ACIS
ACIS DOSE Registered-Photon-Map
The steps we took to compute the dose map are;
- Level 1 Event files for a specified month are obtained from archive.
- Image data including I2, I3, S2, S3 CCDs are extracted from all event files.
- All the extracted image data were merged to create a month long exposure map for the month.
- The exposure map is opened with ds9, and check a distribution of count rates against energy. From this, estimate the upper threshold value. Any events beyond this upper threshold are assumed erroneous events such as bad pixels.
- Using this upper threshold, the data is filtered, and create a cleaned exposure map for the month.
- The exposure map from each month from the Sep 1999 is added up to create a cumulative exposure map for each month.
- Using fimgstatistic, we compute count rate statistics for each CCDs.
- For observations with high data drop rates (e.g., Crab nebula, Cas A), we corrected the observations by adding events.
Please check more detail plots at Telemetered Photon Dose Trend page.
)
)
)
Statistics:
# IMAGE     NPIX     MEAN        RMS        MIN     MAX
ACIS_feb18 6004901       6.286         15.658           0.0     8407


I2 node 0  262654	7.053086	3.248980	0.0	 50.0
I2 node 1  262654	7.538285	21.126763	0.0	7760.0
I2 node 2  262654	7.350832	3.271109	0.0	 88.0
I2 node 3  262654	7.407426	26.399528	0.0	8407.0

I3 node 0  262654	7.200436	11.651727	0.0	4755.0
I3 node 1  262654	7.365662	11.173316	0.0	5106.0
I3 node 2  262654	6.958799	3.112027	0.0	 80.0
I3 node 3  262654	7.068807	15.334200	0.0	5143.0

S2 node 0  262654	5.878114	12.457783	0.0	6033.0
S2 node 1  262654	6.163189	4.867197	0.0	663.0
S2 node 2  262654	6.845301	21.455660	0.0	7533.0
S2 node 3  262654	8.125416	17.045599	0.0	6492.0

S3 node 0  262654	14.055970	36.627895	0.0	1789.0
S3 node 1  262654	12.733932	5.747842	0.0	159.0
S3 node 2  262654	10.895083	4.231508	0.0	166.0
S3 node 3  262654	9.453797	3.781199	0.0	136.0
)
)
)
Statistics:
 IMAGE     NPIX      MEAN        RMS           MIN      MAX
ACIS_total   6004901       2179.210         2827.166           0.0   122894


I2 node 0  262654	1871.953794	367.533400	386.0	10477.0
I2 node 1  262654	1970.696254	511.410271	411.0	72774.0
I2 node 2  262654	7.350832	3.271109	0.0	 88.0
I2 node 3  262654	2007.730951	518.055432	394.0	28448.0

I3 node 0  262654	2122.455534	524.286532	387.0	8302.0
I3 node 1  262654	2205.380985	1644.013105	401.0	51517.0
I3 node 2  262654	1937.478454	356.668646	385.0	10805.0
I3 node 3  262654	7.068807	15.334200	0.0	5143.0

S2 node 0  262654	2536.721052	395.588837	1452.0	21690.0
S2 node 1  262654	6.163189	4.867197	0.0	663.0
S2 node 2  262654	2981.974690	612.869643	2042.0	27603.0
S2 node 3  262654	2929.615967	465.238867	1793.0	52753.0

S3 node 0  262654	4518.629037	2046.803915	1986.0	25702.0
S3 node 1  262654	5714.843324	2209.679494	0.0	28390.0
S3 node 2  262654	4485.980438	1209.419505	1874.0	24741.0
S3 node 3  262654	3460.183824	641.356013	2121.0	24394.0
)
|
)
|
)
|
)
|
| Nov 2017 | Aug 2017 | May 2017 | Feb 2017 |
|---|
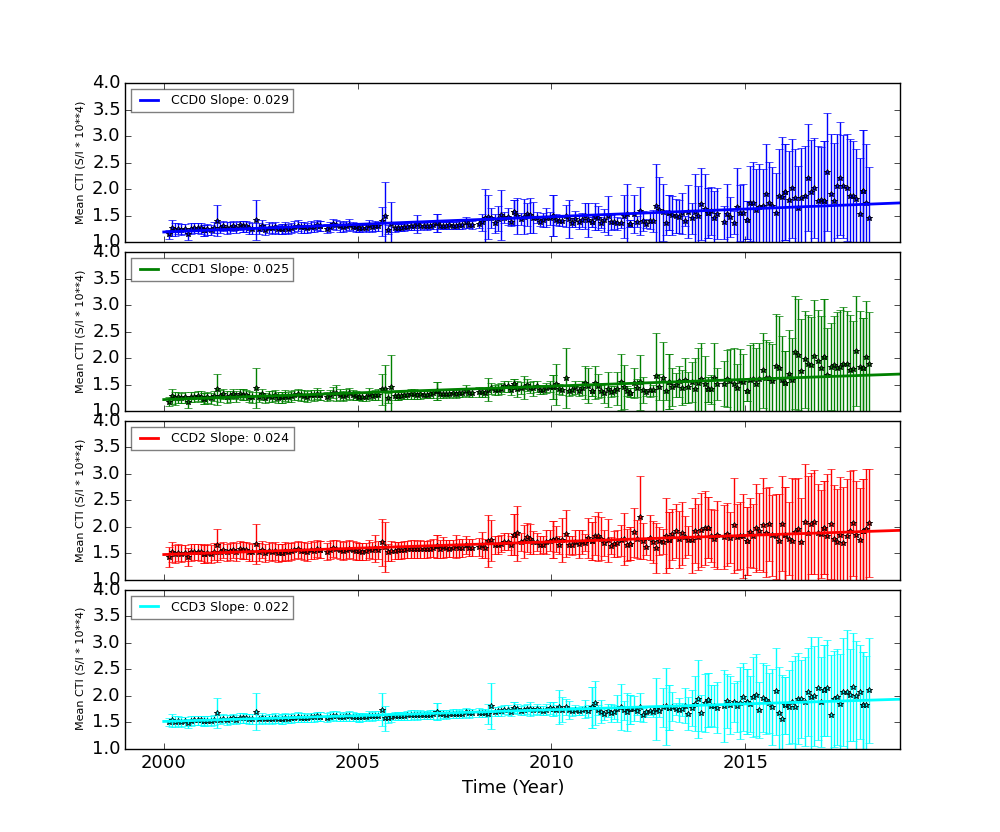
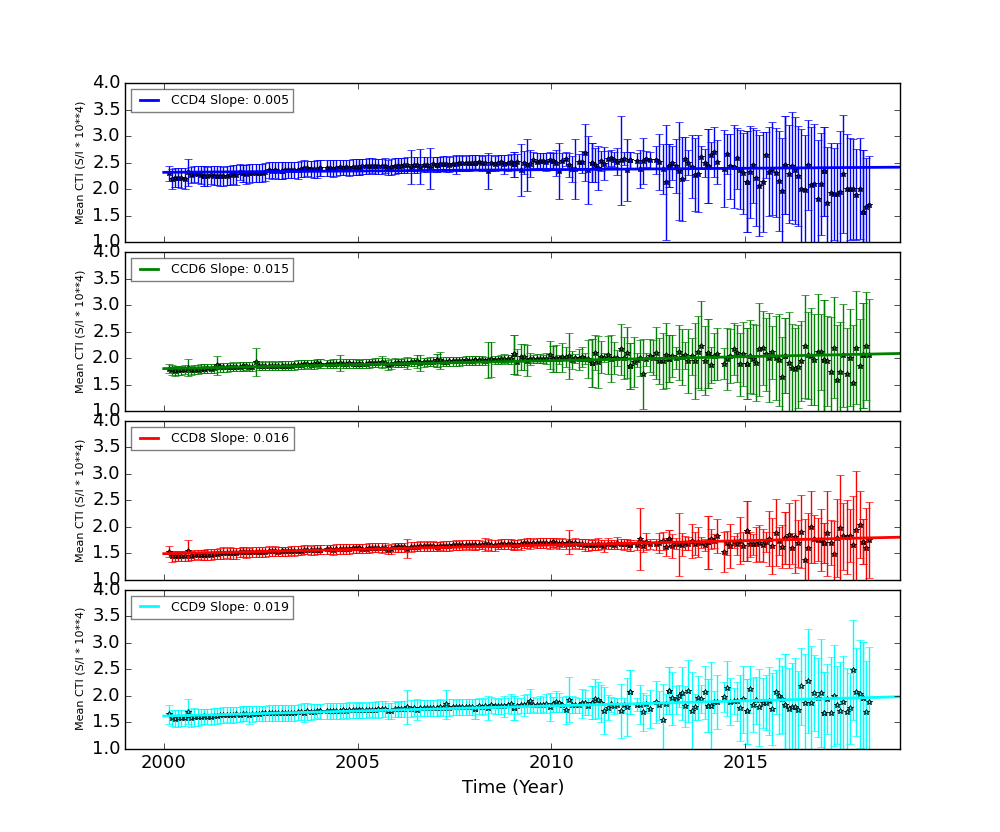
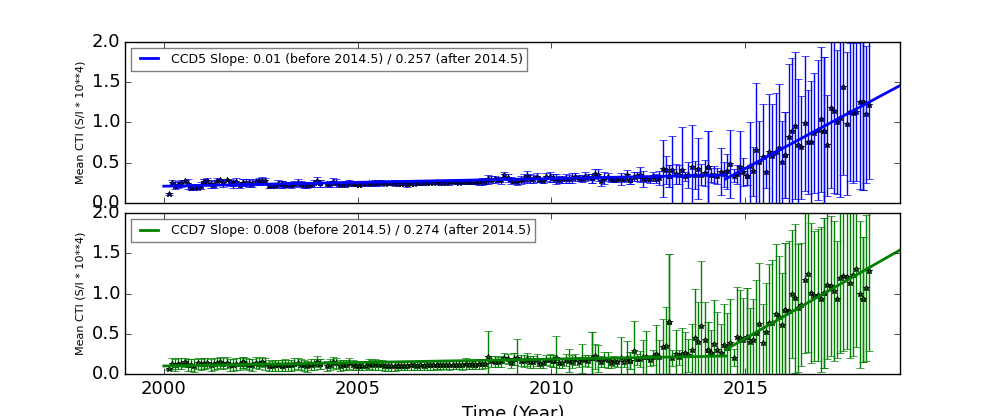
The Mean Detrended CTI
We report CTIs with a refined data definition. CTIs were computed for the temperature dependency corrected data. Please see CTI page for detailed explanation. CTI's are computed for Mn K alpha, and defined as slope/intercept x10^4 of row # vs ADU. Data file: here
Imaging CCDs
Spectral CCDs
Backside CCDs
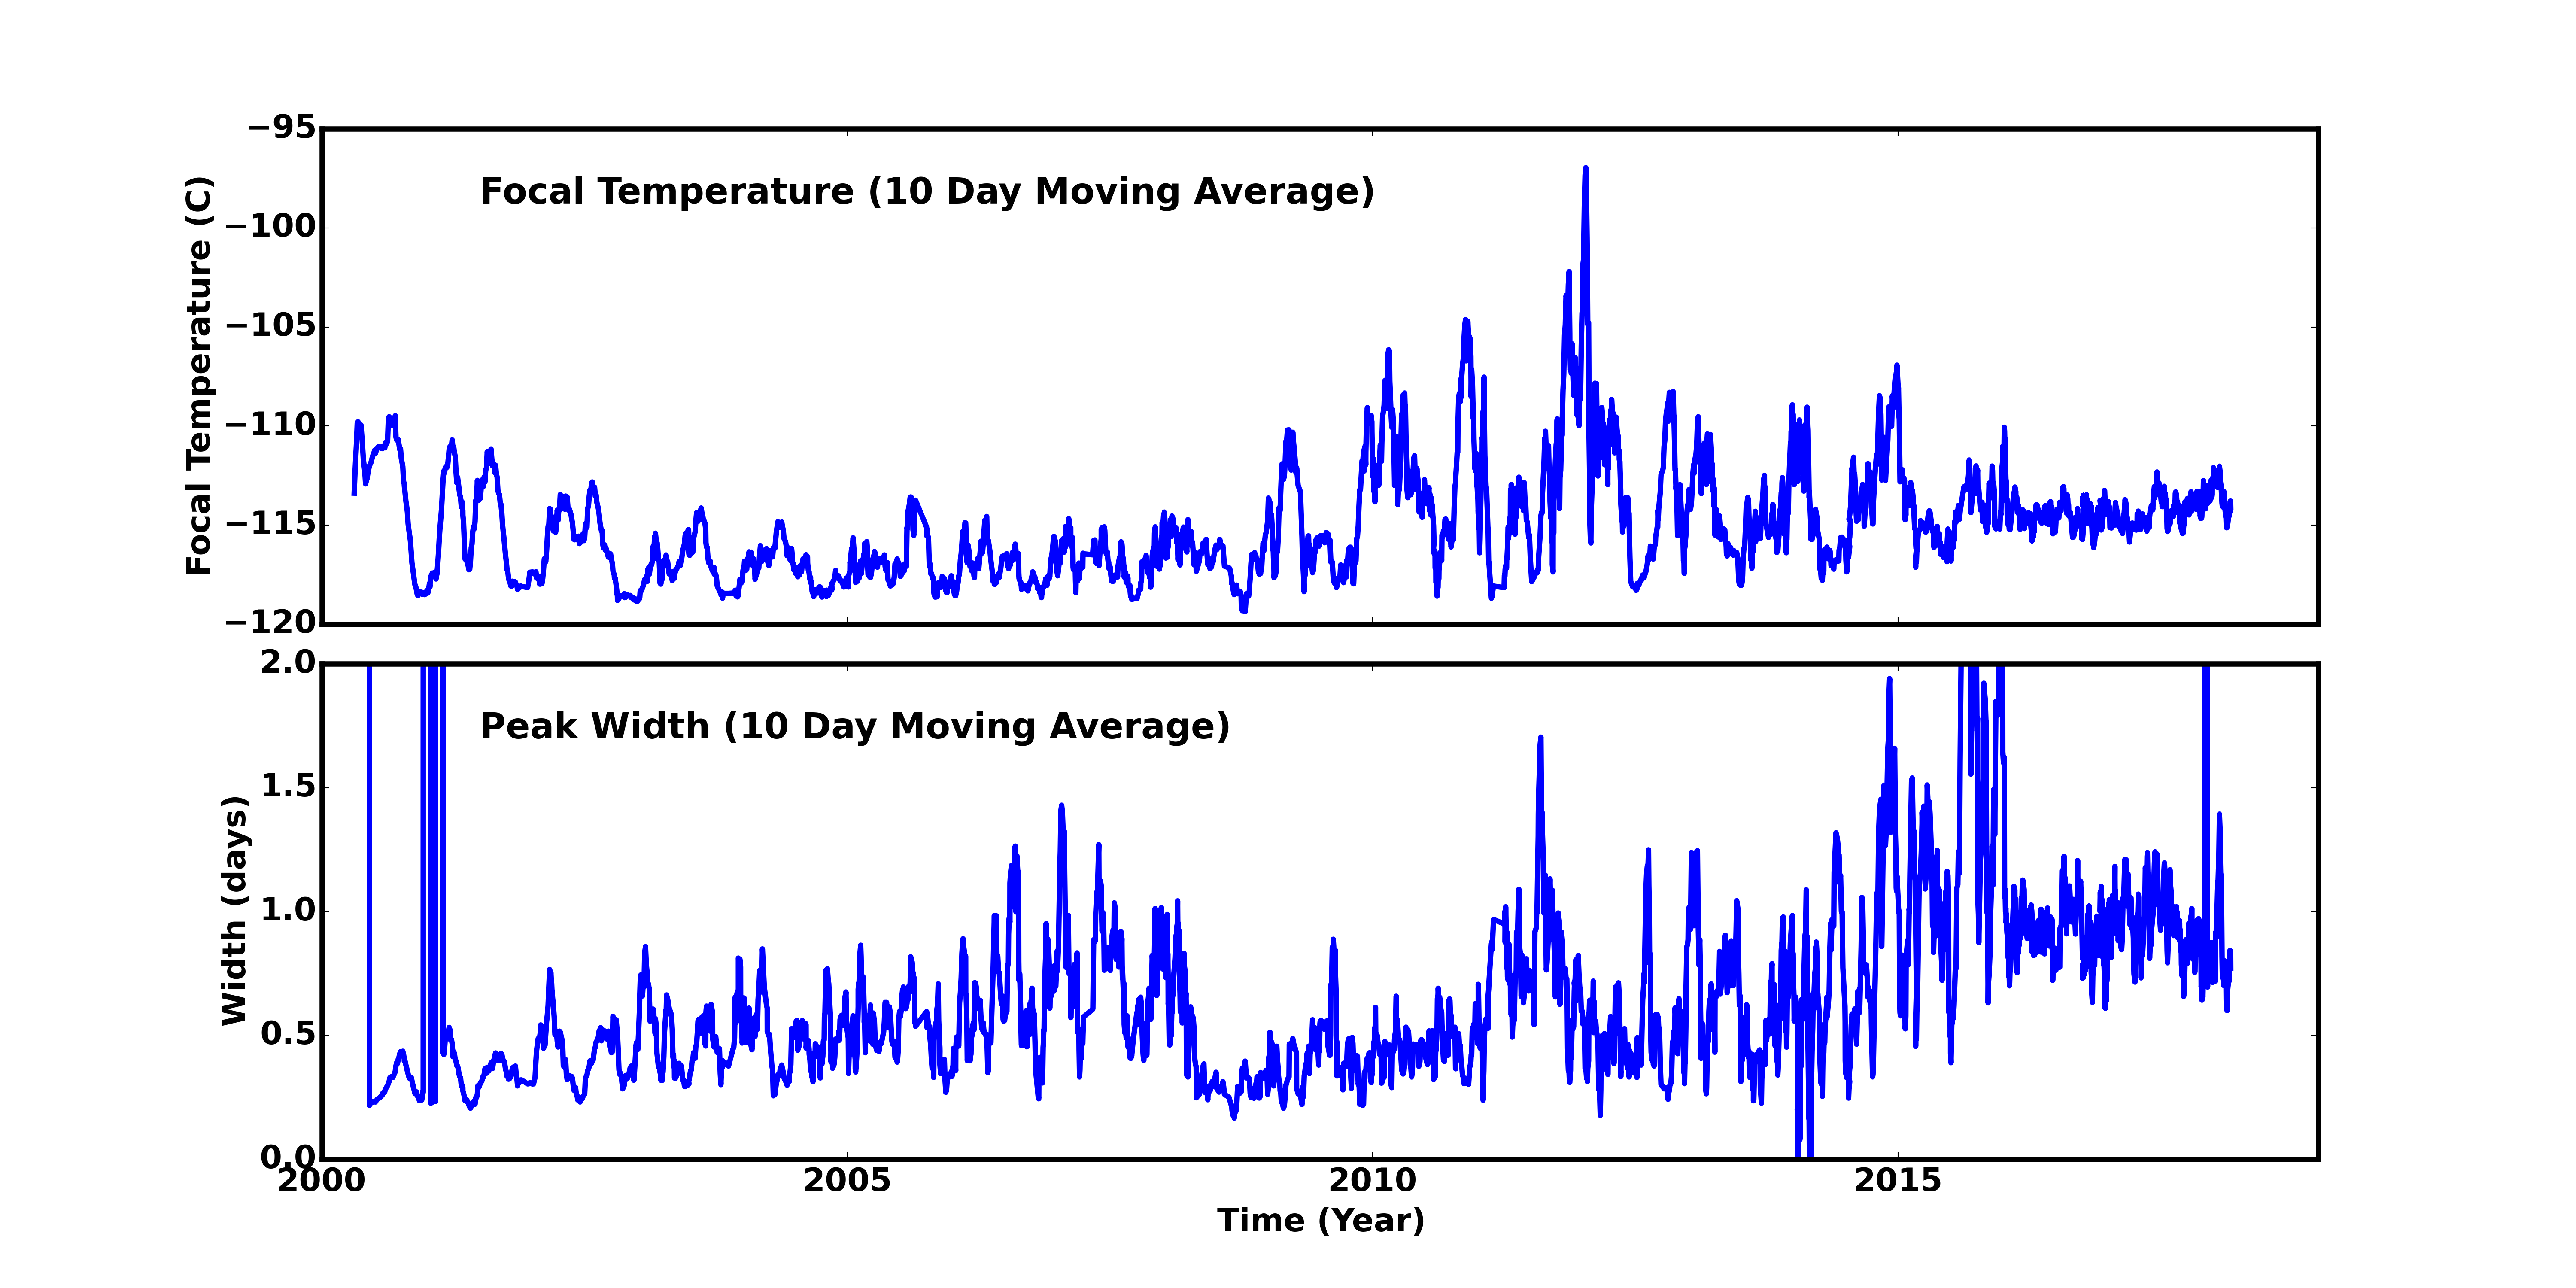
Focal Plane Temperature
Feb 2018 Focal Temperature
| The Mean (max) FPT: | |
|---|---|
| -114.36 | +/- 1.44 C |
| Mean Width: | |
| 0.73 | +/- 0.27 days |
Averaged Focal Plane Temperature
We are using 10 period moving averages to show trends of peak temperatures and peak widths. Note, the gaps in the width plot are due to missing/corrupted data.
Focal Plane Temperature, Sun Angle and Altitude
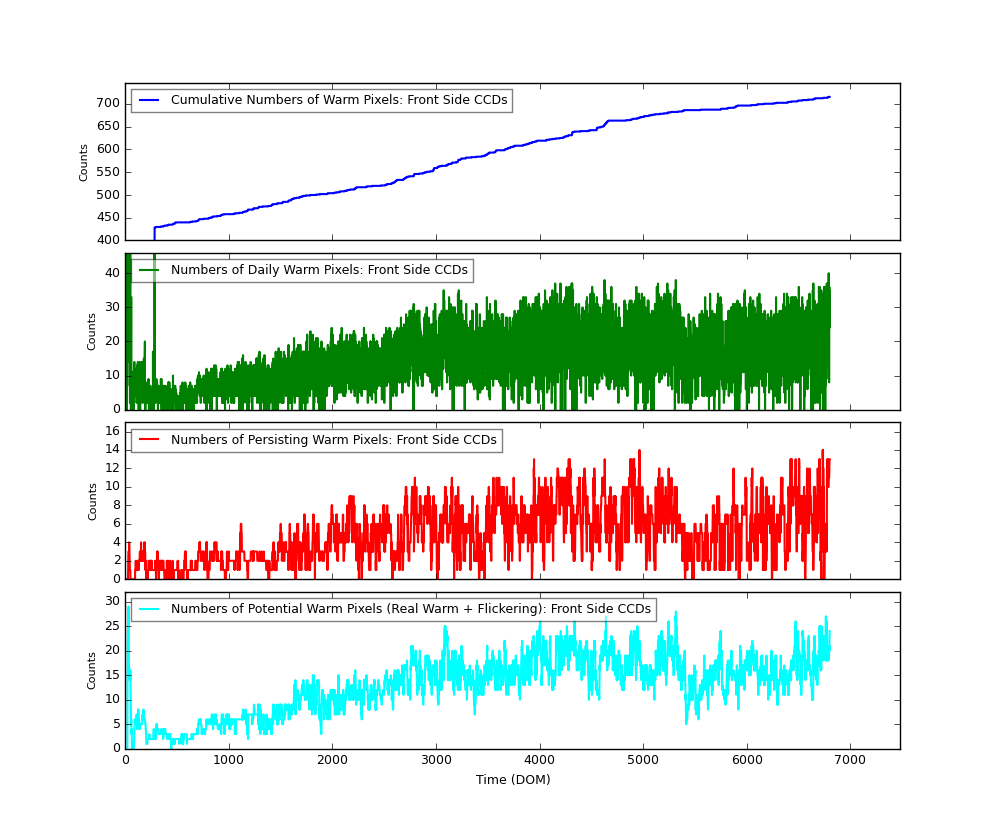
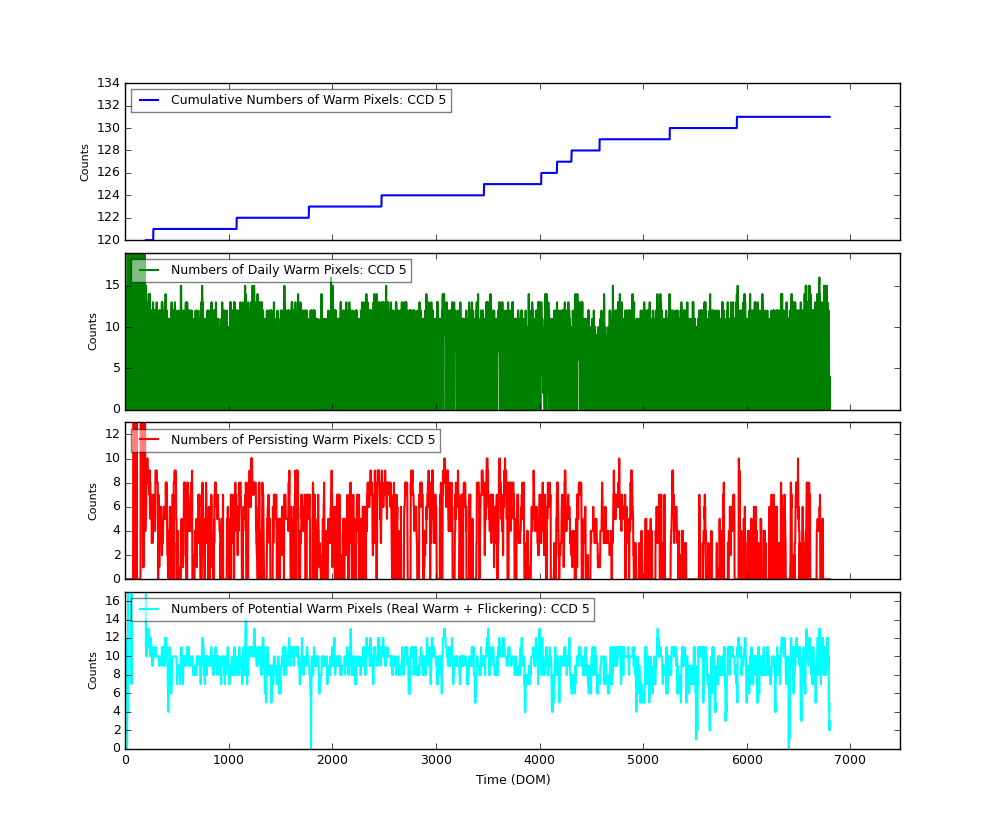
Bad Pixels
The plots below were generated with a new warm pixel finding script. Please see Acis Bad Pixel Page for details.
Front Side CCDs
Back Side CCD (CCD5)
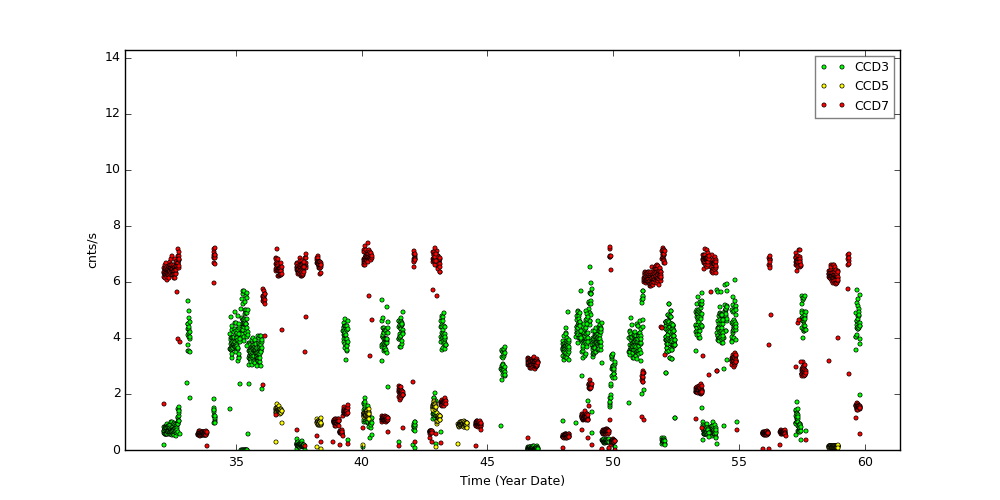
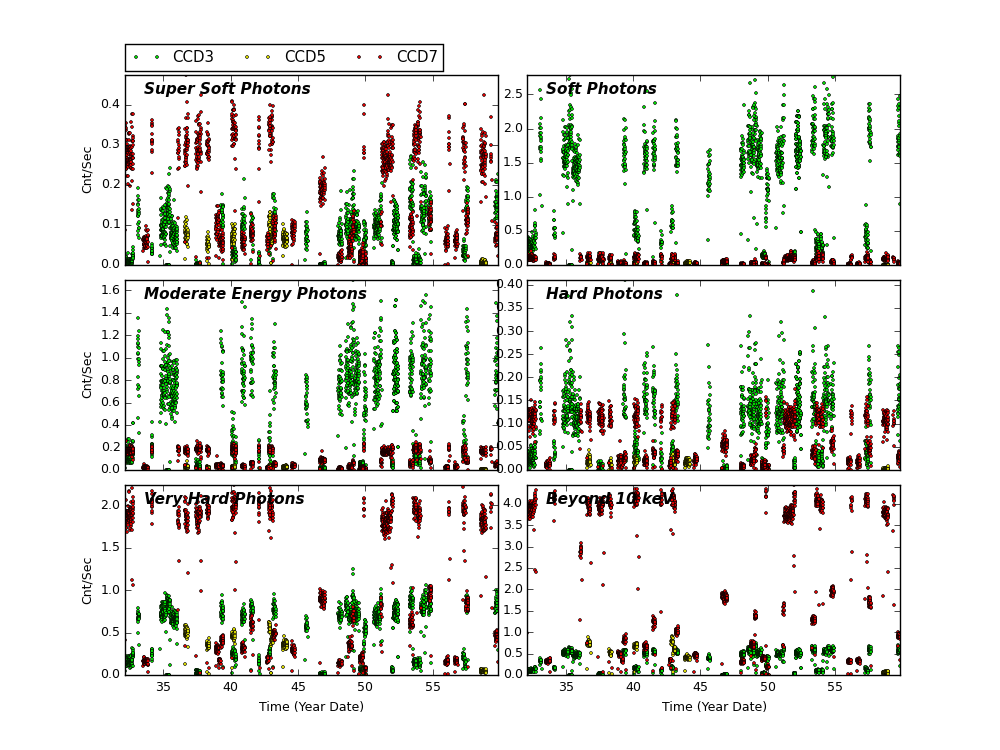
Science Instrument Background Rates
| Name | Low (keV) | High(KeV) | Description |
|---|---|---|---|
| SSoft | 0.00 | 0.50 | Super soft photons |
| Soft | 0.50 | 1.00 | Soft photons |
| Med | 1.00 | 3.00 | Moderate energy photons |
| Hard | 3.00 | 5.00 | Hard Photons |
| Harder | 5.00 | 10.00 | Very Hard photons |
| Hardest | 10.00 | Beyond 10 keV |
HRC
DOSE of Central 4K Pore-Pairs
Please refer to Maximum Dose Trends for more details.
)
|
|---|
IMAGE                NPIX      MEAN    STDDEV      MIN       MAX
HRCI_02_2018.fits  16777216	0.012 	0.114 	0.000 	8.000
)
IMAGE                       NPIX      MEAN    STDDEV      MIN       MAX
HRCI_08_1999_02_2018.fits  16777216	5.095 	5.290 	0.000 	294.000
)
|
|---|
IMAGE                NPIX      MEAN    STDDEV      MIN       MAX
HRCS_02_2018.fits  16777216	0.138 	0.423 	0.000 	7.000
)
IMAGE                       NPIX      MEAN    STDDEV      MIN       MAX
HRCS_08_1999_02_2018.fits  16777216	17.409 	32.034 	0.000 	1728.000
|
|
Max dose trend plots corrected for events that "pile-up"
in the center of the taps due to bad position information.
|
)
|
)
|
)
|
)
|
| Nov 2017 | Aug 2017 | May 2017 | Feb 2017 |
|---|
)
|
)
|
)
|
)
|
| Nov 2017 | Aug 2017 | May 2017 | Feb 2017 |
|---|
HRMA Focus
Plots below show various characteristics of detected imaging sources. Standard level 2 data products (*src2.fits) are used. Only observations with focus (sim_x) within 0.01 mm of nominal value for given SI configuration are used. Sources are also filtered for strength (SNR > 15).
For individual detectors, please go to MTA SRC2 Monitoring page.
Source Sky Position
PSF vs Time
Source Ellipse Roundness
80% Encircled Energy Radius
Signal-to-Noise Ratio
Rotation
)
)
)
|
)
|
)
|
)
|
)
|
)
|
)
|
)
|
Gratings
Focus
We plot the width of the zero order streak of ACIS/HETG observations and the width of the zero order image for HRC/LETG observations of point sources. No significant defocusing trend is seen at this time. See Gratings Focus pages.
PCAD
ACA Trending
Gyro Bias Drift
Radiation History
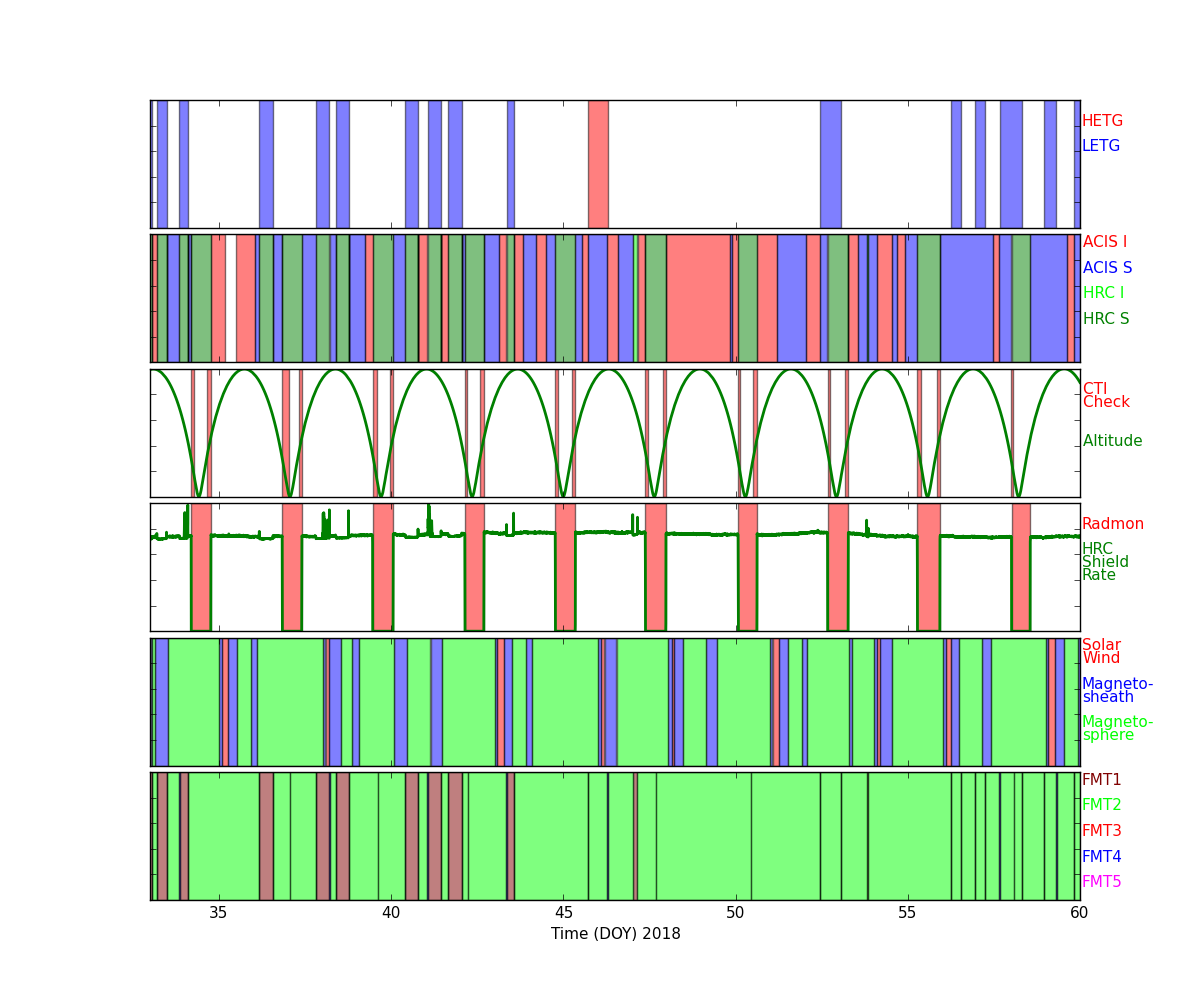
Radiation Zone Timing
Plotted below are radiation zone timing plots based on the following definitions of radiation zone:
- RADZONE - Ephin levels (in any of the E1300,P4GM,P41GM channels) are more than 1/3 of RADMON safing thresholds.
- RADMON - Radmon is disabled for radiation zone (as commanded based on OFLS model, for comparison with actual radiation levels).
- PERIGEE - Time of closest earth approach (for comparison)
Radiation Count Rates of Feb 2018
Sun Spot History
Trending
Quarterly Trends
- HRC Temperature
| Previous Quarter | ||||||
| MSID | MEAN | RMS | DELTA/YR | DELTA/YR/YR | UNITS | DESCRIPTION |
| 2CEAHVPT | 301.20 | 2.37 | -2.884e+00 | -1.985e+02 | K | CEA RADIATOR TEMPERATURE AT CENTER |
| 2CHTRPZT | 297.61 | 2.22 | -2.640e+00 | -1.606e+02 | K | CENTRAL ELECTRONICS BOX TEMP |
| 2CONDMXT | 294.23 | 2.39 | -2.586e+00 | -3.261e+01 | K | CONDUIT -X FACE TEMPERATURE |
| 2DCENTRT | 293.22 | 2.02 | -3.004e+00 | -1.576e+01 | K | DETECTOR HOUSING TEMP 2 |
| 2DTSTATT | 293.87 | 1.96 | -2.752e+00 | 6.116e+01 | K | DETECTOR HOUSING TEMP 1 |
| 2FHTRMZT | 295.98 | 2.11 | -2.599e+00 | 1.133e+02 | K | FRONT END ELECTRONICS BOX TEMPERATURE |
| 2FRADPYT | 291.69 | 2.18 | -2.341e+00 | 1.249e+02 | K | FRONT END ASSEMBLY +Y AT RADIATOR CENTER TEMP |
| 2PMT1T | 295.12 | 2.63 | -3.297e+00 | -3.558e+01 | K | PMT 1 TEMPERATURE |
| 2PMT2T | 297.52 | 2.88 | -3.055e+00 | -3.393e+01 | K | PMT 2 TEMPERATURE |
| 2UVLSPXT | 289.13 | 2.35 | -3.506e+00 | -4.057e+01 | K | UV LIGHT SHIELD NEXT TO SNOUT TEMP |
)
)
)
)
)
)
)
)
)
)
- HRC HK
| Previous Quarter | ||||||
| MSID | MEAN | RMS | DELTA/YR | DELTA/YR/YR | UNITS | DESCRIPTION |
| FE00ATM | 22.37 | 1.60 | -1.735e+00 | 1.024e+02 | C | Front end temperature (2FE00ATM) |
| FEPRATM | 25.09 | 1.86 | -2.023e+00 | 1.181e+02 | C | FE temp card temperature (2FEPRATM) |
| IMHVATM | 31.82 | 1.68 | 7.272e-01 | -6.239e+01 | (2IMHVATM)C | |
)
)
)
- PCAD Temperature
| Previous Quarter | ||||||
| MSID | MEAN | RMS | DELTA/YR | DELTA/YR/YR | UNITS | DESCRIPTION |
| AACCCDPT | 261.03 | 0.89 | 1.469e+00 | -6.095e+00 | K | AC CCD TEMP (PRI) |
| AACCCDRT | 304.88 | 0.90 | 1.490e+00 | -3.748e+00 | K | AC CCD TEMP (RDNT) |
| AACH1T | 302.19 | 0.96 | 1.609e+00 | -3.964e+00 | K | AC HOUSING TEMP (ACH1) |
| AACH2T | 302.24 | 0.96 | 1.596e+00 | -8.413e+00 | K | AC HOUSING TEMP (ACH2) |
)
)
)
)
Envelope Trending
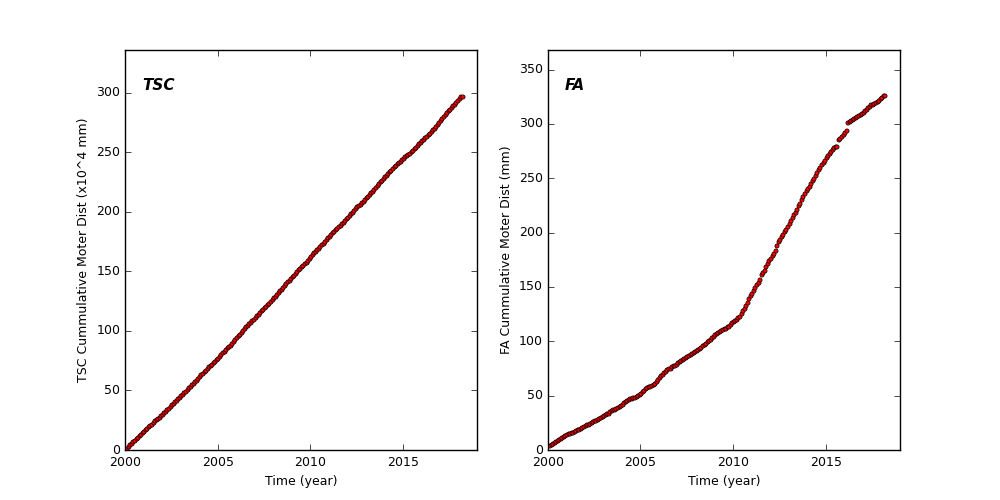
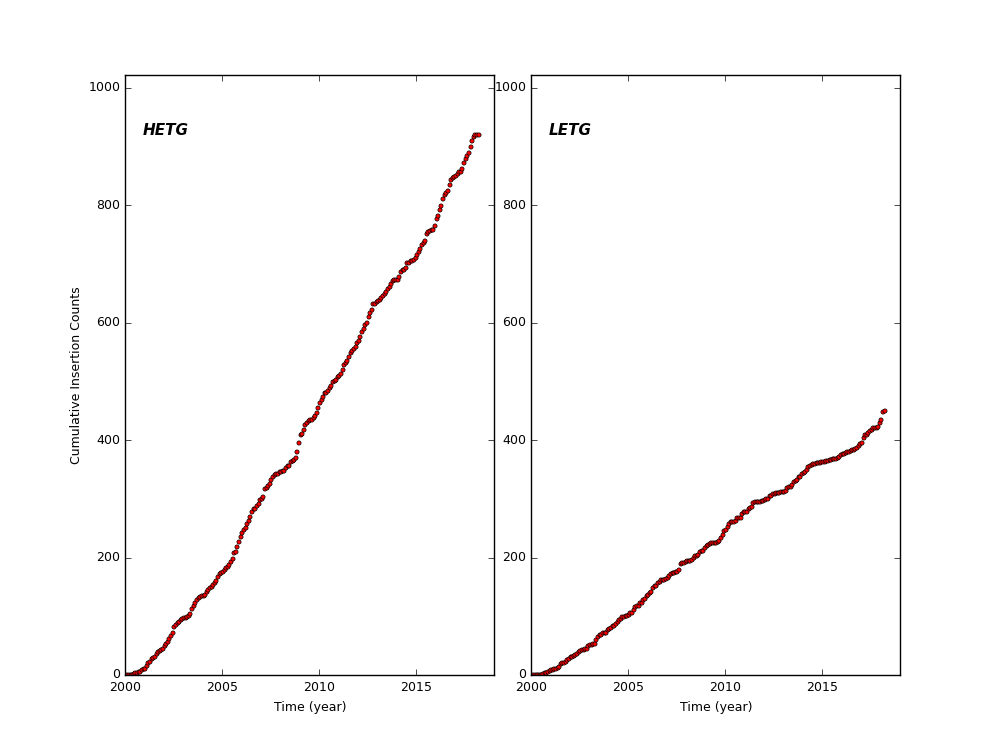
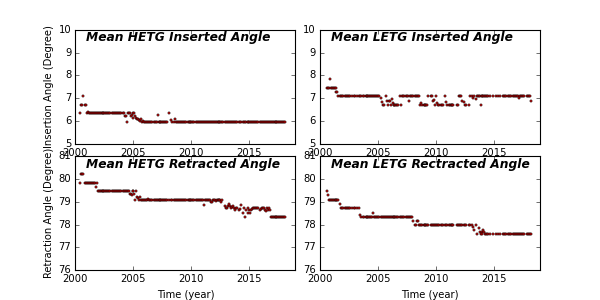
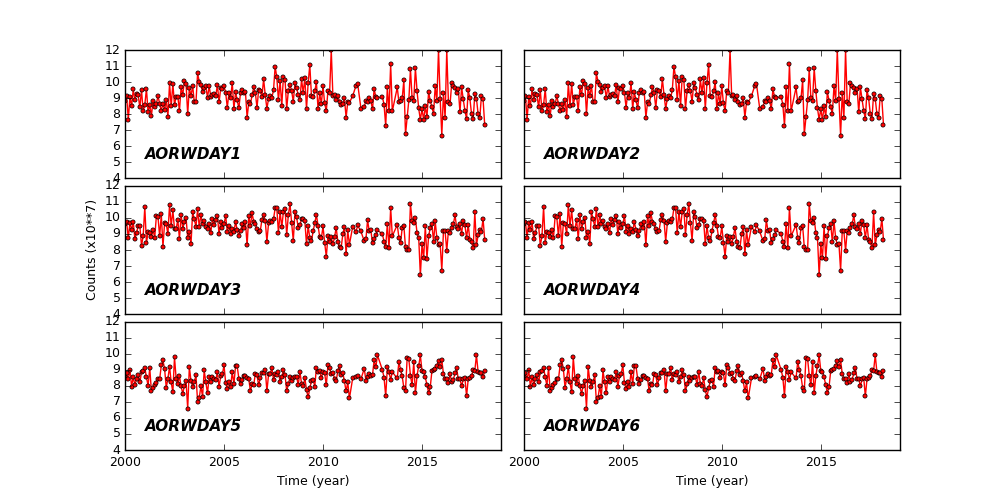
Spacecraft Motions
TSC and FA Cummulative Moter Distance
HETG and LETG Cummulative Insertion Counts
HETG/LETG Insertion/Retraction Angle
Reaction Wheel Rotations
Links to Past Monthly Reports
| Year | Month | |||||||||||
|---|---|---|---|---|---|---|---|---|---|---|---|---|
| 2018 | Jan | |||||||||||
| 2017 | Jan | Feb | Mar | Apr | May | Jun | Jul | Aug | Sep | Oct | Nov | Dec |
| 2016 | Jan | Feb | Mar | Apr | May | Jun | Jul | Aug | Sep | Oct | Nov | Dec |
| 2015 | Jan | Feb | Mar | Apr | May | Jun | Jul | Aug | Sep | Oct | Nov | Dec |
| 2014 | Jan | Feb | Mar | Apr | May | Jun | Jul | Aug | Sep | Oct | Nov | Dec |
| 2013 | Jan | Feb | Mar | Apr | May | Jun | Jul | Aug | Sep | Oct | Nov | Dec |
| 2012 | Jan | Feb | Mar | Apr | May | Jun | Jul | Aug | Sep | Oct | Nov | Dec |
| 2011 | Jan | Feb | Mar | Apr | May | Jun | Jul | Aug | Sep | Oct | Nov | Dec |
| 2010 | Jan | Feb | Mar | Apr | May | Jun | Jul | Aug | Sep | Oct | Nov | Dec |
| 2009 | Jan | Feb | Mar | Apr | May | Jun | Jul | Aug | Sep | Oct | Nov | Dec |
| 2008 | Jan | Feb | Mar | Apr | May | Jun | Jul | Aug | Sep | Oct | Nov | Dec |
| 2007 | Jan | Feb | Mar | Apr | May | Jun | Jul | Aug | Sep | Oct | Nov | Dec |
| 2006 | Jan | Feb | Mar | Apr | May | Jun | Jul | Aug | Sep | Oct | Nov | Dec |
| 2005 | Jan | Feb | Mar | Apr | May | Jun | Jul | Aug | Sep | Oct | Nov | Dec |
| 2004 | Jan | Feb | Mar | Apr | May | Jun | Jul | Aug | Sep | Oct | Nov | Dec |
| 2003 | Jan | Feb | Mar | Apr | May | Jun | Jul | Aug | Sep | Oct | Nov | Dec |
| 2002 | Jan | Feb | Mar | Apr | May | Jun | Jul | Aug | Sep | Oct | Nov | Dec |
| 2001 | Jan | Feb | Mar | Apr | May | Jun | Jul | Aug | Sep | Oct | Nov | Dec |
| 2000 | Jan | Feb | Mar | Apr | May | Jun | Jul | Aug | Sep | Oct | Nov | Dec |
| 1999 | Jul | Aug | Sep | Oct | Nov | Dec | ||||||