ACIS
ACIS DOSE Registered-Photon-Map
The steps we took to compute the dose map are;
- Level 1 Event files for a specified month are obtained from archive.
- Image data including I2, I3, S2, S3 CCDs are extracted from all event files.
- All the extracted image data were merged to create a month long exposure map for the month.
- The exposure map is opened with ds9, and check a distribution of count rates against energy. From this, estimate the upper threshold value. Any events beyond this upper threshold are assumed erroneous events such as bad pixels.
- Using this upper threshold, the data is filtered, and create a cleaned exposure map for the month.
- The exposure map from each month from the Sep 1999 is added up to create a cumulative exposure map for each month.
- Using fimgstatistic, we compute count rate statistics for each CCDs.
- For observations with high data drop rates (e.g., Crab nebula, Cas A), we corrected the observations by adding events.
Please check more detail plots at Telemetered Photon Dose Trend page.
)
)
)
Statistics:
# IMAGE     NPIX     MEAN        RMS        MIN     MAX
ACIS_apr18 6004901       7.854         12.837           0.0     5859


I2 node 0  262654	9.706966	3.966784	0.0	 76.0
I2 node 1  262654	10.154529	7.116127	0.0	2488.0
I2 node 2  262654	10.057554	3.961822	0.0	143.0
I2 node 3  262654	10.157460	9.016207	0.0	3132.0

I3 node 0  262654	10.989683	17.707949	0.0	4336.0
I3 node 1  262654	11.071880	8.721622	0.0	2492.0
I3 node 2  262654	10.351567	3.874659	0.0	 81.0
I3 node 3  262654	10.443352	3.979209	0.0	182.0

S2 node 0  262654	8.815973	3.585254	0.0	 90.0
S2 node 1  262654	9.059886	3.898992	0.0	 92.0
S2 node 2  262654	9.279056	19.953544	0.0	5859.0
S2 node 3  262654	9.515956	16.601364	0.0	5524.0

S3 node 0  262654	11.251130	5.809355	0.0	195.0
S3 node 1  262654	12.887021	5.496988	0.0	270.0
S3 node 2  262654	11.815659	4.427122	0.0	203.0
S3 node 3  262654	10.456162	4.159316	0.0	167.0
)
)
)
Statistics:
 IMAGE     NPIX      MEAN        RMS           MIN      MAX
ACIS_total   6004901       2195.000         2846.765           0.0   123750


I2 node 0  262654	1887.002798	372.717263	393.0	10596.0
I2 node 1  262654	1986.449581	517.609249	413.0	74834.0
I2 node 2  262654	10.057554	3.961822	0.0	143.0
I2 node 3  262654	2023.581656	523.695785	400.0	28461.0

I3 node 0  262654	2140.204004	529.967960	390.0	8603.0
I3 node 1  262654	2223.060585	1652.364659	408.0	54760.0
I3 node 2  262654	1954.124103	361.781900	390.0	10921.0
I3 node 3  262654	10.443352	3.979209	0.0	182.0

S2 node 0  262654	2557.230323	399.382919	1460.0	21718.0
S2 node 1  262654	9.059886	3.898992	0.0	 92.0
S2 node 2  262654	3003.831078	617.192928	2046.0	27629.0
S2 node 3  262654	2952.046742	468.236921	1798.0	53644.0

S3 node 0  262654	4549.133812	2071.146289	1997.0	26696.0
S3 node 1  262654	5744.691865	2213.335927	0.0	28519.0
S3 node 2  262654	4513.413212	1212.246894	1895.0	24804.0
S3 node 3  262654	3484.663259	643.258841	2136.0	24450.0
)
|
)
|
)
|
)
|
| Jan 2018 | Oct 2017 | Jul 2017 | Apr 2017 |
|---|
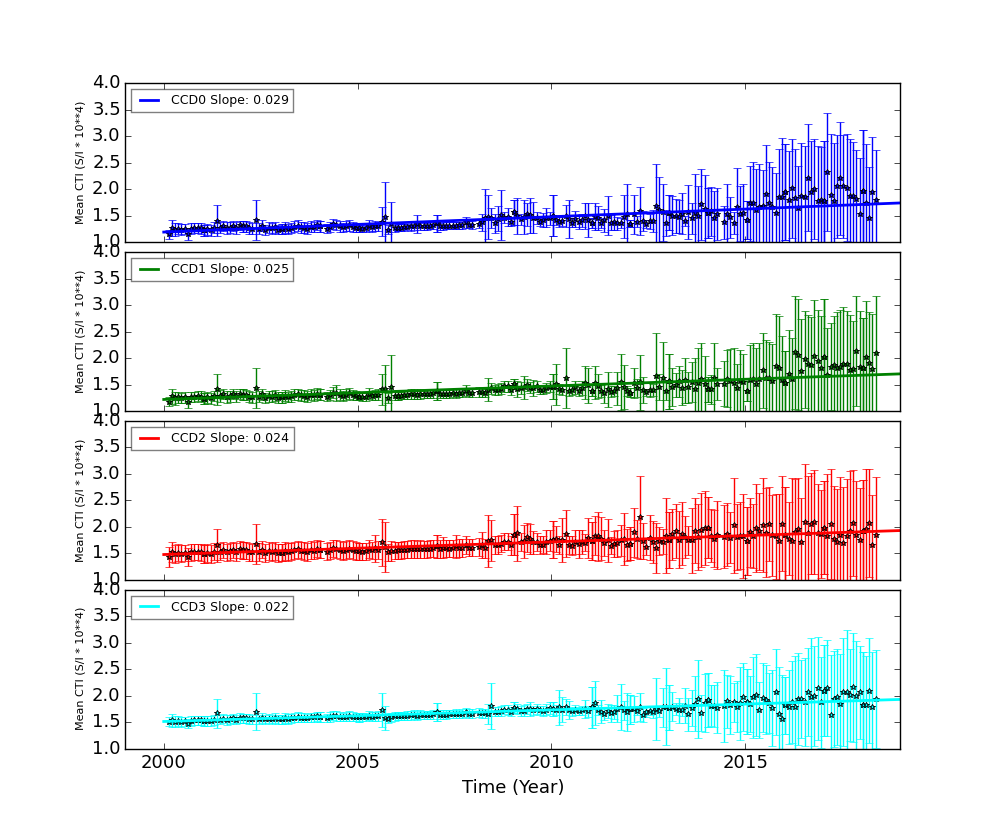
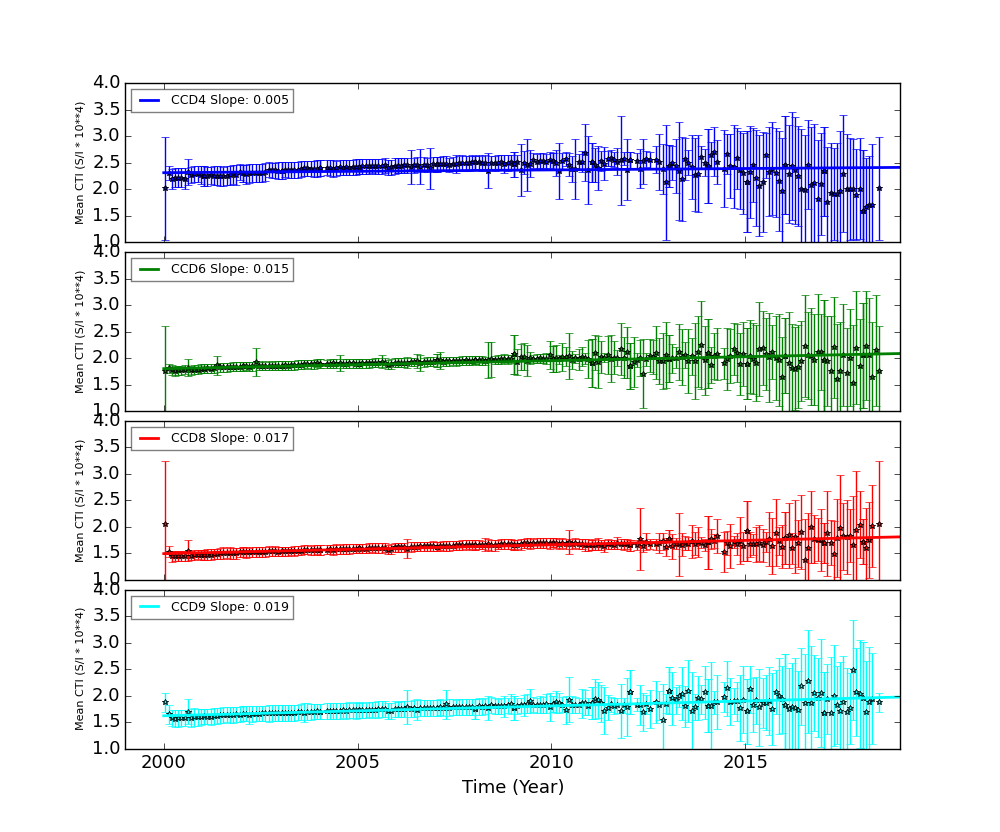
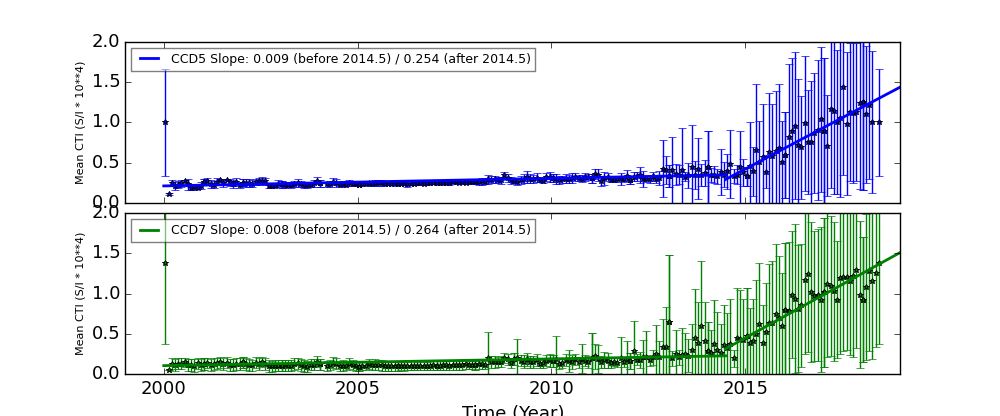
The Mean Detrended CTI
We report CTIs with a refined data definition. CTIs were computed for the temperature dependency corrected data. Please see CTI page for detailed explanation. CTI's are computed for Mn K alpha, and defined as slope/intercept x10^4 of row # vs ADU. Data file: here
Imaging CCDs
Spectral CCDs
Backside CCDs
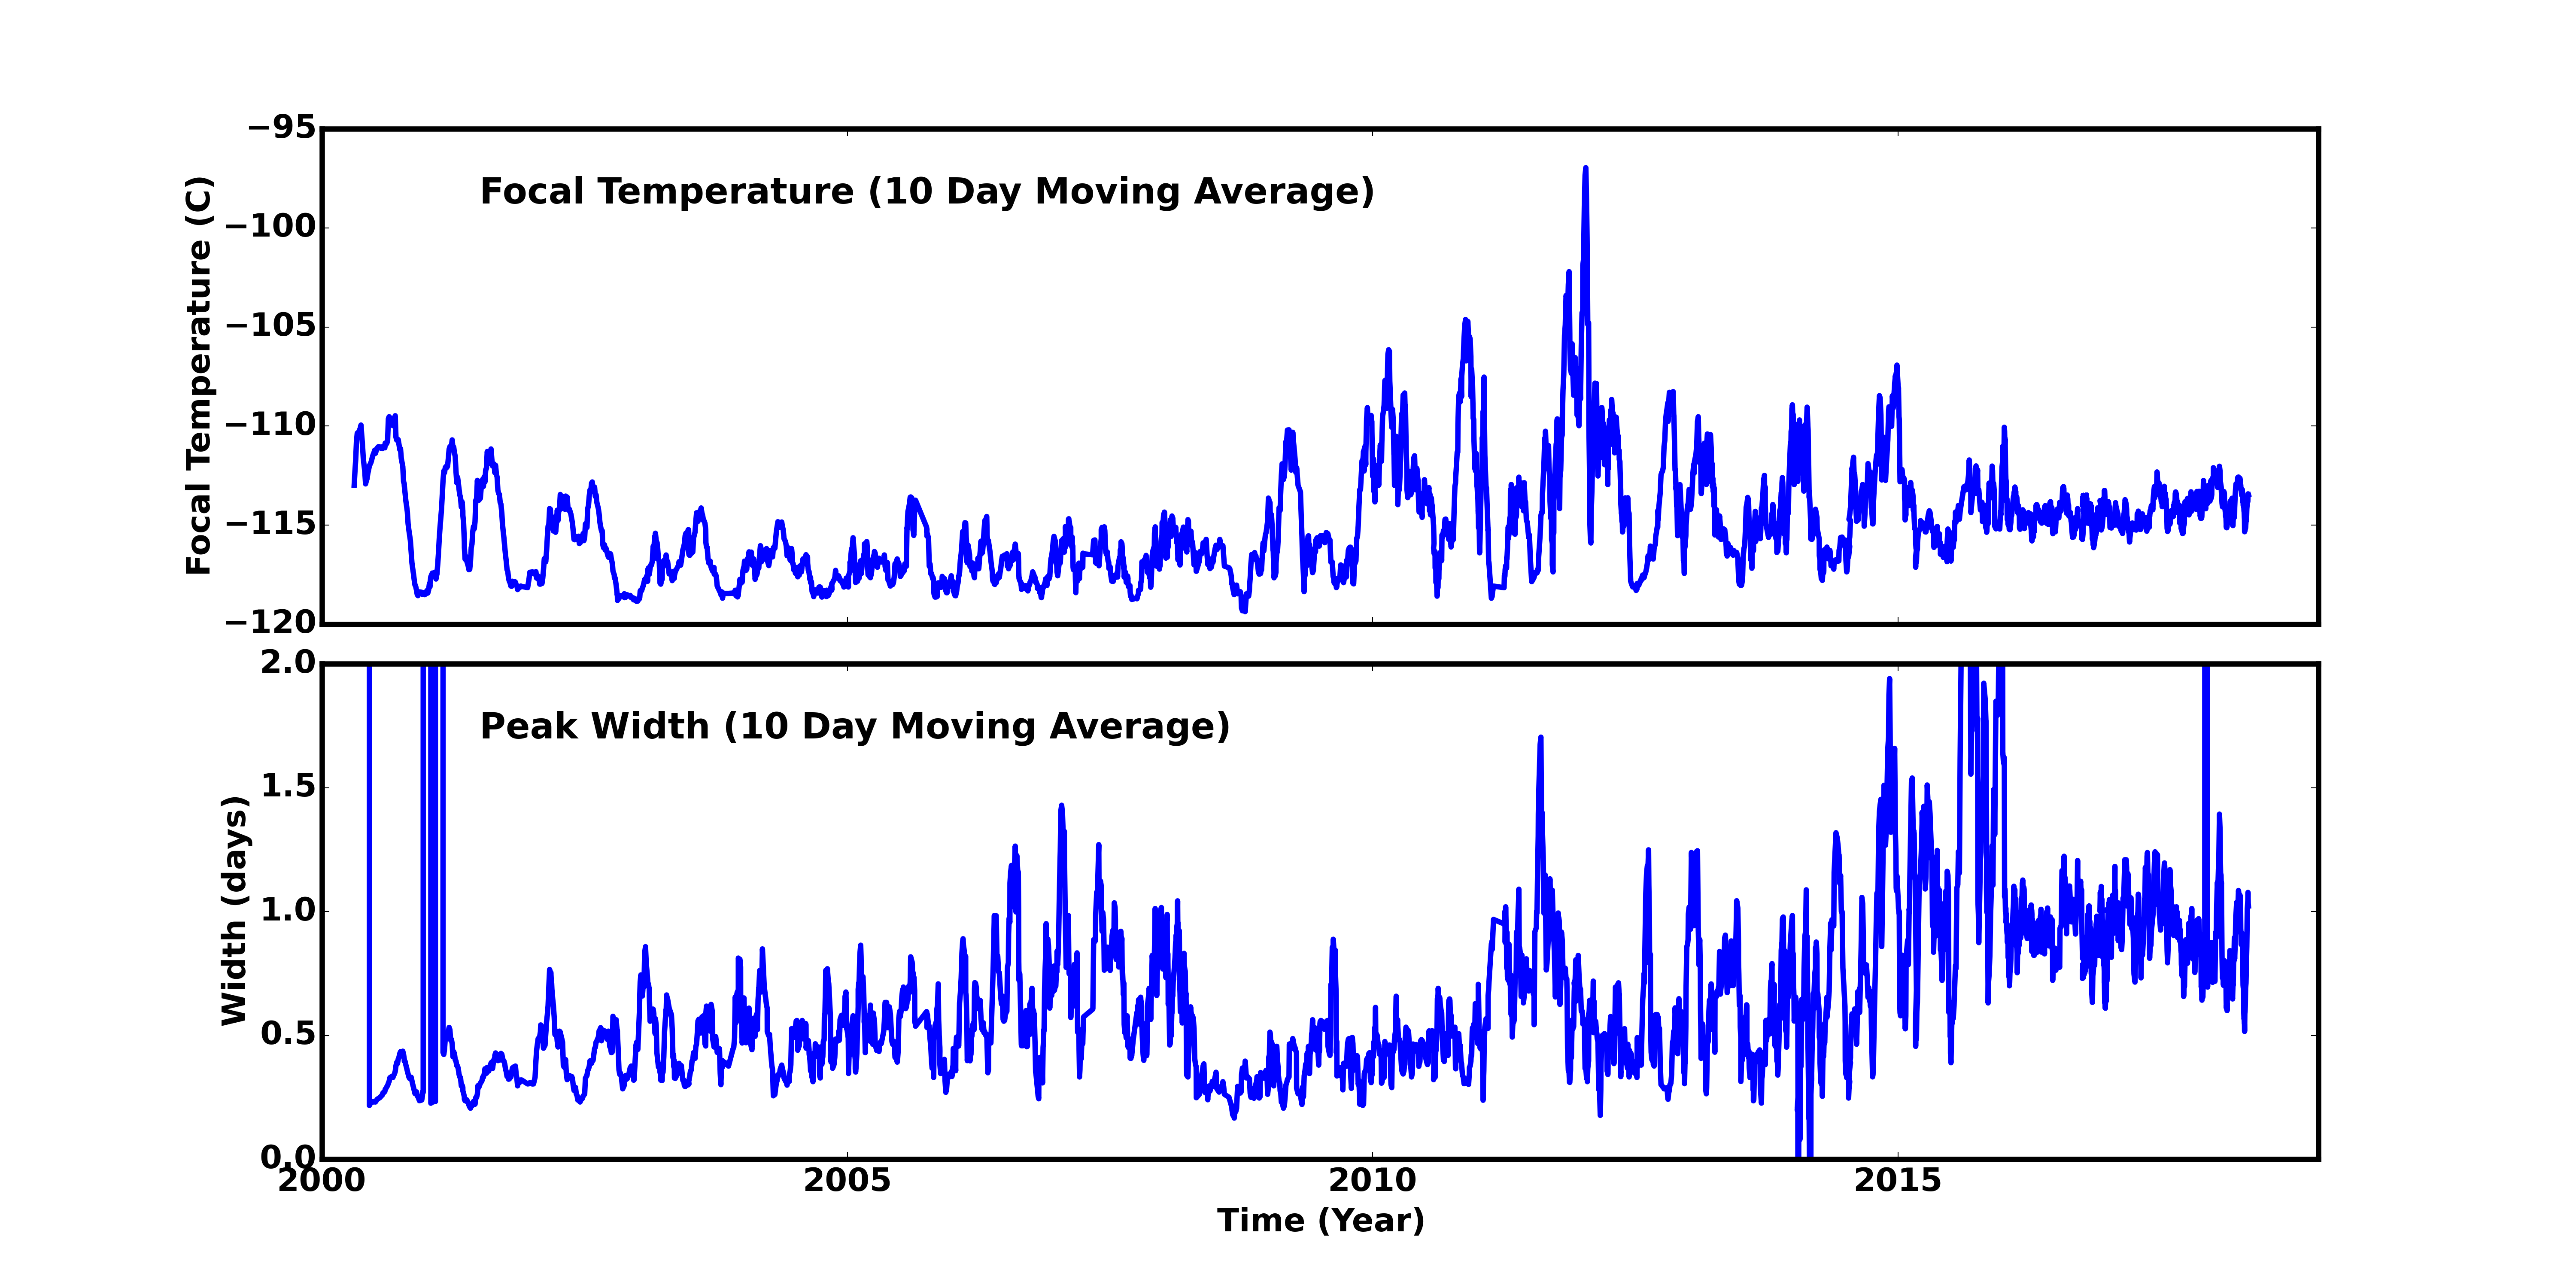
Focal Plane Temperature
Apr 2018 Focal Temperature
| The Mean (max) FPT: | |
|---|---|
| -114.07 | +/- 1.6 C |
| Mean Width: | |
| 0.8 | +/- 0.38 days |
Averaged Focal Plane Temperature
We are using 10 period moving averages to show trends of peak temperatures and peak widths. Note, the gaps in the width plot are due to missing/corrupted data.
Focal Plane Temperature, Sun Angle and Altitude
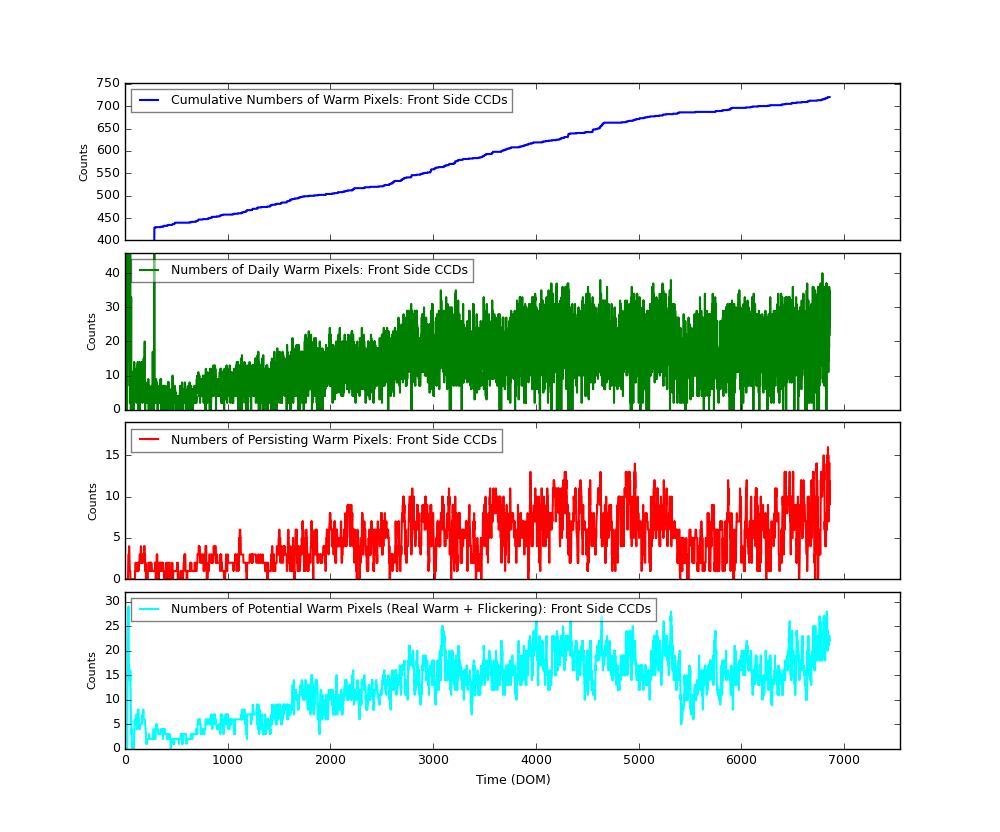
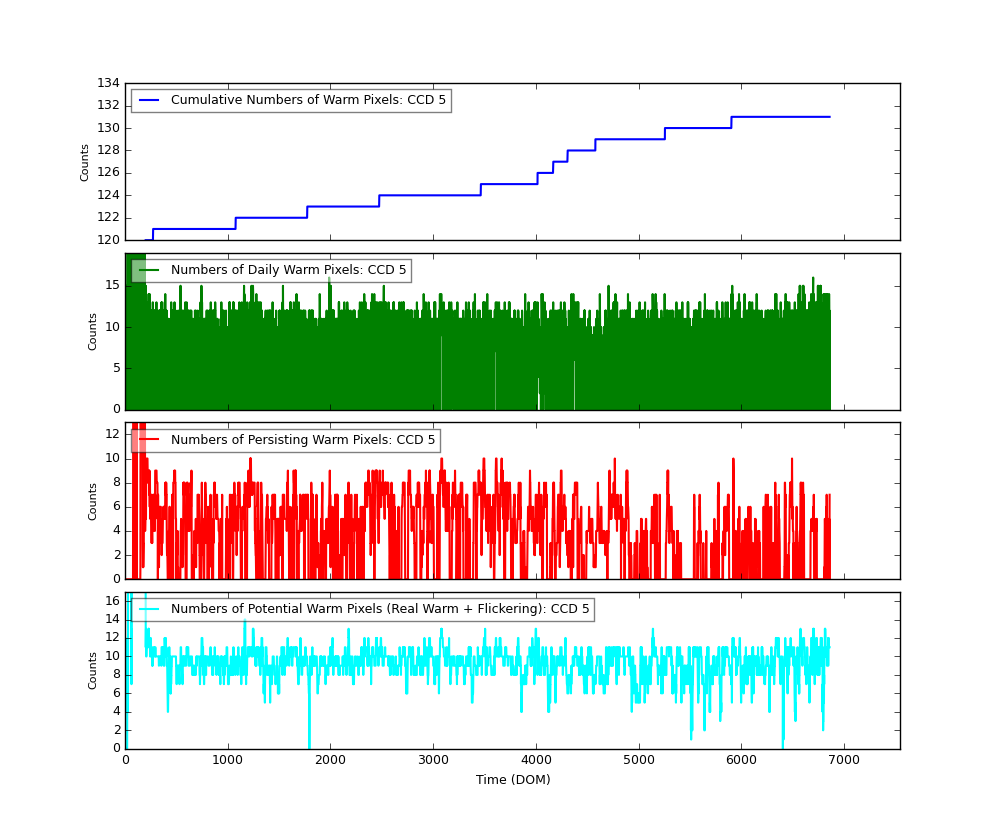
Bad Pixels
The plots below were generated with a new warm pixel finding script. Please see Acis Bad Pixel Page for details.
Front Side CCDs
Back Side CCD (CCD5)
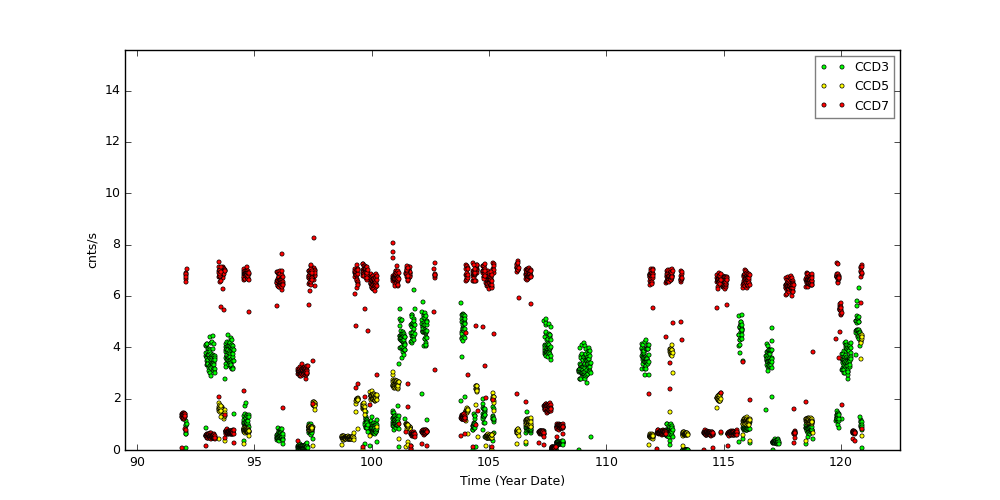
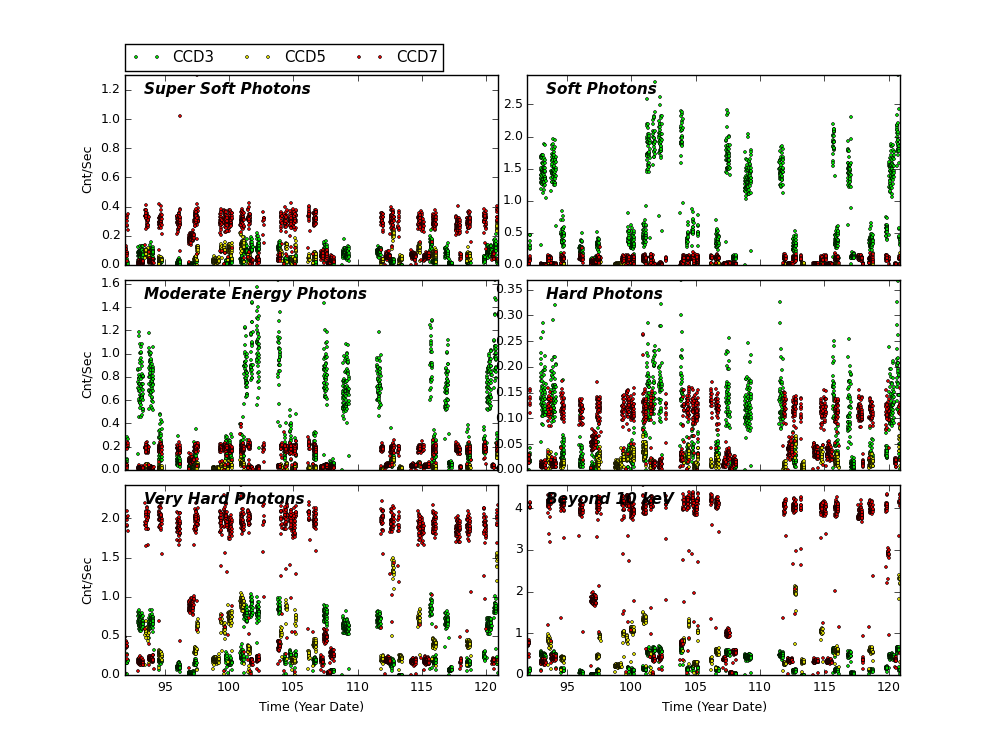
Science Instrument Background Rates
| Name | Low (keV) | High(KeV) | Description |
|---|---|---|---|
| SSoft | 0.00 | 0.50 | Super soft photons |
| Soft | 0.50 | 1.00 | Soft photons |
| Med | 1.00 | 3.00 | Moderate energy photons |
| Hard | 3.00 | 5.00 | Hard Photons |
| Harder | 5.00 | 10.00 | Very Hard photons |
| Hardest | 10.00 | Beyond 10 keV |
HRC
DOSE of Central 4K Pore-Pairs
Please refer to Maximum Dose Trends for more details.
)
|
|---|
IMAGE                NPIX      MEAN    STDDEV      MIN       MAX
HRCI_04_2018.fits  16777216	0.072 	0.272 	0.000 	10.000
)
IMAGE                       NPIX      MEAN    STDDEV      MIN       MAX
HRCI_08_1999_04_2018.fits  16777216	5.176 	5.316 	0.000 	294.000
No Data
)
IMAGE                       NPIX      MEAN    STDDEV      MIN       MAX
HRCS_08_1999_04_2018.fits  16777216	17.428 	32.117 	0.000 	1729.000
|
|
Max dose trend plots corrected for events that "pile-up"
in the center of the taps due to bad position information.
|
)
|
)
|
)
|
)
|
| Jan 2018 | Oct 2017 | Jul 2017 | Apr 2017 |
|---|
)
|
)
|
)
|
)
|
| Jan 2018 | Oct 2017 | Jul 2017 | Apr 2017 |
|---|
Gratings
Focus
We plot the width of the zero order streak of ACIS/HETG observations and the width of the zero order image for HRC/LETG observations of point sources. No significant defocusing trend is seen at this time. See Gratings Focus pages.
Gratings Resolving Power
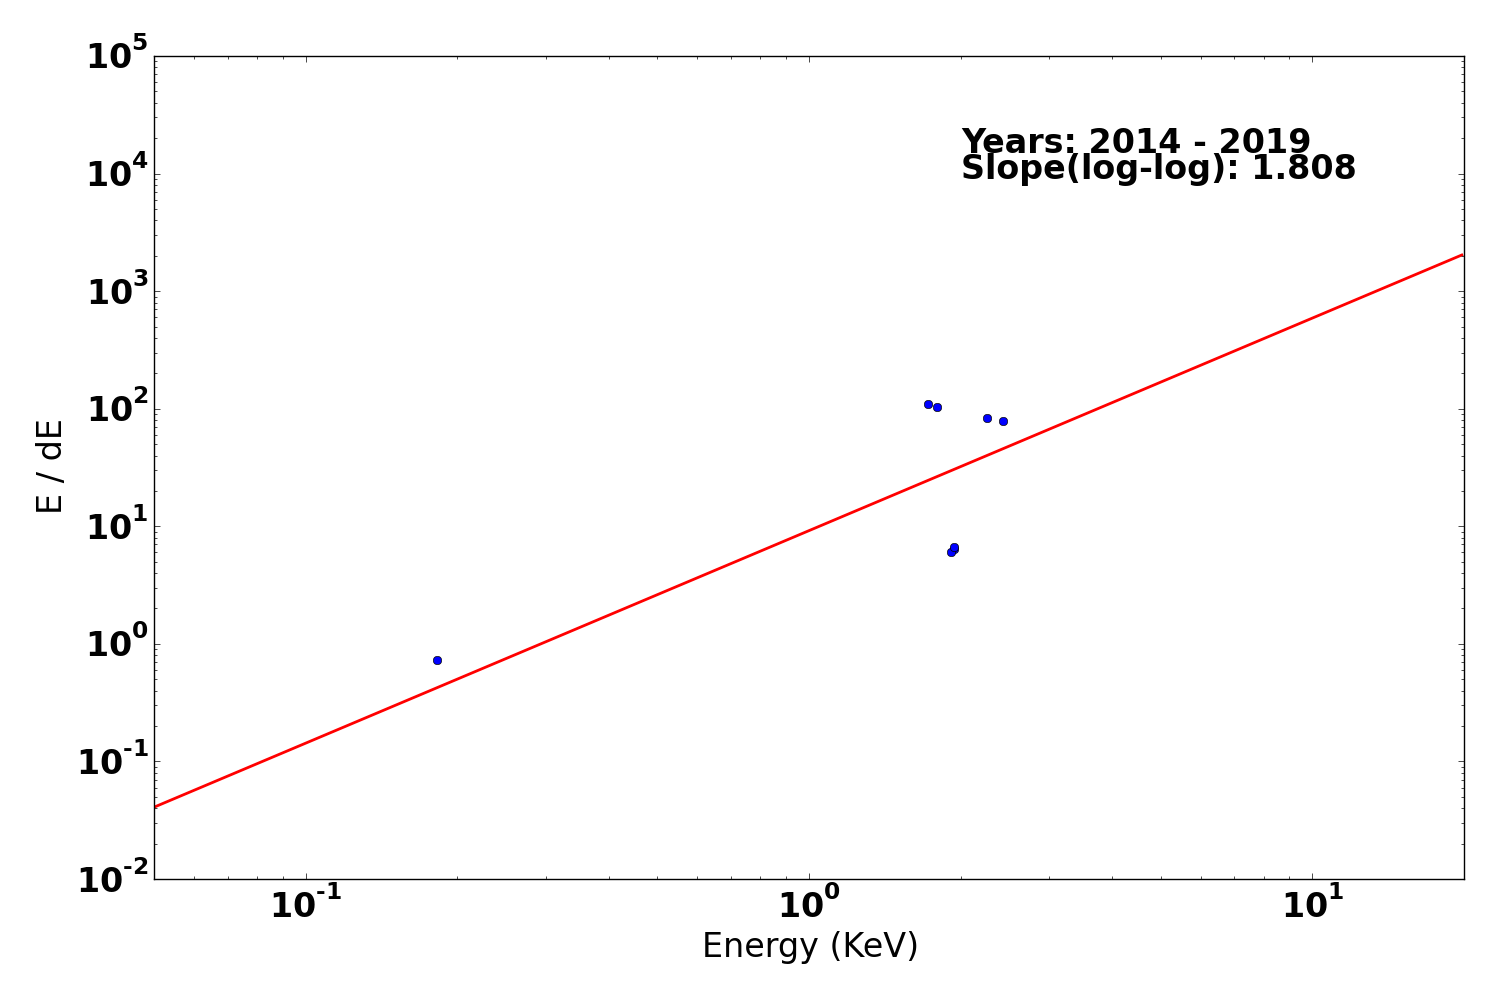
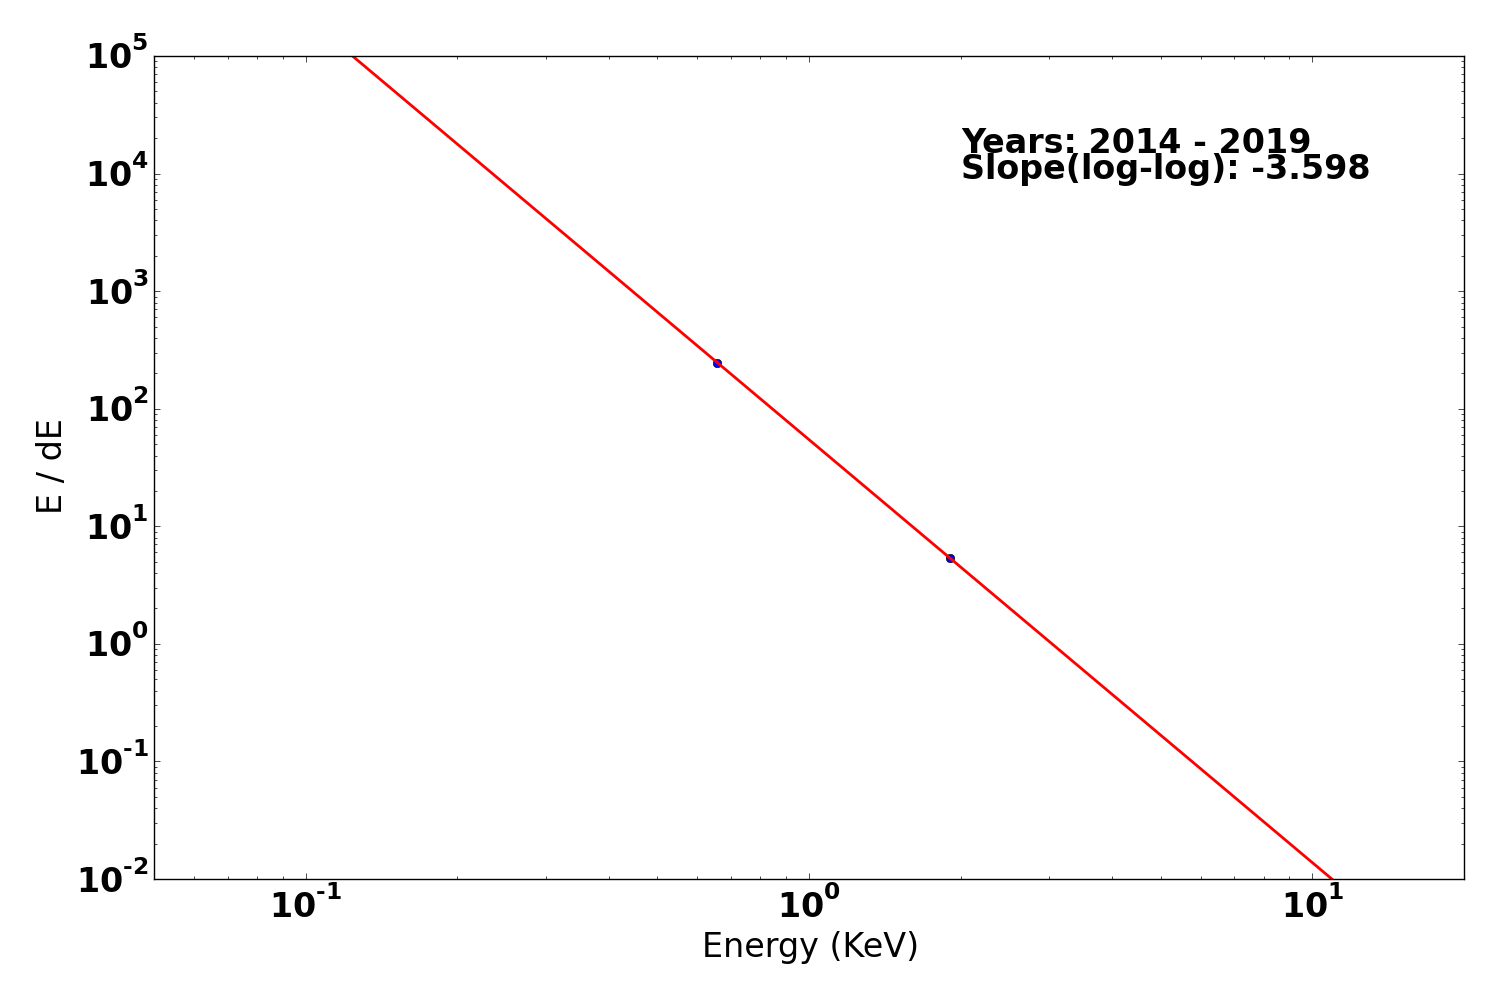
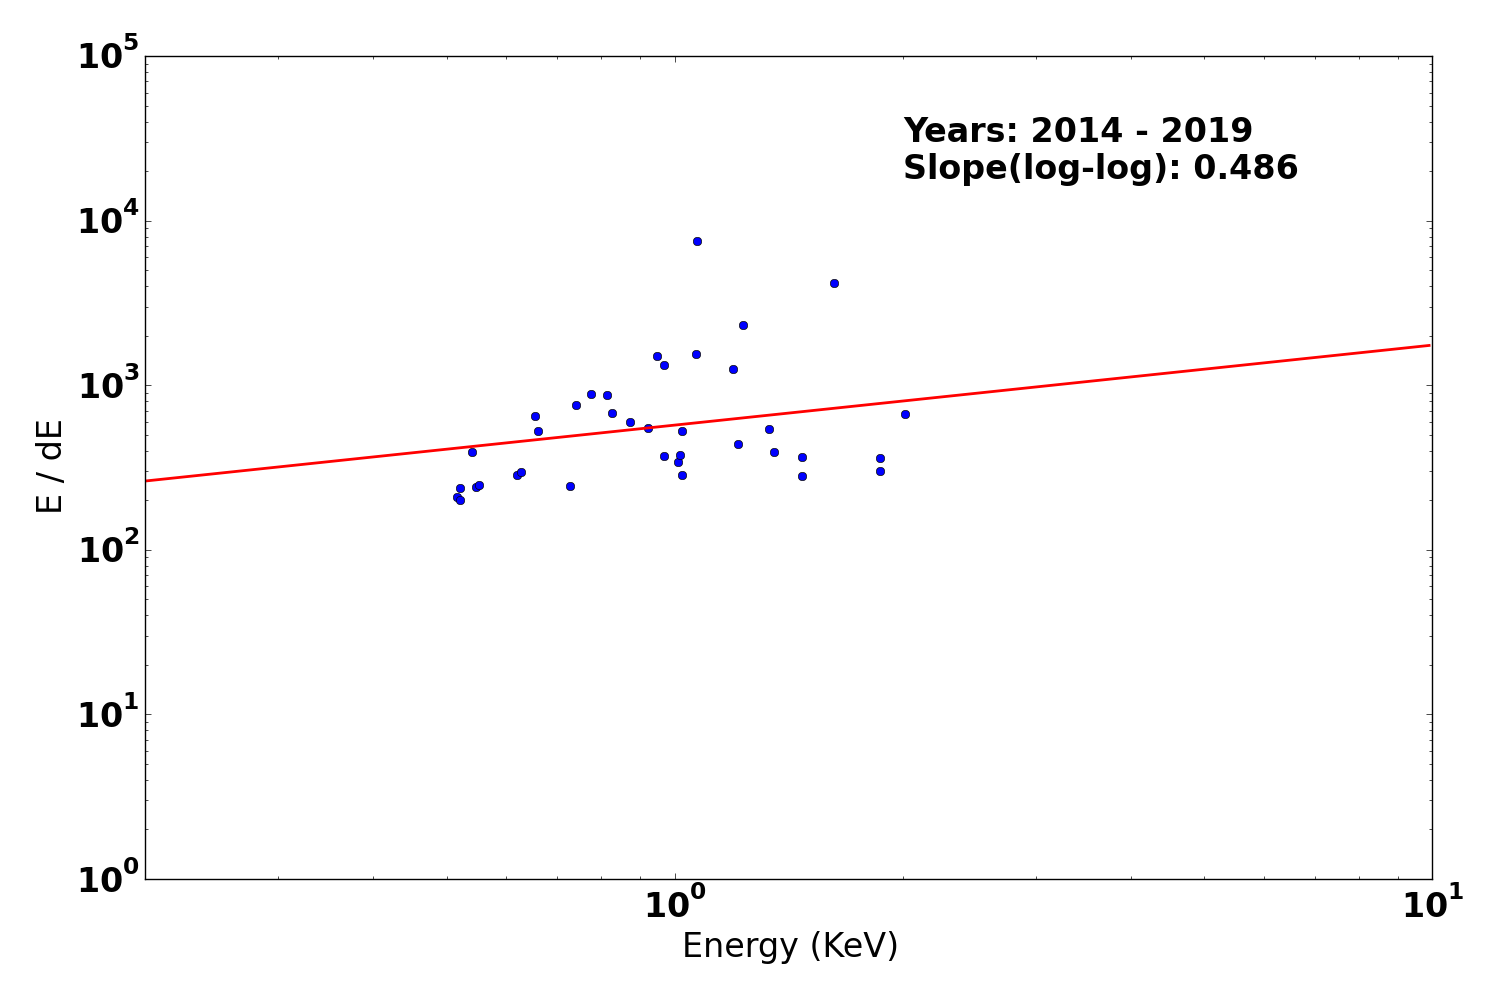
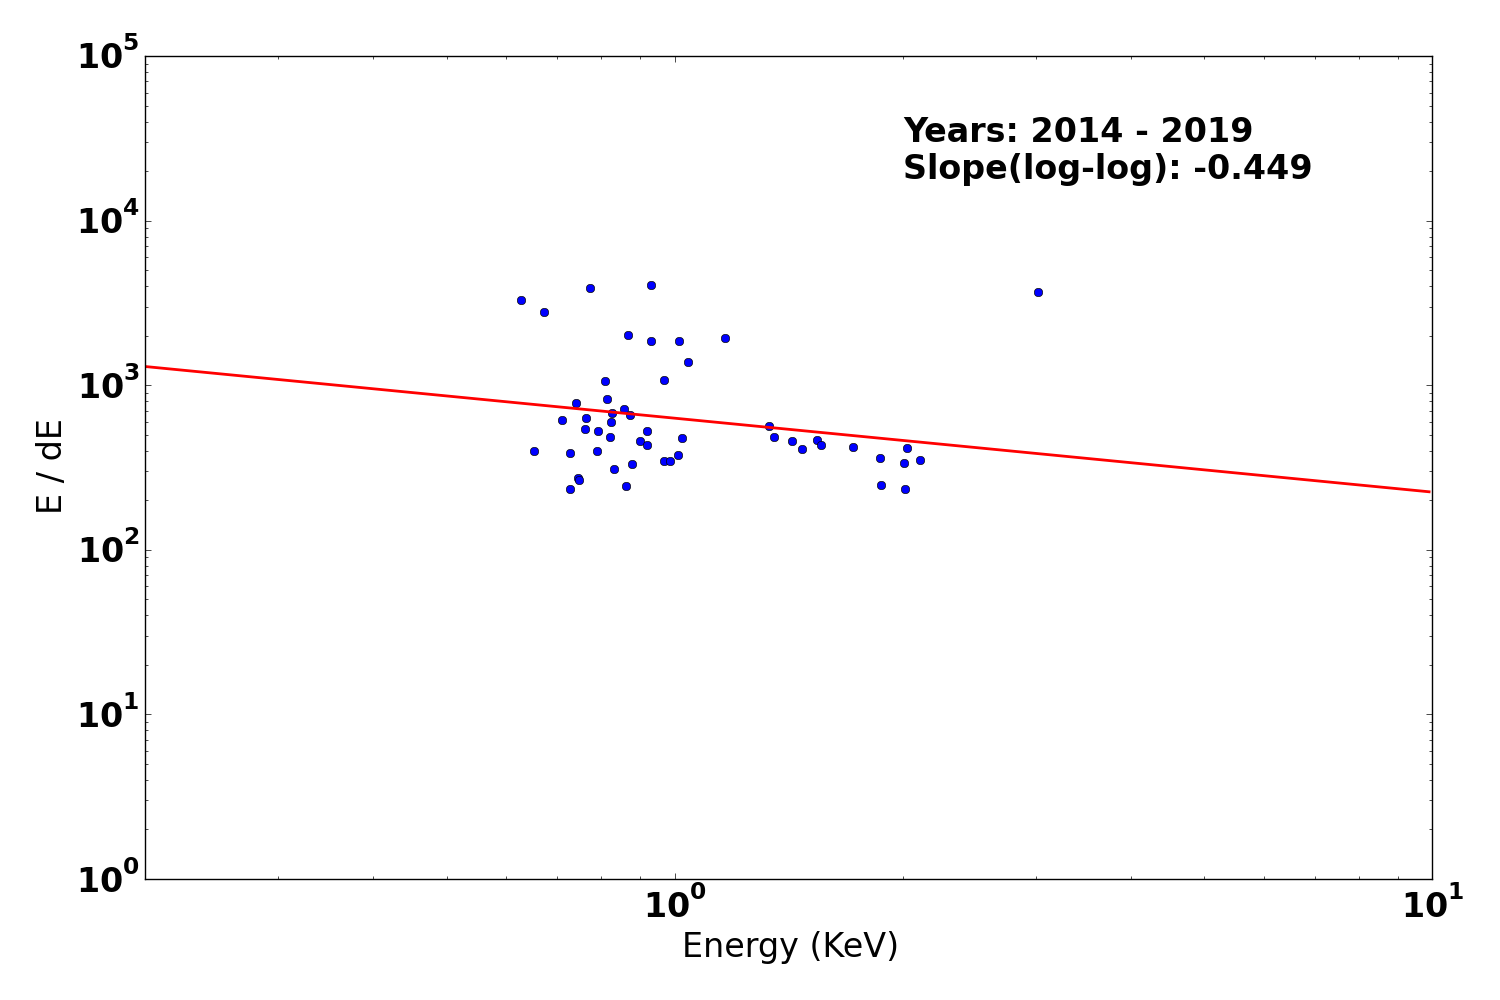
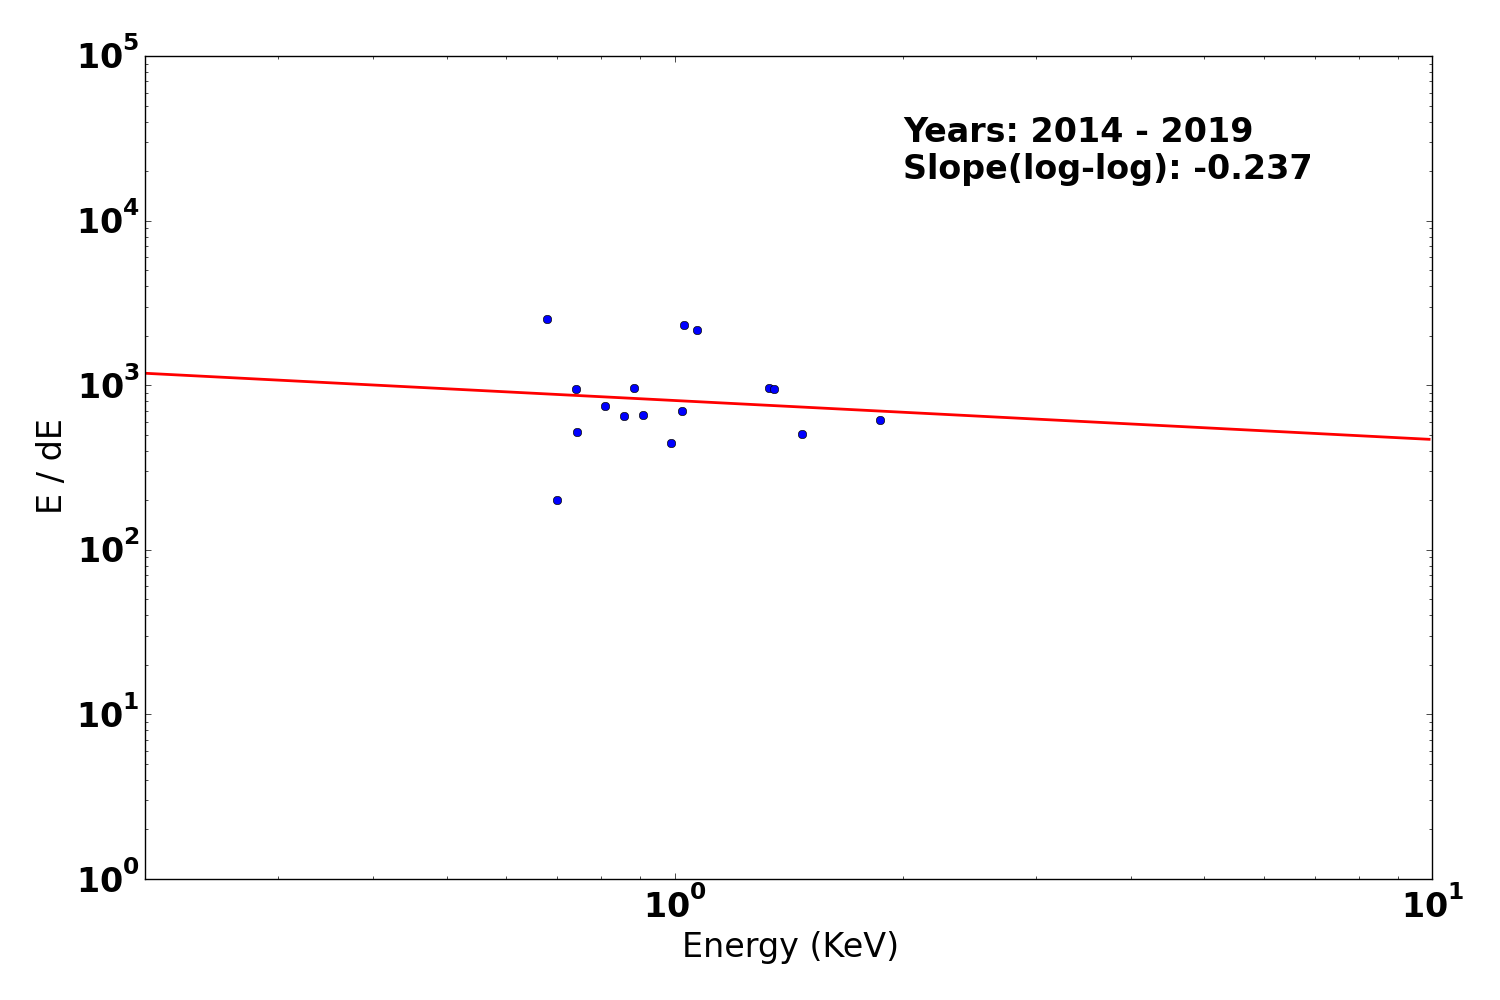
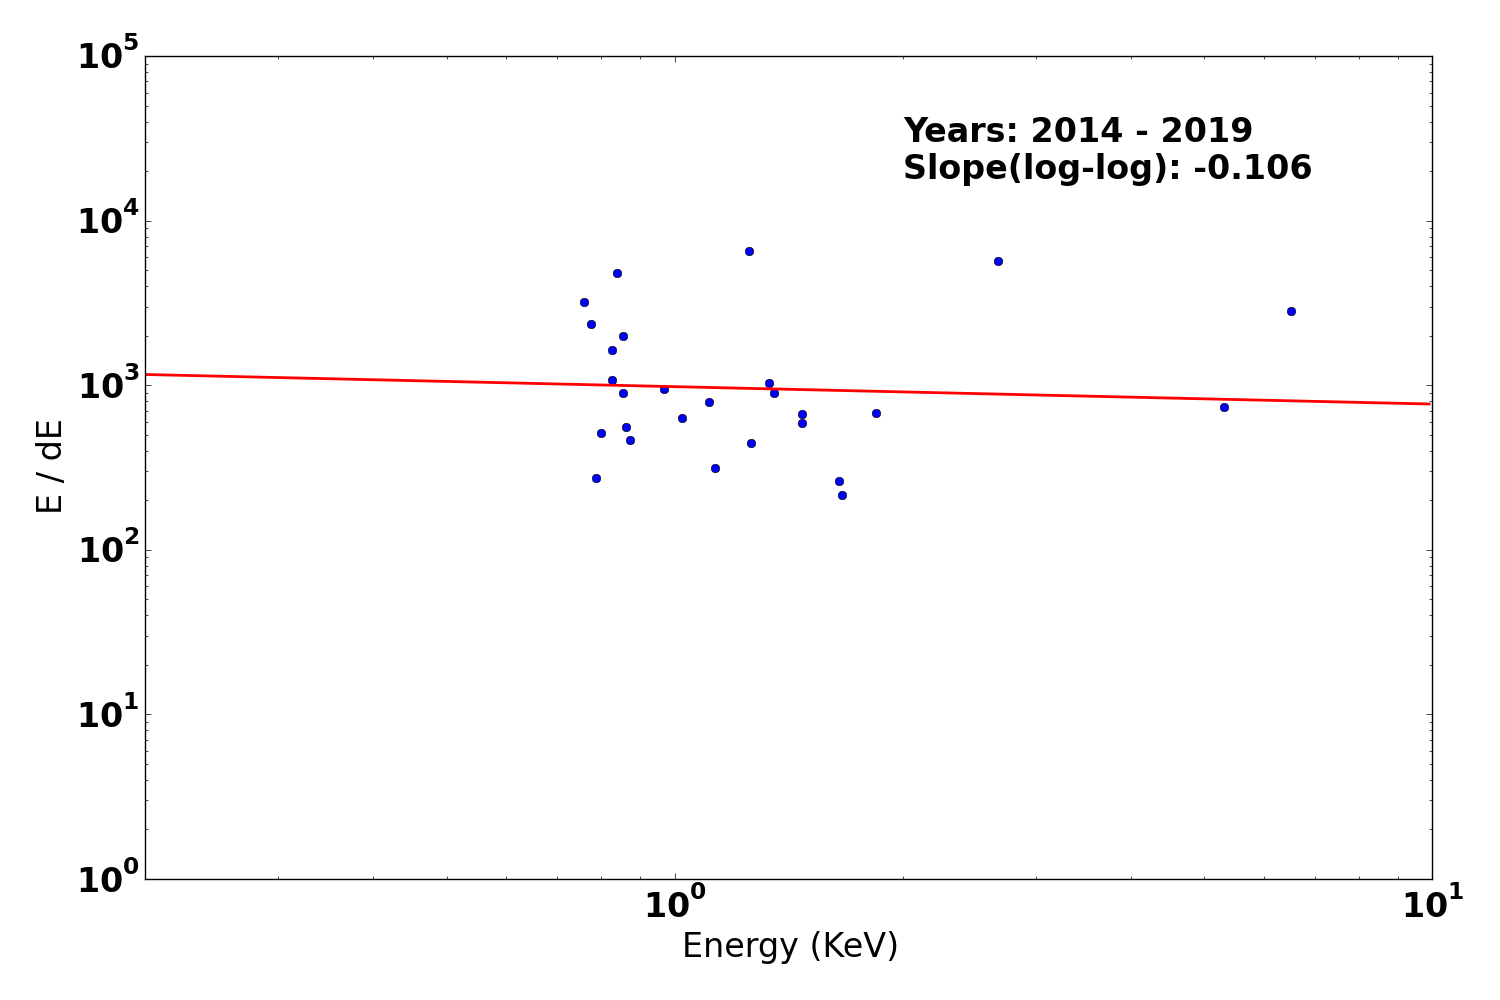
We plot E/dE vs. E for fits to detected lines with fwhm_error/fwhm less than 0.15 for the plus and minus arms of HEG, MEG, and LEG. Also shown are conservative (dotted line) and optimistic (dashed line) pre-launch resolving power expectations.
We have selected only calibration observations of Capella, HR1099, and Sigma Gem. See MIT technotes for a parallel analysis.
| Year 2014 - | |
|---|---|
| Letg minus side | Letg plus side |
 |
 |
| Metg minus side | Metg plus side |
 |
 |
| Hetg minus side | Hetg plus side |
 |
 |
PCAD
ACA Trending
Gyro Bias Drift
Radiation History
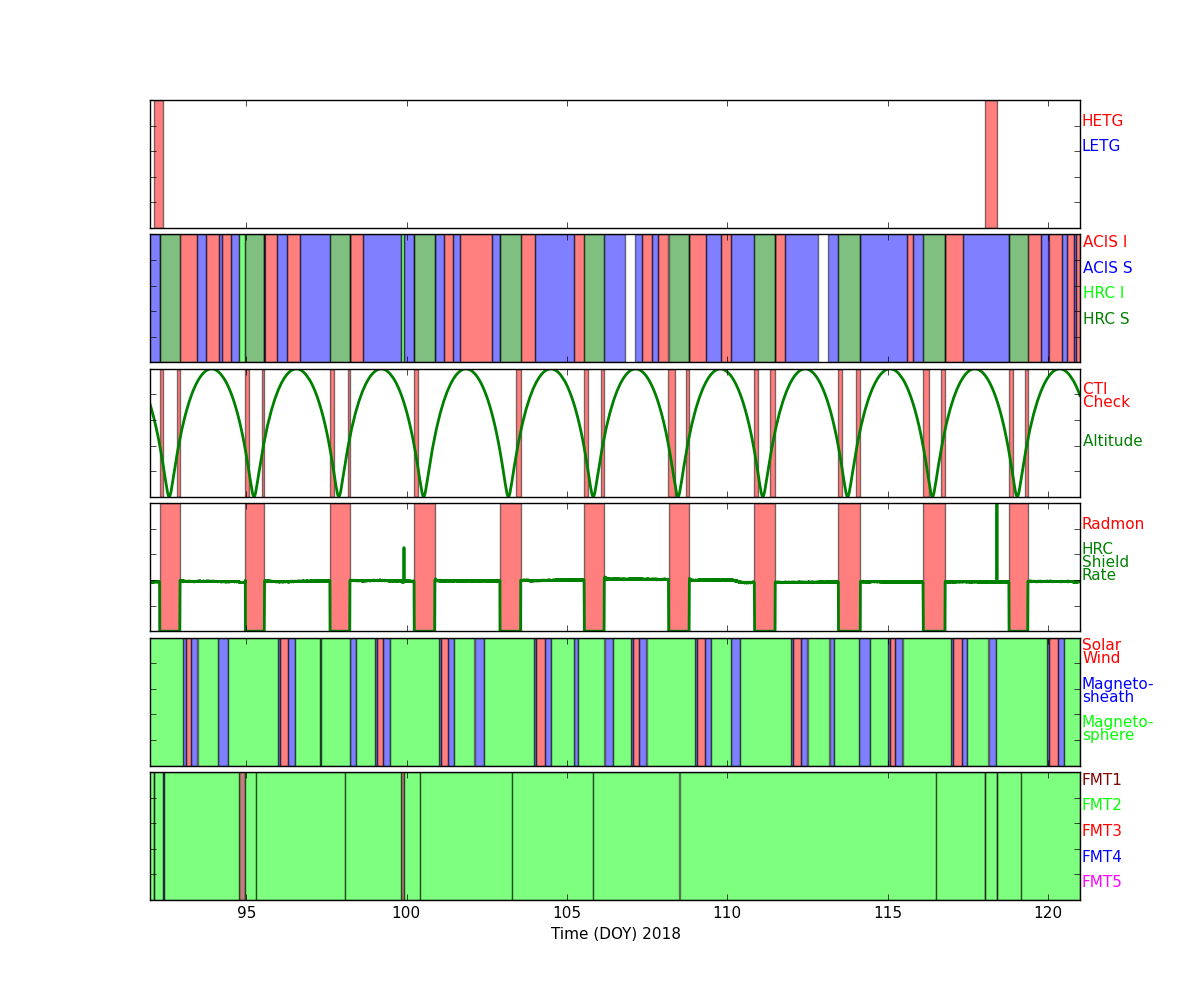
Radiation Zone Timing
Plotted below are radiation zone timing plots based on the following definitions of radiation zone:
- RADZONE - Ephin levels (in any of the E1300,P4GM,P41GM channels) are more than 1/3 of RADMON safing thresholds.
- RADMON - Radmon is disabled for radiation zone (as commanded based on OFLS model, for comparison with actual radiation levels).
- PERIGEE - Time of closest earth approach (for comparison)
Radiation Count Rates of Apr 2018
Sun Spot History
SIM
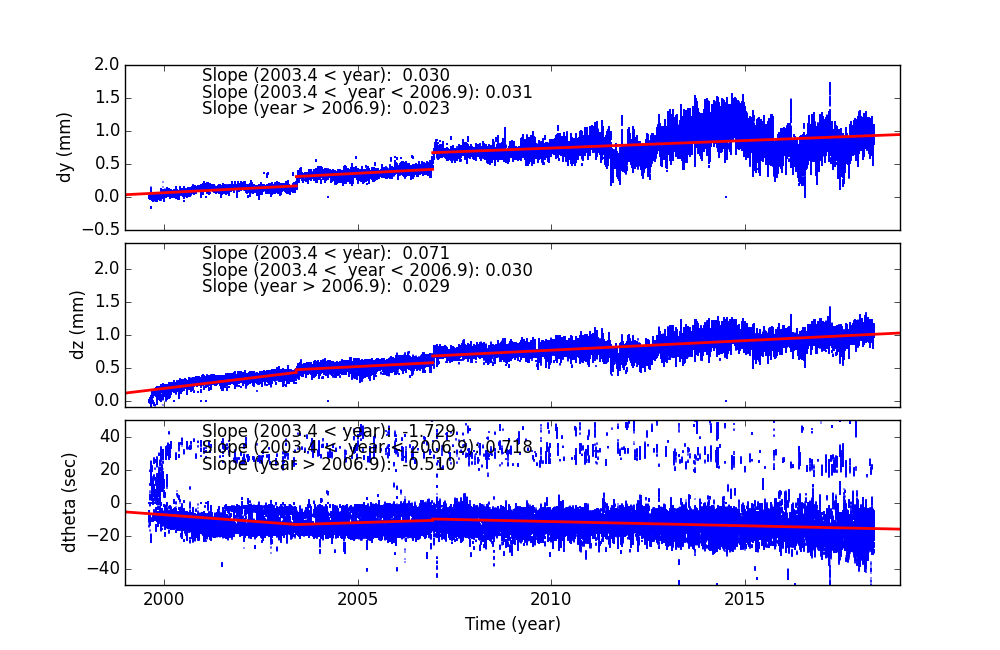
SIM Shift and Twist
SIM Shift and Twist Trend The following plots show trends of SIM shifts (dy and dz) and twist (dtheta). All quantities are directly taken from pcaf*_asol1.fits files. The units are mm for dy and dz, and degree for dtheta. We fit three lines separated before and after (Days of Mission)= 1400 (May 21, 2003), 2700 (Dec 11, 2006), and 4400 (Aug 07, 2011). The unit of slopes are mm per day or degree per day.
The sudden shift around DOM = 1400, 2700 and 4400 are due to fid light drift (see a memo by Aldcroft fiducial light drift). On the dtheta plot, two tracks are clearly observed. The track around 0.01 is due to HRC-I, and all others are clustered around -0.002. For more detail, please see SIM Shift and Twist Trend page
Trending
Quarterly Trends
- EPS Batteries
| Previous Quarter | ||||||
| MSID | MEAN | RMS | DELTA/YR | DELTA/YR/YR | UNITS | DESCRIPTION |
| EB2CI | 0.31 | 9.552e-03 | -1.010e-01 | -1.666e-01 | AMP | BATT 2 CHARGE CURRENT |
| EB2DI | 0.01 | 0.000e+00 | 0.000e+00 | 0.000e+00 | AMP | BATT 2 DISCHARGE CURRENT |
| EB2V | 32.37 | 3.102e-02 | 1.733e-01 | -4.424e+00 | V | BATT 2 VOLTAGE |
| ECNV1V | 14.89 | 2.451e-03 | -5.296e-04 | 8.531e-02 | V | CONV 1 +15V OUTPUT |
| ECNV2V | 14.84 | 9.203e-03 | -2.236e-02 | 3.872e-01 | V | CONV 2 +15V OUTPUT |
| ECNV3V | 15.29 | 2.971e-03 | 4.159e-03 | 4.832e-03 | V | CONV 3 +15V OUTPUT |
)
)
)
)
)
)
- Spacecraft Electronics
| Previous Quarter | ||||||
| MSID | MEAN | RMS | DELTA/YR | DELTA/YR/YR | UNITS | DESCRIPTION |
| ELBI | 55.10 | 1.25 | -1.392e-01 | -2.460e+01 | AMP | LOAD BUS CURRENT |
| ELBV | 28.43 | 0.17 | 2.055e+00 | 3.266e+00 | V | LOAD BUS VOLTAGE |
| OHRMAPWR | 45.08 | 0.58 | -1.825e+00 | -1.536e+01 | W | HRMA COMPUTED TOTAL POWER |
| OOBAPWR | 41.85 | 1.57 | 1.998e+00 | -4.987e+01 | W | OBA COMPUTED TOTAL POWER |
)
)
)
)
- OBA Heater
| Previous Quarter | ||||||
| MSID | MEAN | RMS | DELTA/YR | DELTA/YR/YR | UNITS | DESCRIPTION |
| OOBTHR04 | 294.45 | 1.05 | 5.298e+00 | -2.273e+01 | K | RT 27: HRMA STRUT |
| OOBTHR12 | 291.93 | 1.59 | 7.143e+00 | -6.610e+01 | K | RT 35: OBA CONE |
| OOBTHR26 | 294.85 | 2.73 | 9.472e+00 | -1.336e+02 | K | RT 48: OBA CONE |
| OOBTHR38 | 283.17 | 1.337e-02 | 3.475e-02 | 7.015e-01 | K | RT 60: TFTE CONE |
| OOBTHR44 | 293.99 | 1.61 | 6.914e+00 | -4.602e+01 | K | RT 66: TFTE COVER |
| OOBTHR50 | 288.82 | 1.65 | 7.587e+00 | -6.063e+01 | K | RT 76: S/C STRUT |
)
)
)
)
)
)
Envelope Trending
Spacecraft Motions
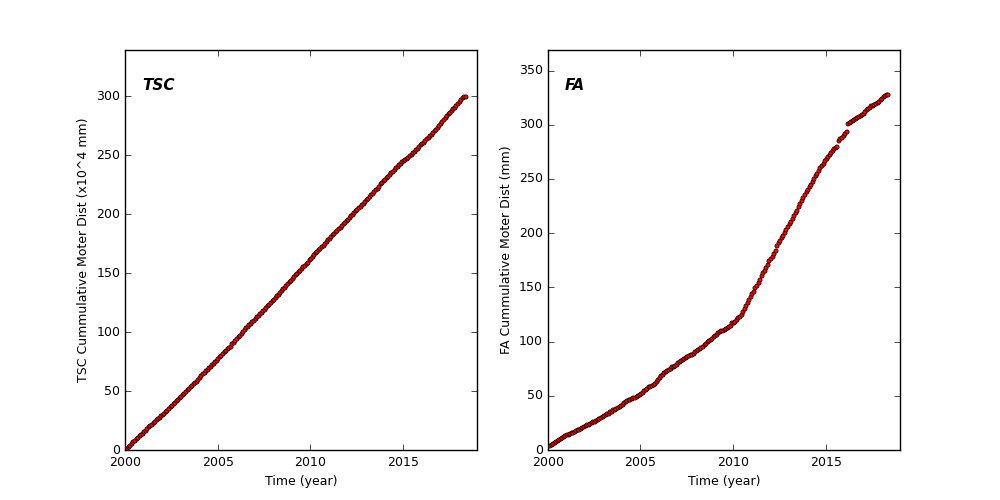
TSC and FA Cummulative Moter Distance
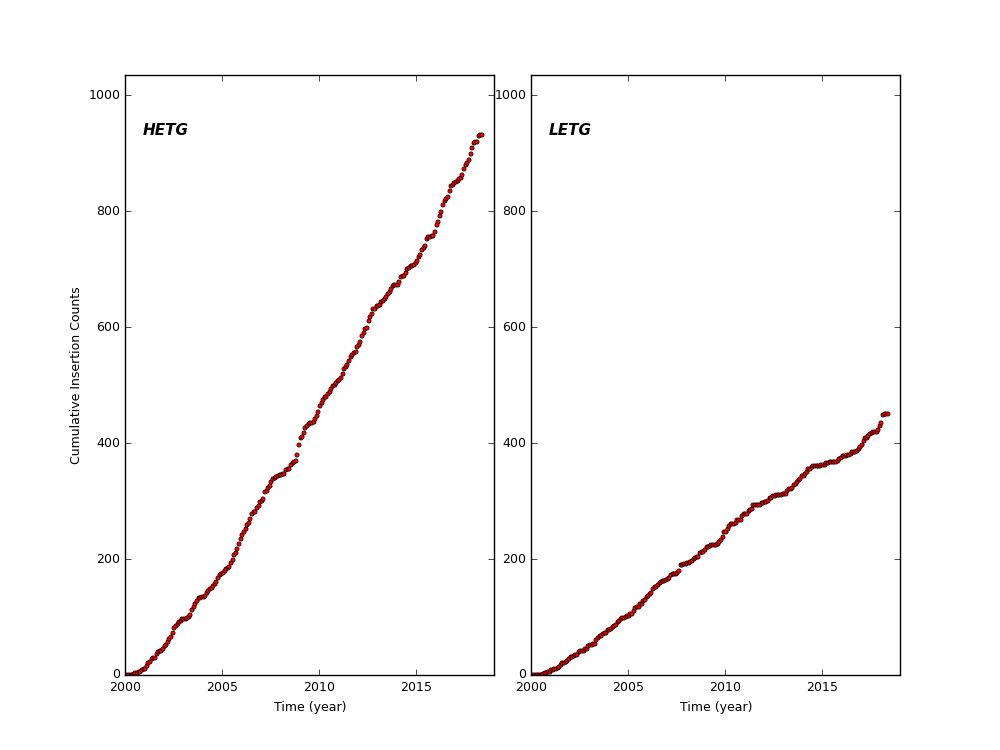
HETG and LETG Cummulative Insertion Counts
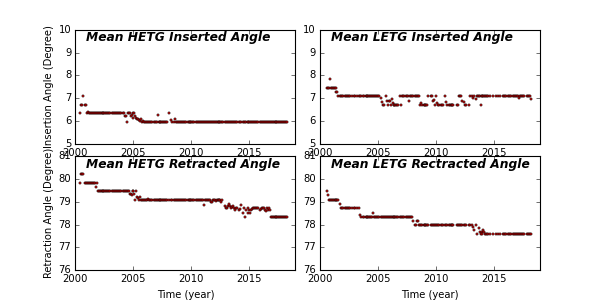
HETG/LETG Insertion/Retraction Angle
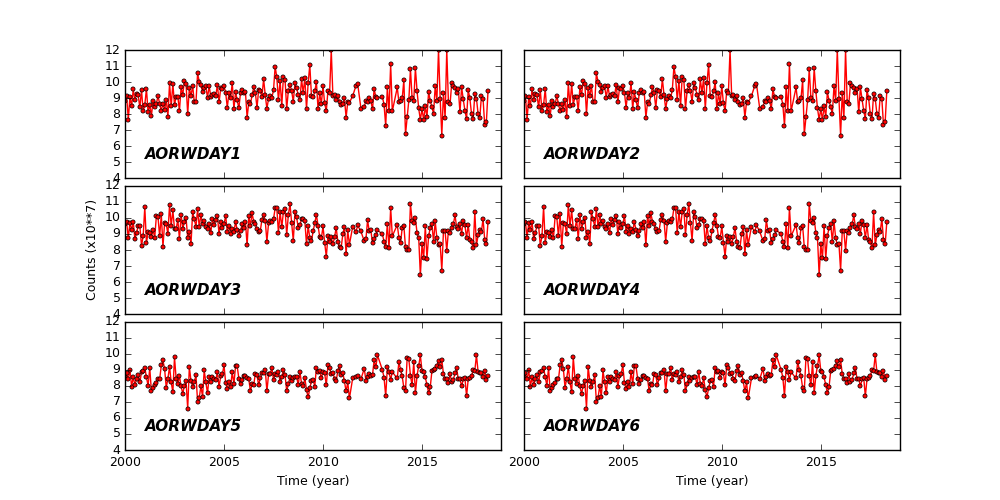
Reaction Wheel Rotations
Links to Past Monthly Reports
| Year | Month | |||||||||||
|---|---|---|---|---|---|---|---|---|---|---|---|---|
| 2018 | Jan | Feb | Mar | |||||||||
| 2017 | Jan | Feb | Mar | Apr | May | Jun | Jul | Aug | Sep | Oct | Nov | Dec |
| 2016 | Jan | Feb | Mar | Apr | May | Jun | Jul | Aug | Sep | Oct | Nov | Dec |
| 2015 | Jan | Feb | Mar | Apr | May | Jun | Jul | Aug | Sep | Oct | Nov | Dec |
| 2014 | Jan | Feb | Mar | Apr | May | Jun | Jul | Aug | Sep | Oct | Nov | Dec |
| 2013 | Jan | Feb | Mar | Apr | May | Jun | Jul | Aug | Sep | Oct | Nov | Dec |
| 2012 | Jan | Feb | Mar | Apr | May | Jun | Jul | Aug | Sep | Oct | Nov | Dec |
| 2011 | Jan | Feb | Mar | Apr | May | Jun | Jul | Aug | Sep | Oct | Nov | Dec |
| 2010 | Jan | Feb | Mar | Apr | May | Jun | Jul | Aug | Sep | Oct | Nov | Dec |
| 2009 | Jan | Feb | Mar | Apr | May | Jun | Jul | Aug | Sep | Oct | Nov | Dec |
| 2008 | Jan | Feb | Mar | Apr | May | Jun | Jul | Aug | Sep | Oct | Nov | Dec |
| 2007 | Jan | Feb | Mar | Apr | May | Jun | Jul | Aug | Sep | Oct | Nov | Dec |
| 2006 | Jan | Feb | Mar | Apr | May | Jun | Jul | Aug | Sep | Oct | Nov | Dec |
| 2005 | Jan | Feb | Mar | Apr | May | Jun | Jul | Aug | Sep | Oct | Nov | Dec |
| 2004 | Jan | Feb | Mar | Apr | May | Jun | Jul | Aug | Sep | Oct | Nov | Dec |
| 2003 | Jan | Feb | Mar | Apr | May | Jun | Jul | Aug | Sep | Oct | Nov | Dec |
| 2002 | Jan | Feb | Mar | Apr | May | Jun | Jul | Aug | Sep | Oct | Nov | Dec |
| 2001 | Jan | Feb | Mar | Apr | May | Jun | Jul | Aug | Sep | Oct | Nov | Dec |
| 2000 | Jan | Feb | Mar | Apr | May | Jun | Jul | Aug | Sep | Oct | Nov | Dec |
| 1999 | Jul | Aug | Sep | Oct | Nov | Dec | ||||||