ACIS
ACIS DOSE Registered-Photon-Map
The steps we took to compute the dose map are;
- Level 1 Event files for a specified month are obtained from archive.
- Image data including I2, I3, S2, S3 CCDs are extracted from all event files.
- All the extracted image data were merged to create a month long exposure map for the month.
- The exposure map is opened with ds9, and check a distribution of count rates against energy. From this, estimate the upper threshold value. Any events beyond this upper threshold are assumed erroneous events such as bad pixels.
- Using this upper threshold, the data is filtered, and create a cleaned exposure map for the month.
- The exposure map from each month from the Sep 1999 is added up to create a cumulative exposure map for each month.
- Using fimgstatistic, we compute count rate statistics for each CCDs.
- For observations with high data drop rates (e.g., Crab nebula, Cas A), we corrected the observations by adding events.
Please check more detail plots at Telemetered Photon Dose Trend page.
)
)
)
Statistics:
# IMAGE     NPIX     MEAN        RMS        MIN     MAX
ACIS_may18 6004901       10.565         18.131           0.0     7031


I2 node 0  262654	8.762965	6.623009	0.0	2816.0
I2 node 1  262654	9.264968	9.628902	0.0	3665.0
I2 node 2  262654	9.099602	3.754687	0.0	 98.0
I2 node 3  262654	9.163879	15.454485	0.0	5683.0

I3 node 0  262654	9.645226	3.997273	0.0	127.0
I3 node 1  262654	9.923194	6.401528	0.0	339.0
I3 node 2  262654	9.381791	3.790574	0.0	 98.0
I3 node 3  262654	9.260626	17.644645	0.0	7031.0

S2 node 0  262654	10.176773	18.150675	0.0	6179.0
S2 node 1  262654	10.548249	5.196824	0.0	 83.0
S2 node 2  262654	12.465529	16.367039	0.0	5355.0
S2 node 3  262654	13.165409	21.871637	0.0	6029.0

S3 node 0  262654	16.085735	15.481730	0.0	264.0
S3 node 1  262654	12.887021	5.496988	0.0	270.0
S3 node 2  262654	11.815659	4.427122	0.0	203.0
S3 node 3  262654	10.456162	4.159316	0.0	167.0
)
)
)
Statistics:
 IMAGE     NPIX      MEAN        RMS           MIN      MAX
ACIS_total   6004901       2205.565         2859.436           0.0   124182


I2 node 0  262654	1895.765763	374.767562	394.0	10671.0
I2 node 1  262654	1995.714550	522.032863	414.0	78499.0
I2 node 2  262654	9.099602	3.754687	0.0	 98.0
I2 node 3  262654	2032.745535	526.250618	400.0	28470.0

I3 node 0  262654	2149.849230	532.189499	393.0	8635.0
I3 node 1  262654	2232.983779	1657.493198	409.0	54834.0
I3 node 2  262654	1963.505894	363.779153	393.0	10995.0
I3 node 3  262654	9.260626	17.644645	0.0	7031.0

S2 node 0  262654	2567.407096	401.152444	1463.0	21737.0
S2 node 1  262654	10.548249	5.196824	0.0	 83.0
S2 node 2  262654	3016.296607	620.233499	2049.0	27660.0
S2 node 3  262654	2965.212151	473.740267	1801.0	54065.0

S3 node 0  262654	4565.219547	2078.839897	2003.0	26706.0
S3 node 1  262654	5744.691865	2213.335927	0.0	28519.0
S3 node 2  262654	4513.413212	1212.246894	1895.0	24804.0
S3 node 3  262654	3484.663259	643.258841	2136.0	24450.0
)
|
)
|
)
|
)
|
| Feb 2018 | Nov 2017 | Aug 2017 | May 2017 |
|---|
The Mean Detrended CTI
We report CTIs with a refined data definition. CTIs were computed for the temperature dependency corrected data. Please see CTI page for detailed explanation. CTI's are computed for Mn K alpha, and defined as slope/intercept x10^4 of row # vs ADU. Data file: here
Imaging CCDs
Spectral CCDs
Backside CCDs
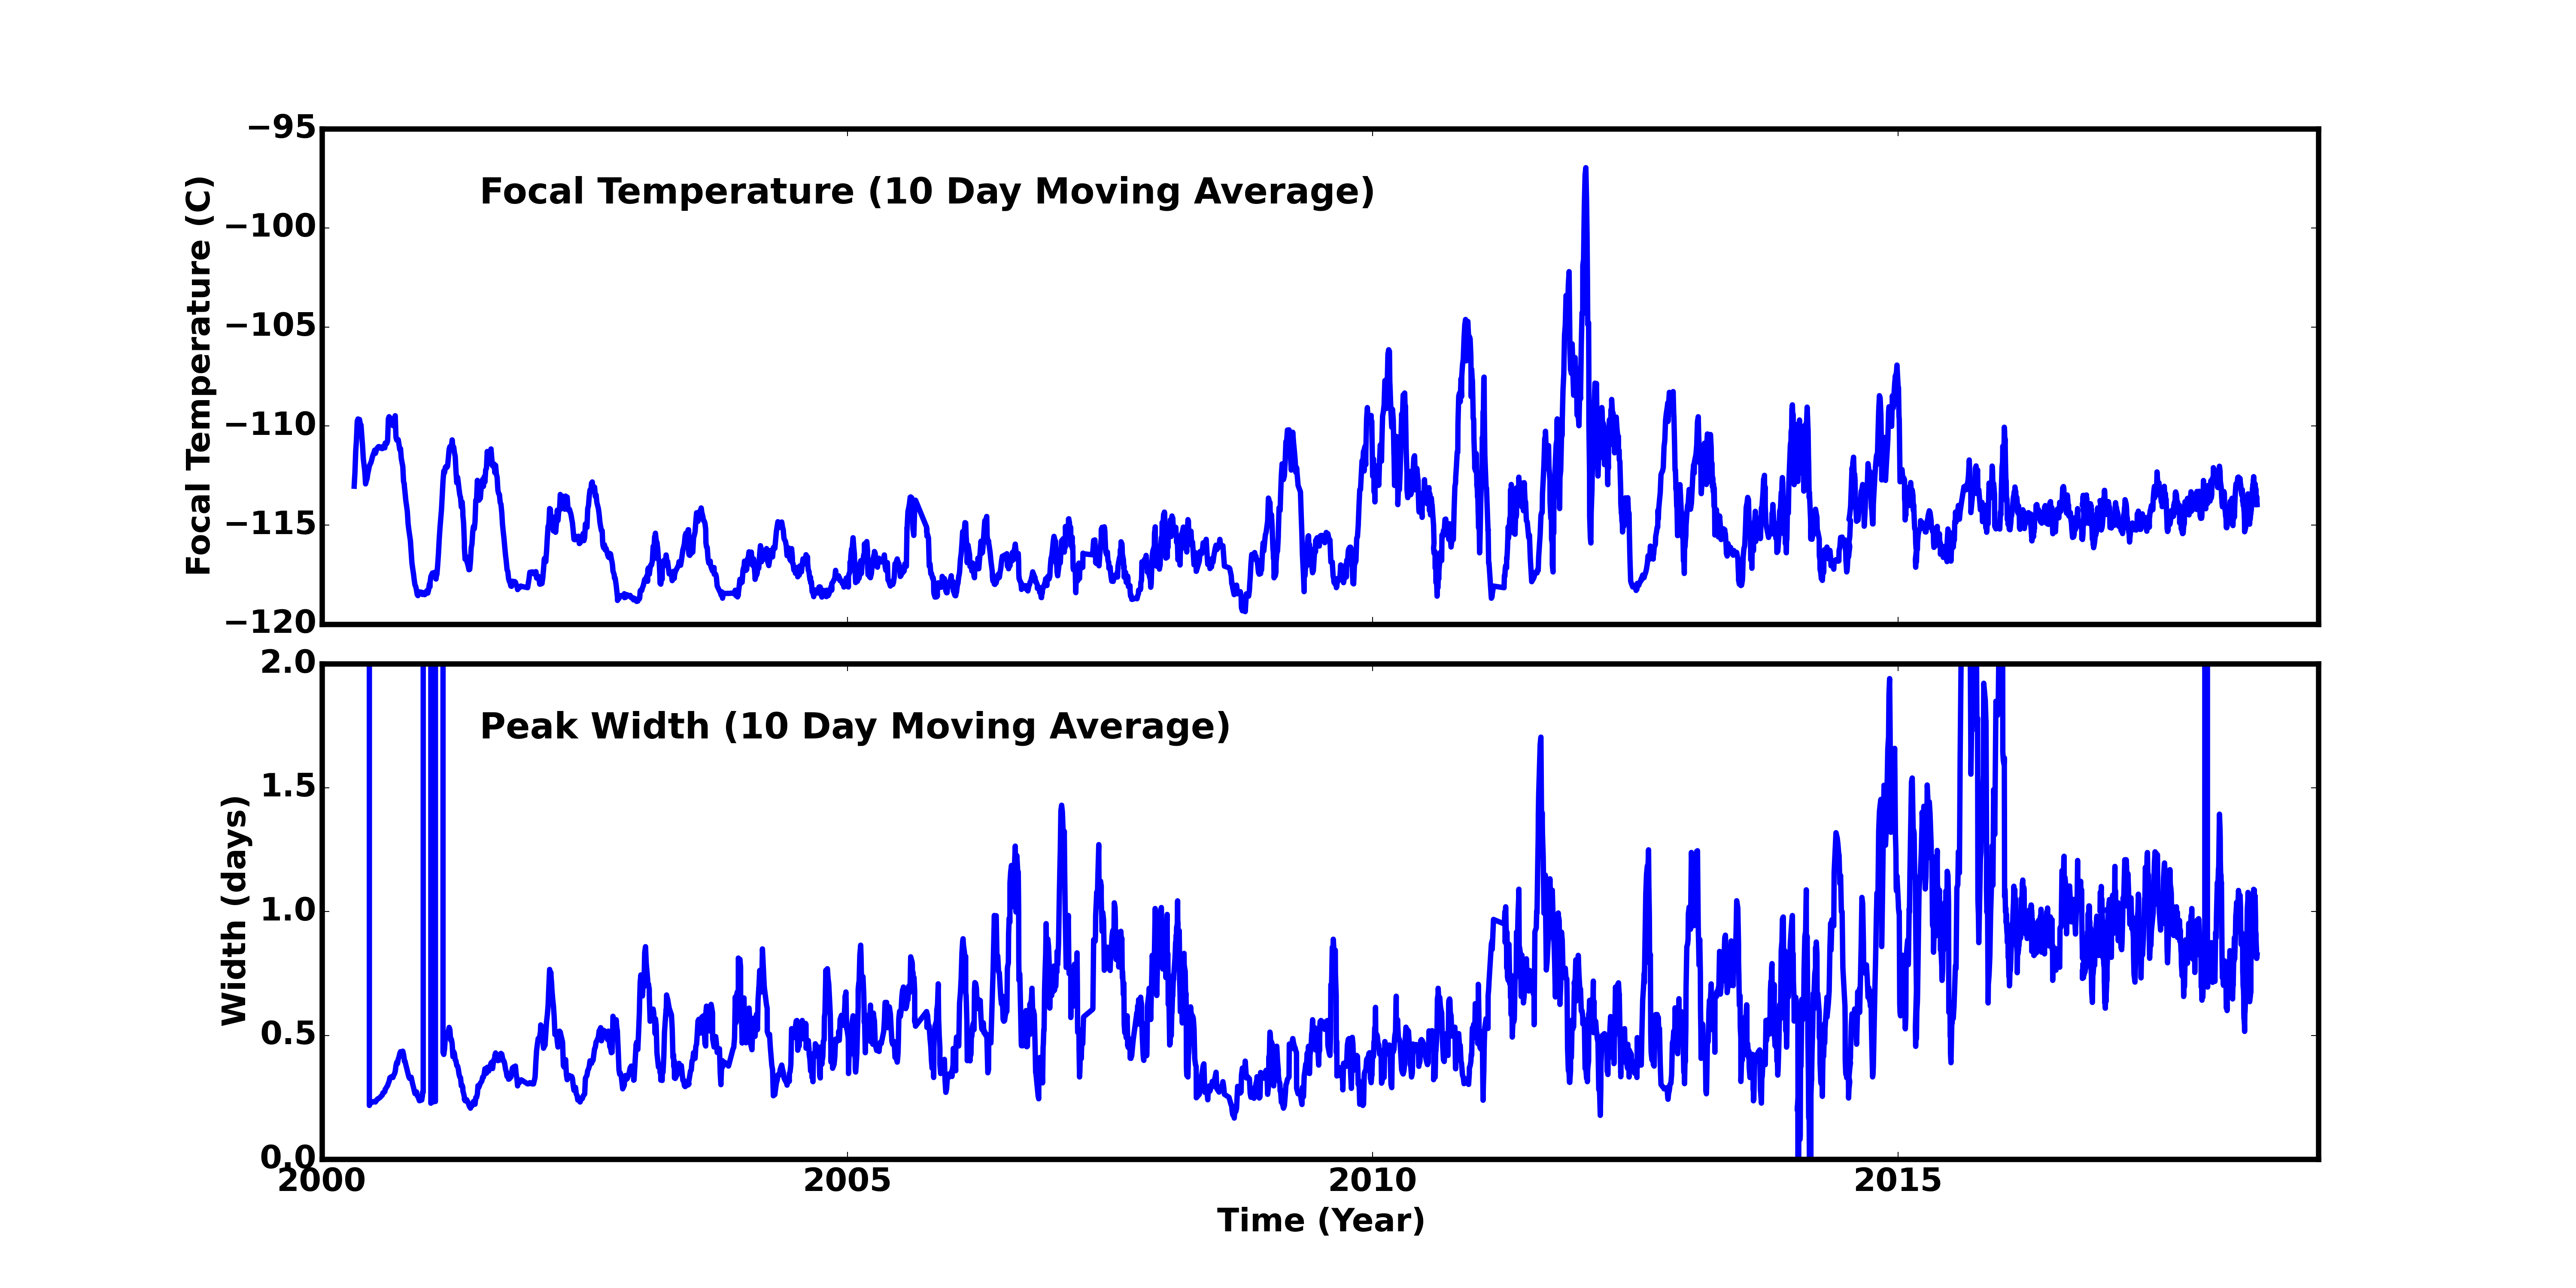
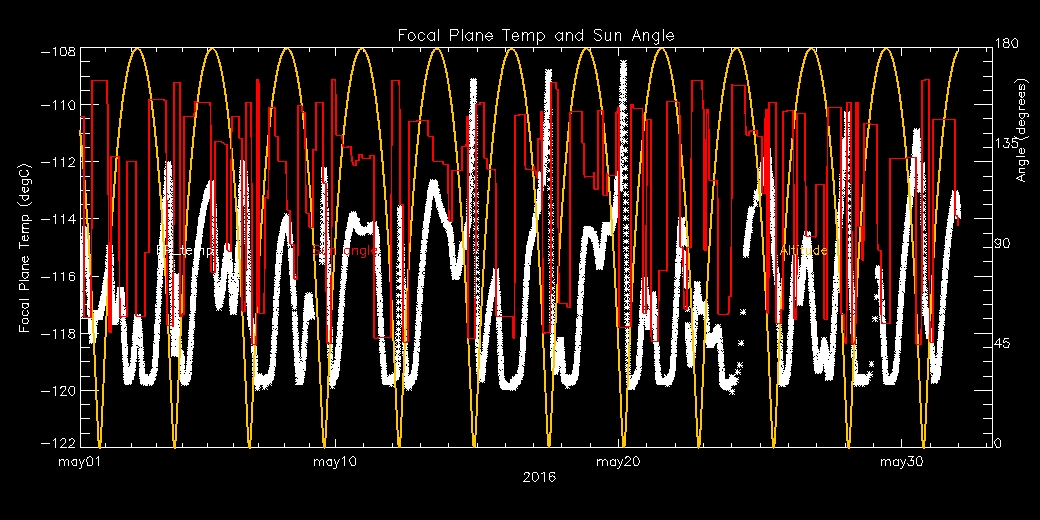
Focal Plane Temperature
May 2018 Focal Temperature
| The Mean (max) FPT: | |
|---|---|
| -113.68 | +/- 2.31 C |
| Mean Width: | |
| 0.87 | +/- 0.39 days |
Averaged Focal Plane Temperature
We are using 10 period moving averages to show trends of peak temperatures and peak widths. Note, the gaps in the width plot are due to missing/corrupted data.
Focal Plane Temperature, Sun Angle and Altitude
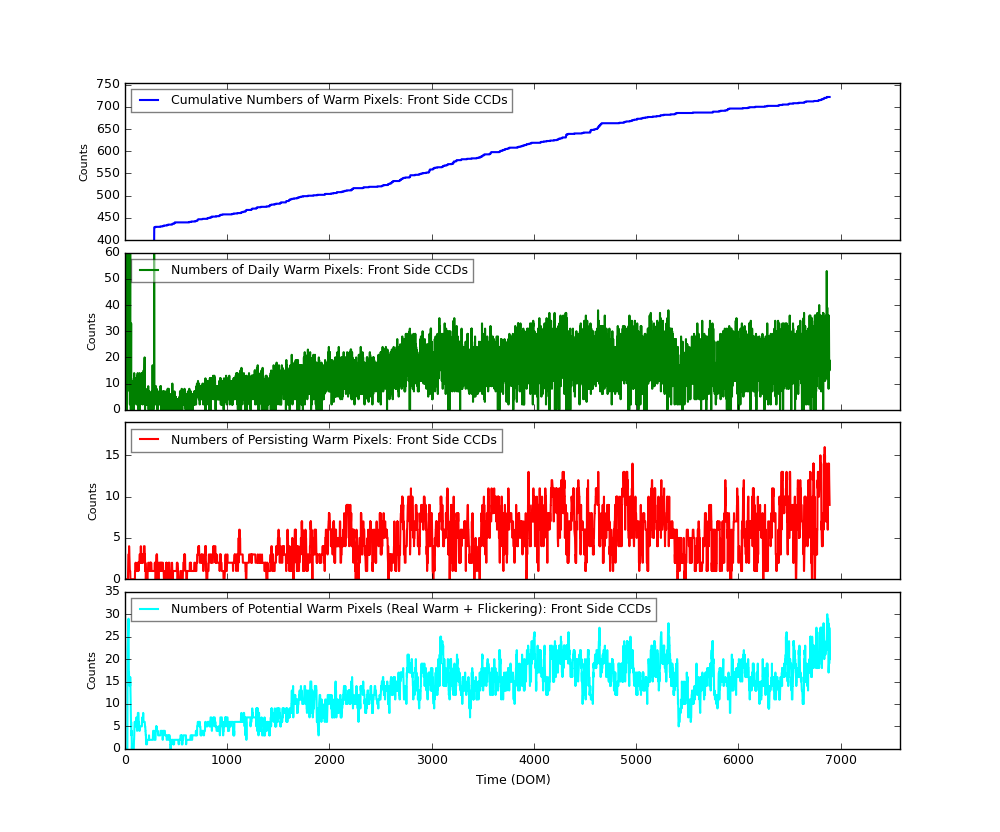
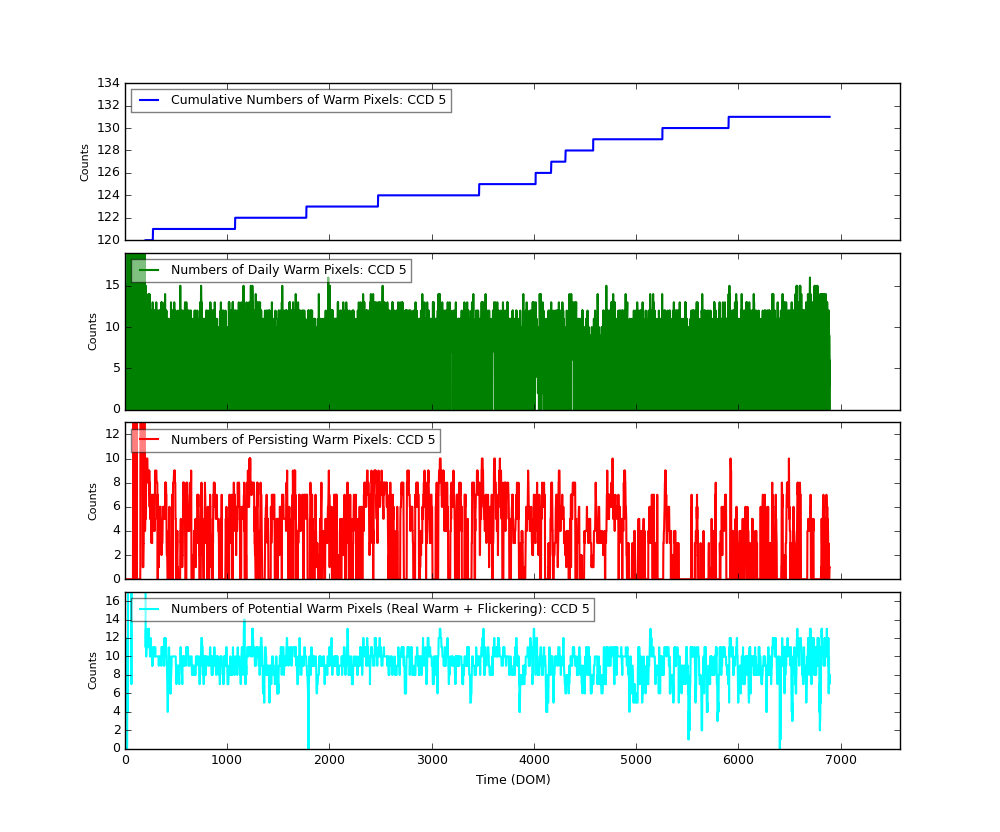
Bad Pixels
The plots below were generated with a new warm pixel finding script. Please see Acis Bad Pixel Page for details.
Front Side CCDs
Back Side CCD (CCD5)
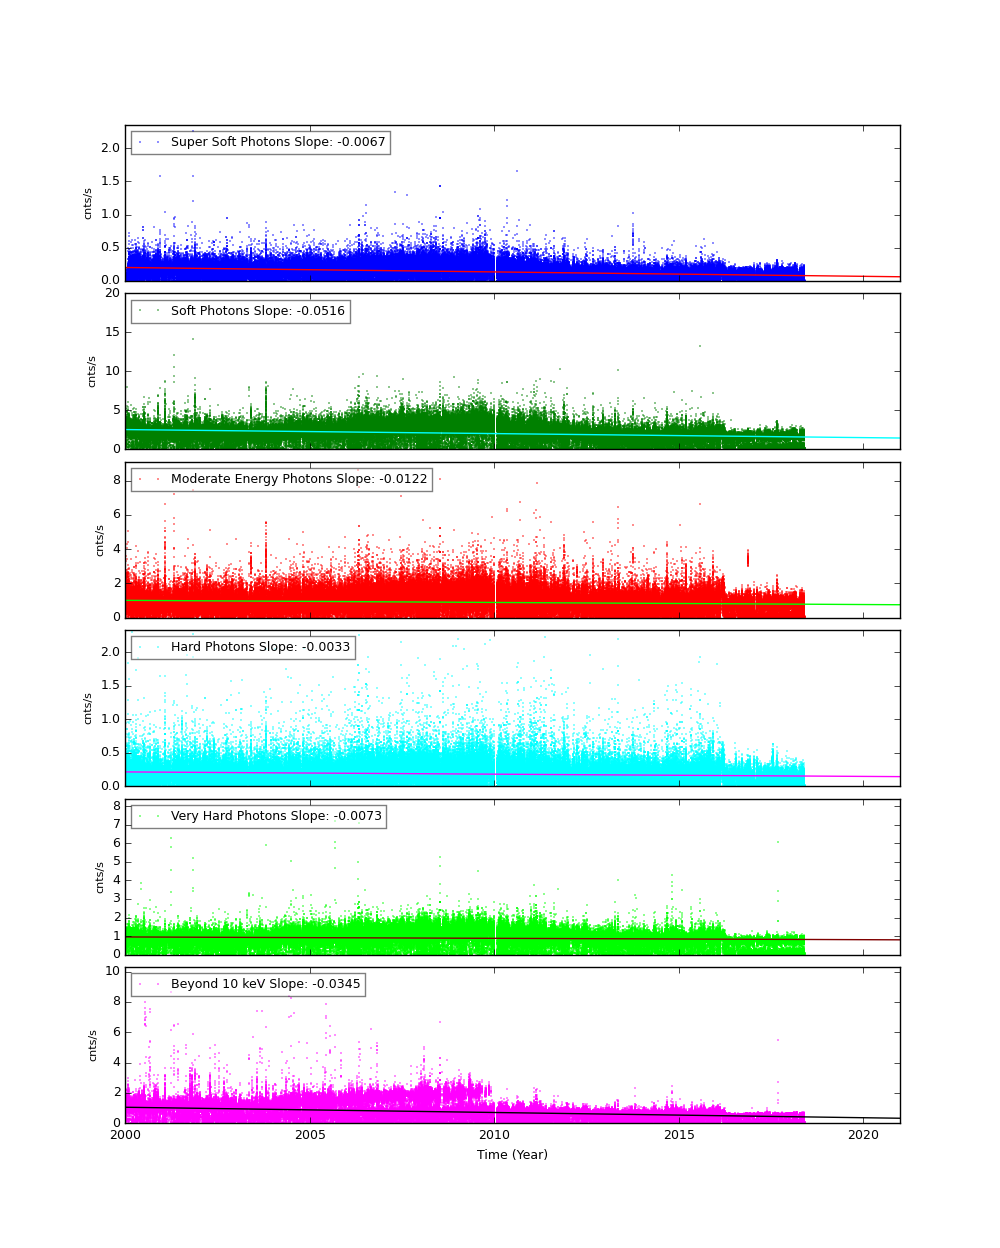
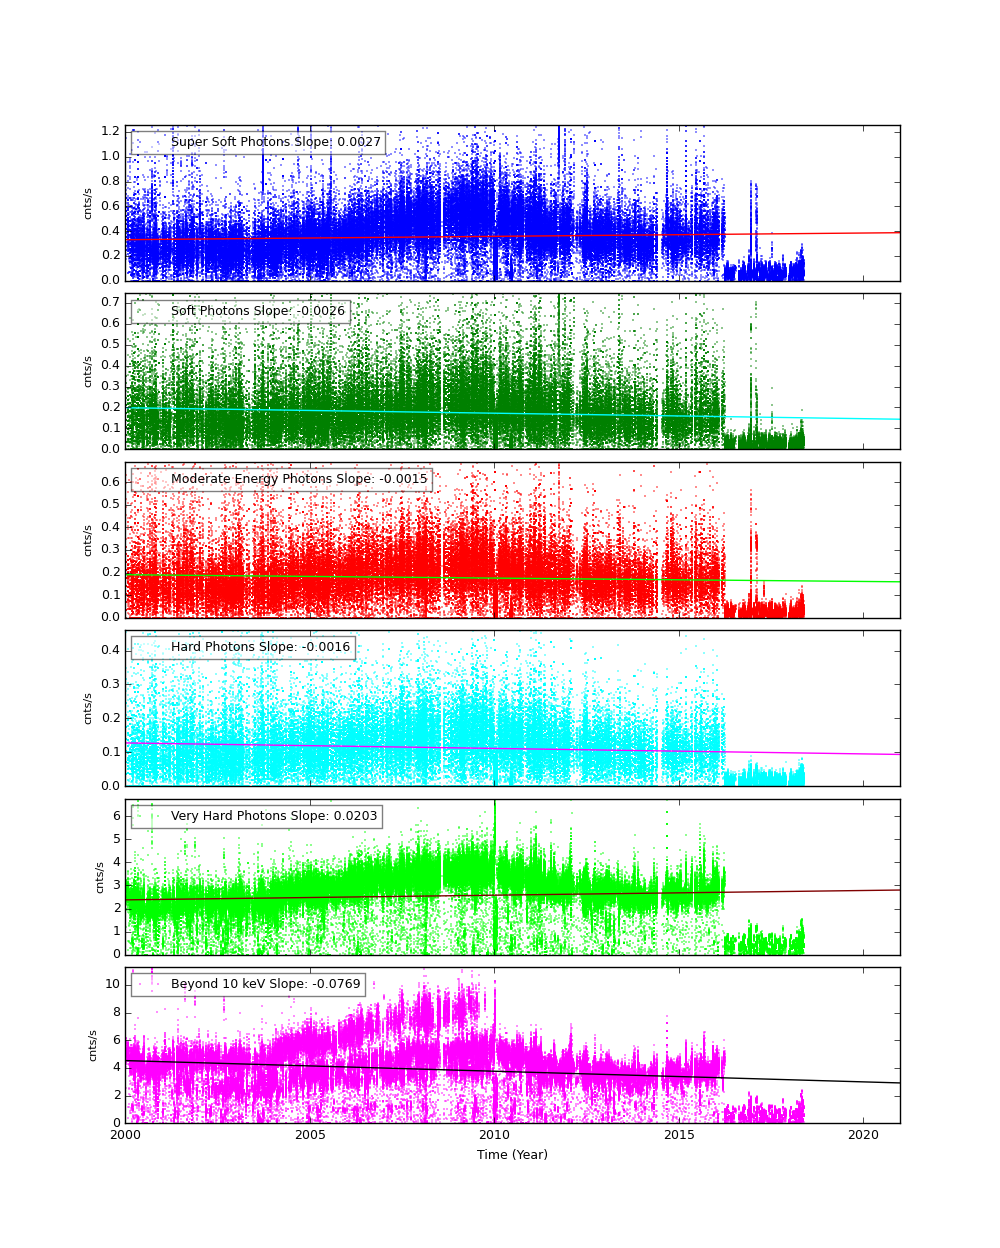
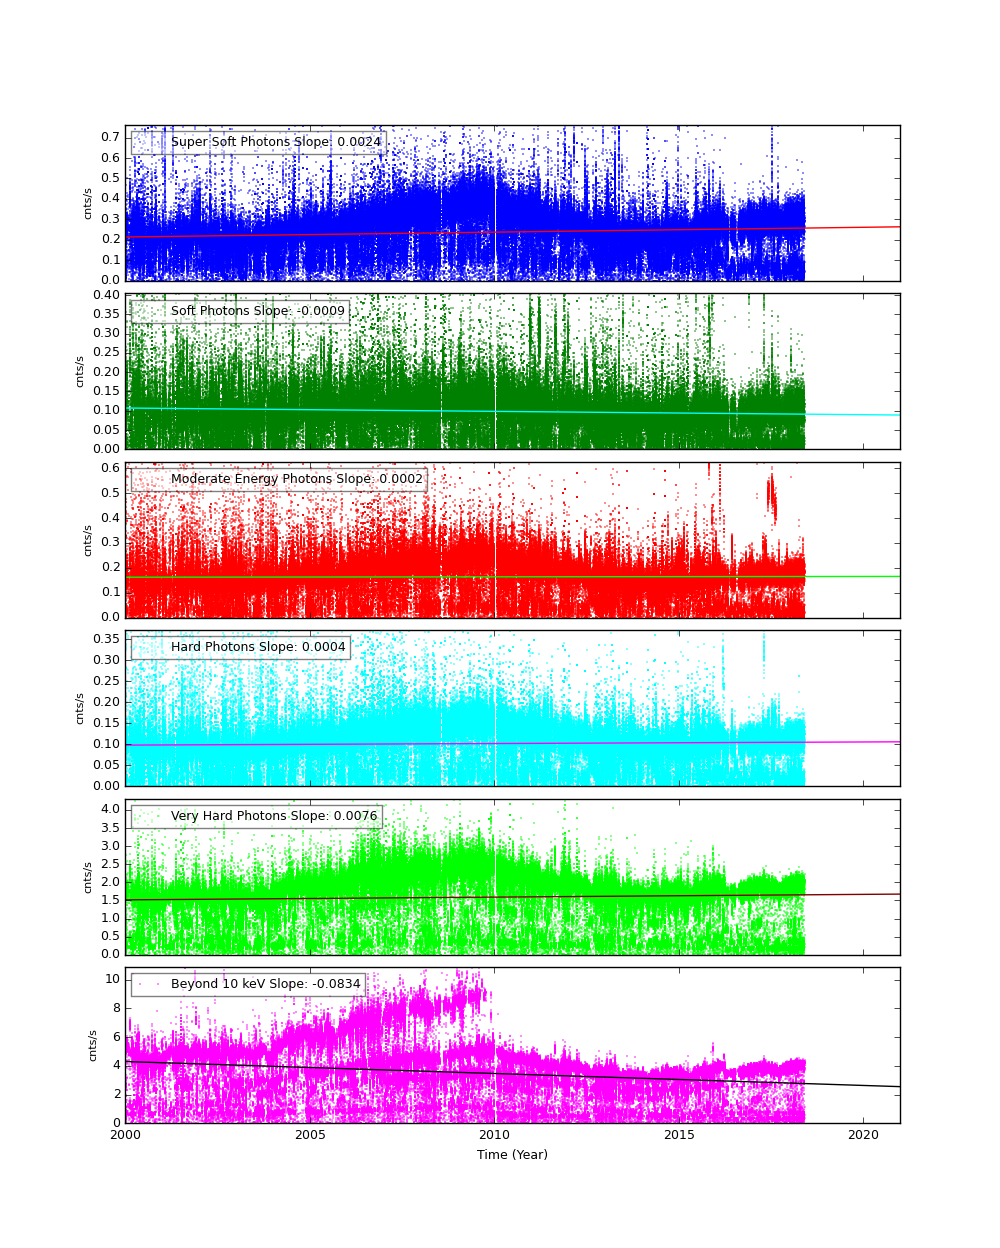
Science Instrument Background Rates
| Name | Low (keV) | High(KeV) | Description |
|---|---|---|---|
| SSoft | 0.00 | 0.50 | Super soft photons |
| Soft | 0.50 | 1.00 | Soft photons |
| Med | 1.00 | 3.00 | Moderate energy photons |
| Hard | 3.00 | 5.00 | Hard Photons |
| Harder | 5.00 | 10.00 | Very Hard photons |
| Hardest | 10.00 | Beyond 10 keV |
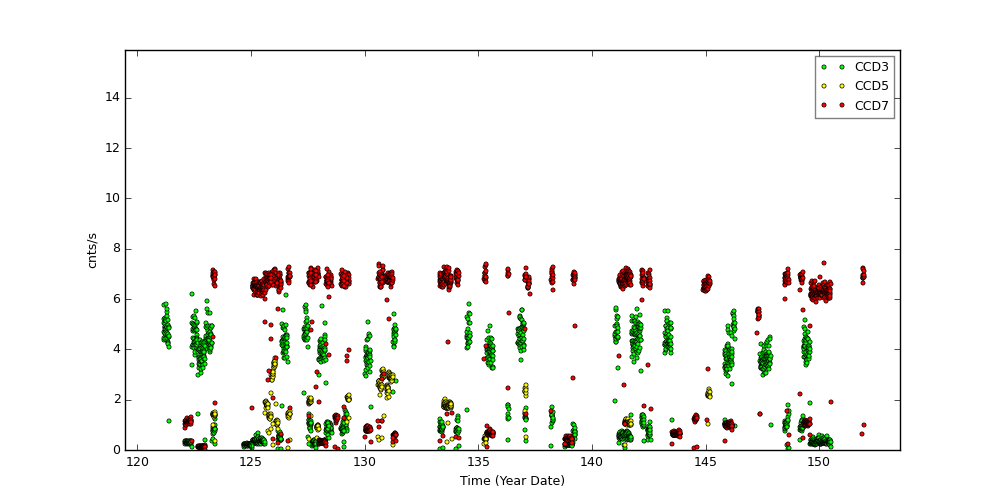
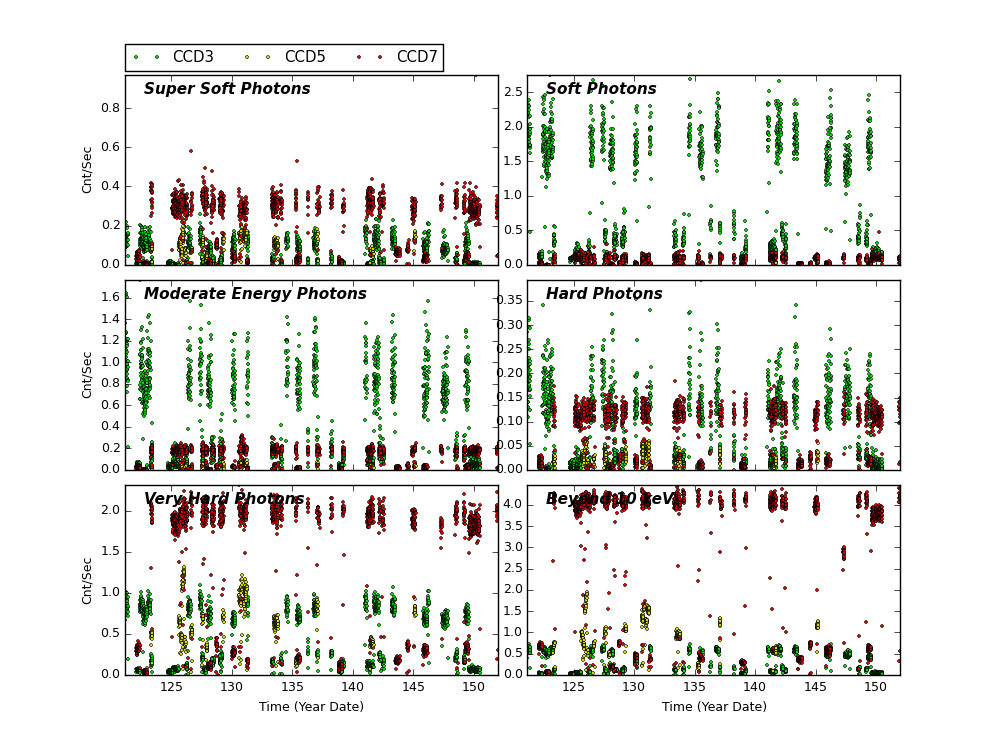
The following three plots show trends of SIB from year 2000. CCDs shown here are CCD3, CCD5, and CCD7. Fitted lines are linear fit after eliminating extreme outliers. For >10 keV plots, 2 lines are fit. One is with a 13 keV filter, and another without.
CCD 3
CCD 5
CCD 7
ACIS Histogram Mode Trends
We collected data from acis histogram mode data, and created trend plots of peak portions and peak widths against time (DOM). The peaks were estimated by fitting a simple Gaussian on three peaks (Al, Ti, and Mn), and the widths were estimated by a width at the half max from the peak.
All histogram data are taken under TIMED and GRADED_HIST mode, SIM position is at an external calibration source position, the focal temperature is around -119.7 C, and parameter settings in aciselec, acistemp are set to about same for all.
CCD 3, Peak Position
CCD 3, Peak Widths
CCD 3, Count Rates
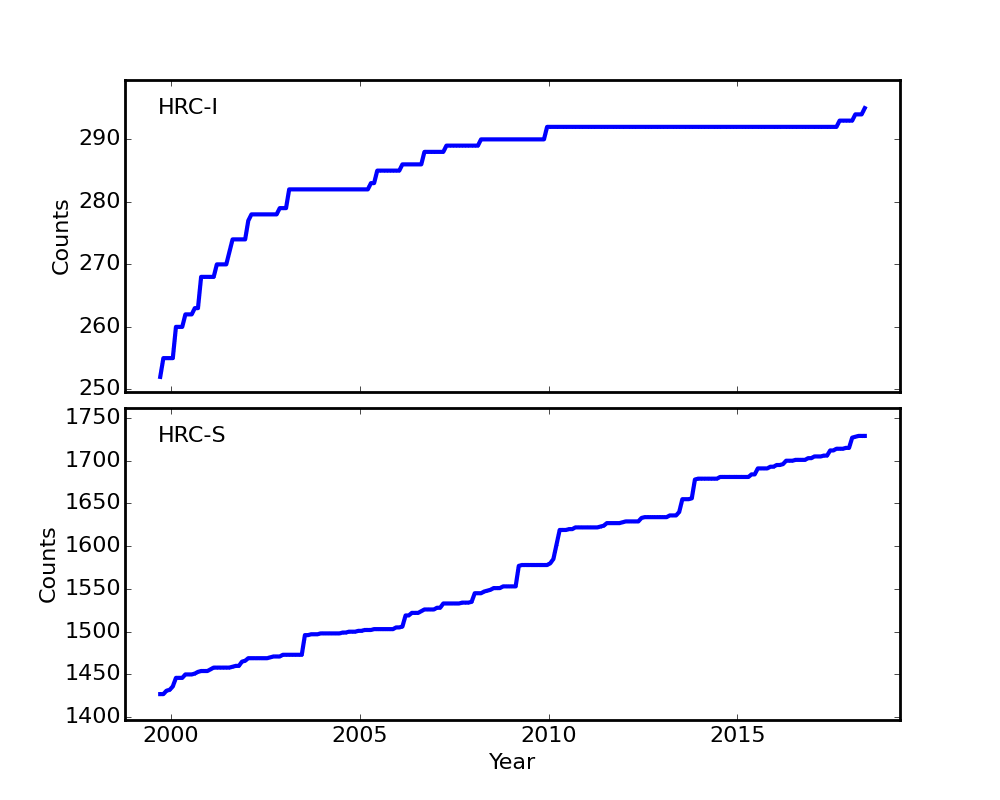
HRC
DOSE of Central 4K Pore-Pairs
Please refer to Maximum Dose Trends for more details.
)
|
|---|
IMAGE                NPIX      MEAN    STDDEV      MIN       MAX
HRCI_05_2018.fits  16777216	0.083 	0.328 	0.000 	24.000
)
IMAGE                       NPIX      MEAN    STDDEV      MIN       MAX
HRCI_08_1999_05_2018.fits  16777216	5.258 	5.365 	0.000 	295.000
)
|
|---|
IMAGE                NPIX      MEAN    STDDEV      MIN       MAX
HRCS_05_2018.fits  16777216	0.036 	0.243 	0.000 	7.000
)
IMAGE                       NPIX      MEAN    STDDEV      MIN       MAX
HRCS_08_1999_05_2018.fits  16777216	17.464 	32.131 	0.000 	1729.000
|
|
Max dose trend plots corrected for events that "pile-up"
in the center of the taps due to bad position information.
|
)
|
)
|
)
|
)
|
| Feb 2018 | Nov 2017 | Aug 2017 | May 2017 |
|---|
)
|
)
|
)
|
)
|
| Feb 2018 | Nov 2017 | Aug 2017 | May 2017 |
|---|
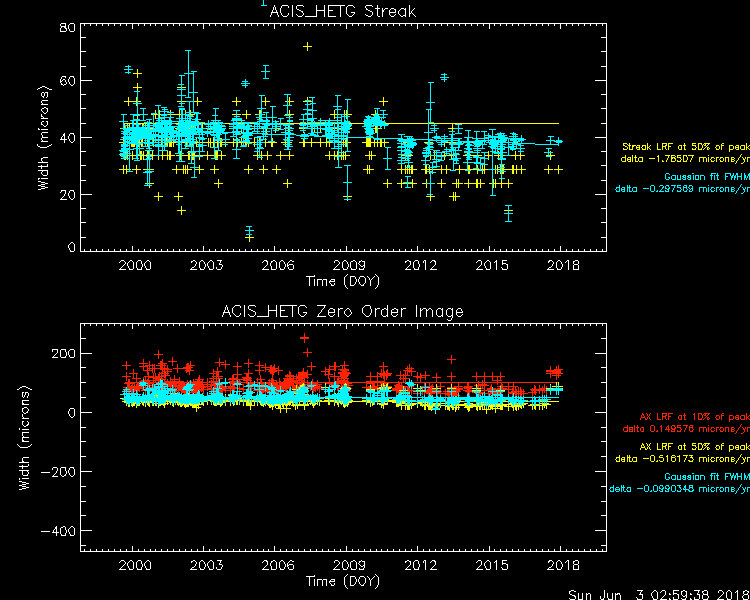
Gratings
Focus
We plot the width of the zero order streak of ACIS/HETG observations and the width of the zero order image for HRC/LETG observations of point sources. No significant defocusing trend is seen at this time. See Gratings Focus pages.
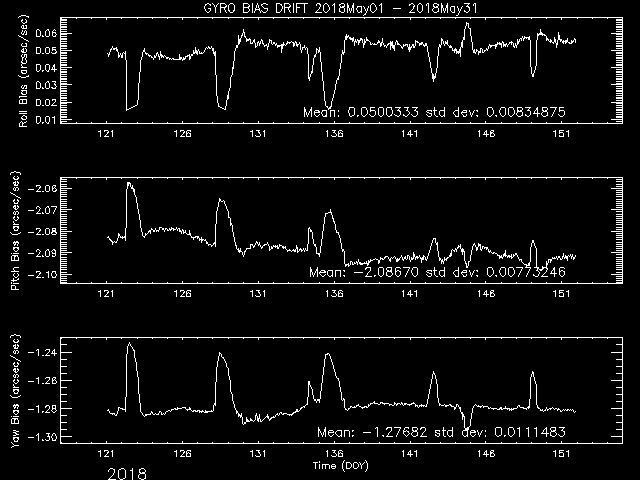
PCAD
ACA Trending
Gyro Bias Drift
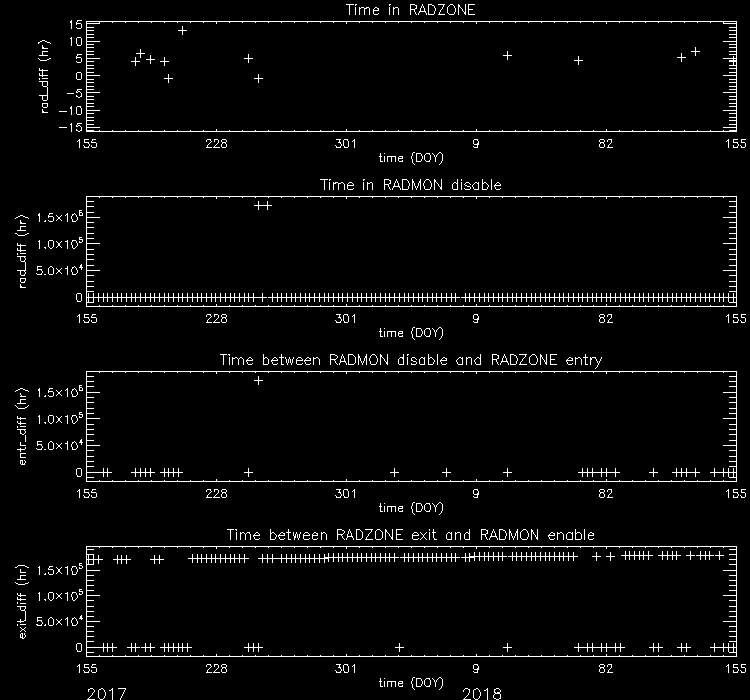
Radiation History
Radiation Zone Timing
Plotted below are radiation zone timing plots based on the following definitions of radiation zone:
- RADZONE - Ephin levels (in any of the E1300,P4GM,P41GM channels) are more than 1/3 of RADMON safing thresholds.
- RADMON - Radmon is disabled for radiation zone (as commanded based on OFLS model, for comparison with actual radiation levels).
- PERIGEE - Time of closest earth approach (for comparison)
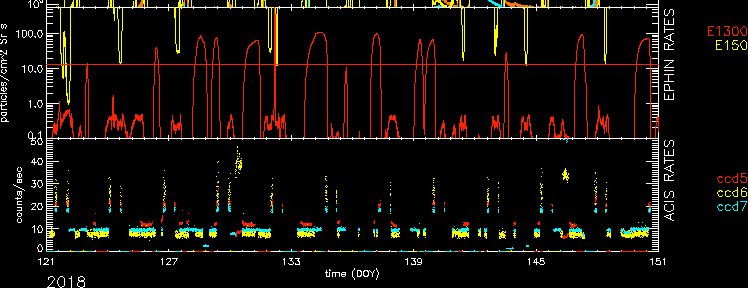
Radiation Count Rates of May 2018
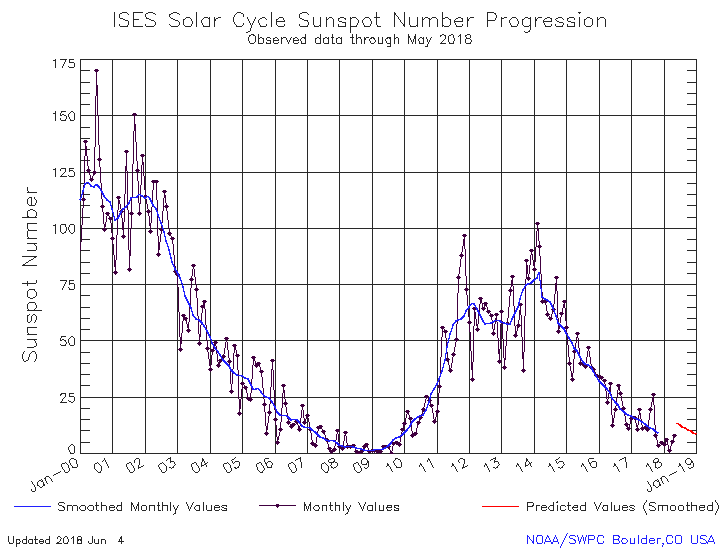
Sun Spot History
Trending
Quarterly Trends
- HRMA Heater
| Previous Quarter | ||||||
| MSID | MEAN | RMS | DELTA/YR | DELTA/YR/YR | UNITS | DESCRIPTION |
| OHRTHR03 | 295.24 | 1.102e-03 | 3.355e-03 | 3.940e-02 | K | RT 5: HRMA FORWARD APERTURE PLATE |
| OHRTHR09 | 294.72 | 0.10 | 4.532e-01 | 2.484e+00 | K | RT 105: HRMA CAP |
| OHRTHR17 | 294.59 | 0.11 | 4.758e-01 | 2.453e+00 | K | RT 125: HSA OUTER CYNLINDER |
| OHRTHR24 | 294.90 | 0.19 | 6.087e-01 | 2.654e-02 | K | RT 12: HRMA AFT HEATER PLATE |
| OHRTHR38 | 296.29 | 0.97 | 2.110e+00 | 6.203e+00 | K | RT 120: HRMA AFT COLLIMATOR OUTER CYLINDER |
| OHRTHR52 | 294.58 | 0.11 | 4.756e-01 | 2.688e+00 | K | RT 100: HRMA CAP |
)
)
)
)
)
)
- HRMA Thermal
| Previous Quarter | ||||||
| MSID | MEAN | RMS | DELTA/YR | DELTA/YR/YR | UNITS | DESCRIPTION |
| 4RT568T | 295.71 | 1.01 | -1.148e+00 | 6.415e+01 | K | RT 568 - HRMA TEMP |
| 4RT569T | 294.98 | 0.20 | -2.391e-01 | 1.725e+01 | K | RT 569 - HRMA TEMP |
| 4RT570T | 294.77 | 0.13 | -1.655e-01 | 1.141e+01 | K | RT 570 - HRMA TEMP |
| 4RT575T | 299.76 | 1.32 | -1.894e+00 | 5.962e+01 | K | RT 575 - OB CONE TEMP |
| 4RT576T | 291.61 | 0.96 | -1.480e+00 | 6.045e+01 | K | RT 576 - OB CONE TEMP |
| 4RT578T | 298.00 | 2.10 | -1.422e+00 | 1.212e+02 | K | RT 578 - OB CONE TEMP |
)
)
)
)
)
)
- MUPS
| Previous Quarter | ||||||
| MSID | MEAN | RMS | DELTA/YR | DELTA/YR/YR | UNITS | DESCRIPTION |
| PM1THV1T | 331.85 | 8.13 | 7.987e+00 | -7.932e+02 | K | MUPS 1 THRUSTER VALVE 01 TEMP |
| PLINE02T | 320.68 | 9.61 | -1.517e+00 | 5.416e+02 | K | PROP LINE TEMP 02 |
| PLINE03T | 318.18 | 11.95 | 4.329e-01 | 6.675e+02 | K | PROP LINE TEMP 03 |
| PLINE04T | 304.38 | 11.62 | 8.152e+00 | 6.499e+02 | K | PROP LINE TEMP 04 |
)
)
)
)
Envelope Trending
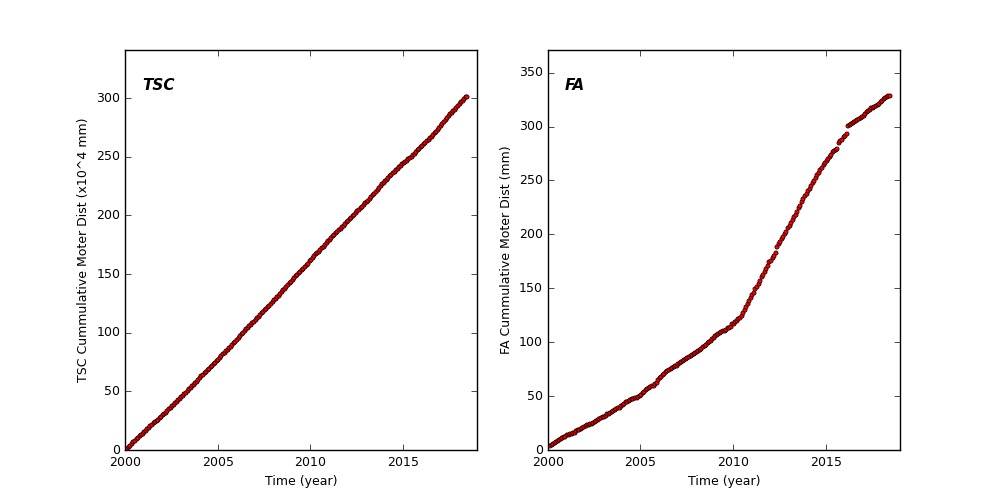
Spacecraft Motions
TSC and FA Cummulative Moter Distance
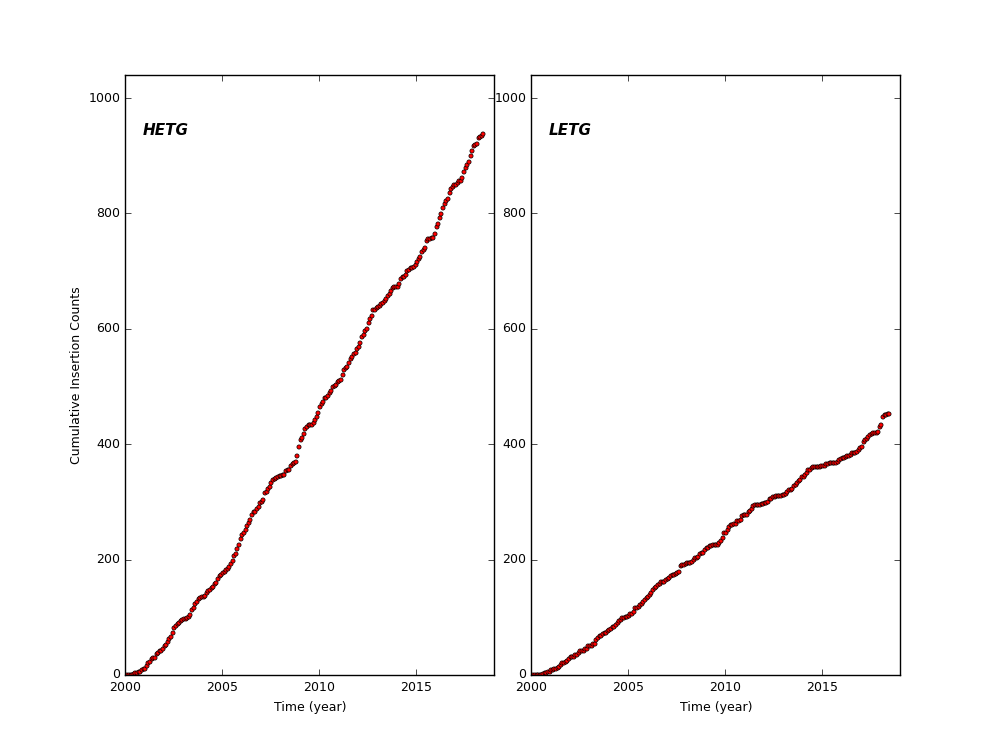
HETG and LETG Cummulative Insertion Counts
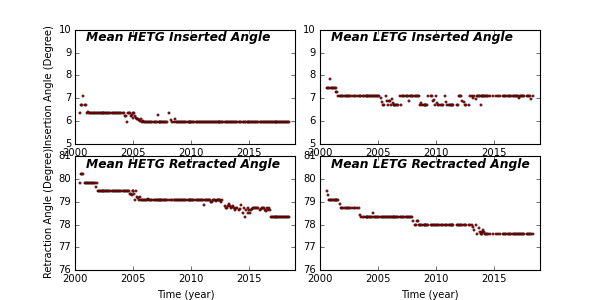
HETG/LETG Insertion/Retraction Angle
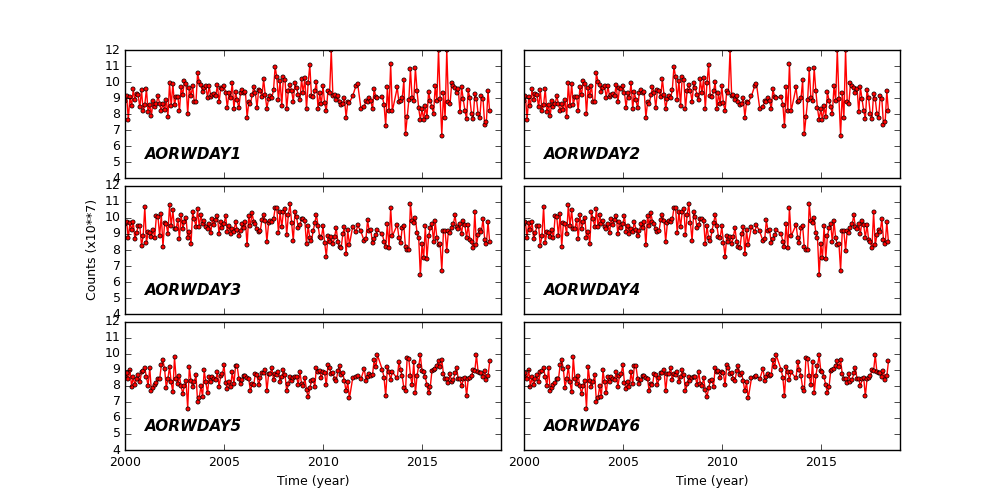
Reaction Wheel Rotations
Links to Past Monthly Reports
| Year | Month | |||||||||||
|---|---|---|---|---|---|---|---|---|---|---|---|---|
| 2018 | Jan | Feb | Mar | Apr | ||||||||
| 2017 | Jan | Feb | Mar | Apr | May | Jun | Jul | Aug | Sep | Oct | Nov | Dec |
| 2016 | Jan | Feb | Mar | Apr | May | Jun | Jul | Aug | Sep | Oct | Nov | Dec |
| 2015 | Jan | Feb | Mar | Apr | May | Jun | Jul | Aug | Sep | Oct | Nov | Dec |
| 2014 | Jan | Feb | Mar | Apr | May | Jun | Jul | Aug | Sep | Oct | Nov | Dec |
| 2013 | Jan | Feb | Mar | Apr | May | Jun | Jul | Aug | Sep | Oct | Nov | Dec |
| 2012 | Jan | Feb | Mar | Apr | May | Jun | Jul | Aug | Sep | Oct | Nov | Dec |
| 2011 | Jan | Feb | Mar | Apr | May | Jun | Jul | Aug | Sep | Oct | Nov | Dec |
| 2010 | Jan | Feb | Mar | Apr | May | Jun | Jul | Aug | Sep | Oct | Nov | Dec |
| 2009 | Jan | Feb | Mar | Apr | May | Jun | Jul | Aug | Sep | Oct | Nov | Dec |
| 2008 | Jan | Feb | Mar | Apr | May | Jun | Jul | Aug | Sep | Oct | Nov | Dec |
| 2007 | Jan | Feb | Mar | Apr | May | Jun | Jul | Aug | Sep | Oct | Nov | Dec |
| 2006 | Jan | Feb | Mar | Apr | May | Jun | Jul | Aug | Sep | Oct | Nov | Dec |
| 2005 | Jan | Feb | Mar | Apr | May | Jun | Jul | Aug | Sep | Oct | Nov | Dec |
| 2004 | Jan | Feb | Mar | Apr | May | Jun | Jul | Aug | Sep | Oct | Nov | Dec |
| 2003 | Jan | Feb | Mar | Apr | May | Jun | Jul | Aug | Sep | Oct | Nov | Dec |
| 2002 | Jan | Feb | Mar | Apr | May | Jun | Jul | Aug | Sep | Oct | Nov | Dec |
| 2001 | Jan | Feb | Mar | Apr | May | Jun | Jul | Aug | Sep | Oct | Nov | Dec |
| 2000 | Jan | Feb | Mar | Apr | May | Jun | Jul | Aug | Sep | Oct | Nov | Dec |
| 1999 | Jul | Aug | Sep | Oct | Nov | Dec | ||||||