ACIS
ACIS DOSE Registered-Photon-Map
The steps we took to compute the dose map are;
- Level 1 Event files for a specified month are obtained from archive.
- Image data including I2, I3, S2, S3 CCDs are extracted from all event files.
- All the extracted image data were merged to create a month long exposure map for the month.
- The exposure map is opened with ds9, and check a distribution of count rates against energy. From this, estimate the upper threshold value. Any events beyond this upper threshold are assumed erroneous events such as bad pixels.
- Using this upper threshold, the data is filtered, and create a cleaned exposure map for the month.
- The exposure map from each month from the Sep 1999 is added up to create a cumulative exposure map for each month.
- Using fimgstatistic, we compute count rate statistics for each CCDs.
- For observations with high data drop rates (e.g., Crab nebula, Cas A), we corrected the observations by adding events.
Please check more detail plots at Telemetered Photon Dose Trend page.
)
)
)
Statistics:
# IMAGE     NPIX     MEAN        RMS        MIN     MAX
ACIS_jun18 6004901       7.501         11.965           0.0     1955


I2 node 0  262654	5.760125	2.878961	0.0	 45.0
I2 node 1  262654	5.908819	3.116243	0.0	371.0
I2 node 2  262654	5.715356	2.800053	0.0	 47.0
I2 node 3  262654	5.741943	2.958212	0.0	236.0

I3 node 0  262654	6.299487	3.044022	0.0	 48.0
I3 node 1  262654	6.348990	3.746274	0.0	 77.0
I3 node 2  262654	5.844982	2.795219	0.0	 51.0
I3 node 3  262654	6.185933	2.980730	0.0	 77.0

S2 node 0  262654	8.616985	7.320419	0.0	605.0
S2 node 1  262654	9.253260	7.938210	0.0	612.0
S2 node 2  262654	10.455928	8.462463	0.0	1046.0
S2 node 3  262654	11.972916	10.771705	0.0	820.0

S3 node 0  262654	17.934406	16.409124	0.0	301.0
S3 node 1  262654	18.548522	13.328605	0.0	646.0
S3 node 2  262654	16.881330	11.264152	0.0	306.0
S3 node 3  262654	15.328618	9.382707	0.0	212.0
)
)
)
Statistics:
 IMAGE     NPIX      MEAN        RMS           MIN      MAX
ACIS_total   6004901       2213.067         2868.238           0.0   124512


I2 node 0  262654	1901.525887	376.001127	396.0	10716.0
I2 node 1  262654	2001.623369	523.613848	415.0	78870.0
I2 node 2  262654	2033.082433	431.442901	412.0	10569.0
I2 node 3  262654	2038.487478	527.576833	401.0	28474.0

I3 node 0  262654	2156.148716	533.576264	395.0	8652.0
I3 node 1  262654	2239.332769	1659.859672	412.0	54870.0
I3 node 2  262654	1969.350876	364.861567	394.0	11045.0
I3 node 3  262654	1958.521576	391.776263	346.0	31103.0

S2 node 0  262654	2576.024081	402.705833	1464.0	21751.0
S2 node 1  262654	2733.504622	609.928774	1602.0	15055.0
S2 node 2  262654	3026.752535	622.892616	2055.0	27676.0
S2 node 3  262654	2977.185068	477.272497	1808.0	54340.0

S3 node 0  262654	4583.153952	2084.607697	2015.0	26864.0
S3 node 1  262654	5801.122456	2232.021001	0.0	28685.0
S3 node 2  262654	4565.948326	1229.102223	1919.0	24923.0
S3 node 3  262654	3515.868557	649.010727	2162.0	24525.0
)
|
)
|
)
|
)
|
| Mar 2018 | Dec 2017 | Sep 2017 | Jun 2017 |
|---|
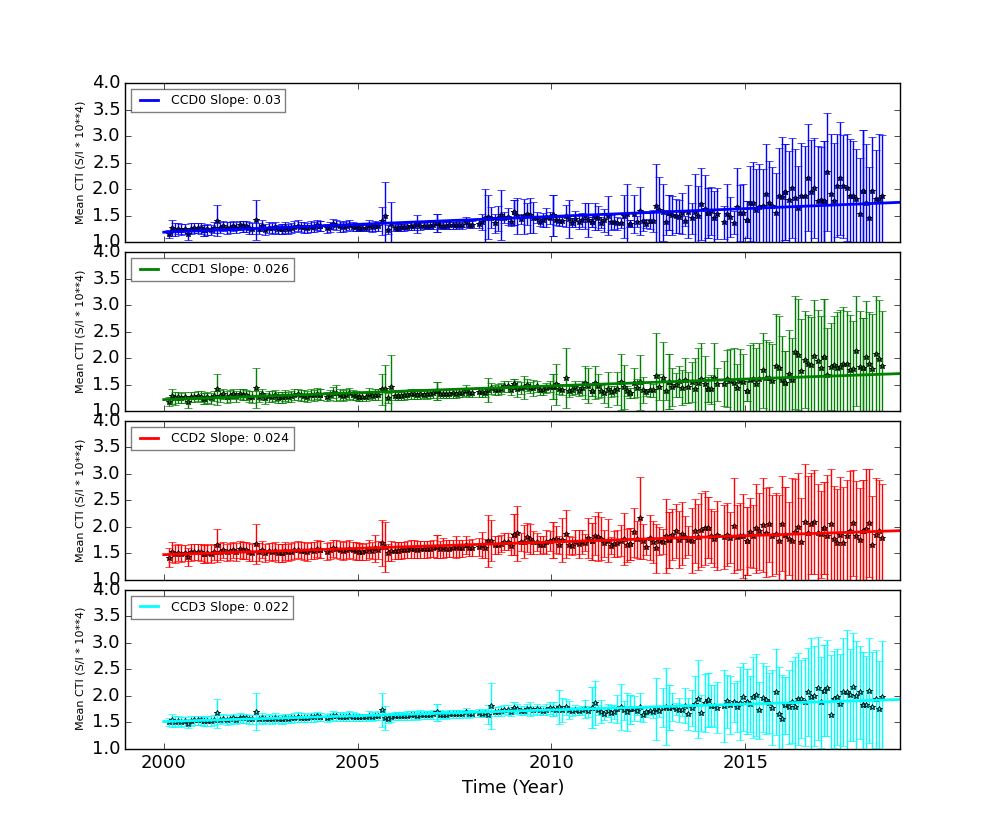
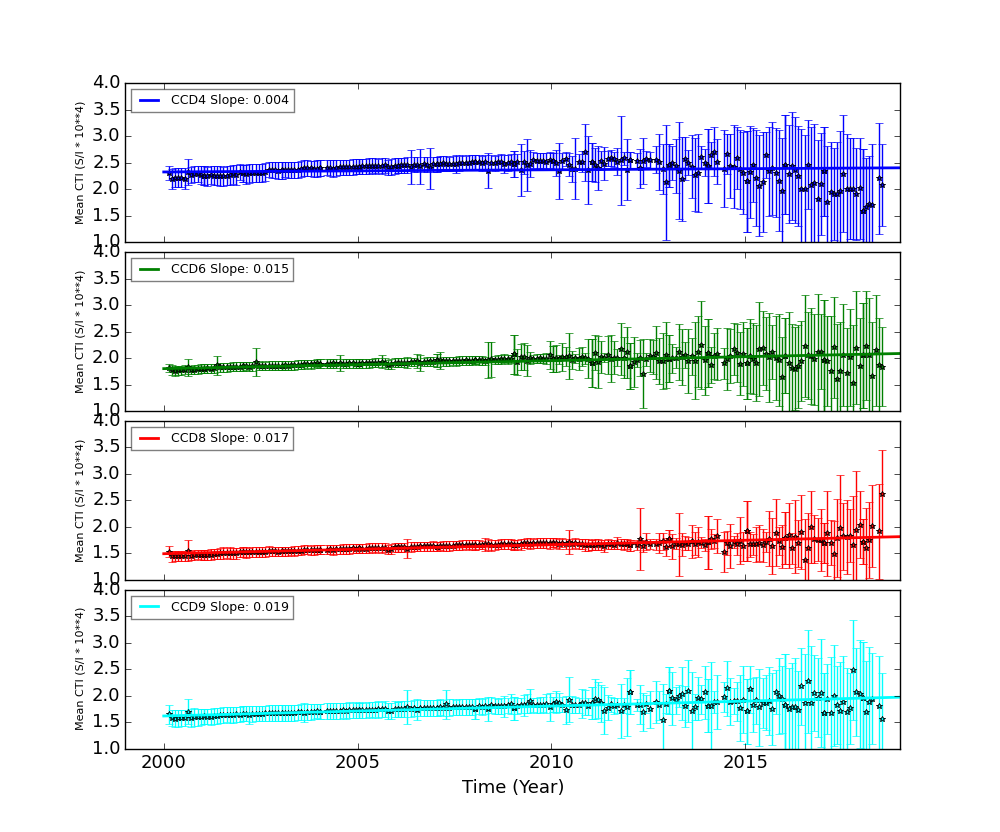
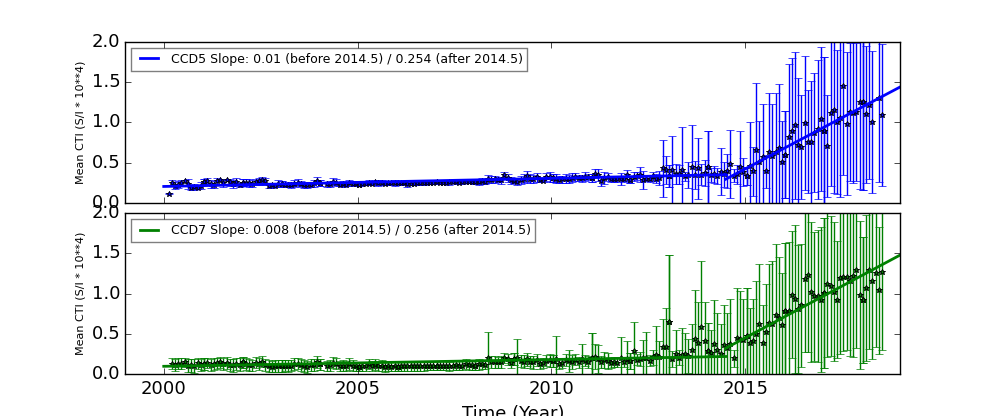
The Mean Detrended CTI
We report CTIs with a refined data definition. CTIs were computed for the temperature dependency corrected data. Please see CTI page for detailed explanation. CTI's are computed for Mn K alpha, and defined as slope/intercept x10^4 of row # vs ADU. Data file: here
Imaging CCDs
Spectral CCDs
Backside CCDs
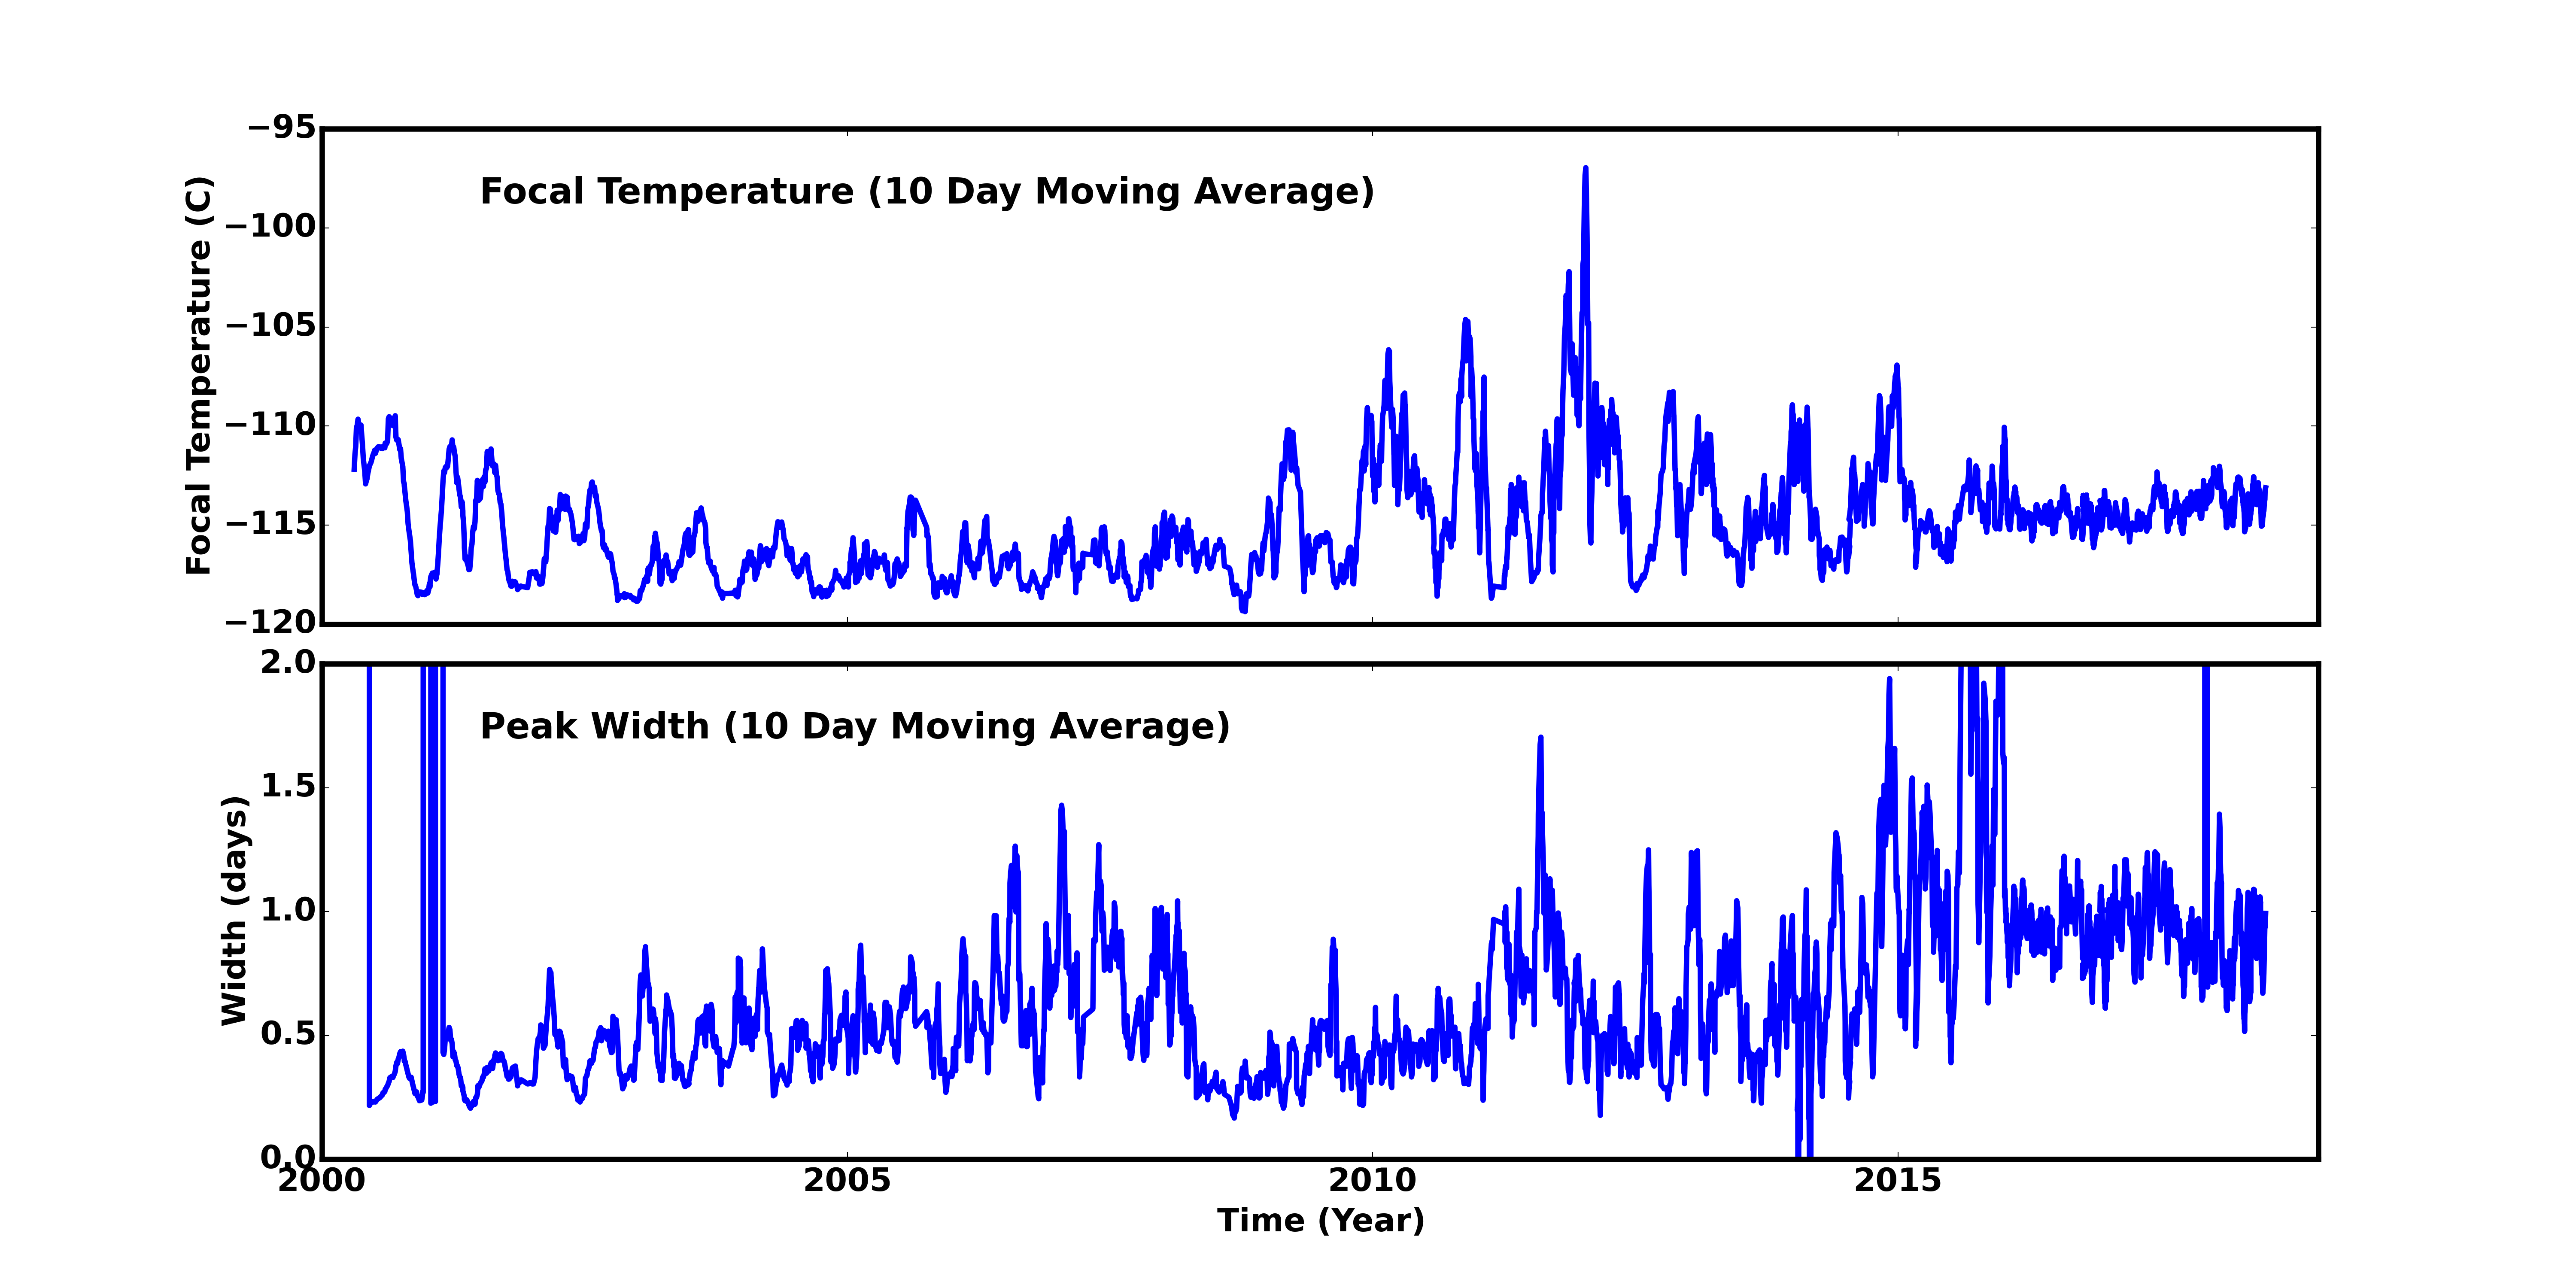
Focal Plane Temperature
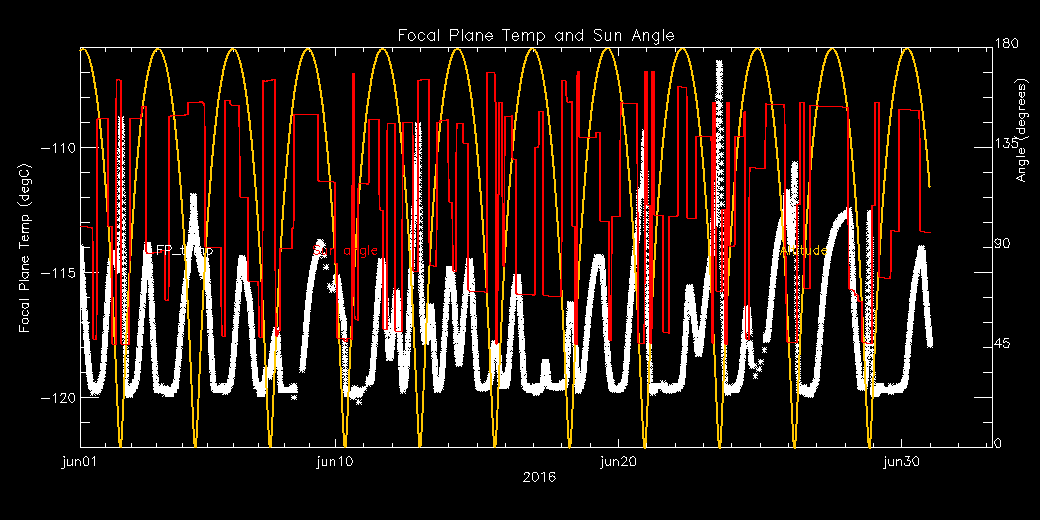
Jun 2018 Focal Temperature
| The Mean (max) FPT: | |
|---|---|
| -113.83 | +/- 2.64 C |
| Mean Width: | |
| 0.93 | +/- 0.4 days |
Averaged Focal Plane Temperature
We are using 10 period moving averages to show trends of peak temperatures and peak widths. Note, the gaps in the width plot are due to missing/corrupted data.
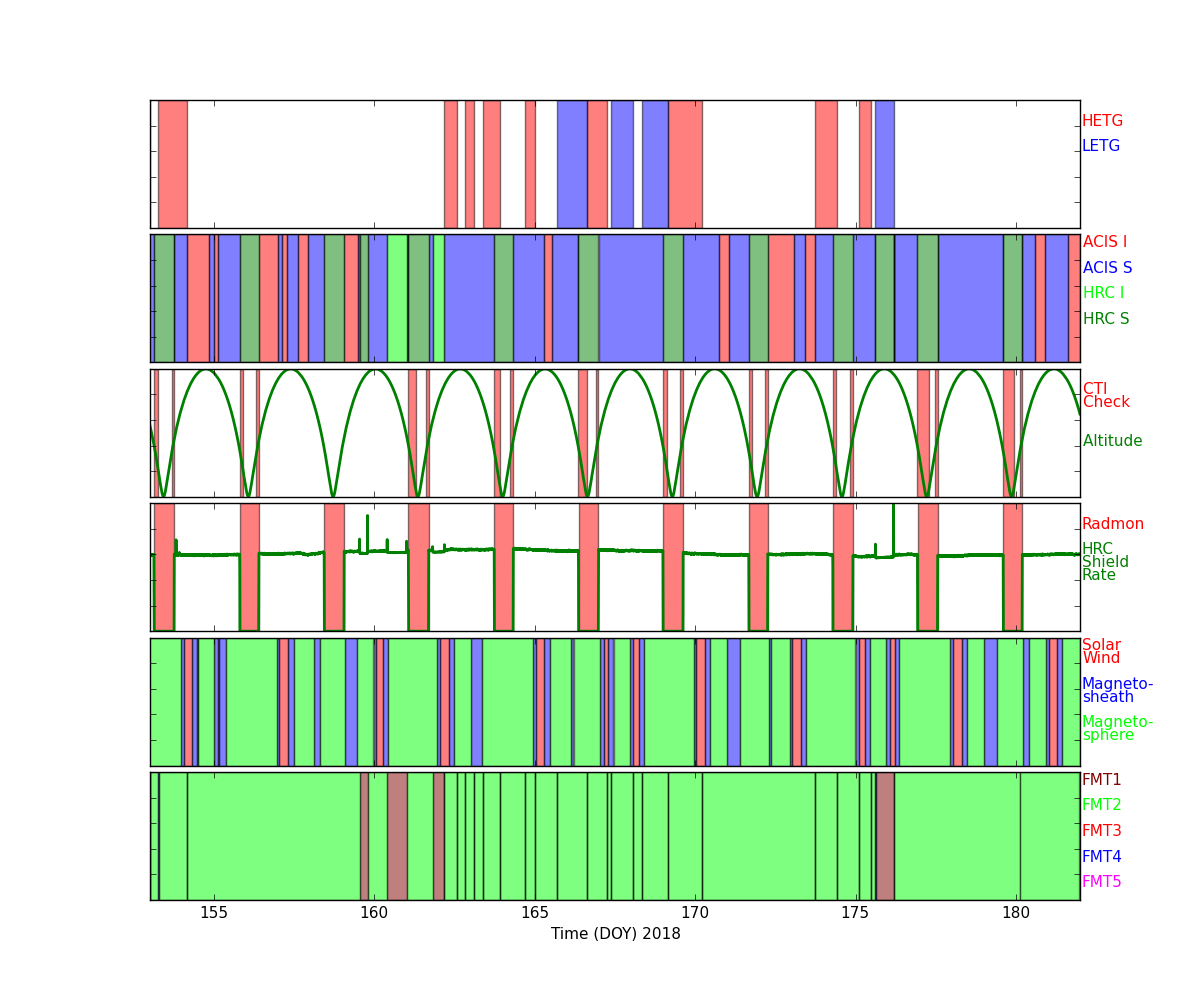
Focal Plane Temperature, Sun Angle and Altitude
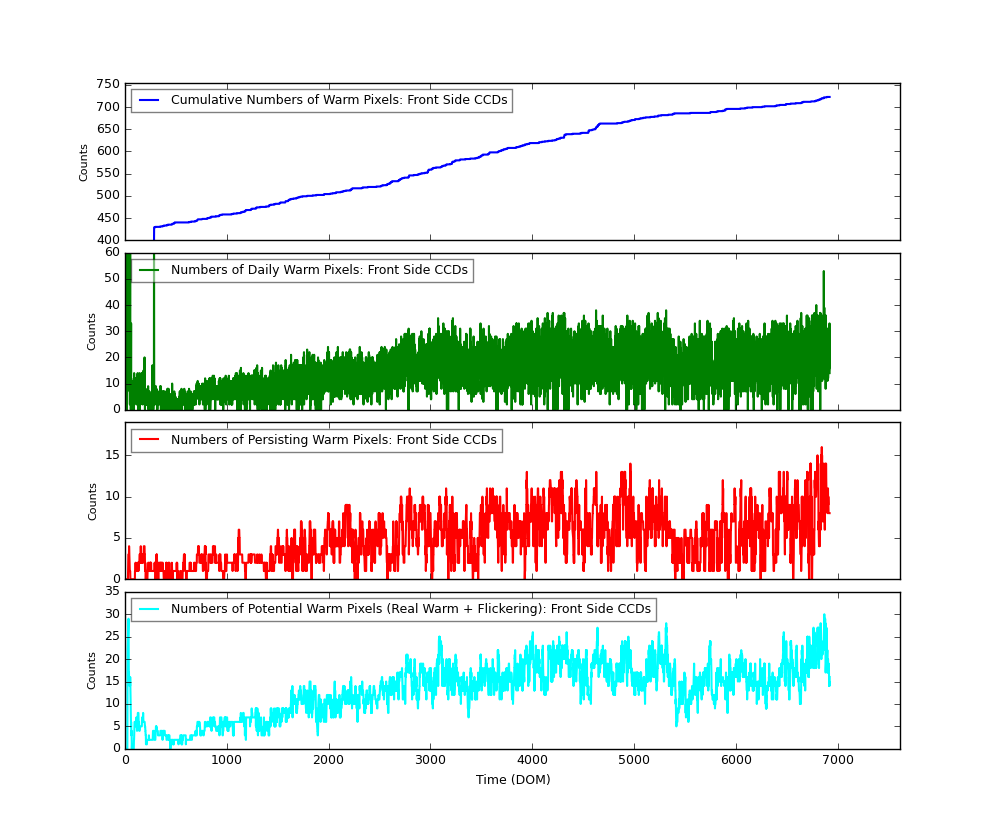
Bad Pixels
The plots below were generated with a new warm pixel finding script. Please see Acis Bad Pixel Page for details.
Front Side CCDs
Back Side CCD (CCD5)

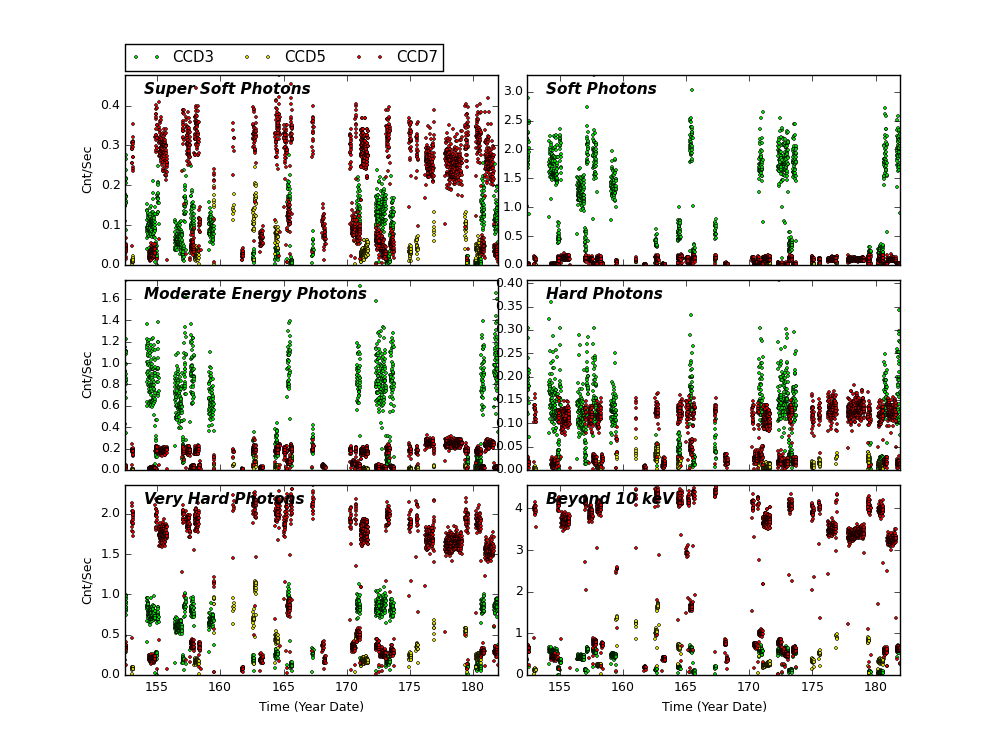
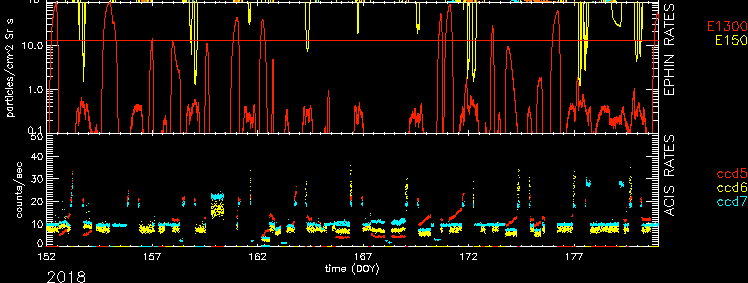
Science Instrument Background Rates
| Name | Low (keV) | High(KeV) | Description |
|---|---|---|---|
| SSoft | 0.00 | 0.50 | Super soft photons |
| Soft | 0.50 | 1.00 | Soft photons |
| Med | 1.00 | 3.00 | Moderate energy photons |
| Hard | 3.00 | 5.00 | Hard Photons |
| Harder | 5.00 | 10.00 | Very Hard photons |
| Hardest | 10.00 | Beyond 10 keV |
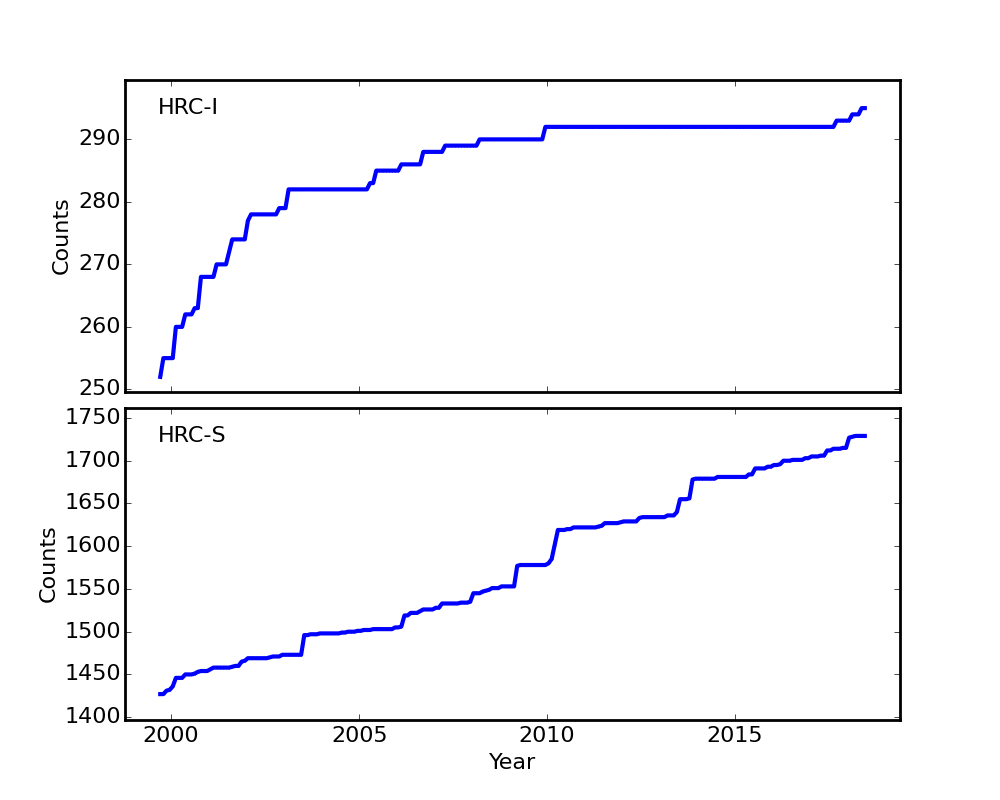
HRC
DOSE of Central 4K Pore-Pairs
Please refer to Maximum Dose Trends for more details.
)
|
|---|
IMAGE                NPIX      MEAN    STDDEV      MIN       MAX
HRCI_06_2018.fits  16777216	0.061 	0.248 	0.000 	5.000
)
IMAGE                       NPIX      MEAN    STDDEV      MIN       MAX
HRCI_08_1999_06_2018.fits  16777216	5.320 	5.377 	0.000 	295.000
)
|
|---|
IMAGE                NPIX      MEAN    STDDEV      MIN       MAX
HRCS_06_2018.fits  16777216	0.045 	0.217 	0.000 	5.000
)
IMAGE                       NPIX      MEAN    STDDEV      MIN       MAX
HRCS_08_1999_06_2018.fits  16777216	17.509 	32.161 	0.000 	1729.000
|
|
Max dose trend plots corrected for events that "pile-up"
in the center of the taps due to bad position information.
|
)
|
)
|
)
|
)
|
| Mar 2018 | Dec 2017 | Sep 2017 | Jun 2017 |
|---|
)
|
)
|
)
|
)
|
| Mar 2018 | Dec 2017 | Sep 2017 | Jun 2017 |
|---|
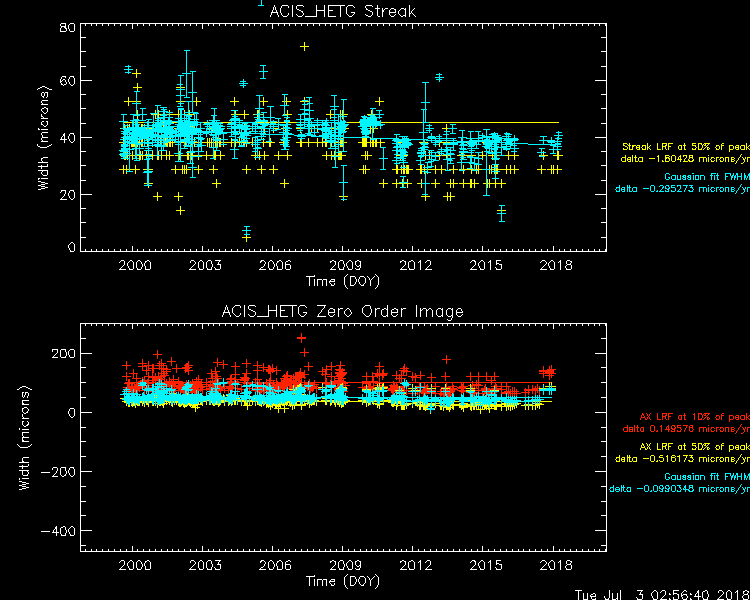
Gratings
Focus
We plot the width of the zero order streak of ACIS/HETG observations and the width of the zero order image for HRC/LETG observations of point sources. No significant defocusing trend is seen at this time. See Gratings Focus pages.
PCAD
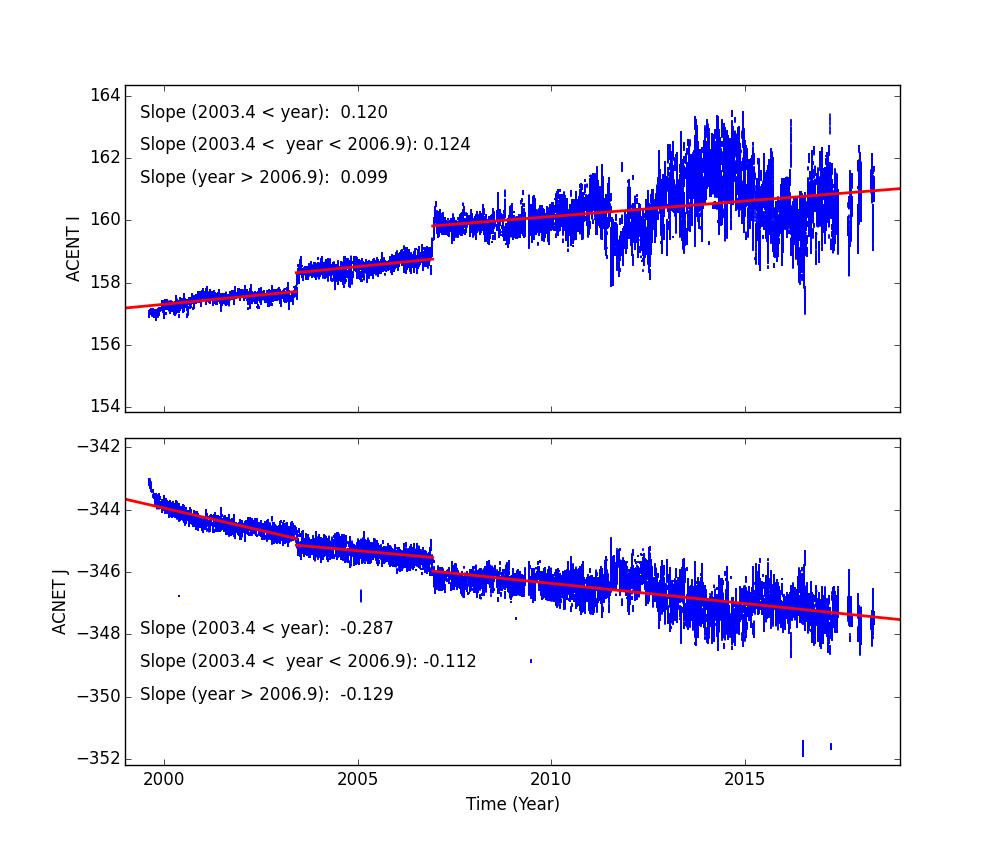
ACA Trending
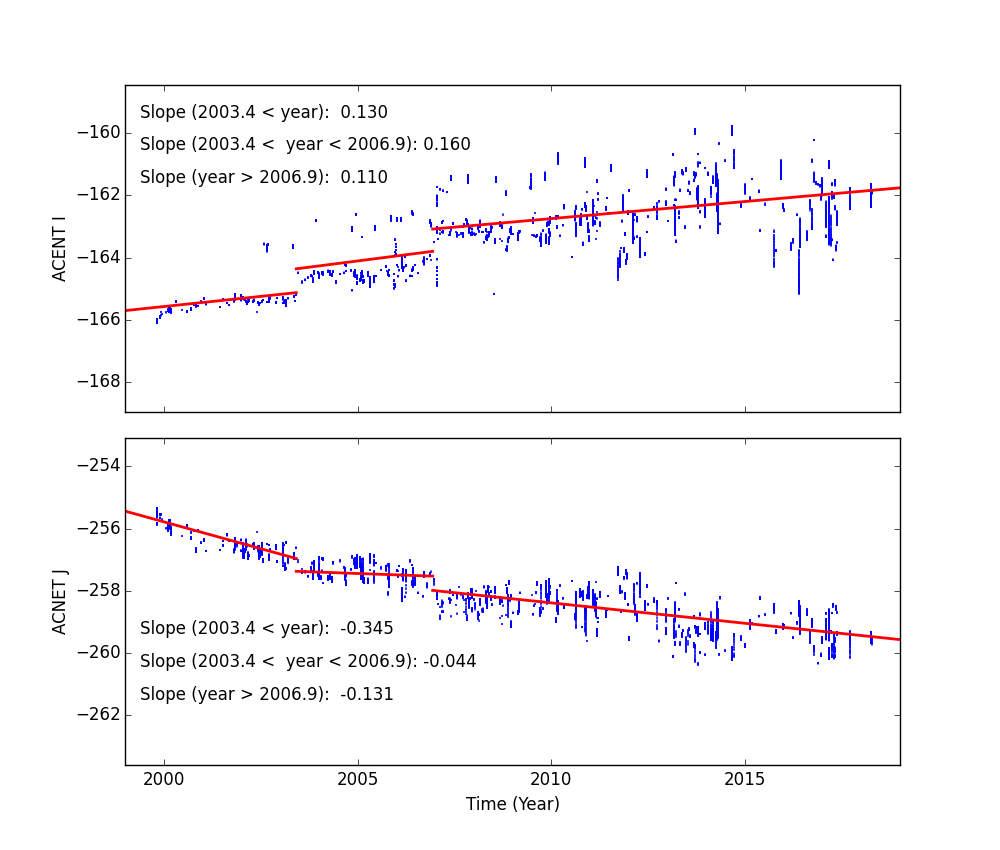
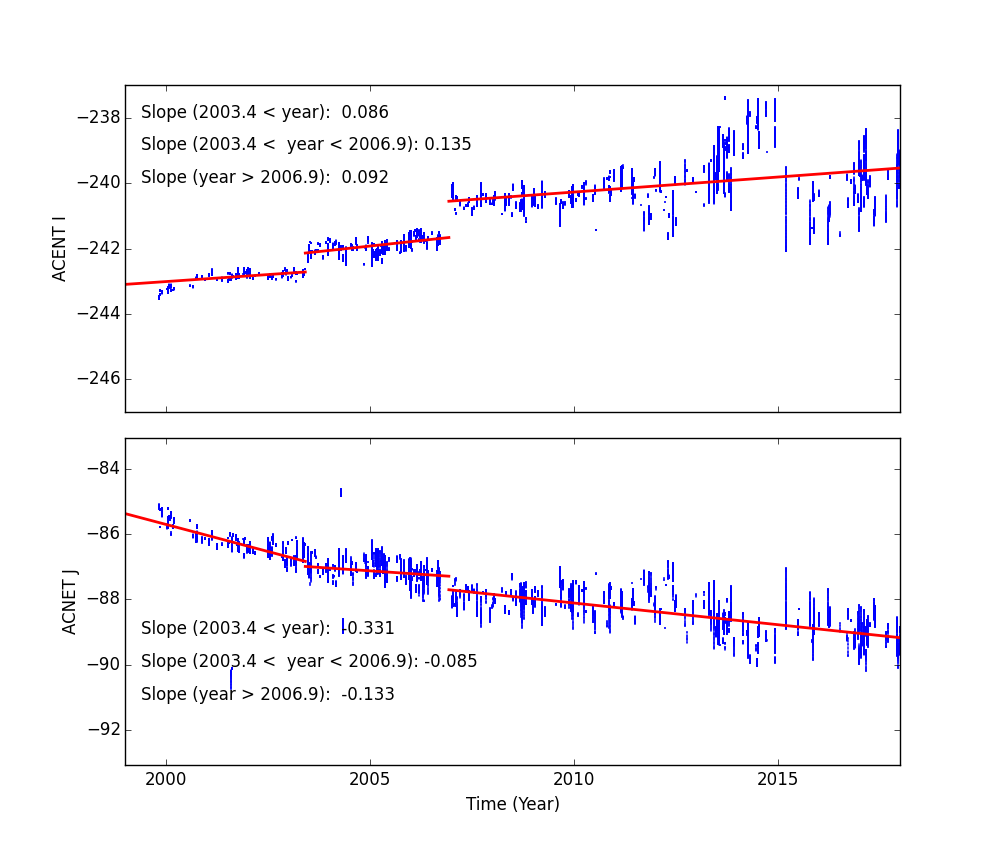
Fid Light Drift
Fid light positions on ACA drift with time. The drift trends of Fid light 2 with ACIS-I and ACIS-S configurations are shown below.
The top panel shows Fid light 2 drift in ACENT I (app. along with -Y axis), and the
bottom panel shows that in ACENT J (app. along with Z axis). The unit is a pixel, and
one pixel is approximately 0.5 arcsec. The slope listed at the top right corner is
the change in a position per year (arcsec/yr). The vertical line on DOM = 1411 (Jun 1, 2003)
indicates a transition date of use of IRU-1 to IRU-2.
See also Tom Aldcroft's updated page:
https://cxc.cfa.harvard.edu/mta/ASPECT/fid_drift
Fid 2 (ACIS-I)

Fid 2 (ACIS-S)
Fid 8 (HRC-I)
Fid 12 (HRC-S)
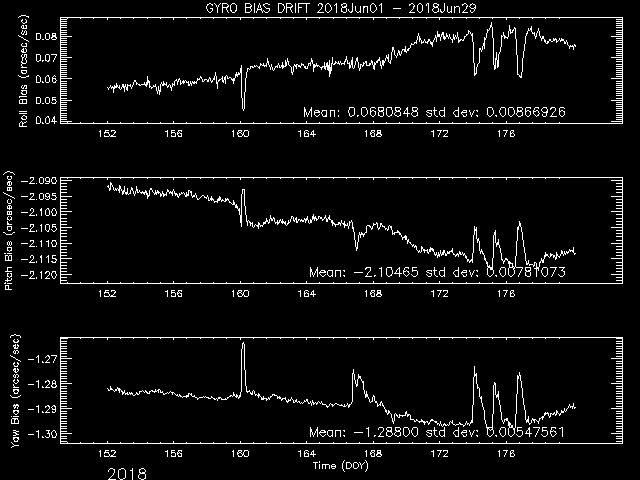
Gyro Bias Drift
Radiation History
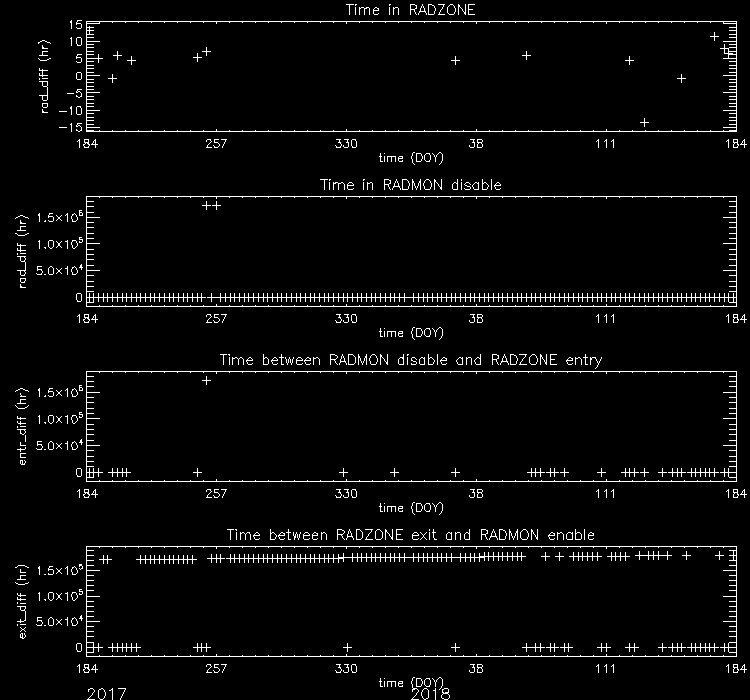
Radiation Zone Timing
Plotted below are radiation zone timing plots based on the following definitions of radiation zone:
- RADZONE - Ephin levels (in any of the E1300,P4GM,P41GM channels) are more than 1/3 of RADMON safing thresholds.
- RADMON - Radmon is disabled for radiation zone (as commanded based on OFLS model, for comparison with actual radiation levels).
- PERIGEE - Time of closest earth approach (for comparison)
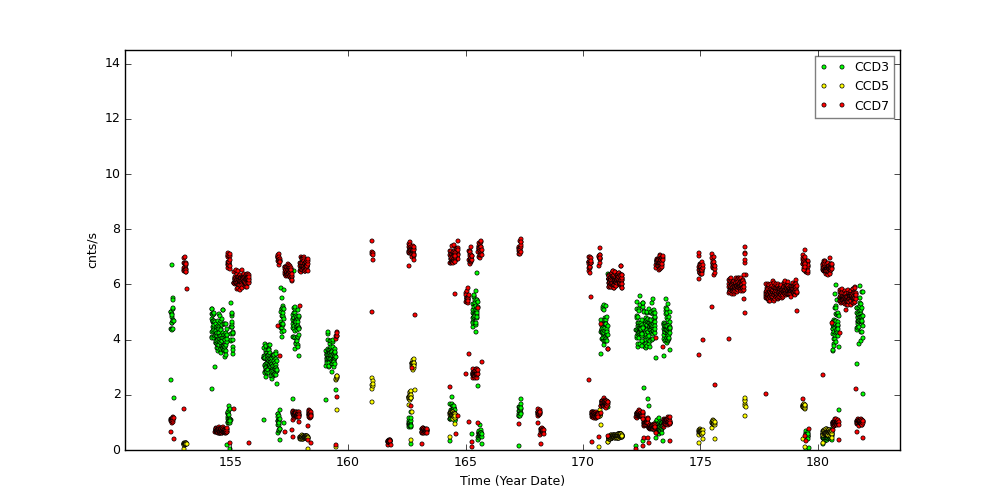
Radiation Count Rates of Jun 2018
Sun Spot History

Trending
Critical Trends
| ACIS Temperatures - Daily Maximums | ||||||
|---|---|---|---|---|---|---|
| MSID | MEAN | RMS | DELTA/YR | DELTA/YR/YR | UNITS | DESCRIPTION |
| 1PDEAAT | 306.37 | 7.45 | -9.498e-02 | 3.591e+00 | K | PSMC DEA PS A TEMP |
| 1PIN1AT | 327.33 | 18.97 | 1.776e+01 | -4.175e+01 | K | PSMC TEMP 1A |
)
)
| HRMA Computed Averages - Daily Maximums | ||||||
|---|---|---|---|---|---|---|
| MSID | MEAN | RMS | DELTA/YR | DELTA/YR/YR | UNITS | DESCRIPTION |
| OBAAVG | 294.62 | 1.51 | 1.122e+00 | -3.046e+00 | K | OBA/TFTE TEMP |
)
| EPHIN Temperatures - Daily Maximums | ||||||
|---|---|---|---|---|---|---|
| MSID | MEAN | RMS | DELTA/YR | DELTA/YR/YR | UNITS | DESCRIPTION |
| TEIO | 336.40 | 19.17 | 1.172e+00 | 5.869e+00 | K | EPHIN ELECTRONICS HOUSING TEMP |
| TEPHIN | 337.58 | 6.22 | 8.746e-01 | -9.271e+00 | K | EPHIN SENSOR HOUSING TEMP |
)
)
| S/C Main Temperatures - Daily Maximums | ||||||
|---|---|---|---|---|---|---|
| MSID | MEAN | RMS | DELTA/YR | DELTA/YR/YR | UNITS | DESCRIPTION |
| TCYLFMZM | 311.24 | 20.98 | 3.652e+00 | -9.603e+00 | K | CNT CYL TEMP:-Z SIDE UNDER LAE-1 |
| TCYLFMZP | 312.49 | 19.41 | 3.452e+00 | -8.570e+00 | K | CNT CYL TEMP:-Z SIDE UNDER LAE-2 |
)
)
| S/C Ancillary Temperatures - Daily Maximums | ||||||
|---|---|---|---|---|---|---|
| MSID | MEAN | RMS | DELTA/YR | DELTA/YR/YR | UNITS | DESCRIPTION |
| TFSSBKT1 | 343.40 | 20.61 | 1.975e+00 | -6.052e+00 | K | FSS BRACKET-1 TEMP (+Y) |
| TFSSBKT2 | 339.55 | 26.99 | 2.174e+00 | -9.317e+00 | K | FSS BRACKET-2 TEMP (+Y) |
| TSCTSF1 | 310.10 | 4.35 | 3.780e+00 | -1.477e+00 | K | SC-TS FITTING -1 TEMP |
| TSCTSF6 | 311.40 | 4.27 | 3.018e+00 | -4.530e+00 | K | SC-TS FITTING -6 TEMP |
)
)
)
)
| MUPS - Daily Maximums | ||||||
|---|---|---|---|---|---|---|
| MSID | MEAN | RMS | DELTA/YR | DELTA/YR/YR | UNITS | DESCRIPTION |
| PM1THV1T | 333.47 | 8.23 | -2.762e-01 | -1.892e+02 | K | MUPS 1 THRUSTER VALVE 01 TEMP |
| PLINE02T | 317.64 | 11.13 | 3.347e+00 | 5.826e+00 | K | PROP LINE TEMP 02 |
| PLINE03T | 316.64 | 13.64 | 3.278e+00 | 7.846e+00 | K | PROP LINE TEMP 03 |
| PLINE04T | 302.24 | 12.73 | 3.233e+00 | 7.055e+00 | K | PROP LINE TEMP 04 |
)
)
)
)
Quarterly Trends
- HRMA Struts
| Previous Quarter | ||||||
| MSID | MEAN | RMS | DELTA/YR | DELTA/YR/YR | UNITS | DESCRIPTION |
| 4RT584T | 297.84 | 0.82 | -1.161e+00 | -4.236e+00 | K | RT 584 - STRUT TEMP |
| 4RT585T | 298.11 | 0.82 | -1.887e-01 | 4.512e+00 | K | RT 585 - STRUT TEMP |
| 4RT586T | 294.65 | 0.69 | 3.519e-01 | 1.788e+01 | K | RT 586 - STRUT TEMP |
| 4RT587T | 289.51 | 0.49 | 1.937e-01 | 1.435e+01 | K | RT 587 - STRUT TEMP |
| 4RT597T | 303.38 | 2.12 | -1.266e+00 | -2.440e+00 | K | RT 597 - TFTE TEMP |
| 4RT598T | 302.66 | 2.10 | -4.222e-03 | 9.029e+00 | K | RT 598 - TFTE TEMP |
)
)
)
)
)
)
- OB Forward Bulkhead
| Previous Quarter | ||||||
| MSID | MEAN | RMS | DELTA/YR | DELTA/YR/YR | UNITS | DESCRIPTION |
| 4RT705T | 289.22 | 1.02 | 2.098e-01 | 1.182e+01 | K | RT 705 - OB BULKHEAD TEMP |
| 4RT706T | 287.79 | 1.05 | 2.174e-01 | 1.294e+01 | K | RT 706 - OB BULKHEAD TEMP |
| 4RT707T | 290.42 | 1.06 | 3.066e-01 | 1.247e+01 | K | RT 707 - OB BULKHEAD TEMP |
| 4RT708T | 295.08 | 1.17 | 4.534e-01 | 1.318e+01 | K | RT 708 - OB BULKHEAD TEMP |
| 4RT709T | 296.34 | 1.25 | 2.970e-01 | 1.222e+01 | K | RT 709 - OB BULKHEAD TEMP |
| 4RT710T | 297.75 | 1.35 | 2.679e-01 | 6.760e+00 | K | RT 710 - OB BULKHEAD TEMP |
)
)
)
)
)
)
- HRMA Thermal
| Previous Quarter | ||||||
| MSID | MEAN | RMS | DELTA/YR | DELTA/YR/YR | UNITS | DESCRIPTION |
| 4RT568T | 295.72 | 1.14 | -2.092e-01 | 7.846e+00 | K | RT 568 - HRMA TEMP |
| 4RT569T | 295.00 | 0.23 | 2.168e-01 | 8.470e+00 | K | RT 569 - HRMA TEMP |
| 4RT570T | 294.78 | 0.13 | 6.776e-02 | 1.228e+01 | K | RT 570 - HRMA TEMP |
| 4RT575T | 299.75 | 1.50 | -4.133e-01 | -8.742e-01 | K | RT 575 - OB CONE TEMP |
| 4RT576T | 291.60 | 1.13 | 2.814e-01 | 8.456e+00 | K | RT 576 - OB CONE TEMP |
| 4RT578T | 298.10 | 2.37 | 2.175e+00 | 8.649e+00 | K | RT 578 - OB CONE TEMP |
)
)
)
)
)
)
Envelope Trending
- oobthr45
- oobthr46
- oobthr51
- oobthr52
- oobthr56
- oobthr59
- pftank2t
- pftankip
- pmtank1t
- pmtank3t
- scstrutrnge
- tape1pst
- tatecdrt
- tcylaft1
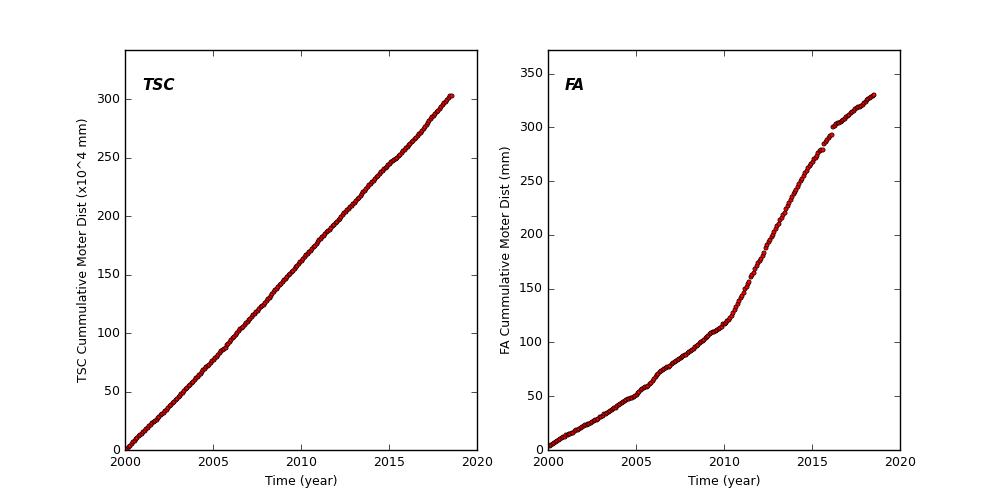
Spacecraft Motions
TSC and FA Cummulative Moter Distance
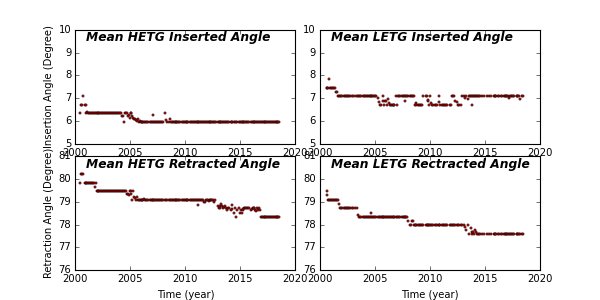
HETG and LETG Cummulative Insertion Counts

HETG/LETG Insertion/Retraction Angle
Reaction Wheel Rotations

Links to Past Monthly Reports
| Year | Month | |||||||||||
|---|---|---|---|---|---|---|---|---|---|---|---|---|
| 2018 | Jan | Feb | Mar | Apr | May | |||||||
| 2017 | Jan | Feb | Mar | Apr | May | Jun | Jul | Aug | Sep | Oct | Nov | Dec |
| 2016 | Jan | Feb | Mar | Apr | May | Jun | Jul | Aug | Sep | Oct | Nov | Dec |
| 2015 | Jan | Feb | Mar | Apr | May | Jun | Jul | Aug | Sep | Oct | Nov | Dec |
| 2014 | Jan | Feb | Mar | Apr | May | Jun | Jul | Aug | Sep | Oct | Nov | Dec |
| 2013 | Jan | Feb | Mar | Apr | May | Jun | Jul | Aug | Sep | Oct | Nov | Dec |
| 2012 | Jan | Feb | Mar | Apr | May | Jun | Jul | Aug | Sep | Oct | Nov | Dec |
| 2011 | Jan | Feb | Mar | Apr | May | Jun | Jul | Aug | Sep | Oct | Nov | Dec |
| 2010 | Jan | Feb | Mar | Apr | May | Jun | Jul | Aug | Sep | Oct | Nov | Dec |
| 2009 | Jan | Feb | Mar | Apr | May | Jun | Jul | Aug | Sep | Oct | Nov | Dec |
| 2008 | Jan | Feb | Mar | Apr | May | Jun | Jul | Aug | Sep | Oct | Nov | Dec |
| 2007 | Jan | Feb | Mar | Apr | May | Jun | Jul | Aug | Sep | Oct | Nov | Dec |
| 2006 | Jan | Feb | Mar | Apr | May | Jun | Jul | Aug | Sep | Oct | Nov | Dec |
| 2005 | Jan | Feb | Mar | Apr | May | Jun | Jul | Aug | Sep | Oct | Nov | Dec |
| 2004 | Jan | Feb | Mar | Apr | May | Jun | Jul | Aug | Sep | Oct | Nov | Dec |
| 2003 | Jan | Feb | Mar | Apr | May | Jun | Jul | Aug | Sep | Oct | Nov | Dec |
| 2002 | Jan | Feb | Mar | Apr | May | Jun | Jul | Aug | Sep | Oct | Nov | Dec |
| 2001 | Jan | Feb | Mar | Apr | May | Jun | Jul | Aug | Sep | Oct | Nov | Dec |
| 2000 | Jan | Feb | Mar | Apr | May | Jun | Jul | Aug | Sep | Oct | Nov | Dec |
| 1999 | Jul | Aug | Sep | Oct | Nov | Dec | ||||||