ACIS
ACIS DOSE Registered-Photon-Map
The steps we took to compute the dose map are;
- Level 1 Event files for a specified month are obtained from archive.
- Image data including I2, I3, S2, S3 CCDs are extracted from all event files.
- All the extracted image data were merged to create a month long exposure map for the month.
- The exposure map is opened with ds9, and check a distribution of count rates against energy. From this, estimate the upper threshold value. Any events beyond this upper threshold are assumed erroneous events such as bad pixels.
- Using this upper threshold, the data is filtered, and create a cleaned exposure map for the month.
- The exposure map from each month from the Sep 1999 is added up to create a cumulative exposure map for each month.
- Using fimgstatistic, we compute count rate statistics for each CCDs.
- For observations with high data drop rates (e.g., Crab nebula, Cas A), we corrected the observations by adding events.
Please check more detail plots at Telemetered Photon Dose Trend page.
)
)
)
Statistics:
# IMAGE     NPIX     MEAN        RMS        MIN     MAX
ACIS_aug18 6004901       8.396         12.137           0.0     5650


I2 node 0  262654	6.172578	3.014347	0.0	 77.0
I2 node 1  262654	6.439455	11.414002	0.0	4671.0
I2 node 2  262654	6.353084	4.755695	0.0	1896.0
I2 node 3  262654	6.365887	3.231949	0.0	448.0

I3 node 0  262654	8.377015	3.989239	0.0	131.0
I3 node 1  262654	8.256964	6.450420	0.0	1813.0
I3 node 2  262654	7.789655	3.346439	0.0	 77.0
I3 node 3  262654	7.848425	8.061525	0.0	3735.0

S2 node 0  262654	11.467341	4.228506	0.0	216.0
S2 node 1  262654	9.338165	4.046186	0.0	 65.0
S2 node 2  262654	10.455928	8.462463	0.0	1046.0
S2 node 3  262654	11.972916	10.771705	0.0	820.0

S3 node 0  262654	17.934406	16.409124	0.0	301.0
S3 node 1  262654	18.548522	13.328605	0.0	646.0
S3 node 2  262654	16.881330	11.264152	0.0	306.0
S3 node 3  262654	15.328618	9.382707	0.0	212.0
)
)
)
Statistics:
 IMAGE     NPIX      MEAN        RMS           MIN      MAX
ACIS_total   6004901       2229.329         2887.164           0.0   125360


I2 node 0  262654	1916.683219	379.485735	400.0	10847.0
I2 node 1  262654	2017.570656	530.053496	418.0	83071.0
I2 node 2  262654	2048.767762	434.804132	415.0	10733.0
I2 node 3  262654	2054.100204	531.489072	404.0	28484.0

I3 node 0  262654	2174.851198	538.190561	399.0	8694.0
I3 node 1  262654	2258.124507	1667.181182	415.0	54951.0
I3 node 2  262654	1986.929220	368.507091	399.0	11180.0
I3 node 3  262654	1976.313998	395.680808	351.0	31317.0

S2 node 0  262654	2596.520129	406.286026	1475.0	21777.0
S2 node 1  262654	2754.655637	615.009322	1617.0	15156.0
S2 node 2  262654	3036.359953	624.503499	2058.0	27682.0
S2 node 3  262654	2977.185068	477.272497	1808.0	54340.0

S3 node 0  262654	4583.153952	2084.607697	2015.0	26864.0
S3 node 1  262654	5801.122456	2232.021001	0.0	28685.0
S3 node 2  262654	4565.948326	1229.102223	1919.0	24923.0
S3 node 3  262654	3515.868557	649.010727	2162.0	24525.0
)
|
)
|
)
|
)
|
| May 2018 | Feb 2018 | Nov 2017 | Aug 2017 |
|---|
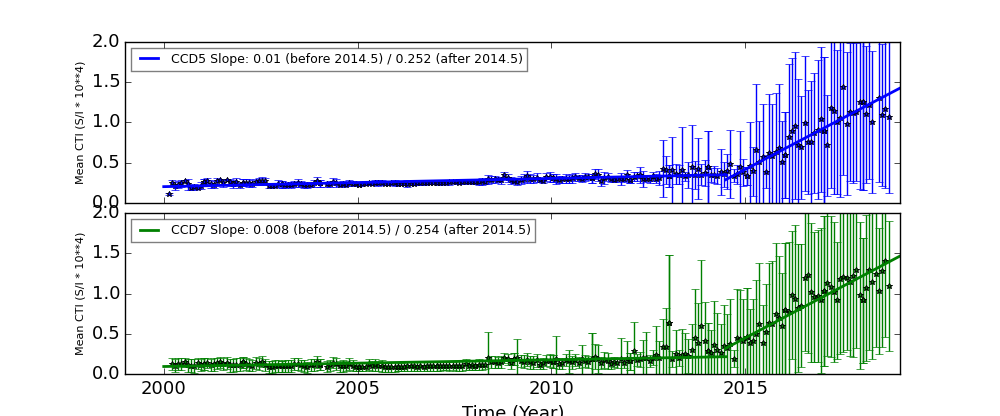
The Mean Detrended CTI
We report CTIs with a refined data definition. CTIs were computed for the temperature dependency corrected data. Please see CTI page for detailed explanation. CTI's are computed for Mn K alpha, and defined as slope/intercept x10^4 of row # vs ADU. Data file: here
Imaging CCDs
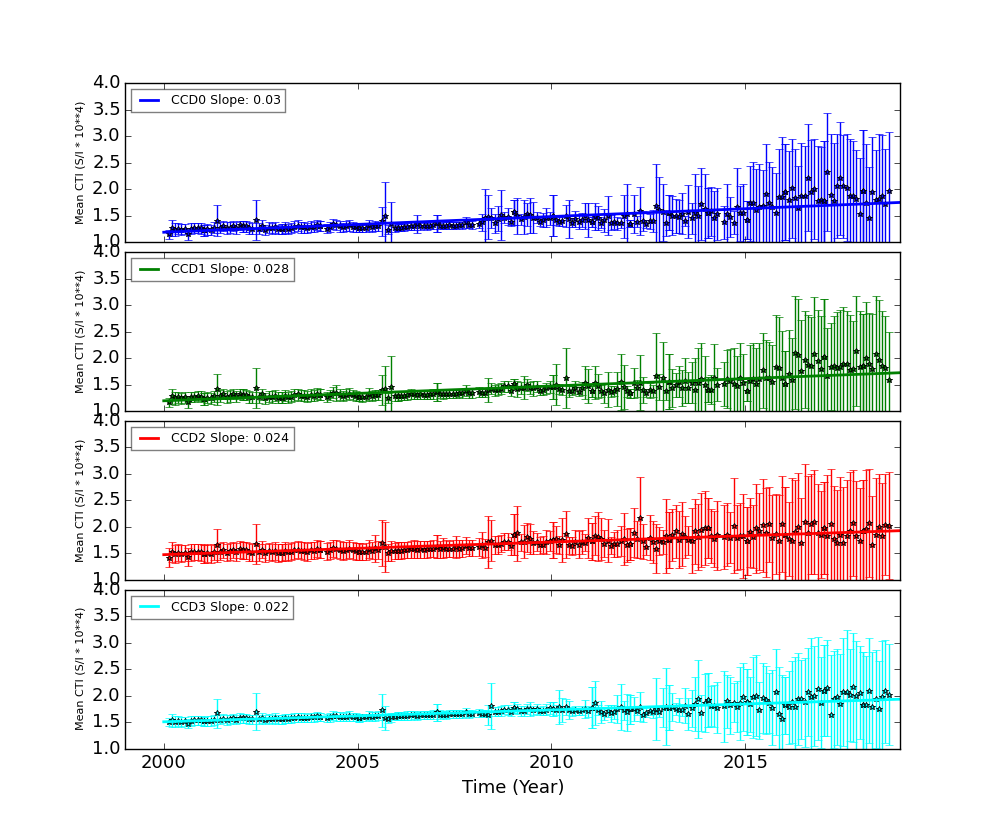
Spectral CCDs
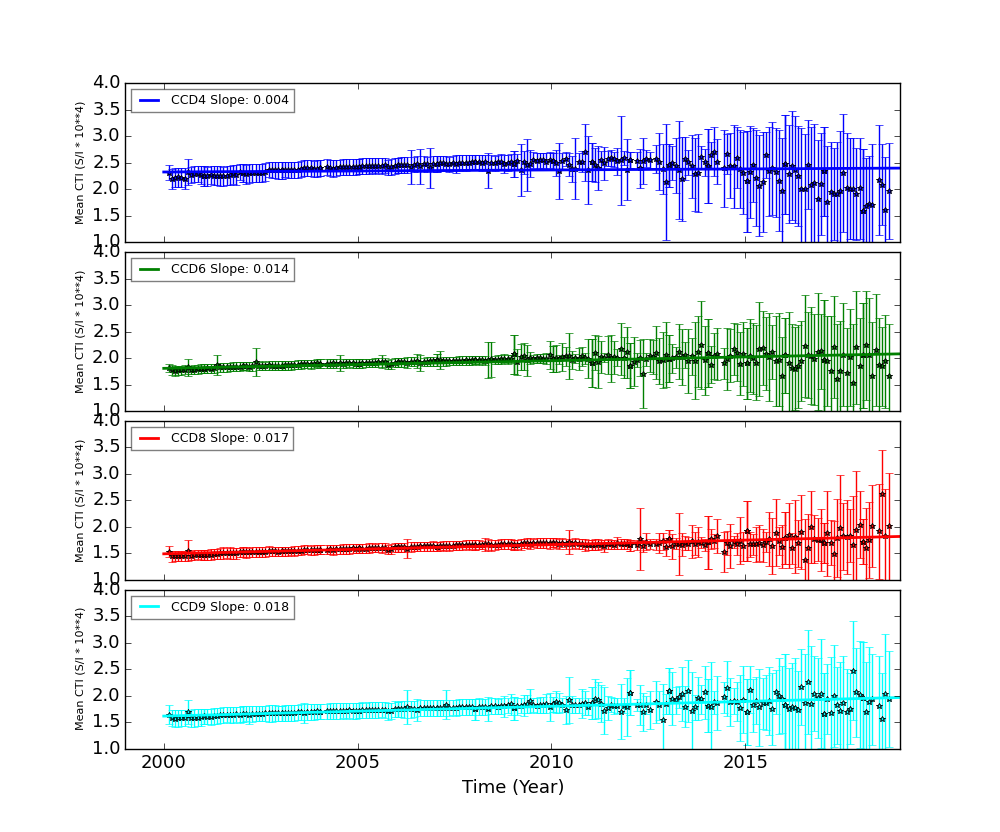
Backside CCDs
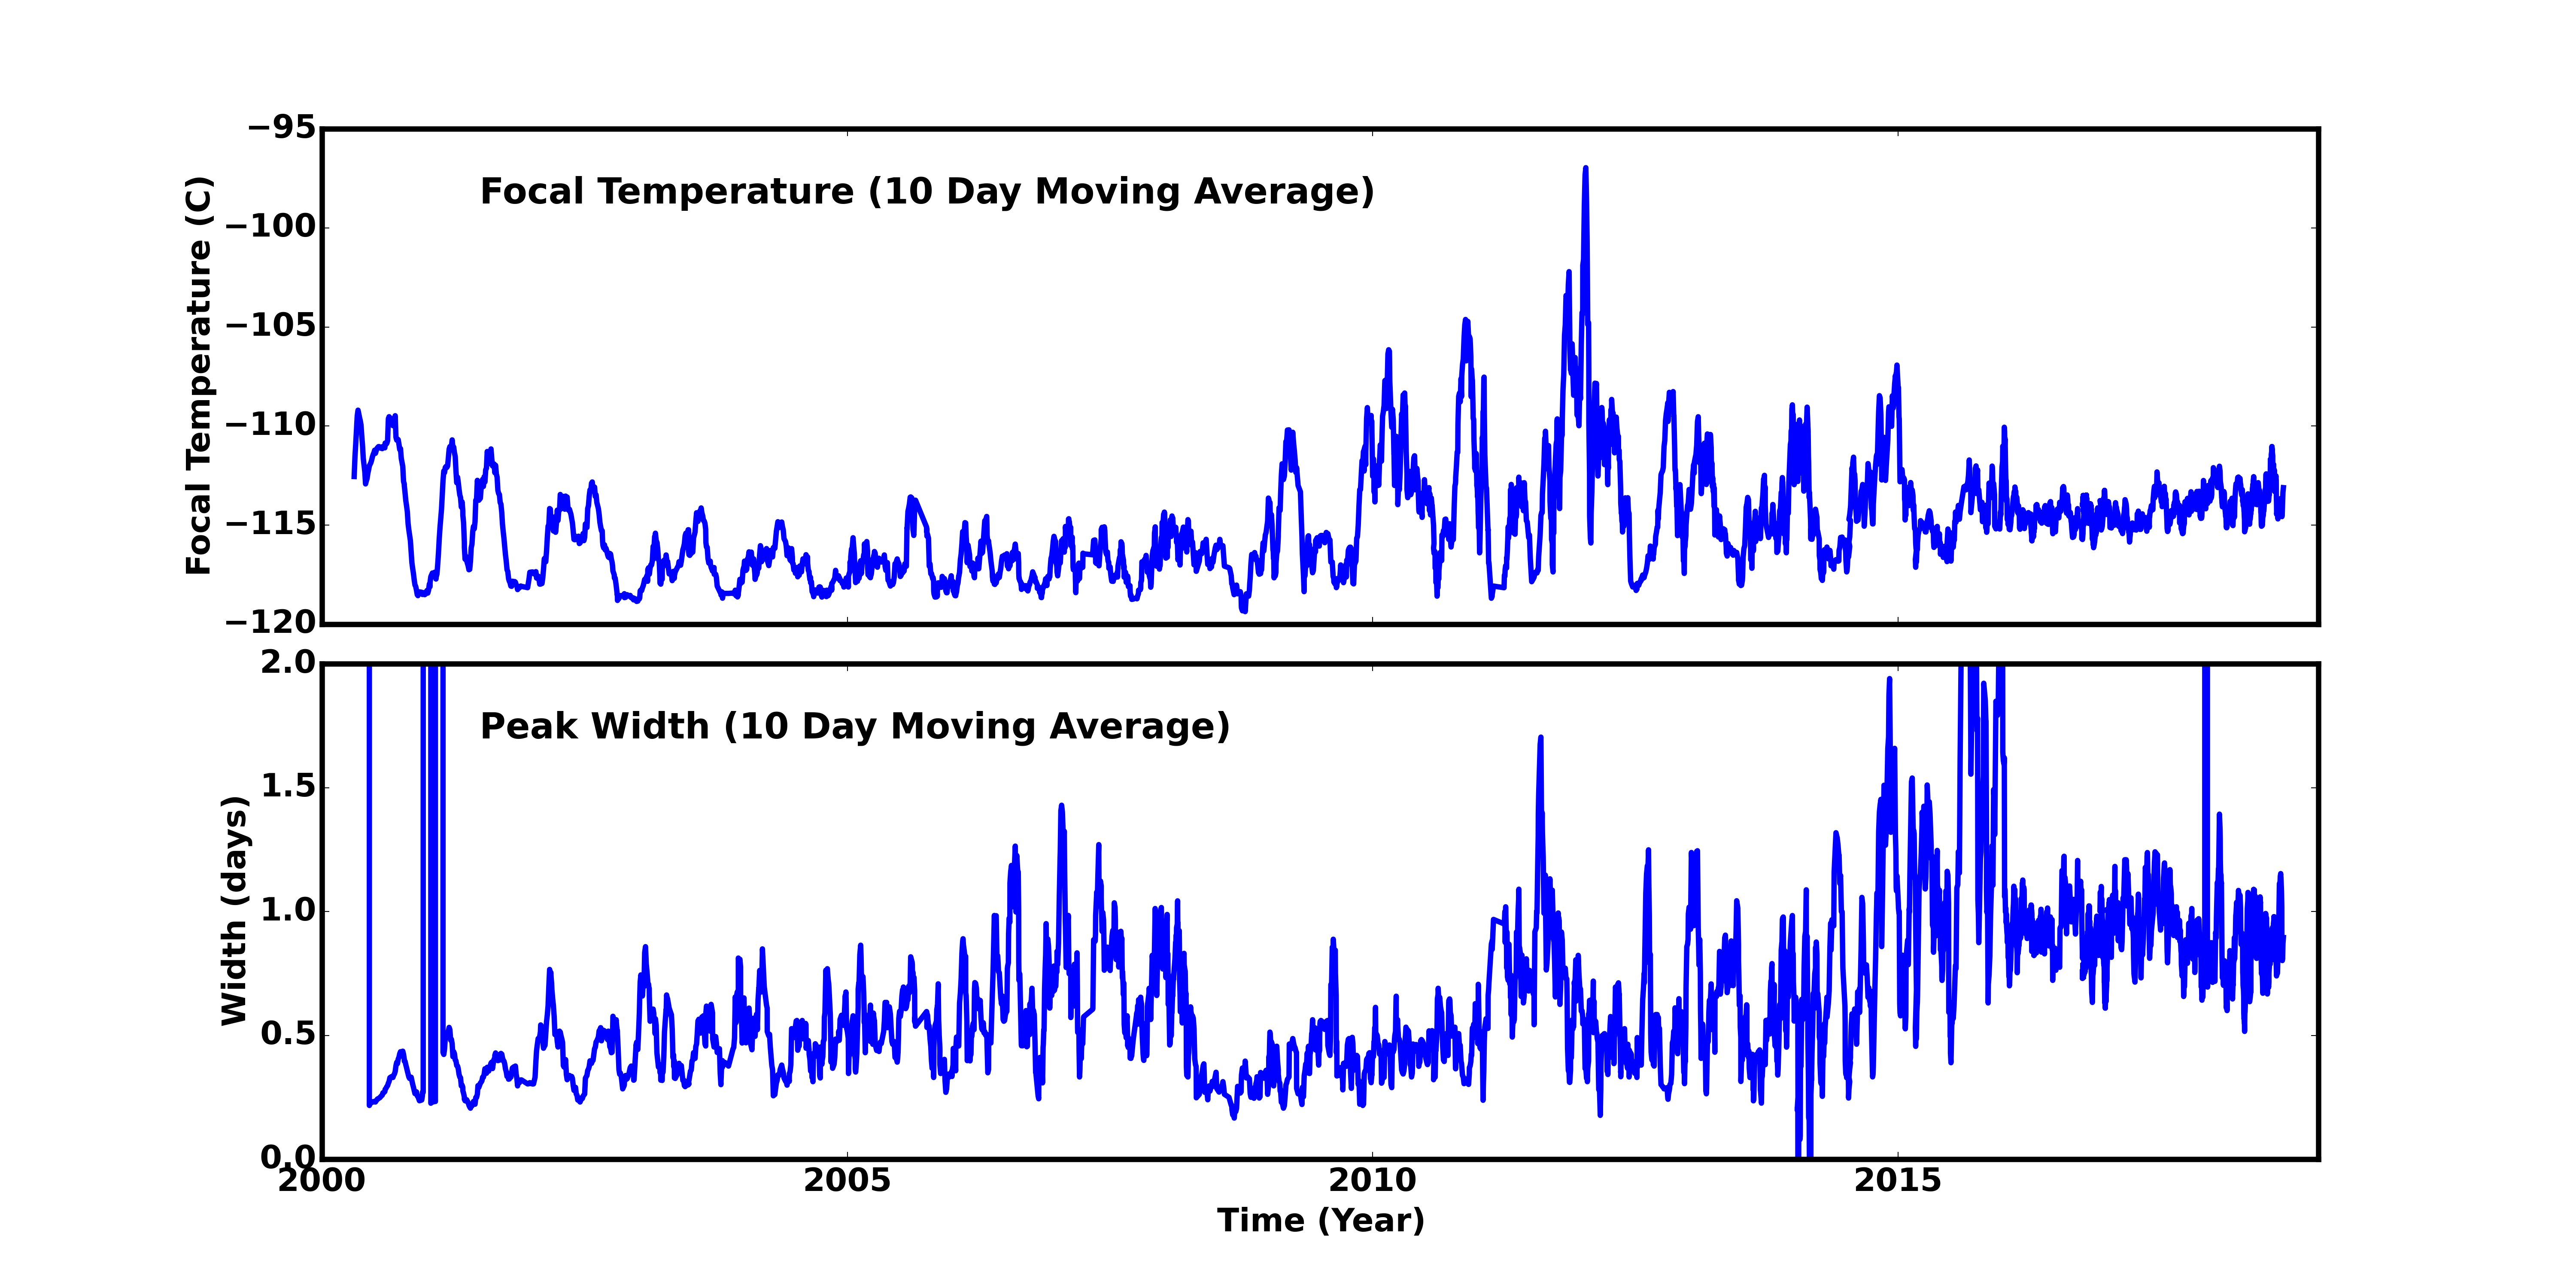
Focal Plane Temperature
Aug 2018 Focal Temperature
| The Mean (max) FPT: | |
|---|---|
| -113.72 | +/- 2.35 C |
| Mean Width: | |
| 0.93 | +/- 0.4 days |
Averaged Focal Plane Temperature
We are using 10 period moving averages to show trends of peak temperatures and peak widths. Note, the gaps in the width plot are due to missing/corrupted data.
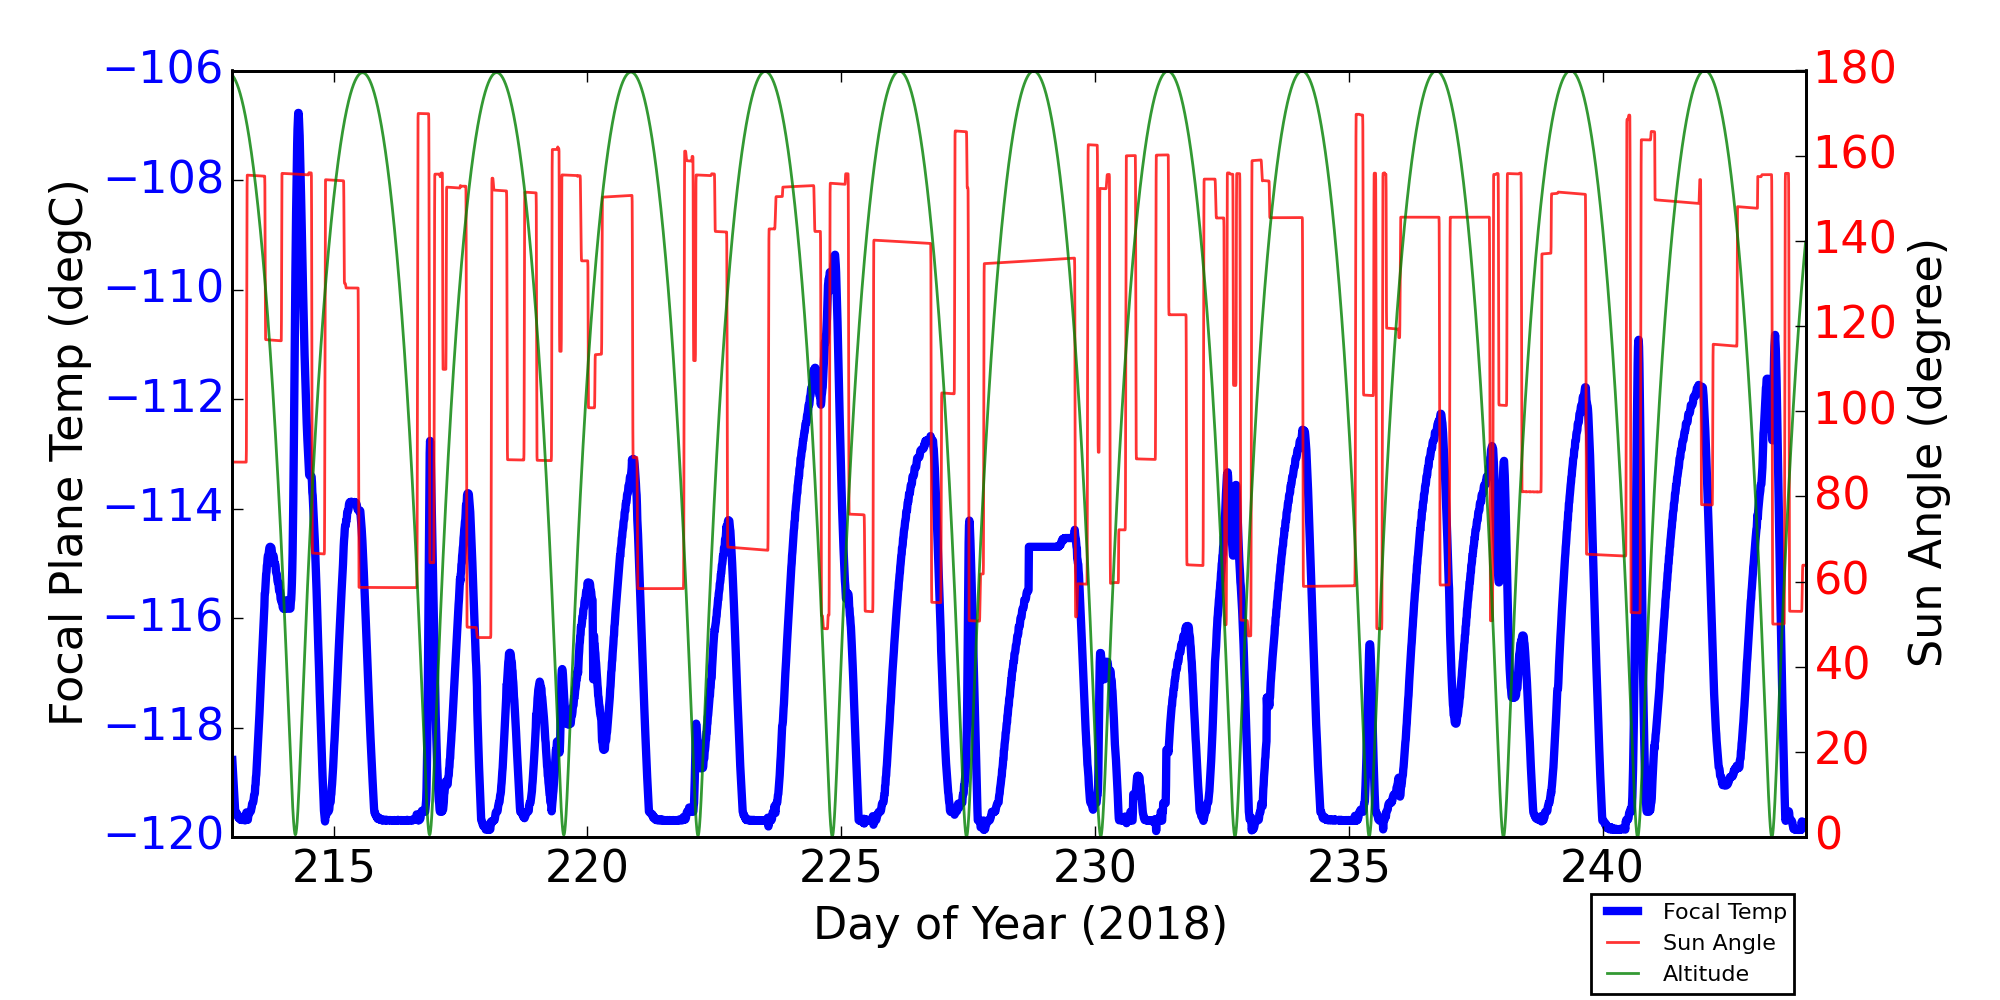
Focal Plane Temperature, Sun Angle and Altitude
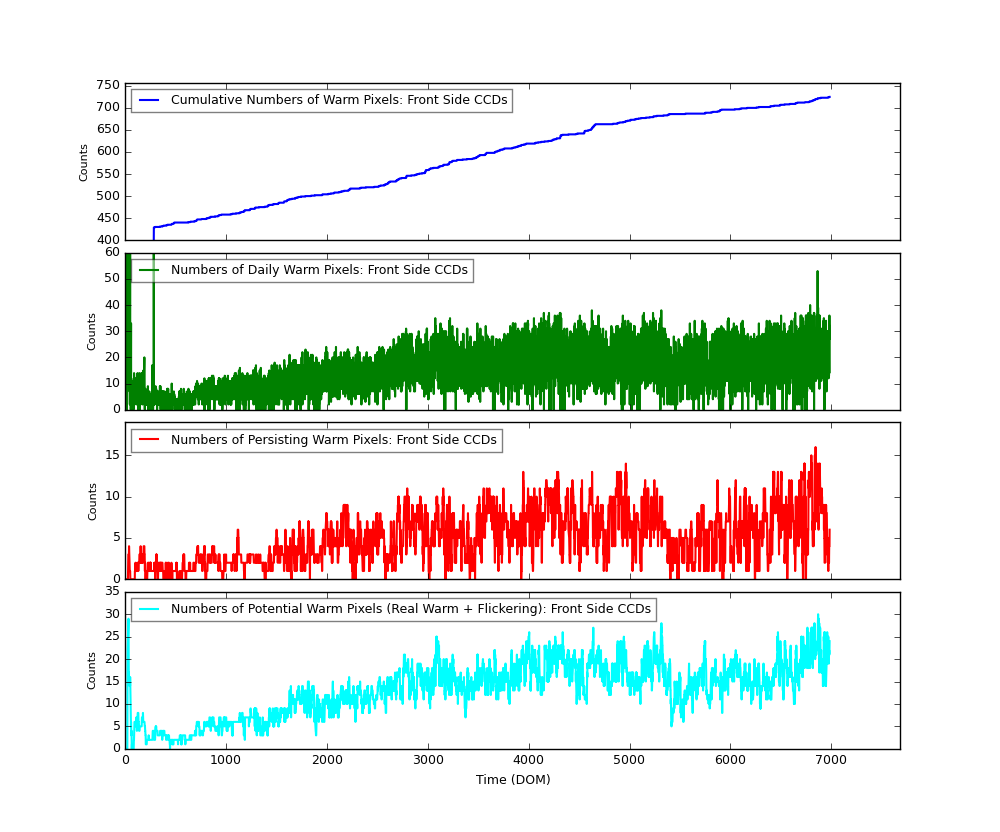
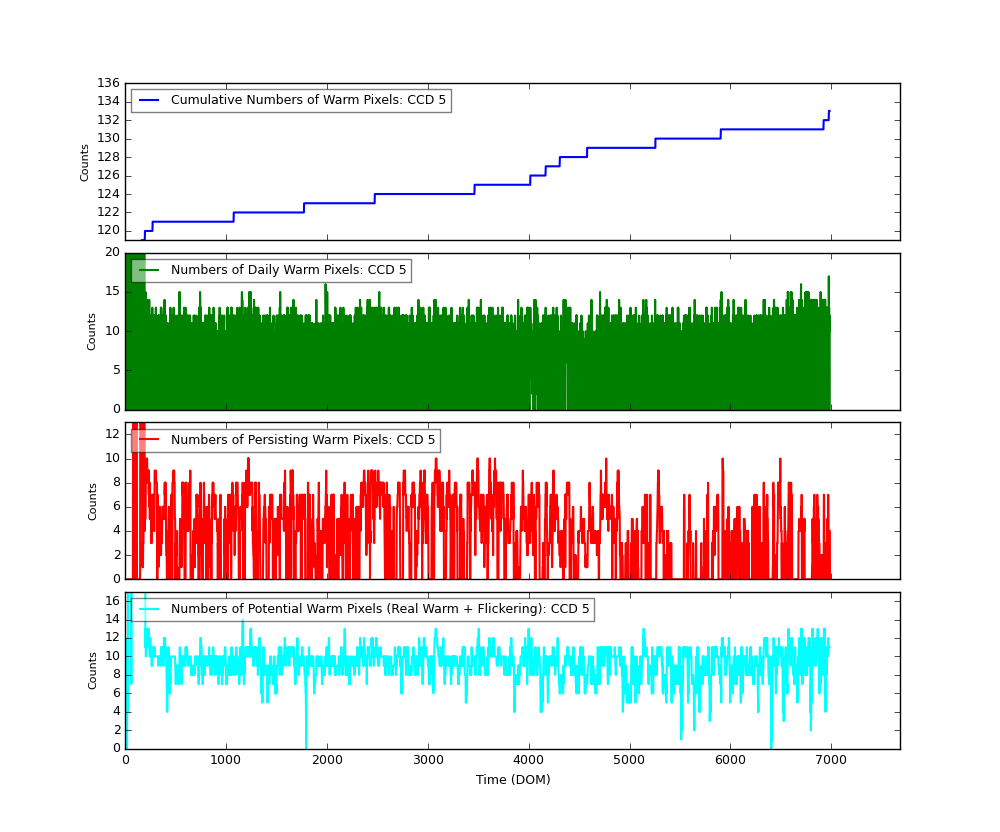
Bad Pixels
The plots below were generated with a new warm pixel finding script. Please see Acis Bad Pixel Page for details.
Front Side CCDs
Back Side CCD (CCD5)
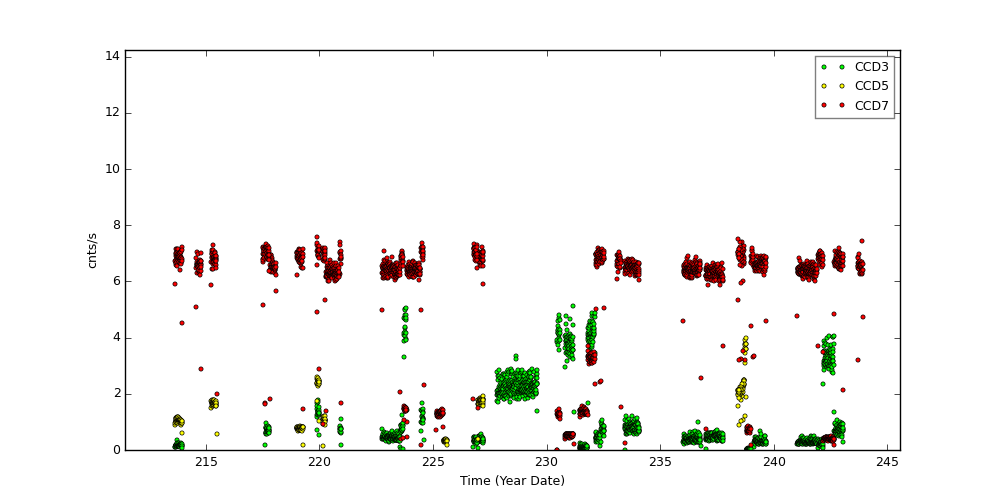
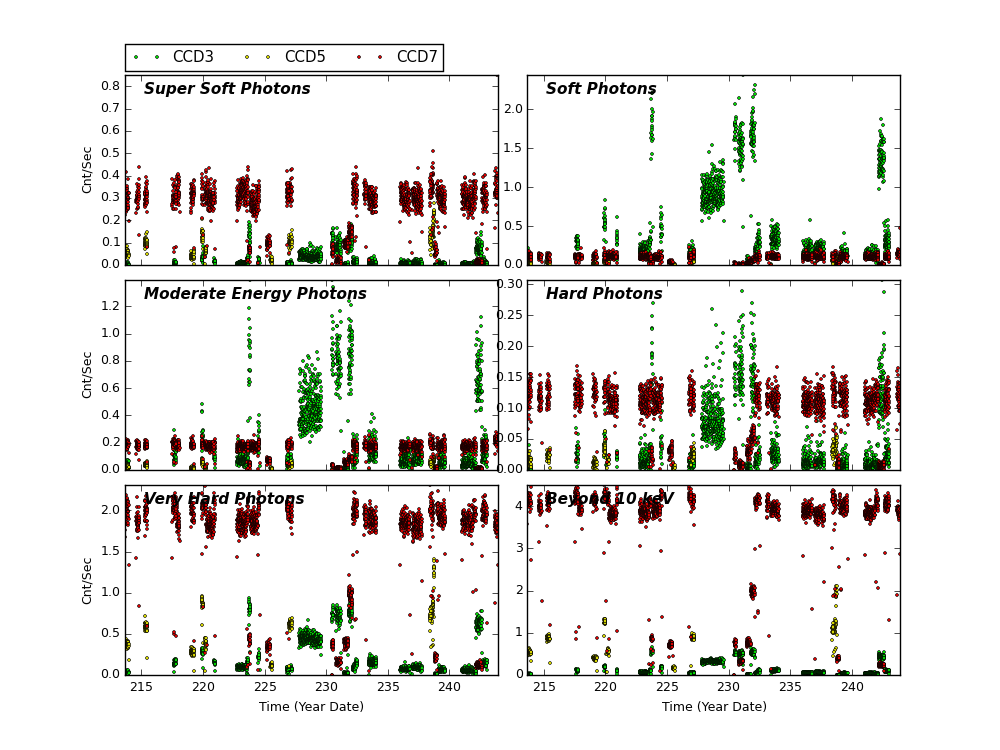
Science Instrument Background Rates
| Name | Low (keV) | High(KeV) | Description |
|---|---|---|---|
| SSoft | 0.00 | 0.50 | Super soft photons |
| Soft | 0.50 | 1.00 | Soft photons |
| Med | 1.00 | 3.00 | Moderate energy photons |
| Hard | 3.00 | 5.00 | Hard Photons |
| Harder | 5.00 | 10.00 | Very Hard photons |
| Hardest | 10.00 | Beyond 10 keV |
HRC
DOSE of Central 4K Pore-Pairs
Please refer to Maximum Dose Trends for more details.
No Data
)
IMAGE                       NPIX      MEAN    STDDEV      MIN       MAX
HRCI_08_1999_08_2018.fits  16777216	5.352 	5.383 	0.000 	295.000
)
|
|---|
IMAGE                NPIX      MEAN    STDDEV      MIN       MAX
HRCS_08_2018.fits  16777216	0.037 	0.197 	0.000 	4.000
)
IMAGE                       NPIX      MEAN    STDDEV      MIN       MAX
HRCS_08_1999_08_2018.fits  16777216	17.611 	32.365 	0.000 	1730.000
|
|
Max dose trend plots corrected for events that "pile-up"
in the center of the taps due to bad position information.
|
)
|
)
|
)
|
)
|
| May 2018 | Feb 2018 | Nov 2017 | Aug 2017 |
|---|
)
|
)
|
)
|
)
|
| May 2018 | Feb 2018 | Nov 2017 | Aug 2017 |
|---|
HRMA Focus
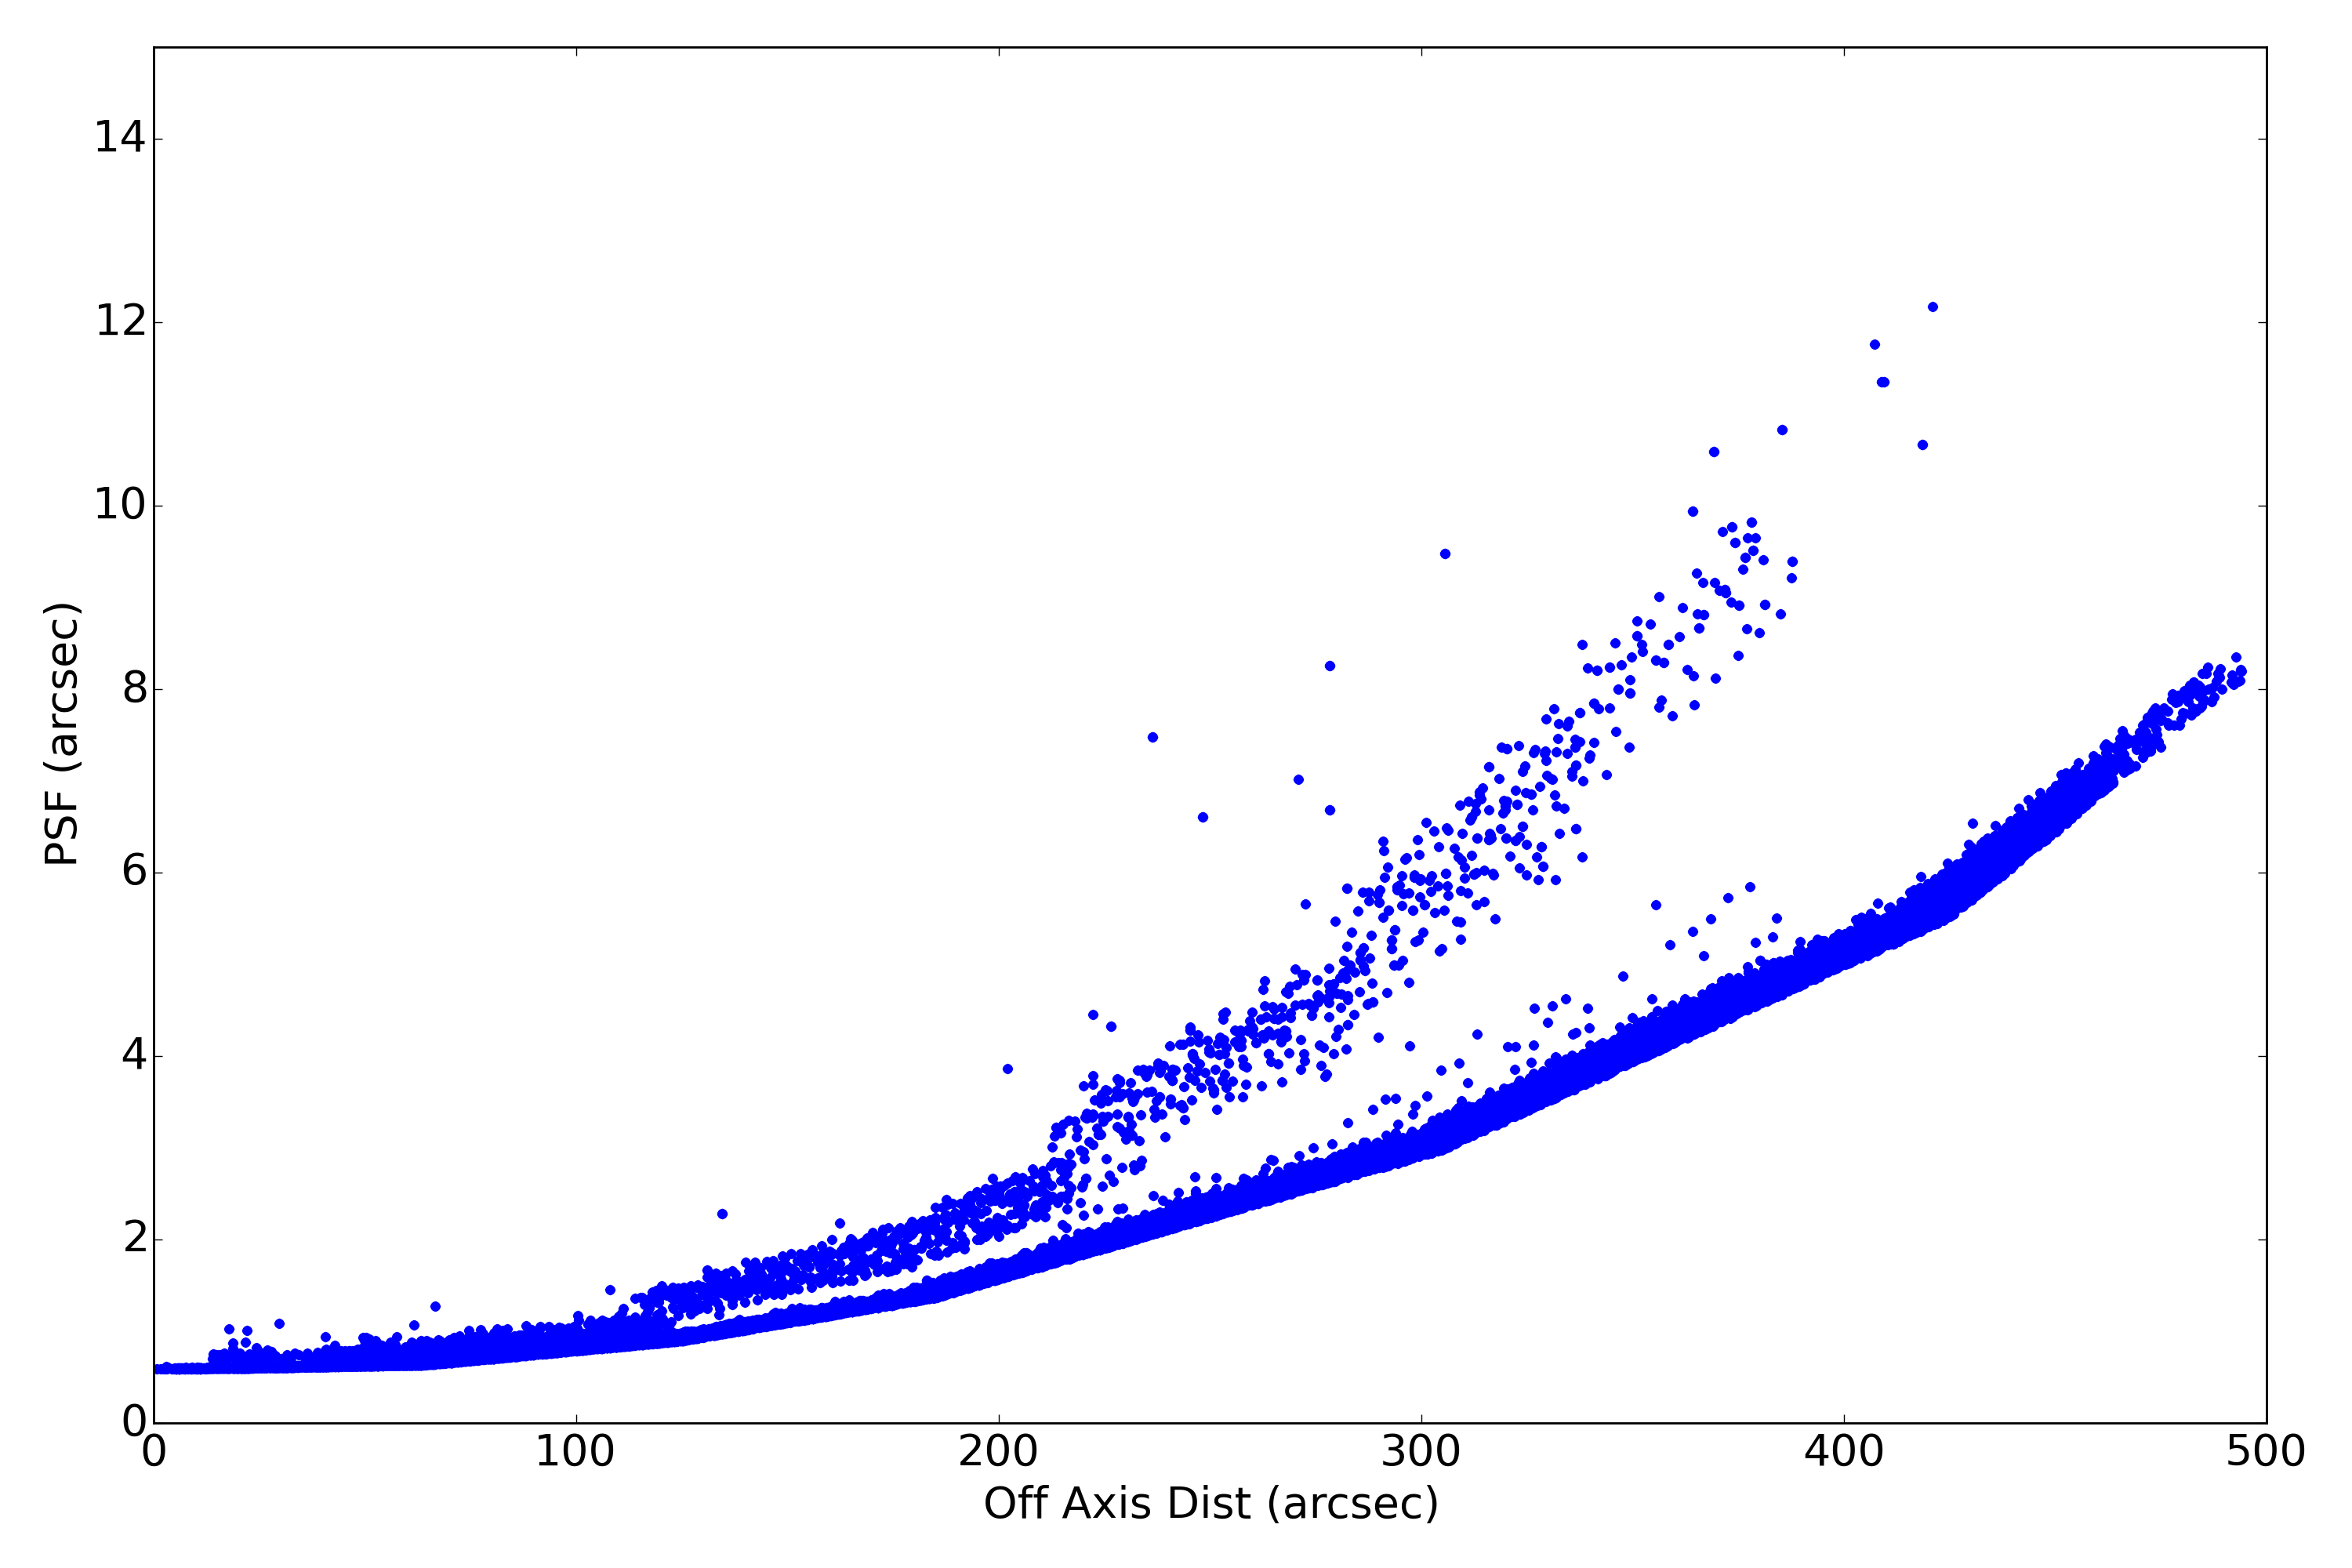
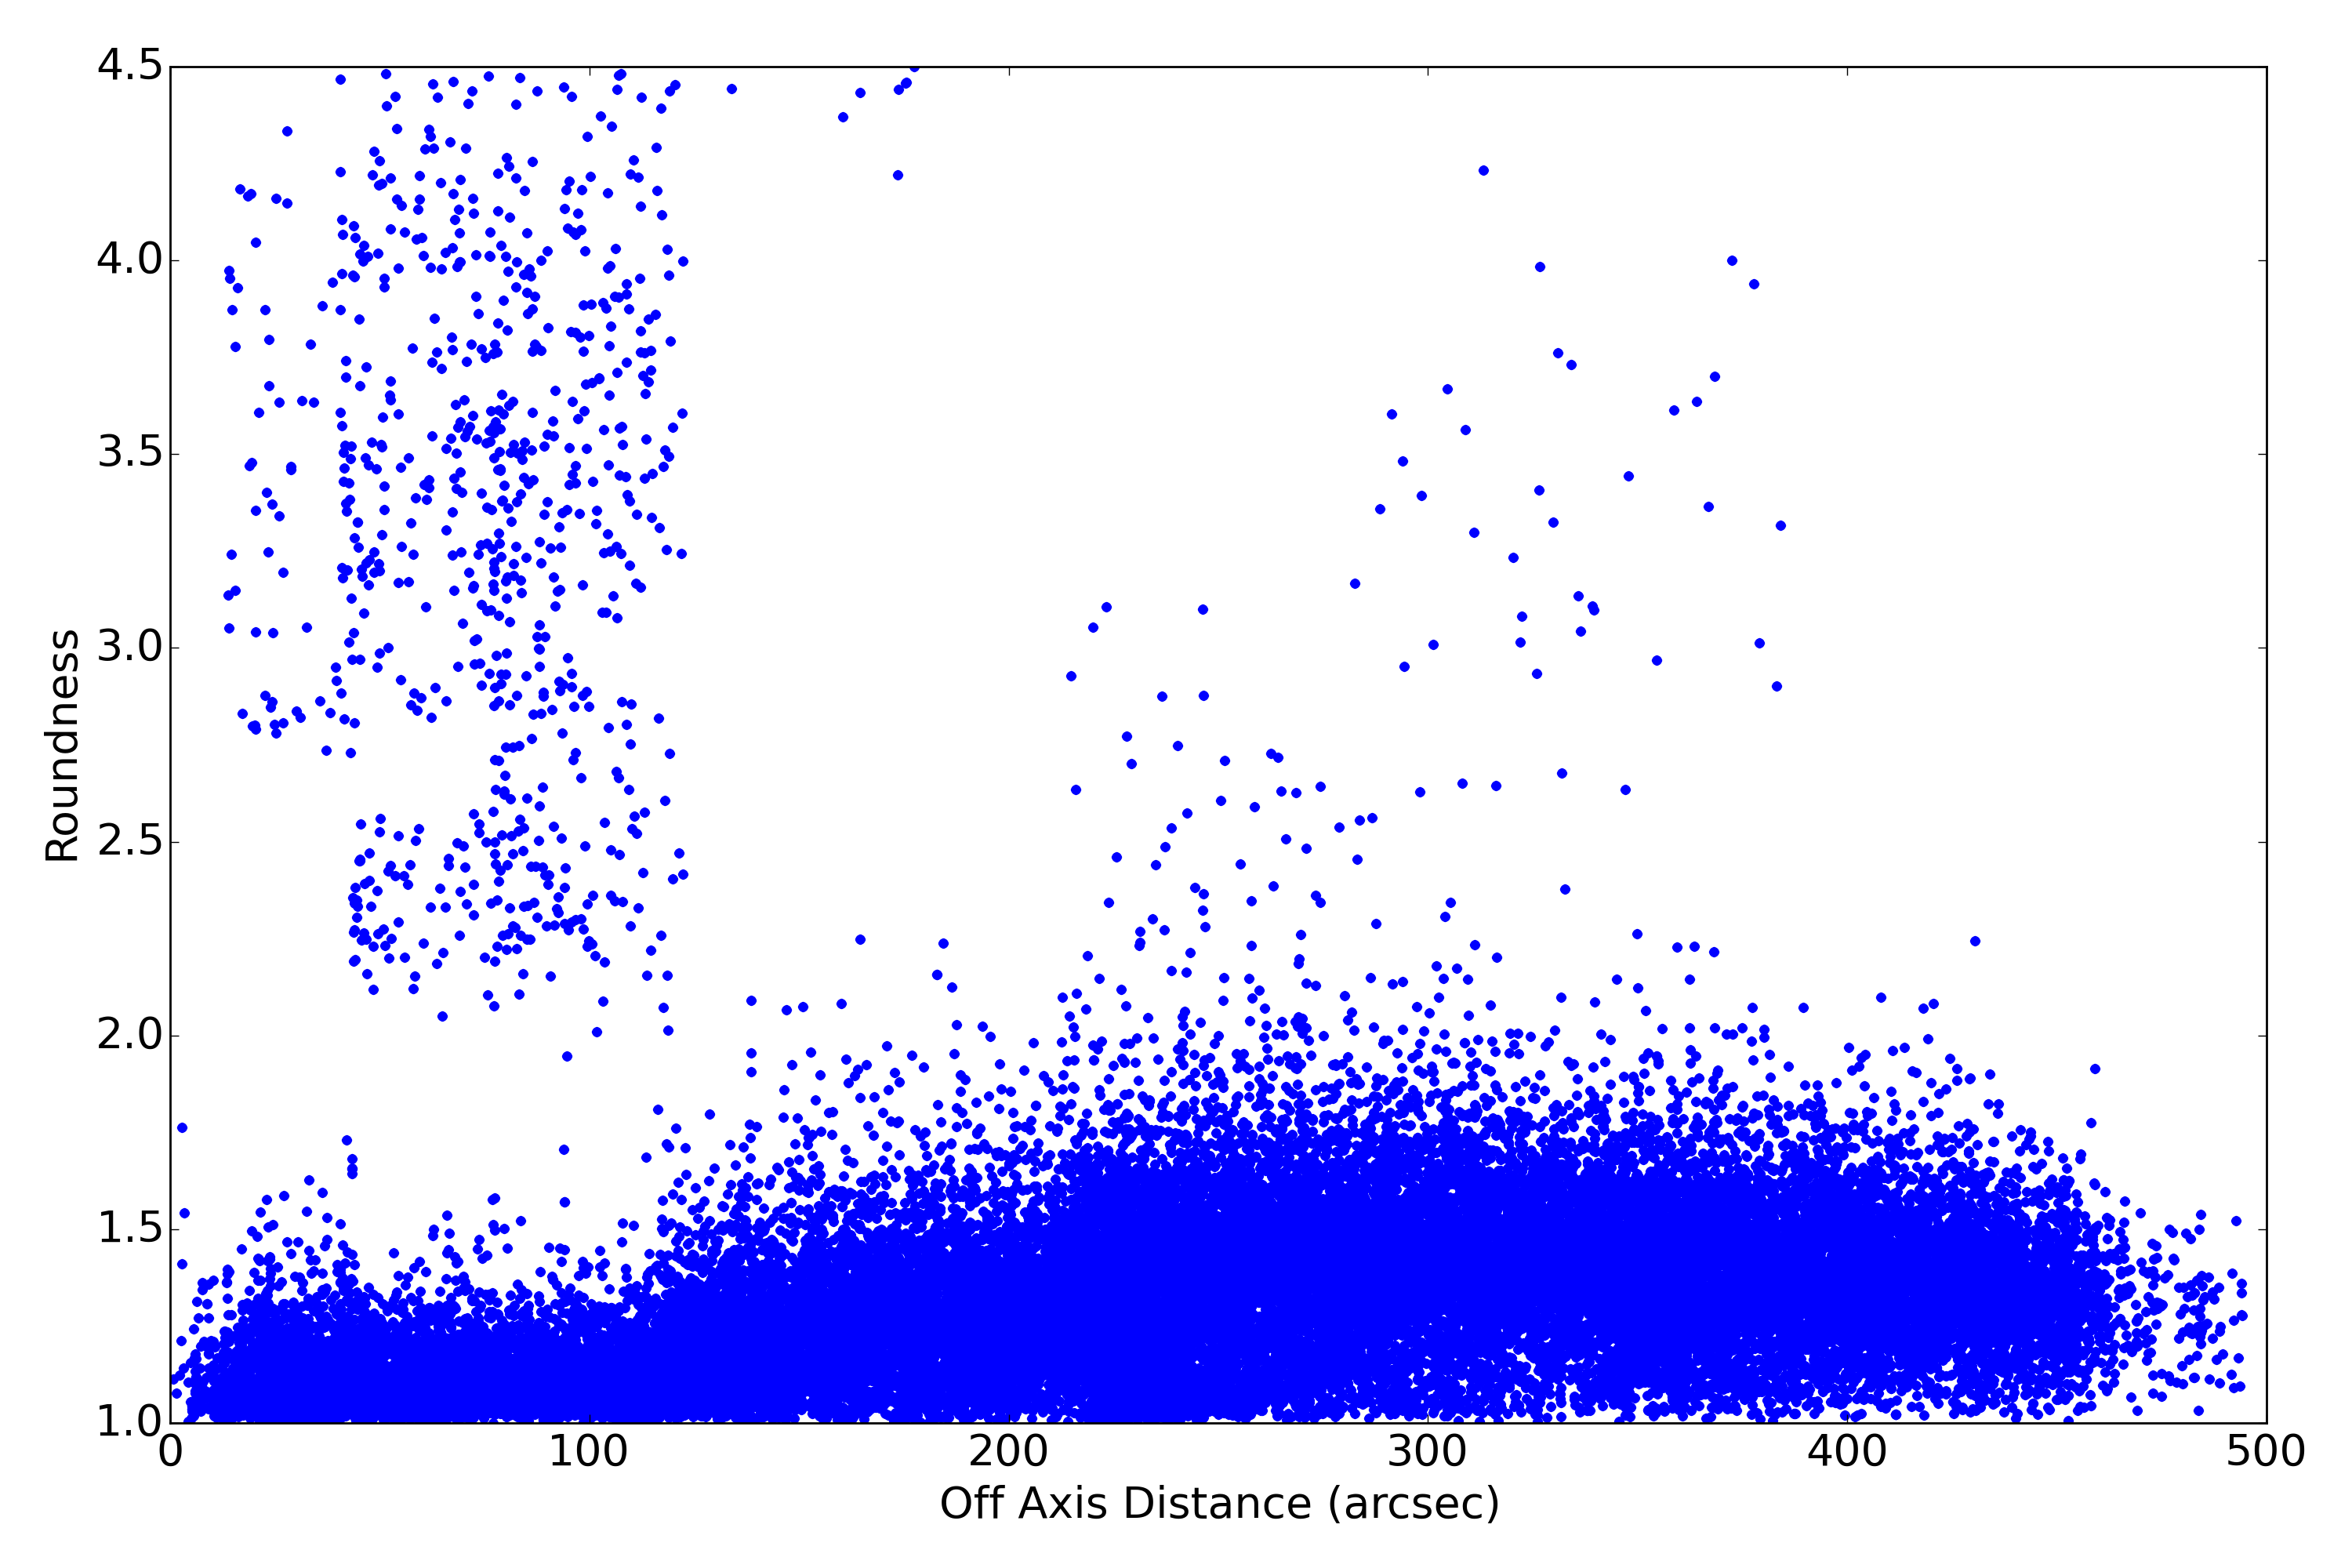
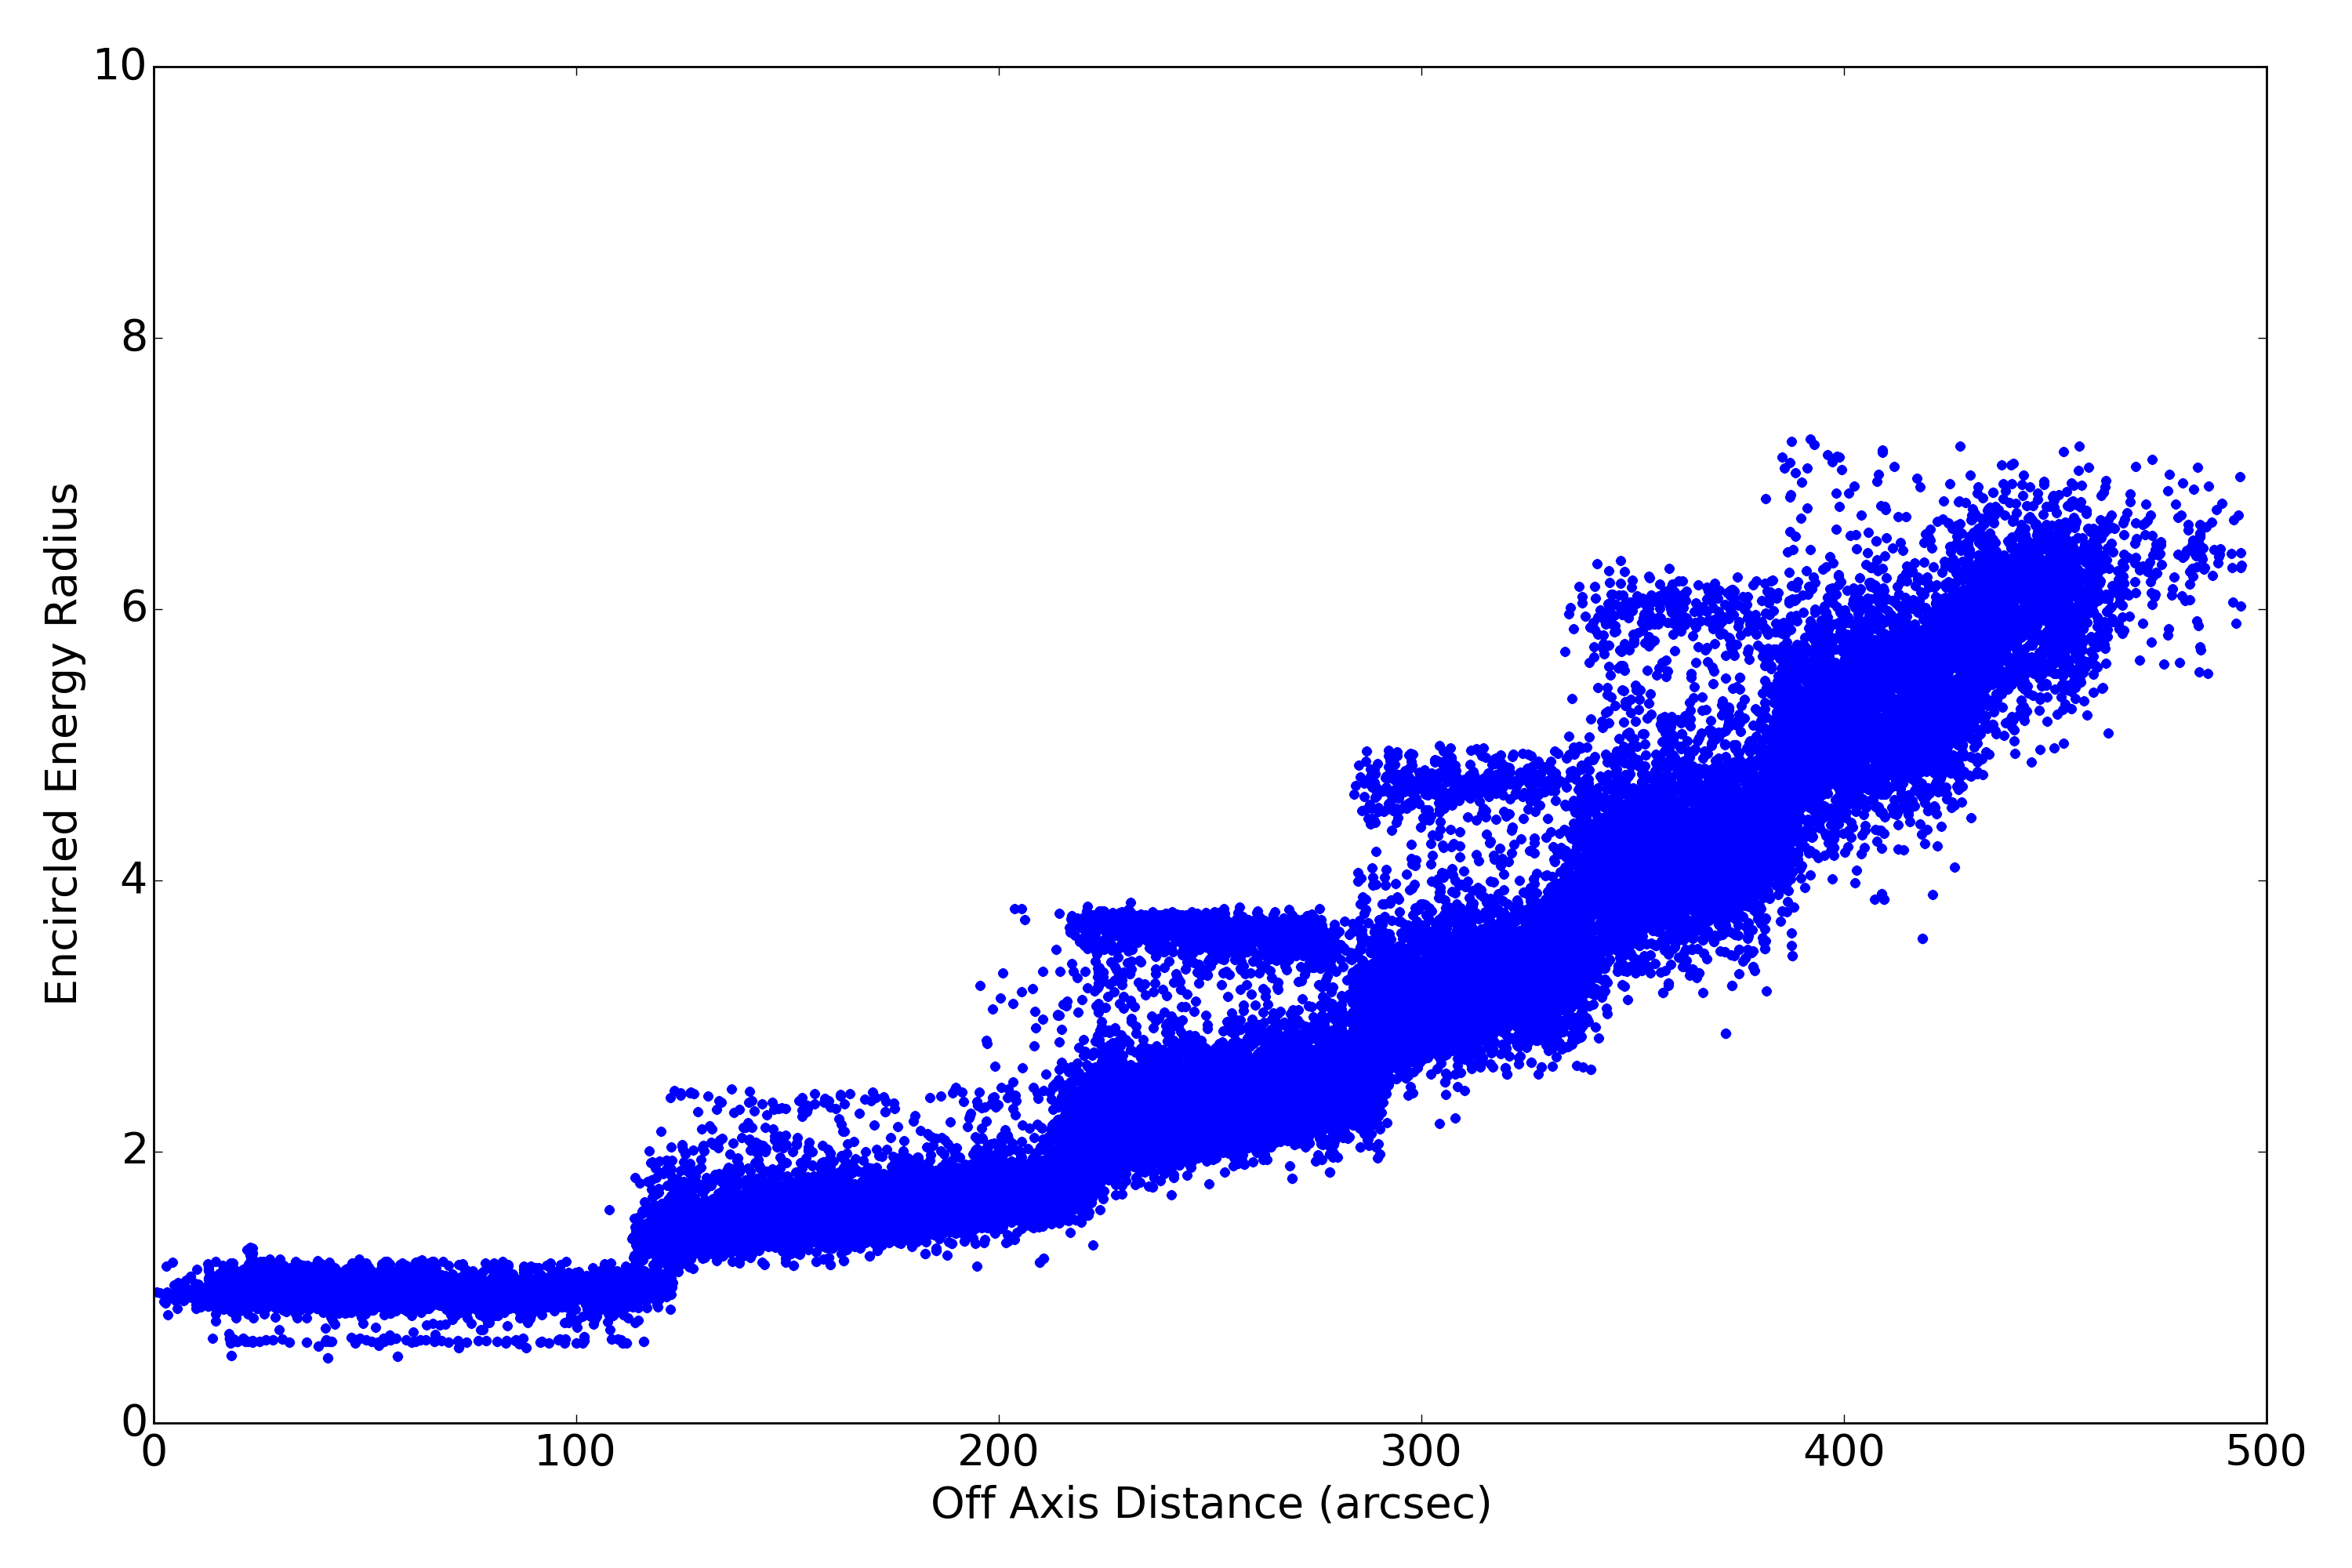
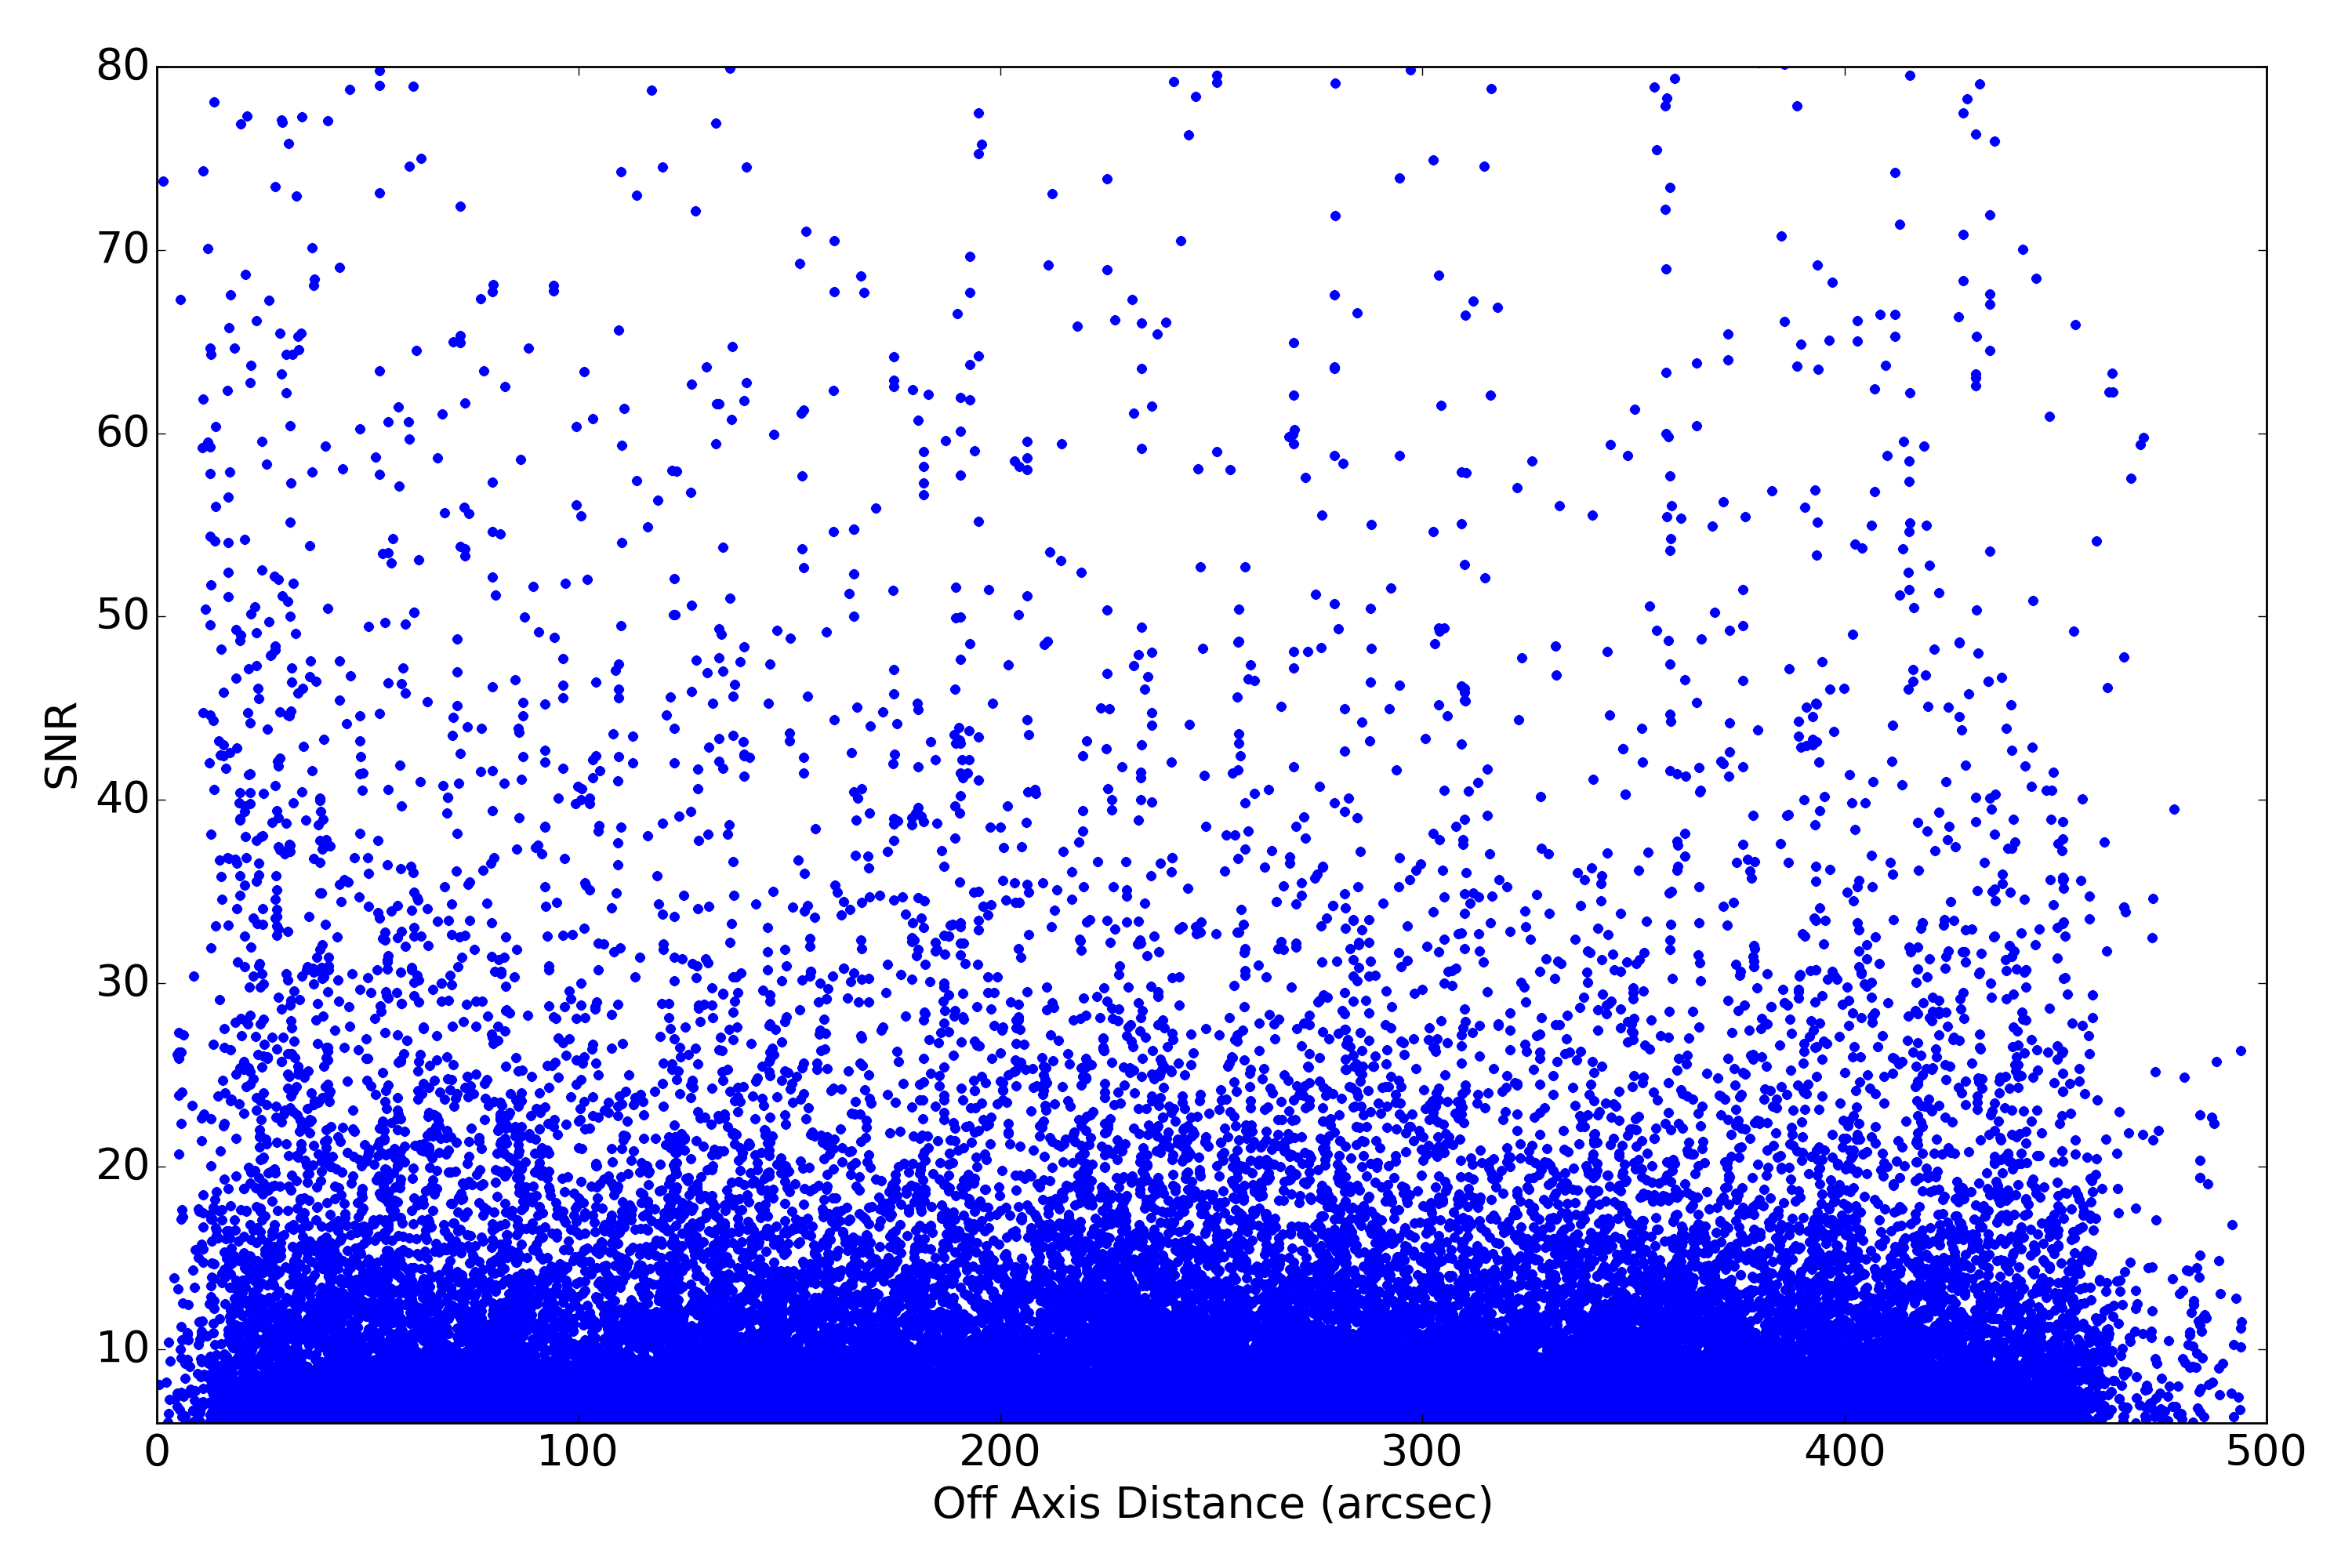
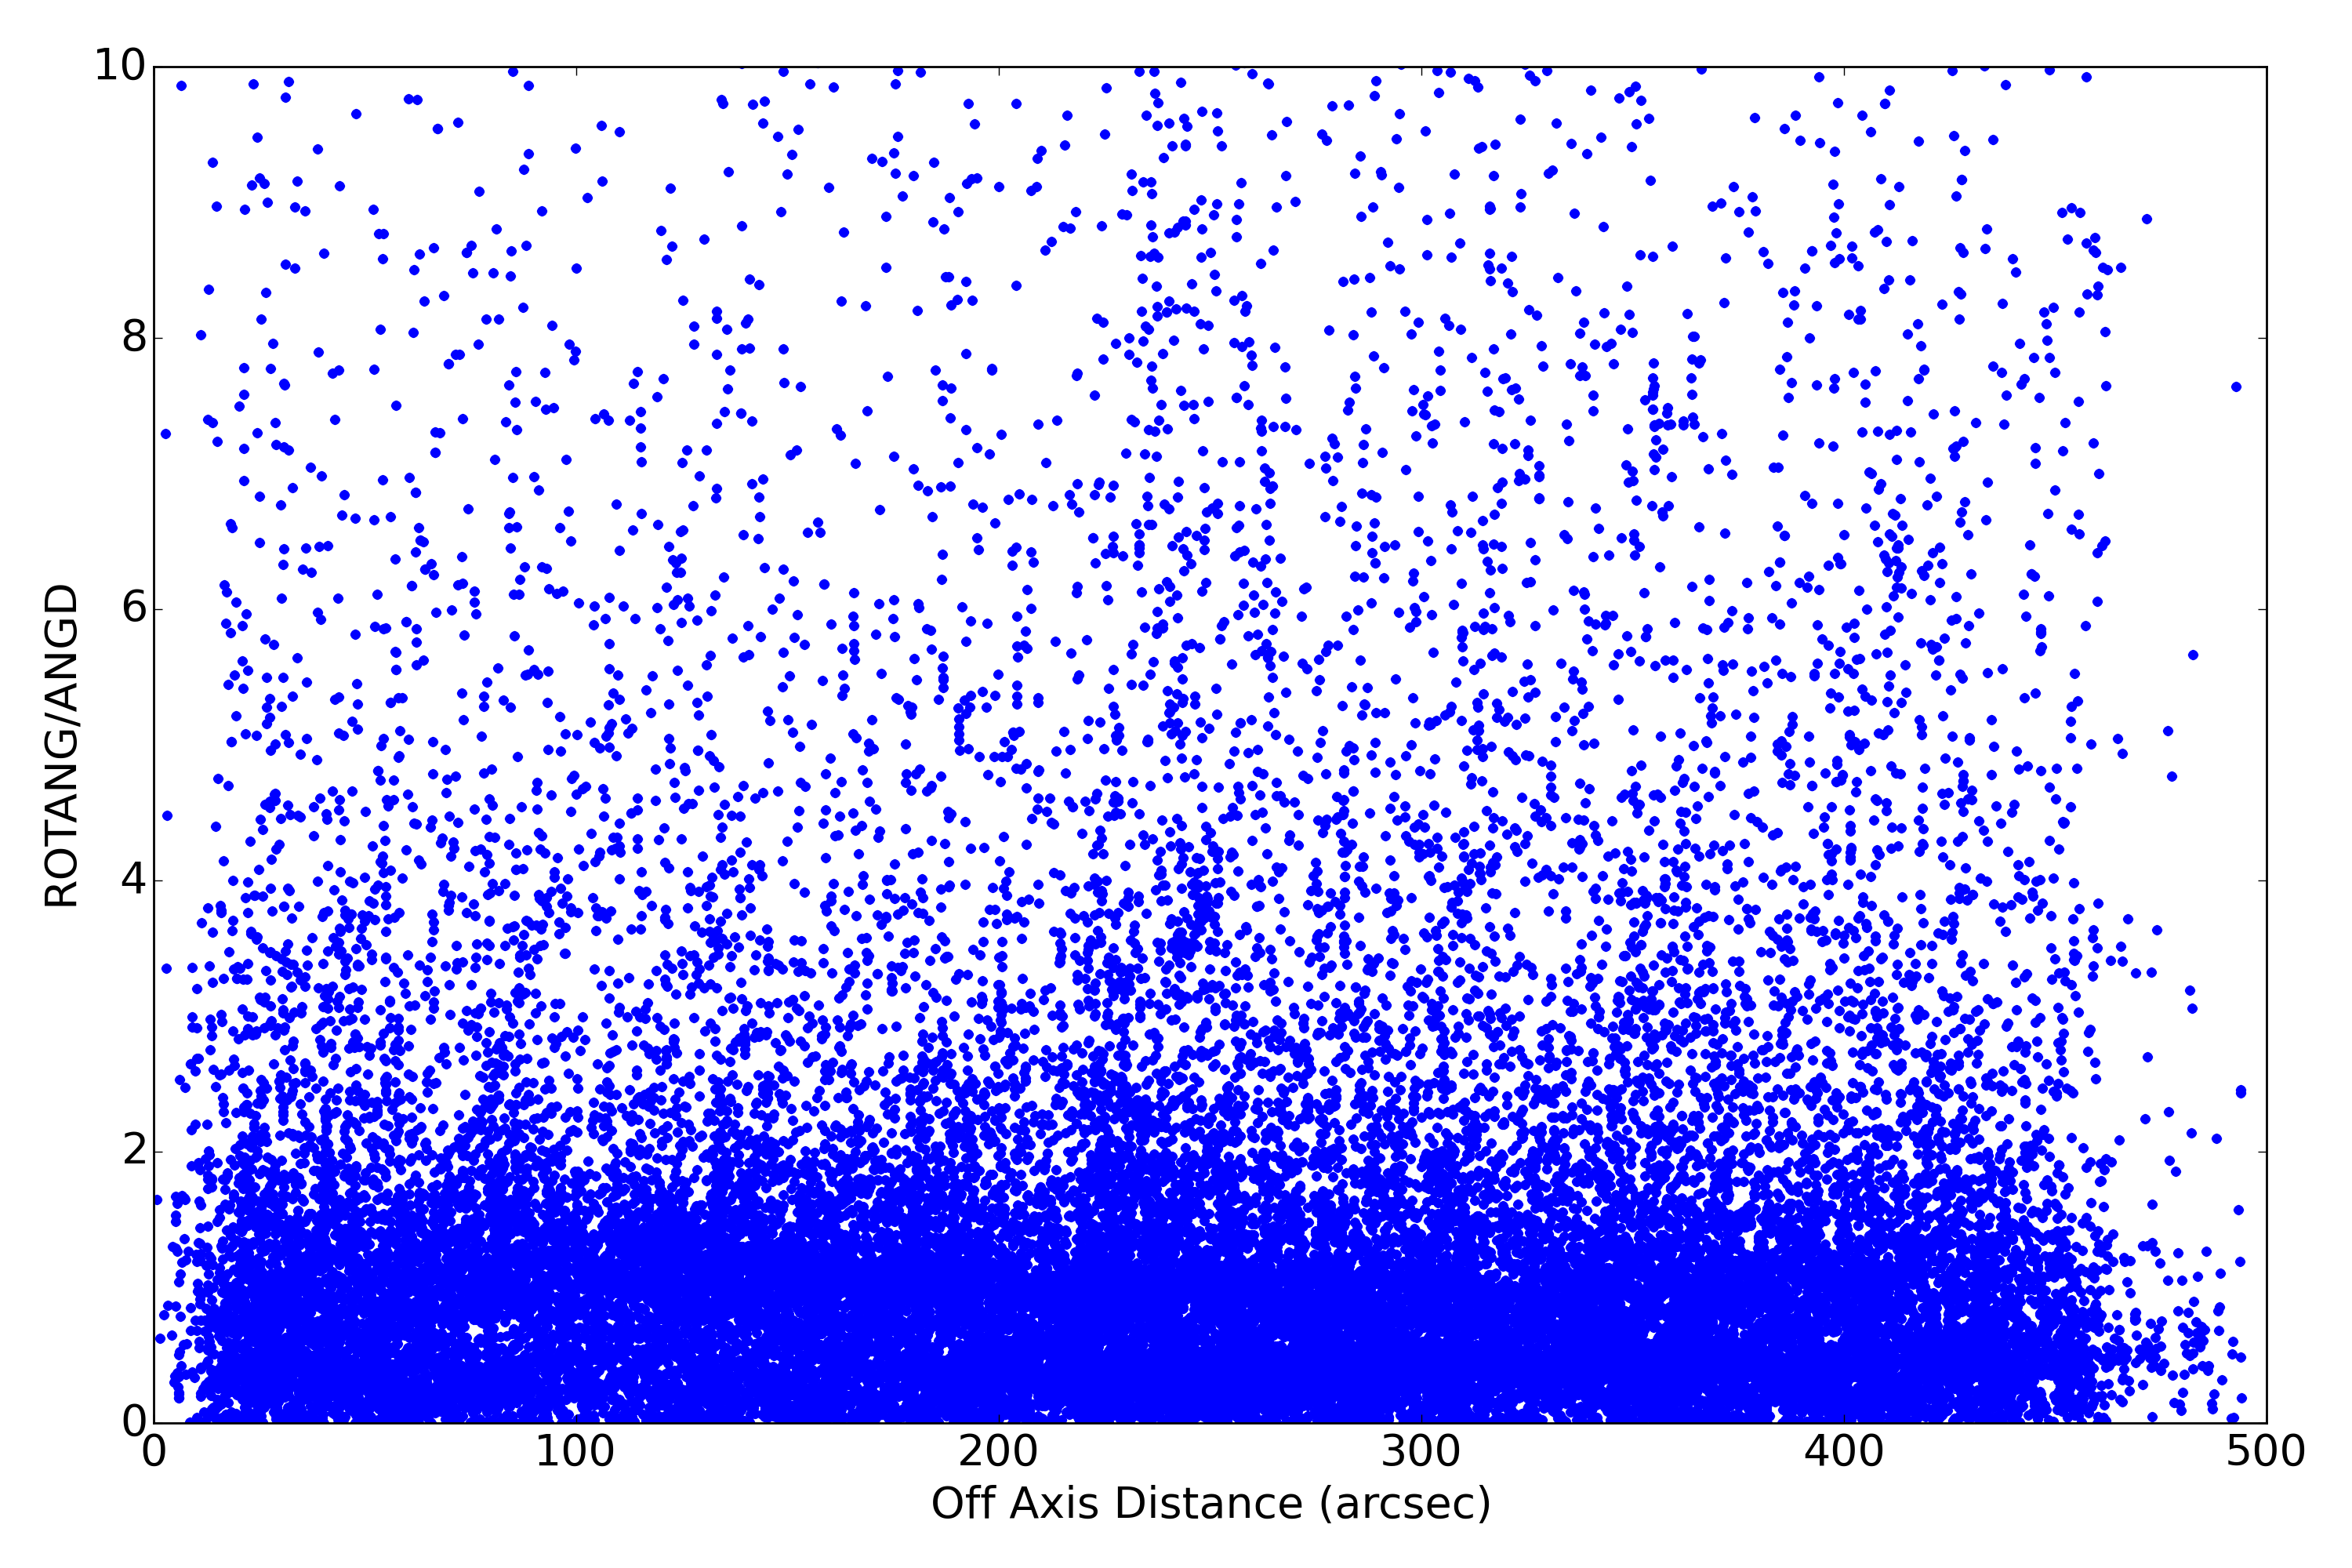
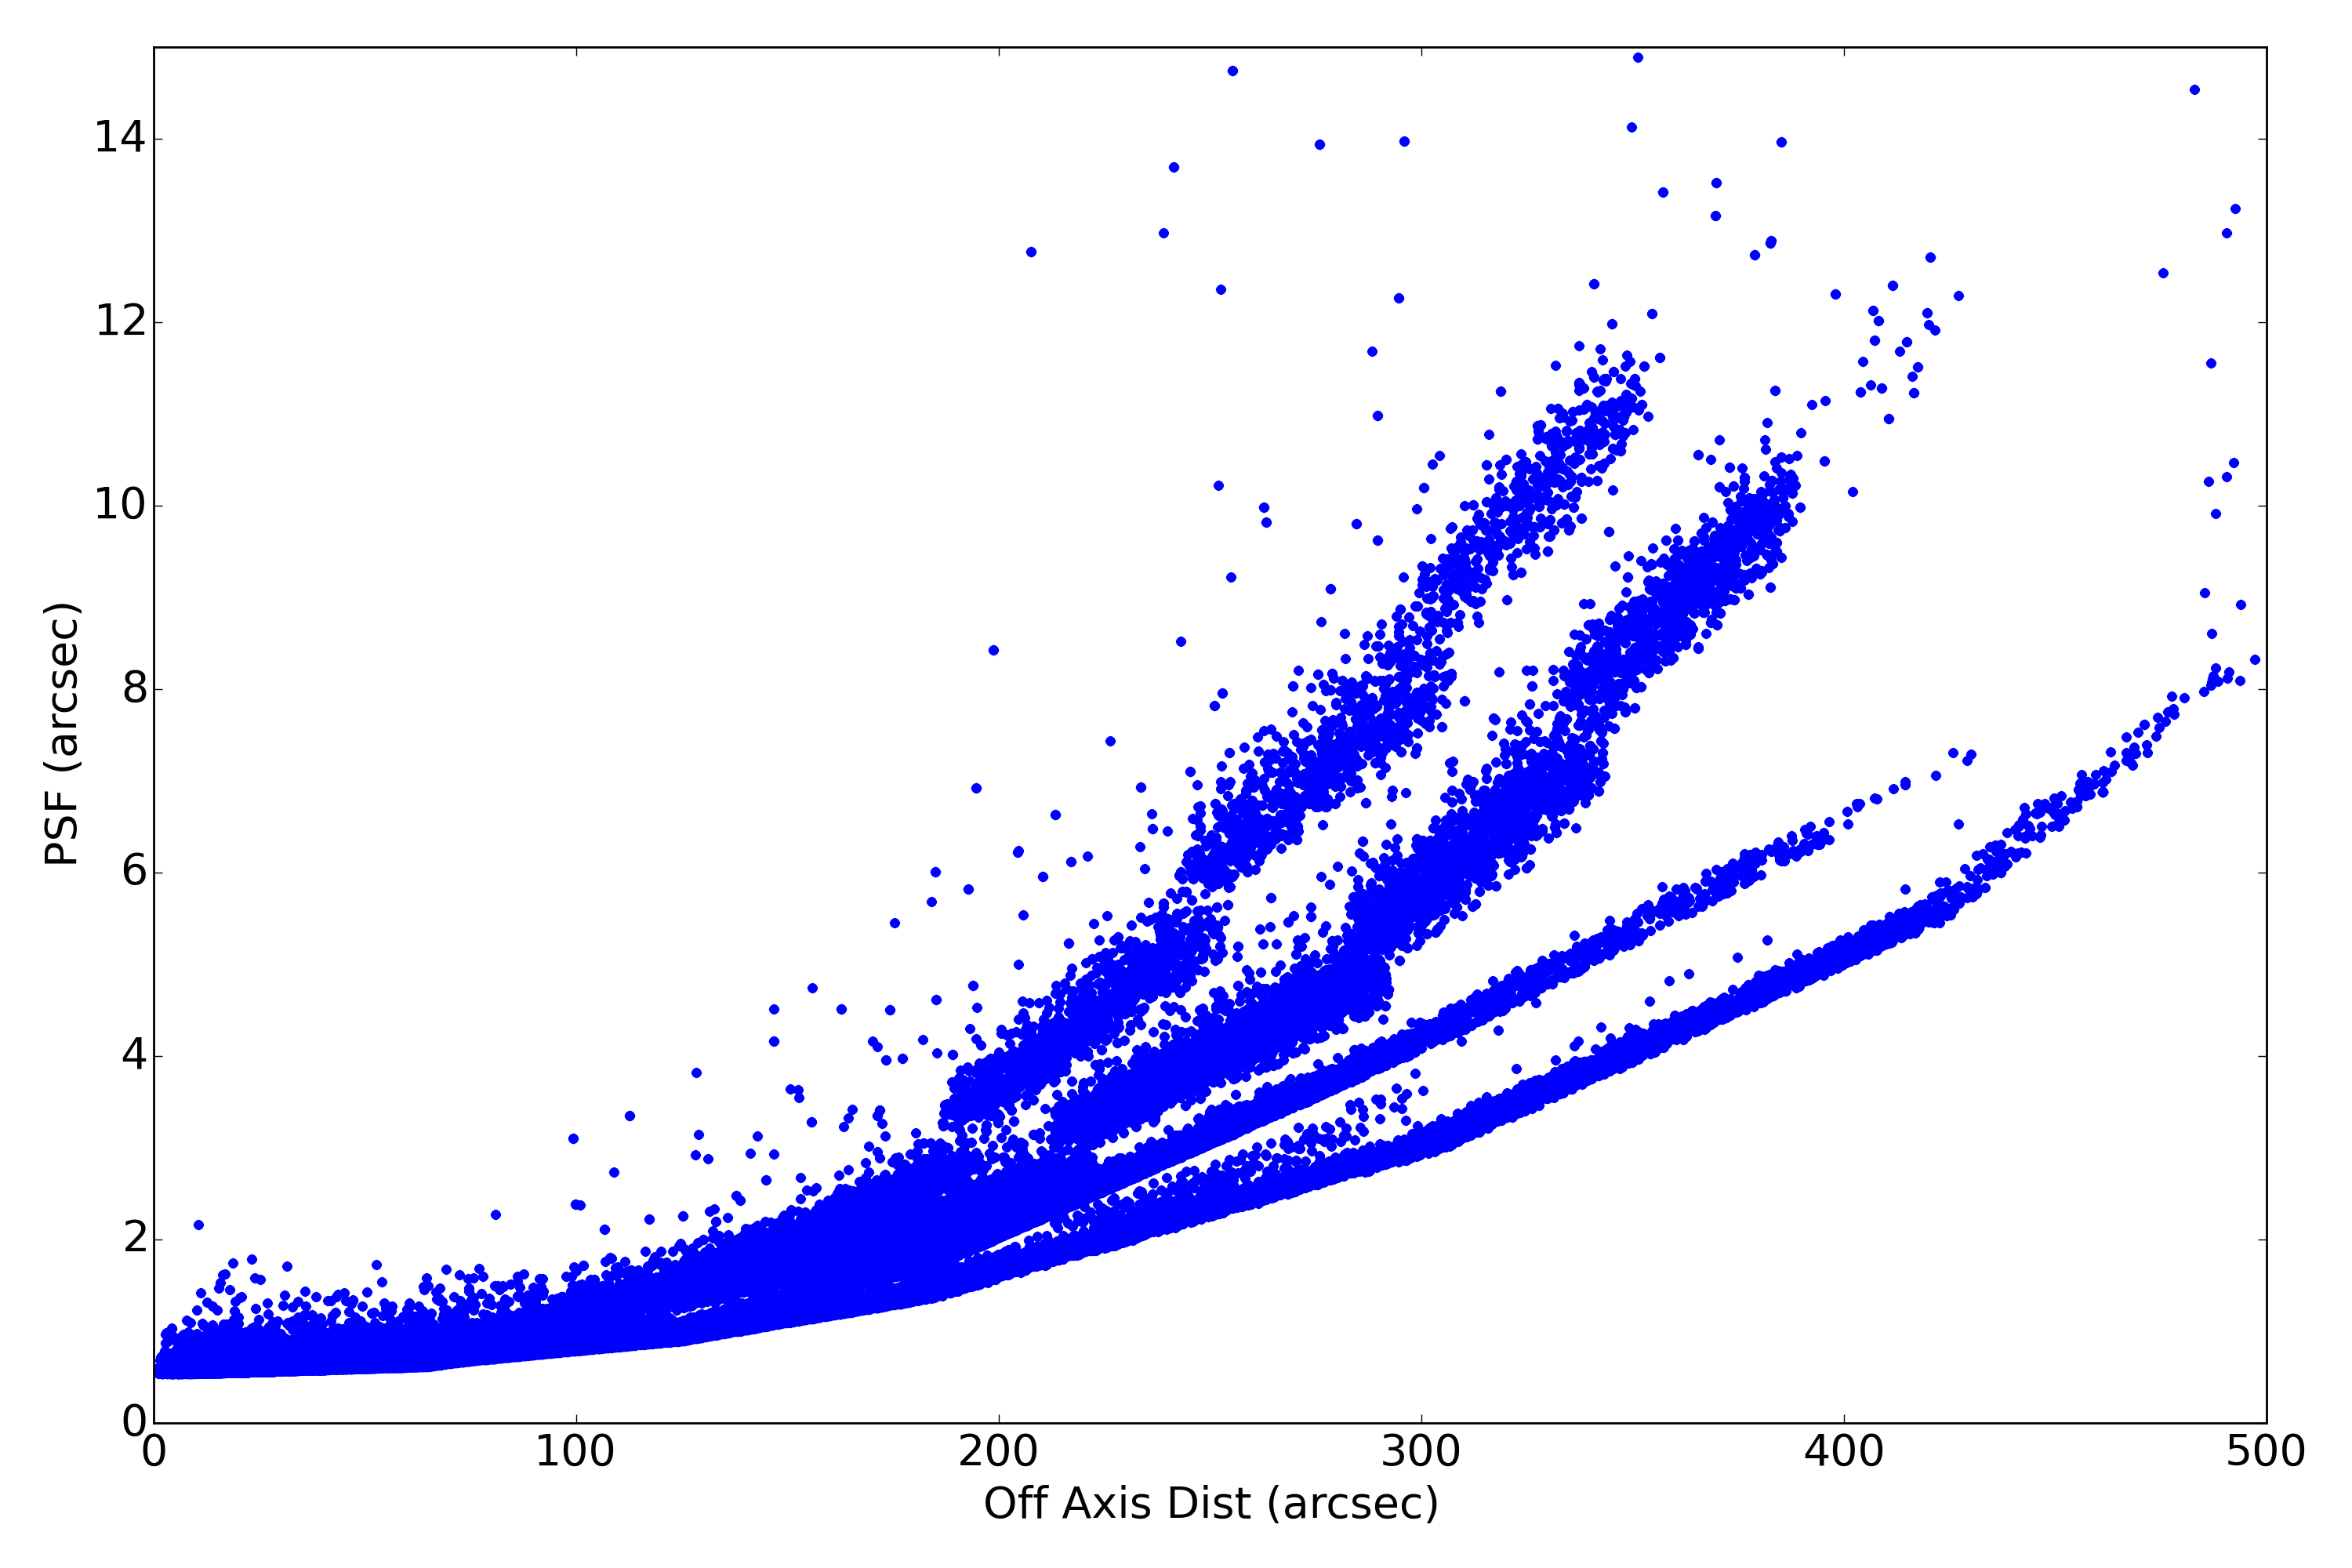
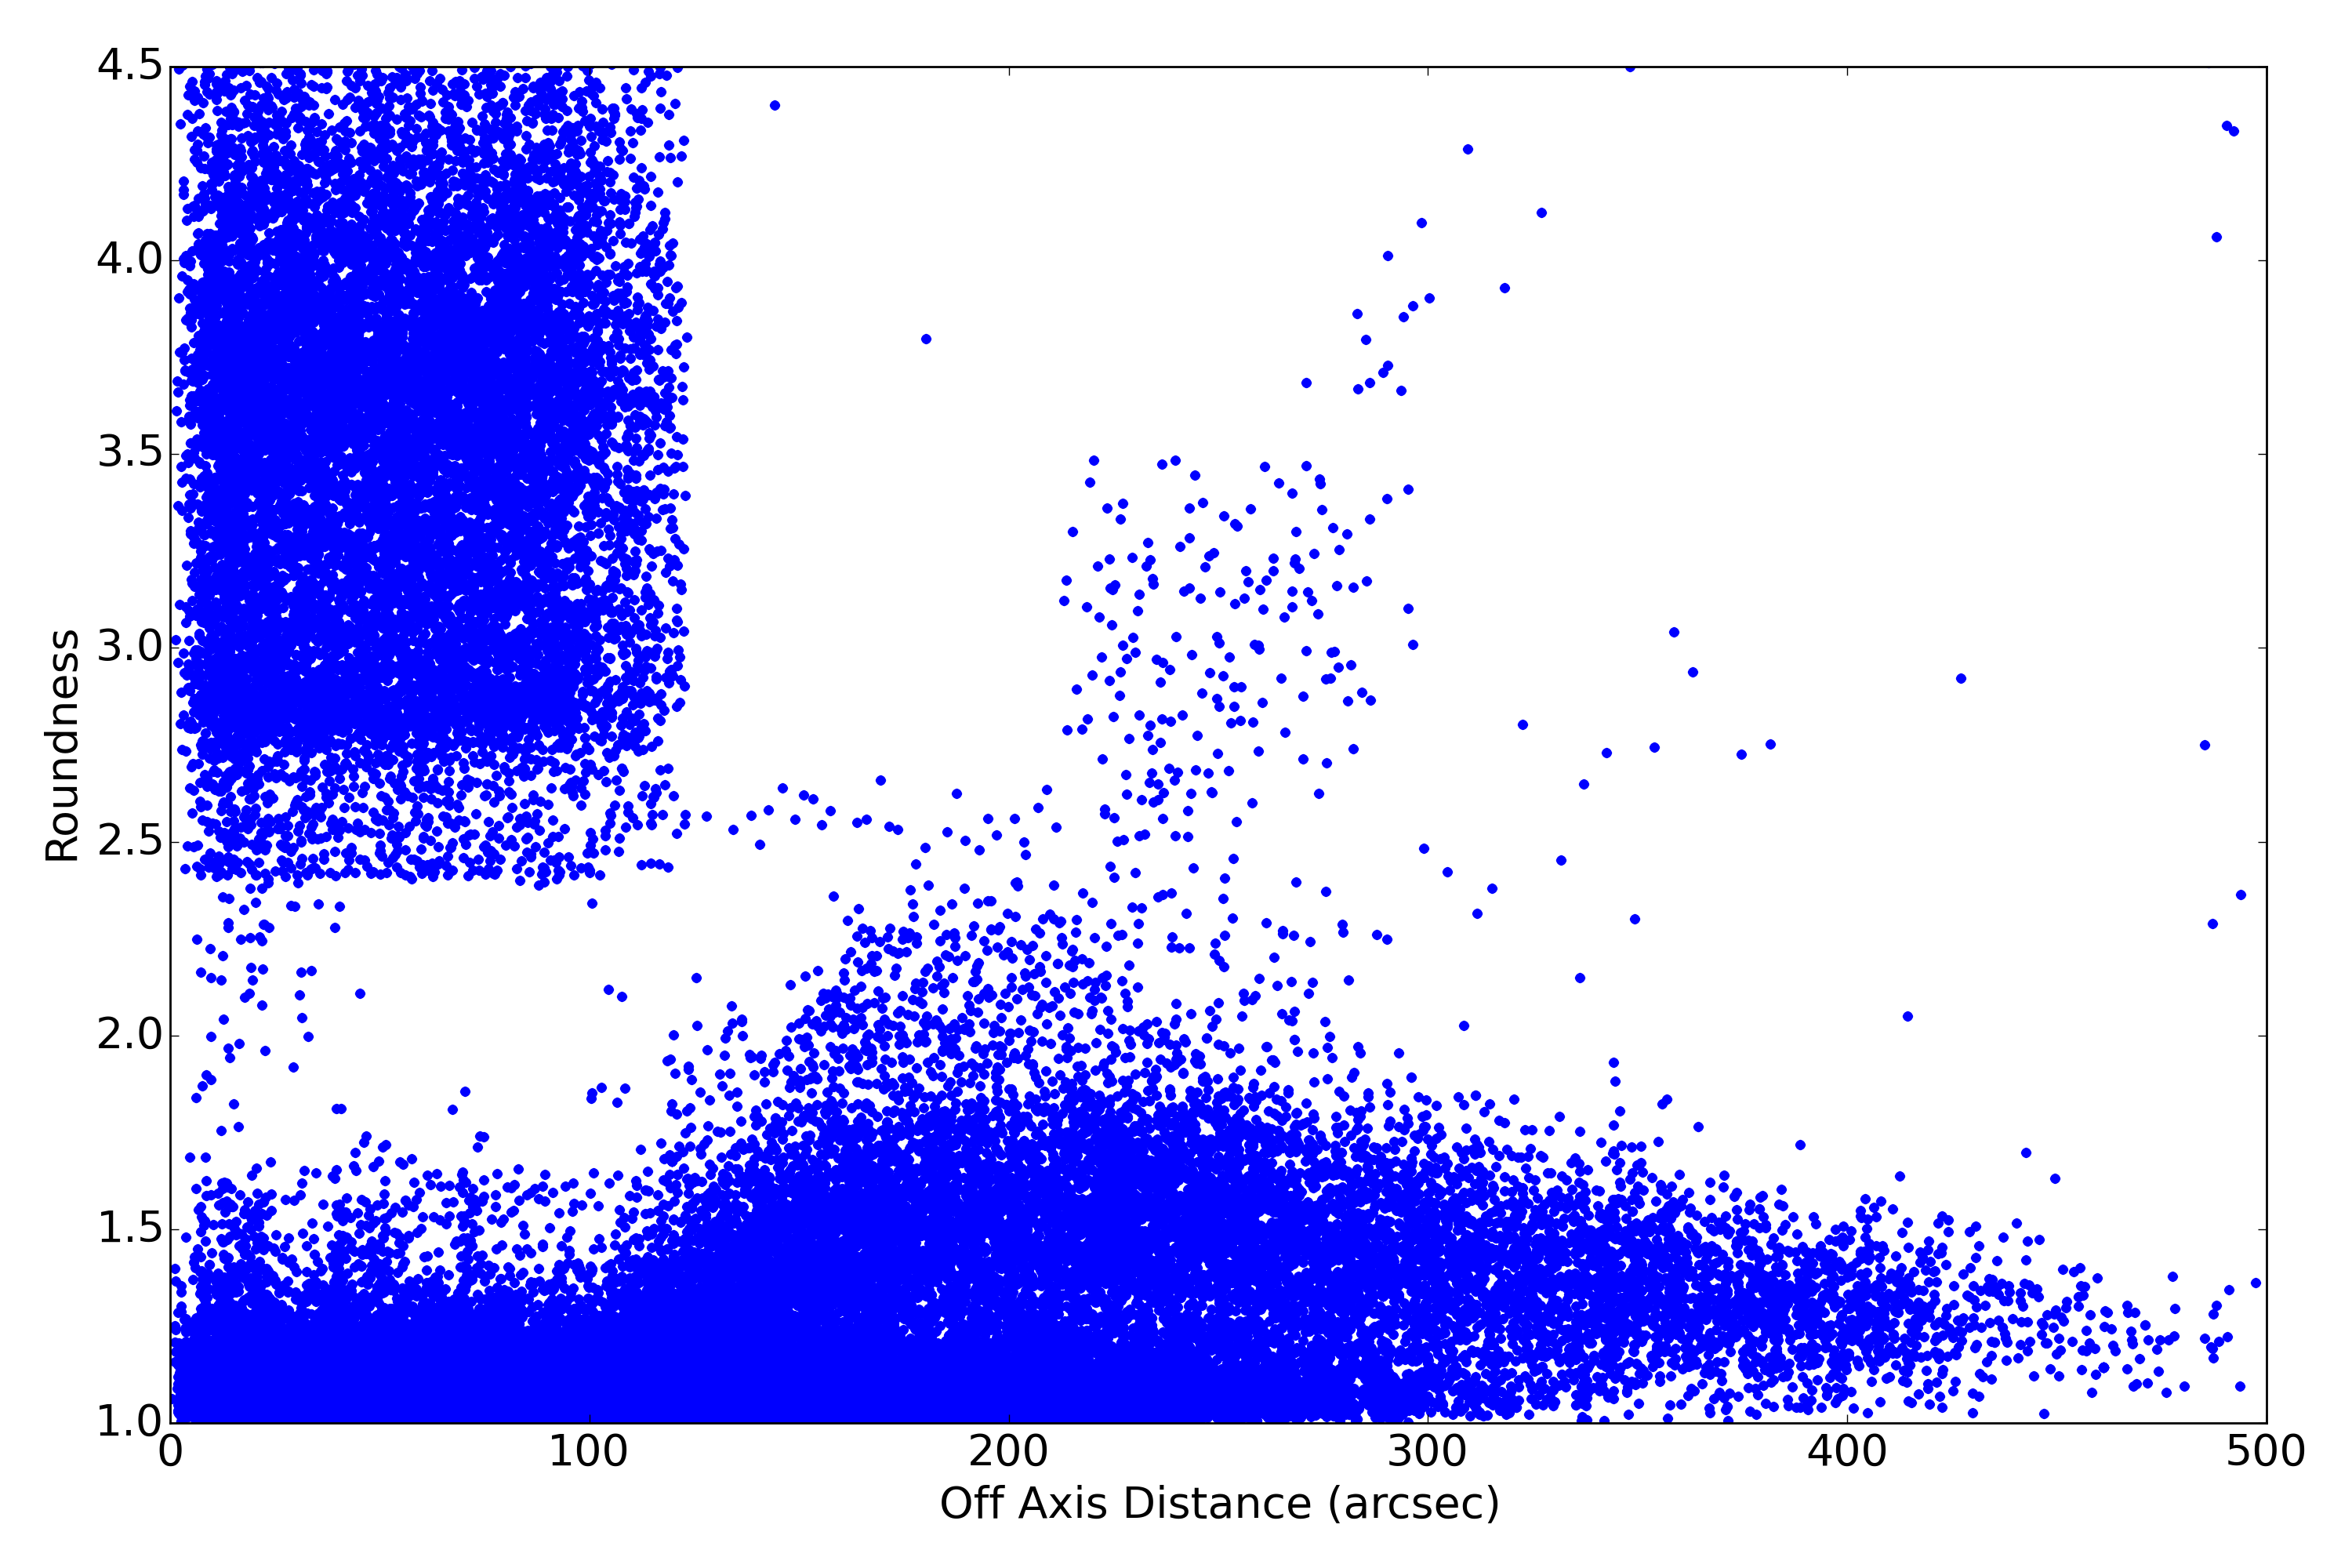
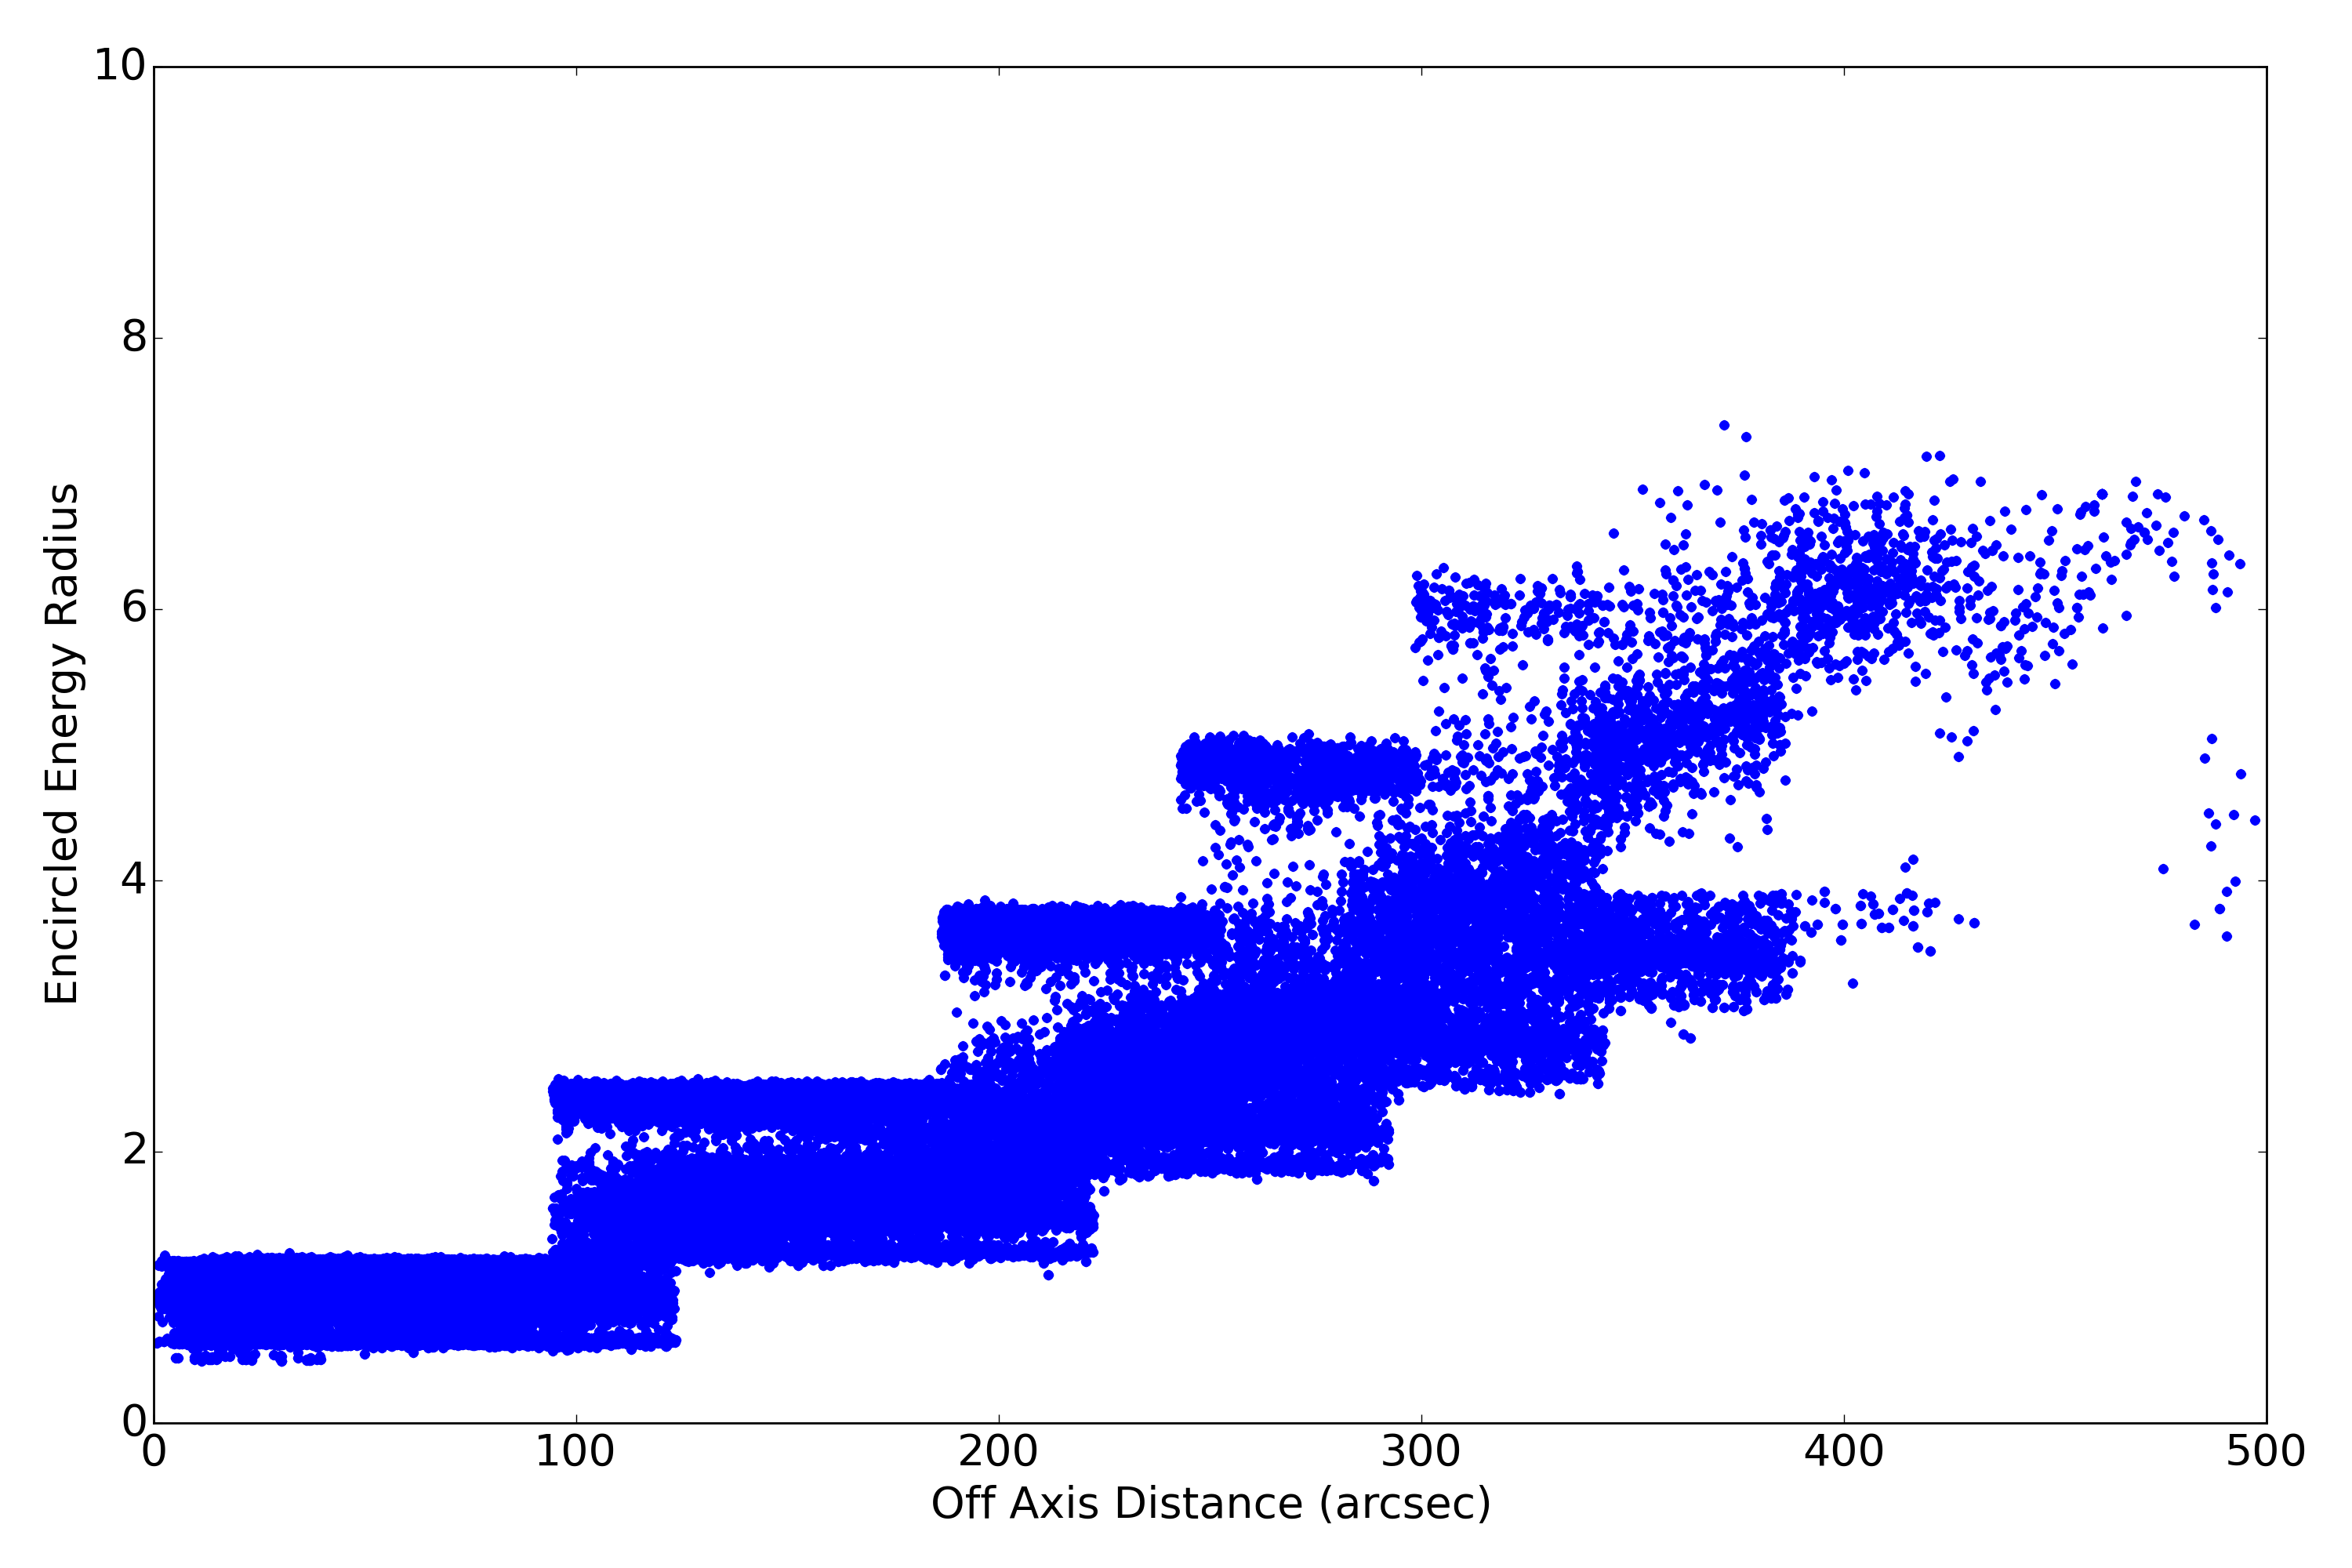
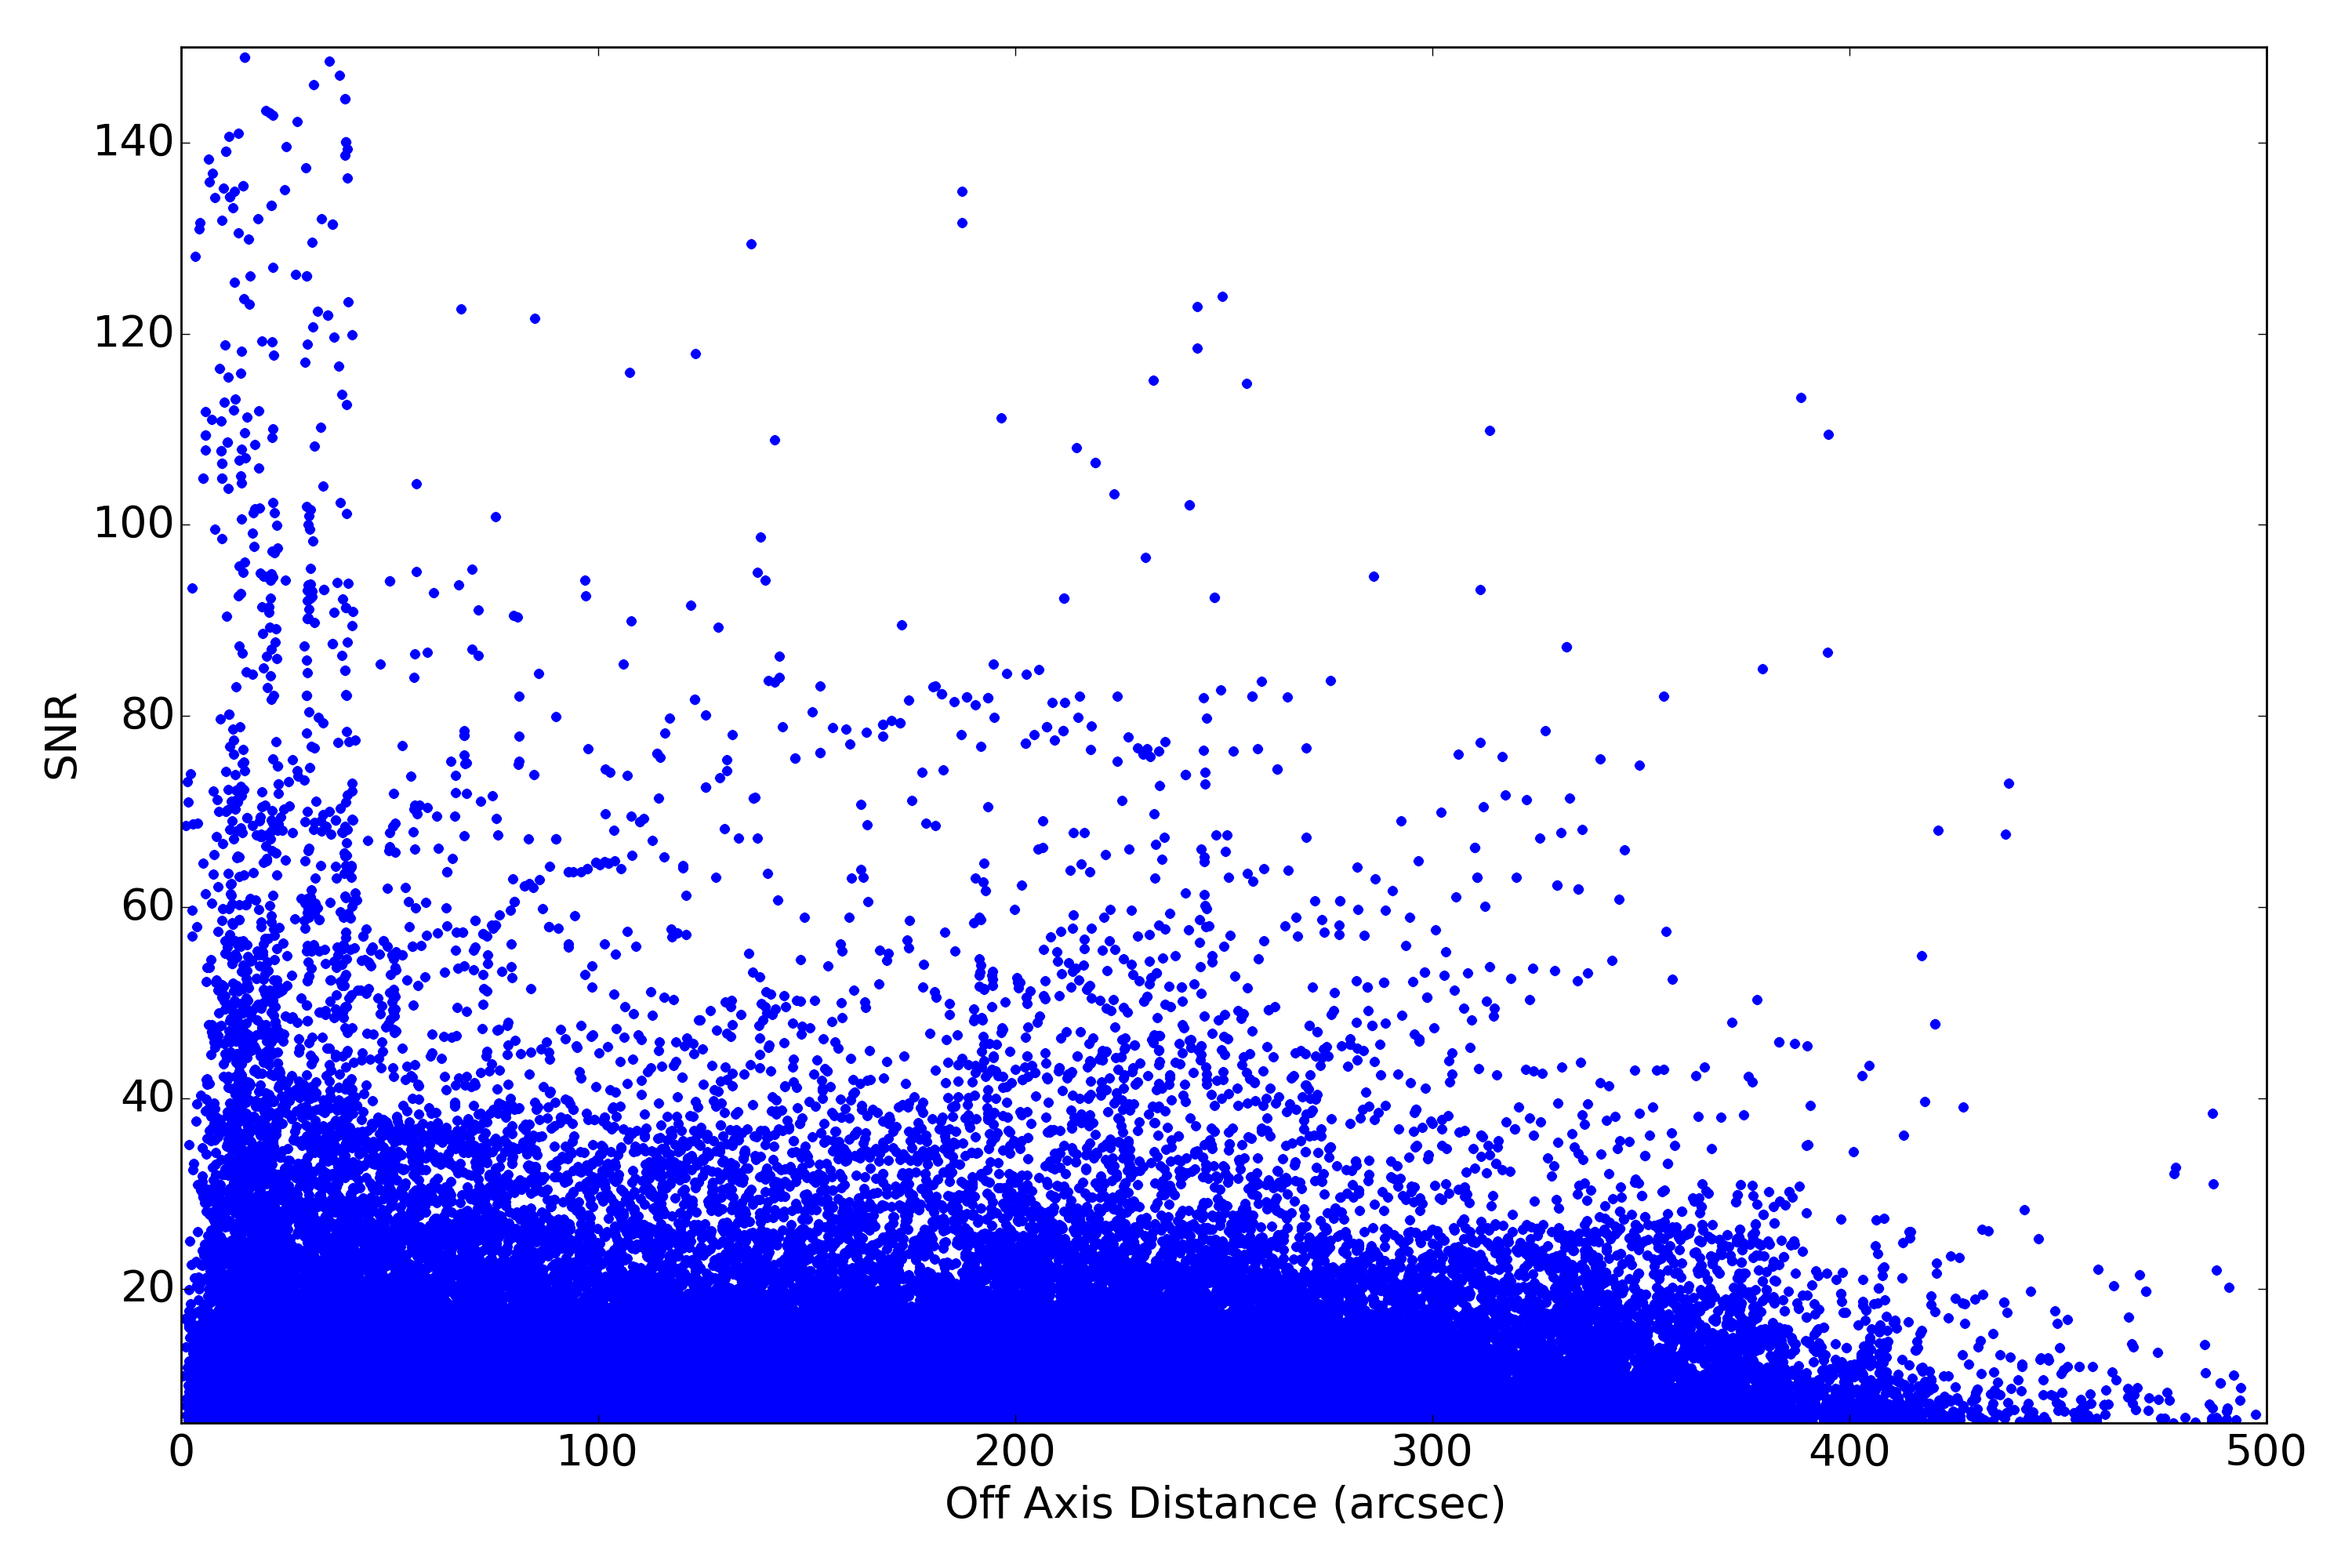
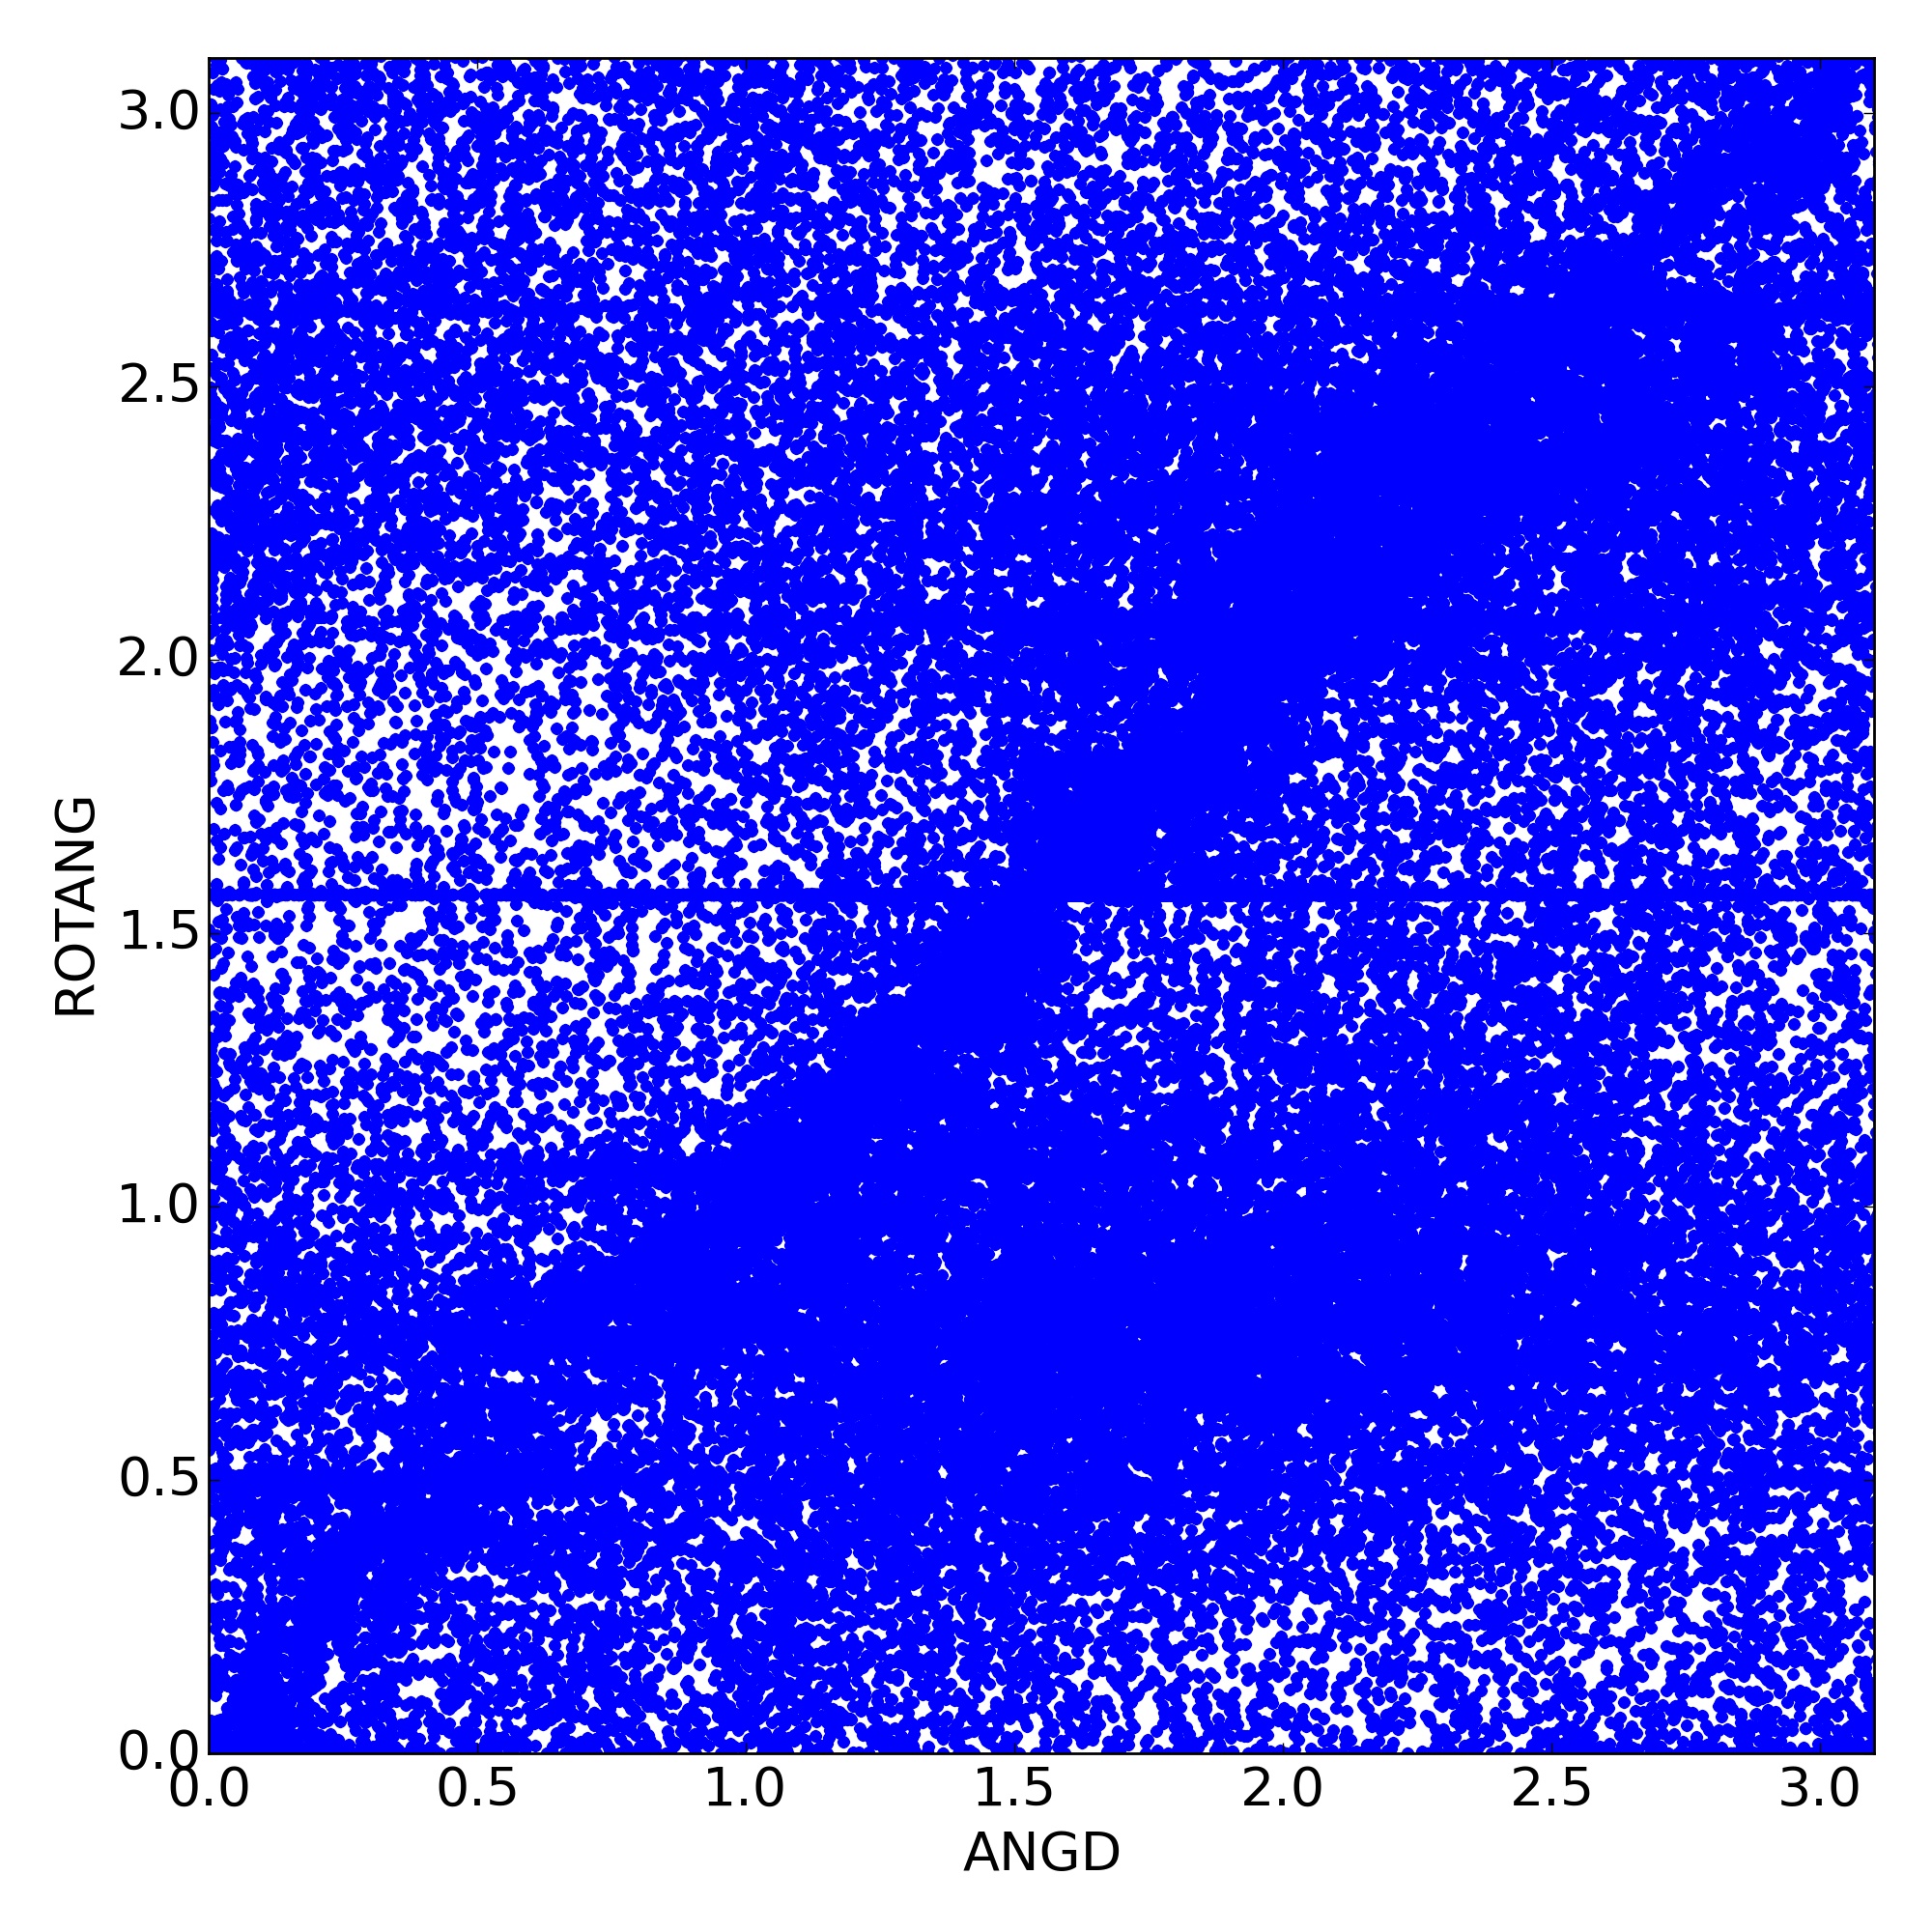
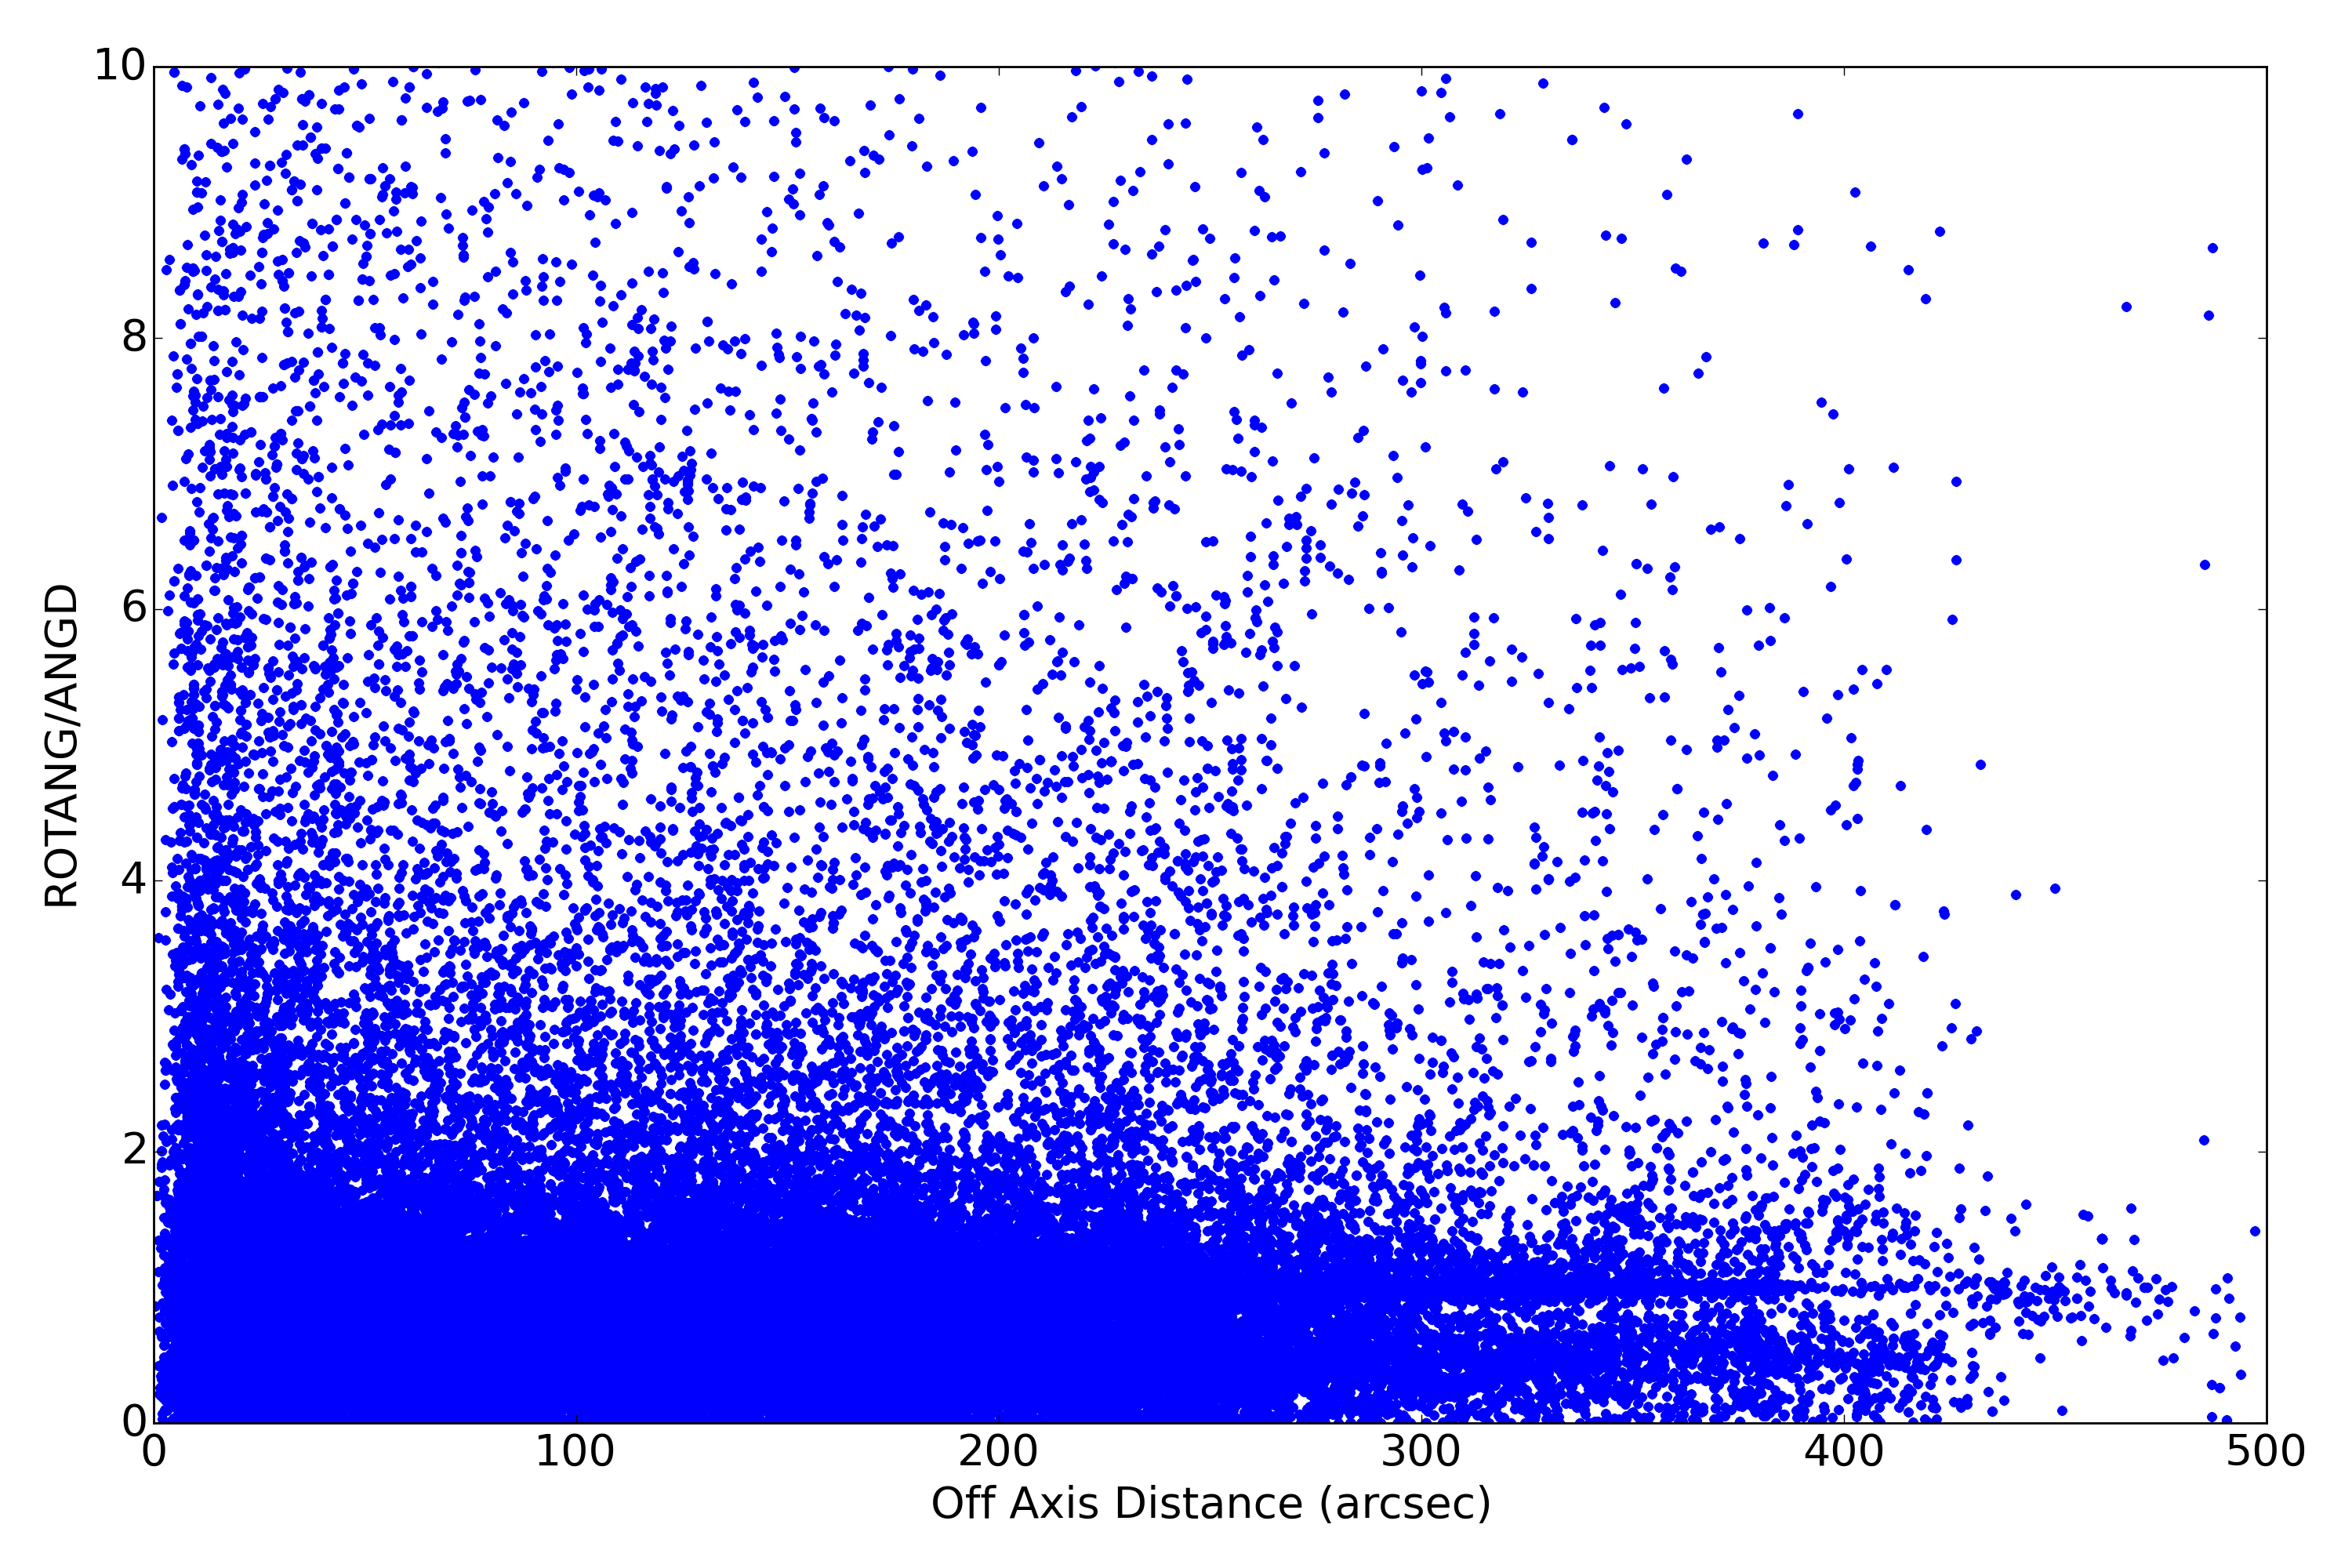
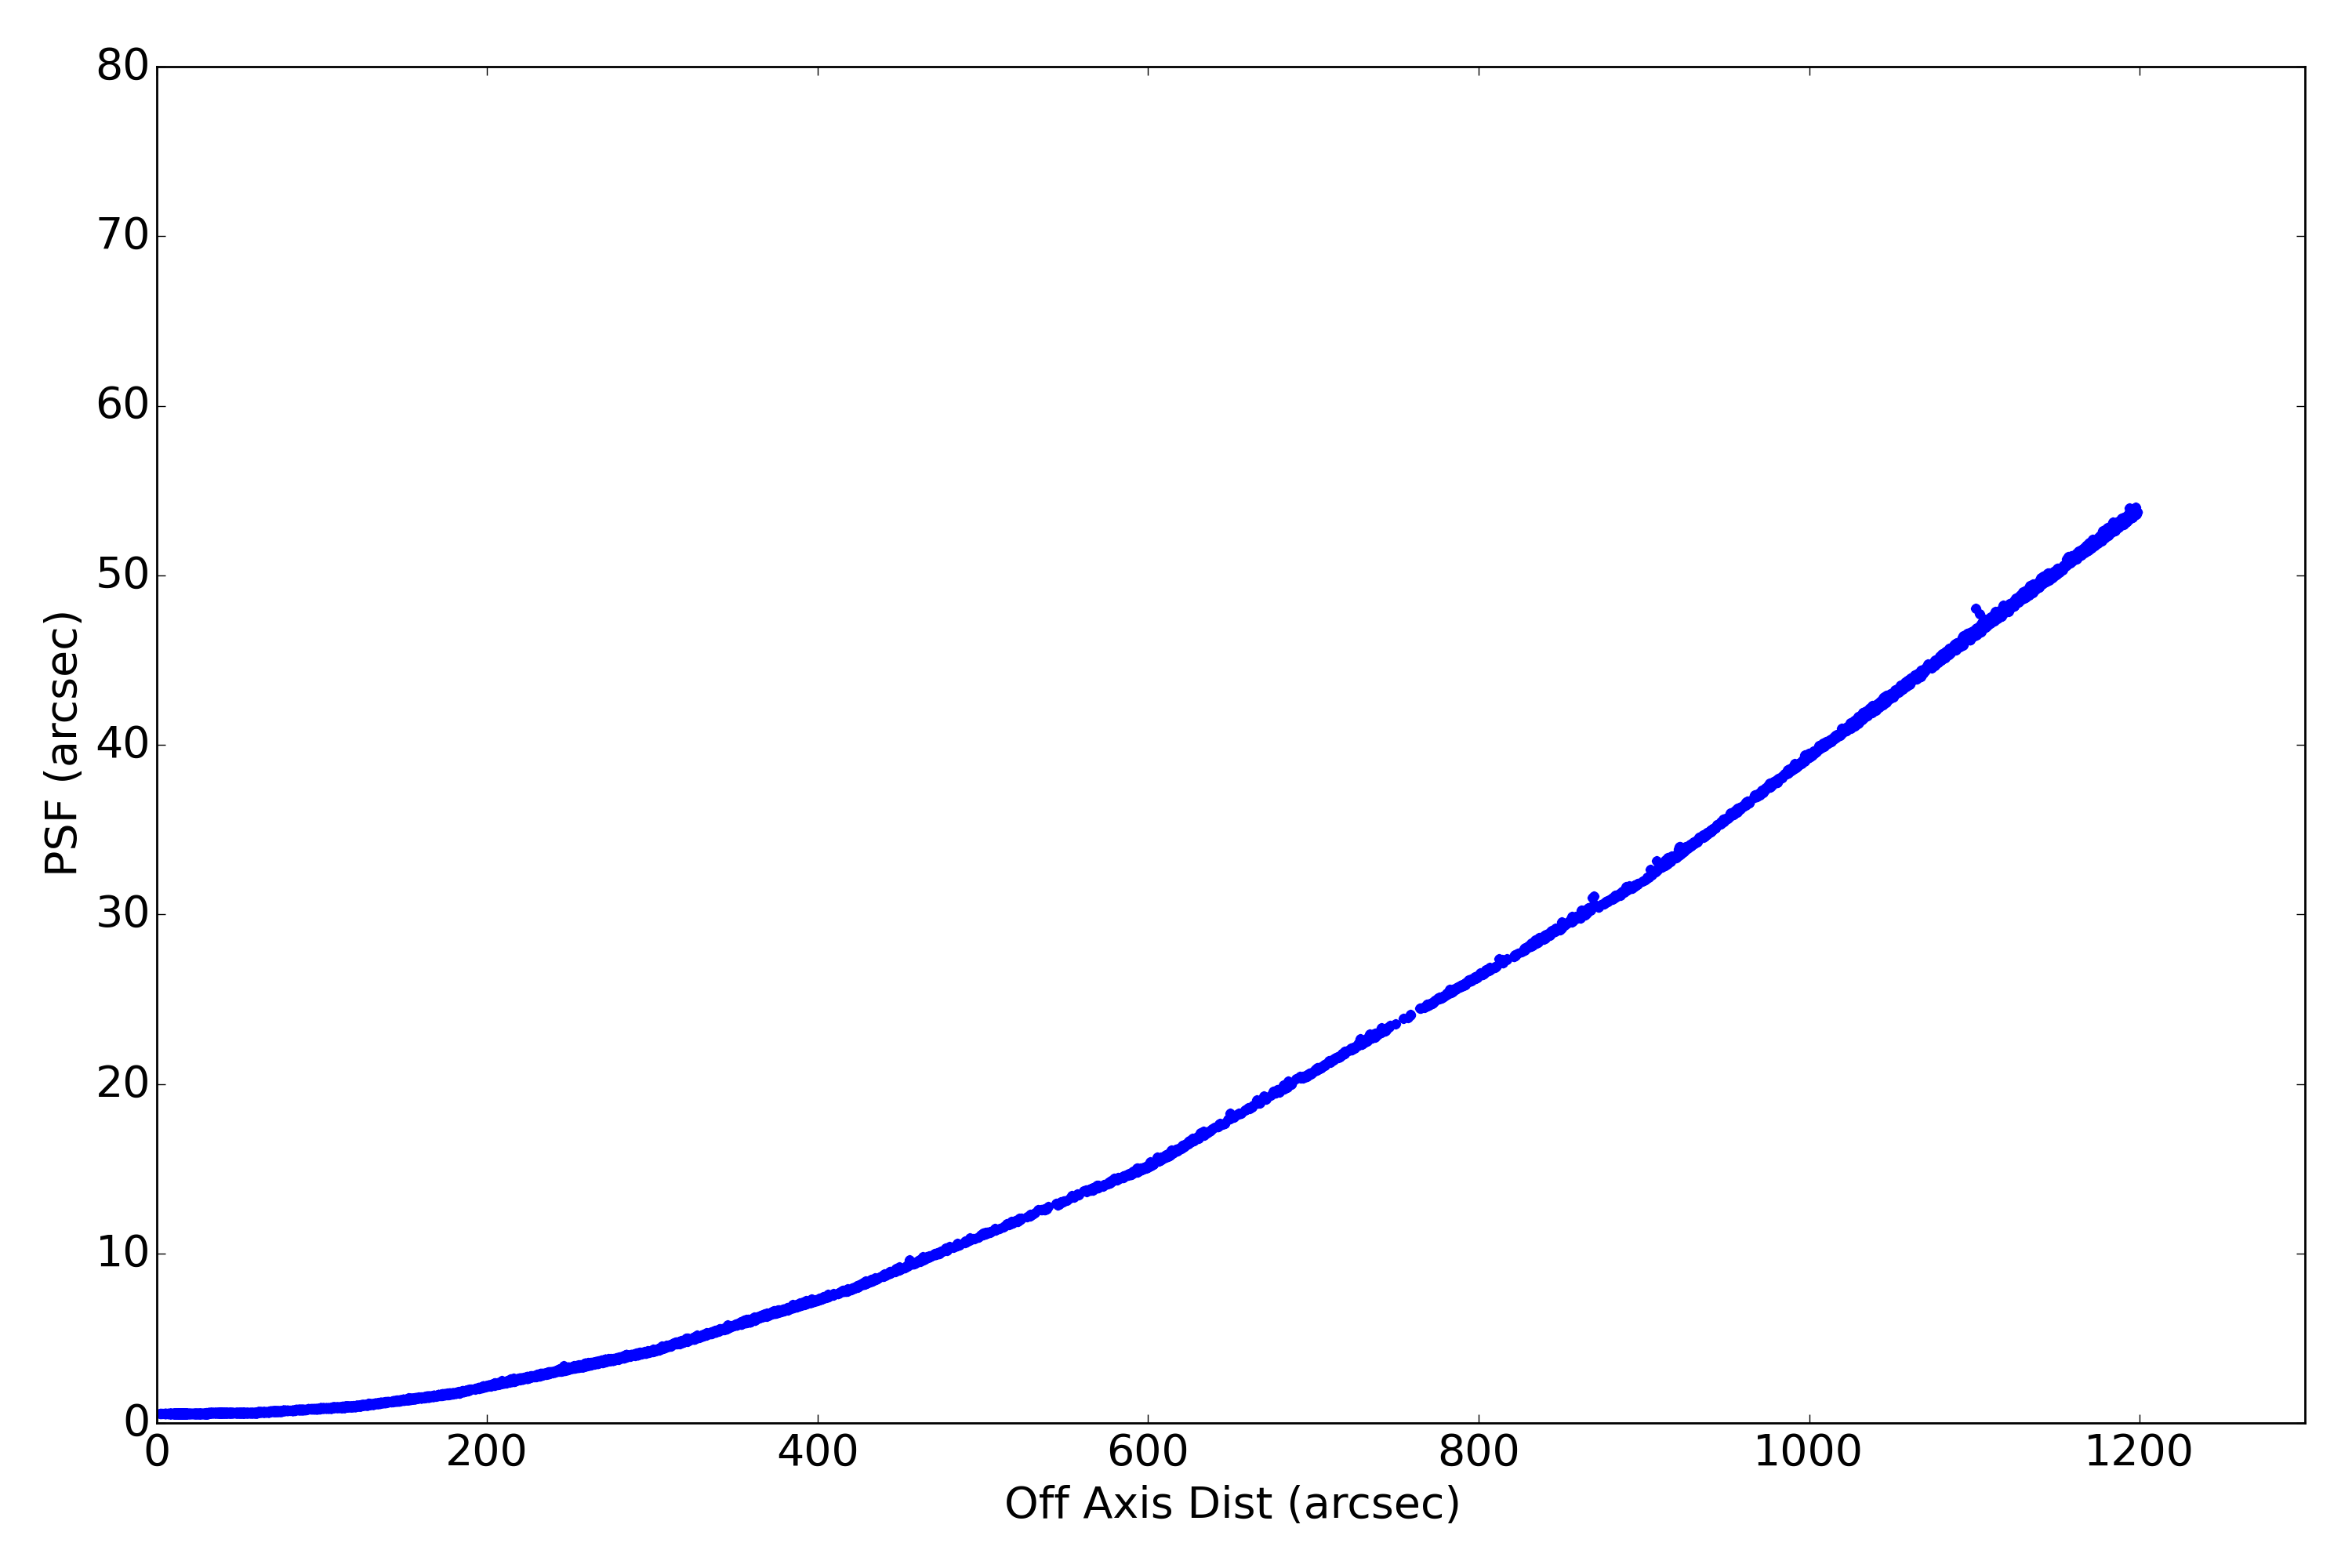
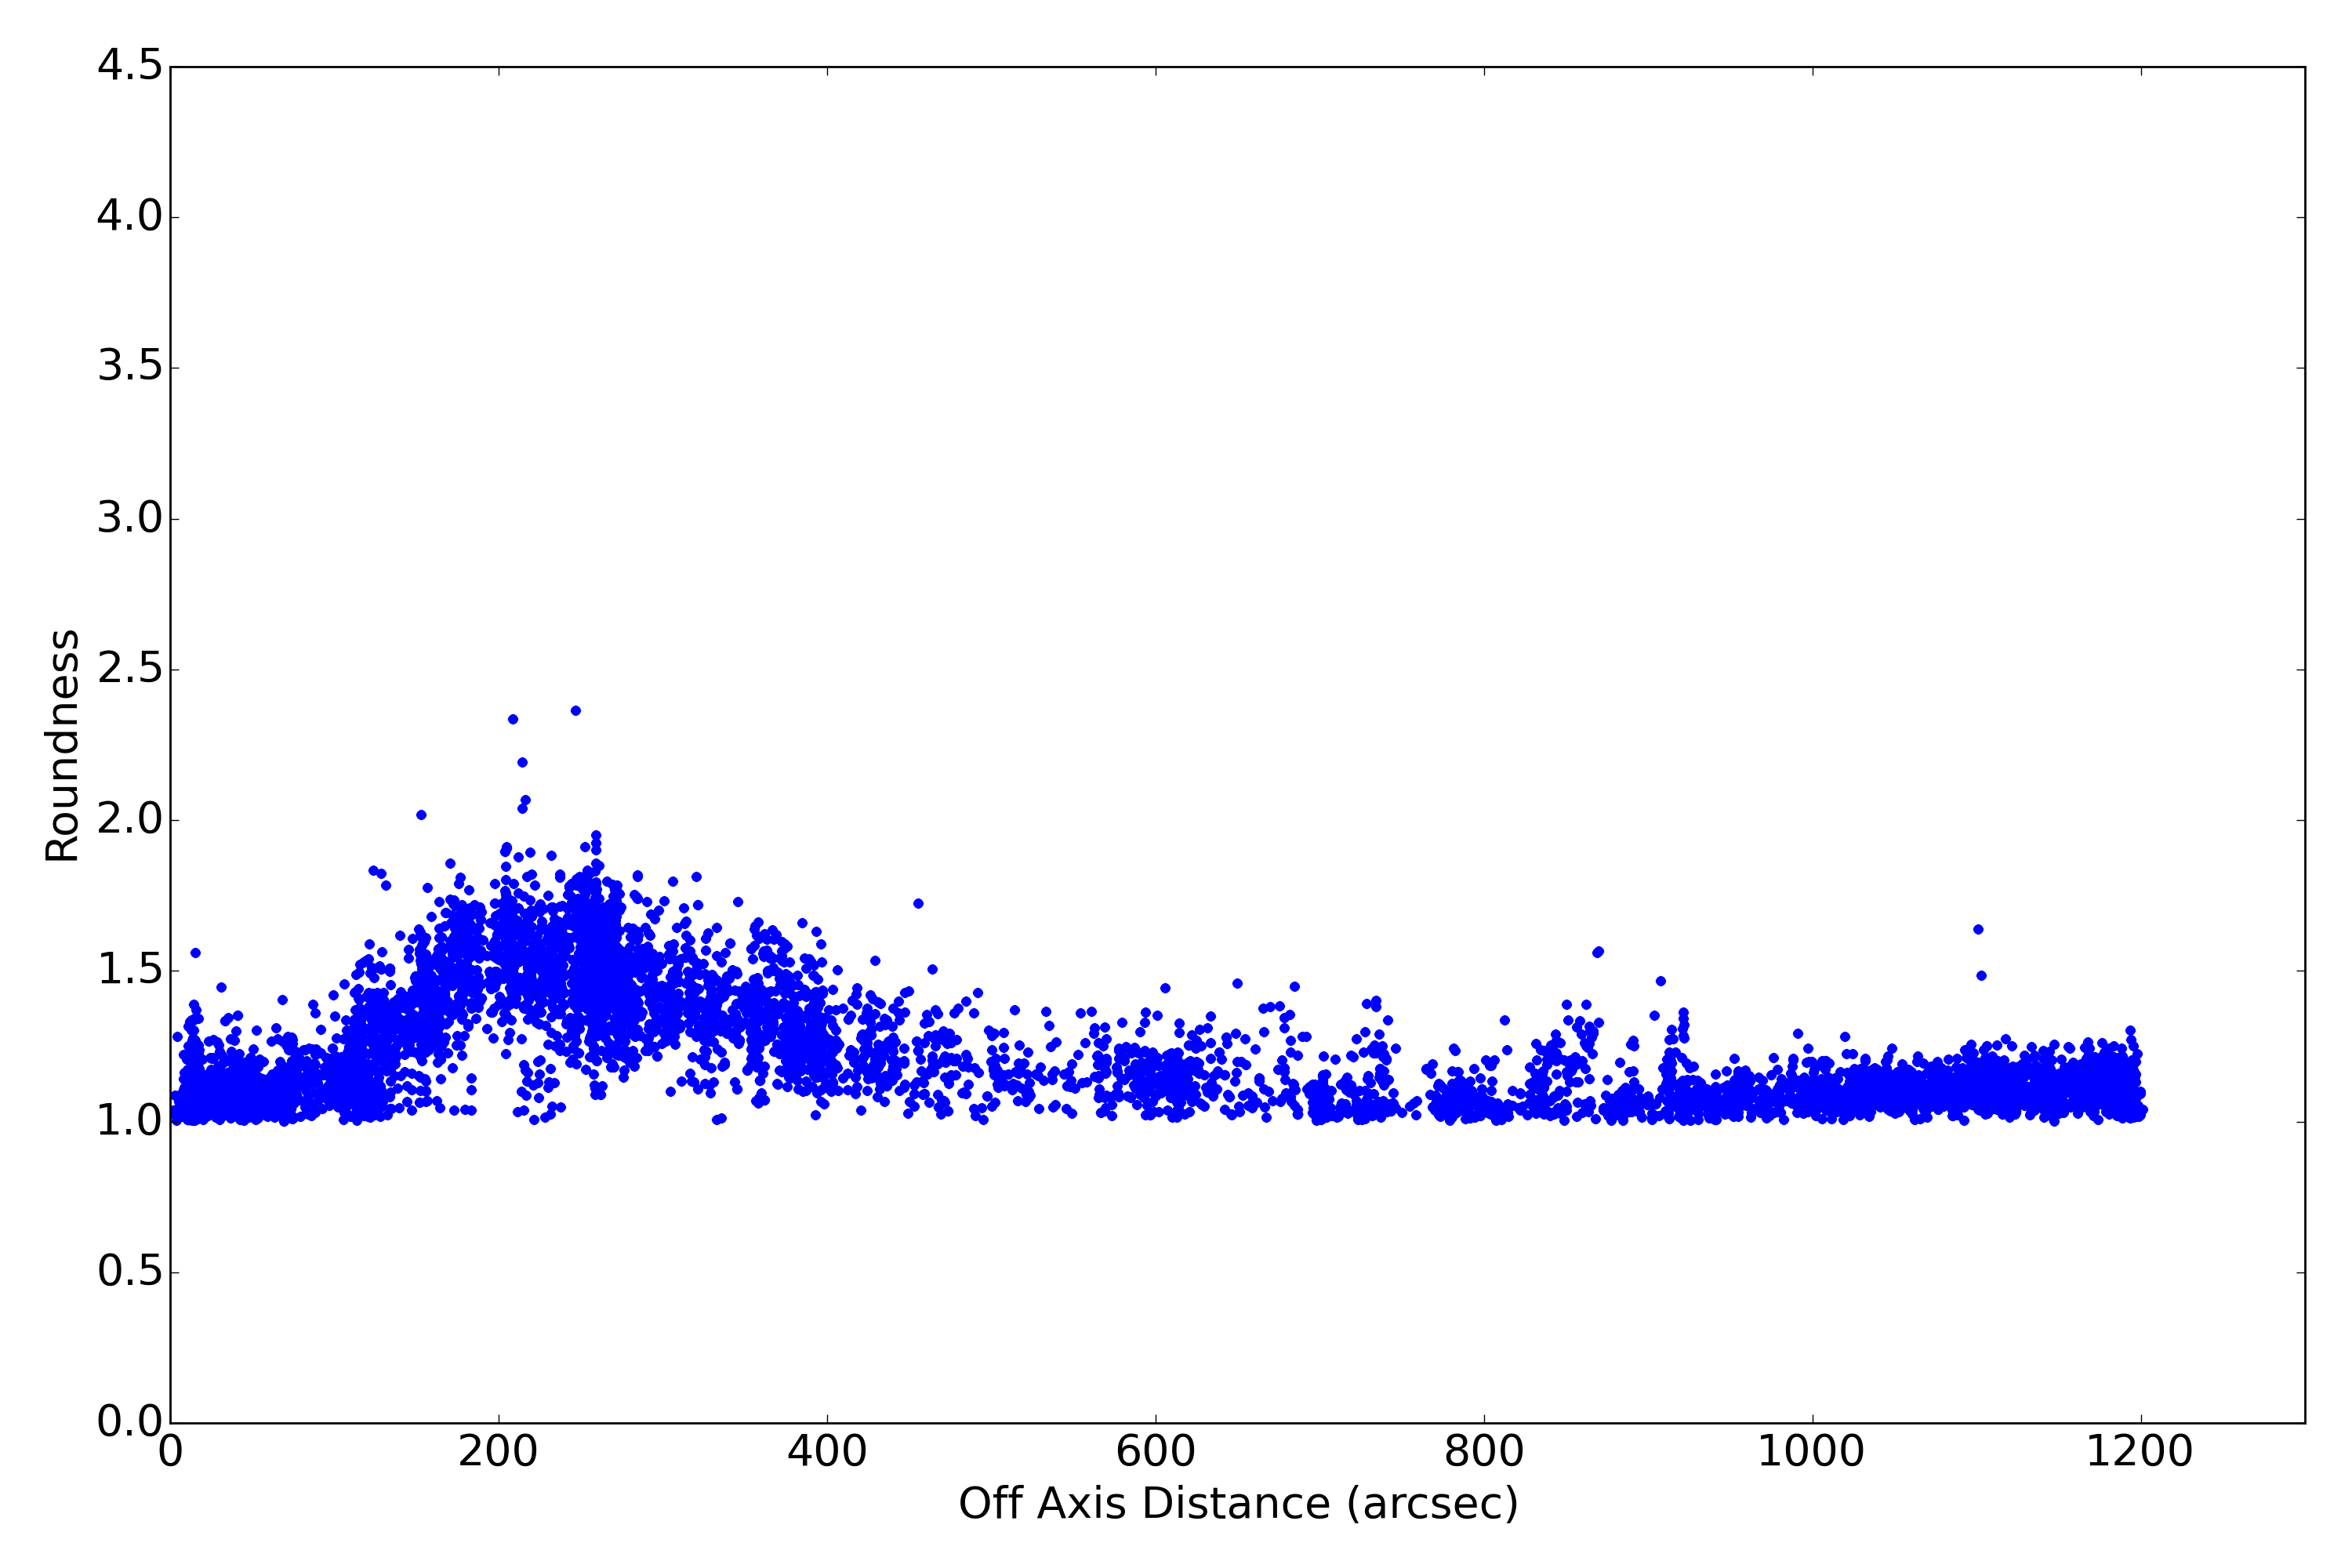
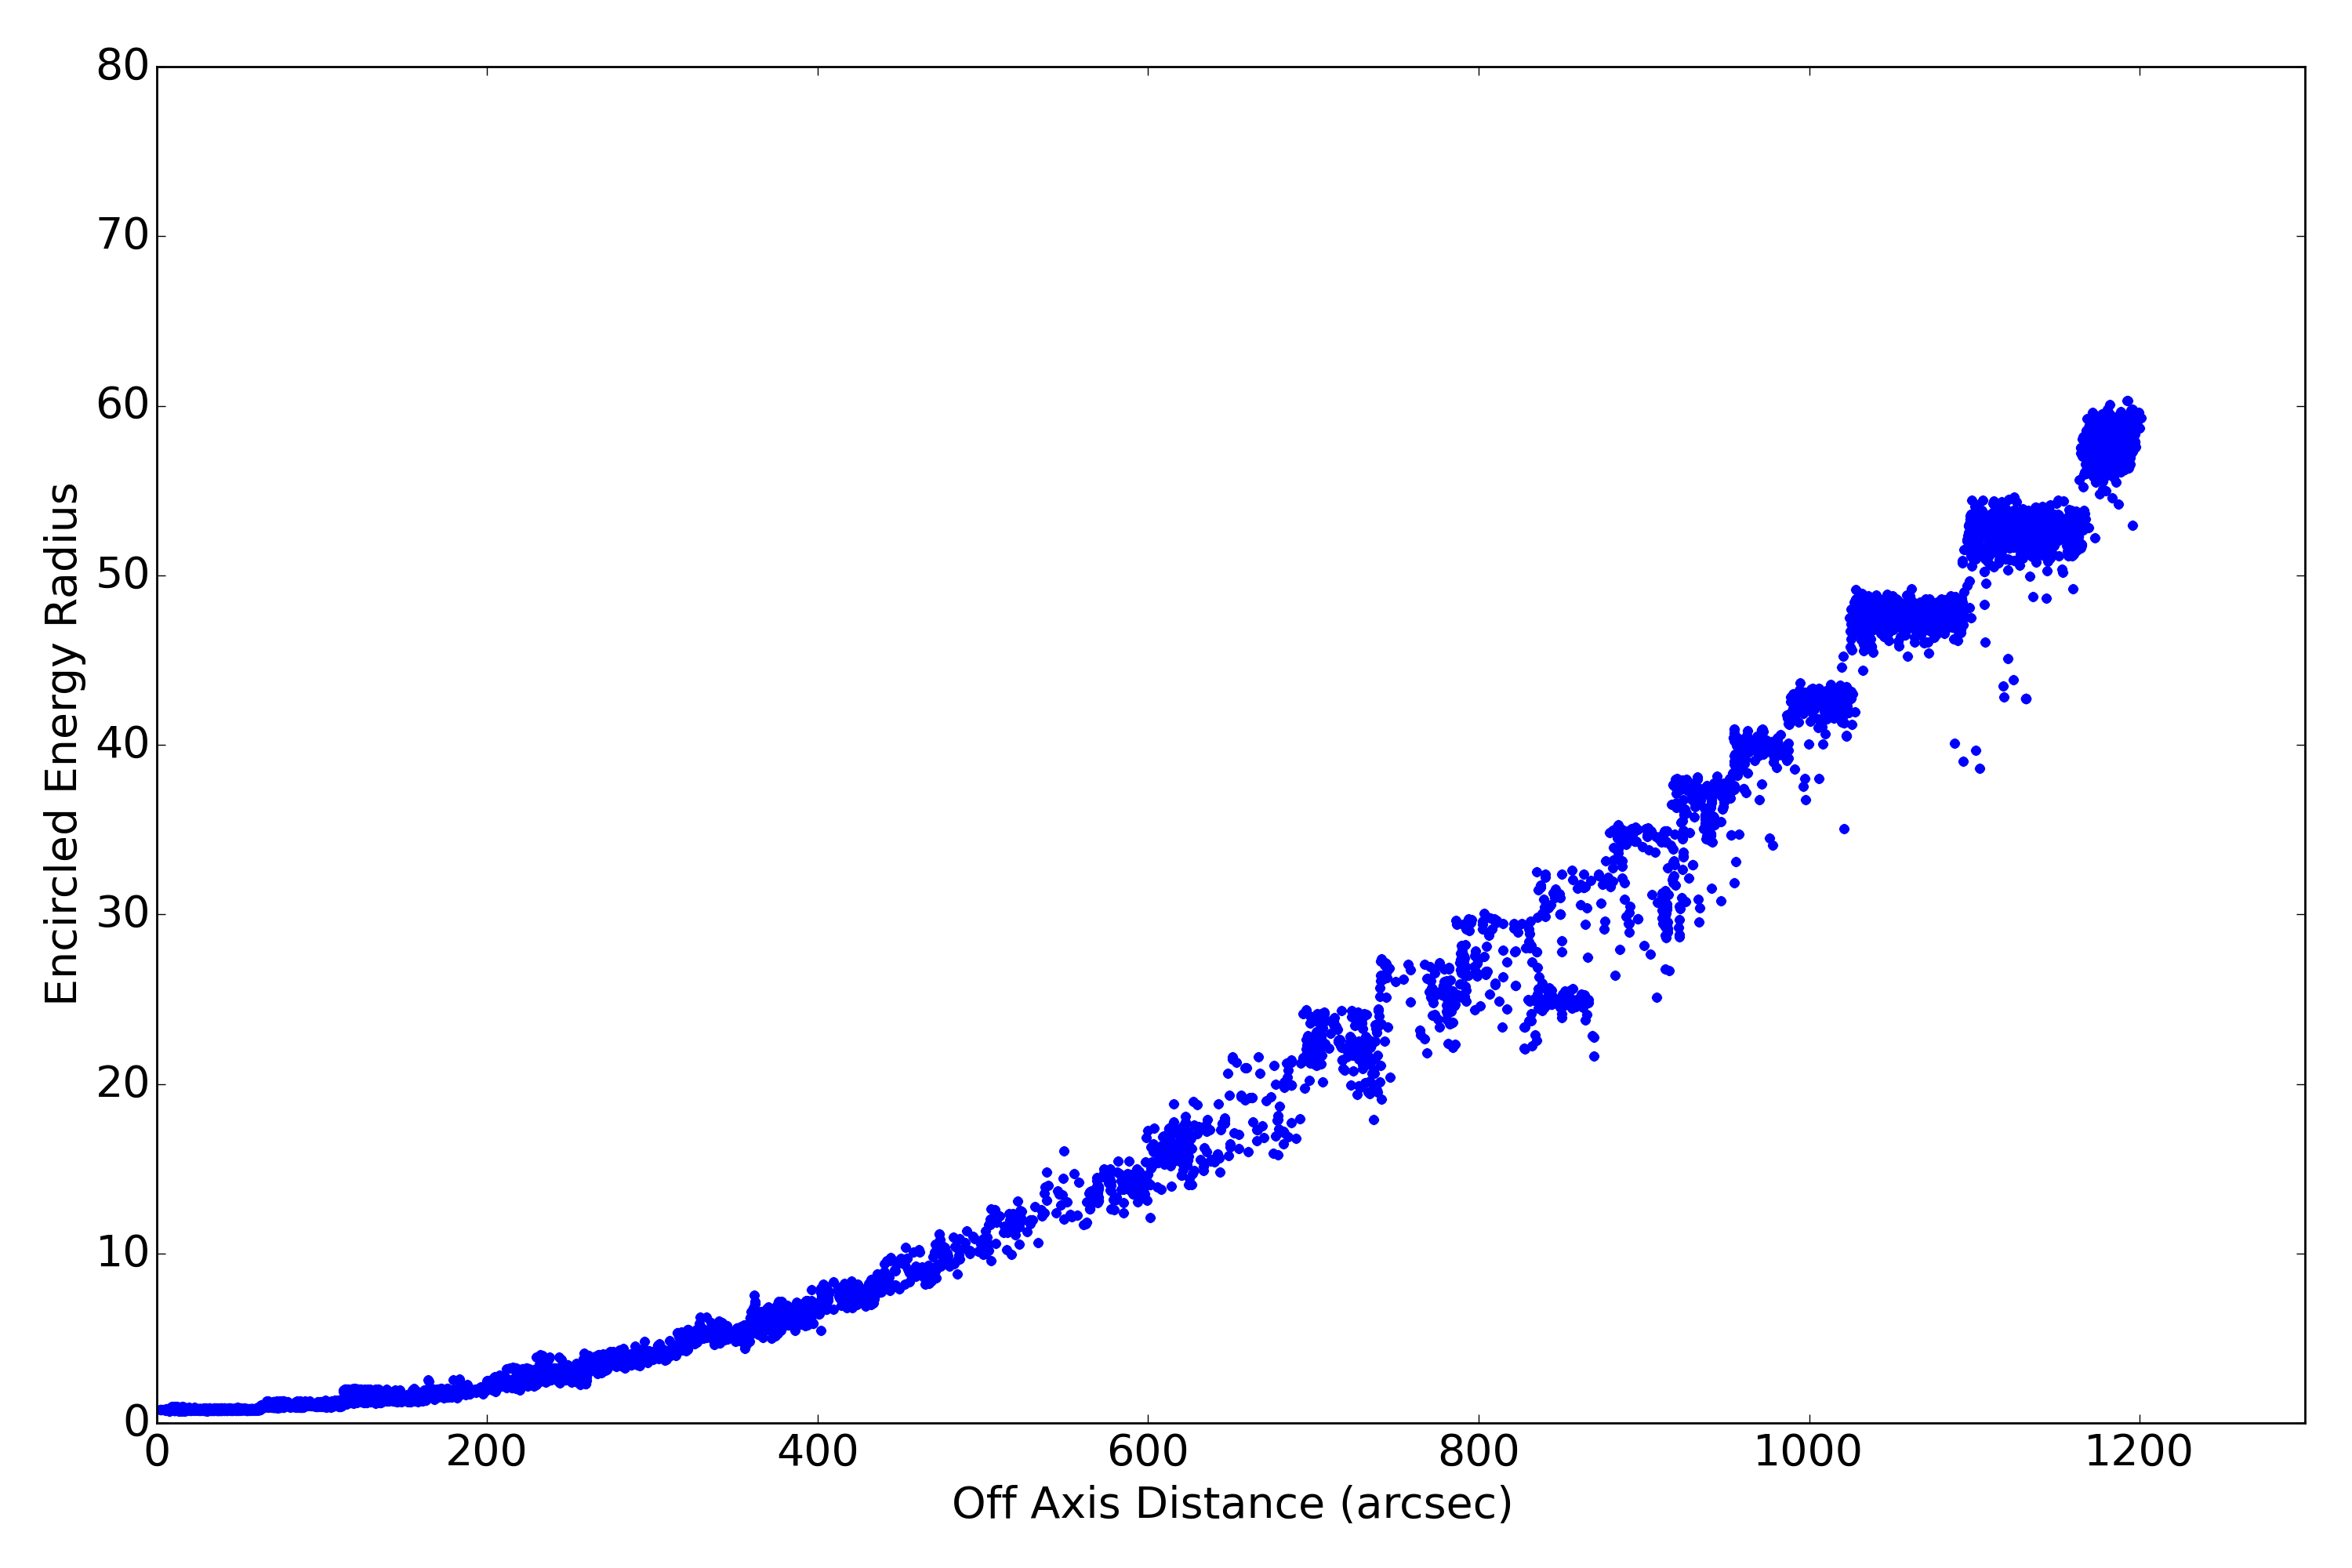
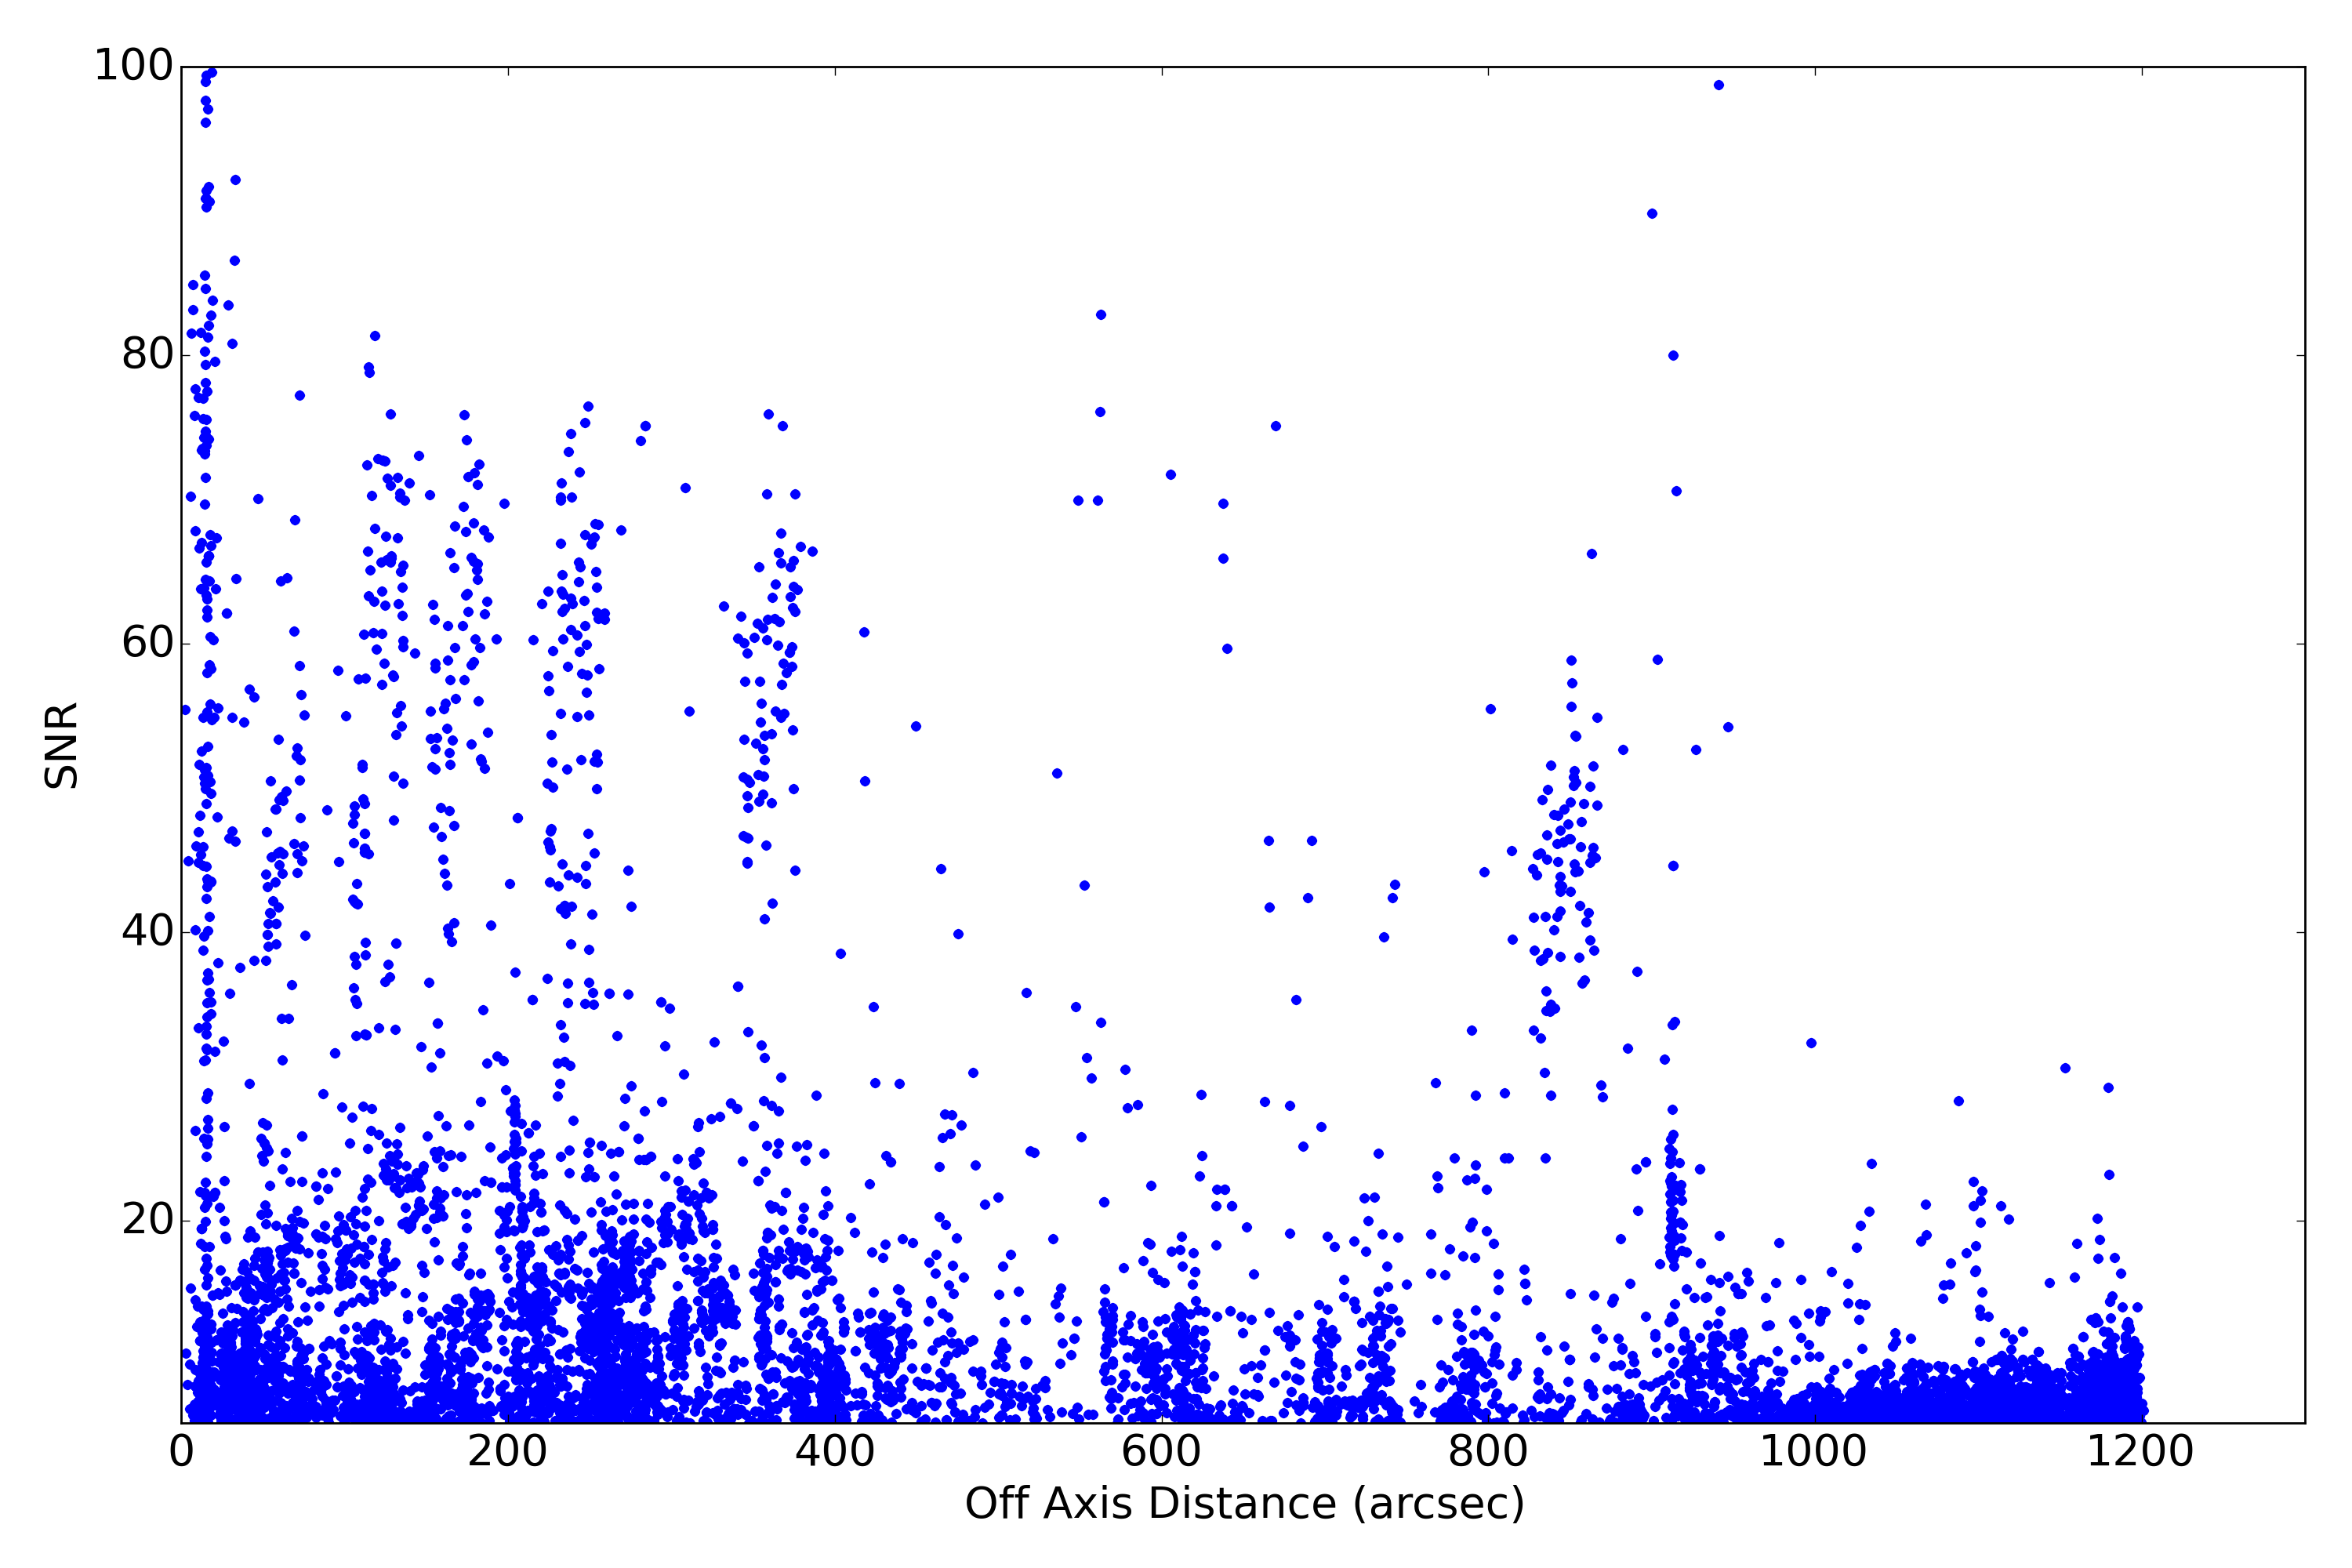
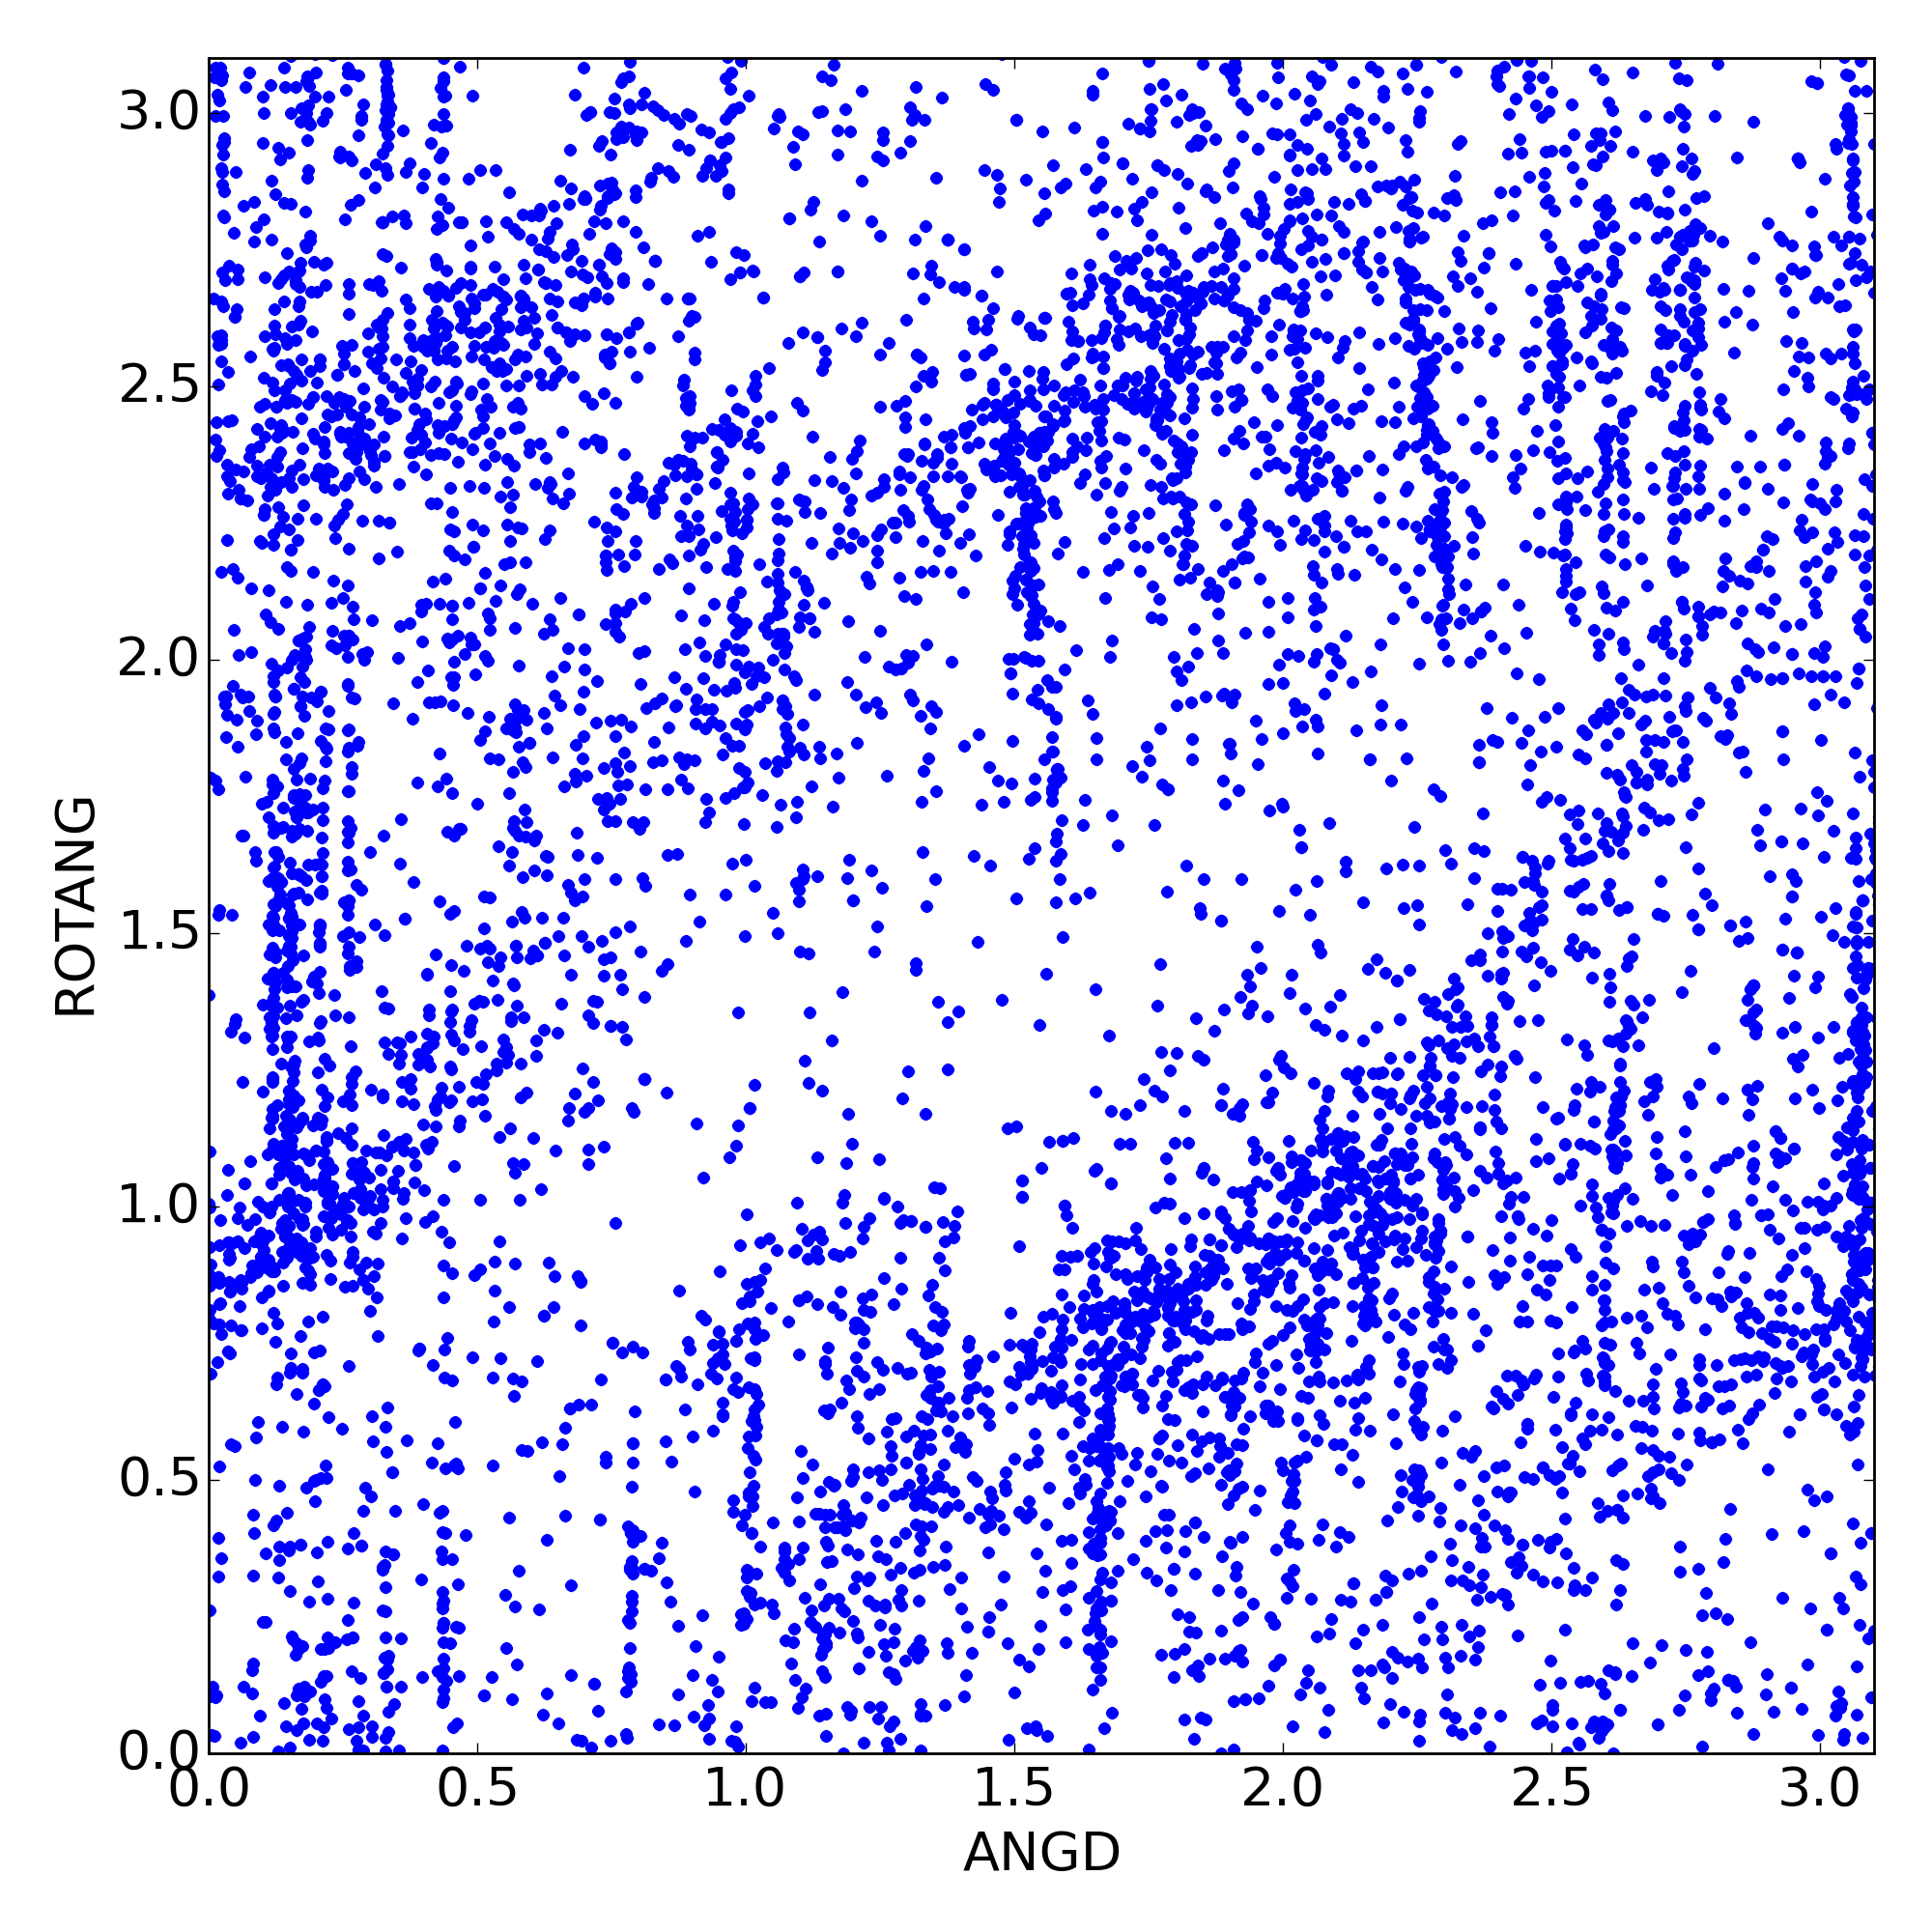
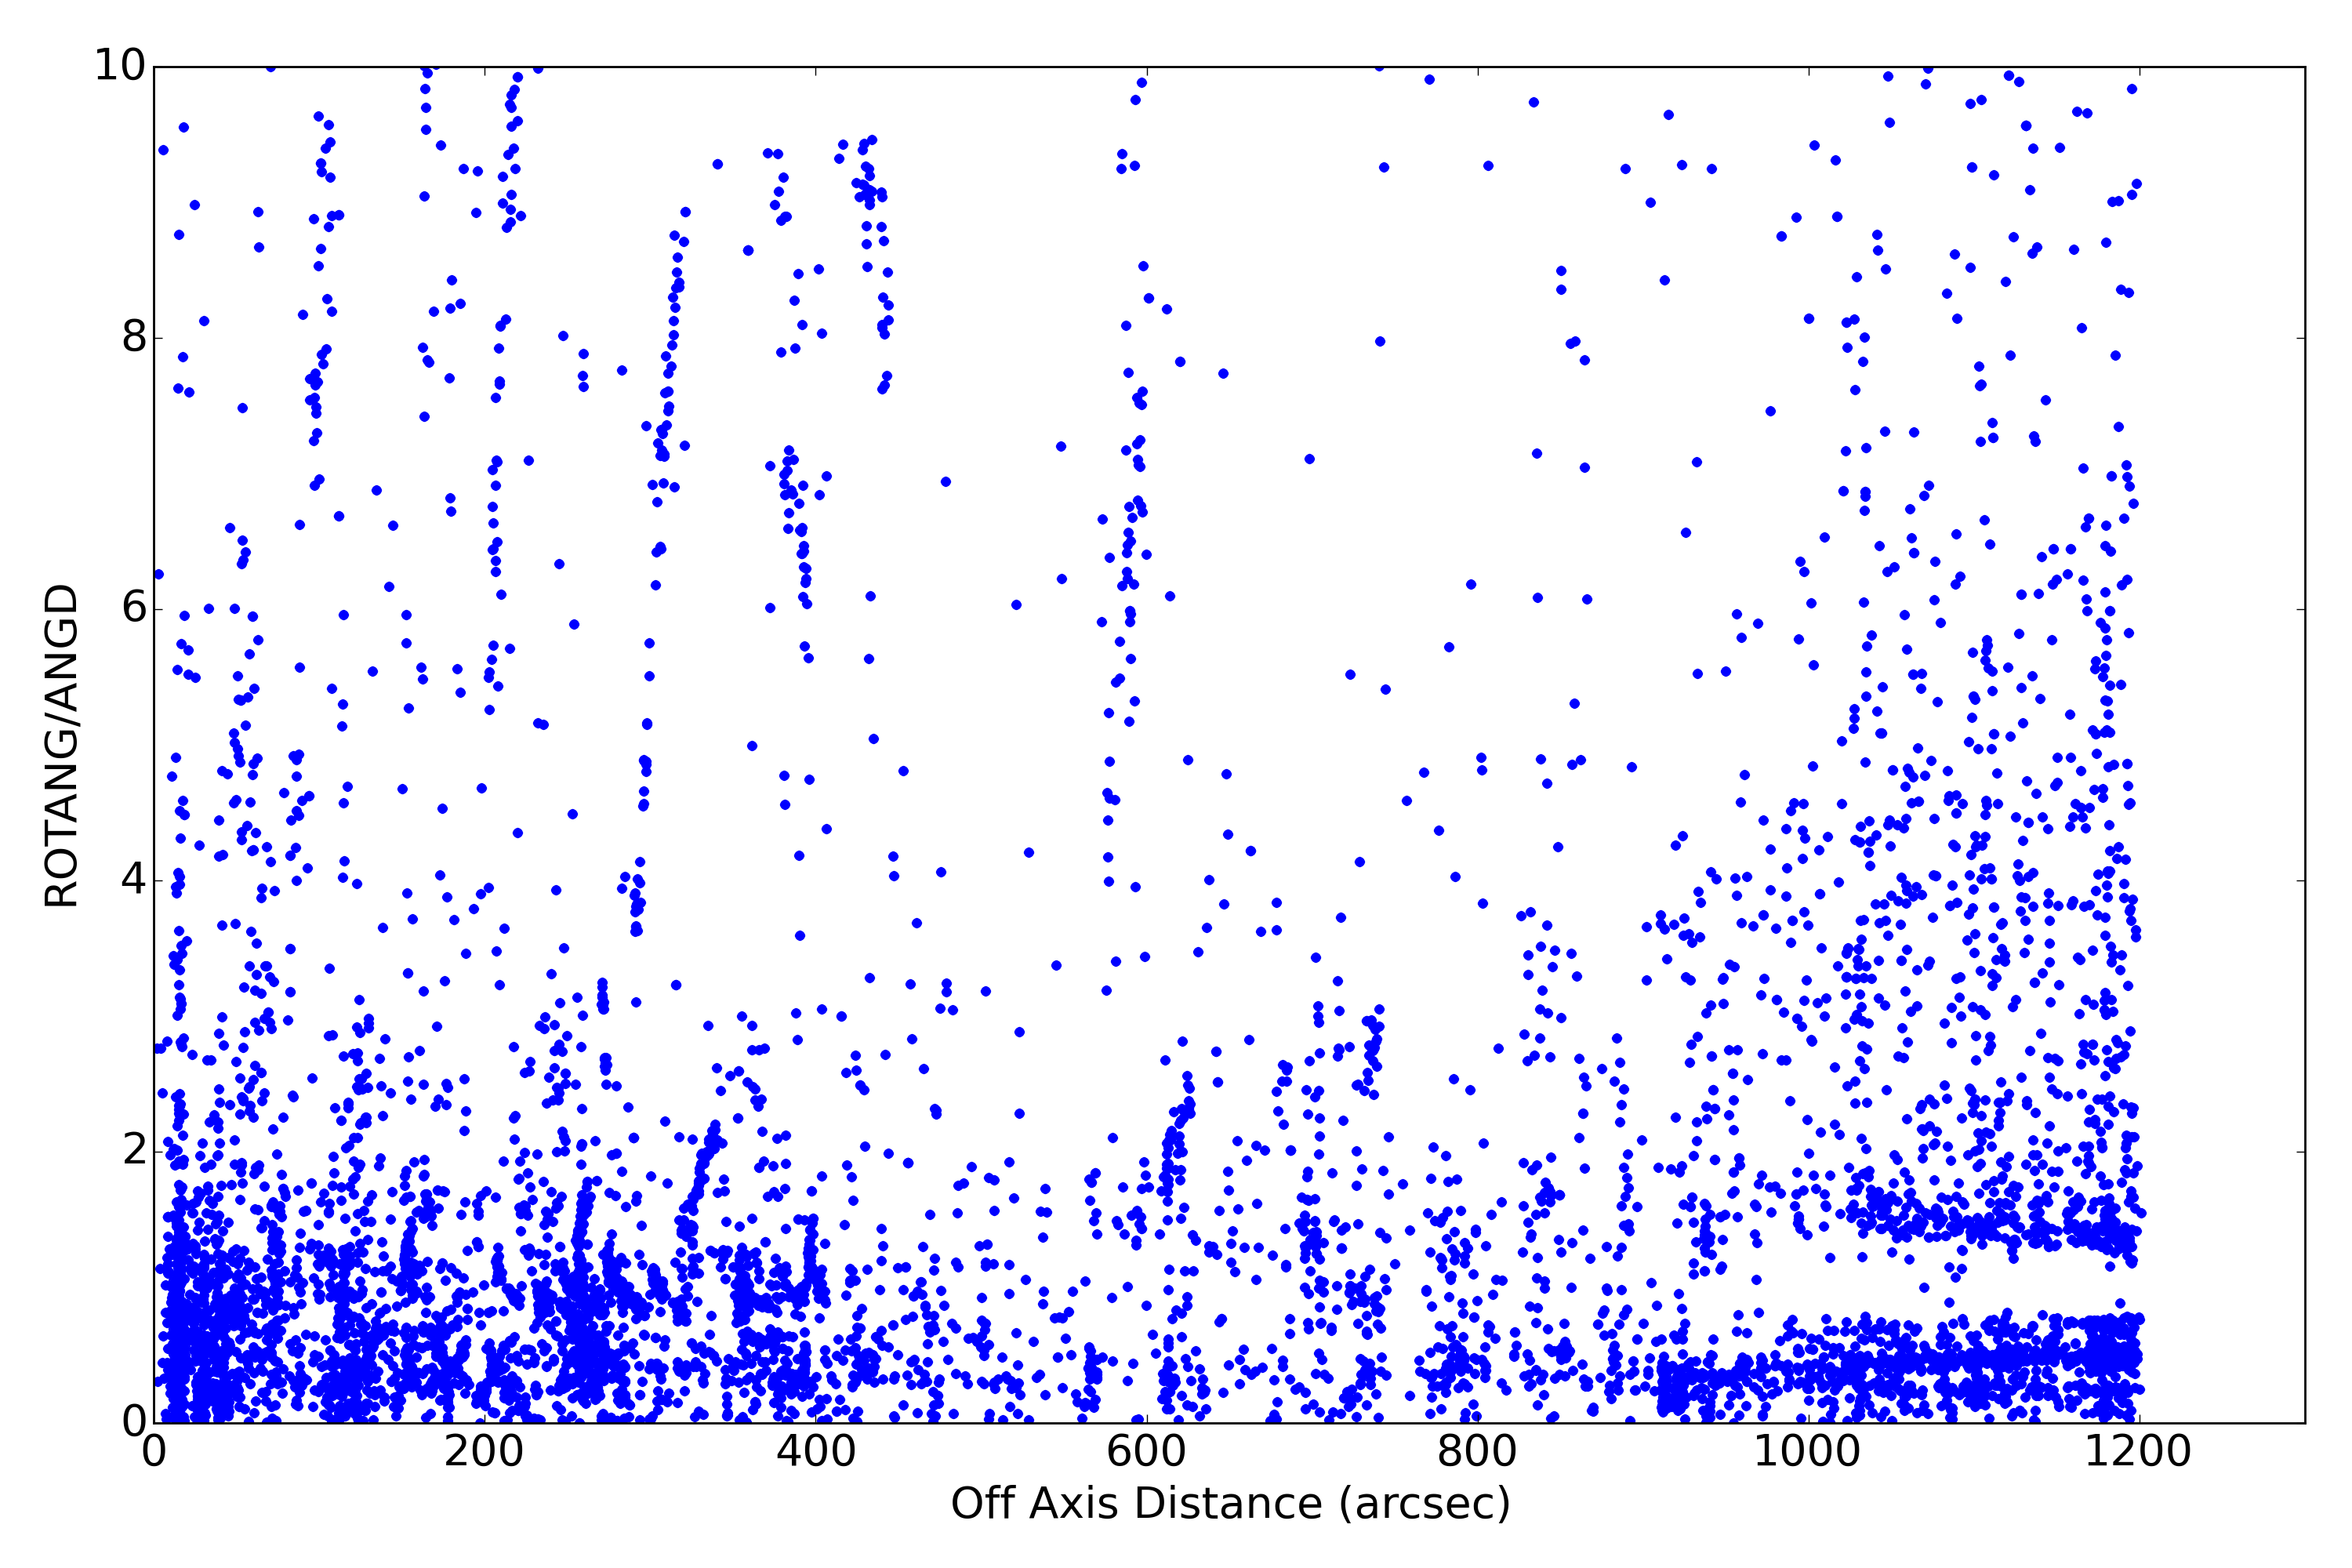
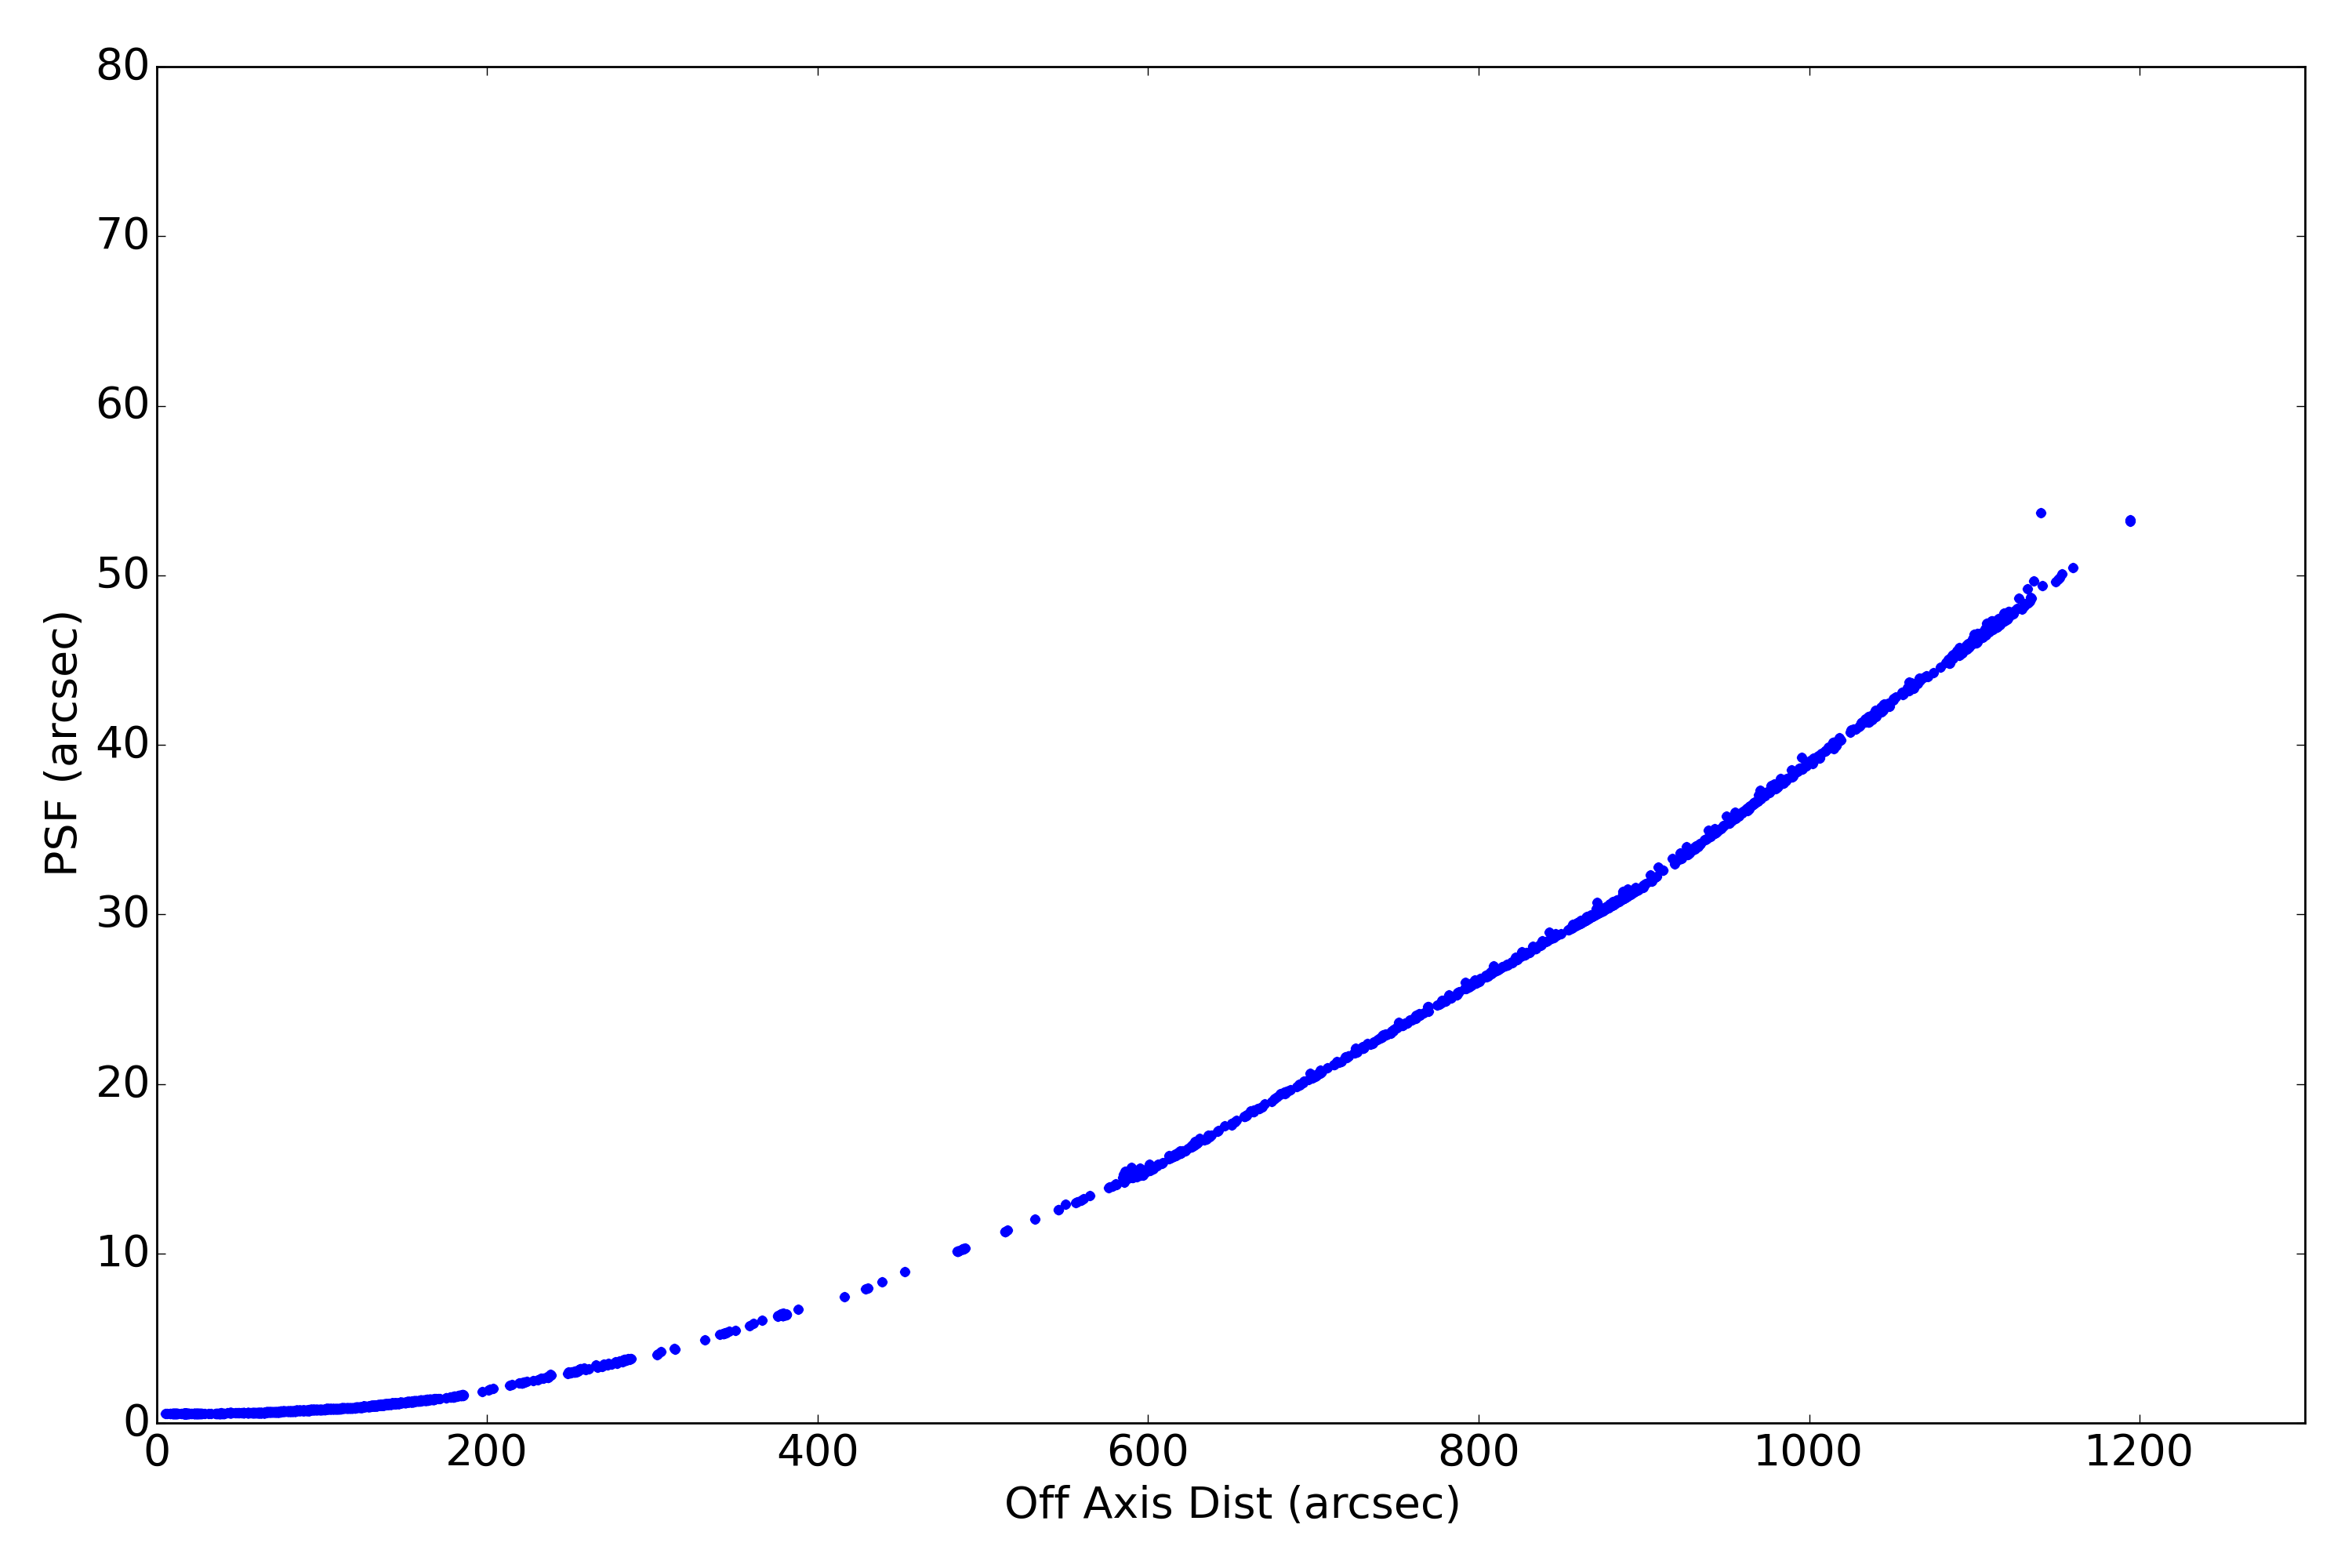
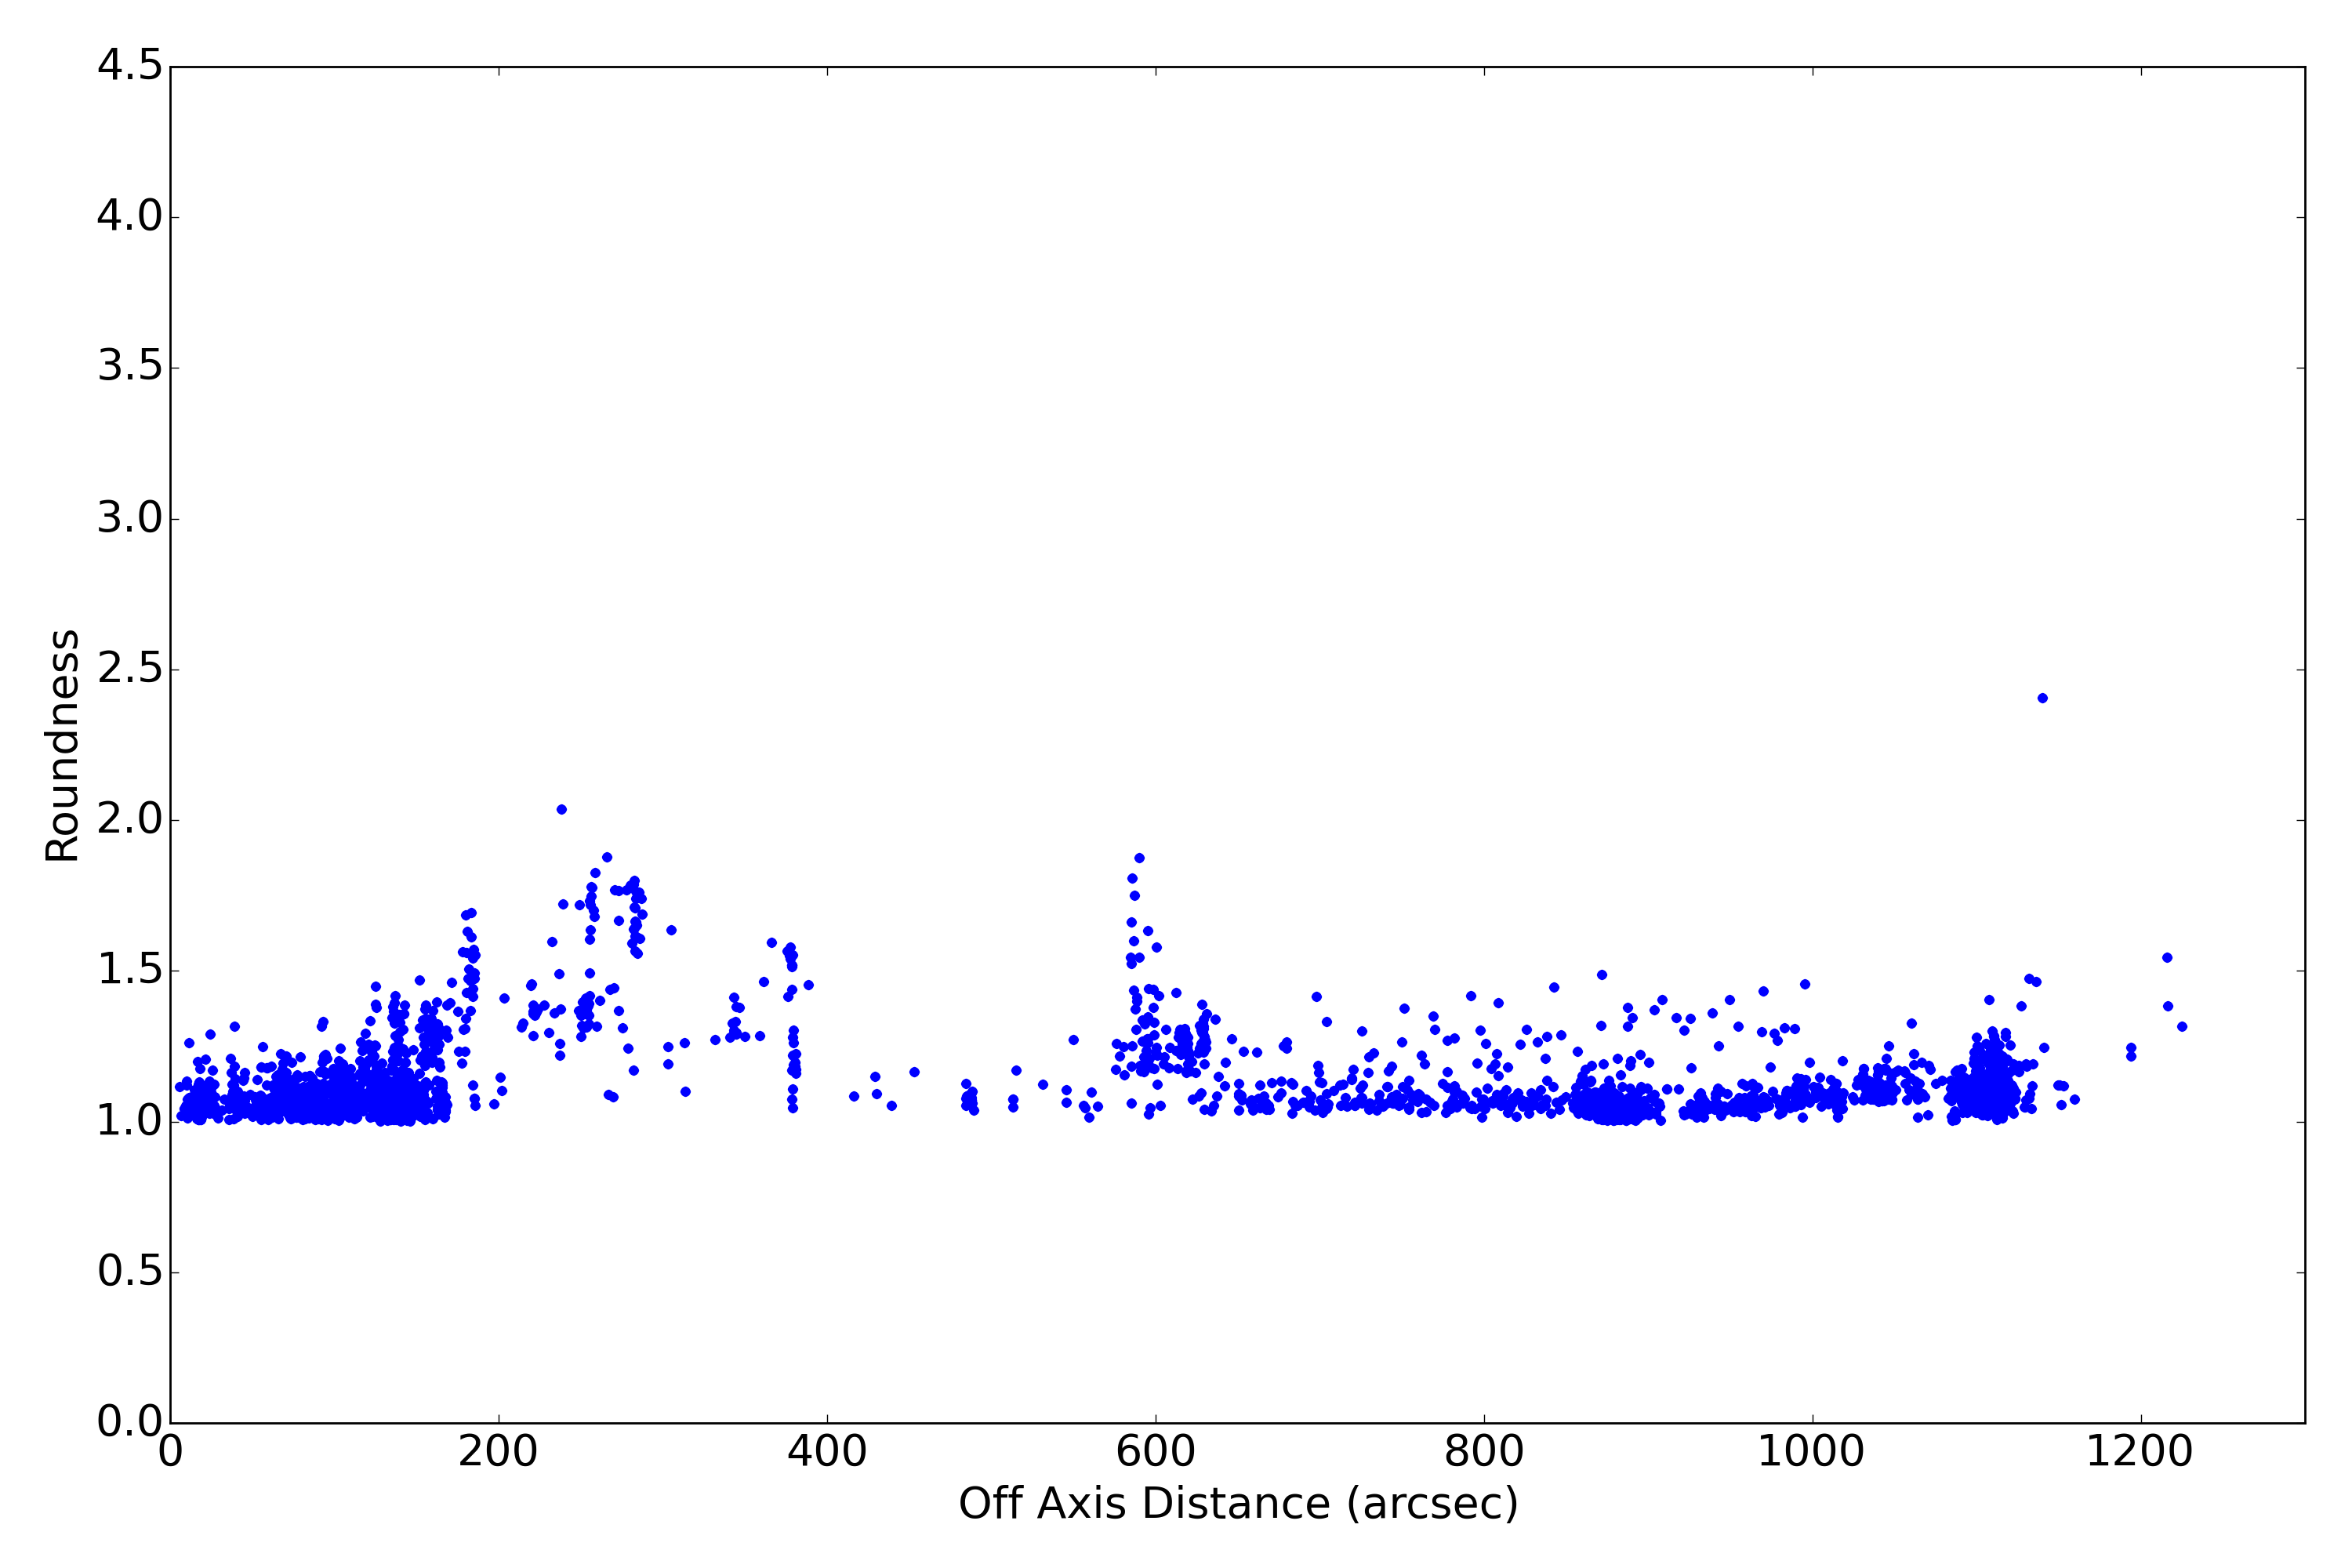
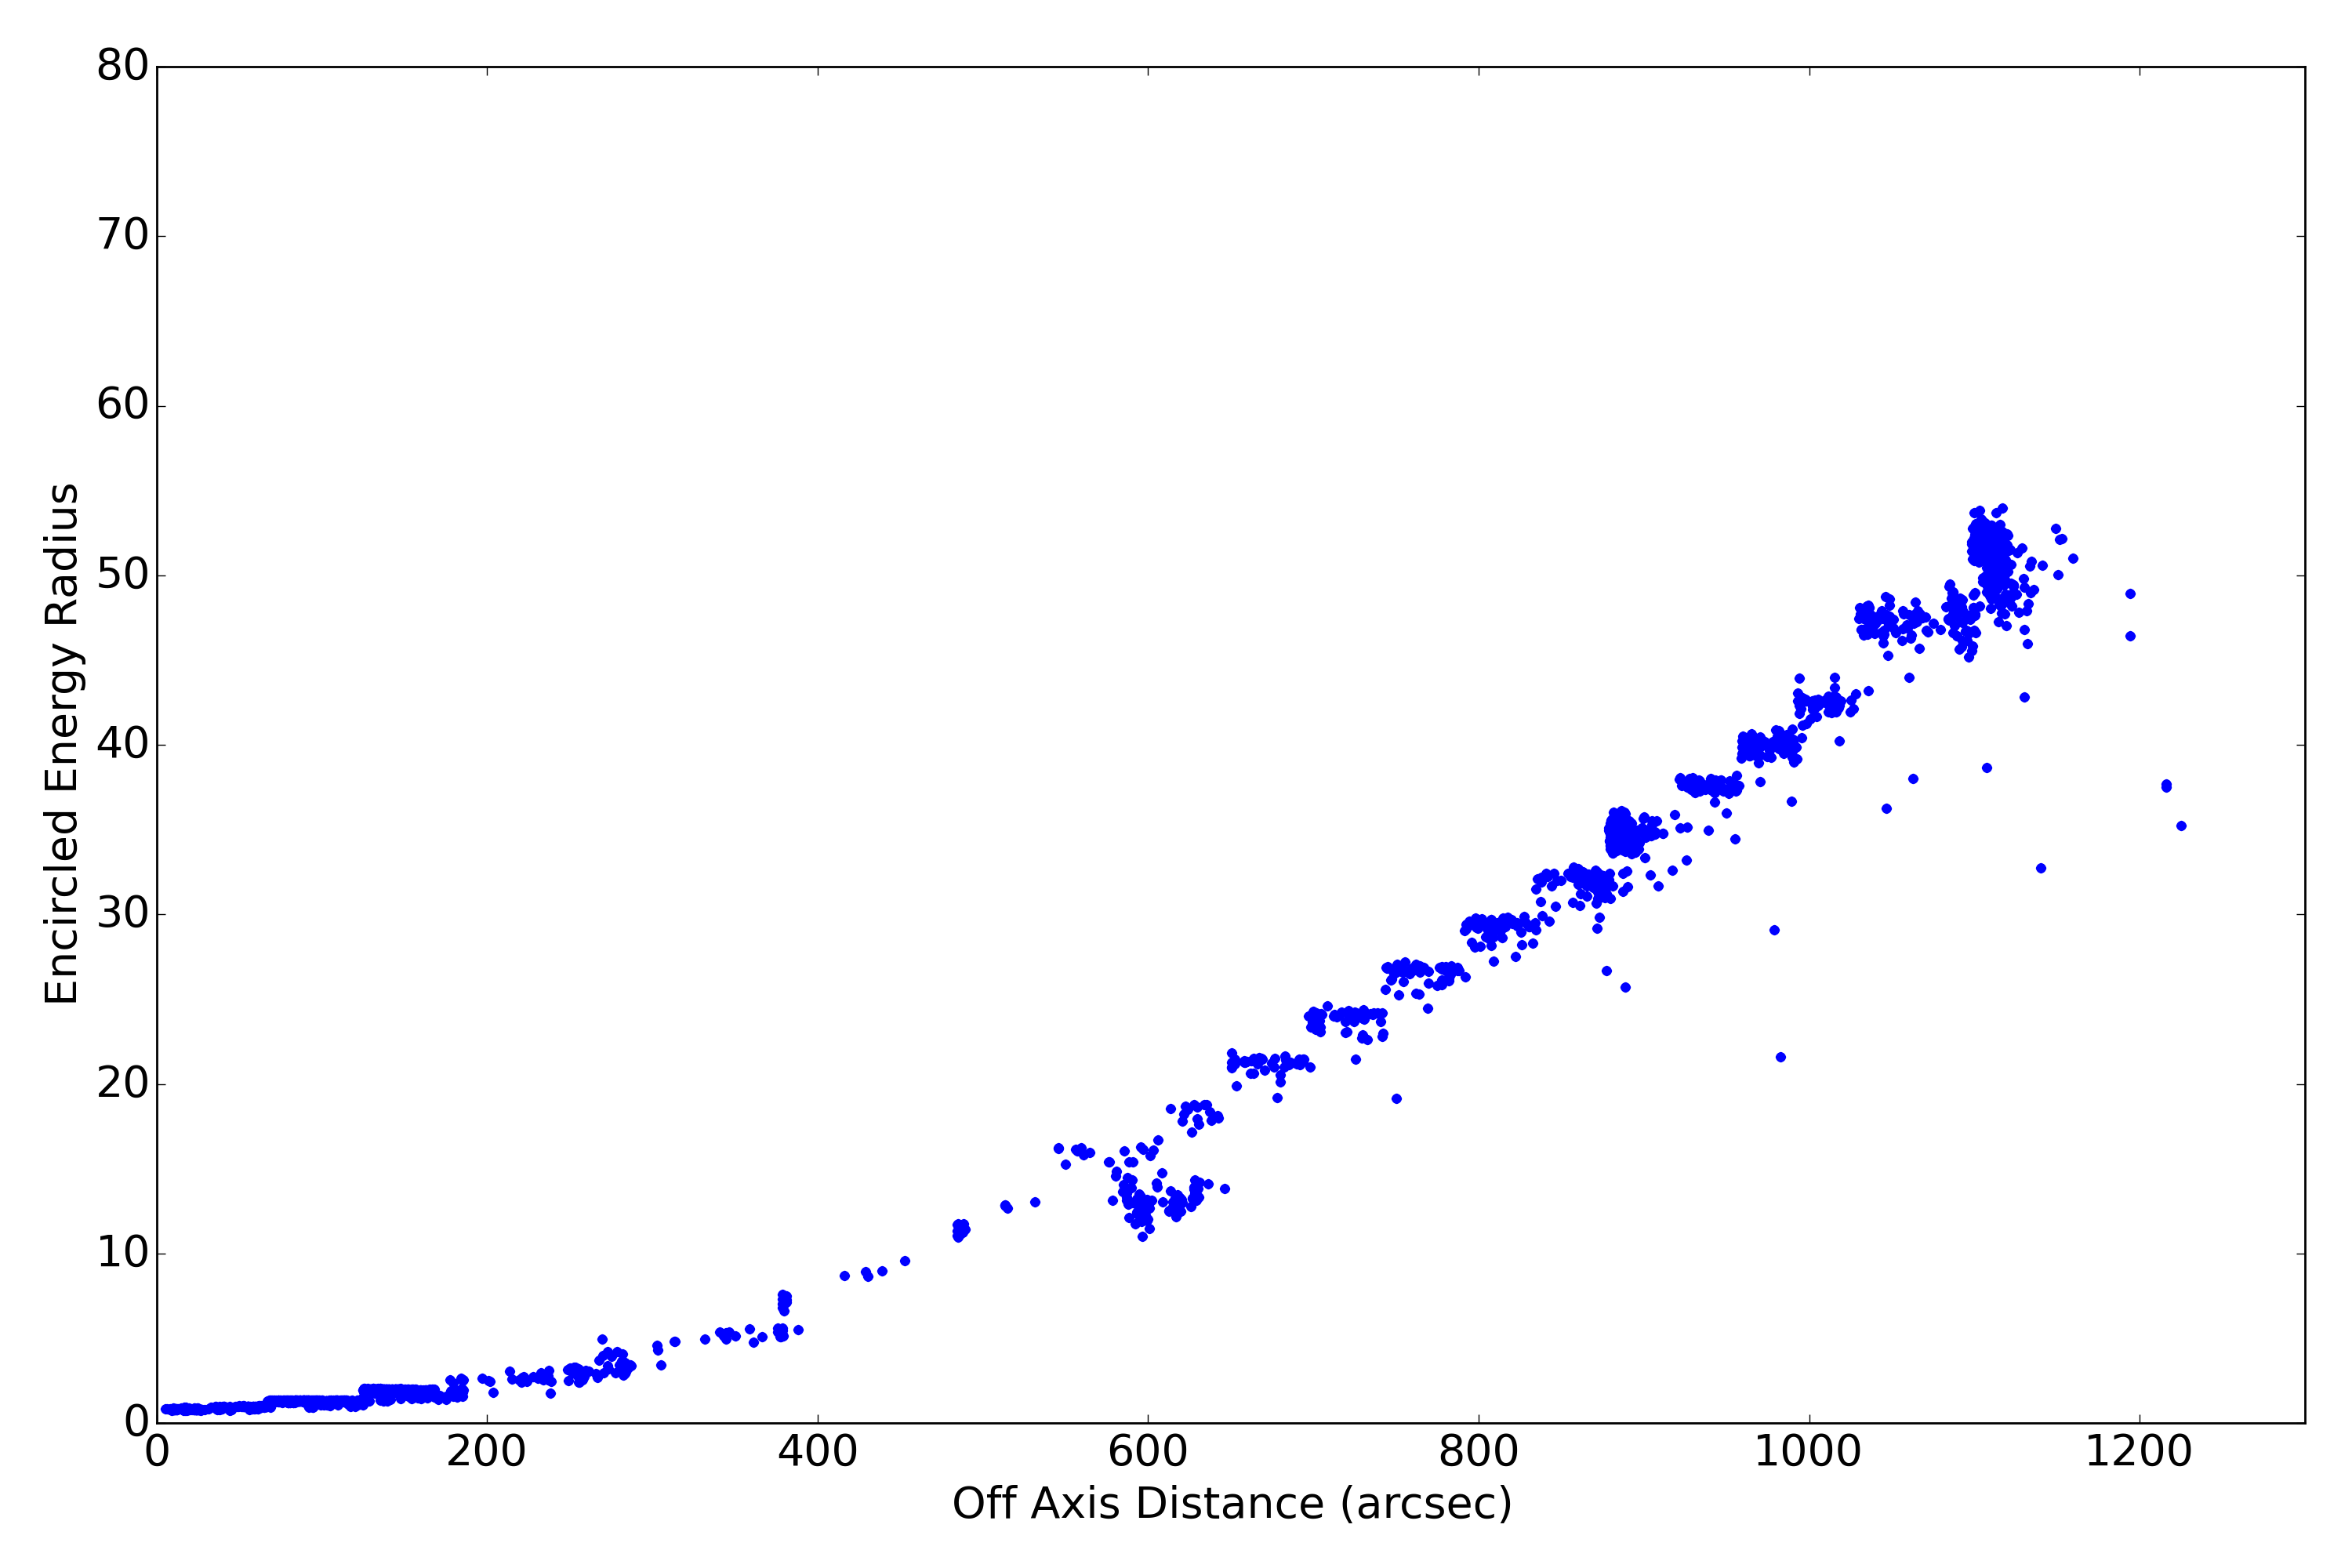
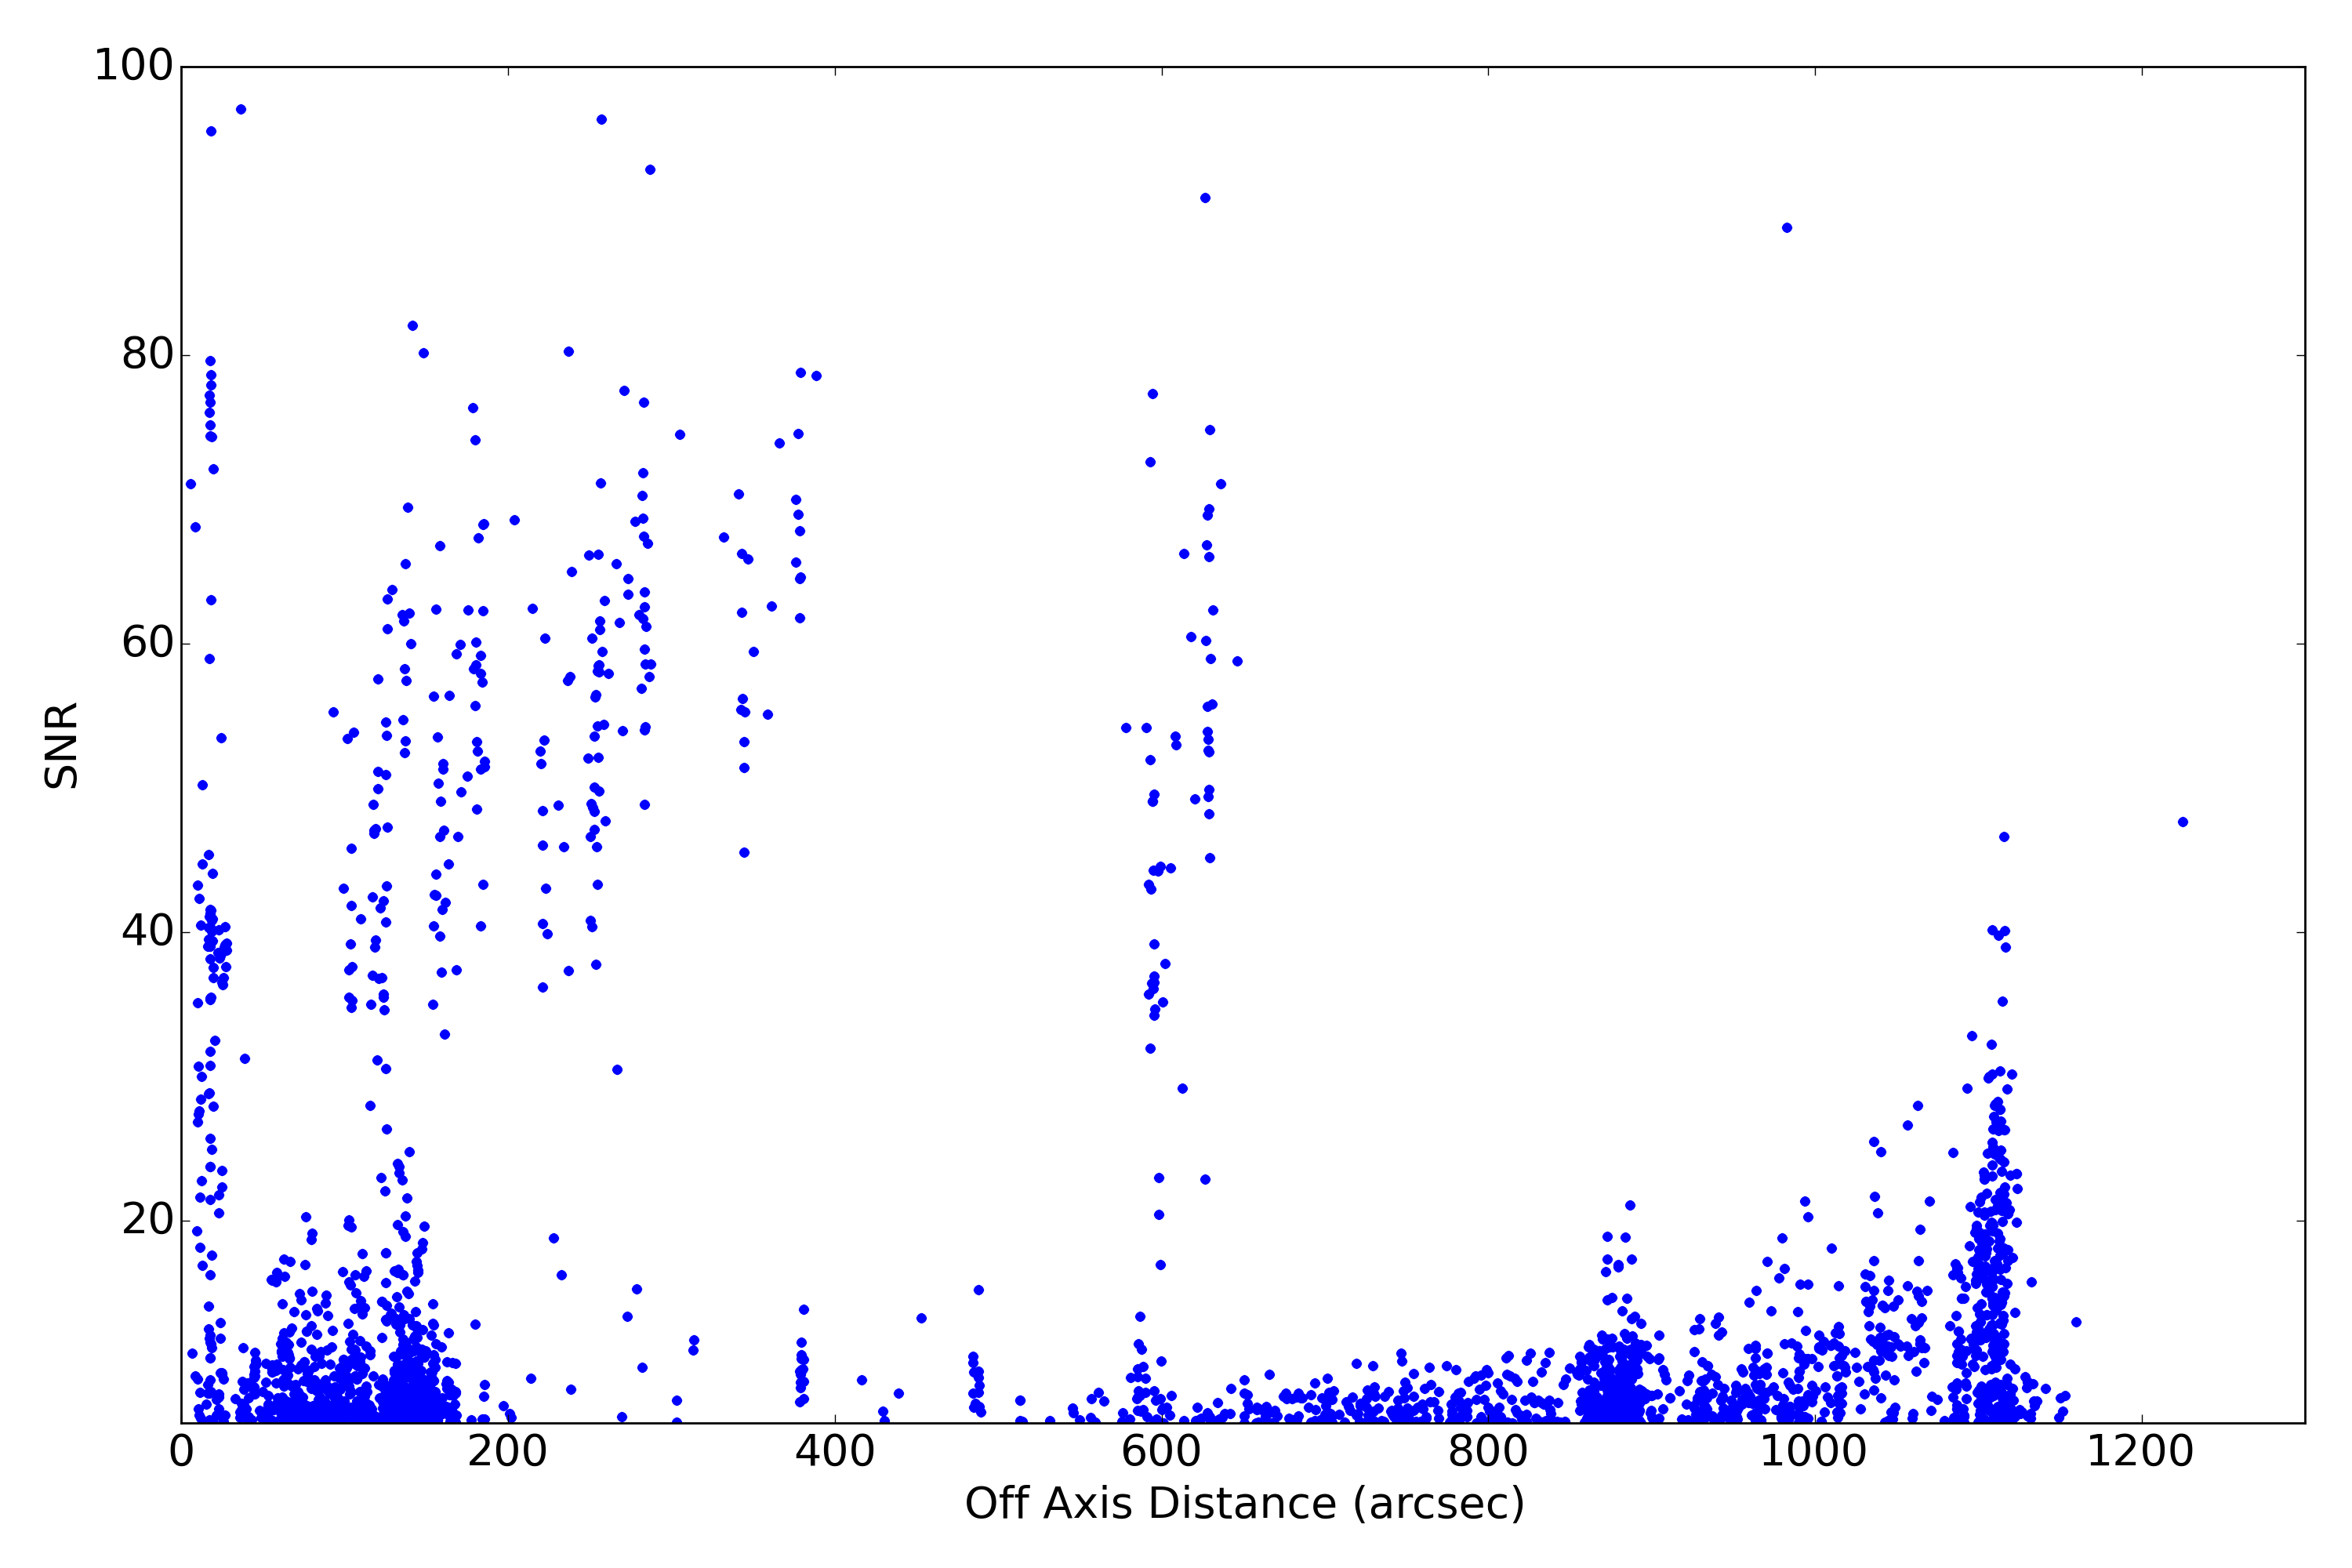
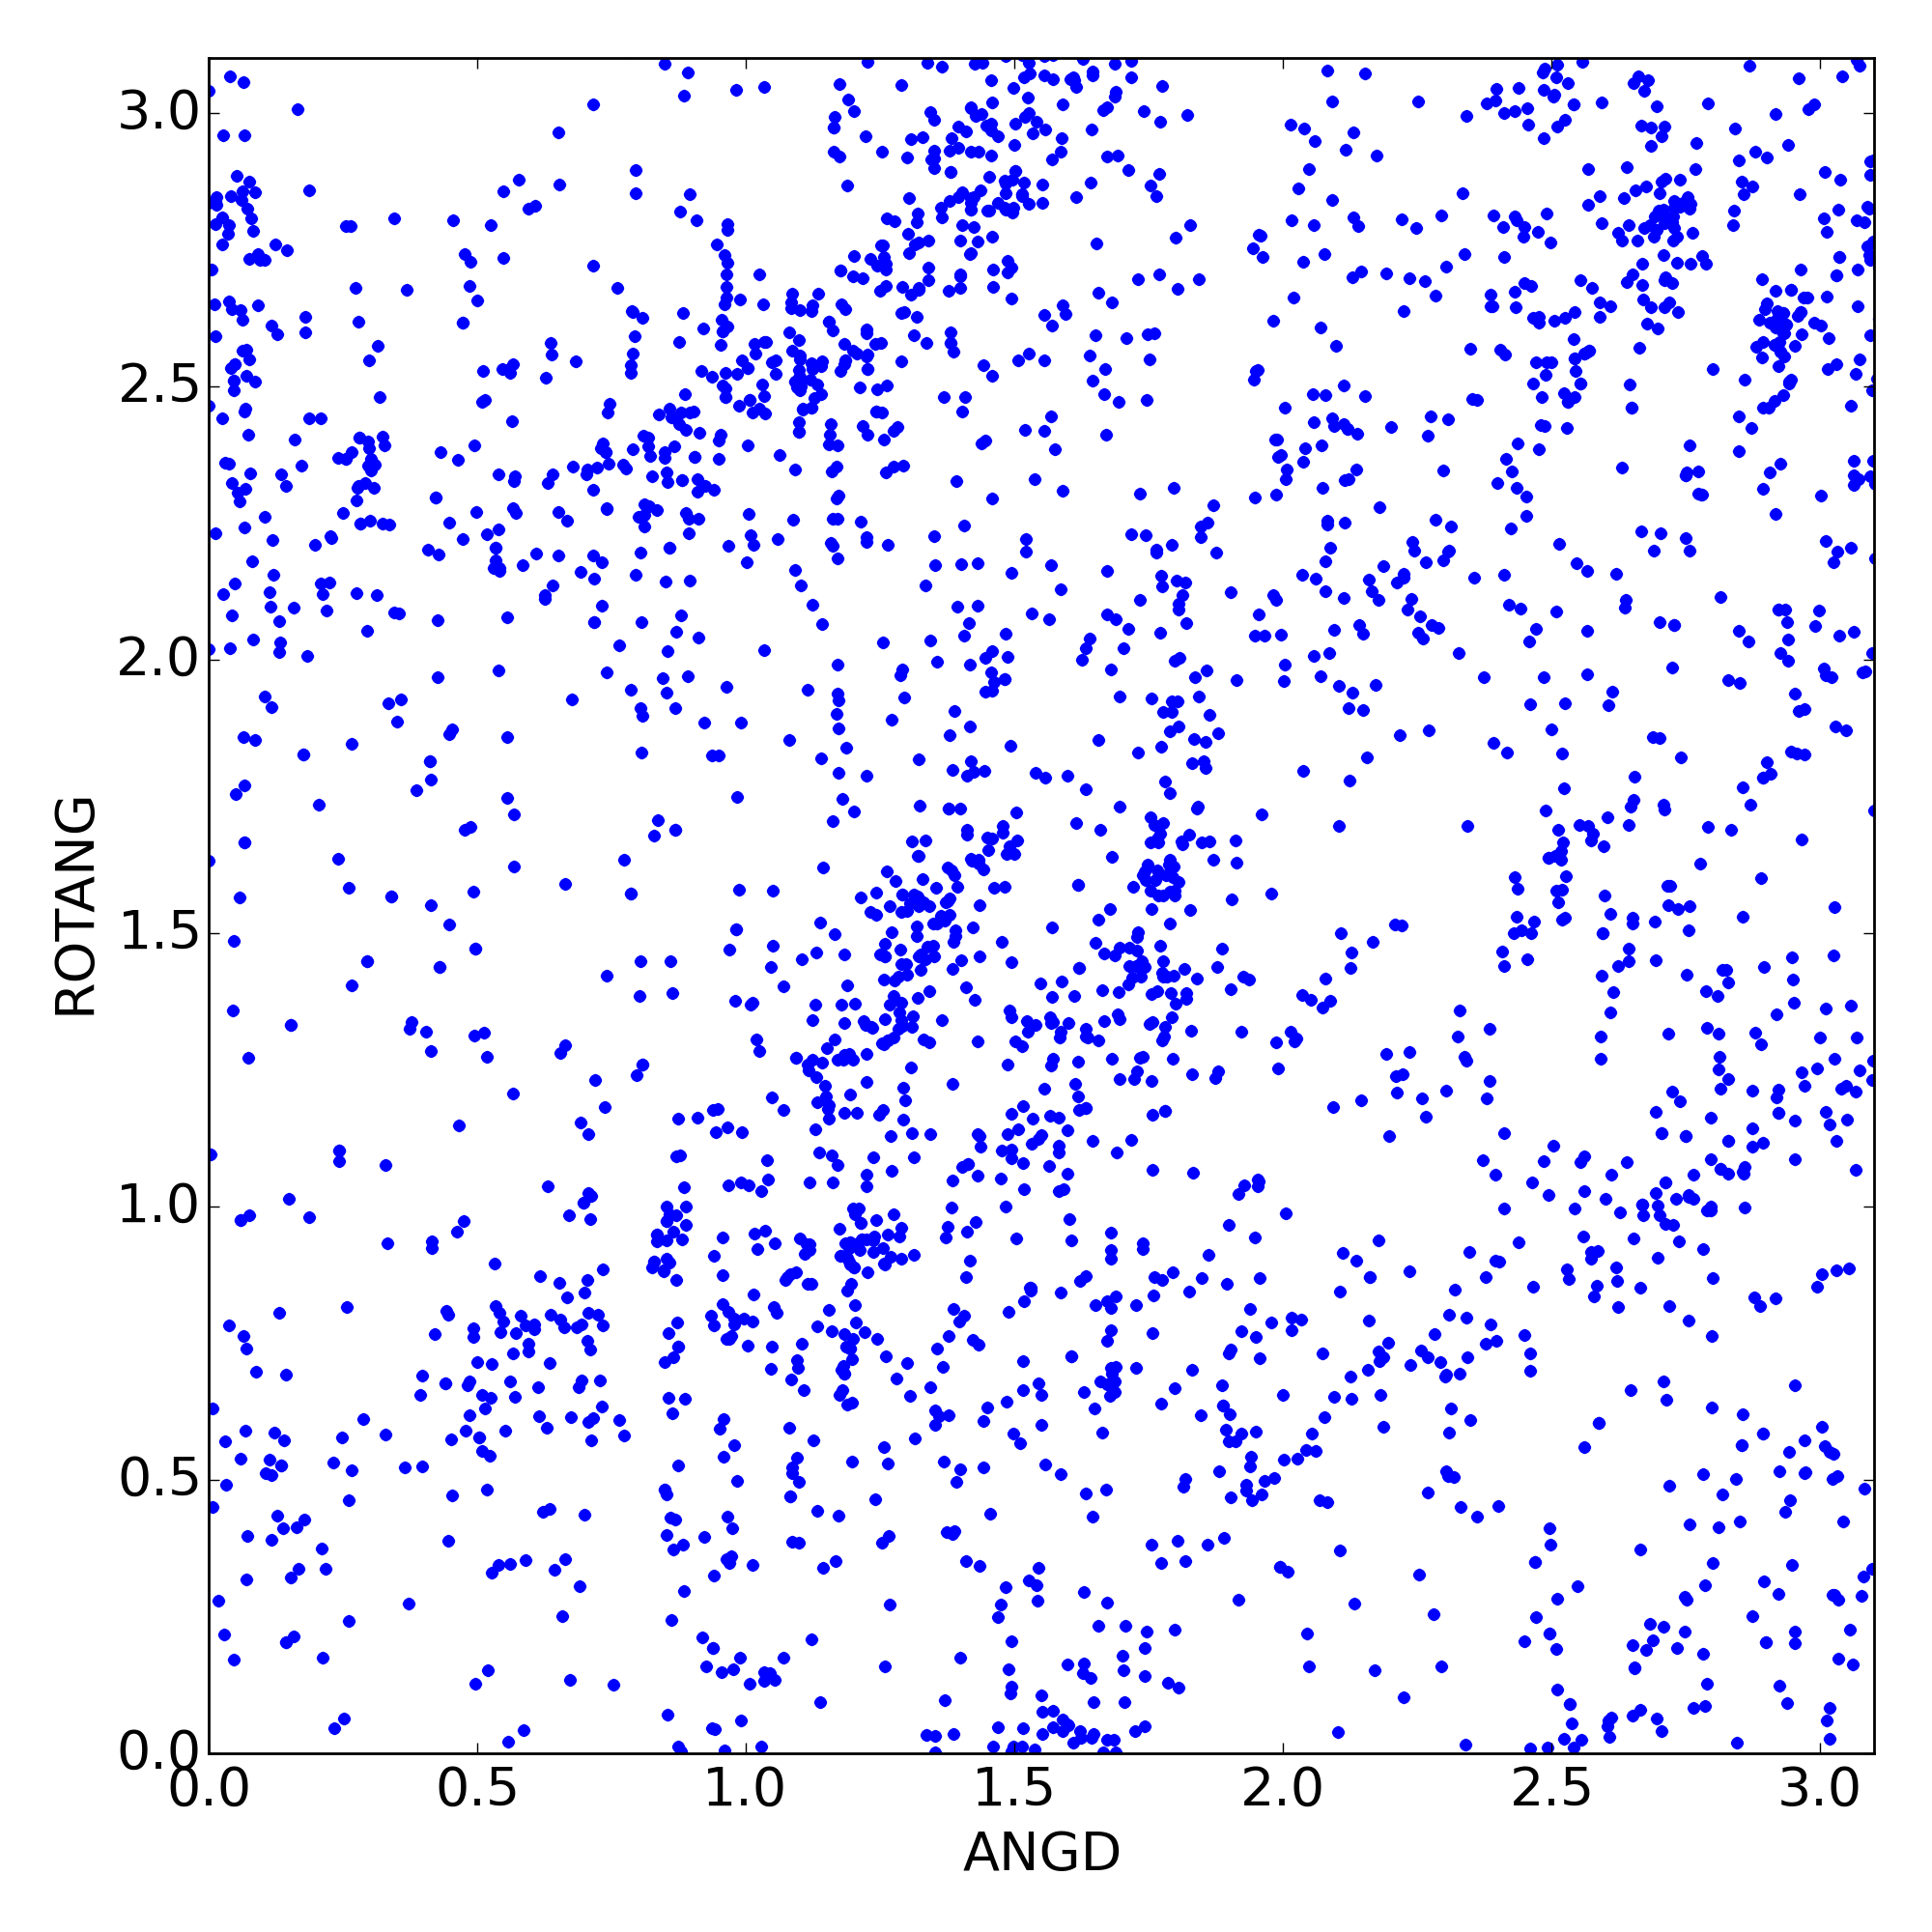
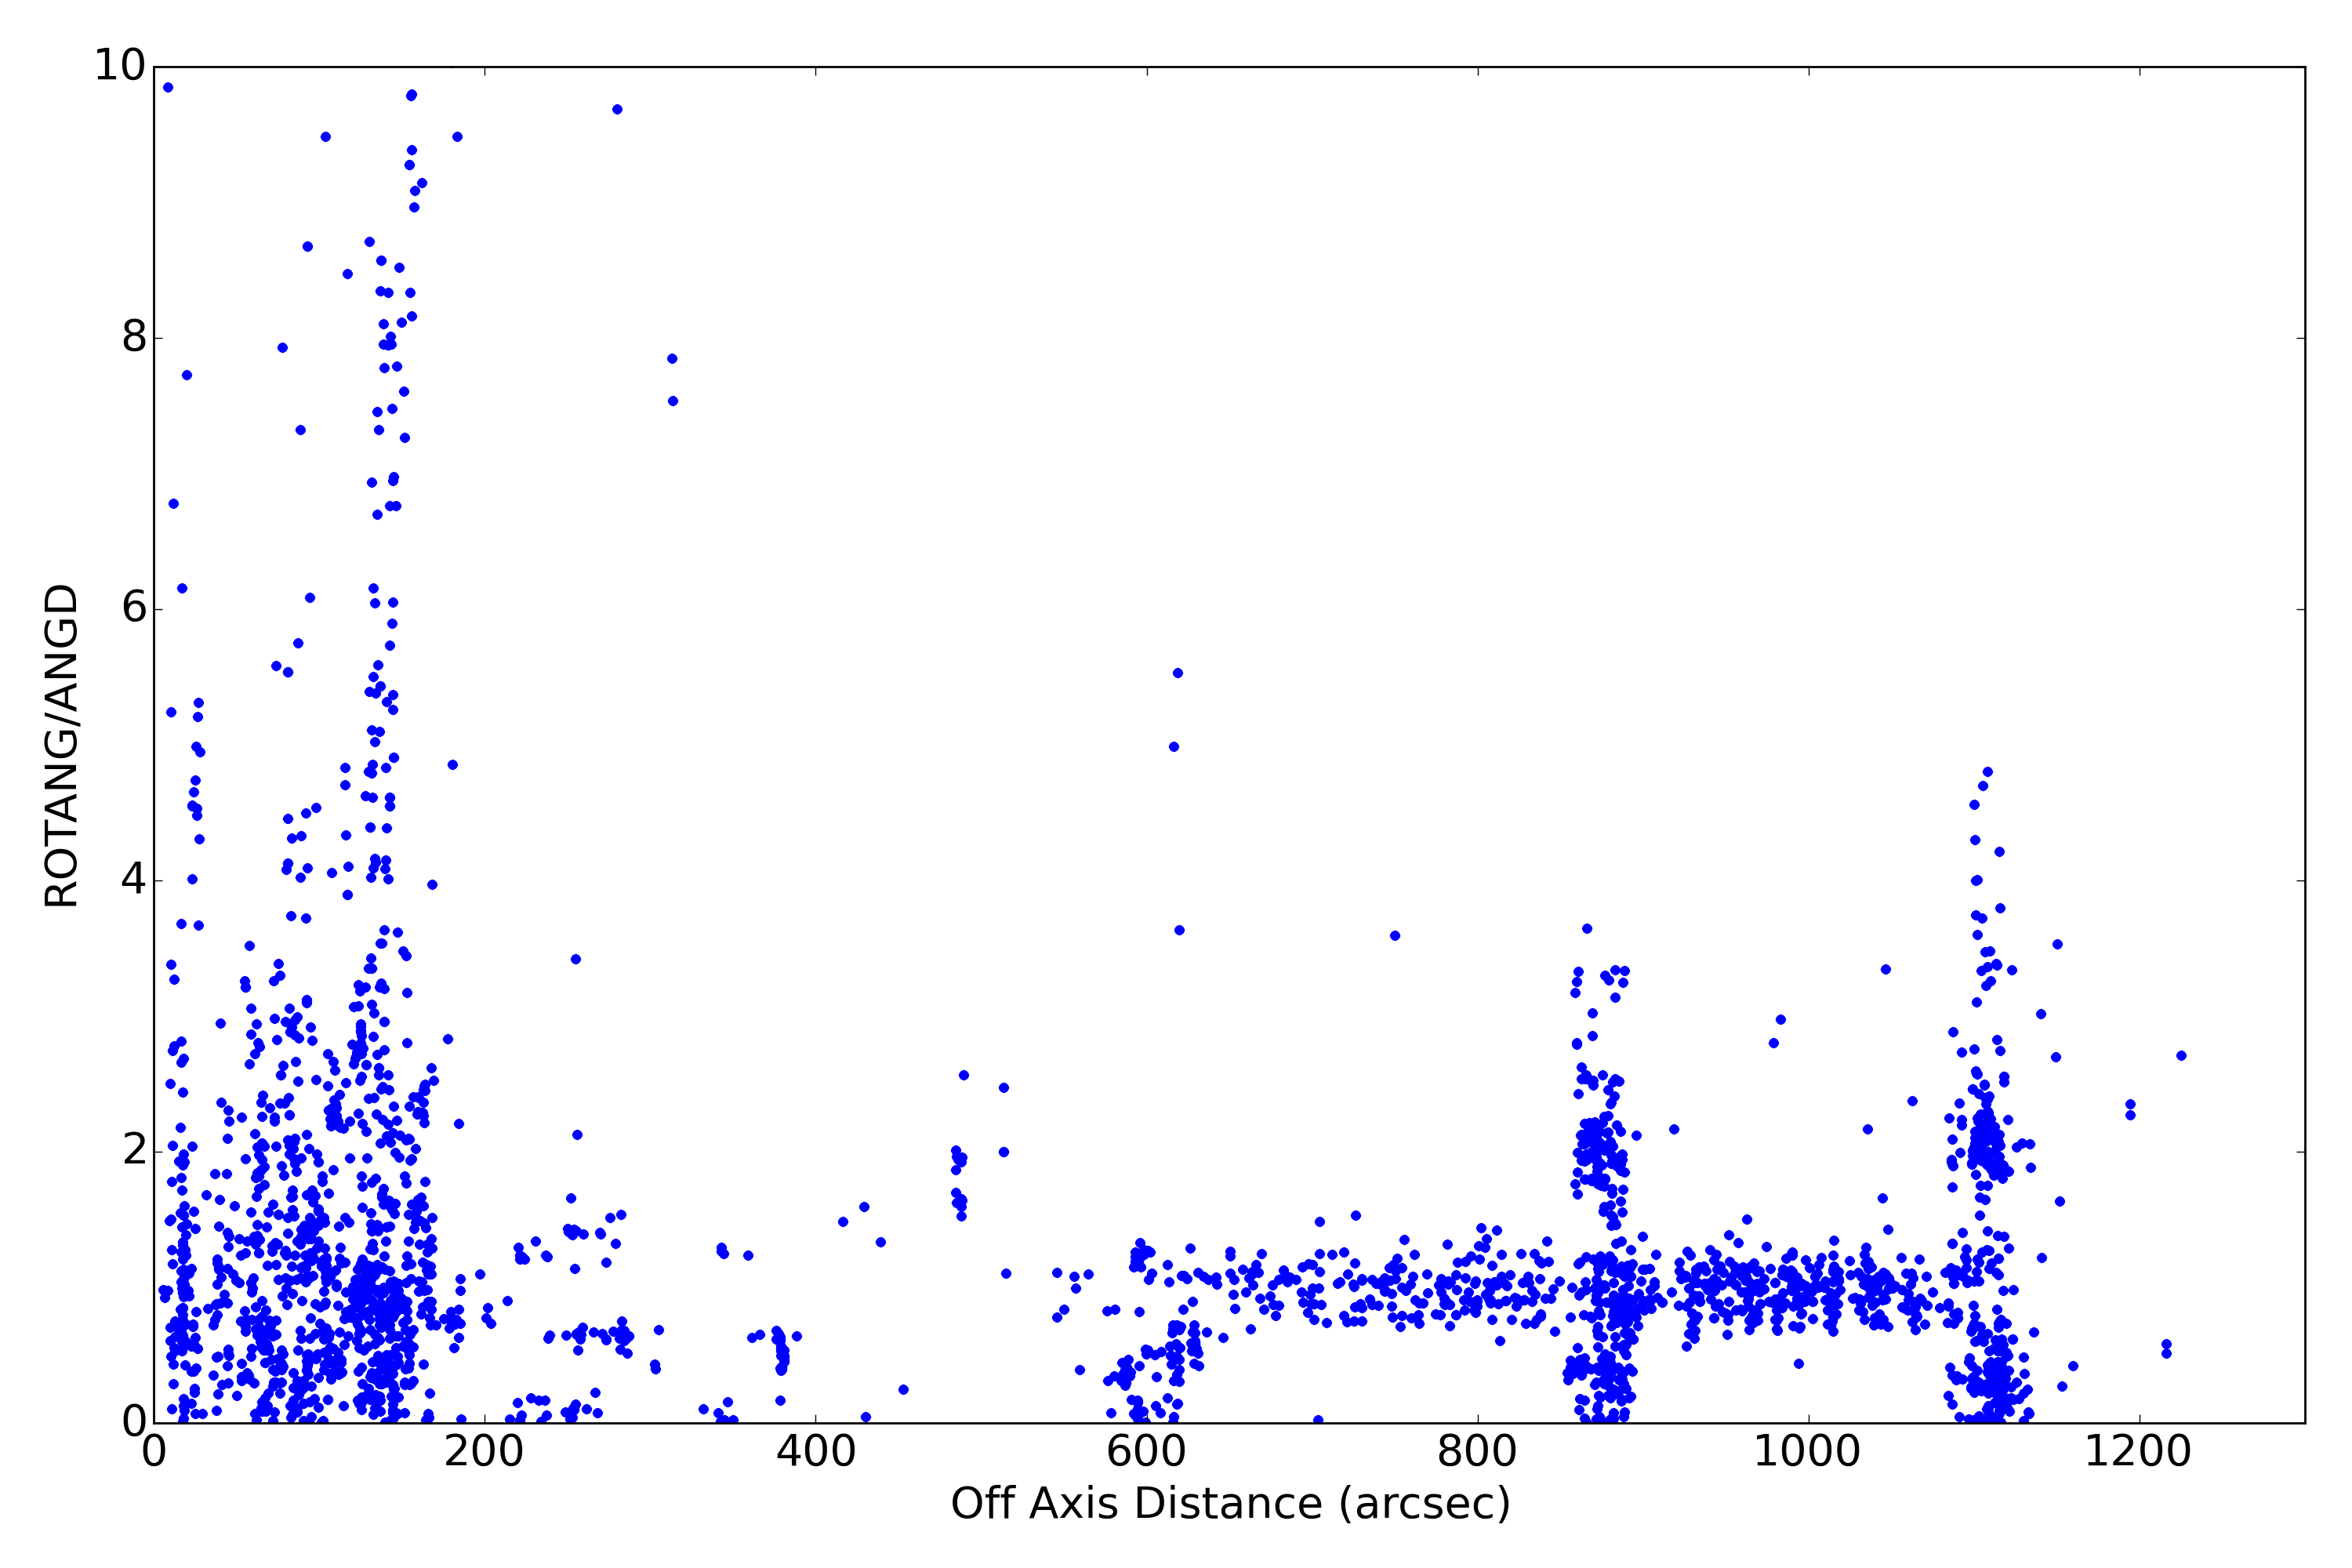
Plots below show various characteristics of detected imaging sources. Standard level 2 data products (*src2.fits) are used. Only observations with focus (sim_x) within 0.01 mm of nominal value for given SI configuration are used. Sources are also filtered for strength (SNR > 15).
| XY | PSF | Roundness | EE Radius | SNR | Rotation | Rotation2 | |
|---|---|---|---|---|---|---|---|
| ACIS I | 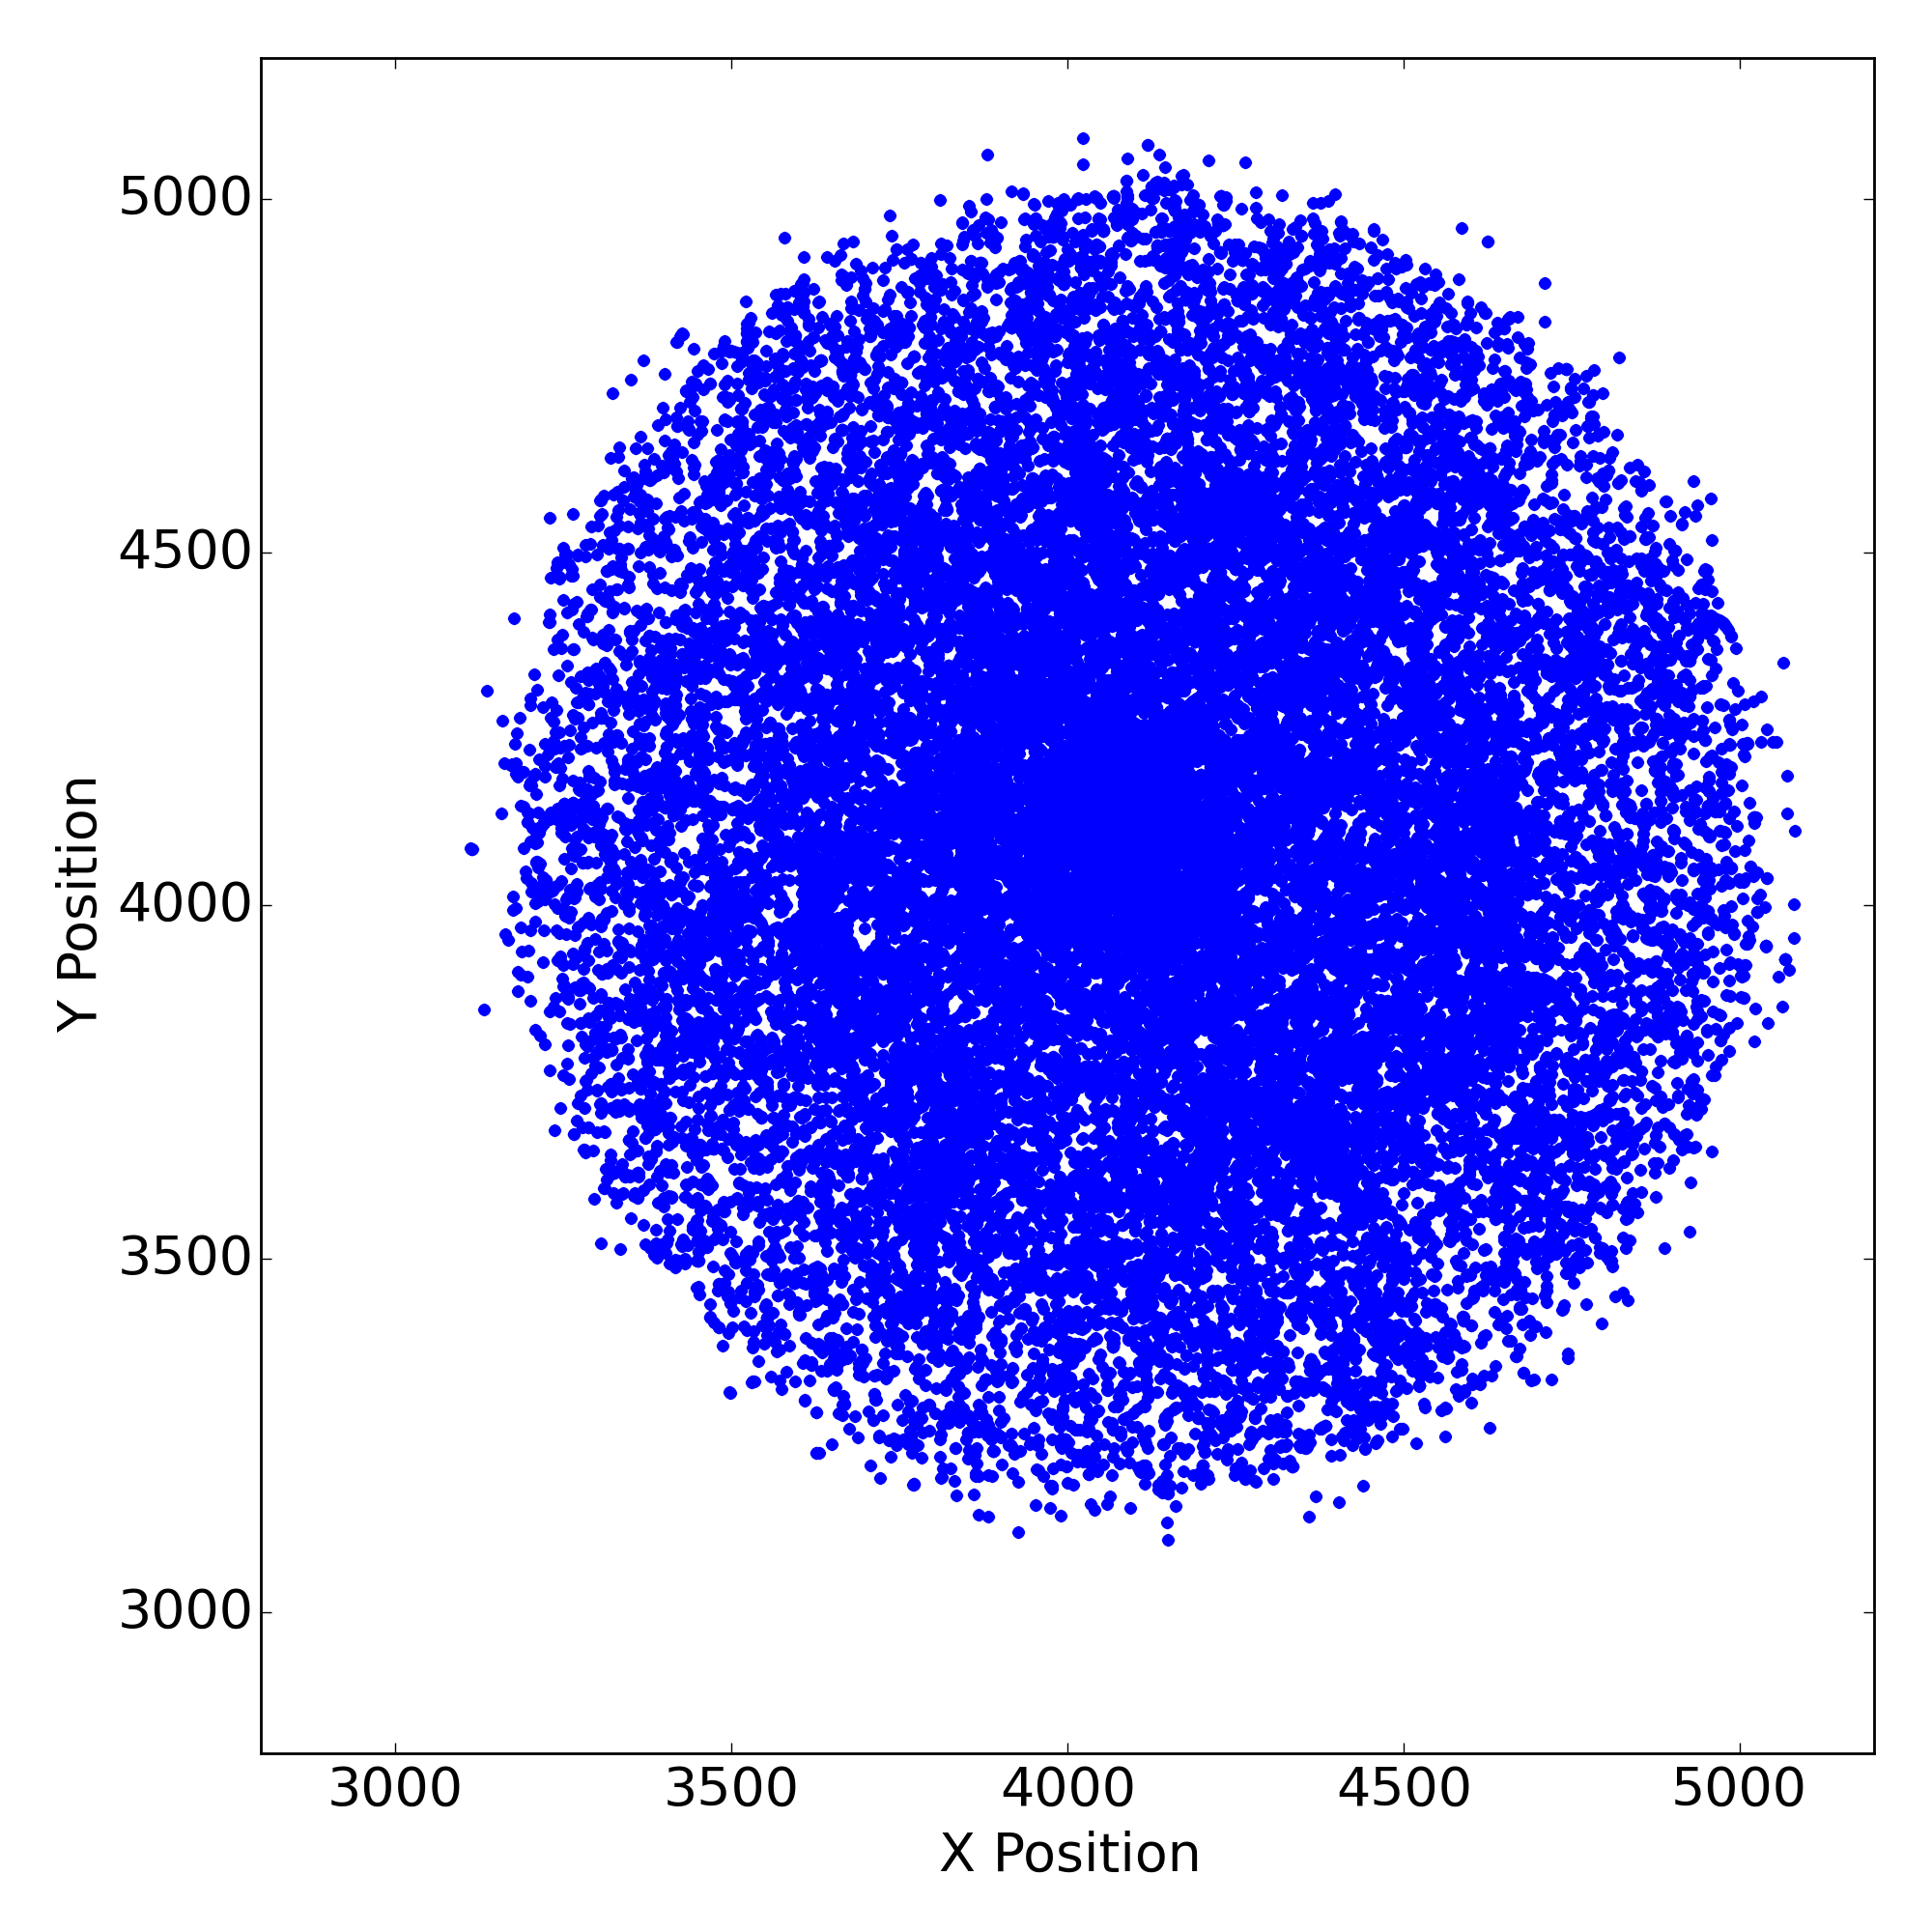 |
 |
 |
 |
 |
 |
 |
| ACIS S | 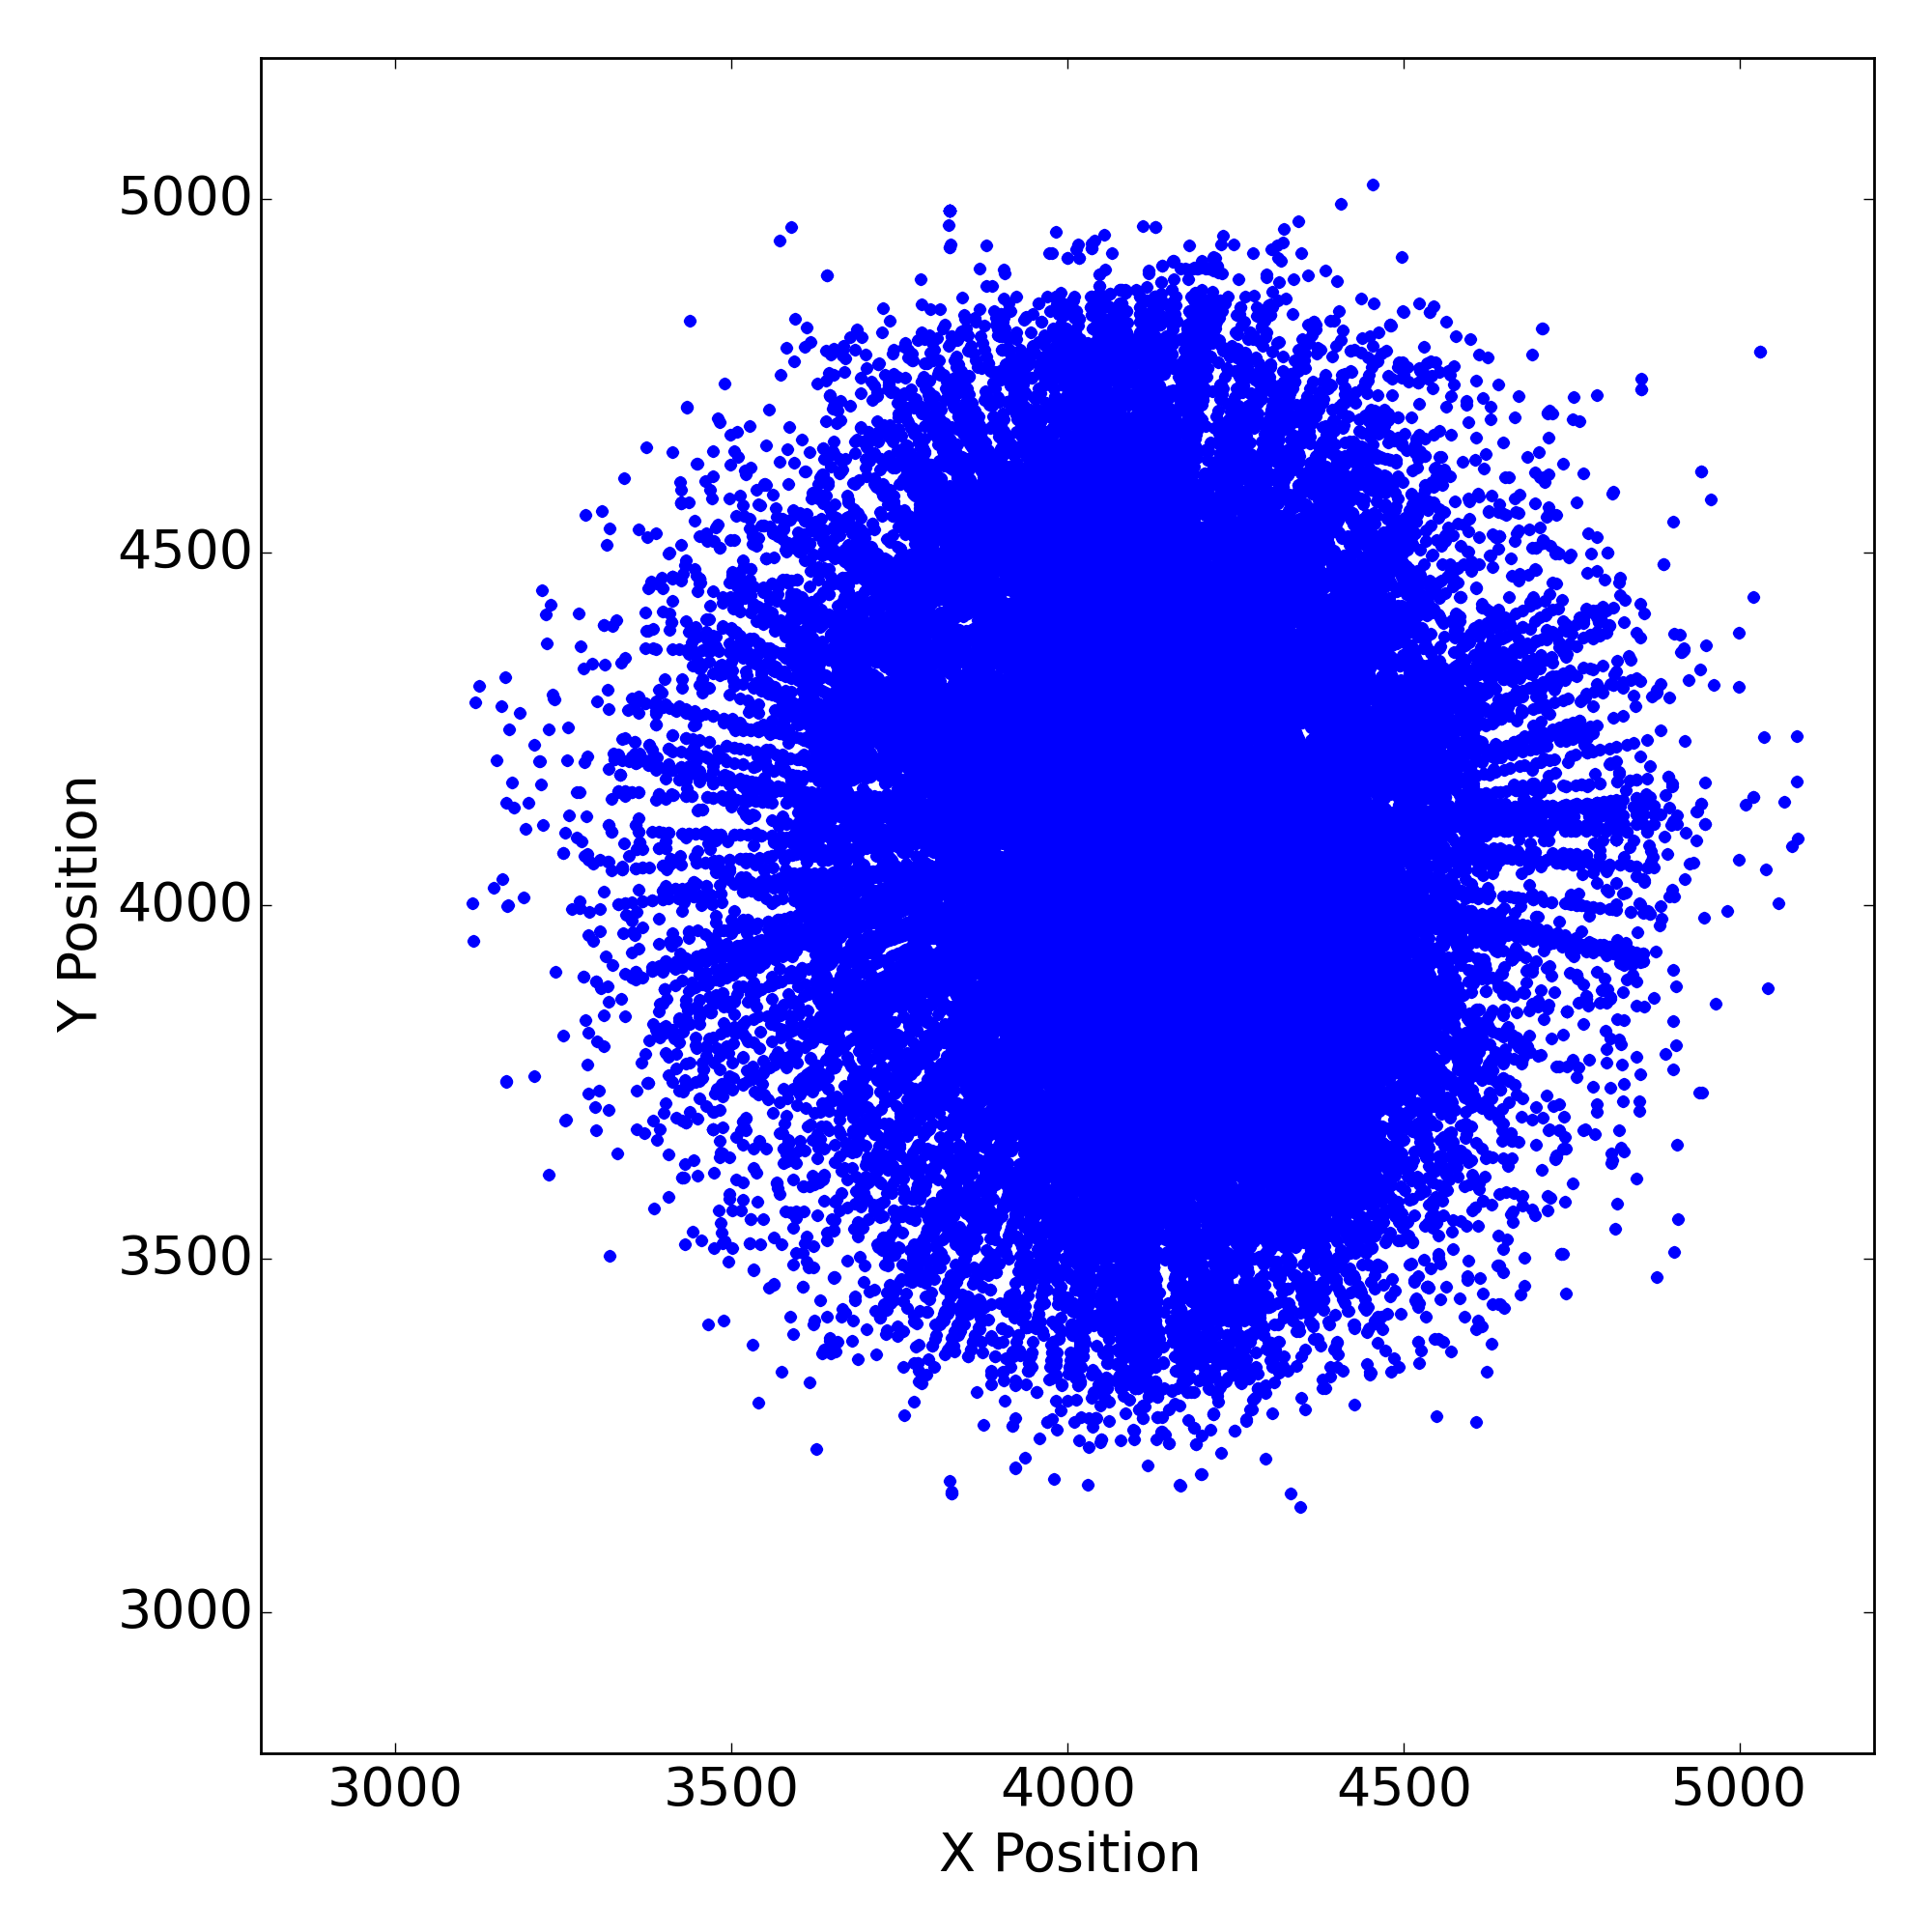 |
 |
 |
 |
 |
 |
 |
| HRC I | 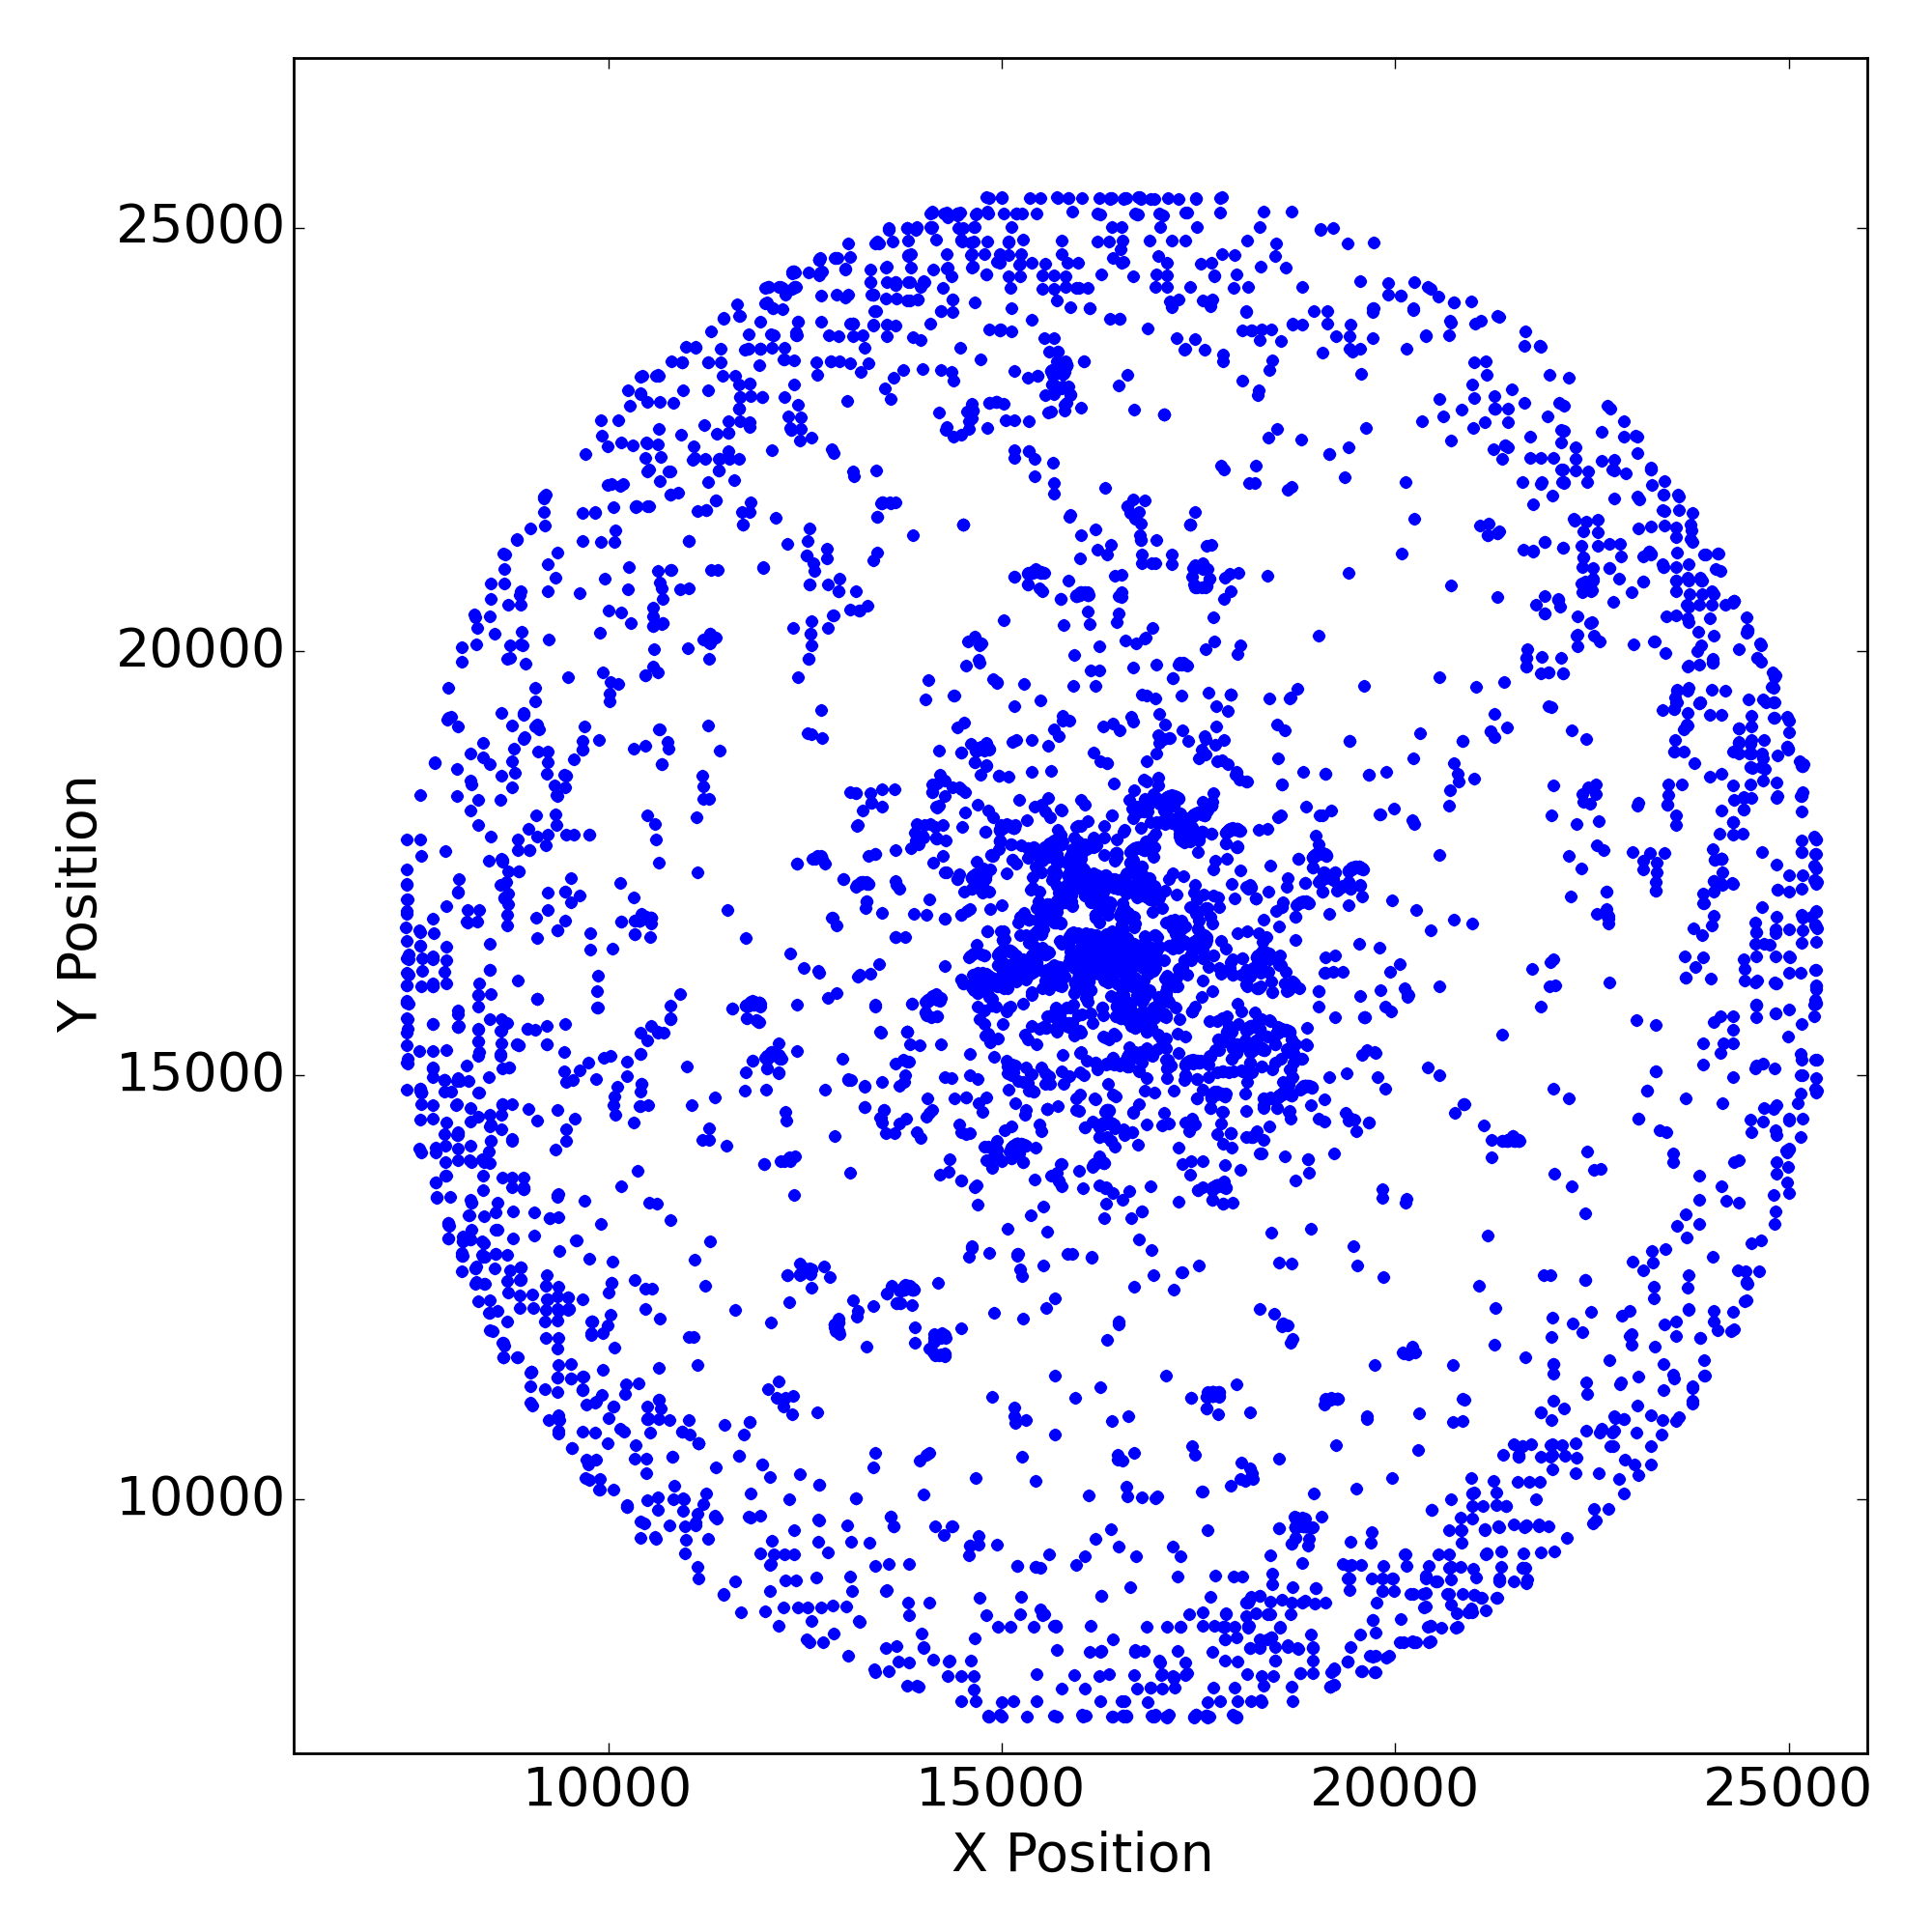 |
 |
 |
 |
 |
 |
 |
| HRC S | 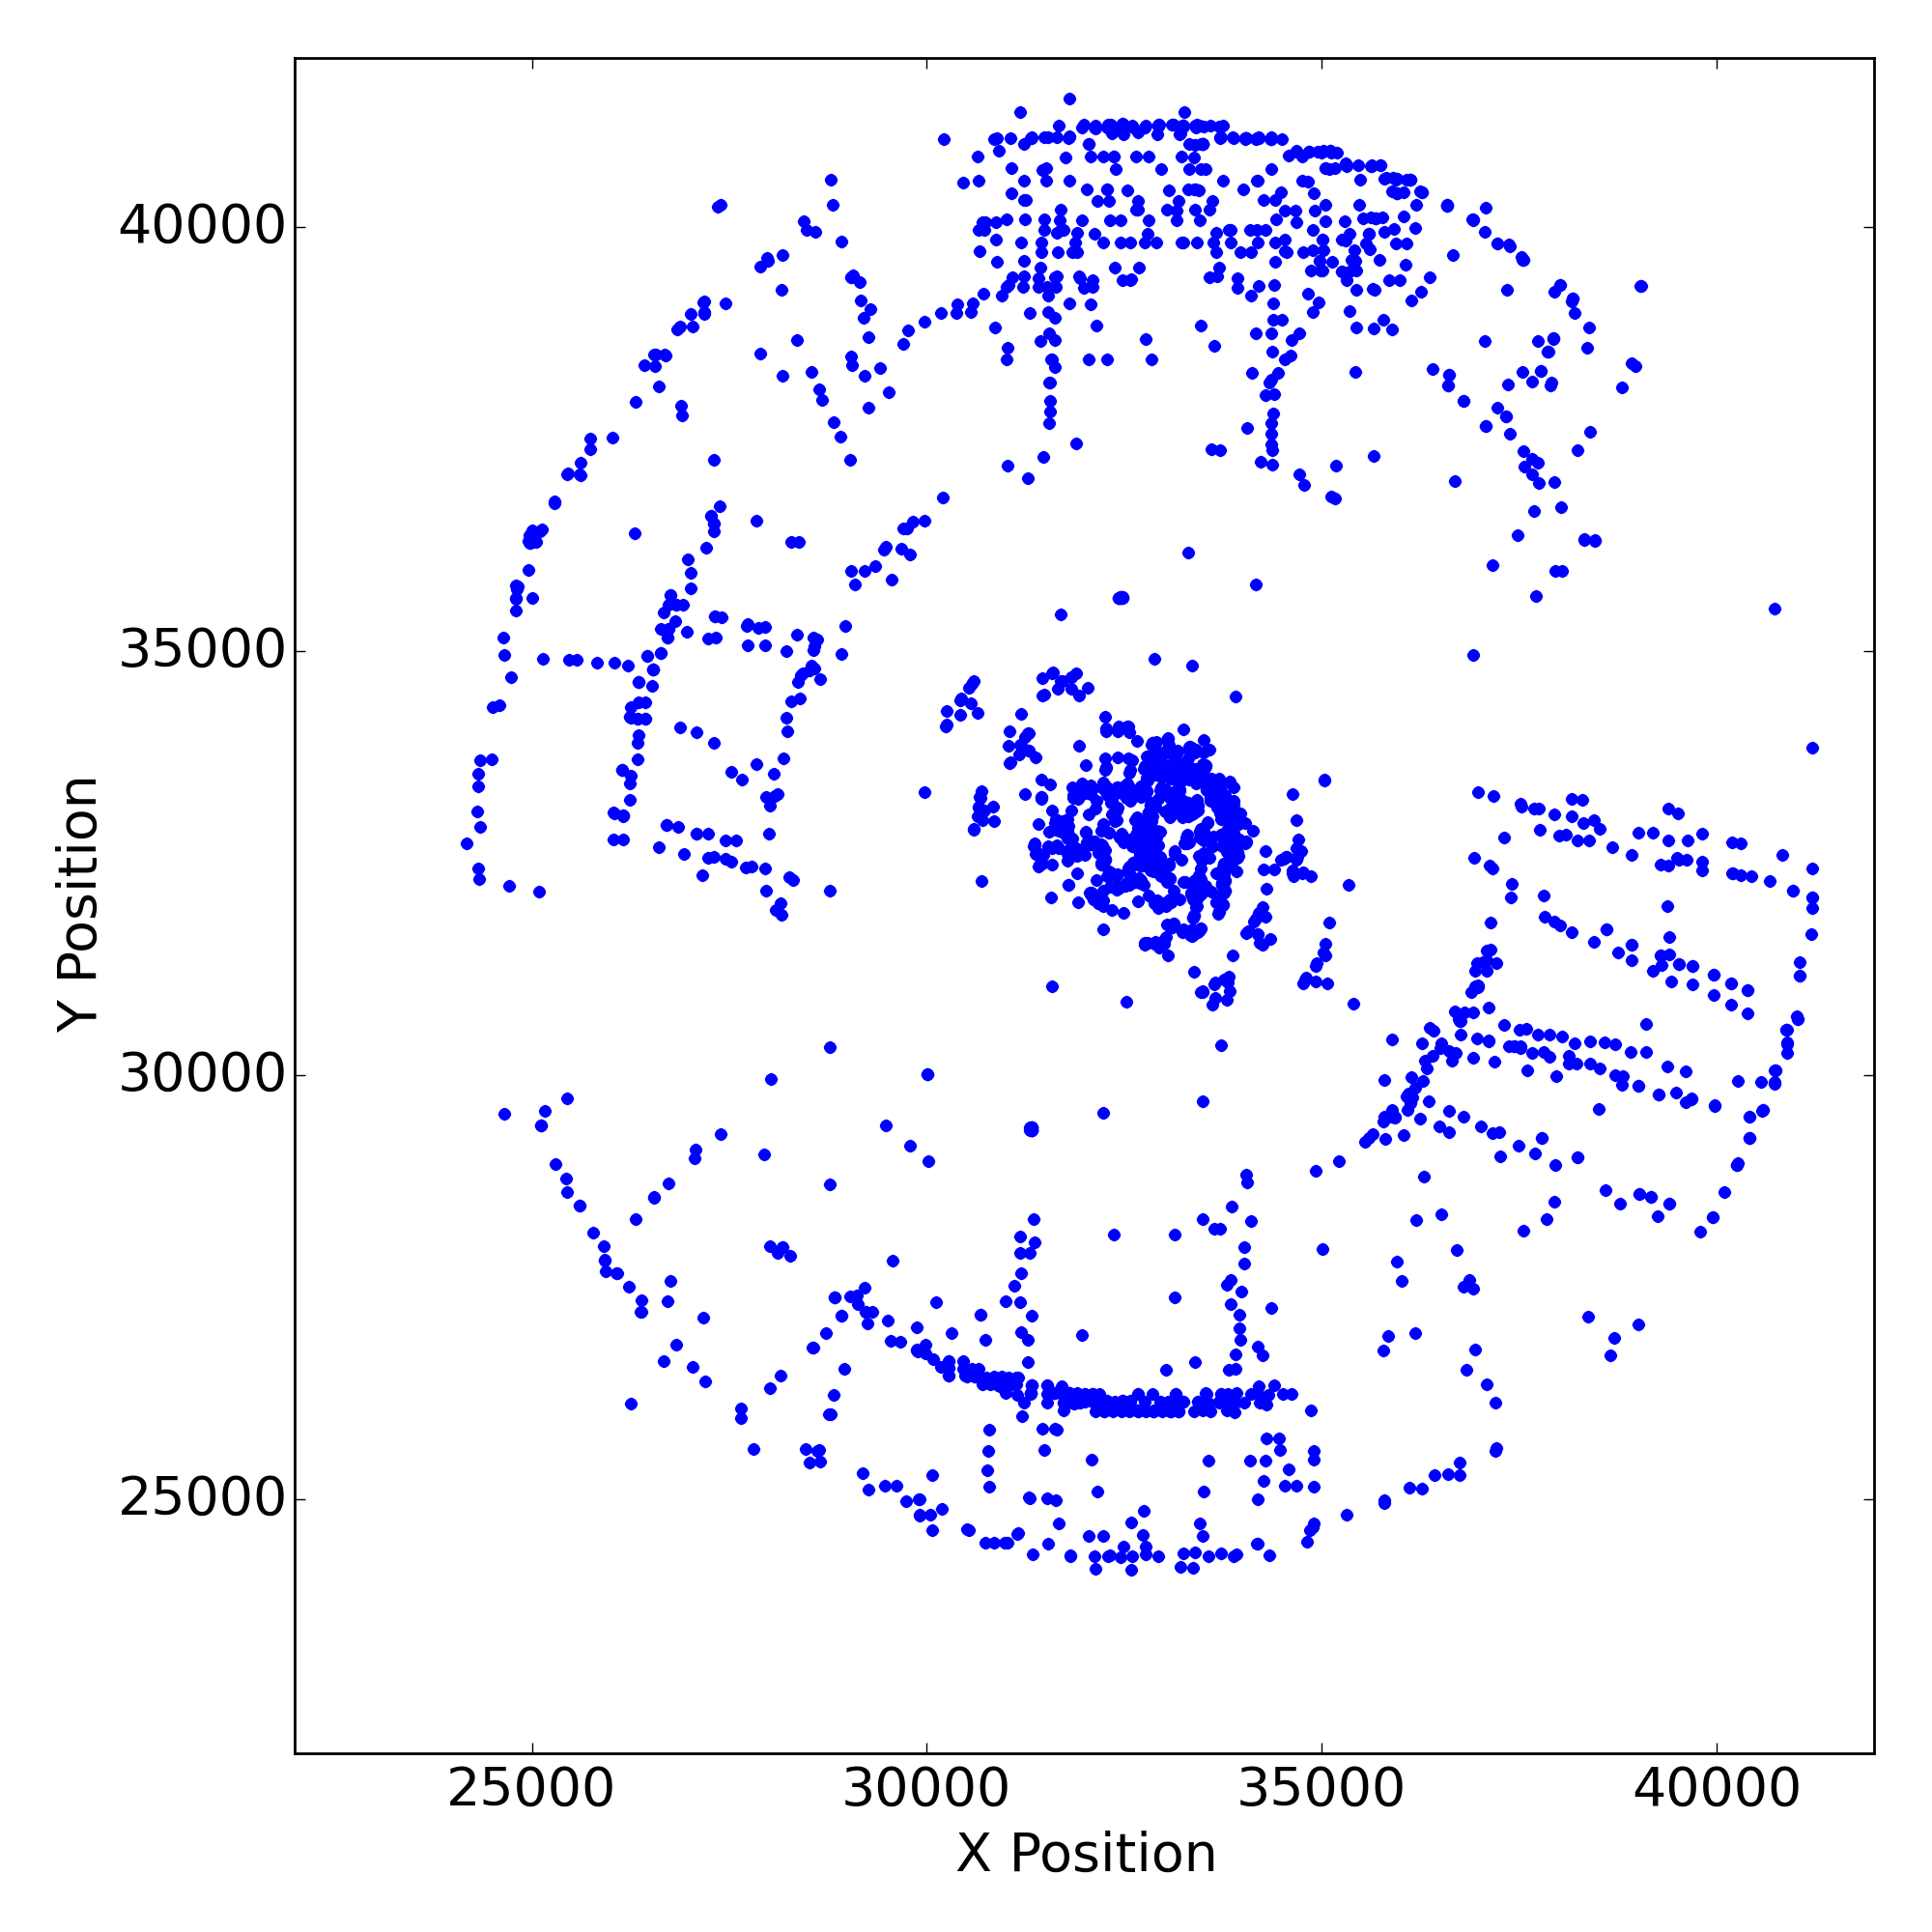 |
 |
 |
 |
 |
 |
 |
Gratings
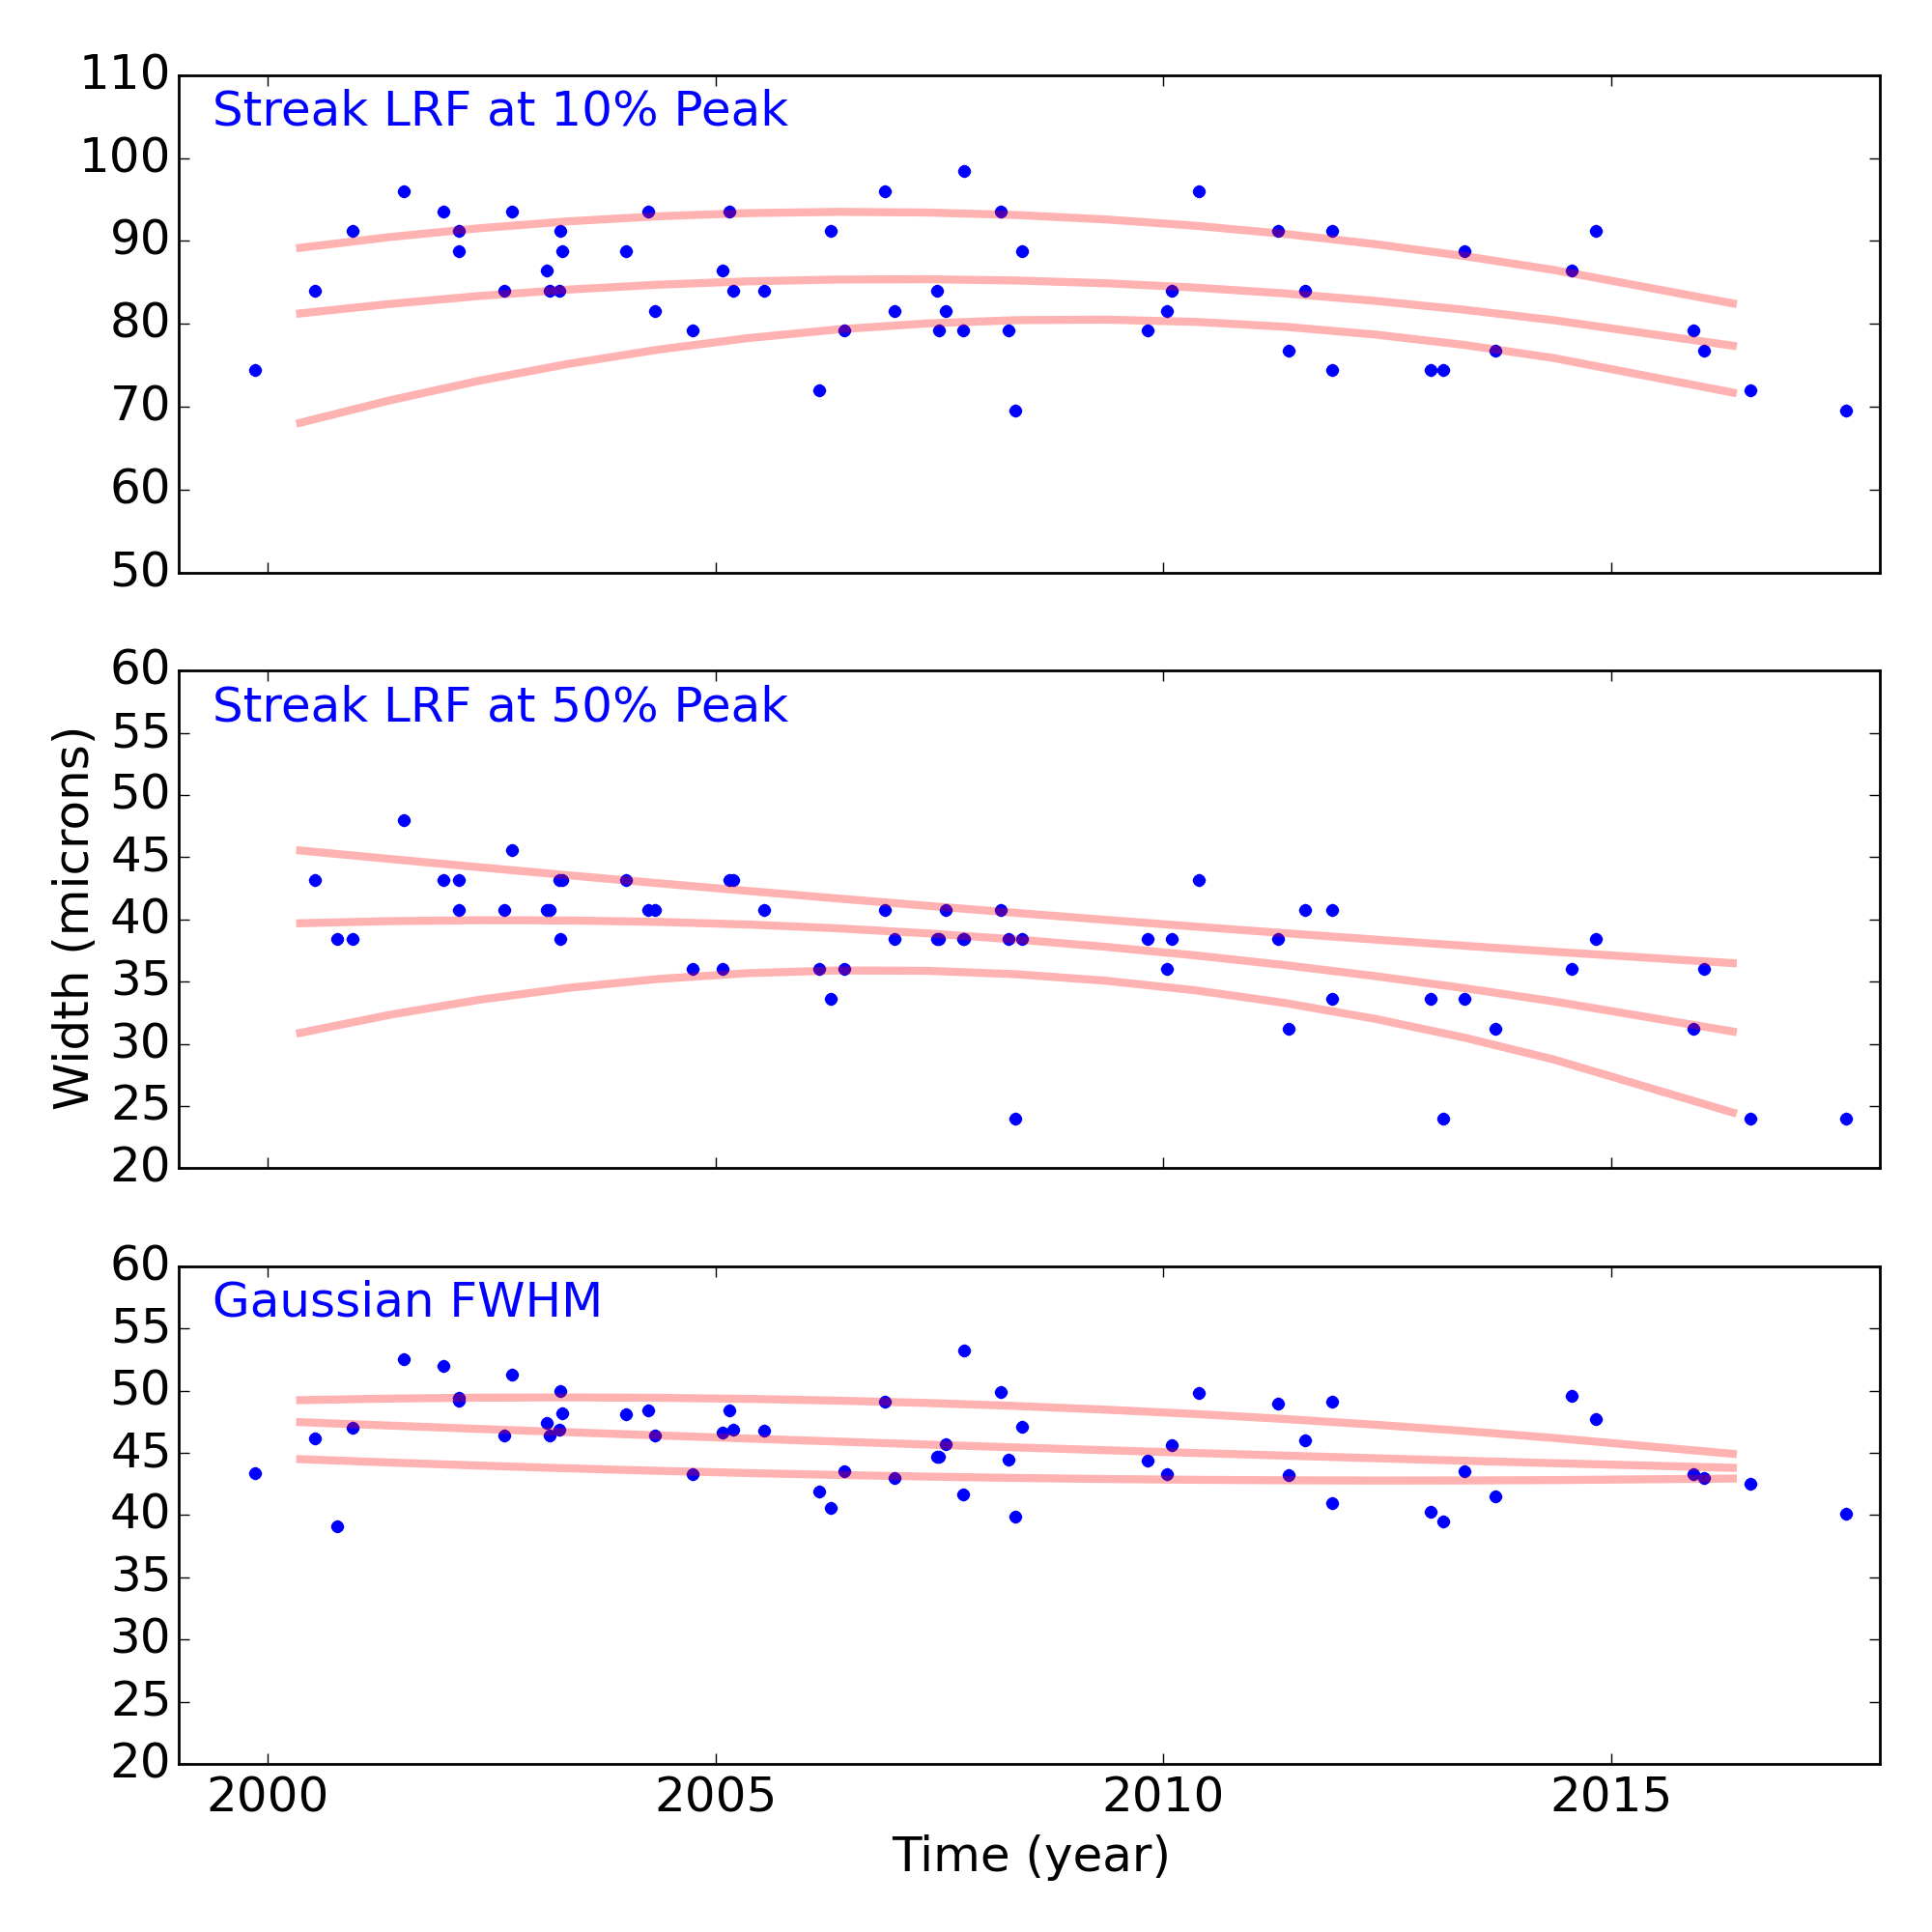
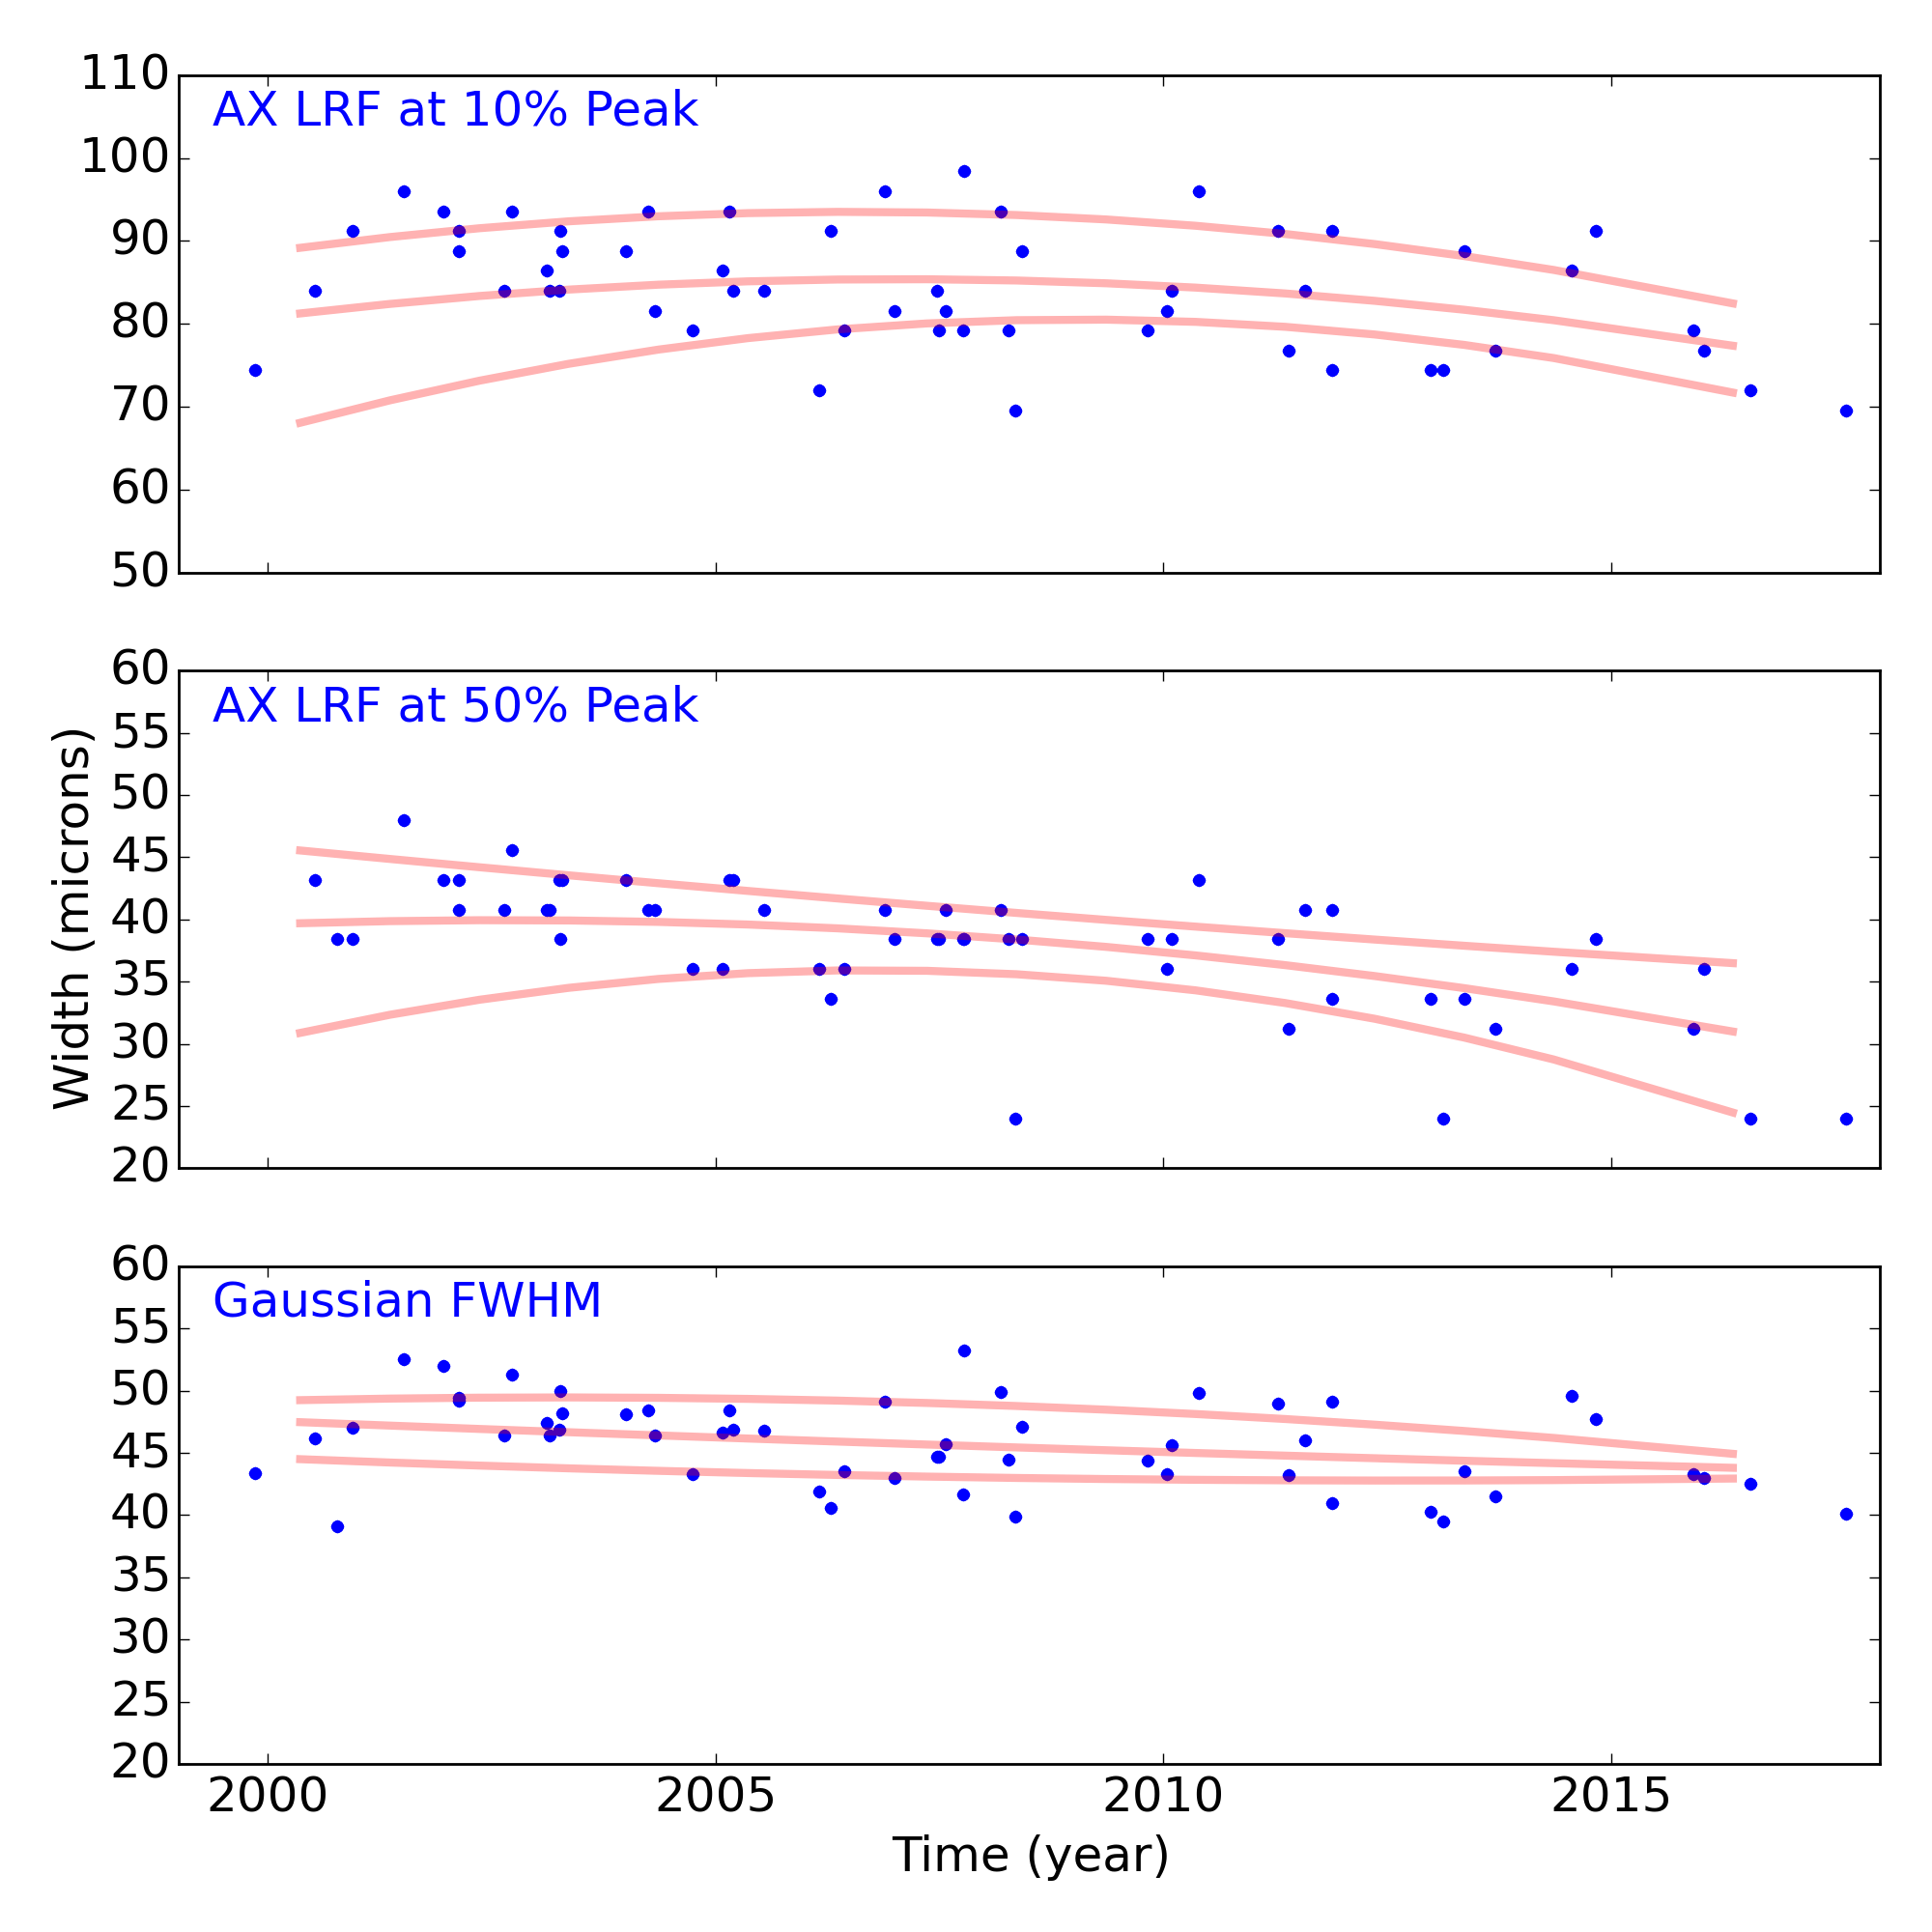
Grating Trends/Focus
We plot the width of the zero order streak of ACIS/HETG observations and the width of the zero order image for HRC/LETG observations of point sources. No significant defocusing trend is seen at this time. See Gratings Trends pages.
PCAD
ACA Trending
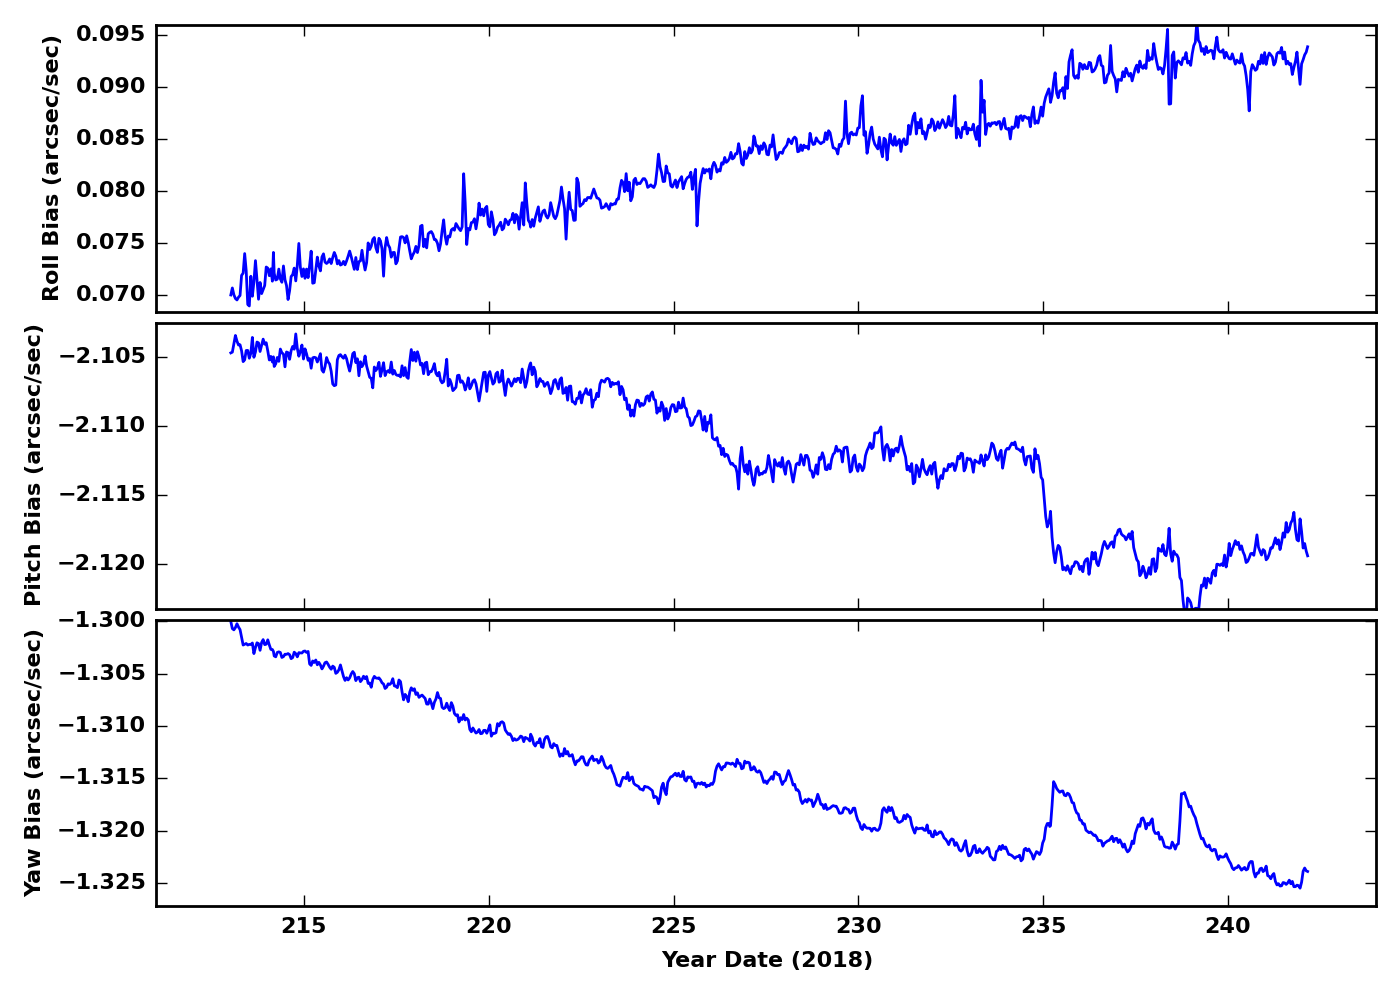
Gyro Bias Drift
Radiation History
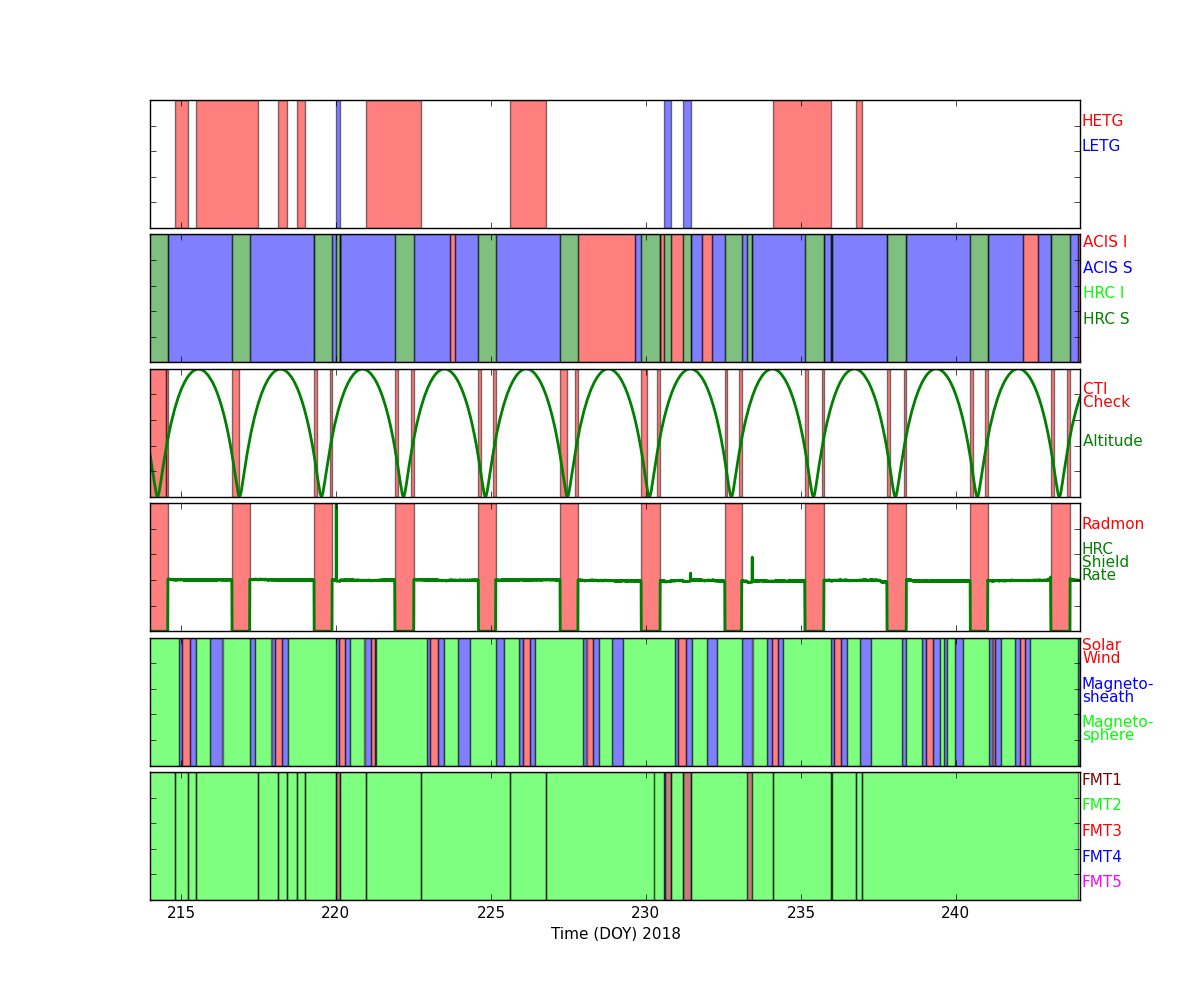
Radiation Zone Timing
Plotted below are radiation zone timing plots based on the following definitions of radiation zone:
- RADZONE - Ephin levels (in any of the E1300,P4GM,P41GM channels) are more than 1/3 of RADMON safing thresholds.
- RADMON - Radmon is disabled for radiation zone (as commanded based on OFLS model, for comparison with actual radiation levels).
- PERIGEE - Time of closest earth approach (for comparison)
Radiation Count Rates of Aug 2018
Sun Spot History
Trending
Quarterly Trends
- HRC Temperature
| Previous Quarter | ||||||
| MSID | MEAN | RMS | DELTA/YR | DELTA/YR/YR | UNITS | DESCRIPTION |
| 2CEAHVPT | 299.97 | 1.99 | 7.988e+00 | -4.505e+02 | K | CEA RADIATOR TEMPERATURE AT CENTER |
| 2CHTRPZT | 296.31 | 1.91 | 7.367e+00 | -4.071e+02 | K | CENTRAL ELECTRONICS BOX TEMP |
| 2CONDMXT | 293.04 | 2.21 | 2.664e+00 | -3.808e+02 | K | CONDUIT -X FACE TEMPERATURE |
| 2DCENTRT | 292.22 | 1.72 | 2.871e+00 | -4.092e+02 | K | DETECTOR HOUSING TEMP 2 |
| 2DTSTATT | 293.03 | 1.85 | -4.853e-01 | -3.766e+02 | K | DETECTOR HOUSING TEMP 1 |
| 2FHTRMZT | 295.24 | 2.19 | -3.087e+00 | -3.754e+02 | K | FRONT END ELECTRONICS BOX TEMPERATURE |
| 2FRADPYT | 291.01 | 2.33 | -4.205e+00 | -3.531e+02 | K | FRONT END ASSEMBLY +Y AT RADIATOR CENTER TEMP |
| 2PMT1T | 294.24 | 2.34 | 5.269e+00 | -4.489e+02 | K | PMT 1 TEMPERATURE |
| 2PMT2T | 296.73 | 2.54 | 5.311e+00 | -4.474e+02 | K | PMT 2 TEMPERATURE |
| 2UVLSPXT | 288.13 | 2.06 | 5.029e+00 | -3.752e+02 | K | UV LIGHT SHIELD NEXT TO SNOUT TEMP |
)
)
)
)
)
)
)
)
)
)
- HRC HK
| Previous Quarter | ||||||
| MSID | MEAN | RMS | DELTA/YR | DELTA/YR/YR | UNITS | DESCRIPTION |
| FE00ATM | 21.86 | 1.71 | -2.548e+00 | -2.909e+02 | C | Front end temperature (2FE00ATM) |
| FEPRATM | 24.50 | 1.96 | -2.871e+00 | -3.380e+02 | C | FE temp card temperature (2FEPRATM) |
| IMHVATM | 31.19 | 1.49 | 2.043e+00 | -3.264e+02 | (2IMHVATM)C | |
)
)
)
- PCAD Temperature
| Previous Quarter | ||||||
| MSID | MEAN | RMS | DELTA/YR | DELTA/YR/YR | UNITS | DESCRIPTION |
| AACCCDPT | 260.69 | 1.14 | 4.452e-01 | 1.127e+02 | K | AC CCD TEMP (PRI) |
| AACCCDRT | 304.52 | 1.18 | 4.320e-01 | 1.102e+02 | K | AC CCD TEMP (RDNT) |
| AACH1T | 301.80 | 1.25 | 4.118e-01 | 1.240e+02 | K | AC HOUSING TEMP (ACH1) |
| AACH2T | 301.86 | 1.25 | 3.951e-01 | 1.260e+02 | K | AC HOUSING TEMP (ACH2) |
)
)
)
)
Envelope Trending
- htftegrd7
- htftegrd9
- ohrthr07
- ohrthr08
- ohrthr17
- ohrthr25
- ohrthr26
- ohrthr33
- ohrthr36
- ohrthr39
- ohrthr41
- ohrthr50
- ohrthr51
- ohrthr61
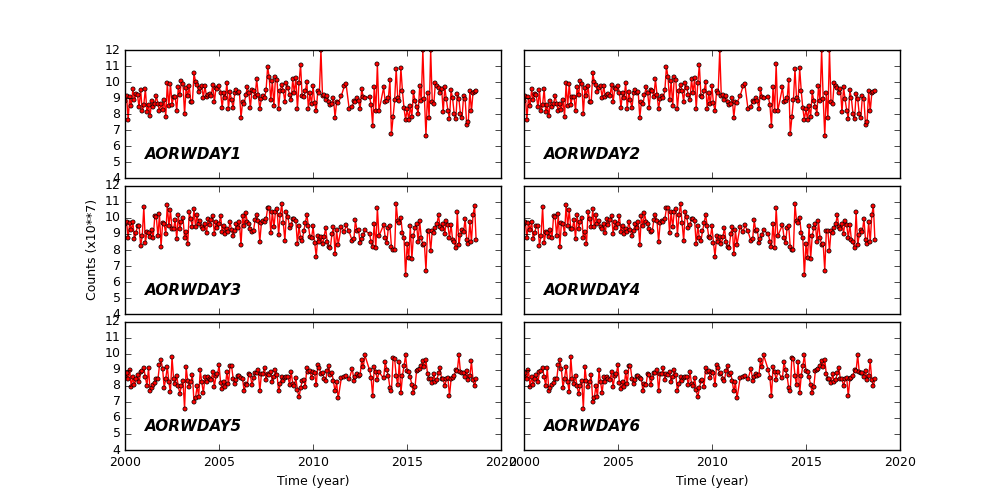
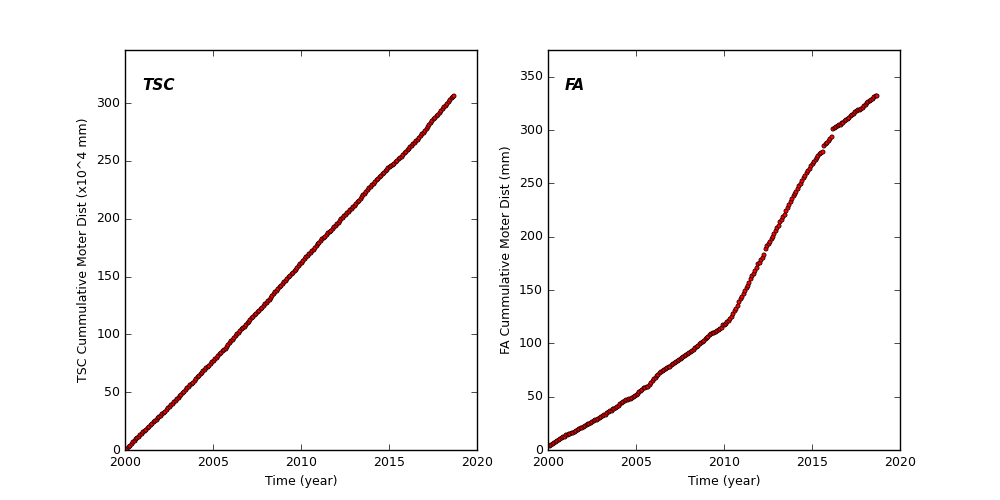
Spacecraft Motions
TSC and FA Cummulative Moter Distance
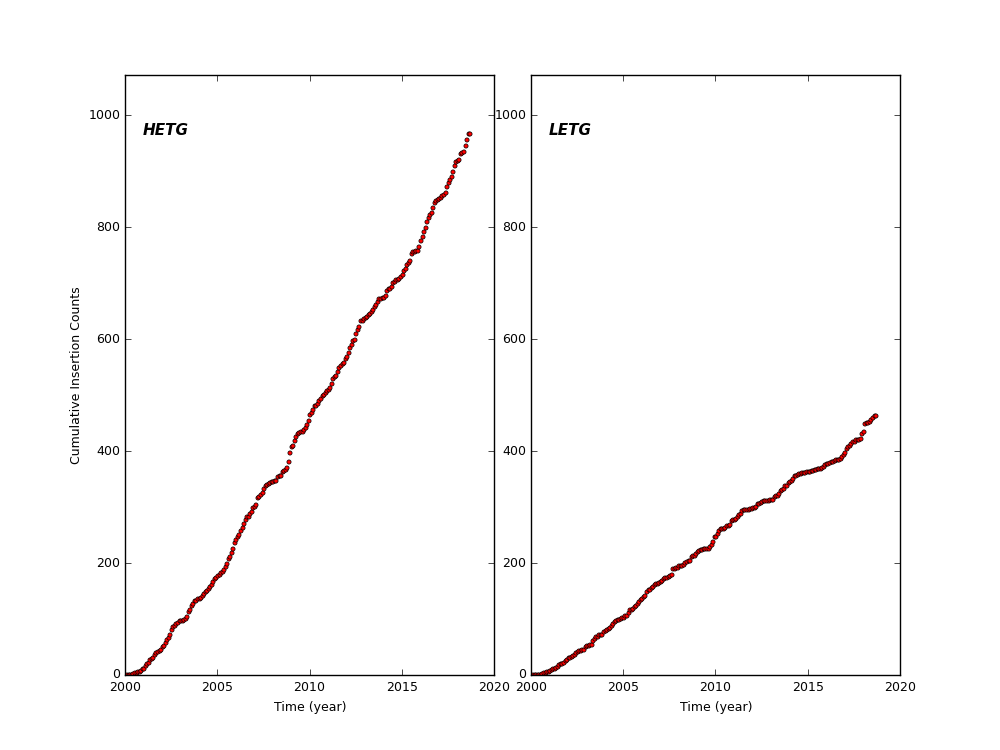
HETG and LETG Cummulative Insertion Counts
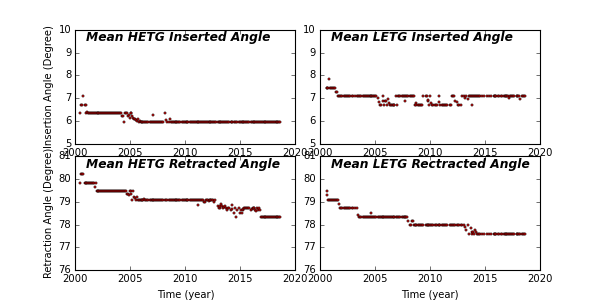
HETG/LETG Insertion/Retraction Angle
Reaction Wheel Rotations