ACIS
ACIS DOSE Registered-Photon-Map
The steps we took to compute the dose map are;
- Level 1 Event files for a specified month are obtained from archive.
- Image data including I2, I3, S2, S3 CCDs are extracted from all event files.
- All the extracted image data were merged to create a month long exposure map for the month.
- The exposure map is opened with ds9, and check a distribution of count rates against energy. From this, estimate the upper threshold value. Any events beyond this upper threshold are assumed erroneous events such as bad pixels.
- Using this upper threshold, the data is filtered, and create a cleaned exposure map for the month.
- The exposure map from each month from the Sep 1999 is added up to create a cumulative exposure map for each month.
- Using fimgstatistic, we compute count rate statistics for each CCDs.
- For observations with high data drop rates (e.g., Crab nebula, Cas A), we corrected the observations by adding events.
Please check more detail plots at Telemetered Photon Dose Trend page.
)
)
)
Statistics:
# IMAGE     NPIX     MEAN        RMS        MIN     MAX
ACIS_sep18 6004901       7.150         10.818           0.0     5032


I2 node 0  262654	9.811617	4.037781	0.0	 65.0
I2 node 1  262654	10.347843	4.818021	0.0	984.0
I2 node 2  262654	10.101509	4.018197	0.0	 79.0
I2 node 3  262654	10.229972	13.580301	0.0	4617.0

I3 node 0  262654	10.969535	4.662854	0.0	 74.0
I3 node 1  262654	10.662148	7.863735	0.0	2501.0
I3 node 2  262654	10.053404	3.931293	0.0	102.0
I3 node 3  262654	10.255194	6.341233	0.0	1811.0

S2 node 0  262654	7.685964	10.945574	0.0	5032.0
S2 node 1  262654	7.715005	3.603281	0.0	 63.0
S2 node 2  262654	7.802834	3.655585	0.0	300.0
S2 node 3  262654	7.875443	3.603220	0.0	483.0

S3 node 0  262654	8.514725	3.352489	0.0	 40.0
S3 node 1  262654	9.842460	3.963273	0.0	 95.0
S3 node 2  262654	9.615028	3.460386	0.0	110.0
S3 node 3  262654	8.717340	3.252834	0.0	 36.0
)
)
)
Statistics:
 IMAGE     NPIX      MEAN        RMS           MIN      MAX
ACIS_total   6004901       2236.479         2895.611           0.0   125766


I2 node 0  262654	1926.494836	381.725253	403.0	10912.0
I2 node 1  262654	2027.918499	533.216544	425.0	84055.0
I2 node 2  262654	2058.869271	436.920860	420.0	10812.0
I2 node 3  262654	2064.330177	534.360278	408.0	28495.0

I3 node 0  262654	2185.820734	541.118652	402.0	8718.0
I3 node 1  262654	2268.786655	1671.973651	418.0	55002.0
I3 node 2  262654	1996.982624	370.538305	400.0	11271.0
I3 node 3  262654	1986.569193	397.878473	356.0	31418.0

S2 node 0  262654	2604.206093	407.667850	1478.0	21790.0
S2 node 1  262654	2762.370643	616.634927	1620.0	15198.0
S2 node 2  262654	3056.488251	627.452211	2068.0	27710.0
S2 node 3  262654	3006.426158	479.856501	1825.0	55451.0

S3 node 0  262654	4620.789851	2091.849394	2033.0	27034.0
S3 node 1  262654	5842.181980	2235.436257	0.0	28836.0
S3 node 2  262654	4606.012385	1231.447365	1956.0	25011.0
S3 node 3  262654	3552.381703	650.540836	2181.0	24584.0
)
|
)
|
)
|
)
|
| Jun 2018 | Mar 2018 | Dec 2017 | Sep 2017 |
|---|
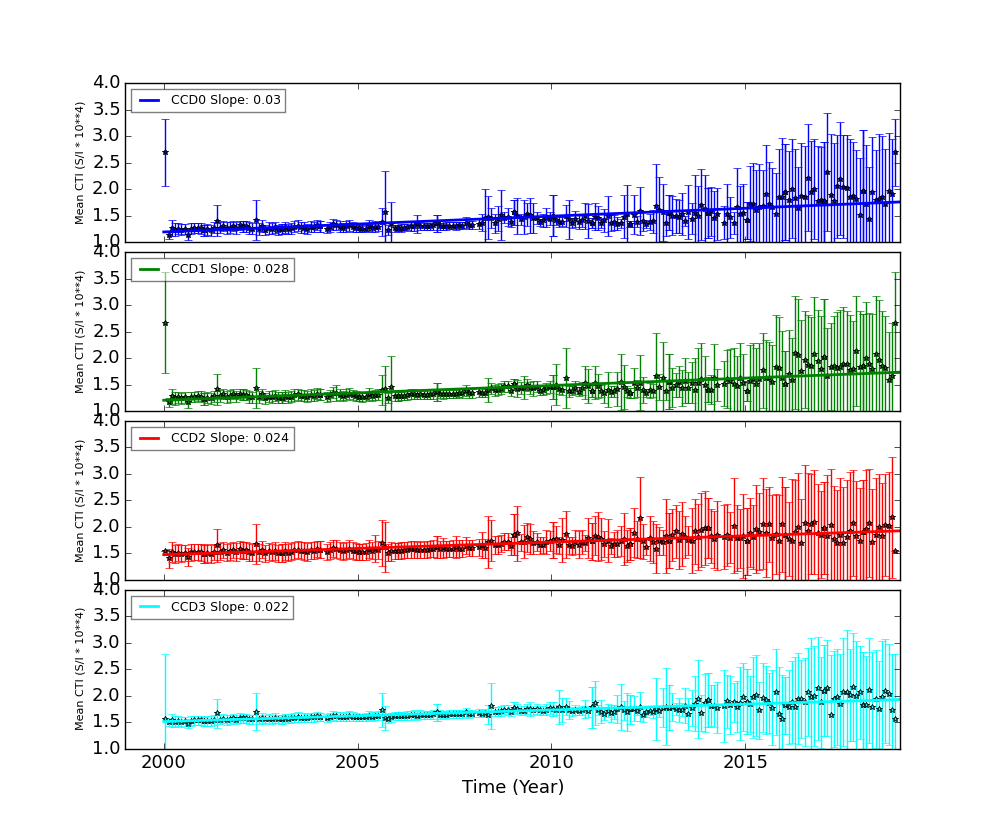
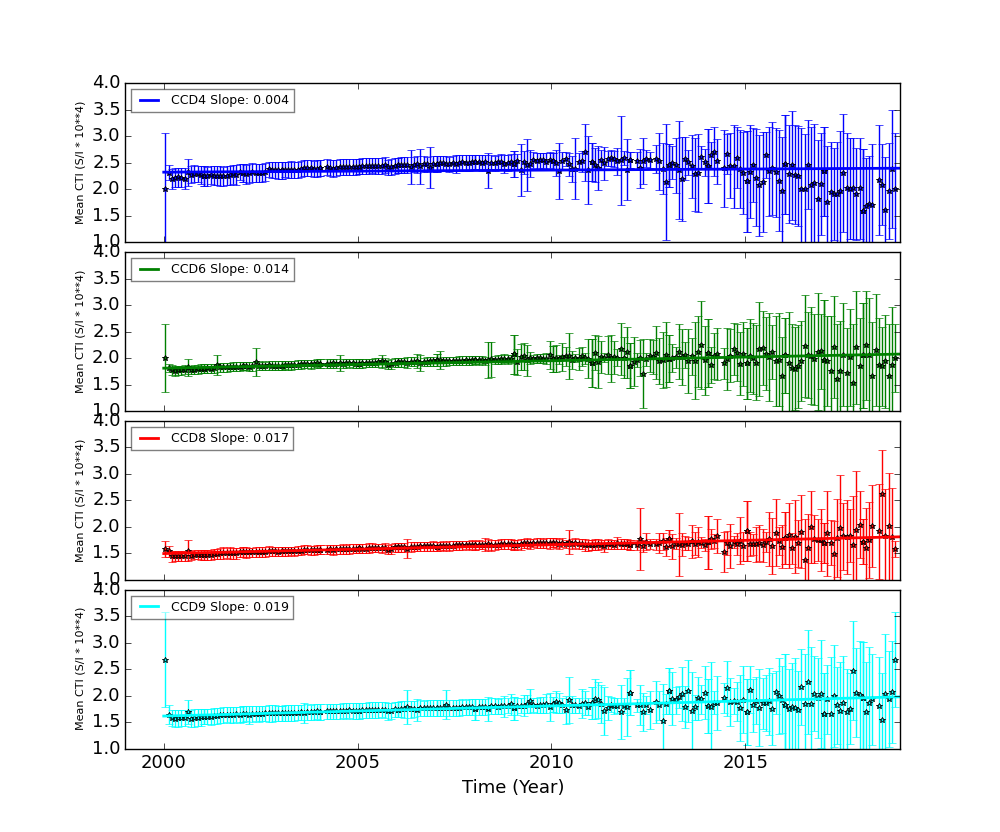
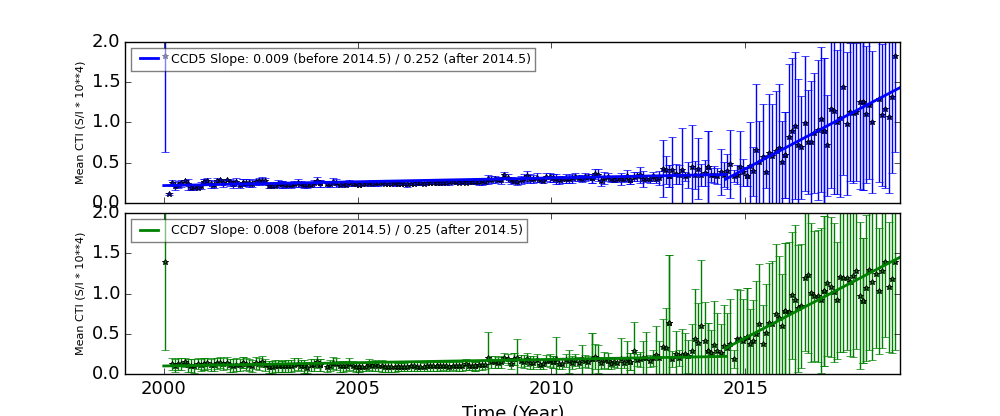
The Mean Detrended CTI
We report CTIs with a refined data definition. CTIs were computed for the temperature dependency corrected data. Please see CTI page for detailed explanation. CTI's are computed for Mn K alpha, and defined as slope/intercept x10^4 of row # vs ADU. Data file: here
Imaging CCDs
Spectral CCDs
Backside CCDs
Focal Plane Temperature
Sep 2018 Focal Temperature
| The Mean (max) FPT: | |
|---|---|
| -113.01 | +/- 3.32 C |
| Mean Width: | |
| 0.92 | +/- 0.37 days |
Averaged Focal Plane Temperature
We are using 10 period moving averages to show trends of peak temperatures and peak widths. Note, the gaps in the width plot are due to missing/corrupted data.

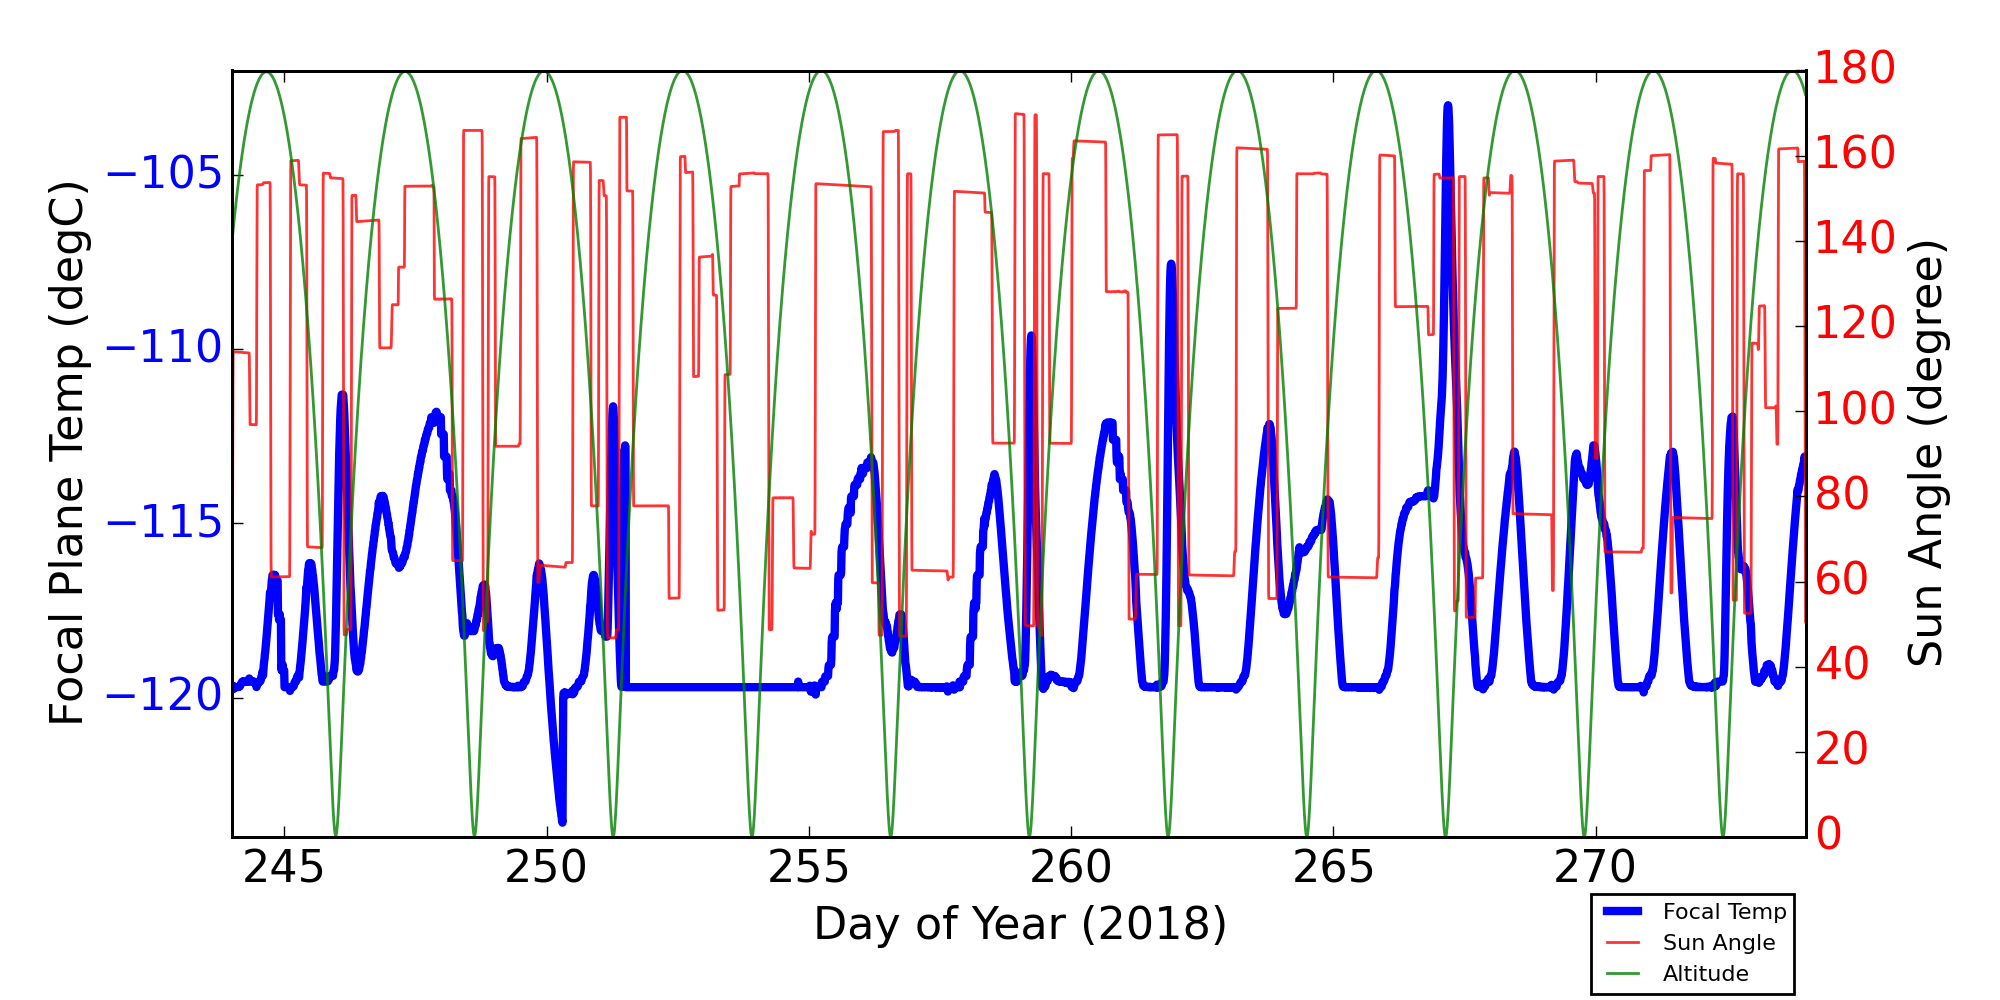
Focal Plane Temperature, Sun Angle and Altitude
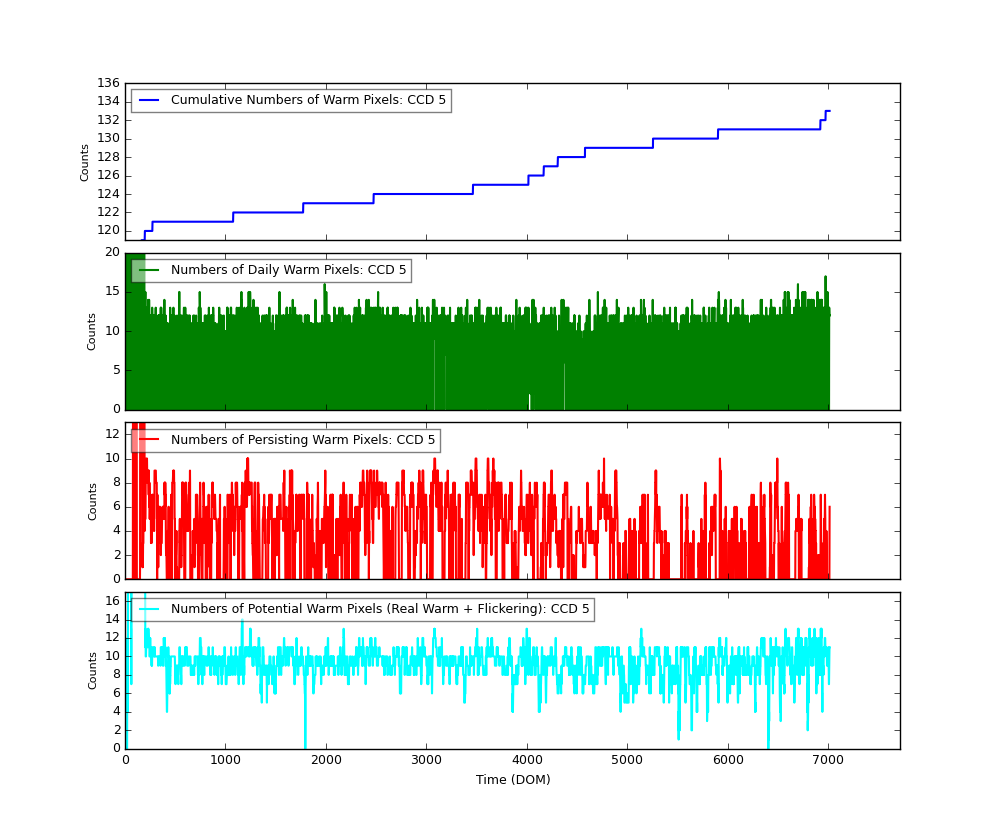
Bad Pixels
The plots below were generated with a new warm pixel finding script. Please see Acis Bad Pixel Page for details.
Front Side CCDs

Back Side CCD (CCD5)
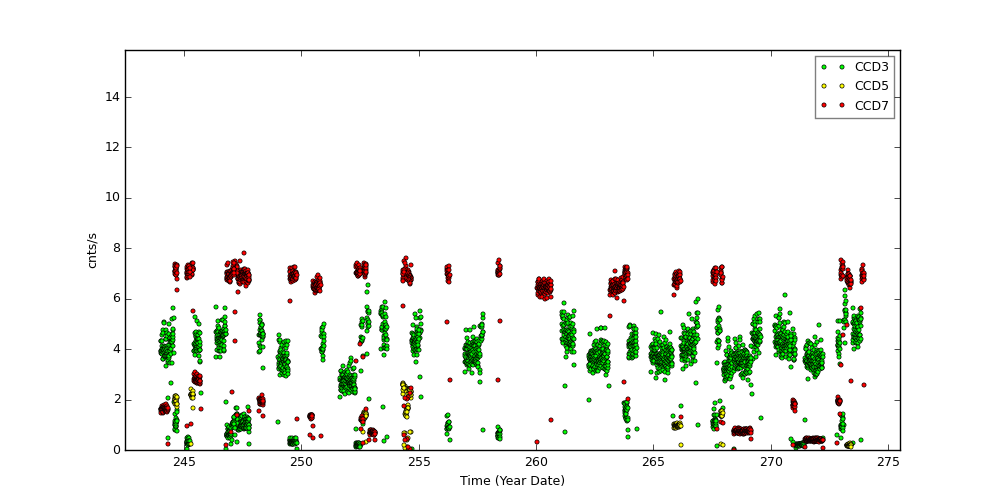
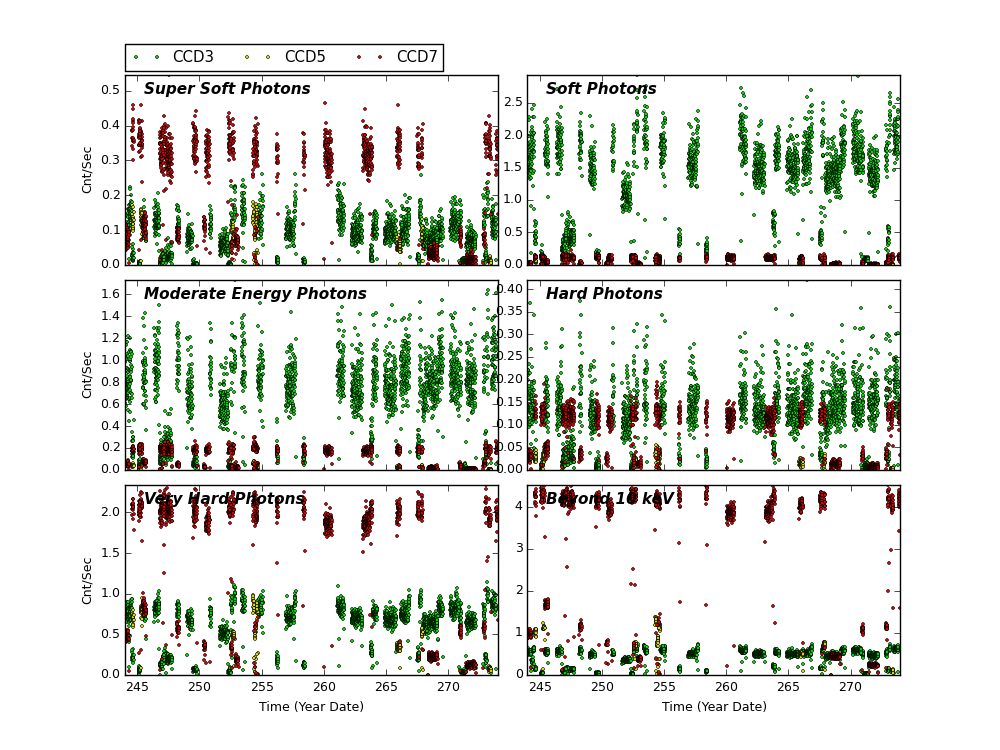
Science Instrument Background Rates
| Name | Low (keV) | High(KeV) | Description |
|---|---|---|---|
| SSoft | 0.00 | 0.50 | Super soft photons |
| Soft | 0.50 | 1.00 | Soft photons |
| Med | 1.00 | 3.00 | Moderate energy photons |
| Hard | 3.00 | 5.00 | Hard Photons |
| Harder | 5.00 | 10.00 | Very Hard photons |
| Hardest | 10.00 | Beyond 10 keV |
ACIS Rejected Events
The links below are plots of stat1 quantities, showing on-board rejected events. The average EVTSENT, DROP_AMP, DROP_POS, DROP_GRD, THR_PIX, and maximum BERR_SUM obtained from L1 acis*stat1.fits files are plotted for each observation. CTI observations are plotted separately from regular science observations.
Column definitions:
- EVTSENT - number of events sent in data record
- DROP_AMP - number of discarded events due to corrected amplitude
- DROP_POS - number of discarded events due to CCD position
- DROP_GRD - number of discarded events due to grade code
- THR_PIX - number of pixels above respective threshold level
- BERR_SUM - number of pixel bias errors so far in science run
Note the half-life decline of the CTI source is clearly evidenced in the steady janline of EVTSENT.
CCD3 CTI Observations
CCD3 Science Observations
CCD7 CTI Observations
CCD7 Science Observations
ACIS Gain Trends
We computed ACIS gain and offset from ACIS event1 files used in CTI computation, following the step described by C. Grant ACIS gain @ -120C page.
Instead computing gains and offsets from individual observations, we combined all data from each month and computed an monthly averaged gain and offset.
The following plots show CCD3 and CCD5 gains and offset trends.
| CCD 3 | |
)
|
)
|
| CCD 5 | |
)
|
)
|
[an error occurred while processing this directive]
HRC
DOSE of Central 4K Pore-Pairs
Please refer to Maximum Dose Trends for more details.
)
|
|---|
IMAGE                NPIX      MEAN    STDDEV      MIN       MAX
HRCI_09_2018.fits  16777216	0.096 	0.318 	0.000 	12.000
)
IMAGE                       NPIX      MEAN    STDDEV      MIN       MAX
HRCI_08_1999_09_2018.fits  16777216	5.448 	5.420 	0.000 	295.000
)
|
|---|
IMAGE                NPIX      MEAN    STDDEV      MIN       MAX
HRCS_09_2018.fits  16777216	0.113 	0.363 	0.000 	14.000
)
IMAGE                       NPIX      MEAN    STDDEV      MIN       MAX
HRCS_08_1999_09_2018.fits  16777216	17.725 	32.453 	0.000 	1730.000
|
|
Max dose trend plots corrected for events that "pile-up"
in the center of the taps due to bad position information.
|
)
|
)
|
)
|
)
|
| Jun 2018 | Mar 2018 | Dec 2017 | Sep 2017 |
|---|
)
|
)
|
)
|
)
|
| Jun 2018 | Mar 2018 | Dec 2017 | Sep 2017 |
|---|
Gratings
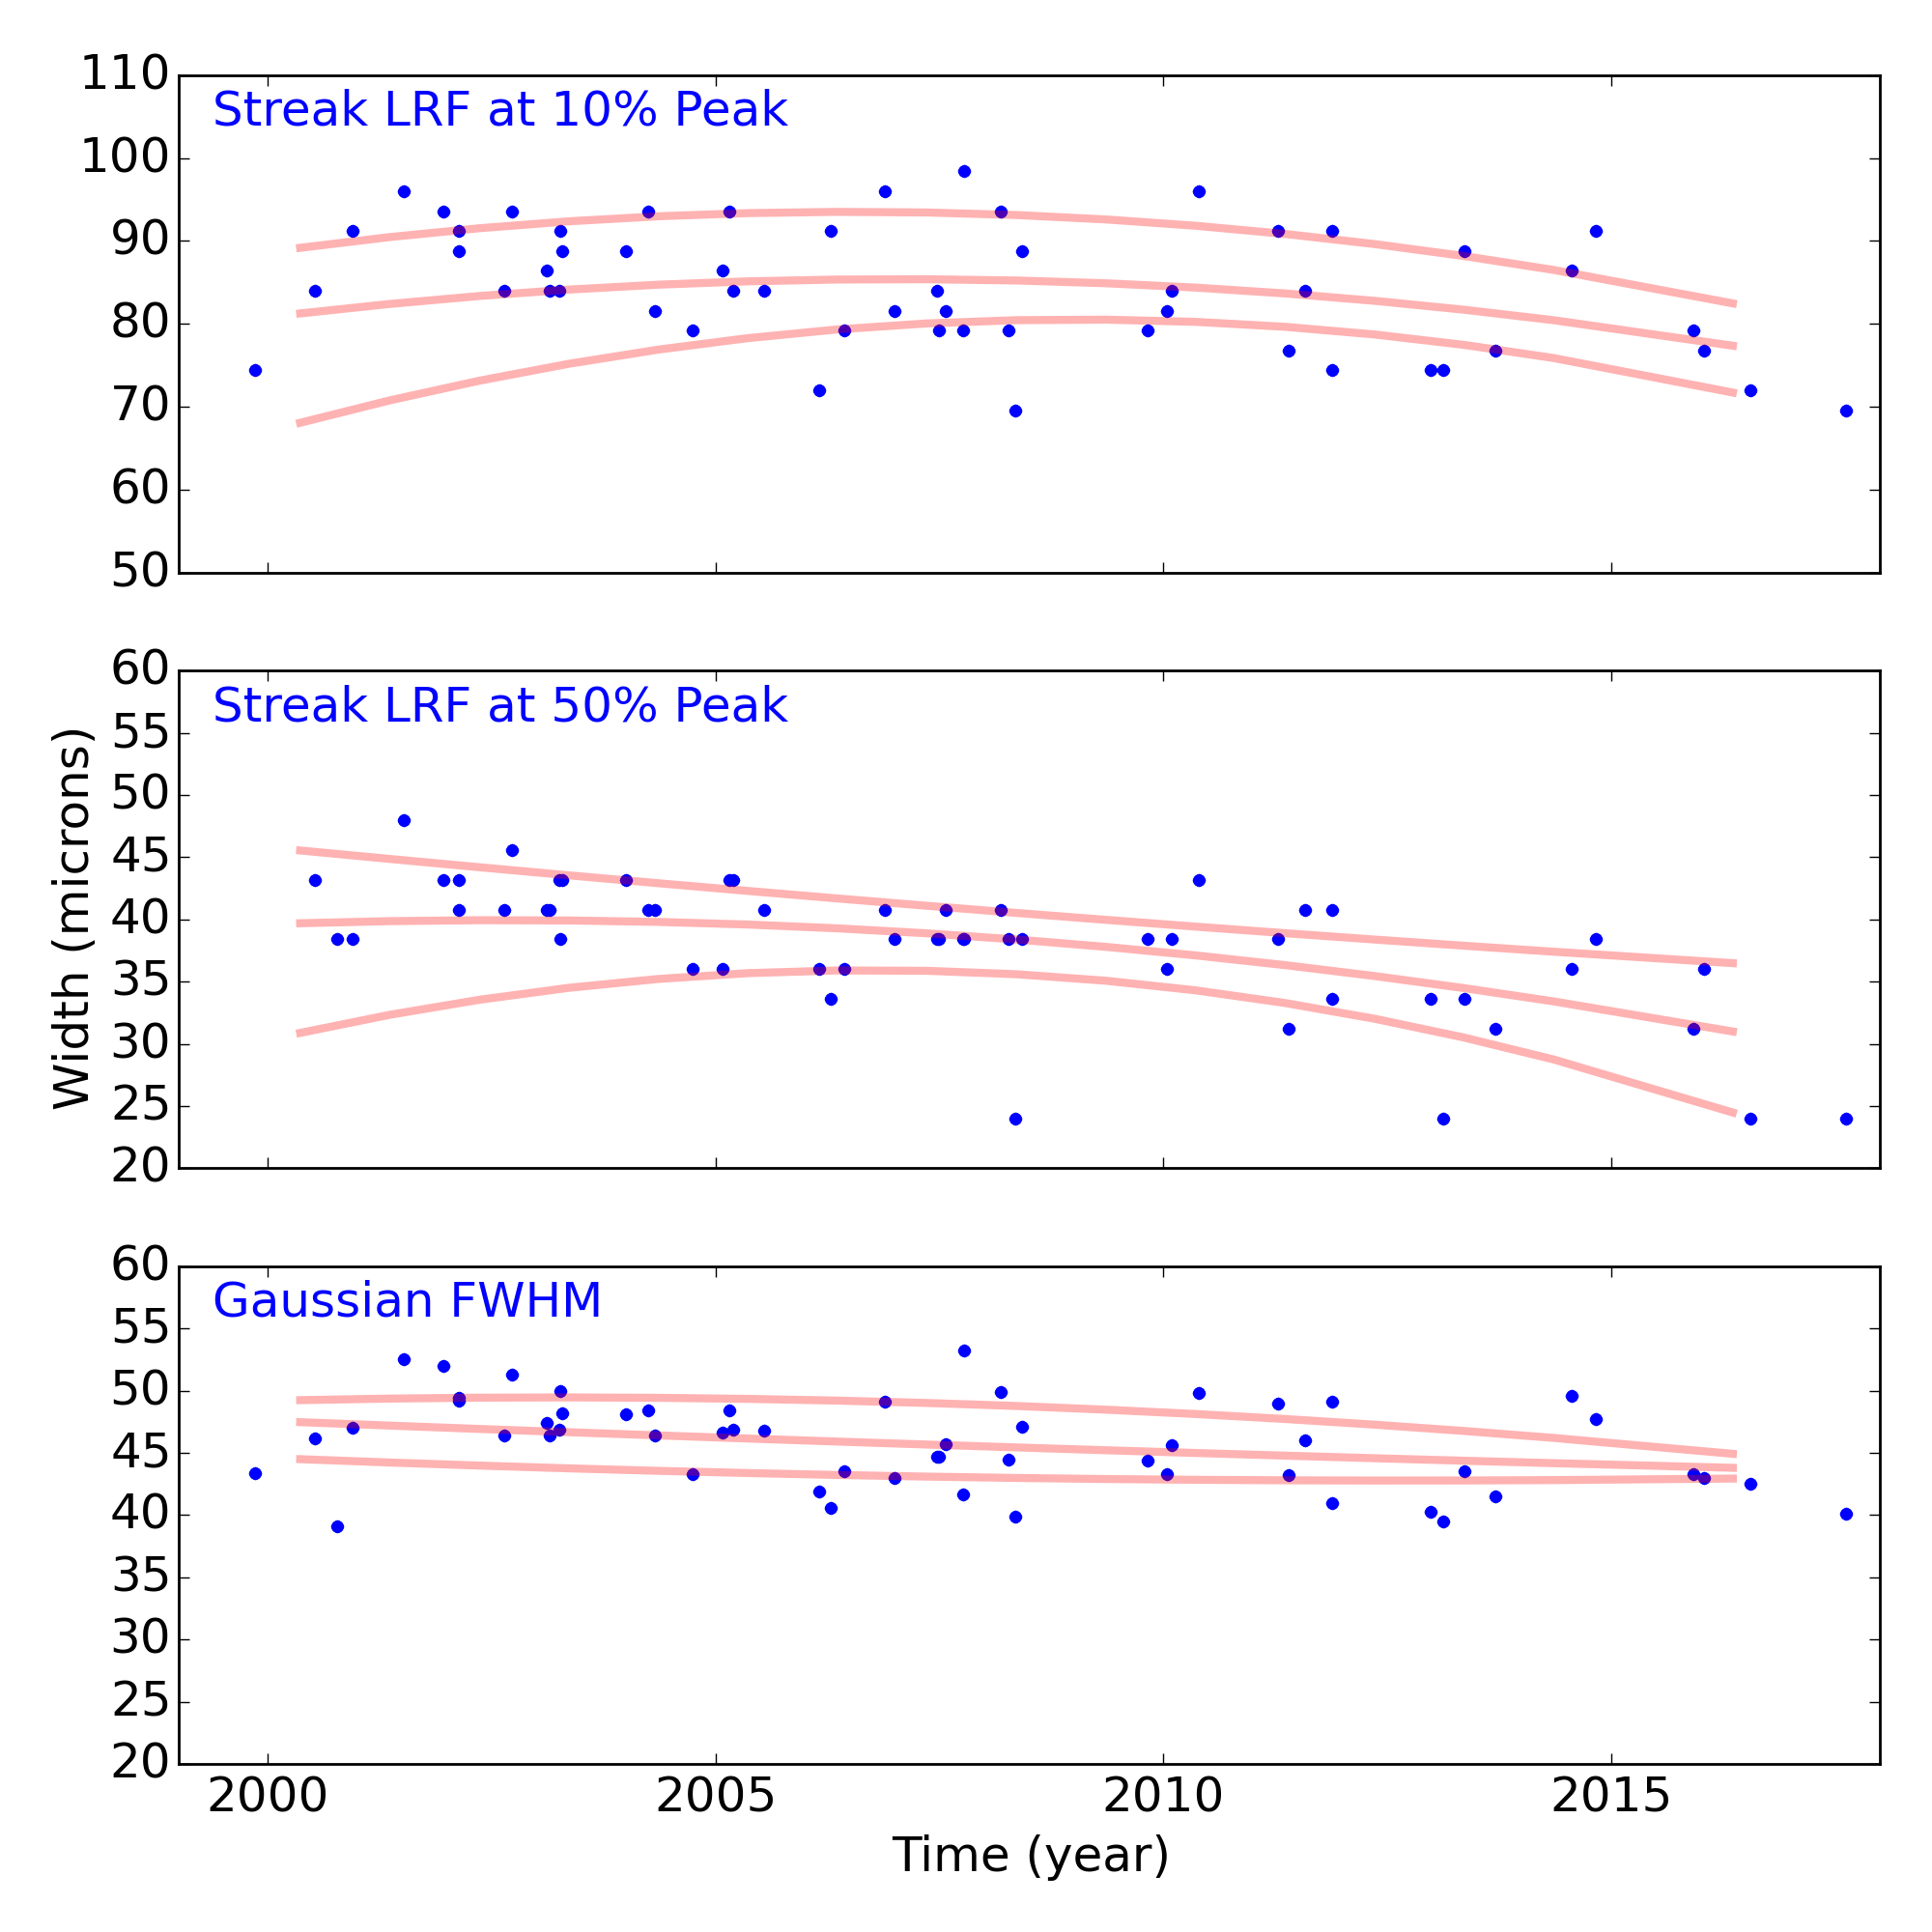
Grating Trends/Focus
We plot the width of the zero order streak of ACIS/HETG observations and the width of the zero order image for HRC/LETG observations of point sources. No significant defocusing trend is seen at this time. See Gratings Trends pages.

PCAD
ACA Trending
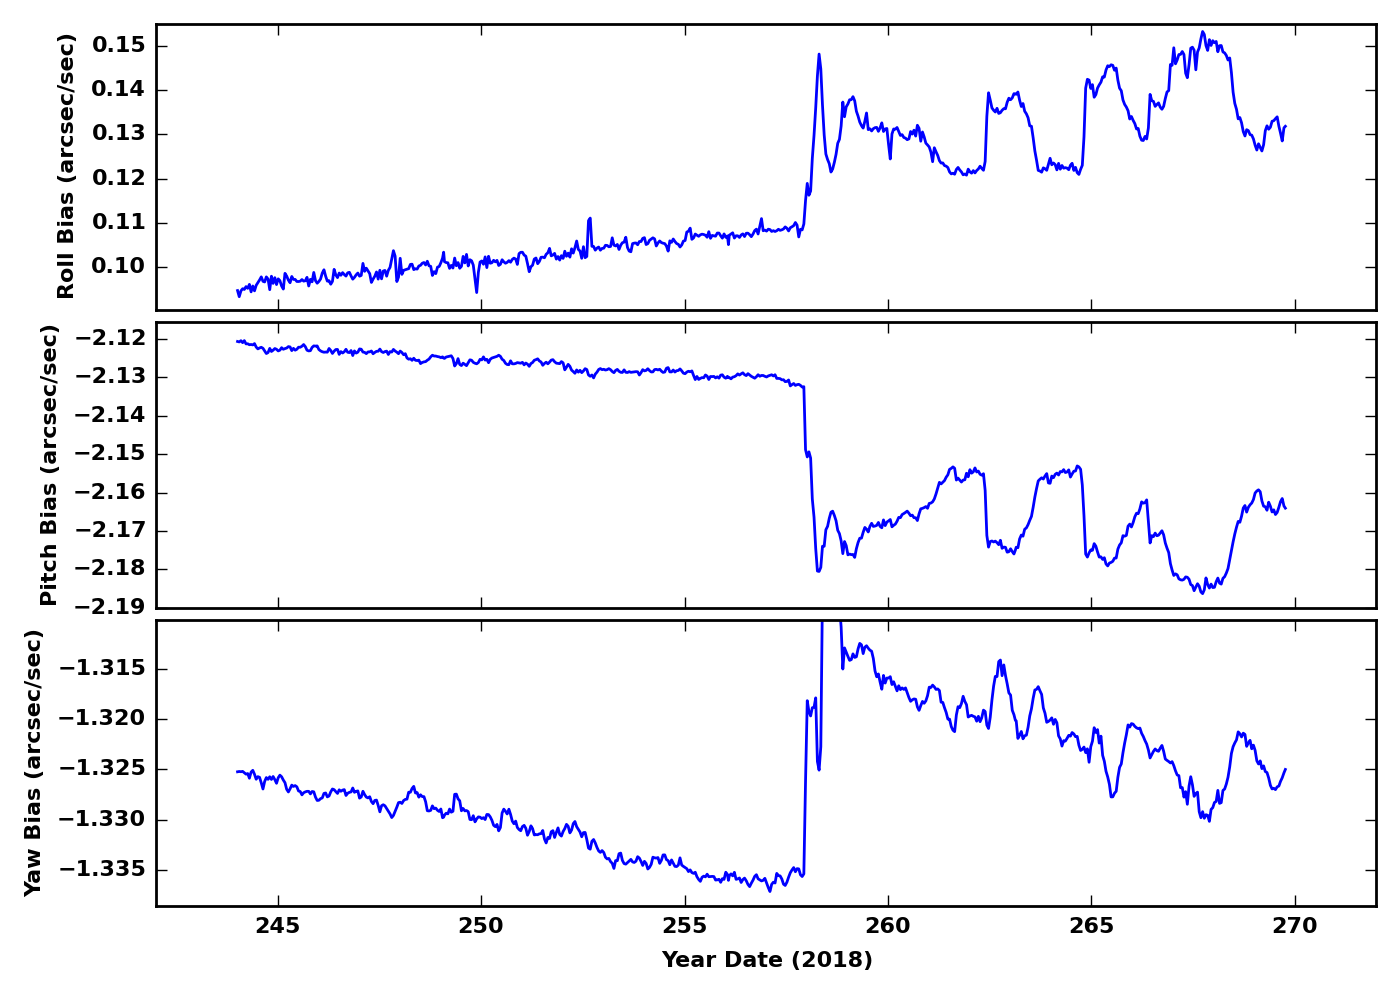
Gyro Bias Drift
Radiation History
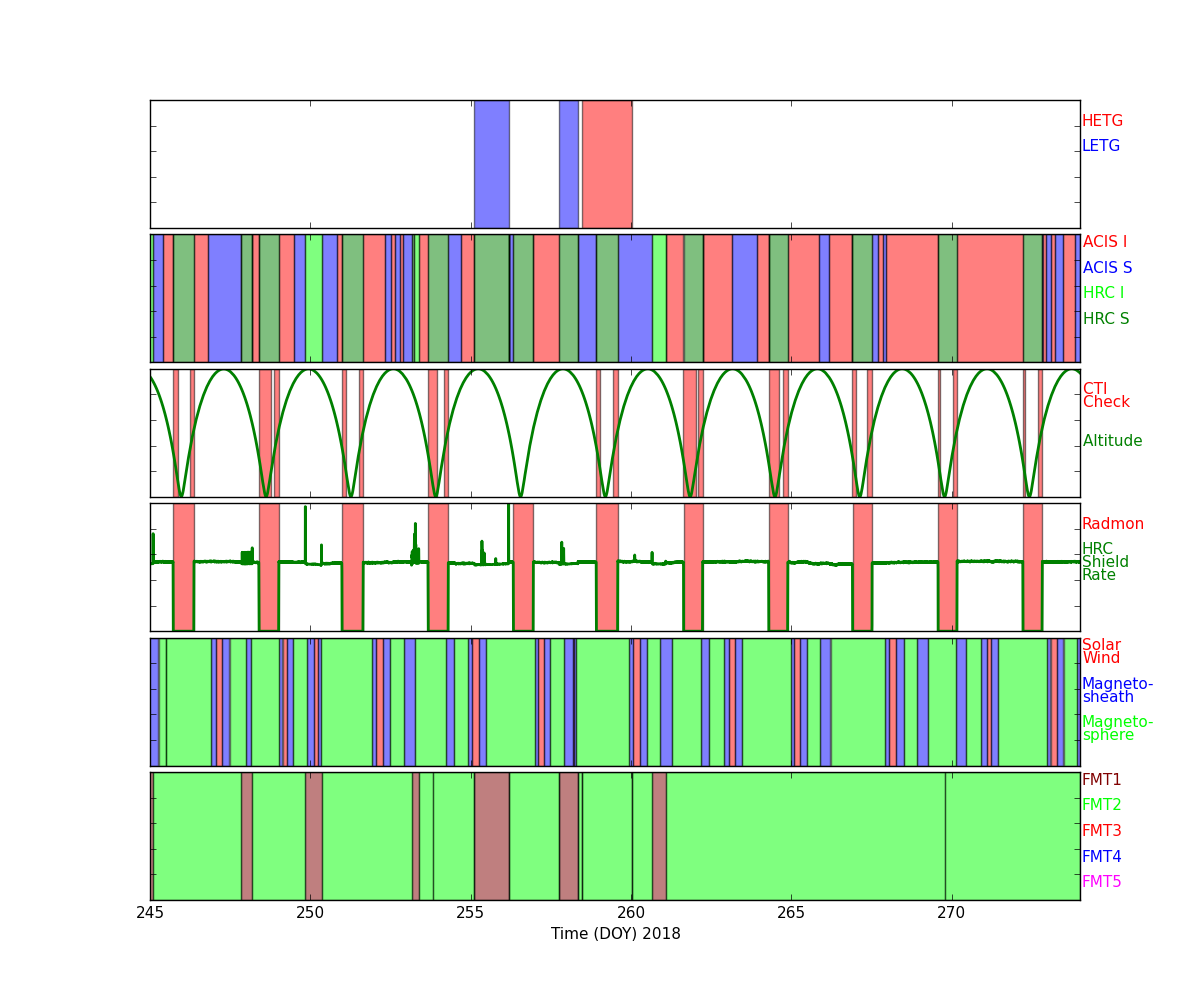
Radiation Zone Timing
Plotted below are radiation zone timing plots based on the following definitions of radiation zone:
- RADZONE - Ephin levels (in any of the E1300,P4GM,P41GM channels) are more than 1/3 of RADMON safing thresholds.
- RADMON - Radmon is disabled for radiation zone (as commanded based on OFLS model, for comparison with actual radiation levels).
- PERIGEE - Time of closest earth approach (for comparison)
Radiation Count Rates of Sep 2018
Sun Spot History

-->
Trending
Critical Trends
| ACIS Temperatures - Daily Maximums | ||||||
|---|---|---|---|---|---|---|
| MSID | MEAN | RMS | DELTA/YR | DELTA/YR/YR | UNITS | DESCRIPTION |
| 1pdeaat | 304.157 | 6.639 | 0.017+/-0.001 | 1.682+/-0.081 | K | PSMC DEA POWER SUPPLY TEMP A |
| 1pin1at | 338.510 | 11.313 | -0.032+/-0.004 | -2.183+/-0.163 | K | PSMC TEMP 1A |
| HRMA Computed Averages - Daily Maximums | ||||||
|---|---|---|---|---|---|---|
| MSID | MEAN | RMS | DELTA/YR | DELTA/YR/YR | UNITS | DESCRIPTION |
| obaavg | 295.426 | 1.546 | (-5.67+/-3.18)e-4 | -0.475+/-0.018 | TEMP | OBA/TFTE |
| EPHIN Temperatures - Daily Maximums | ||||||
|---|---|---|---|---|---|---|
| MSID | MEAN | RMS | DELTA/YR | DELTA/YR/YR | UNITS | DESCRIPTION |
| teio | 330.358 | 21.043 | -0.020+/-0.003 | -1.738+/-0.200 | K | EPHIN ELECTRONICS HOUSING TEMP |
| tephin | 335.172 | 6.704 | -0.033+/-0.001 | -0.736+/-0.126 | K | EPHIN SENSOR HOUSING TEMP |
| S/C Main Temperatures - Daily Maximums | ||||||
|---|---|---|---|---|---|---|
| MSID | MEAN | RMS | DELTA/YR | DELTA/YR/YR | UNITS | DESCRIPTION |
| S/C Ancillary Temperatures - Daily Maximums | ||||||
|---|---|---|---|---|---|---|
| MSID | MEAN | RMS | DELTA/YR | DELTA/YR/YR | UNITS | DESCRIPTION |
| tfssbkt1 | 339.564 | 21.853 | -0.008+/-0.003 | -0.087+/-0.123 | K | FSS BRACKET-1 TEMP (+Y) |
| tfssbkt2 | 333.883 | 27.800 | 0.008+/-0.004 | 0.466+/-0.148 | K | FSS BRACKET-2 TEMP (-Y) |
| tsctsf1 | 312.030 | 3.653 | -0.005+/-0.001 | -0.325+/-0.045 | K | SC-TS FITTING -1 TEMP |
| tsctsf6 | 312.395 | 3.745 | -0.008+/-0.001 | -0.675+/-0.053 | K | SC-TS FITTING -6 TEMP |
| MUPS - Daily Maximums | ||||||
|---|---|---|---|---|---|---|
| MSID | MEAN | RMS | DELTA/YR | DELTA/YR/YR | UNITS | DESCRIPTION |
| pm1thv1t | 346.836 | 8.391 | 0.002+/-0.001 | 0.574+/-0.046 | K | MUPS 1 THRUSTER VALVE 01 TEMP |
| pline02t | 328.407 | 8.970 | 0.003+/-0.001 | 0.942+/-0.055 | K | PROP LINE TEMP 02 |
| pline03t | 324.170 | 11.715 | 0.012+/-0.002 | 1.090+/-0.066 | K | PROP LINE TEMP 03 |
| pline04t | 309.706 | 9.814 | 0.014+/-0.001 | 1.193+/-0.065 | K | PROP LINE TEMP 04 |
Quarterly Trends
- PCAD FTS Temperature and Gradient
| Previous Quarter | ||||||
| MSID | MEAN | RMS | DELTA/YR | DELTA/YR/YR | UNITS | DESCRIPTION |
| ohrthr27 | 297.176 | 0.015 | (1.62+/-0.22)e-5 | (-3.69+/-3.75)e-4 | K | RT 20 : PERISCOPE |
|---|---|---|---|---|---|---|
| ohrthr42 | 295.102 | 0.228 | (-7.74+/-3.39)e-5 | 0.004+/-0.007 | K | RT 133: PERISCOPE |
| ohrthr43 | 295.313 | 0.296 | (-1.83+/-0.44)e-4 | 0.010+/-0.009 | K | RT 134: PERISCOPE |
| oobagrd3 | -0.285 | 0.086 | (9.50+/-1.23)e-5 | -0.001+/-0.002 | K | RT 505 TO RT 504: PERISCOPE GRADIENT MONITOR |
| oobagrd6 | 0.088 | 0.006 | (-4.83+/-0.90)e-6 | (1.23+/-1.56)e-4 | K | RT 507 TO RT 506: PERISCOPE GRADIENT MONITOR |
- SIM Temperature
| Previous Quarter | ||||||
| MSID | MEAN | RMS | DELTA/YR | DELTA/YR/YR | UNITS | DESCRIPTION |
| 3btu_bpt | 267.797 | 6.468 | 0.021+/-0.001 | 0.376+/-0.081 | K | BTU BASEPLATE (+X) |
|---|---|---|---|---|---|---|
| 3tsmxcet | 244.457 | 39.040 | -0.064+/-0.006 | -0.876+/-0.155 | K | -X TURTLE SHELL |
| 3tsmxspt | 449.376 | 195.919 | 0.145+/-0.032 | -3.886+/-0.897 | K | -X TURTLE SHELL |
- SIIM Electronics
| Previous Quarter | ||||||
| MSID | MEAN | RMS | DELTA/YR | DELTA/YR/YR | UNITS | DESCRIPTION |
| agrndadc | -9.488e-06 | 1.833e-04 | (-2.93+/-0.51)e-7 | (-1.34+/-0.09)e-5 | --- | agrndadc |
|---|---|---|---|---|---|---|
| fatabadc | 4.992 | 0.076 | (-4.35+/-0.70)e-6 | -0.003+/-0.000 | V | FA Tab Position Sensor A/D Converter |
| n15vadc | -15.015 | 0.001 | (-1.08+/-0.15)e-6 | (-3.94+/-0.16)e-5 | V | -15V Power Supply A/D Converter Reading |
| p15vadc | 14.963 | 0.001 | (-1.36+/-0.15)e-6 | (-4.97+/-0.28)e-5 | V | +15V Power Supply A/D Converter Reading |
| p5vadc | 4.985 | 0.023 | (-5.25+/-0.69)e-5 | -0.002+/-0.000 | V | +5V Power Supply A/D Converter Reading |
| tsctabadc | 4.981 | 0.152 | (-4.51+/-2.25)e-5 | -0.014+/-0.000 | V | TSC Tab Position Sensor A/D converter |
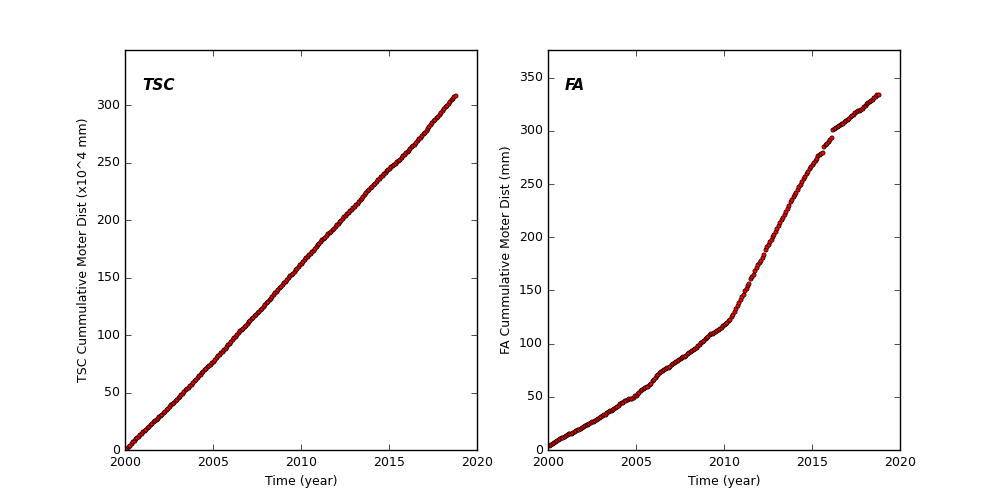
Spacecraft Motions
TSC and FA Cummulative Moter Distance
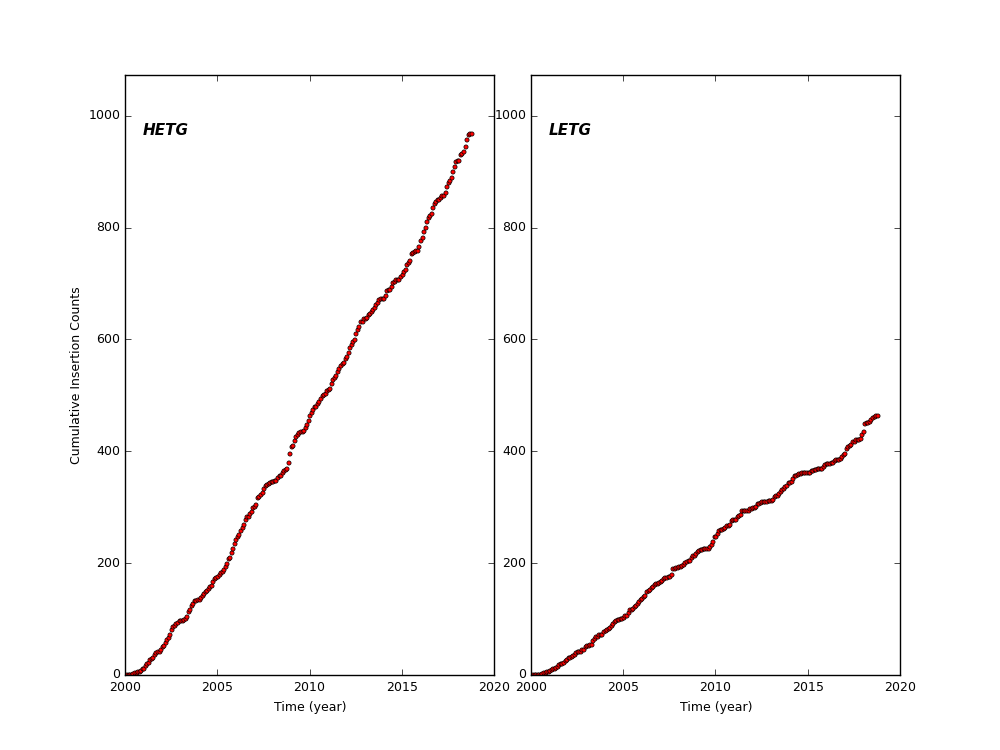
HETG and LETG Cummulative Insertion Counts
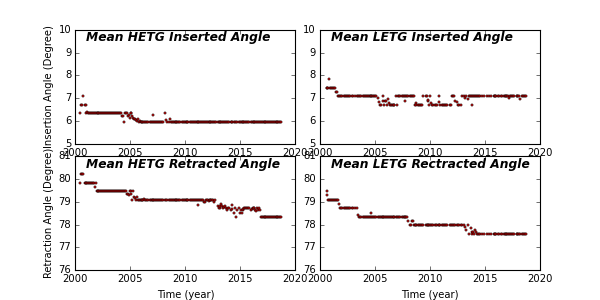
HETG/LETG Insertion/Retraction Angle
Reaction Wheel Rotations
