ACIS
ACIS DOSE Registered-Photon-Map
The steps we took to compute the dose map are;
- Level 1 Event files for a specified month are obtained from archive.
- Image data including I2, I3, S2, S3 CCDs are extracted from all event files.
- All the extracted image data were merged to create a month long exposure map for the month.
- The exposure map is opened with ds9, and check a distribution of count rates against energy. From this, estimate the upper threshold value. Any events beyond this upper threshold are assumed erroneous events such as bad pixels.
- Using this upper threshold, the data is filtered, and create a cleaned exposure map for the month.
- The exposure map from each month from the Sep 1999 is added up to create a cumulative exposure map for each month.
- Using fimgstatistic, we compute count rate statistics for each CCDs.
- For observations with high data drop rates (e.g., Crab nebula, Cas A), we corrected the observations by adding events.
Please check more detail plots at Telemetered Photon Dose Trend page.
)
)
)
Statistics:
# IMAGE     NPIX     MEAN        RMS        MIN     MAX
ACIS_oct18 6004901       7.889         12.182           0.0      725


I2 node 0  262654	12.336687	4.704146	0.0	100.0
I2 node 1  262654	12.358125	4.754106	0.0	116.0
I2 node 2  262654	12.204207	4.572138	0.0	106.0
I2 node 3  262654	12.178645	4.705448	0.0	 52.0

I3 node 0  262654	12.753992	5.006077	0.0	119.0
I3 node 1  262654	11.534736	5.233986	0.0	137.0
I3 node 2  262654	10.945334	4.086627	0.0	 90.0
I3 node 3  262654	12.036895	4.757816	0.0	209.0

S2 node 0  262654	5.045121	2.602746	0.0	155.0
S2 node 1  262654	5.028377	2.692319	0.0	 49.0
S2 node 2  262654	5.127386	2.832523	0.0	375.0
S2 node 3  262654	5.162831	2.746564	0.0	326.0

S3 node 0  262654	11.653263	3.946536	0.0	 60.0
S3 node 1  262654	13.222627	4.915794	0.0	183.0
S3 node 2  262654	13.020784	4.153915	0.0	 81.0
S3 node 3  262654	11.876159	3.910204	0.0	 36.0
)
)
)
Statistics:
 IMAGE     NPIX      MEAN        RMS           MIN      MAX
ACIS_total   6004901       2244.368         2905.188           0.0   125999


I2 node 0  262654	1938.831523	383.996198	412.0	11012.0
I2 node 1  262654	2040.276625	535.448204	429.0	84055.0
I2 node 2  262654	2071.073477	438.949729	428.0	10901.0
I2 node 3  262654	2076.508822	536.703762	417.0	28504.0

I3 node 0  262654	2198.574725	543.851188	406.0	8739.0
I3 node 1  262654	2280.321390	1675.074651	429.0	55043.0
I3 node 2  262654	2007.927958	372.162392	408.0	11354.0
I3 node 3  262654	1998.606088	400.231959	360.0	31496.0

S2 node 0  262654	2609.251214	408.481007	1480.0	21800.0
S2 node 1  262654	2767.399020	617.645392	1622.0	15224.0
S2 node 2  262654	3061.615637	627.981801	2069.0	27713.0
S2 node 3  262654	3011.588989	480.105396	1826.0	55691.0

S3 node 0  262654	4632.443114	2091.659669	2040.0	27048.0
S3 node 1  262654	5855.404606	2235.806678	0.0	28883.0
S3 node 2  262654	4619.033169	1231.387276	1968.0	25030.0
S3 node 3  262654	3564.257863	650.192720	2187.0	24597.0
)
|
)
|
)
|
)
|
| Jul 2018 | Apr 2018 | Jan 2018 | Oct 2017 |
|---|
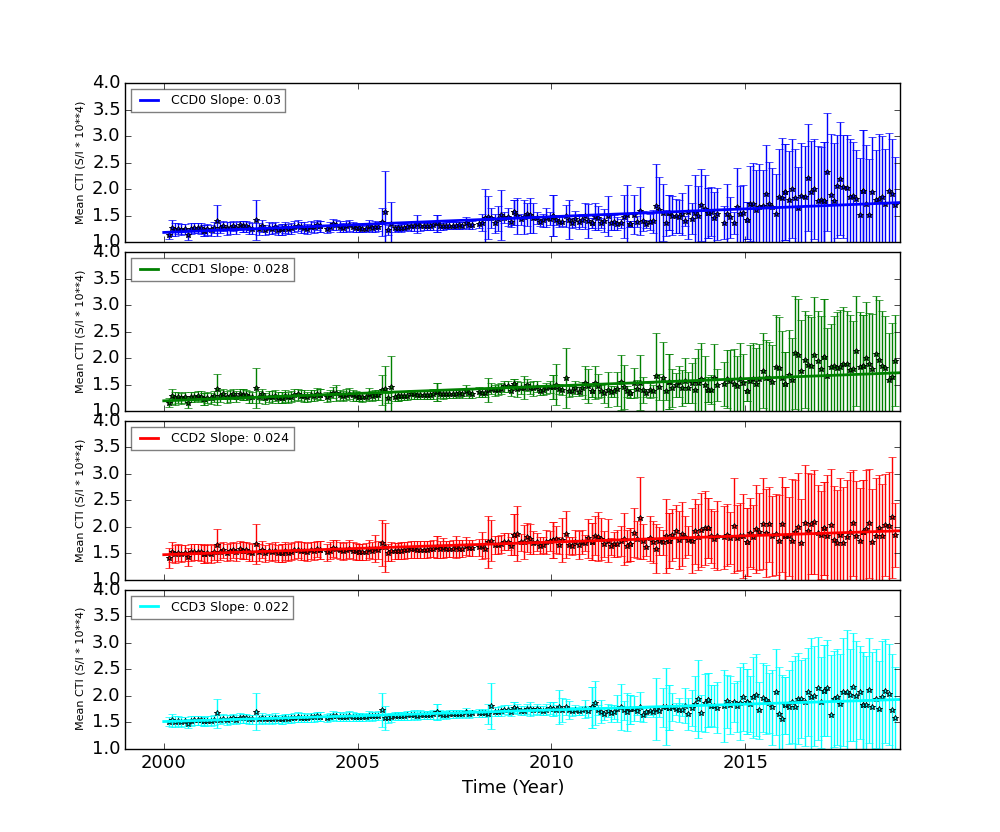
The Mean Detrended CTI
We report CTIs with a refined data definition. CTIs were computed for the temperature dependency corrected data. Please see CTI page for detailed explanation. CTI's are computed for Mn K alpha, and defined as slope/intercept x10^4 of row # vs ADU. Data file: here
Imaging CCDs
Spectral CCDs
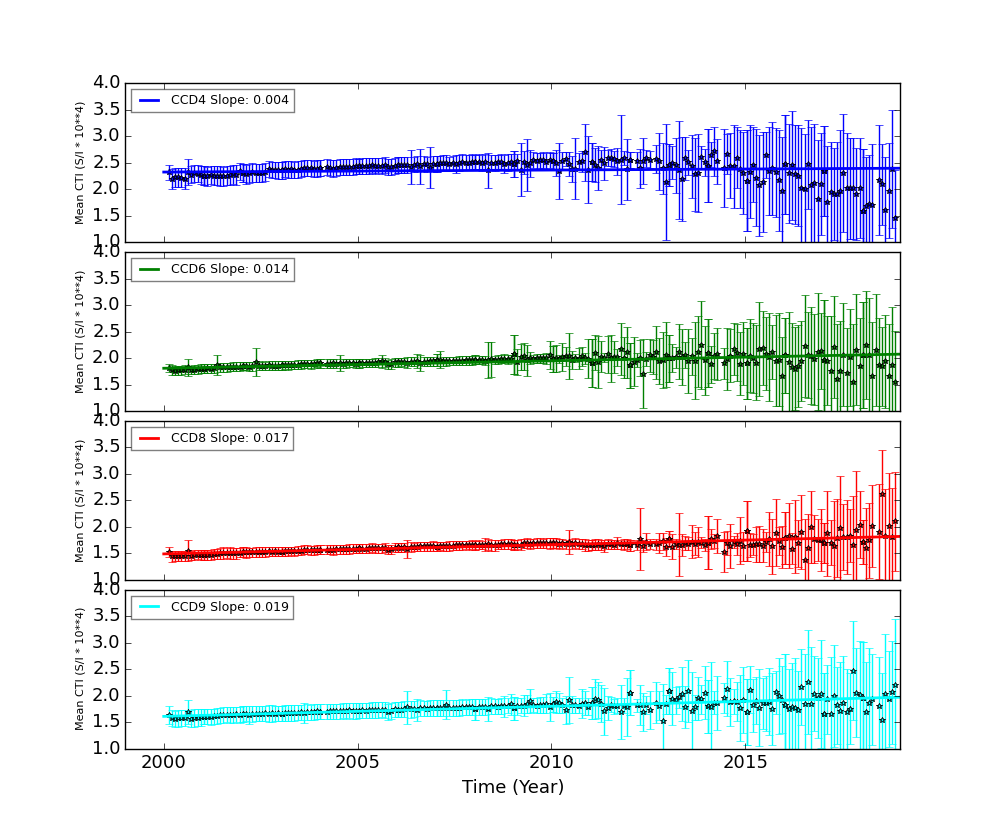
Backside CCDs

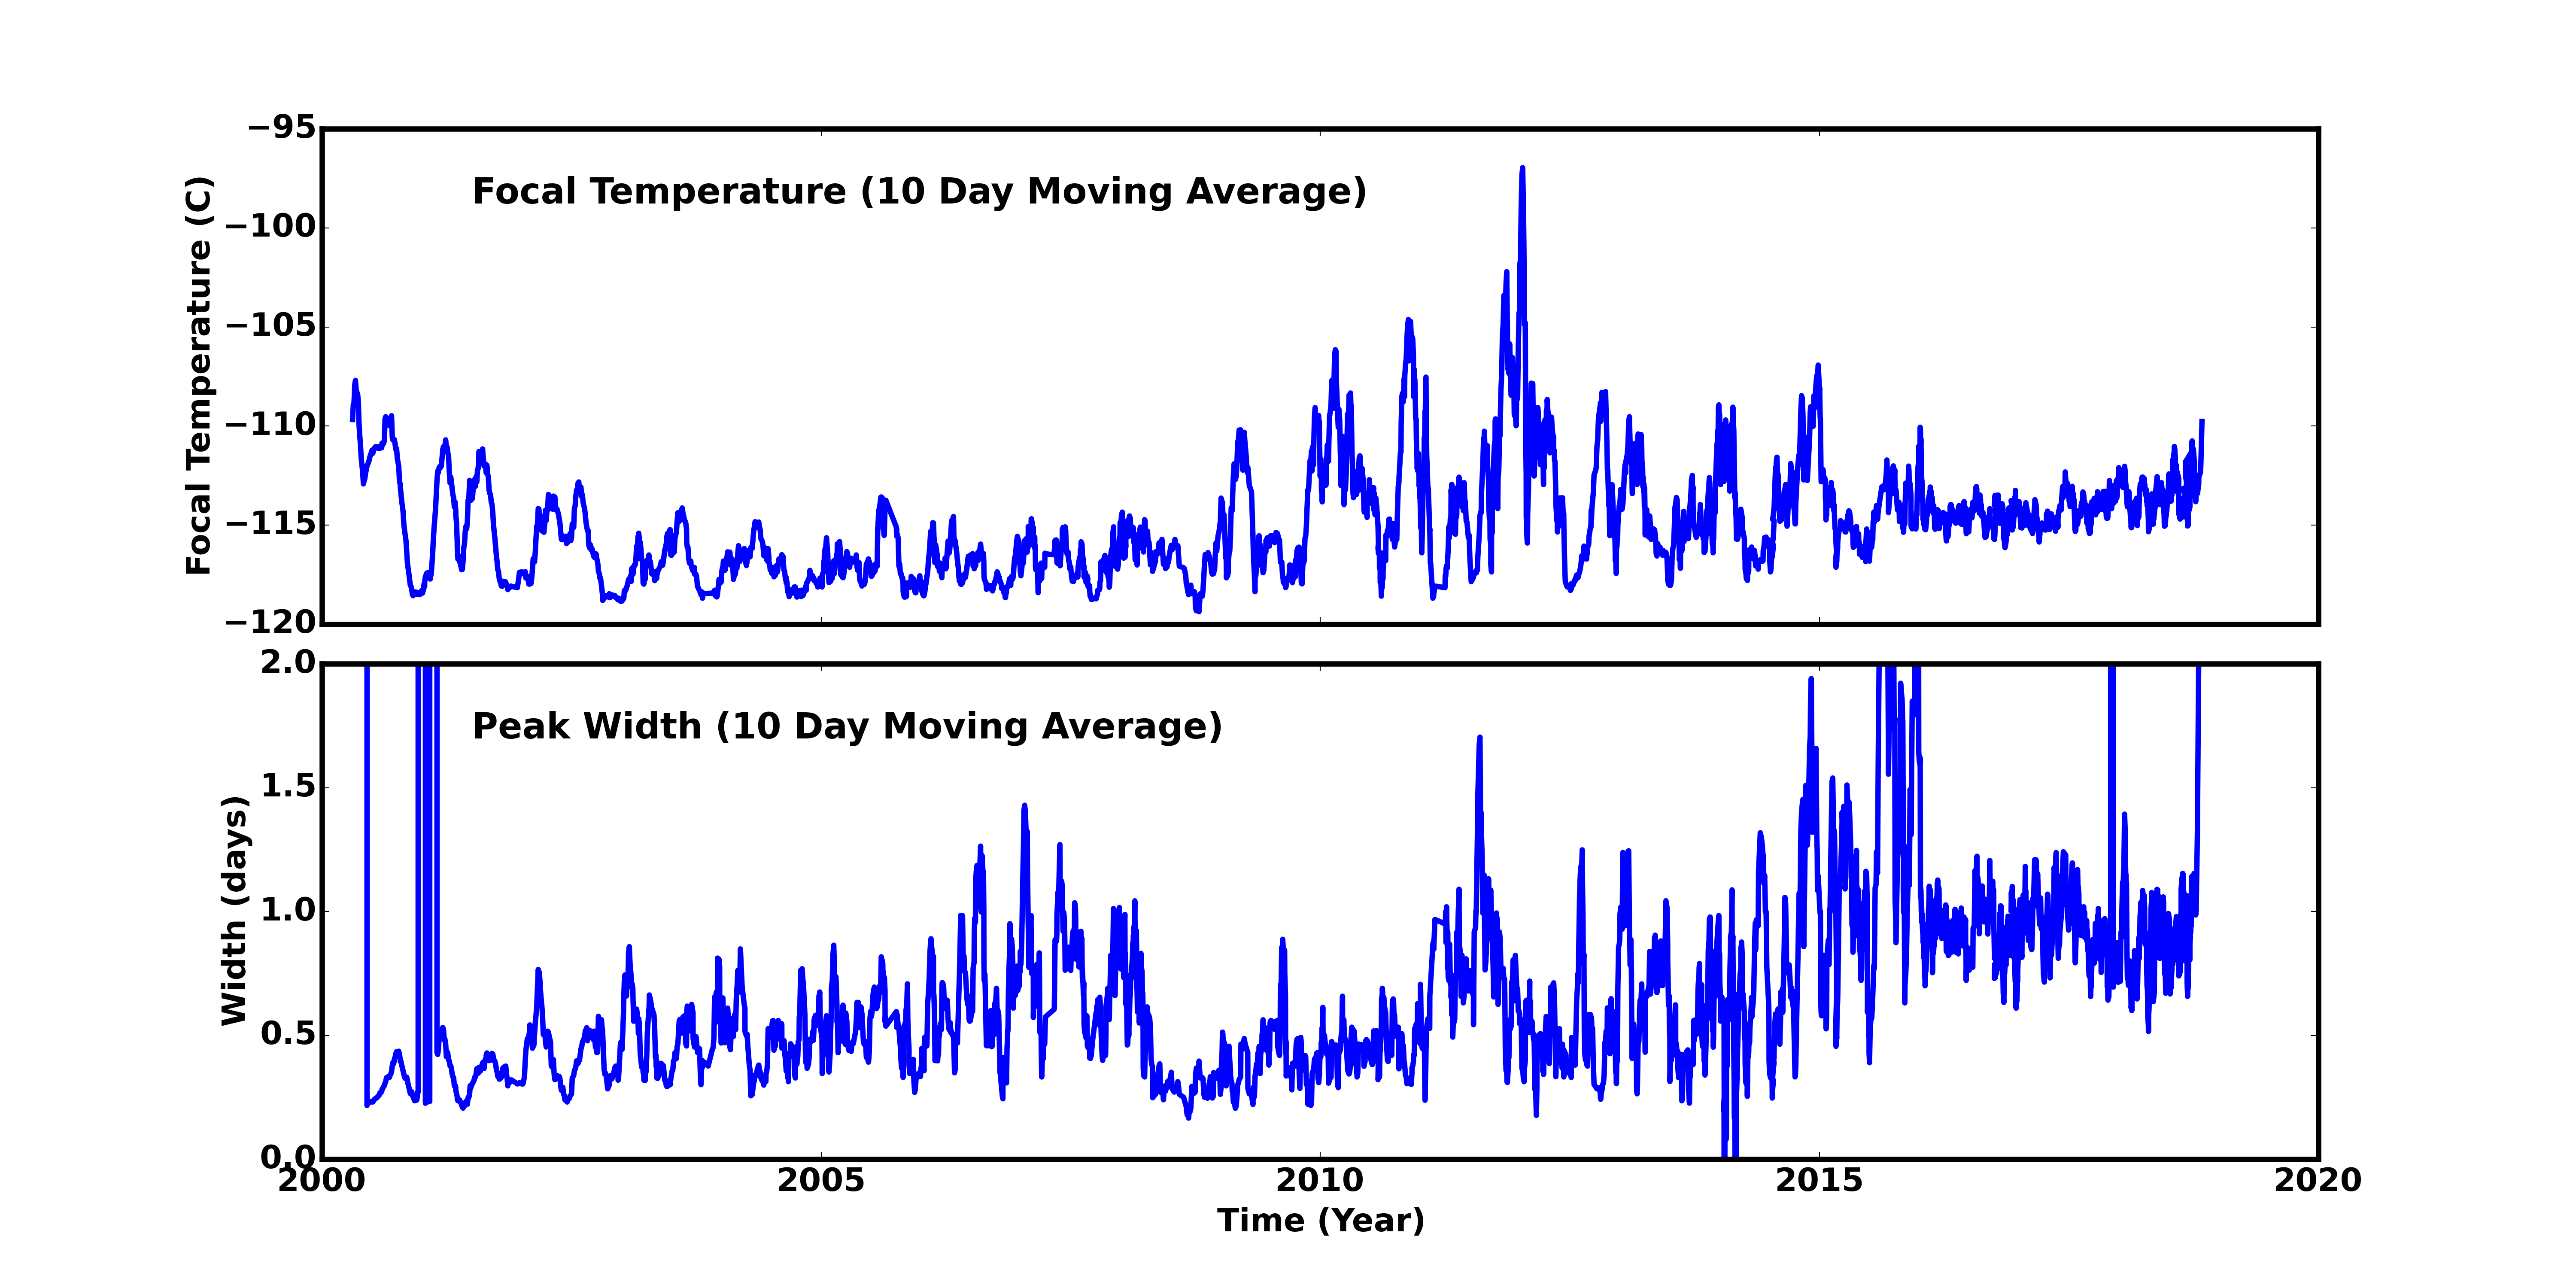
Focal Plane Temperature
Oct 2018 Focal Temperature
| The Mean (max) FPT: | |
|---|---|
| -111.59 | +/- 4.34 C |
| Mean Width: | |
| 2.38 | +/- 2.53 days |
Averaged Focal Plane Temperature
We are using 10 period moving averages to show trends of peak temperatures and peak widths. Note, the gaps in the width plot are due to missing/corrupted data.
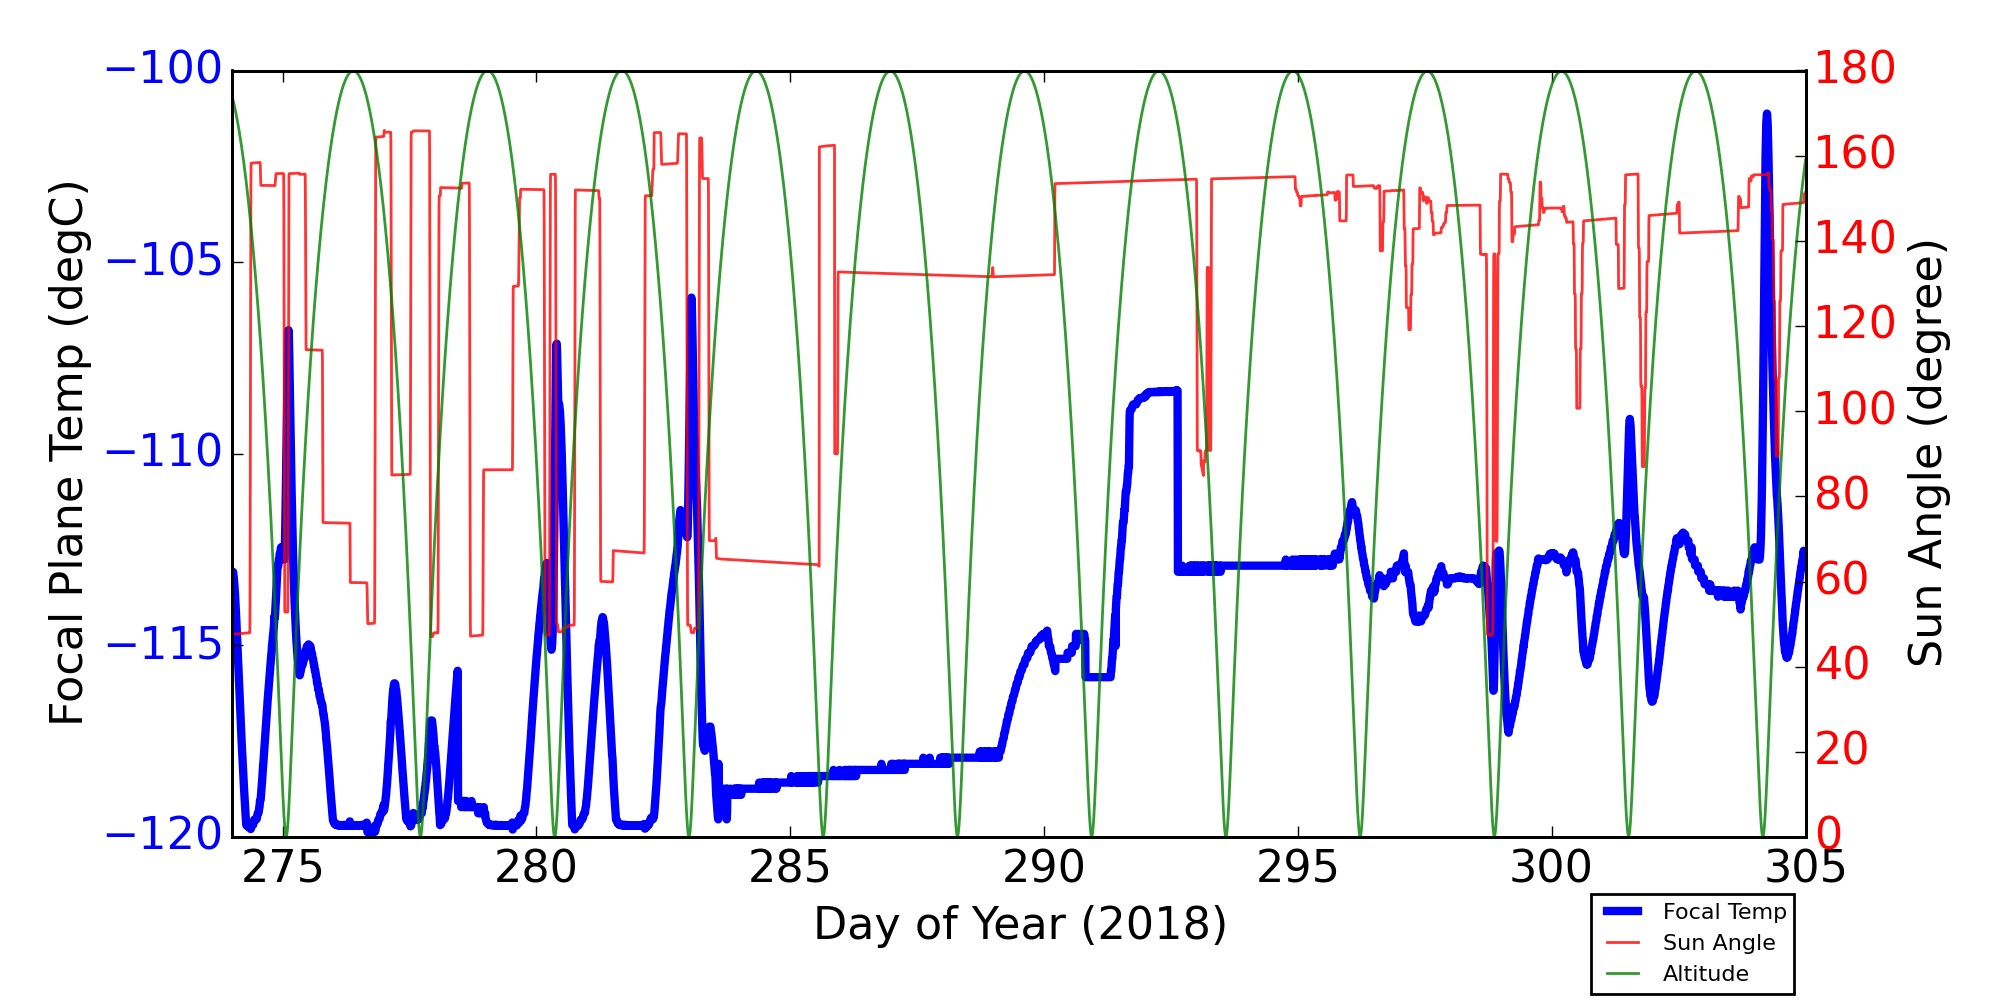
Focal Plane Temperature, Sun Angle and Altitude
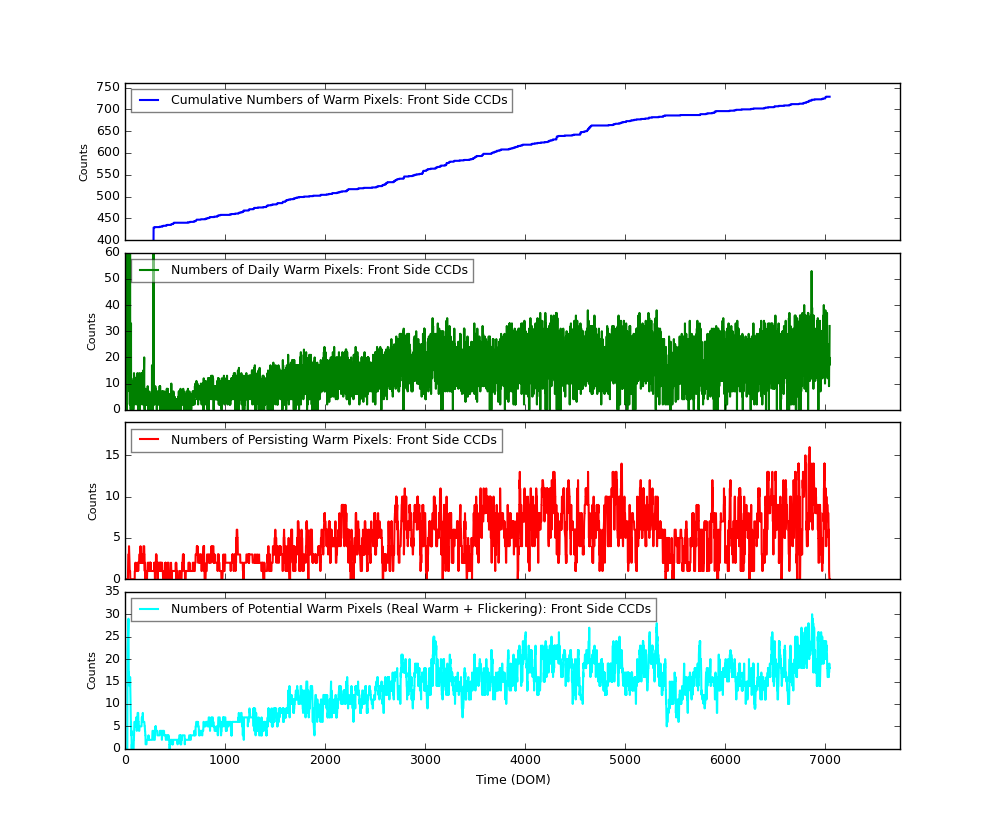
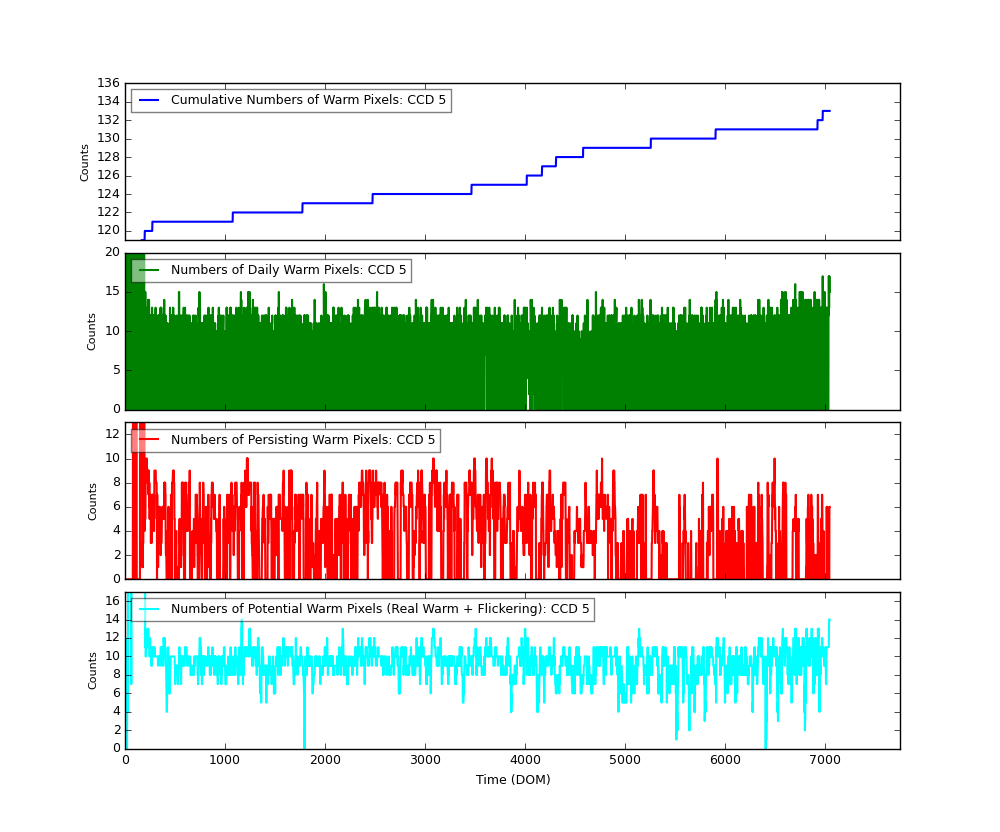
Bad Pixels
The plots below were generated with a new warm pixel finding script. Please see Acis Bad Pixel Page for details.
Front Side CCDs
Back Side CCD (CCD5)
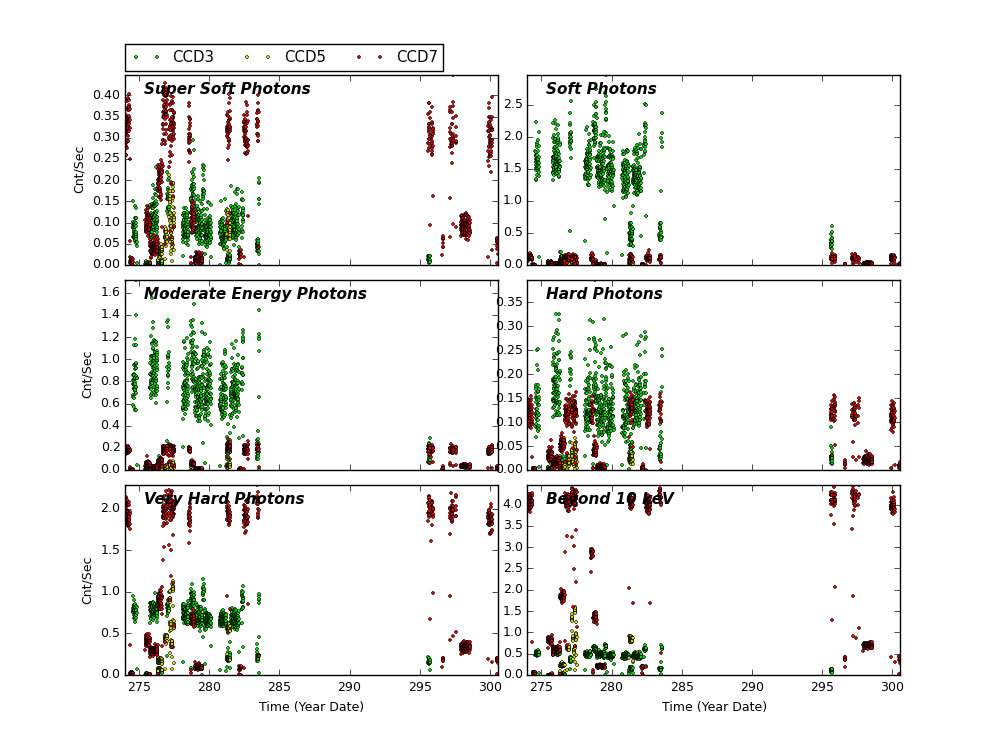
Science Instrument Background Rates
| Name | Low (keV) | High(KeV) | Description |
|---|---|---|---|
| SSoft | 0.00 | 0.50 | Super soft photons |
| Soft | 0.50 | 1.00 | Soft photons |
| Med | 1.00 | 3.00 | Moderate energy photons |
| Hard | 3.00 | 5.00 | Hard Photons |
| Harder | 5.00 | 10.00 | Very Hard photons |
| Hardest | 10.00 | Beyond 10 keV |
HRC
DOSE of Central 4K Pore-Pairs
Please refer to Maximum Dose Trends for more details.
)
|
|---|
IMAGE                NPIX      MEAN    STDDEV      MIN       MAX
HRCI_10_2018.fits  16777216	0.115 	0.736 	0.000 	66.000
)
IMAGE                       NPIX      MEAN    STDDEV      MIN       MAX
HRCI_08_1999_10_2018.fits  16777216	5.563 	5.697 	0.000 	302.000
)
|
|---|
IMAGE                NPIX      MEAN    STDDEV      MIN       MAX
HRCS_10_2018.fits  16777216	0.051 	0.239 	0.000 	5.000
)
IMAGE                       NPIX      MEAN    STDDEV      MIN       MAX
HRCS_08_1999_10_2018.fits  16777216	17.776 	32.504 	0.000 	1730.000
|
|
Max dose trend plots corrected for events that "pile-up"
in the center of the taps due to bad position information.
|
)
|
)
|
)
|
)
|
| Jul 2018 | Apr 2018 | Jan 2018 | Oct 2017 |
|---|
)
|
)
|
)
|
)
|
| Jul 2018 | Apr 2018 | Jan 2018 | Oct 2017 |
|---|
Gratings
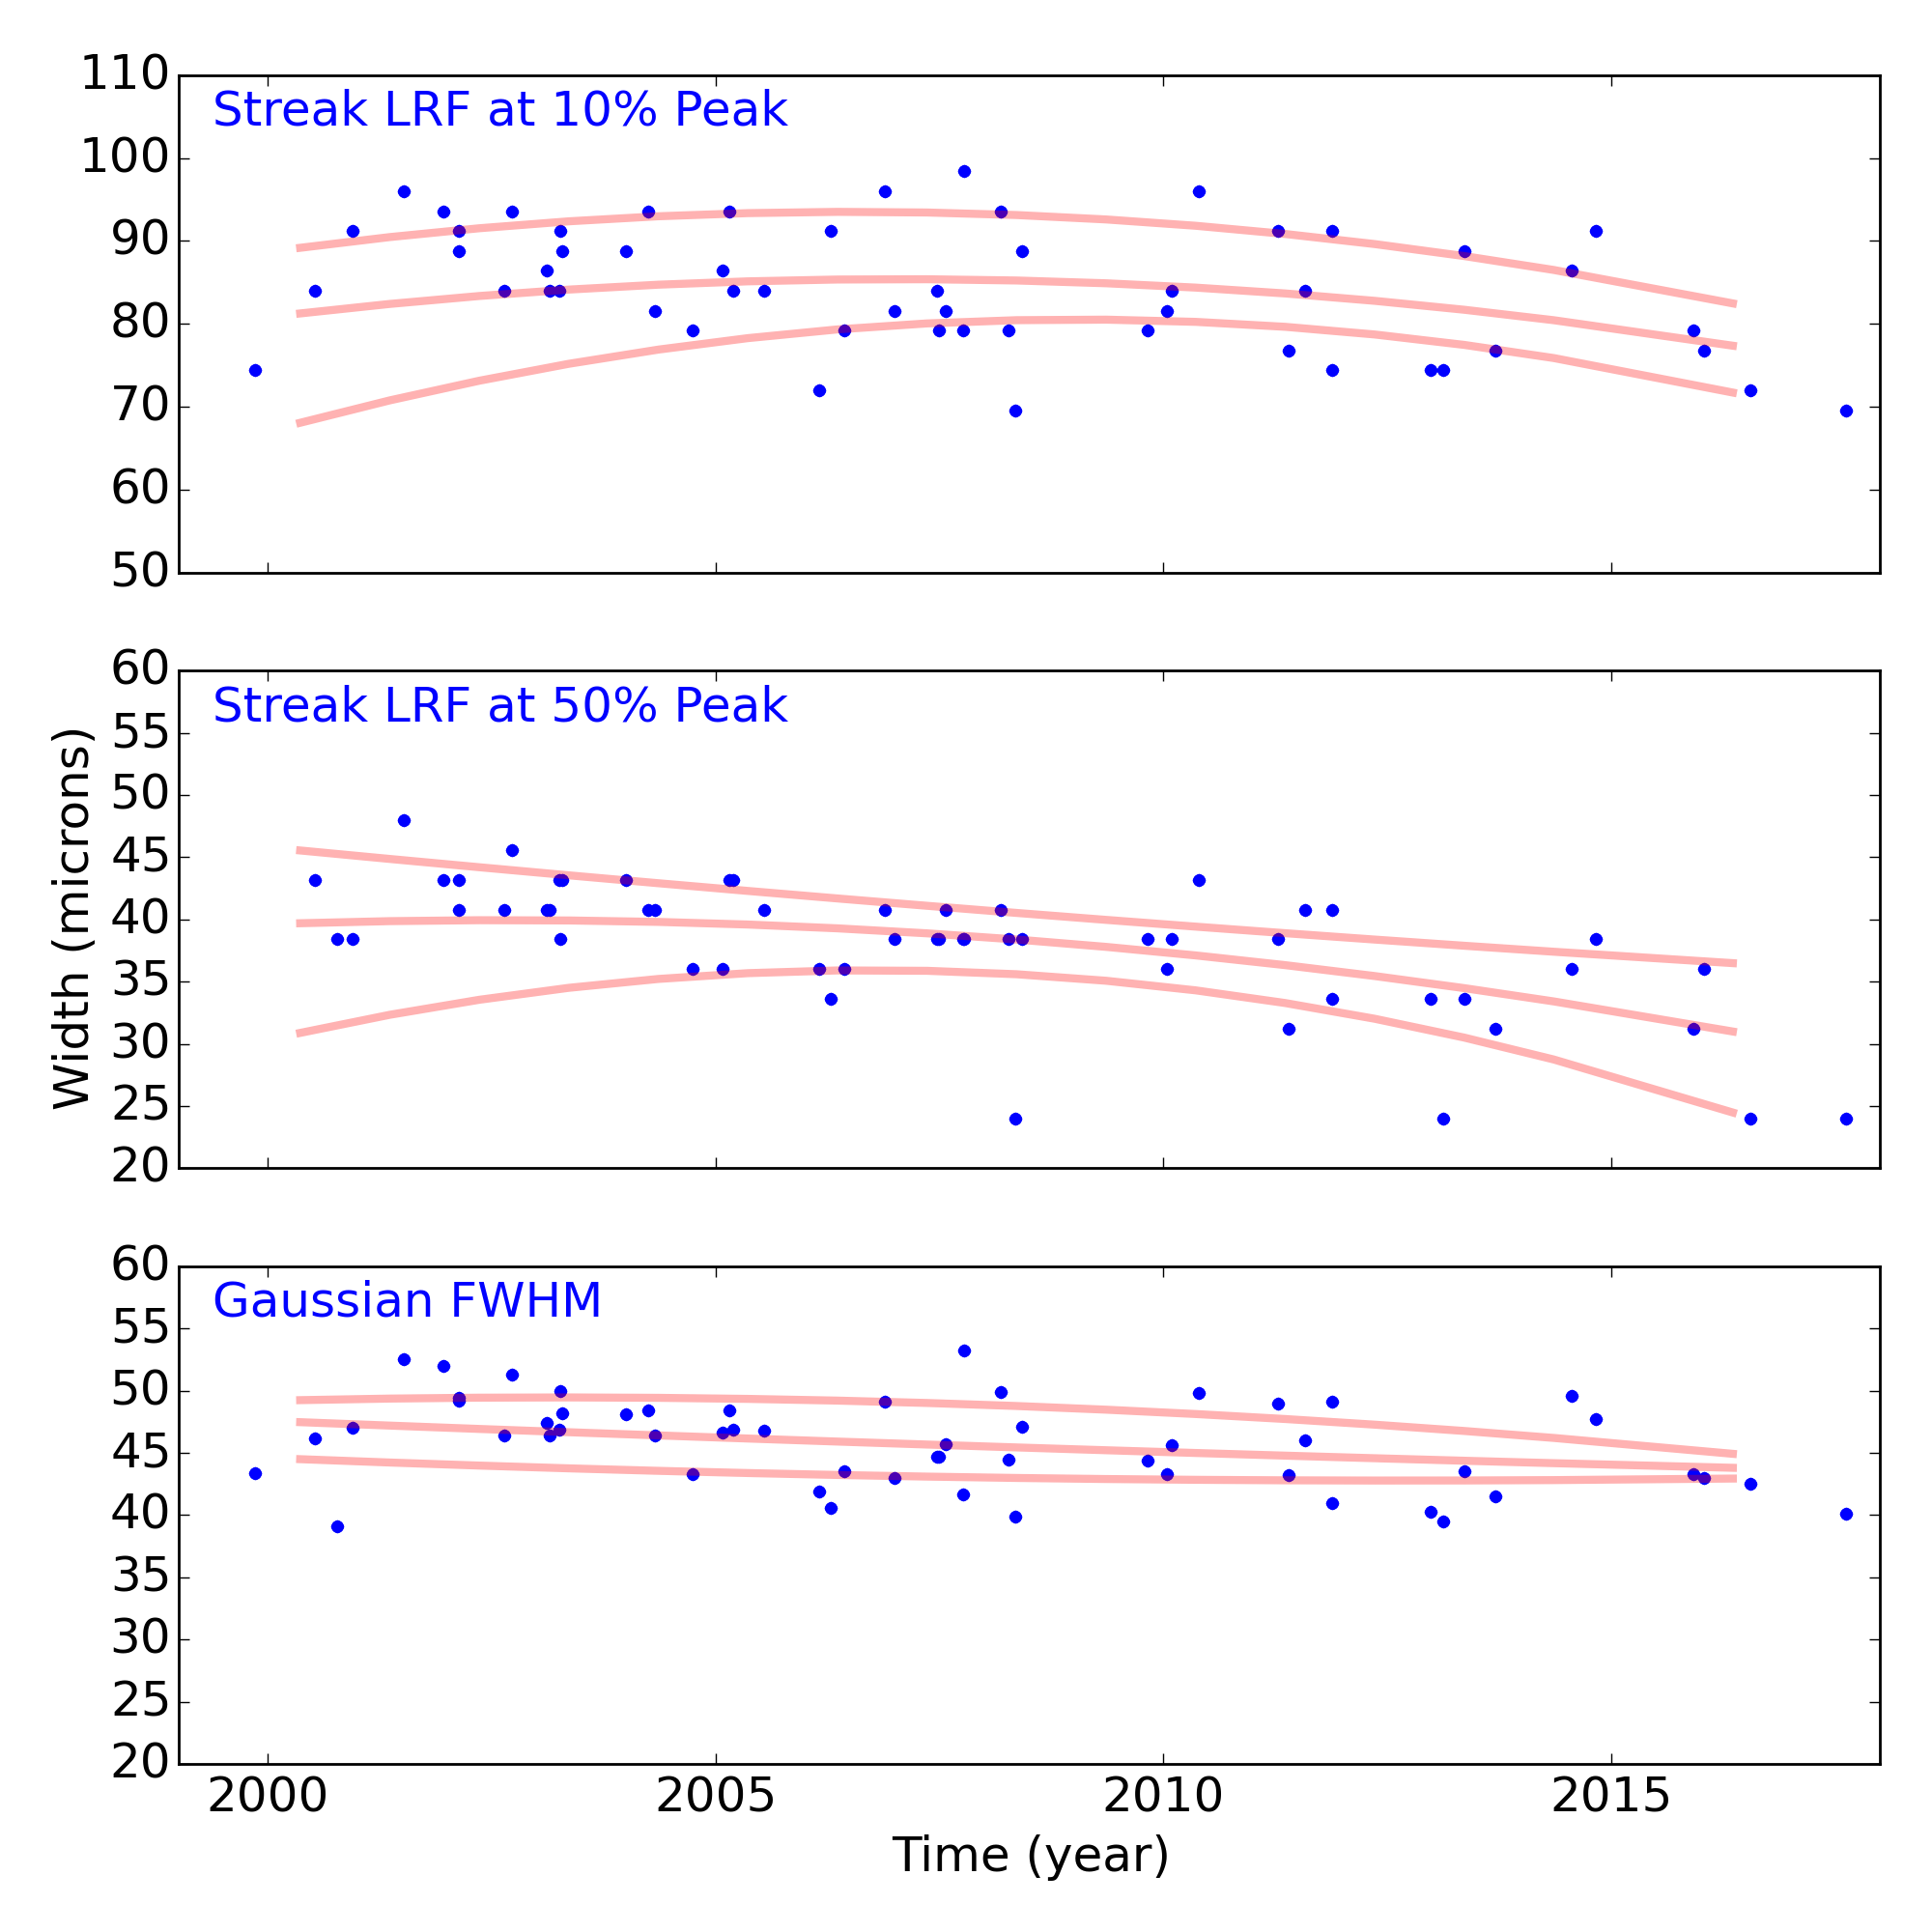
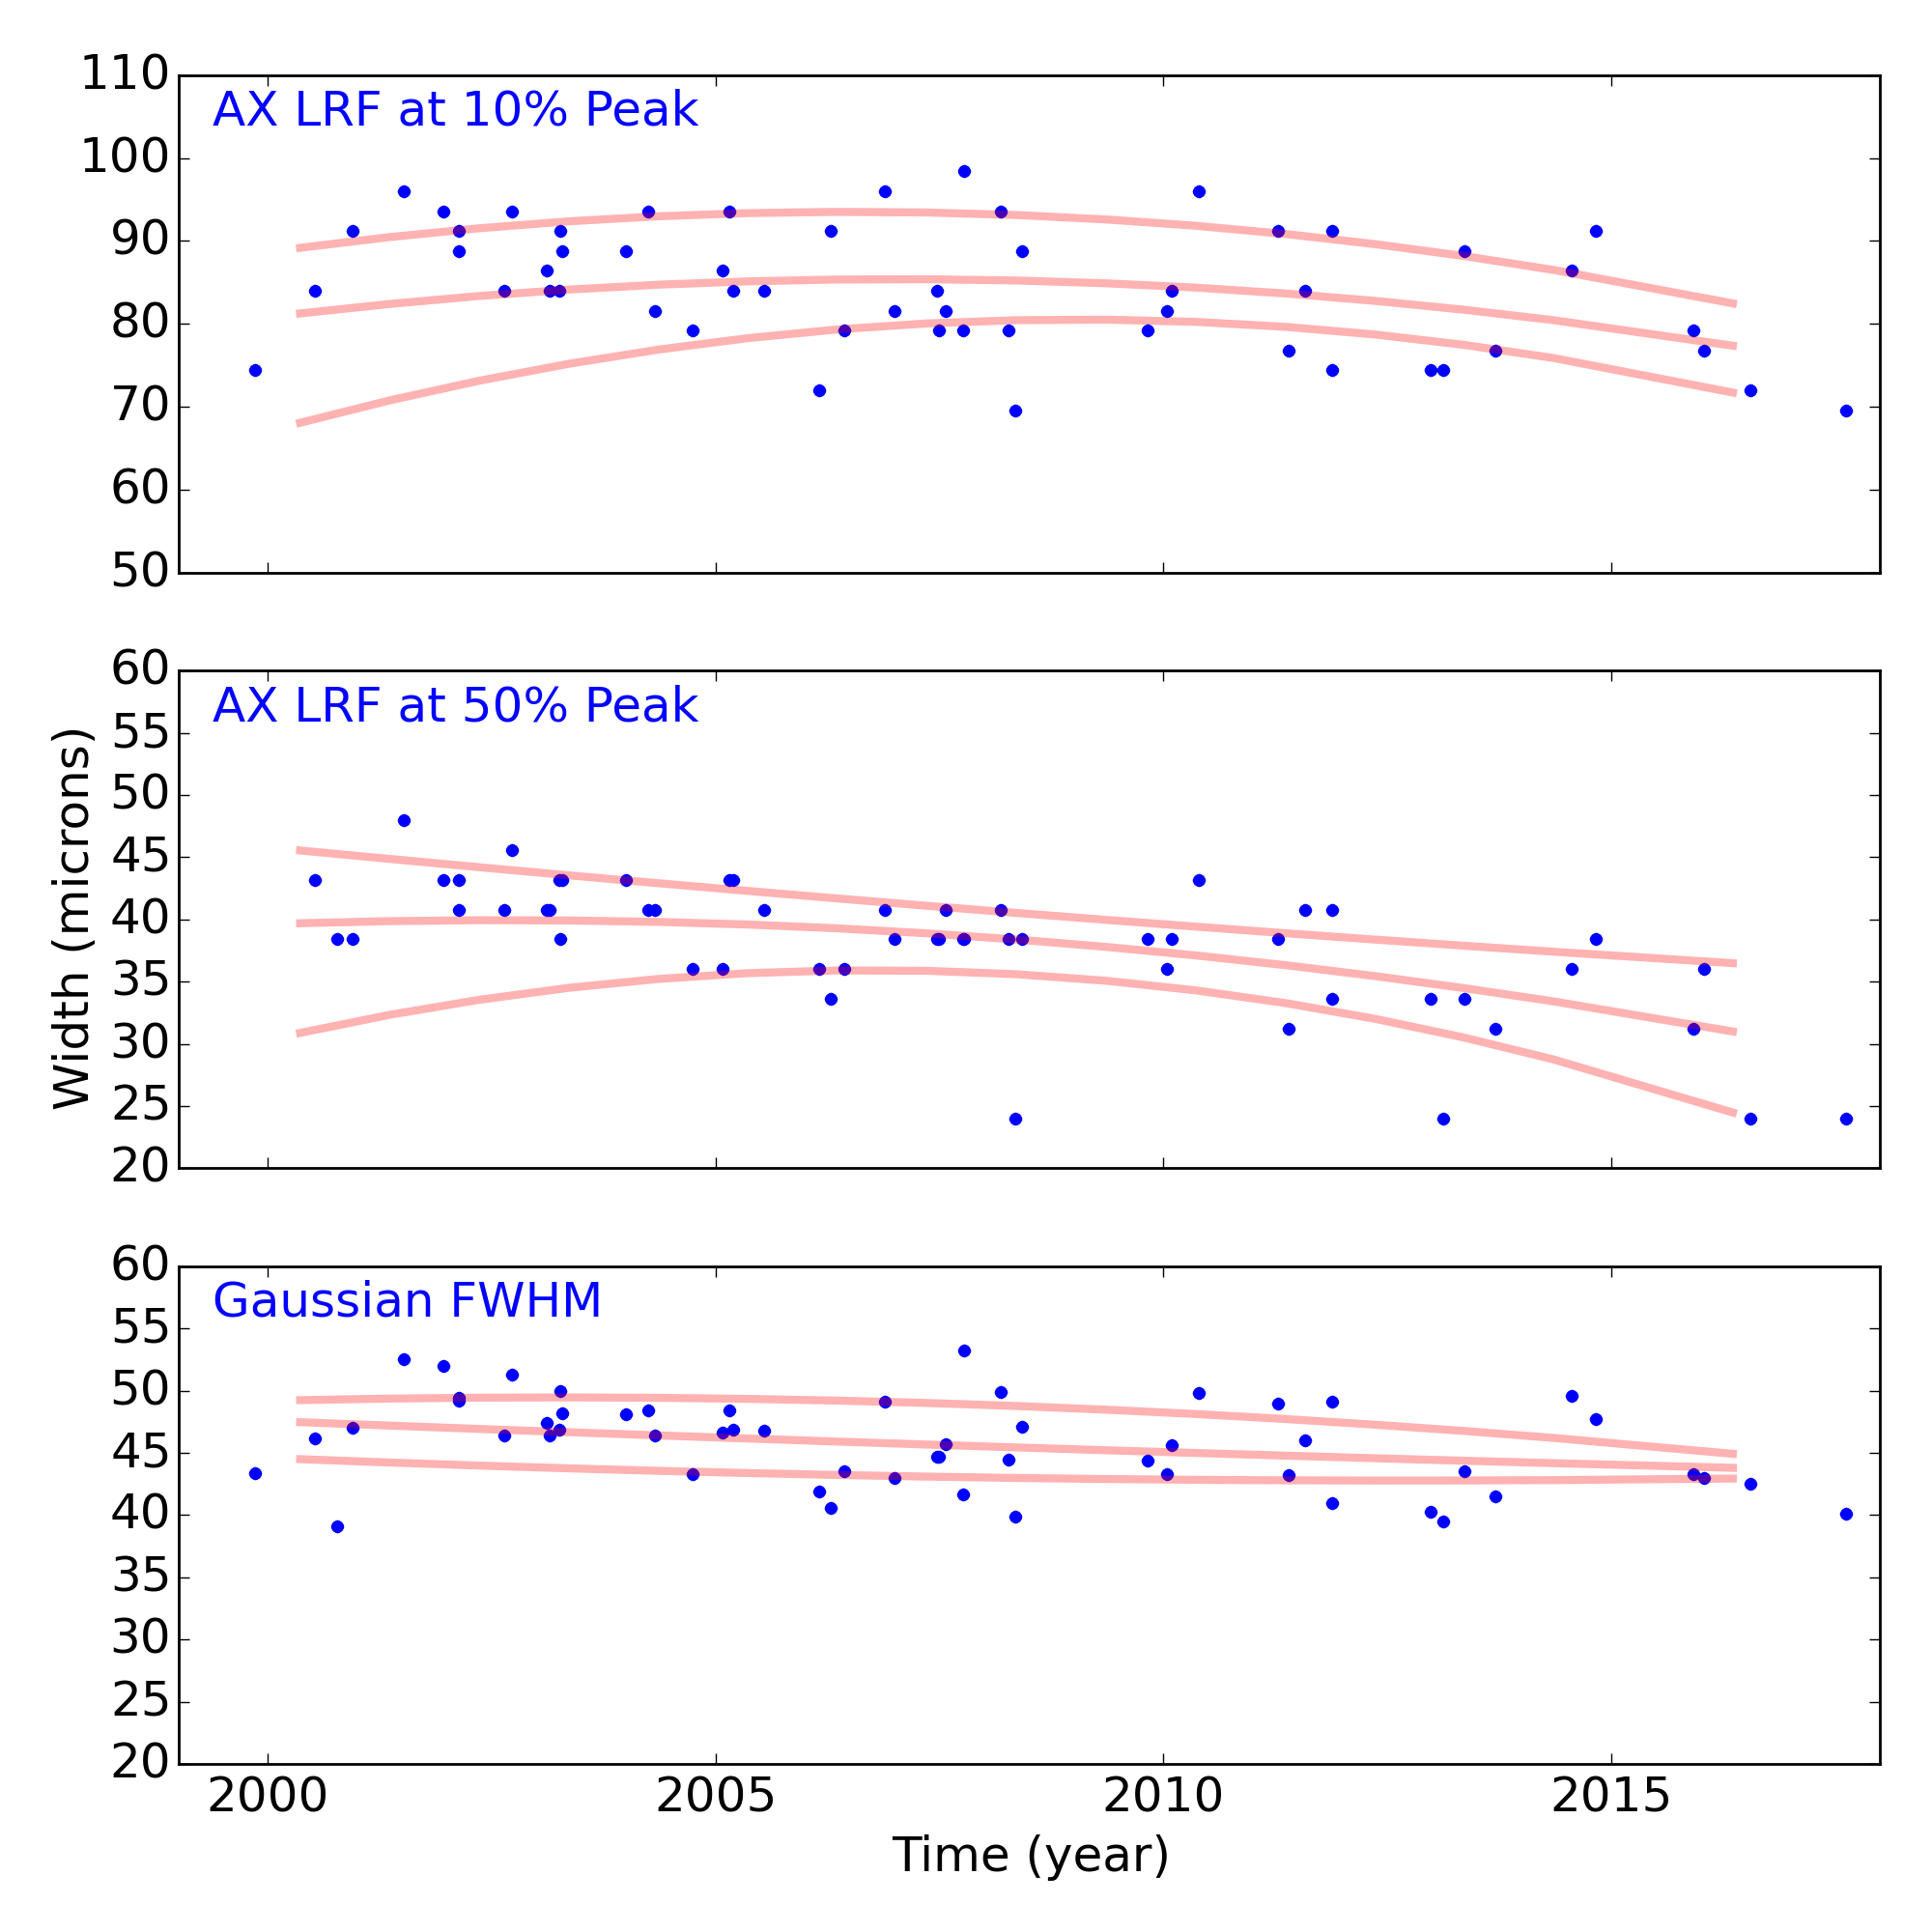
Grating Trends/Focus
We plot the width of the zero order streak of ACIS/HETG observations and the width of the zero order image for HRC/LETG observations of point sources. No significant defocusing trend is seen at this time. See Gratings Trends pages.
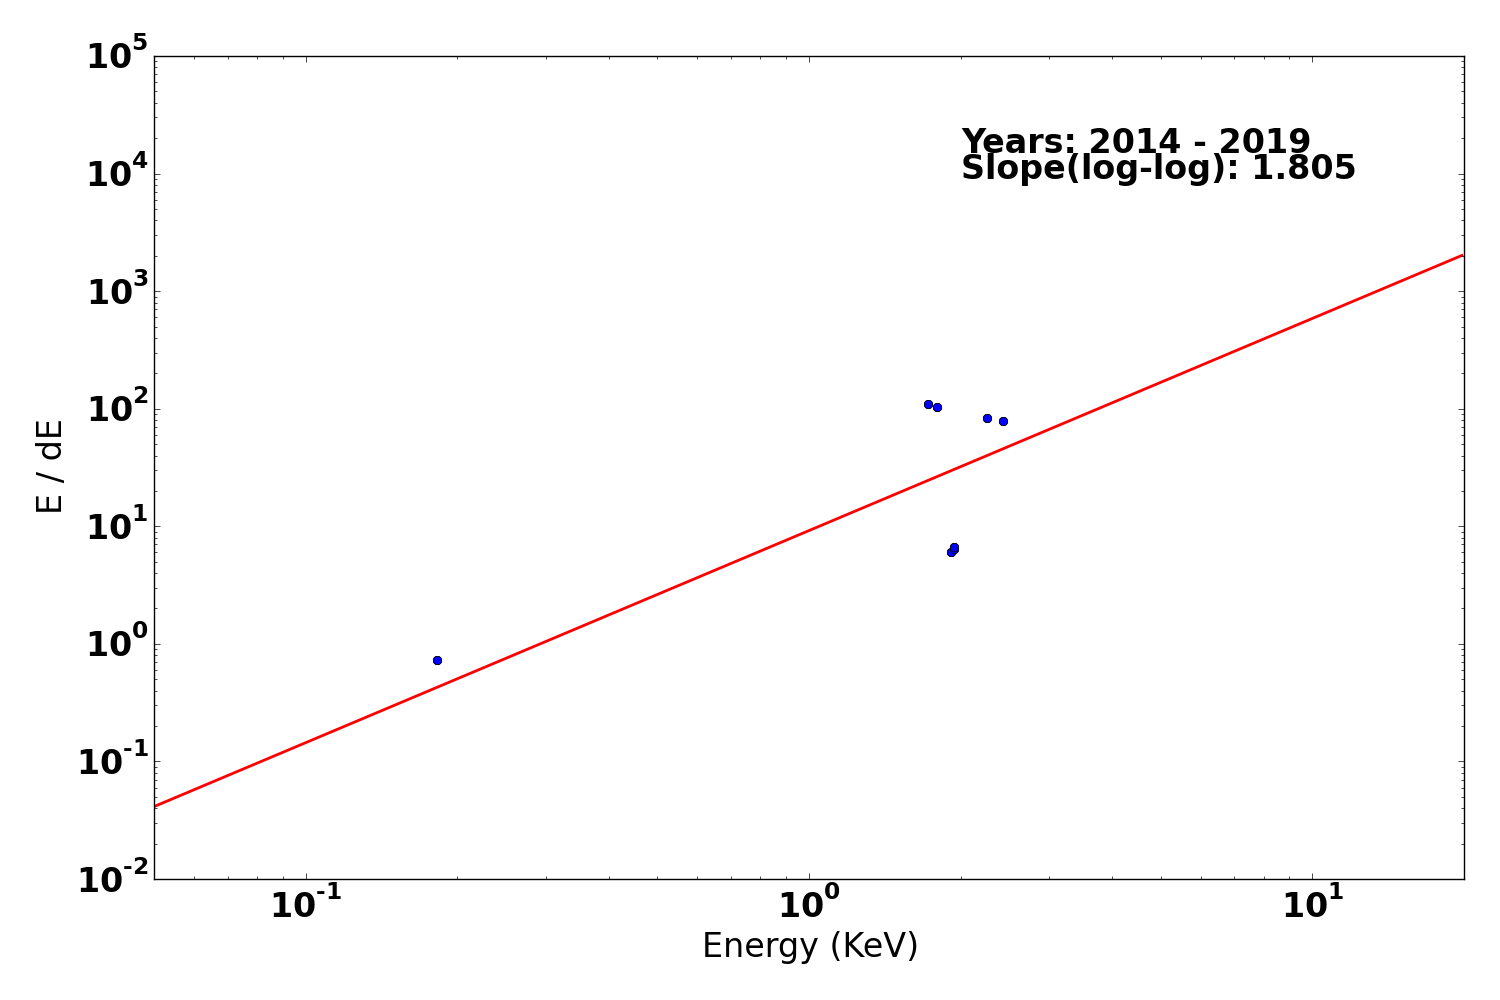
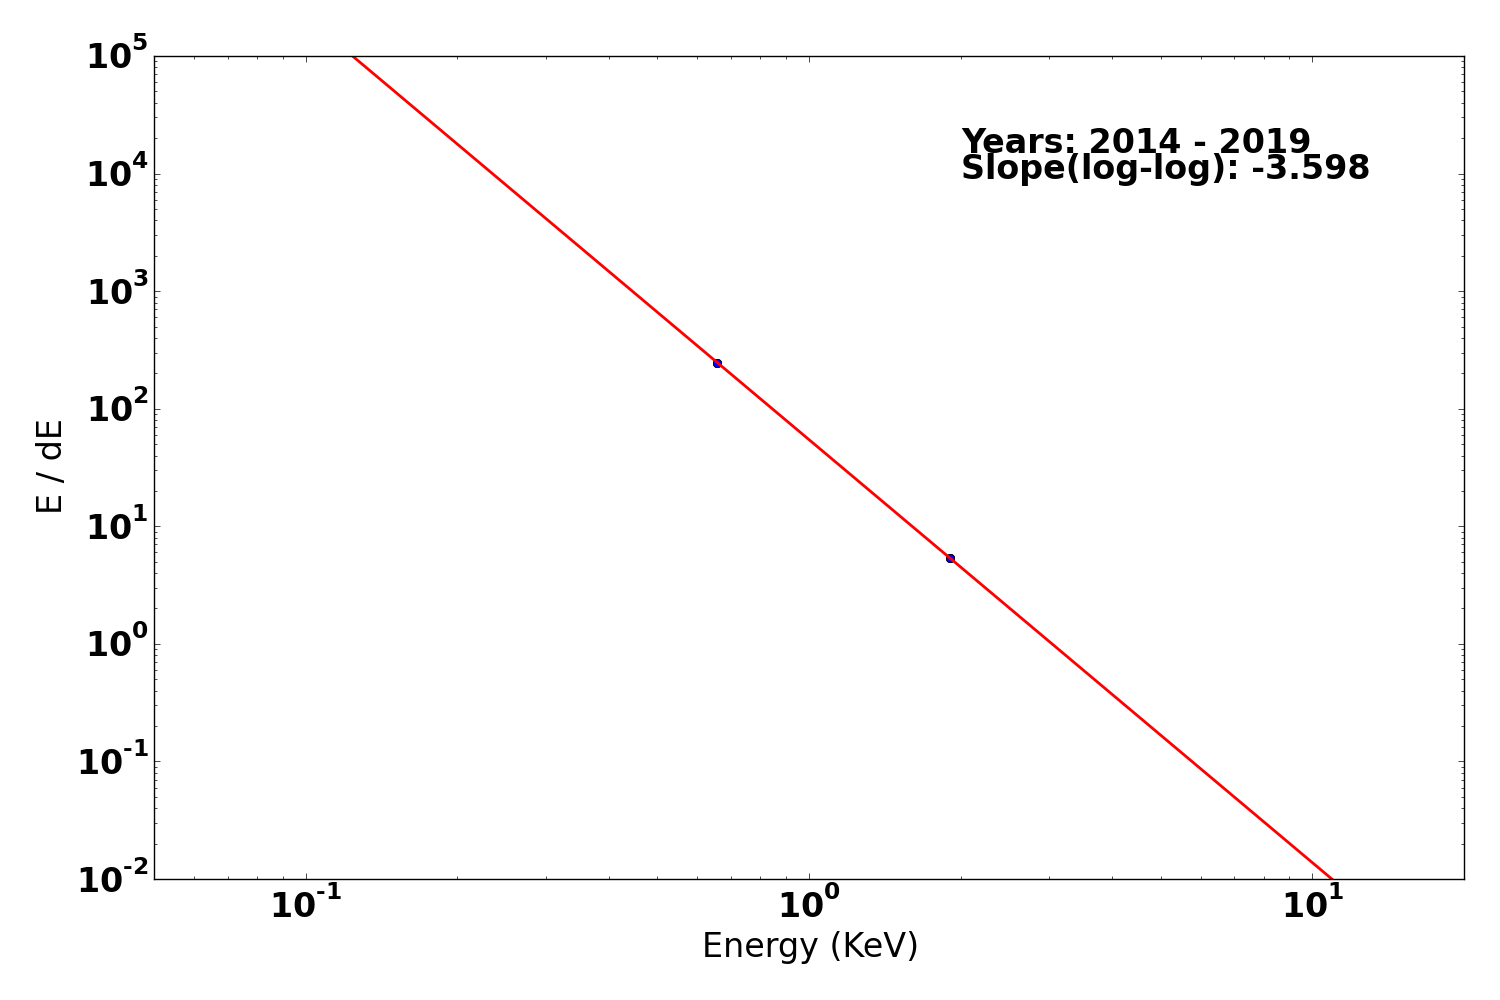
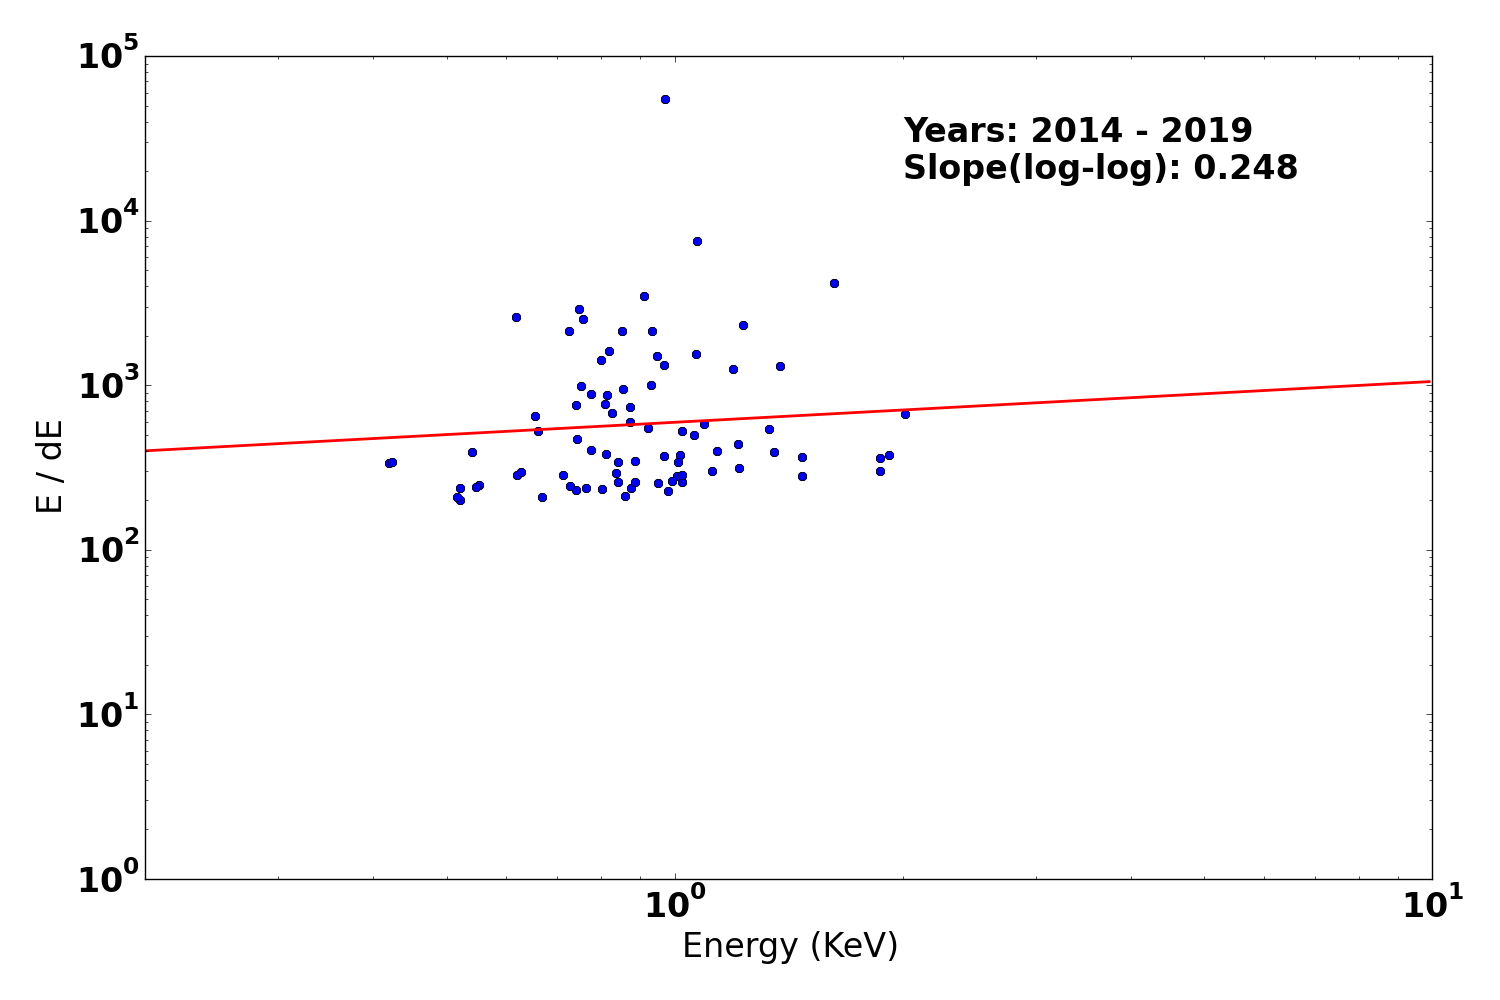
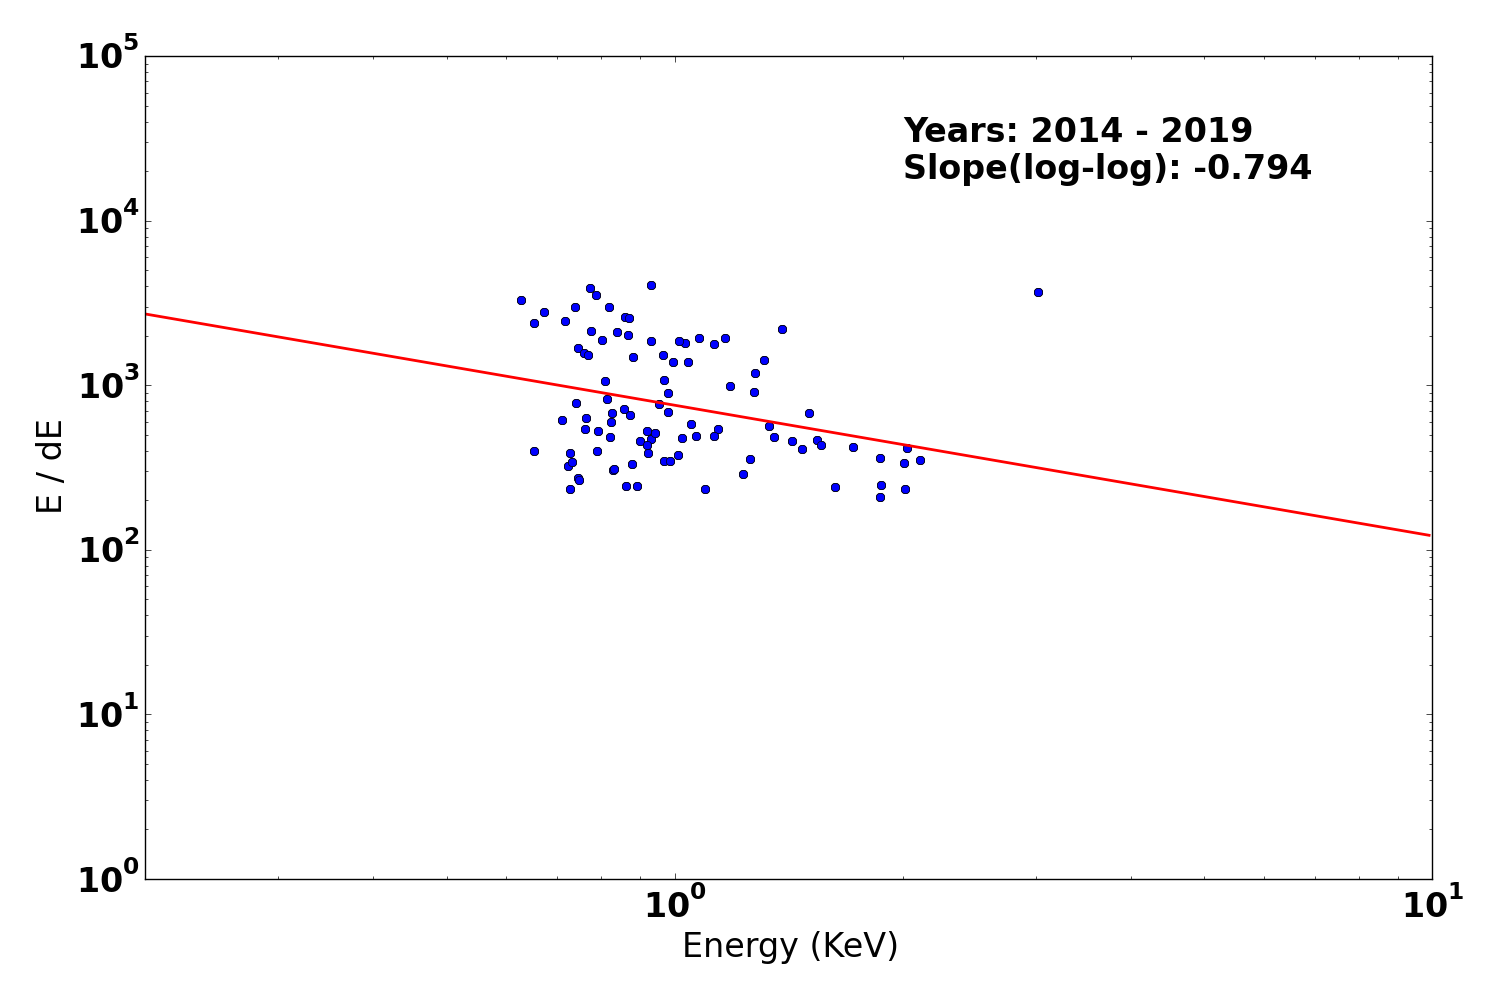
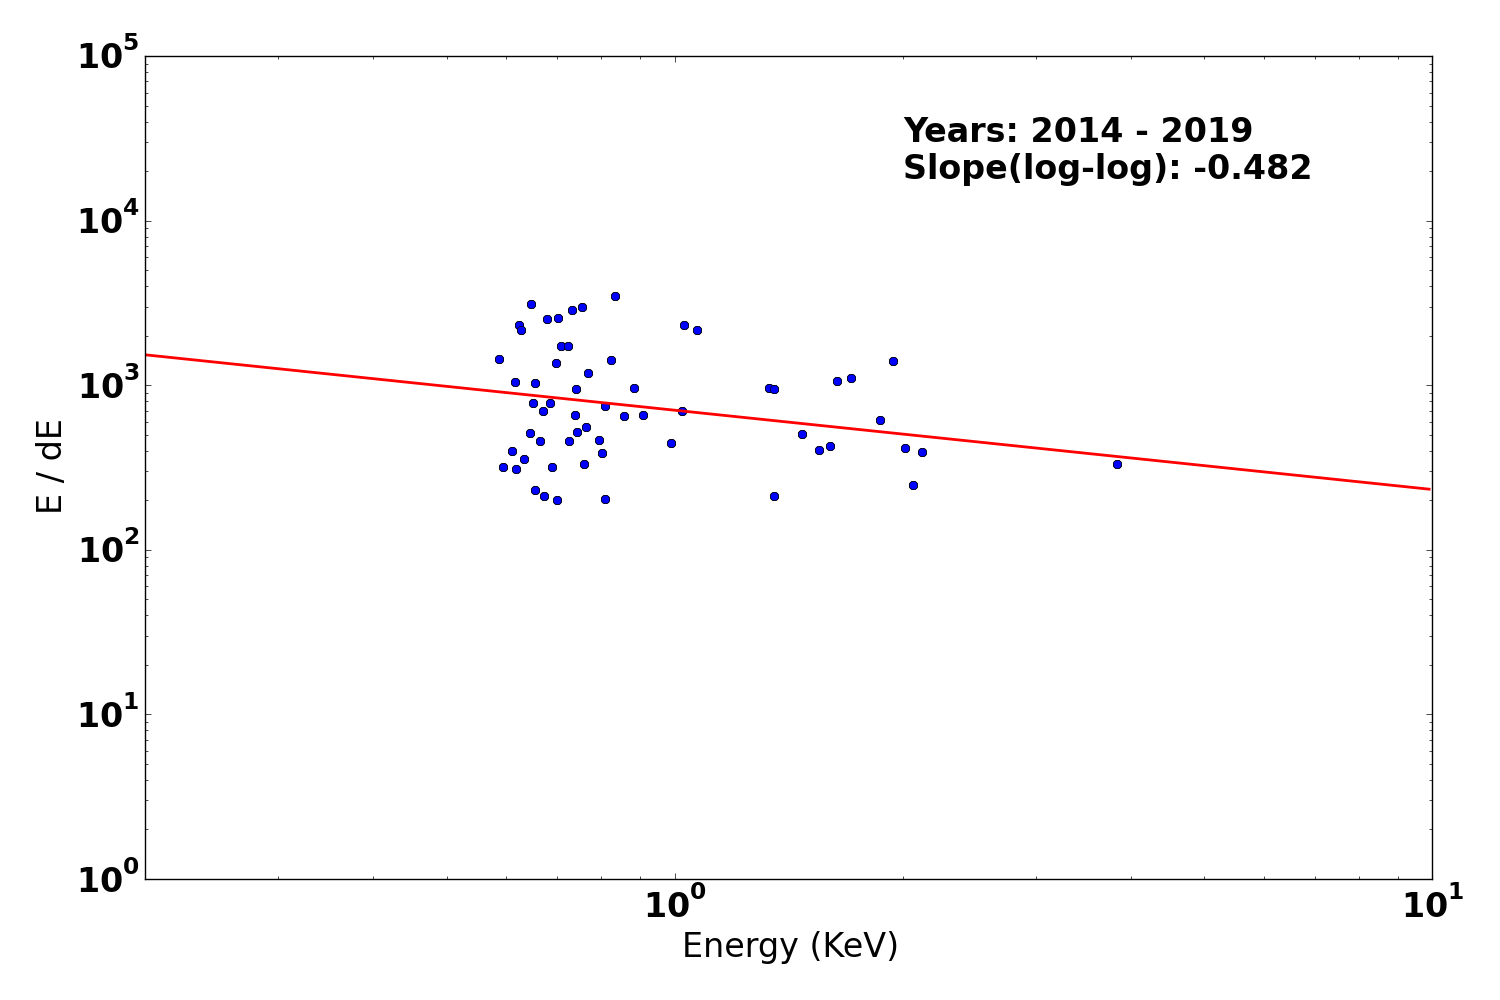
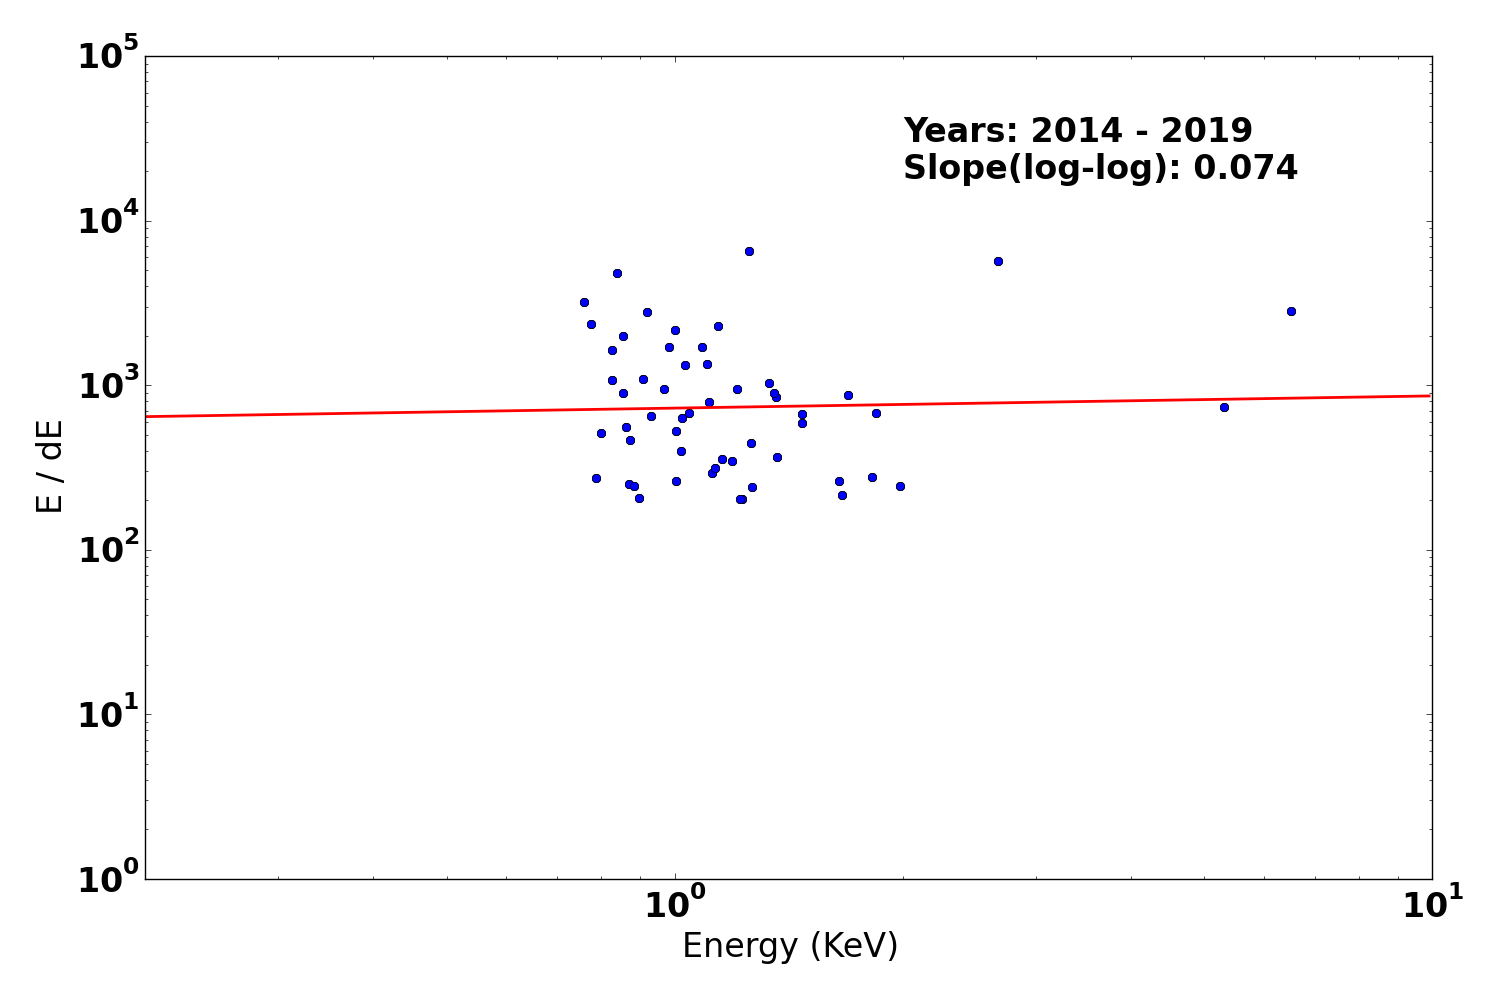
Gratings Resolving Power
We plot E/dE vs. E for fits to detected lines with fwhm_error/fwhm less than 0.15 for the plus and minus arms of HEG, MEG, and LEG. Also shown are conservative (dotted line) and optimistic (dashed line) pre-launch resolving power expectations.
We have selected only calibration observations of Capella, HR1099, and Sigma Gem. See MIT technotes for a parallel analysis.
| Year 2014 - | |
|---|---|
| Letg minus side | Letg plus side |
 |
 |
| Metg minus side | Metg plus side |
 |
 |
| Hetg minus side | Hetg plus side |
 |
 |
PCAD
ACA Trending
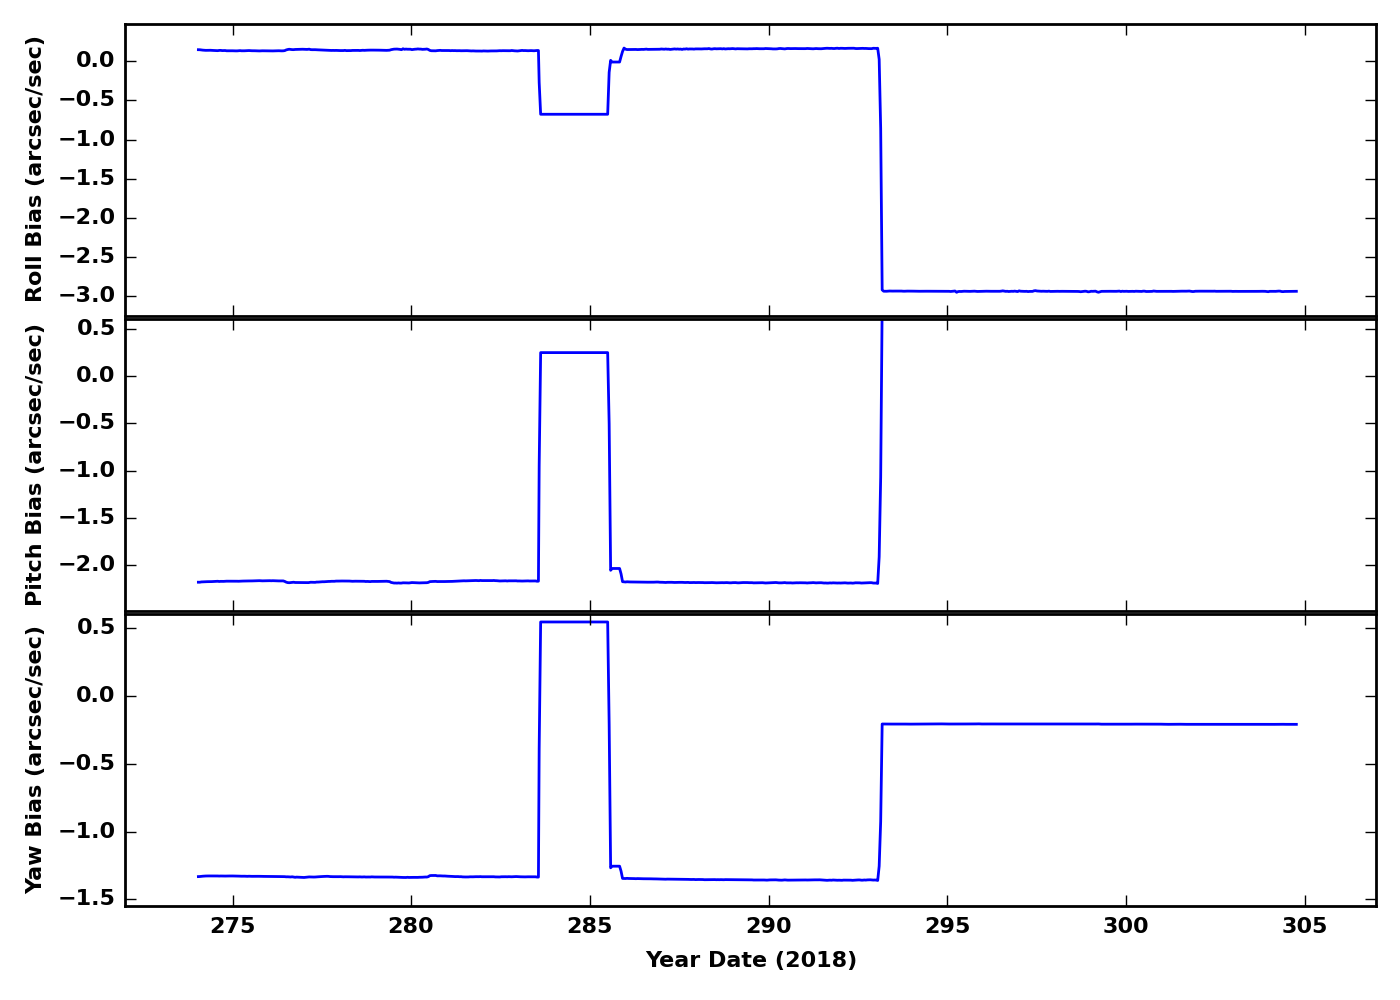
Gyro Bias Drift
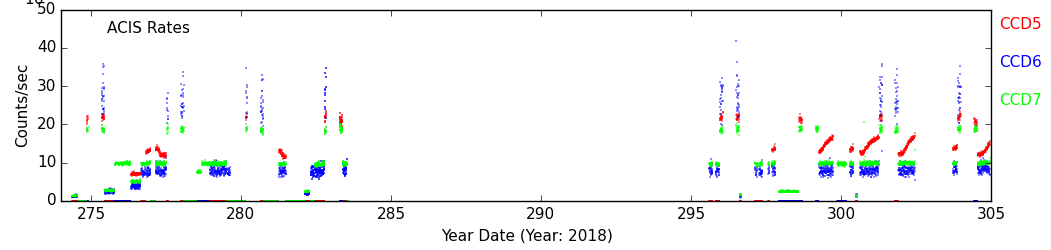
Radiation History
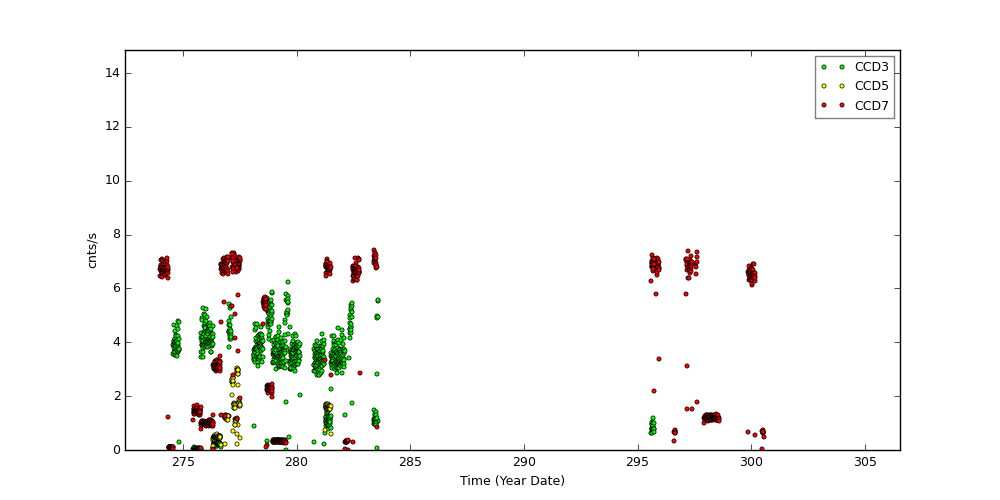
Radiation Count Rates of Oct 2018
Sun Spot History

SIM
SIM Shift and Twist
SIM Shift and Twist Trend The following plots show trends of SIM shifts (dy and dz) and twist (dtheta). All quantities are directly taken from pcaf*_asol1.fits files. The units are mm for dy and dz, and degree for dtheta. We fit three lines separated before and after (Days of Mission)= 1400 (May 21, 2003), 2700 (Dec 11, 2006), and 4400 (Aug 07, 2011). The unit of slopes are mm per day or degree per day.
The sudden shift around DOM = 1400, 2700 and 4400 are due to fid light drift (see a memo by Aldcroft fiducial light drift). On the dtheta plot, two tracks are clearly observed. The track around 0.01 is due to HRC-I, and all others are clustered around -0.002. For more detail, please see SIM Shift and Twist Trend page

Trending
Quarterly Trends
- EPS Batteries
| Previous Quarter | ||||||
| MSID | MEAN | RMS | DELTA/YR | DELTA/YR/YR | UNITS | DESCRIPTION |
| eb2ci | 0.304 | 0.110 | (-1.91+/-0.10)e-5 | -0.002+/-0.000 | AMP | BATT 2 CHARGE CURRENT |
|---|---|---|---|---|---|---|
| eb2di | 0.025 | 0.234 | (0.00+/-0.00)e0 | (-1.58+/-0.14)e-4 | AMP | BATT 2 DISCHARGE CURRENT |
| eb2v | 32.337 | 0.129 | (-1.86+/-0.07)e-4 | 0.010+/-0.001 | V | BATT 2 VOLTAGE |
| ecnv1v | 14.892 | 0.006 | (4.32+/-0.34)e-6 | (-7.12+/-0.43)e-4 | V | CONV 1 +15V OUTPUT |
| ecnv2v | 14.843 | 0.010 | (5.78+/-1.22)e-6 | -0.003+/-0.000 | V | CONV 2 +15V OUTPUT |
| ecnv3v | 15.290 | 0.004 | (-4.27+/-0.38)e-6 | (4.02+/-0.13)e-4 | V | CONV 3 +15V OUTPUT |
- Spacecraft Electronics
| Previous Quarter | ||||||
| MSID | MEAN | RMS | DELTA/YR | DELTA/YR/YR | UNITS | DESCRIPTION |
| elbi | 55.174 | 1.296 | (4.73+/-1.70)e-4 | 0.064+/-0.008 | AMP | LOAD BUS CURRENT |
|---|---|---|---|---|---|---|
| elbv | 28.686 | 0.196 | (4.78+/-0.25)e-4 | -0.033+/-0.001 | V | LOAD BUS VOLTAGE |
- OBA Heater
| Previous Quarter | ||||||
| MSID | MEAN | RMS | DELTA/YR | DELTA/YR/YR | UNITS | DESCRIPTION |
| oobthr04 | 298.409 | 1.517 | 0.002+/-0.000 | 0.018+/-0.062 | K | RT 27: HRMA STRUT |
|---|---|---|---|---|---|---|
| oobthr12 | 296.673 | 2.094 | 0.003+/-0.000 | -0.055+/-0.075 | K | RT 35: OBA FWD CONE |
| oobthr26 | 300.071 | 3.070 | 0.004+/-0.000 | -0.632+/-0.089 | K | RT 48: OBA AFT CONE |
| oobthr38 | 283.187 | 0.362 | (1.78+/-0.11)e-5 | 0.003+/-0.001 | K | RT 60: TFTE FWD CYLINDER |
| oobthr44 | 298.617 | 2.099 | 0.004+/-0.000 | 0.062+/-0.074 | K | RT 66: TFTE AFT CYLINDER |
| oobthr50 | 293.408 | 1.827 | 0.002+/-0.000 | -0.270+/-0.074 | K | RT 76: S/C STRUT |
Spacecraft Motions
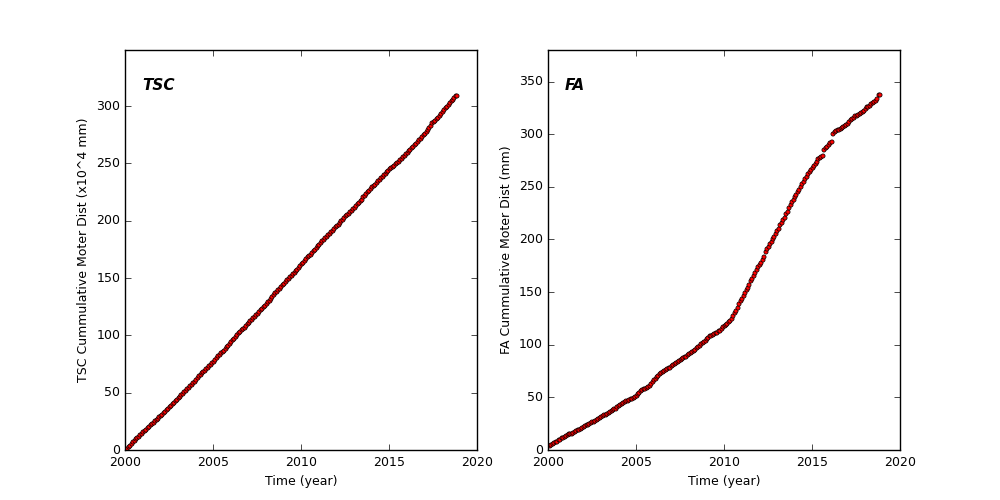
TSC and FA Cummulative Moter Distance
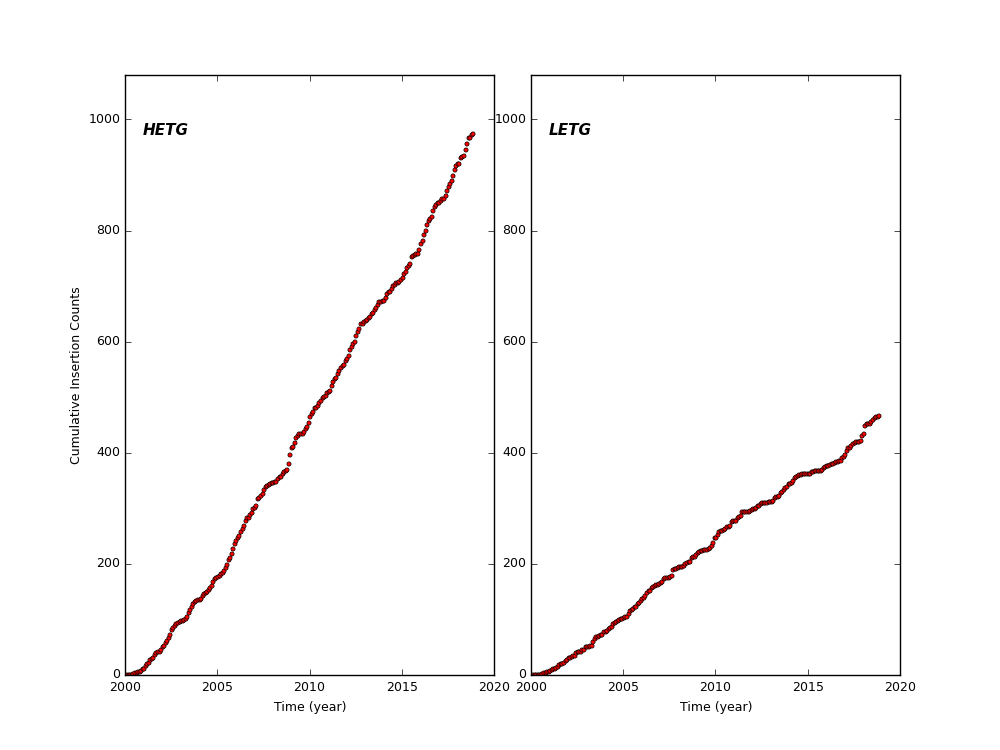
HETG and LETG Cummulative Insertion Counts
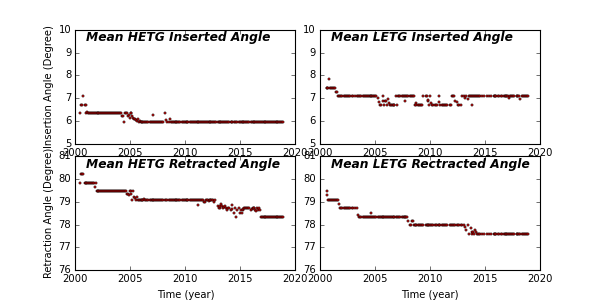
HETG/LETG Insertion/Retraction Angle
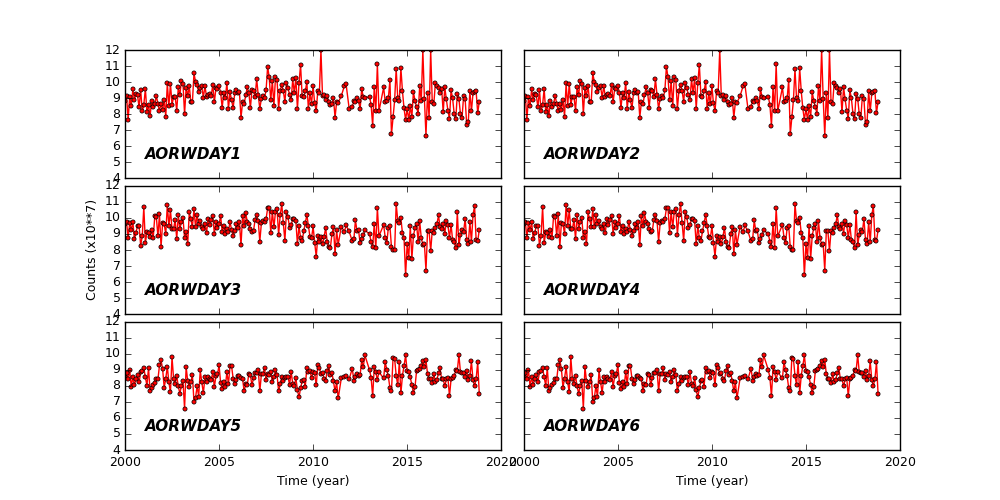
Reaction Wheel Rotations