ACIS
ACIS DOSE Registered-Photon-Map
The steps we took to compute the dose map are;
- Level 1 Event files for a specified month are obtained from archive.
- Image data including I2, I3, S2, S3 CCDs are extracted from all event files.
- All the extracted image data were merged to create a month long exposure map for the month.
- The exposure map is opened with ds9, and check a distribution of count rates against energy. From this, estimate the upper threshold value. Any events beyond this upper threshold are assumed erroneous events such as bad pixels.
- Using this upper threshold, the data is filtered, and create a cleaned exposure map for the month.
- The exposure map from each month from the Sep 1999 is added up to create a cumulative exposure map for each month.
- Using fimgstatistic, we compute count rate statistics for each CCDs.
- For observations with high data drop rates (e.g., Crab nebula, Cas A), we corrected the observations by adding events.
Please check more detail plots at Telemetered Photon Dose Trend page.
)
)
)
Statistics:
# IMAGE     NPIX     MEAN        RMS        MIN     MAX
ACIS_feb19 6004901       6.951         11.059           0.0     1550


I2 node 0  262654	5.557019	2.799984	0.0	 61.0
I2 node 1  262654	5.905725	3.360015	0.0	803.0
I2 node 2  262654	5.769860	2.814764	0.0	 57.0
I2 node 3  262654	5.692689	3.819950	0.0	867.0

I3 node 0  262654	6.934007	3.361050	0.0	134.0
I3 node 1  262654	6.686395	4.816628	0.0	1550.0
I3 node 2  262654	6.466596	3.005444	0.0	 76.0
I3 node 3  262654	6.572006	3.300453	0.0	596.0

S2 node 0  262654	8.521232	5.948280	0.0	609.0
S2 node 1  262654	9.121067	6.752984	0.0	414.0
S2 node 2  262654	11.176547	10.153151	0.0	461.0
S2 node 3  262654	12.641825	12.007822	0.0	562.0

S3 node 0  262654	14.094773	14.936435	0.0	1380.0
S3 node 1  262654	14.535131	12.075238	0.0	344.0
S3 node 2  262654	14.712983	15.059860	0.0	277.0
S3 node 3  262654	12.276572	11.766706	0.0	236.0
)
)
)
Statistics:
 IMAGE     NPIX      MEAN        RMS           MIN      MAX
ACIS_total   6004901       2273.172         2939.419           0.0   127576


I2 node 0  262654	1968.326818	390.610593	421.0	11261.0
I2 node 1  262654	2071.488534	545.348396	433.0	88334.0
I2 node 2  262654	2101.634559	445.238164	434.0	11224.0
I2 node 3  262654	2106.855869	544.265849	423.0	28541.0

I3 node 0  262654	2233.290424	552.234032	413.0	8830.0
I3 node 1  262654	2314.573405	1686.590197	437.0	55183.0
I3 node 2  262654	2040.533272	378.947044	413.0	11584.0
I3 node 3  262654	2031.457157	407.359310	368.0	31872.0

S2 node 0  262654	2645.270439	414.536876	1491.0	21838.0
S2 node 1  262654	2804.568834	625.738001	1644.0	15427.0
S2 node 2  262654	3101.602455	633.347373	2085.0	27746.0
S2 node 3  262654	3052.977197	485.080688	1841.0	57168.0

S3 node 0  262654	4679.589871	2102.282594	2060.0	27236.0
S3 node 1  262654	5907.534434	2241.842655	0.0	29123.0
S3 node 2  262654	4669.821886	1237.690863	2003.0	25111.0
S3 node 3  262654	3607.736068	652.541937	2216.0	24670.0
)
|
)
|
)
|
)
|
| Nov 2018 | Aug 2018 | May 2018 | Feb 2018 |
|---|
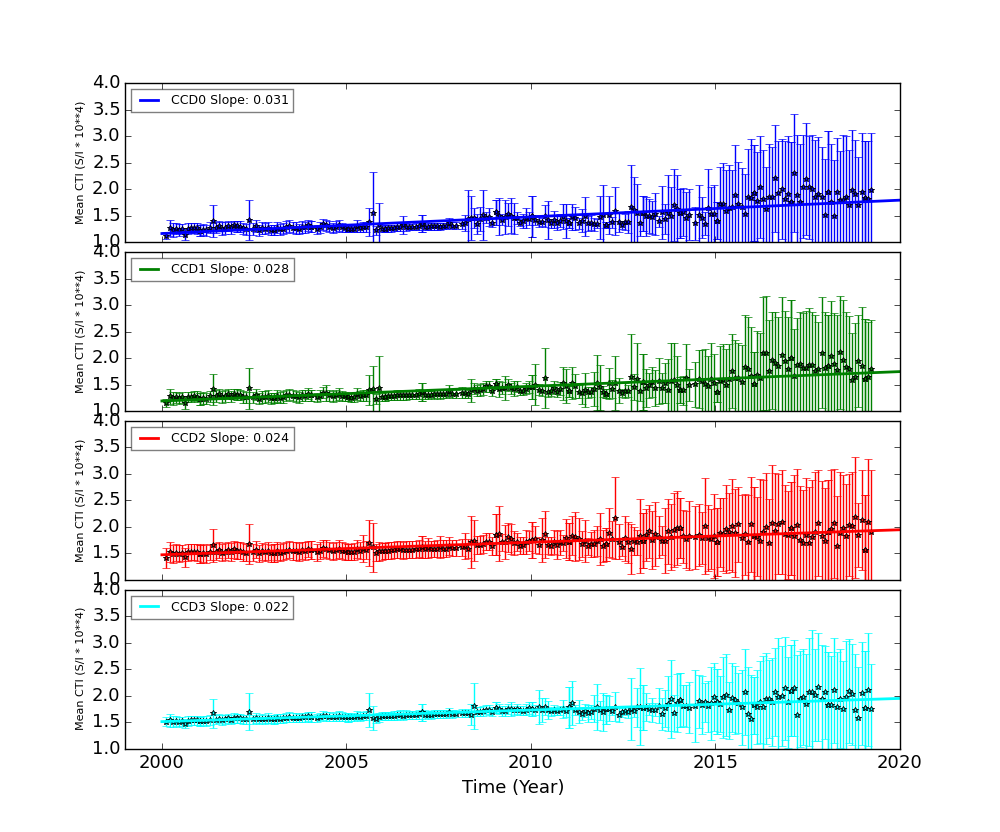
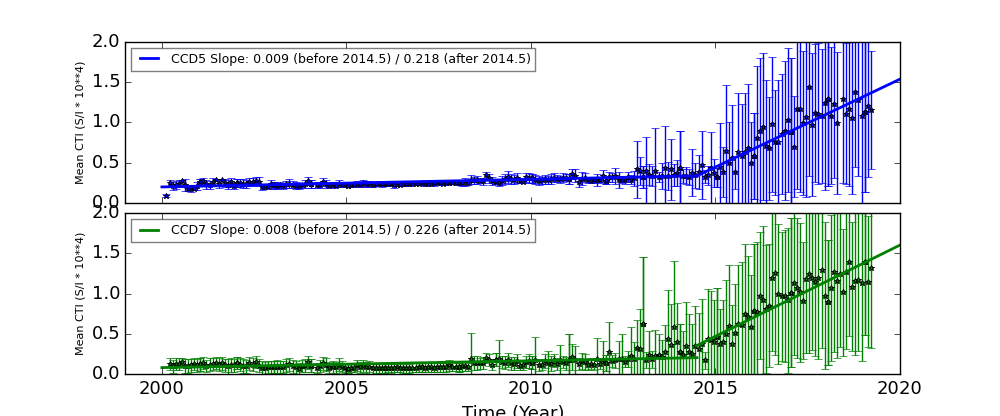
The Mean Detrended CTI
We report CTIs with a refined data definition. CTIs were computed for the temperature dependency corrected data. Please see CTI page for detailed explanation. CTI's are computed for Mn K alpha, and defined as slope/intercept x10^4 of row # vs ADU. Data file: here
Imaging CCDs
Spectral CCDs

Backside CCDs
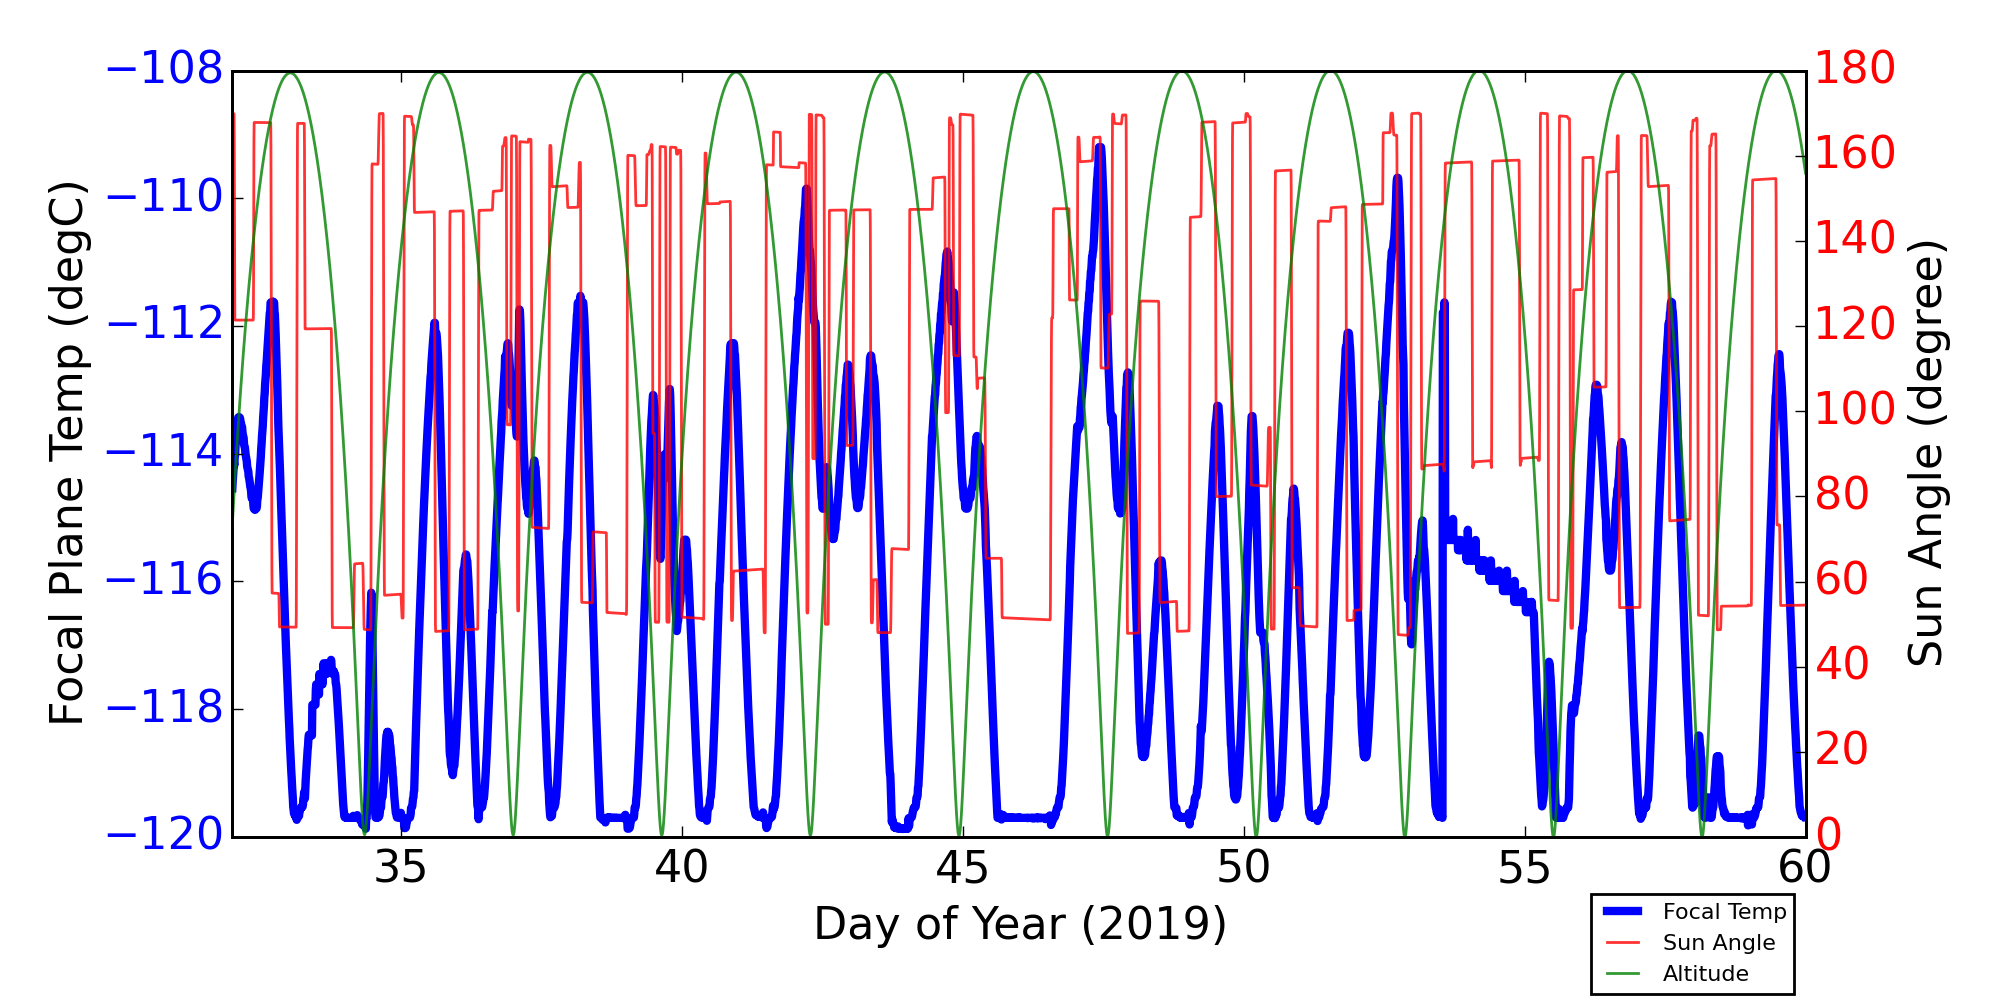
Focal Plane Temperature
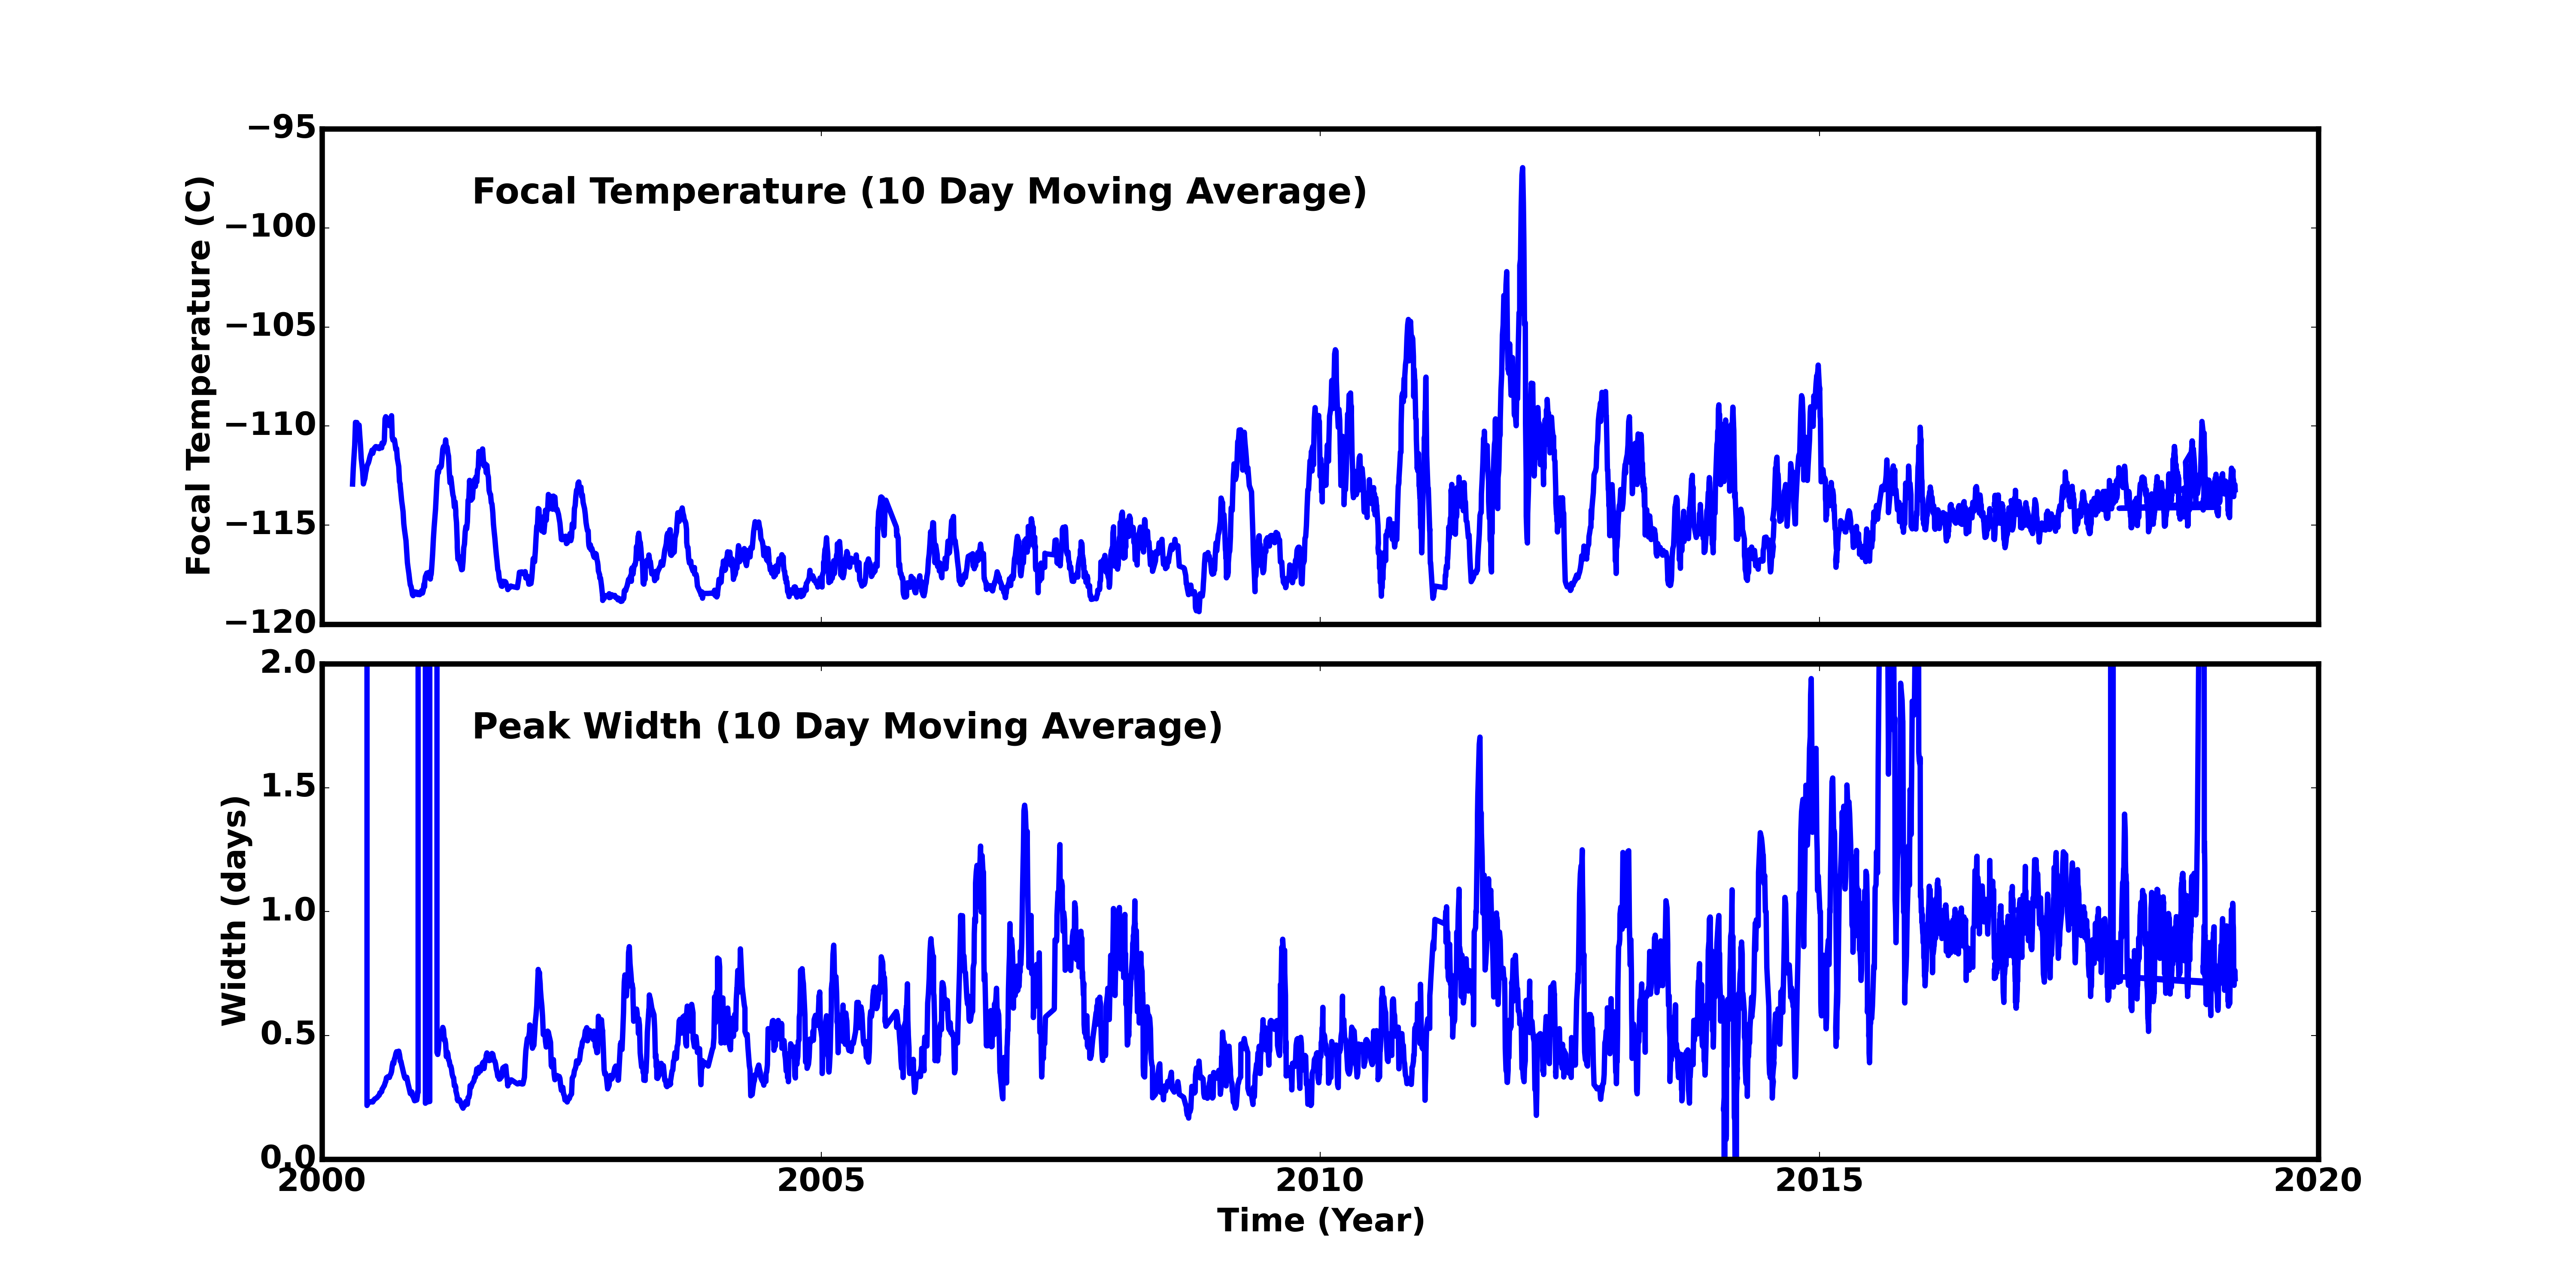
Feb 2019 Focal Temperature
| The Mean (max) FPT: | |
|---|---|
| -113.44 | +/- 2.29 C |
| Mean Width: | |
| 0.8 | +/- 0.36 days |
Averaged Focal Plane Temperature
We are using 10 period moving averages to show trends of peak temperatures and peak widths. Note, the gaps in the width plot are due to missing/corrupted data.
Focal Plane Temperature, Sun Angle and Altitude
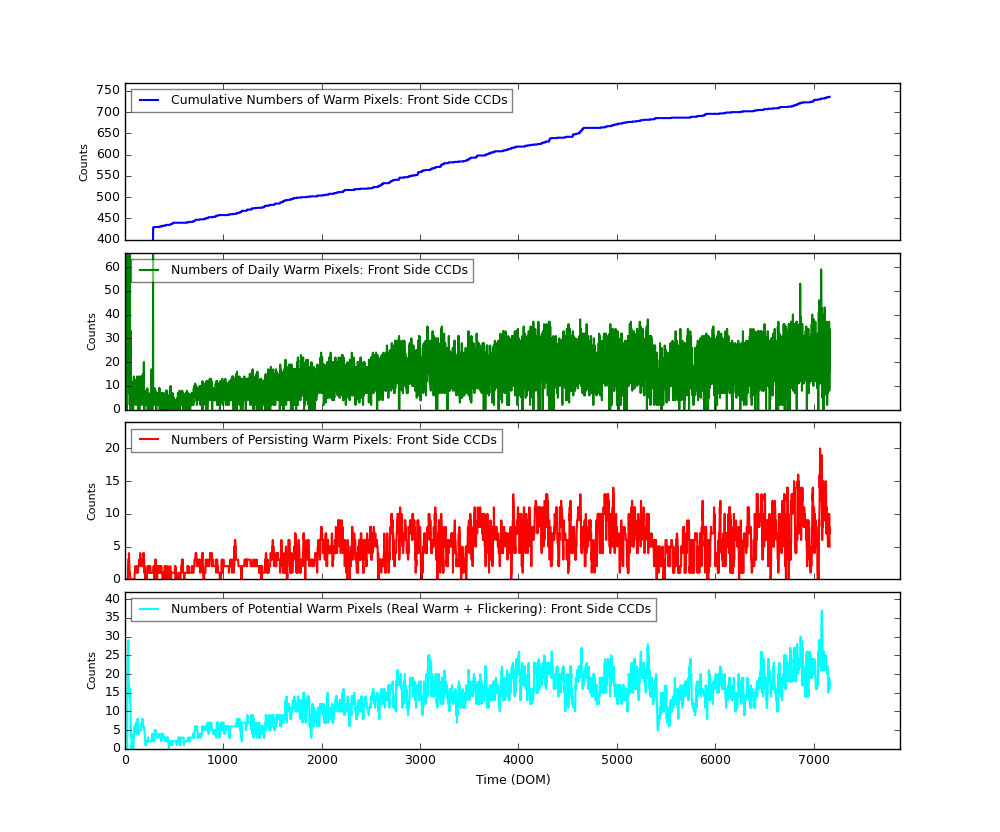
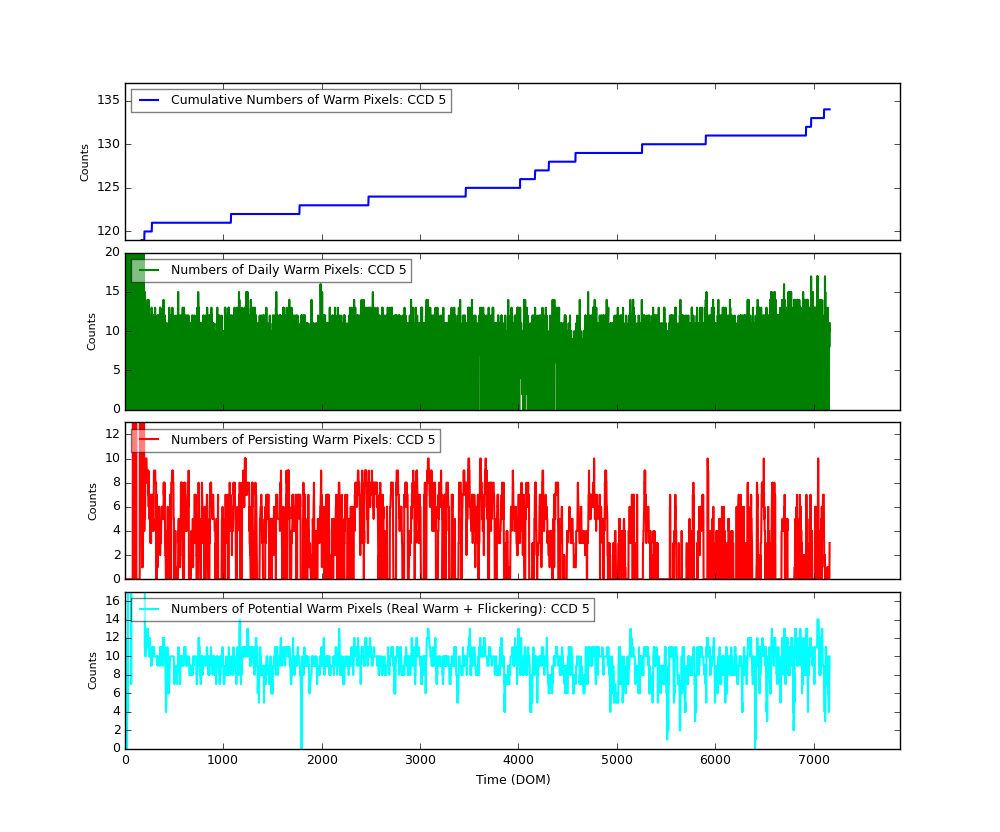
Bad Pixels
The plots below were generated with a new warm pixel finding script. Please see Acis Bad Pixel Page for details.
Front Side CCDs
Back Side CCD (CCD5)
Science Instrument Background Rates
| Name | Low (keV) | High(KeV) | Description |
|---|---|---|---|
| SSoft | 0.00 | 0.50 | Super soft photons |
| Soft | 0.50 | 1.00 | Soft photons |
| Med | 1.00 | 3.00 | Moderate energy photons |
| Hard | 3.00 | 5.00 | Hard Photons |
| Harder | 5.00 | 10.00 | Very Hard photons |
| Hardest | 10.00 | Beyond 10 keV |

HRC
DOSE of Central 4K Pore-Pairs
Please refer to Maximum Dose Trends for more details.
)
|
|---|
IMAGE                NPIX      MEAN    STDDEV      MIN       MAX
HRCI_02_2019.fits  16777216	0.040 	0.200 	0.000 	4.000
)
IMAGE                       NPIX      MEAN    STDDEV      MIN       MAX
HRCI_08_1999_02_2019.fits  16777216	5.665 	5.739 	0.000 	302.000
No Data
)
IMAGE                       NPIX      MEAN    STDDEV      MIN       MAX
HRCS_08_1999_02_2019.fits  16777216	17.945 	32.735 	0.000 	1730.000
|
|
Max dose trend plots corrected for events that "pile-up"
in the center of the taps due to bad position information.
|
)
|
)
|
)
|
)
|
| Nov 2018 | Aug 2018 | May 2018 | Feb 2018 |
|---|
)
|
)
|
)
|
)
|
| Nov 2018 | Aug 2018 | May 2018 | Feb 2018 |
|---|
HRMA Focus
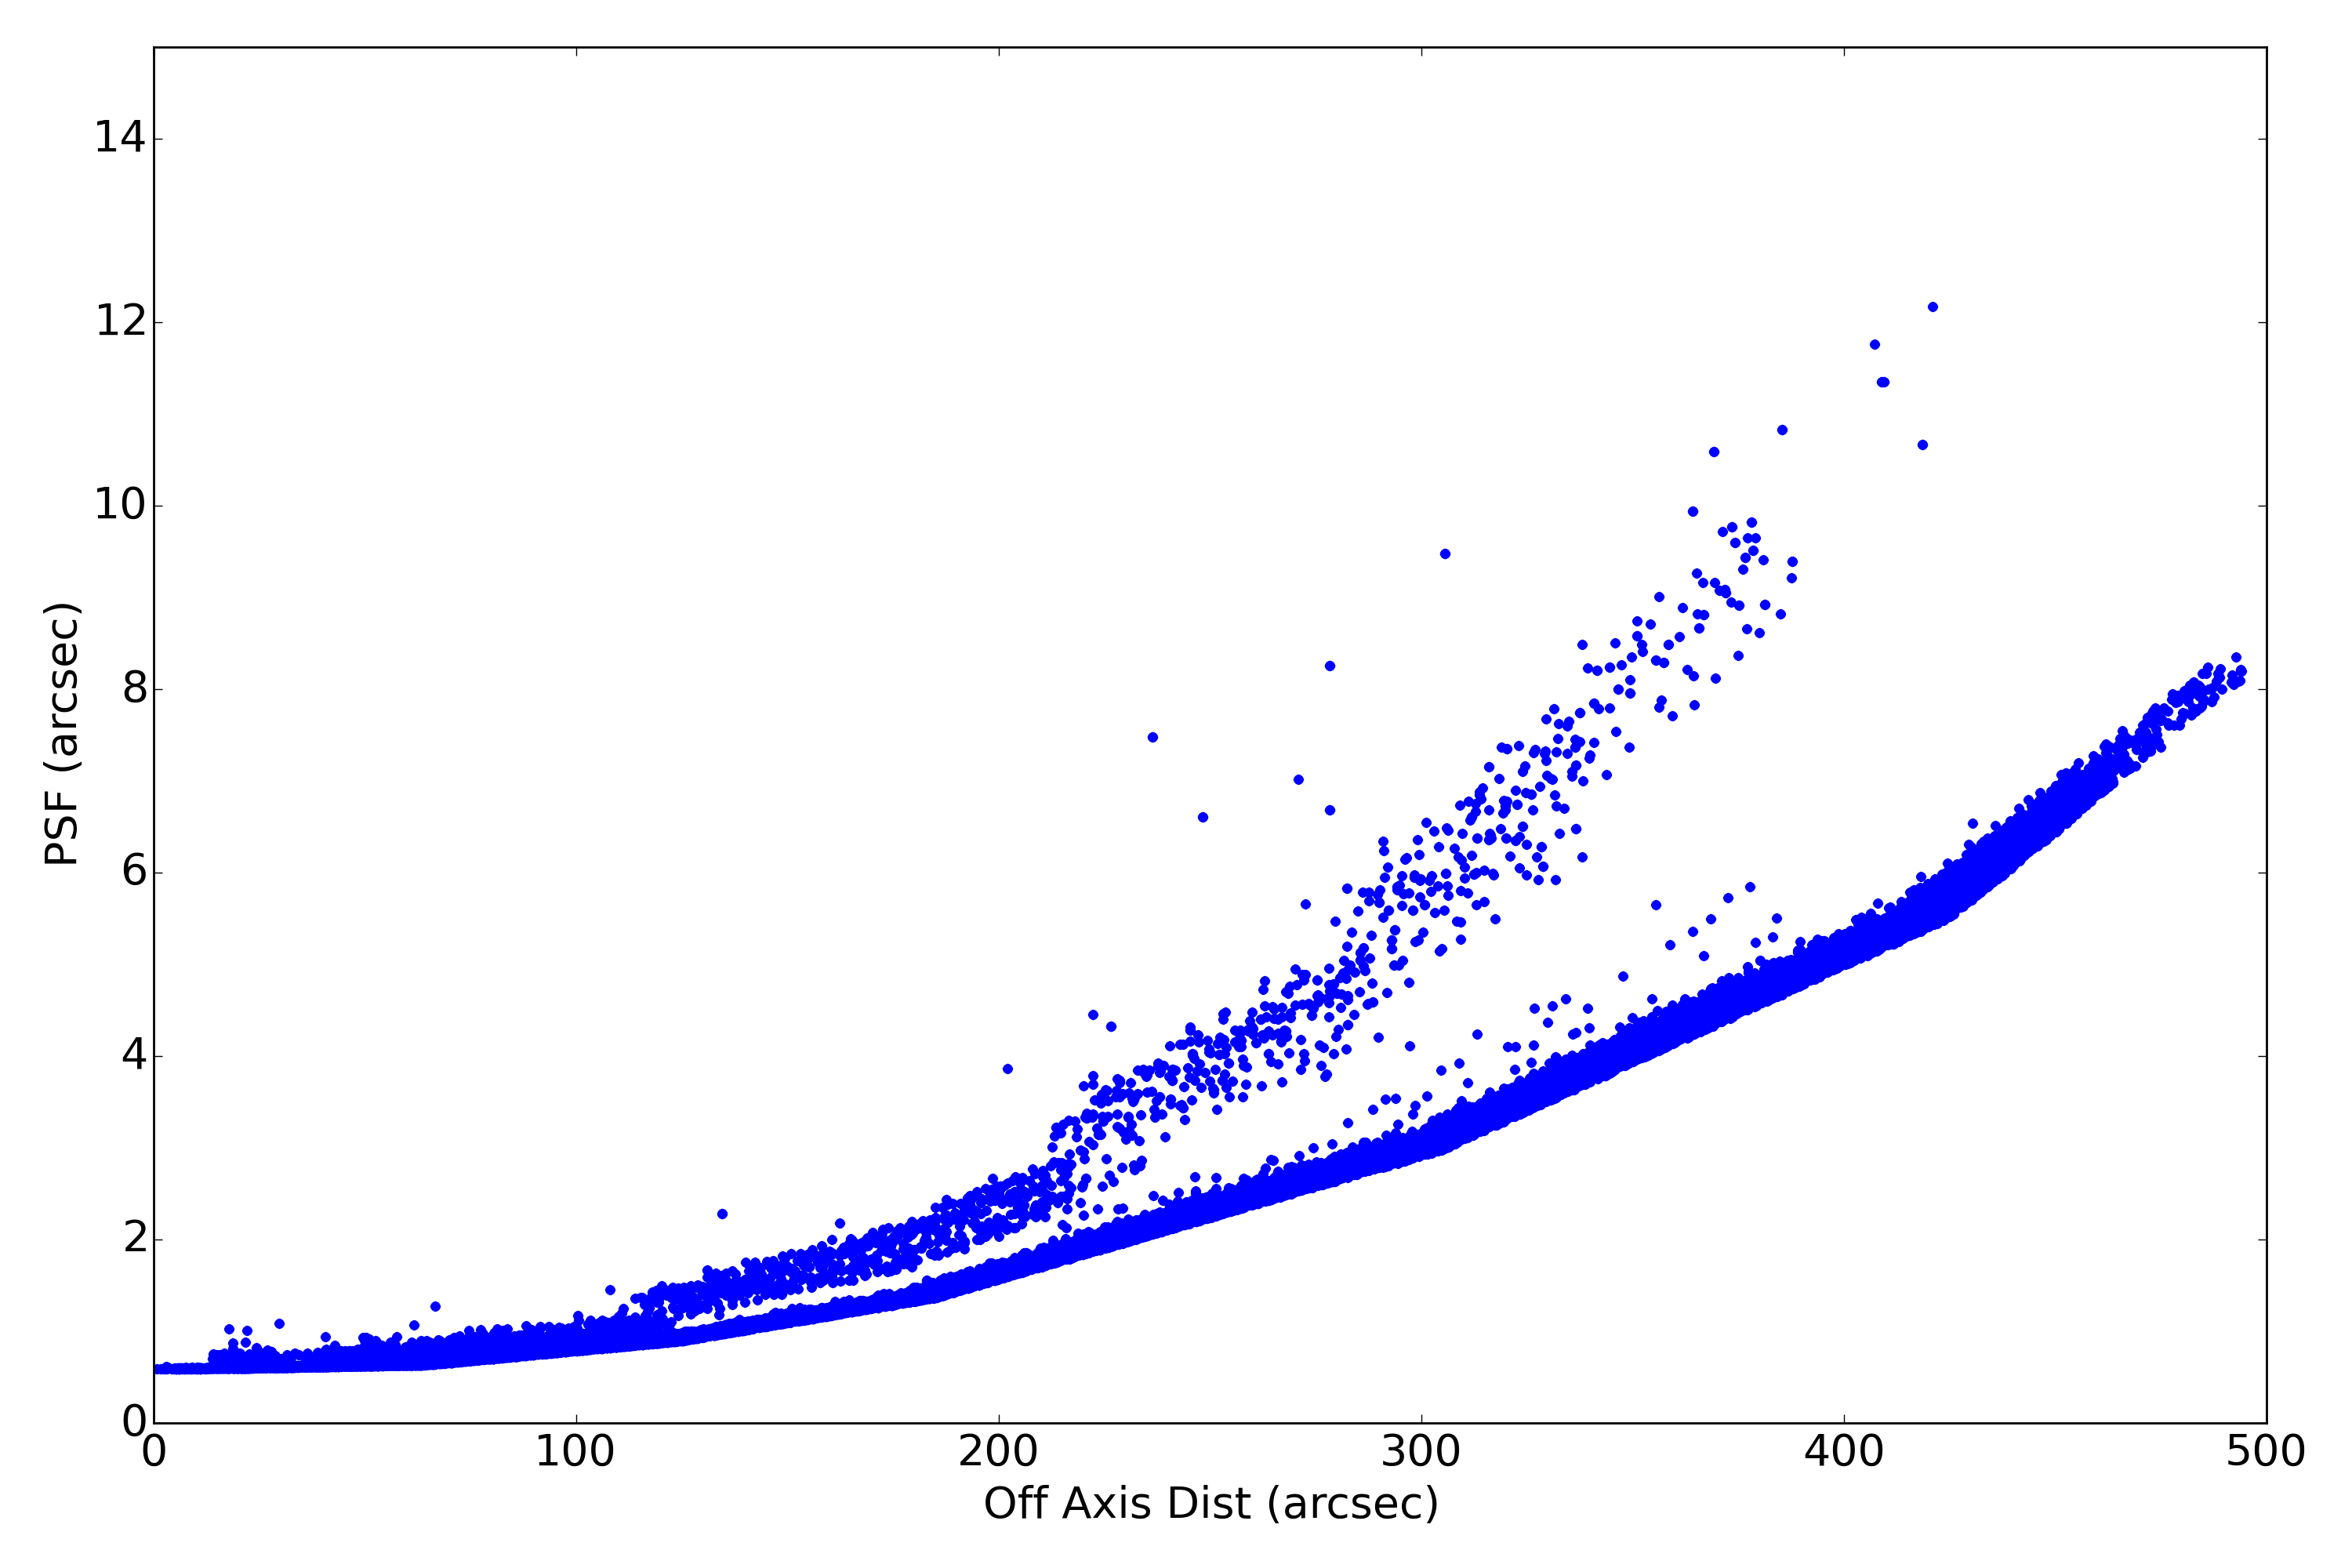
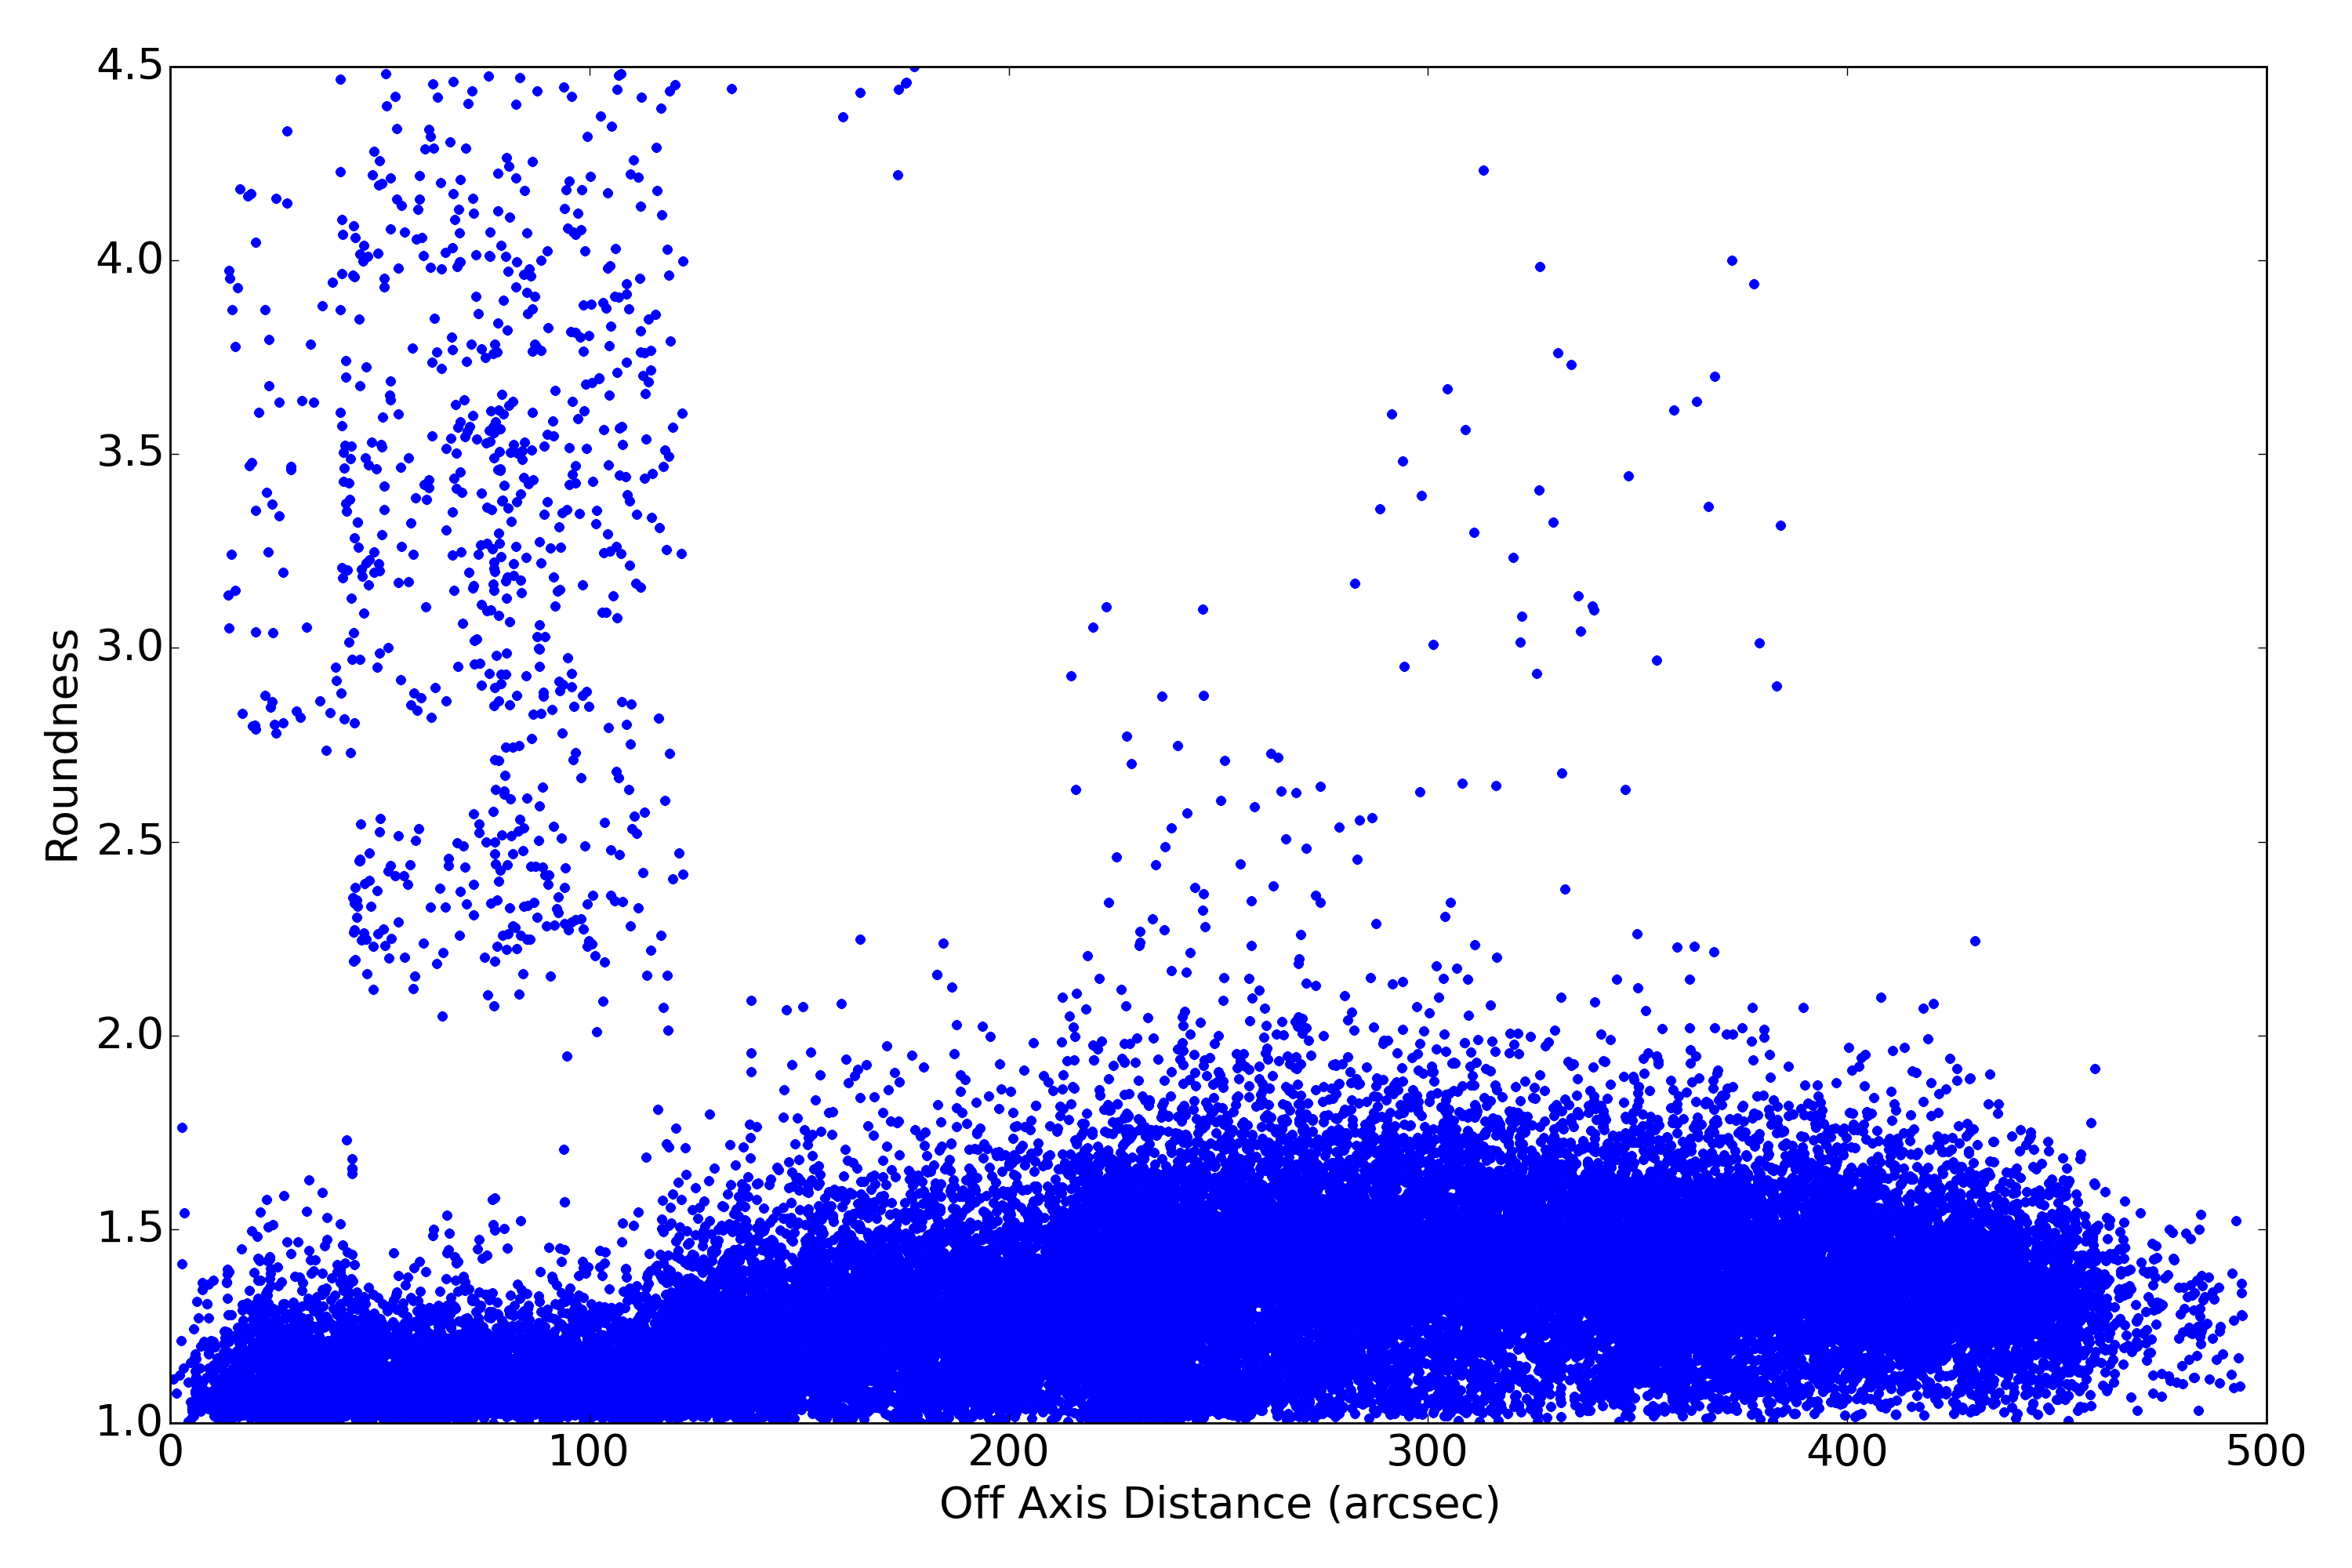
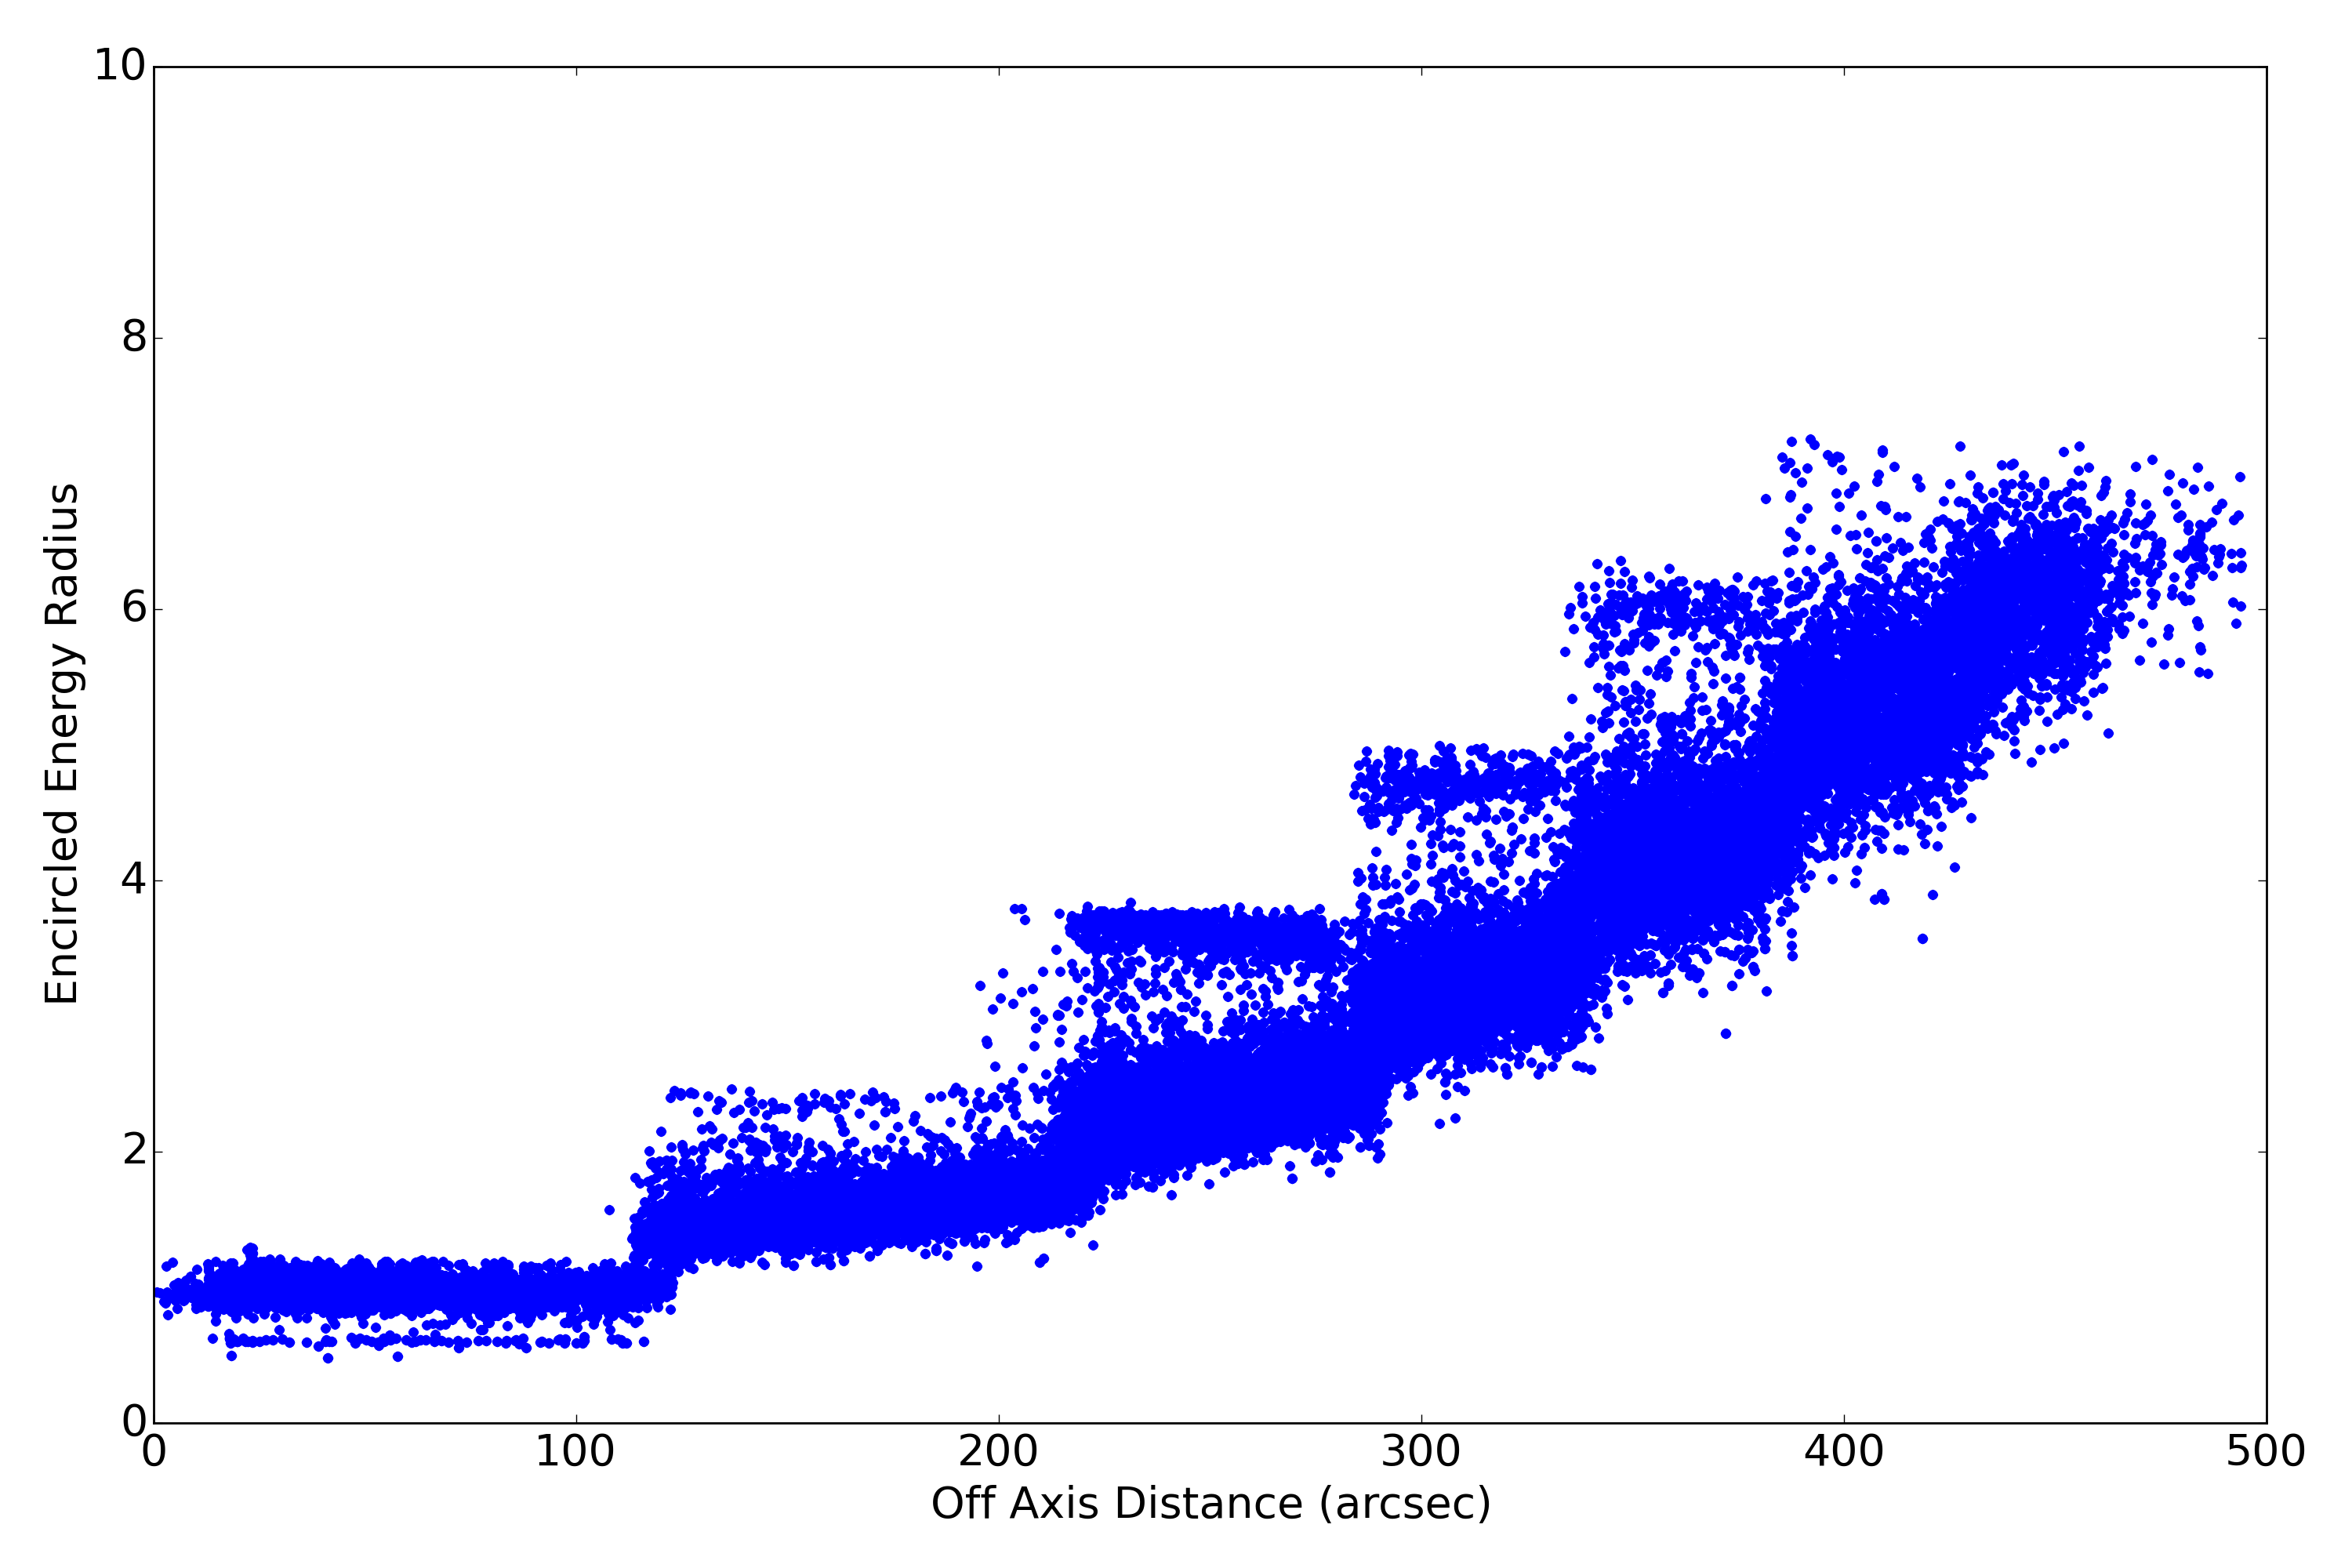
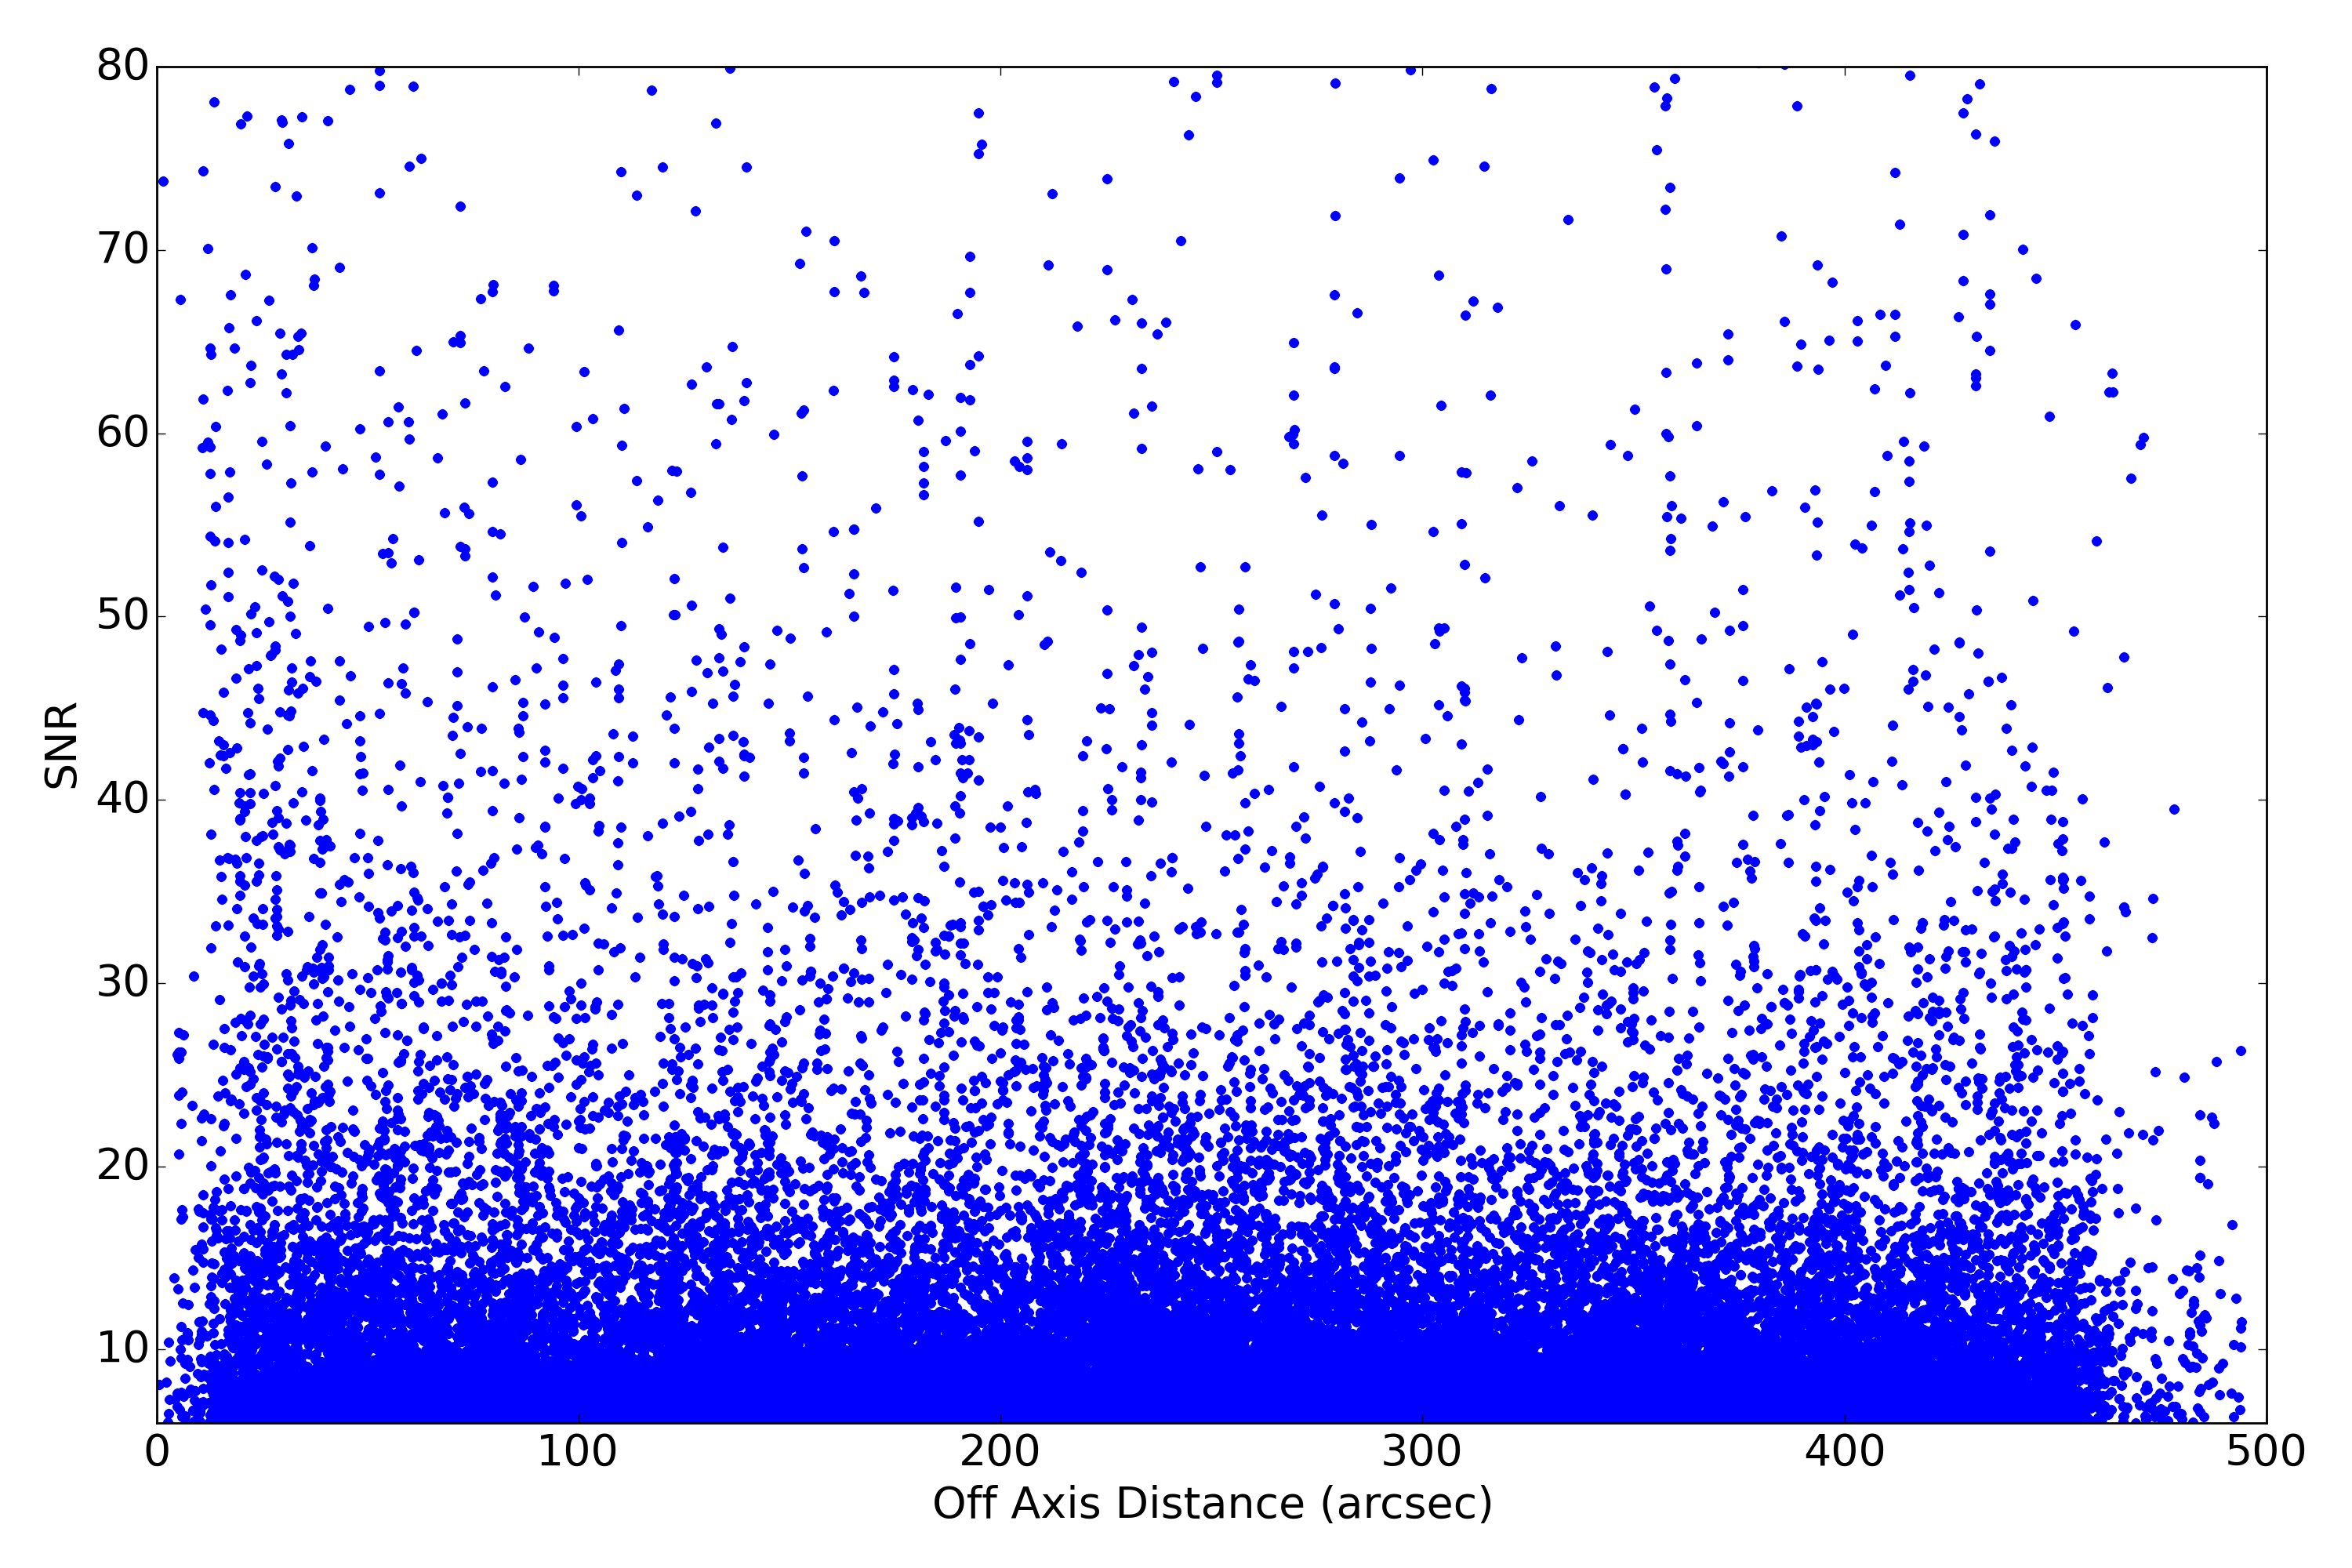
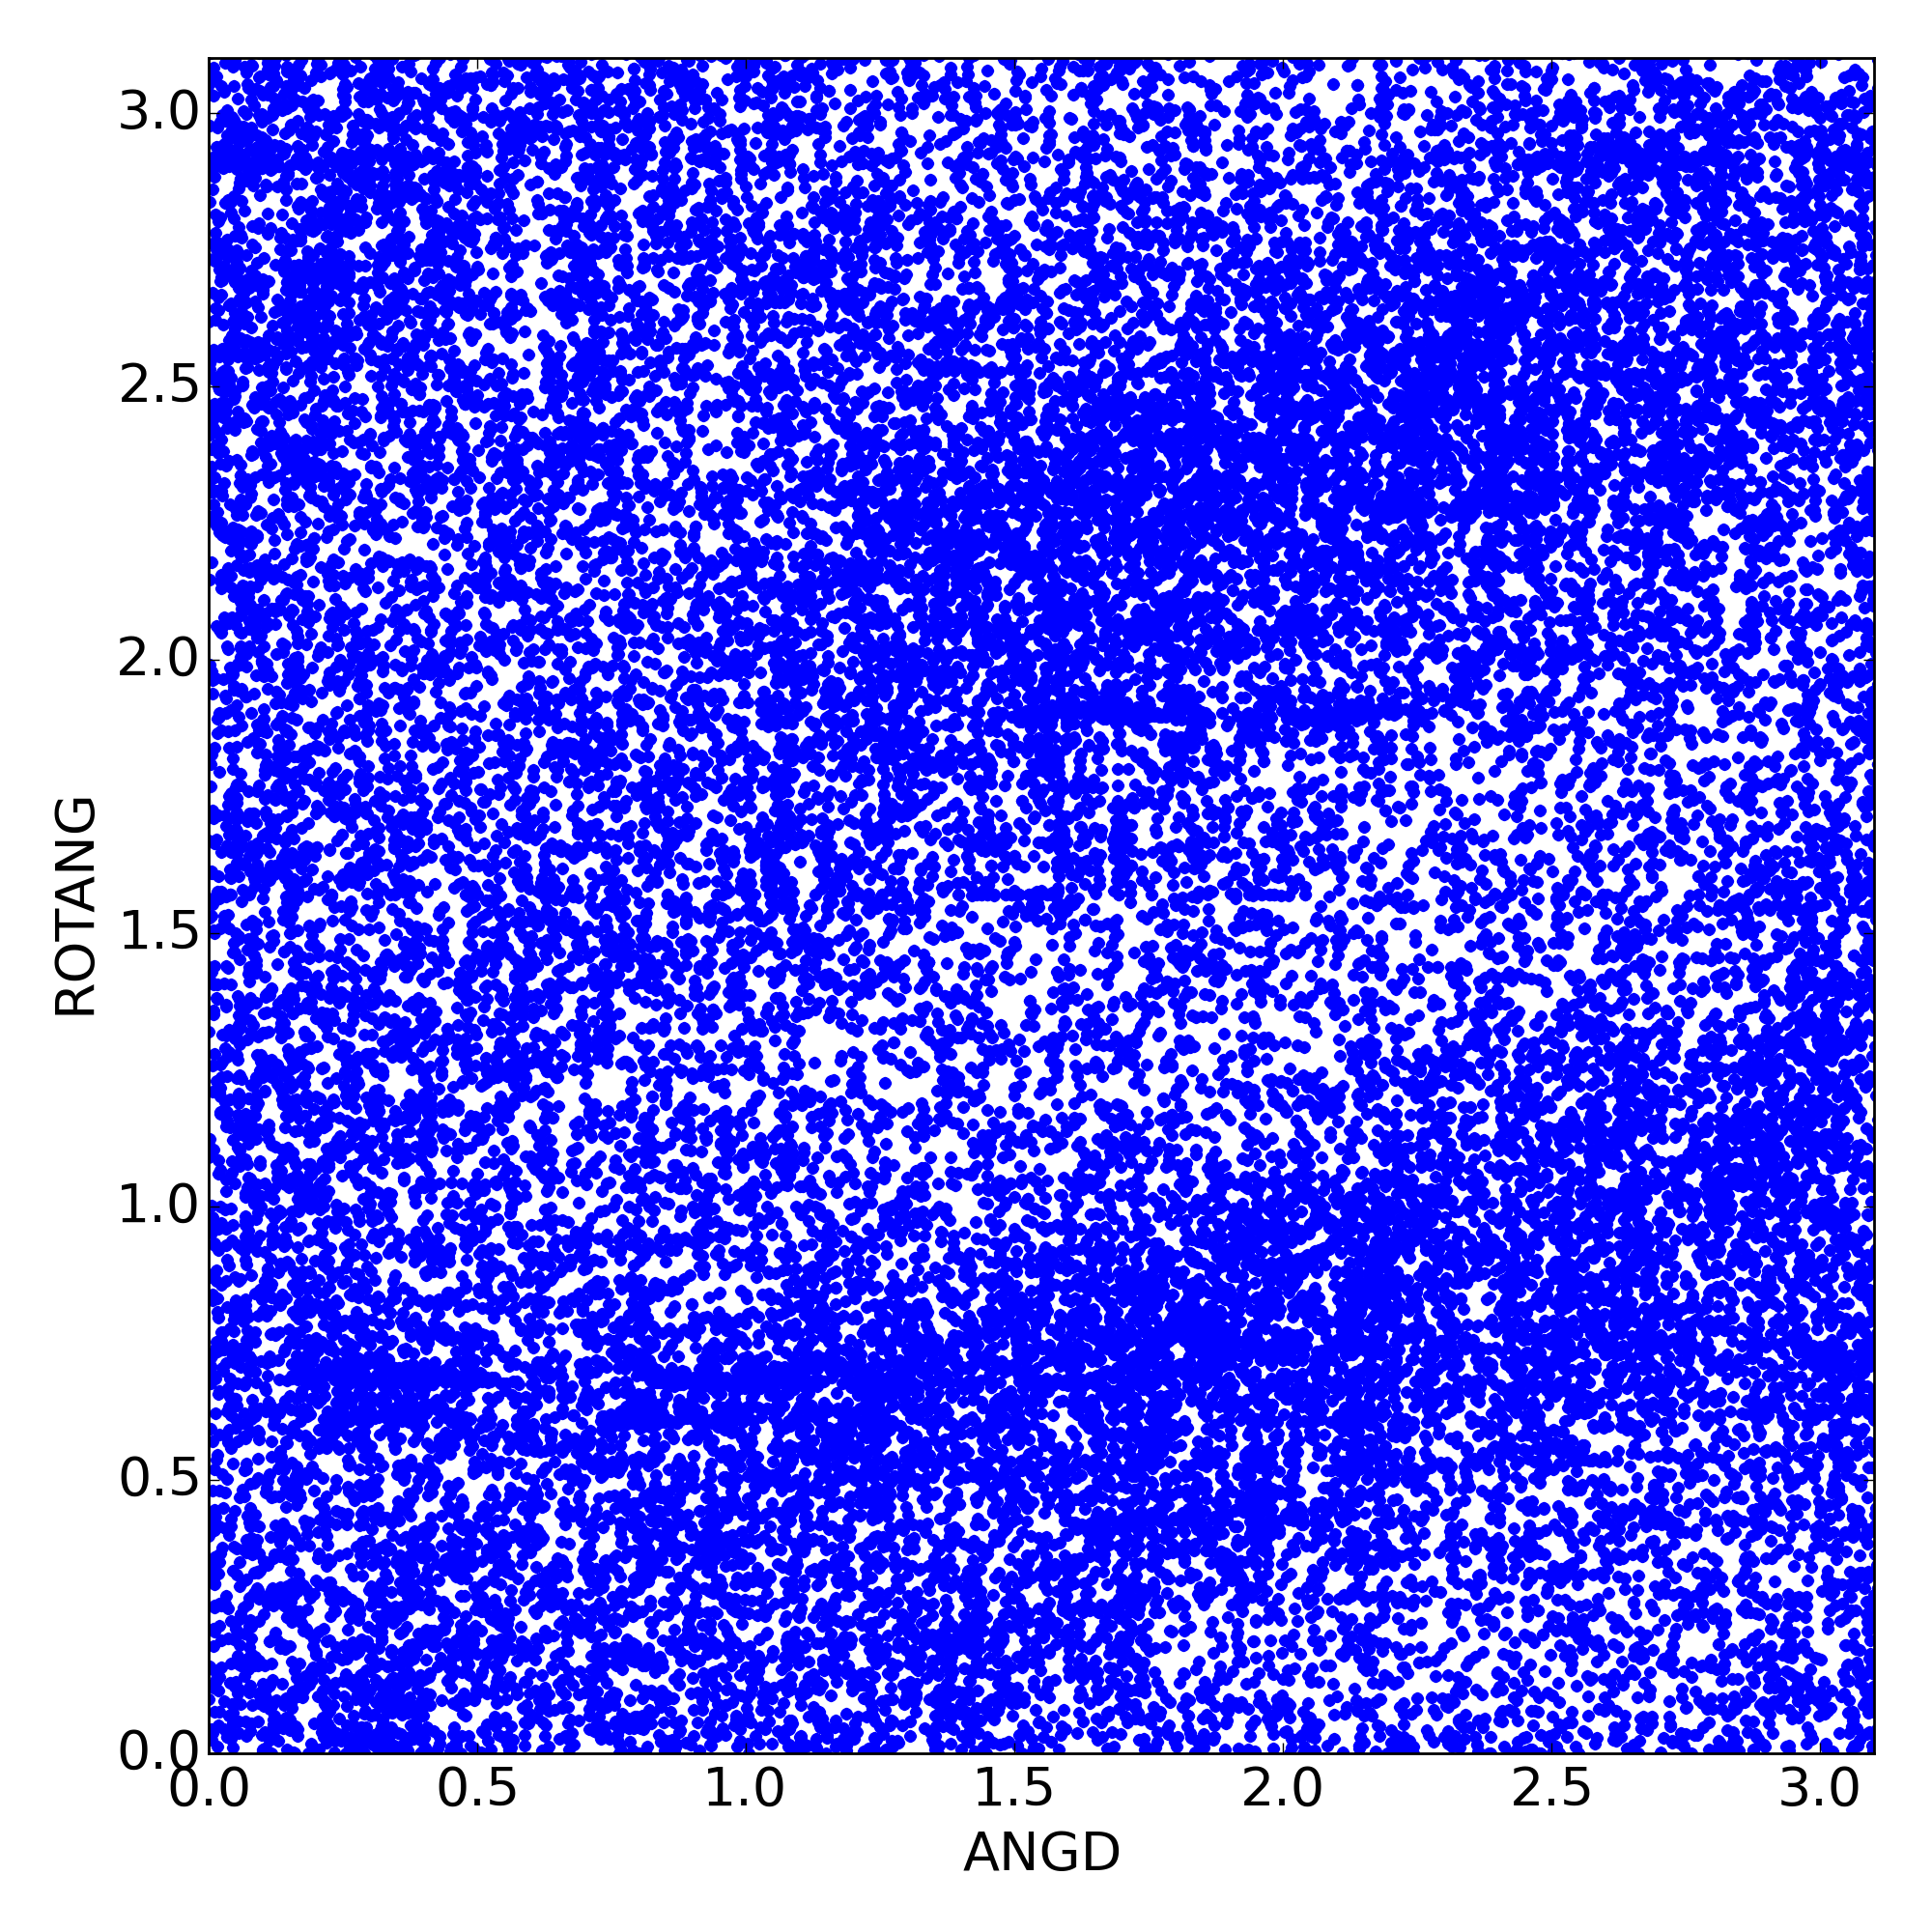
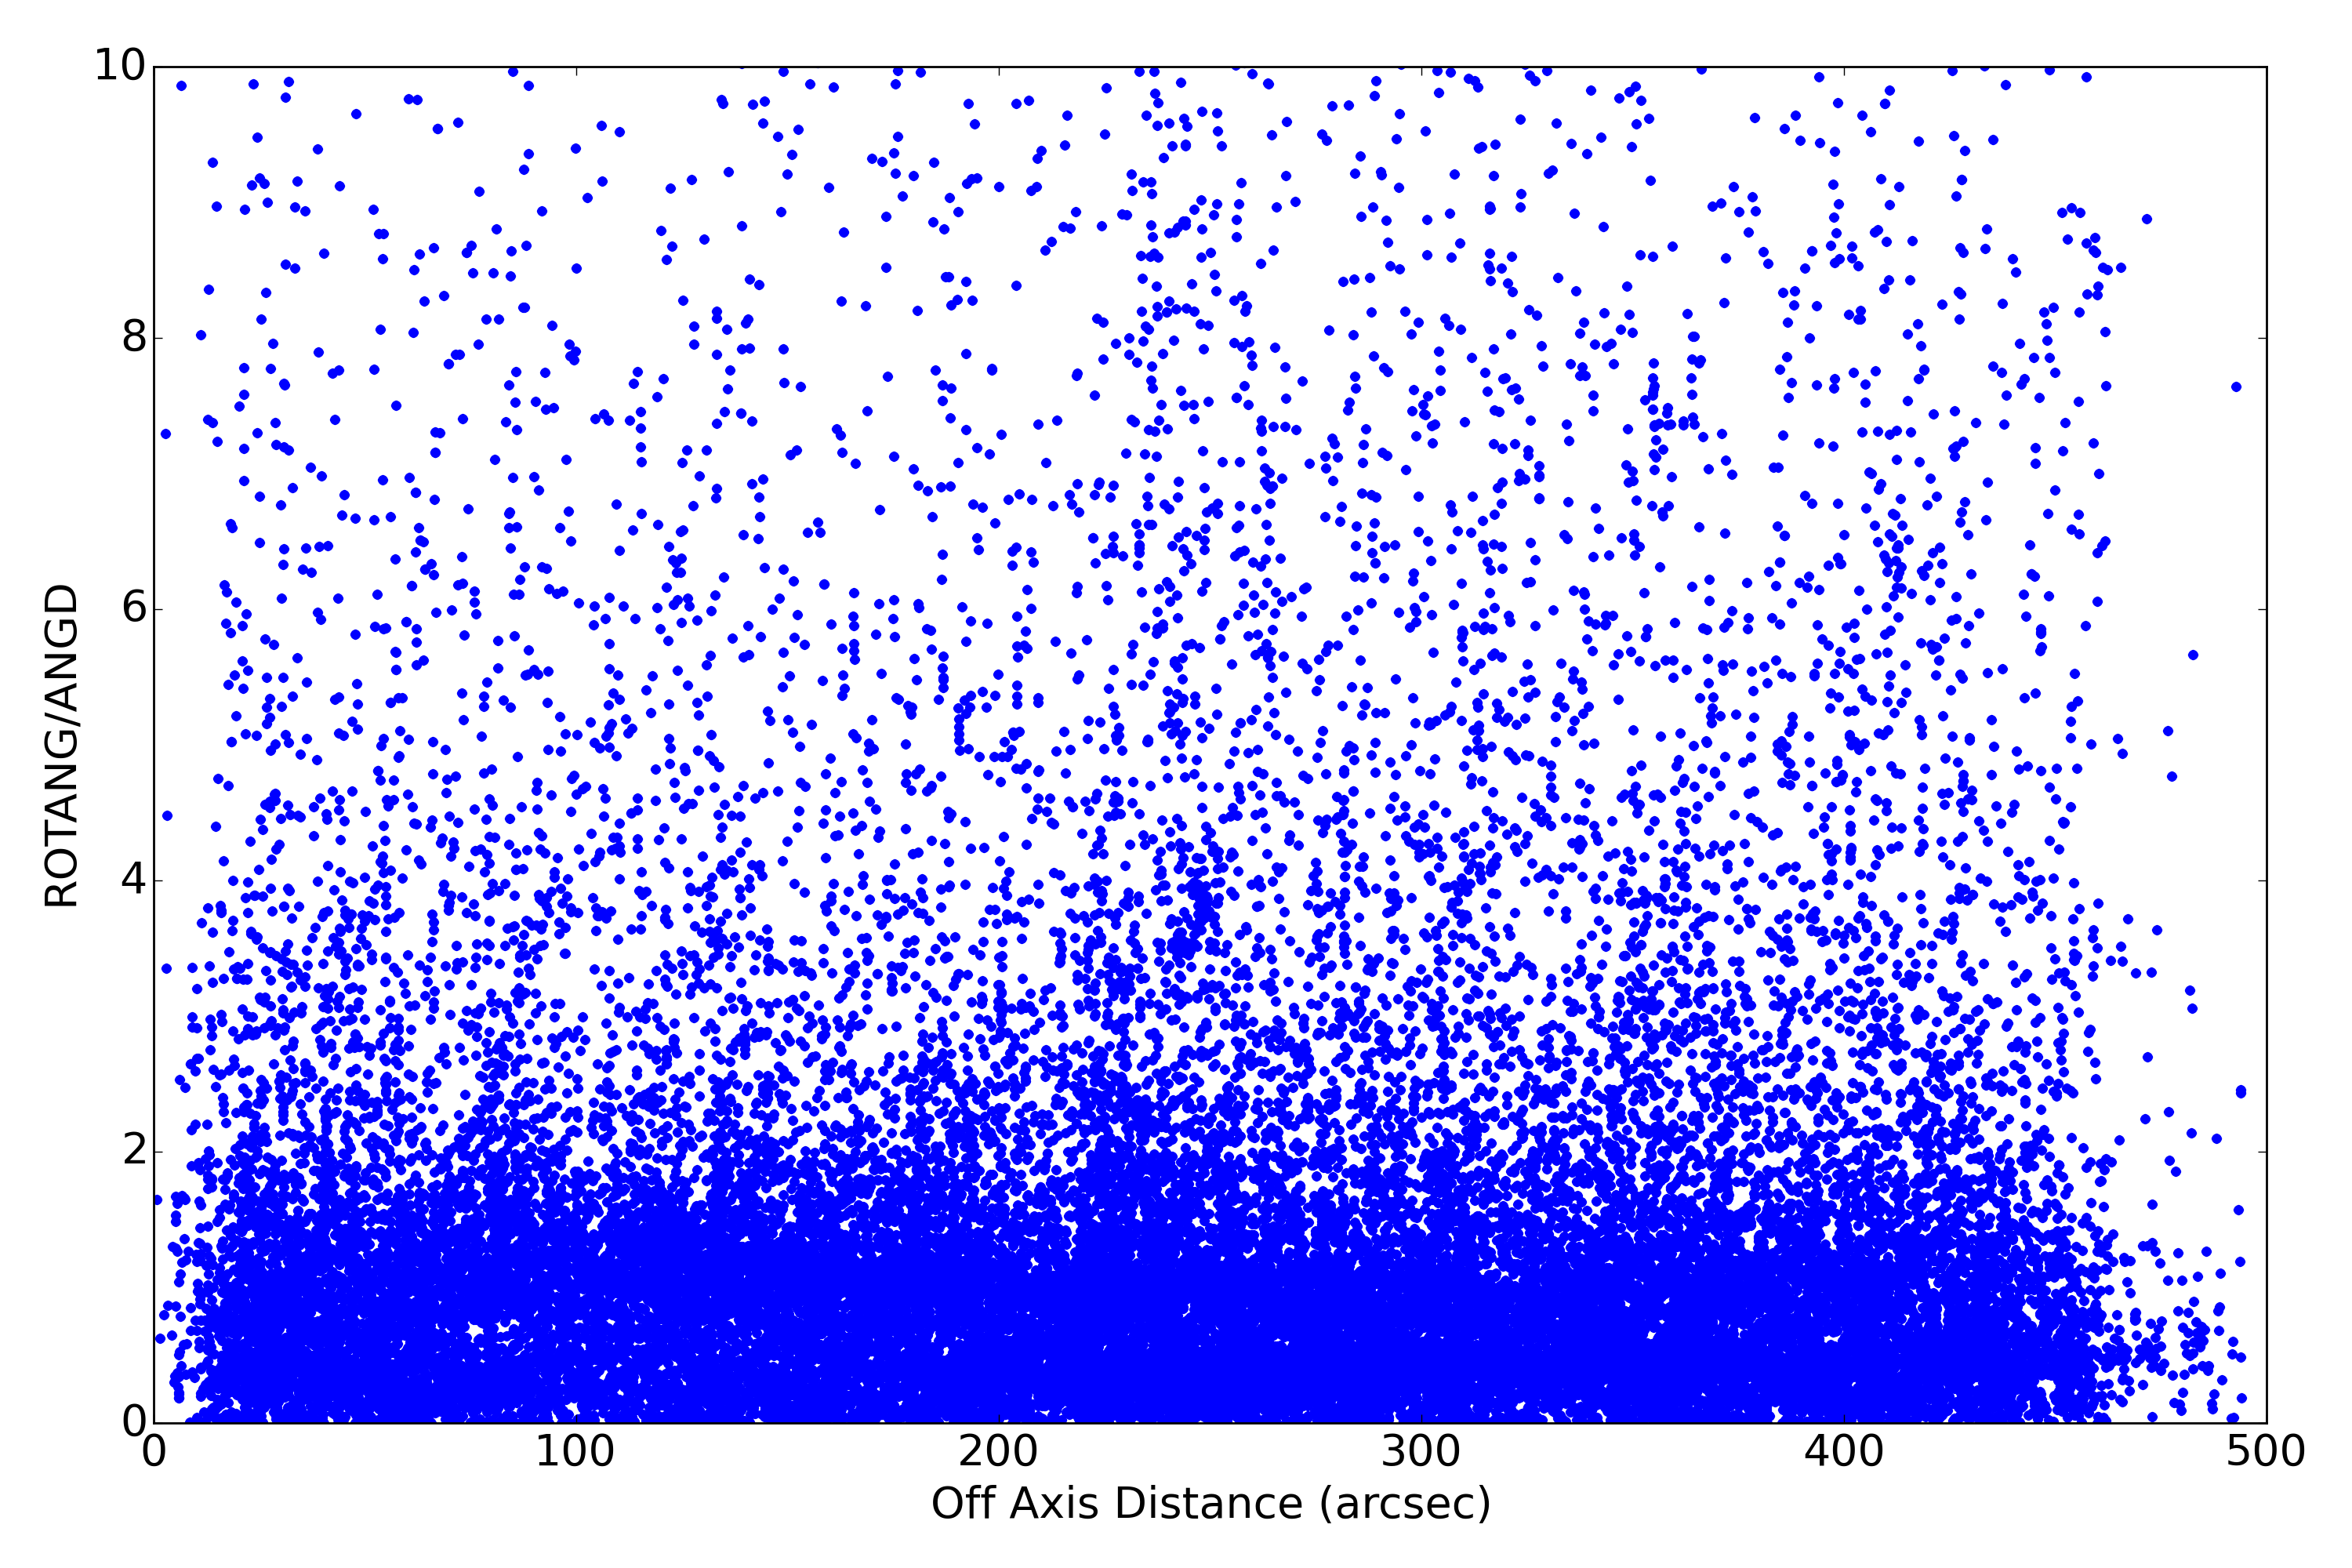
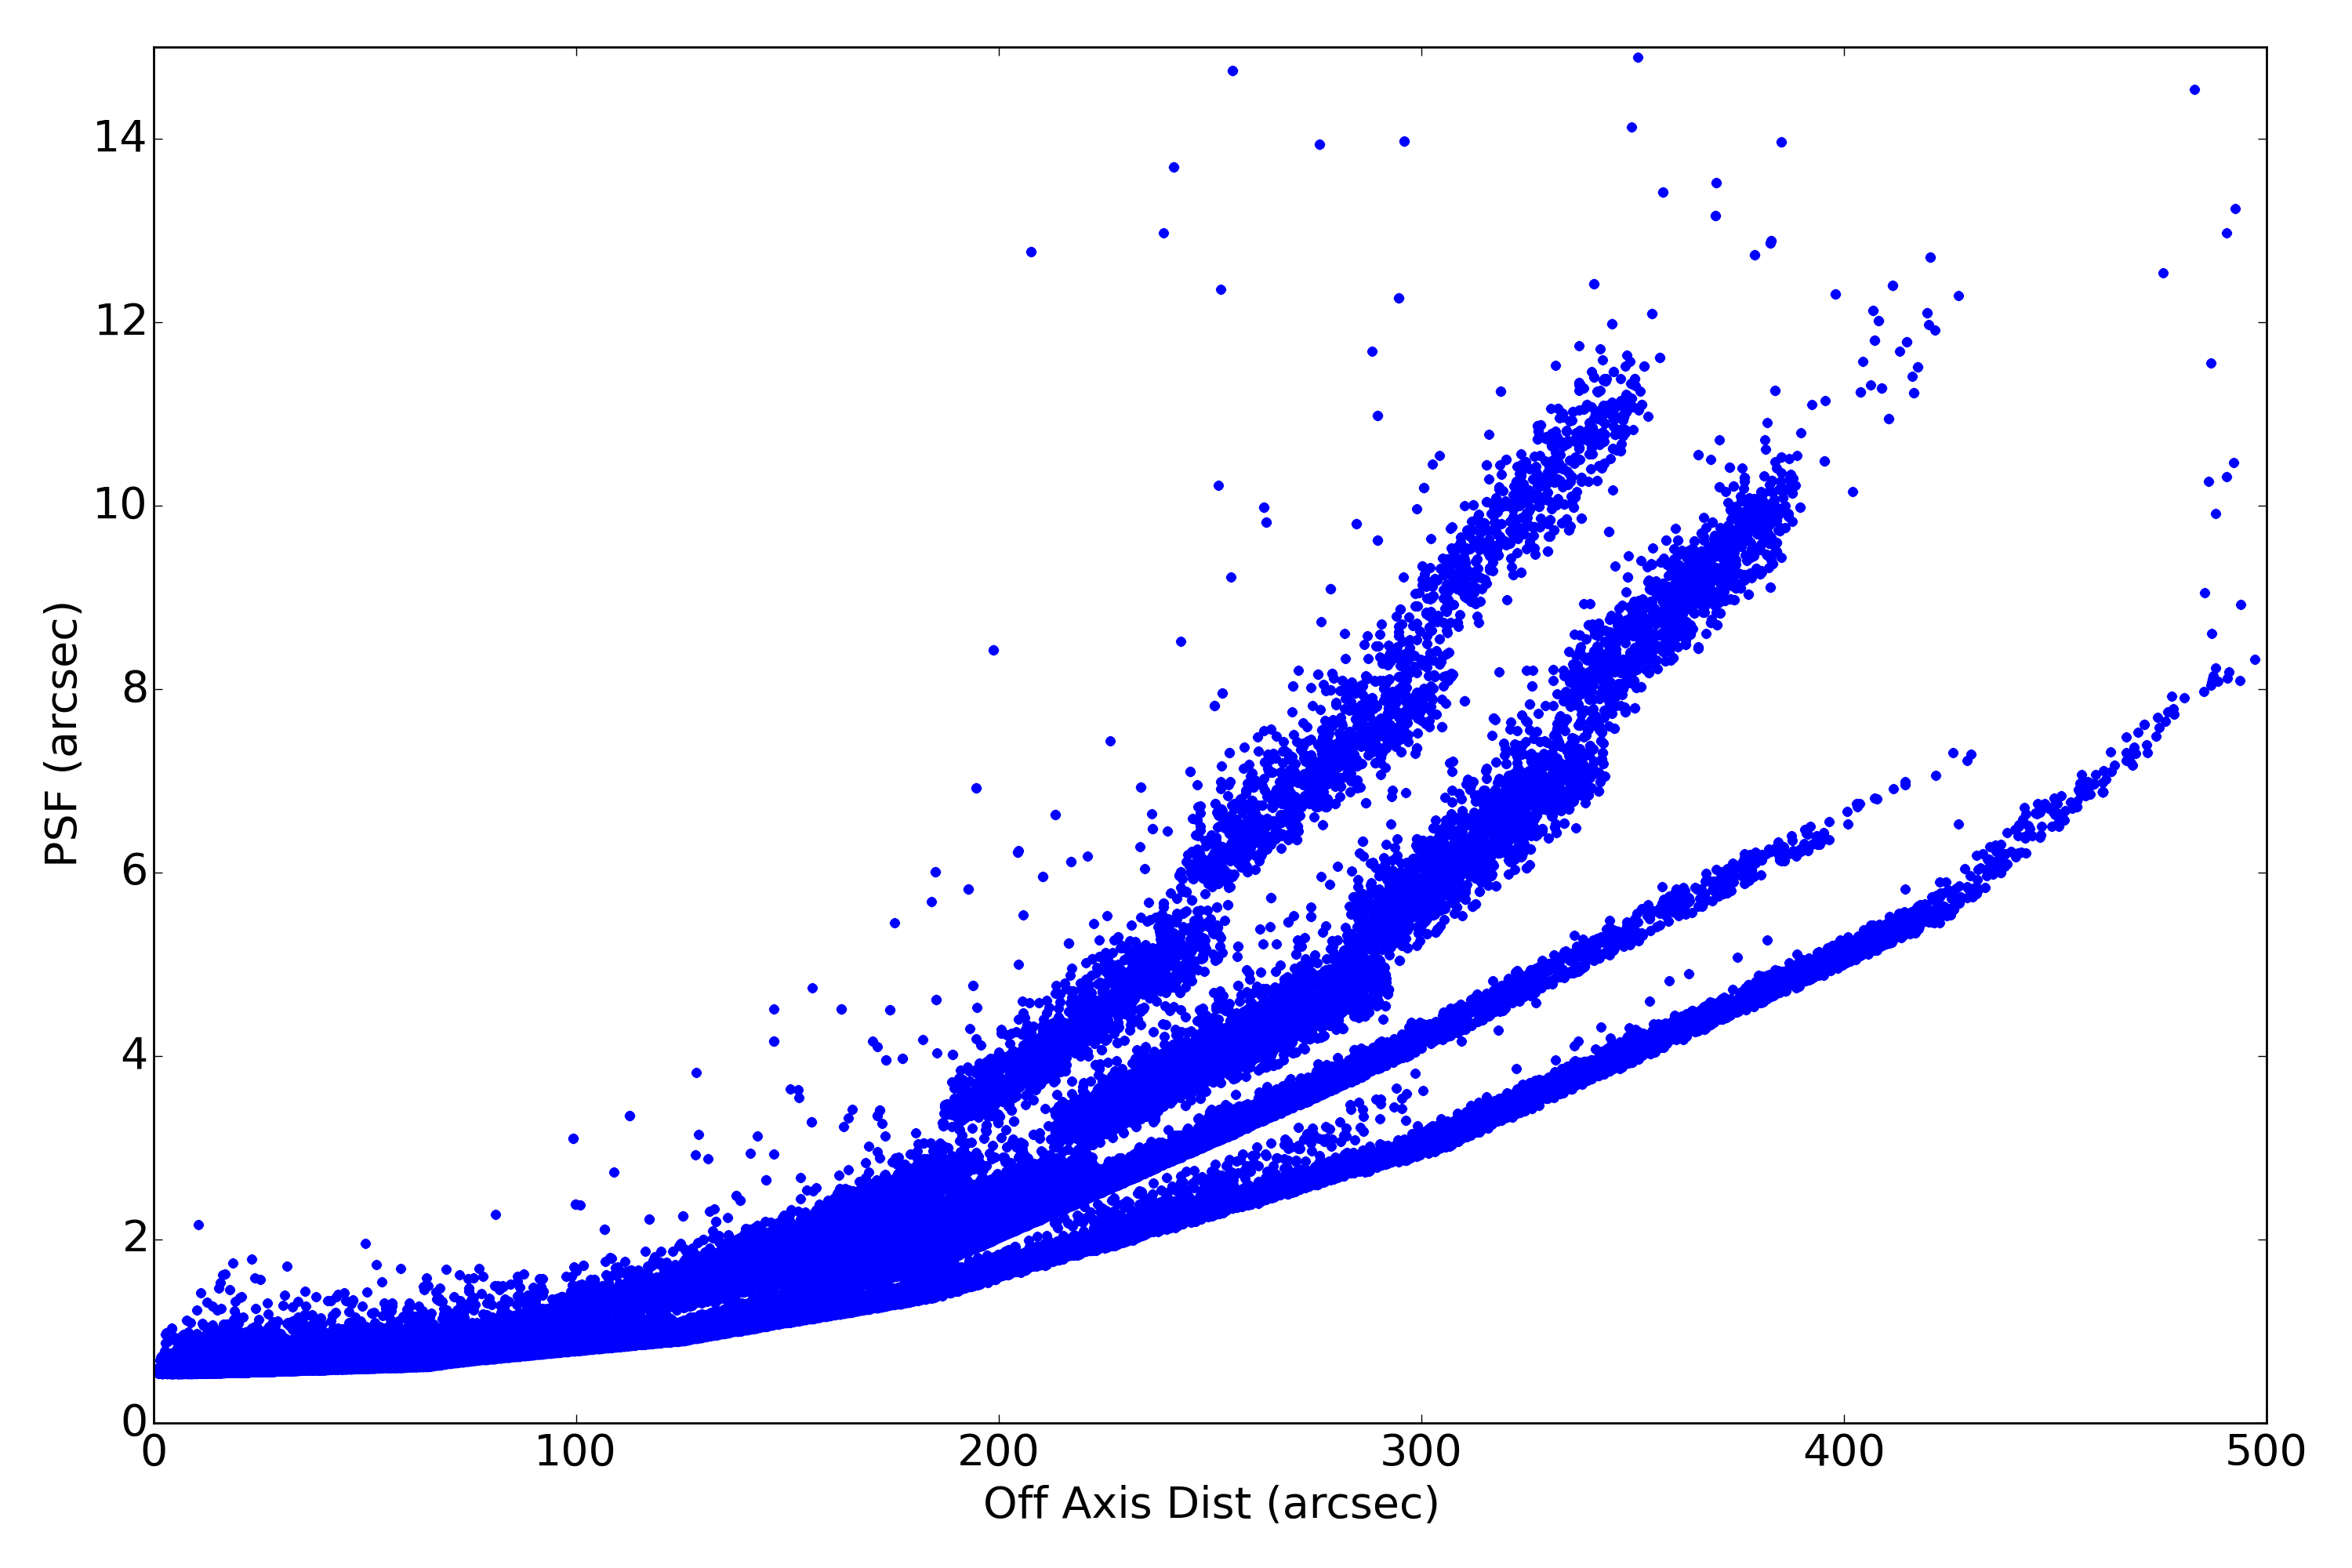
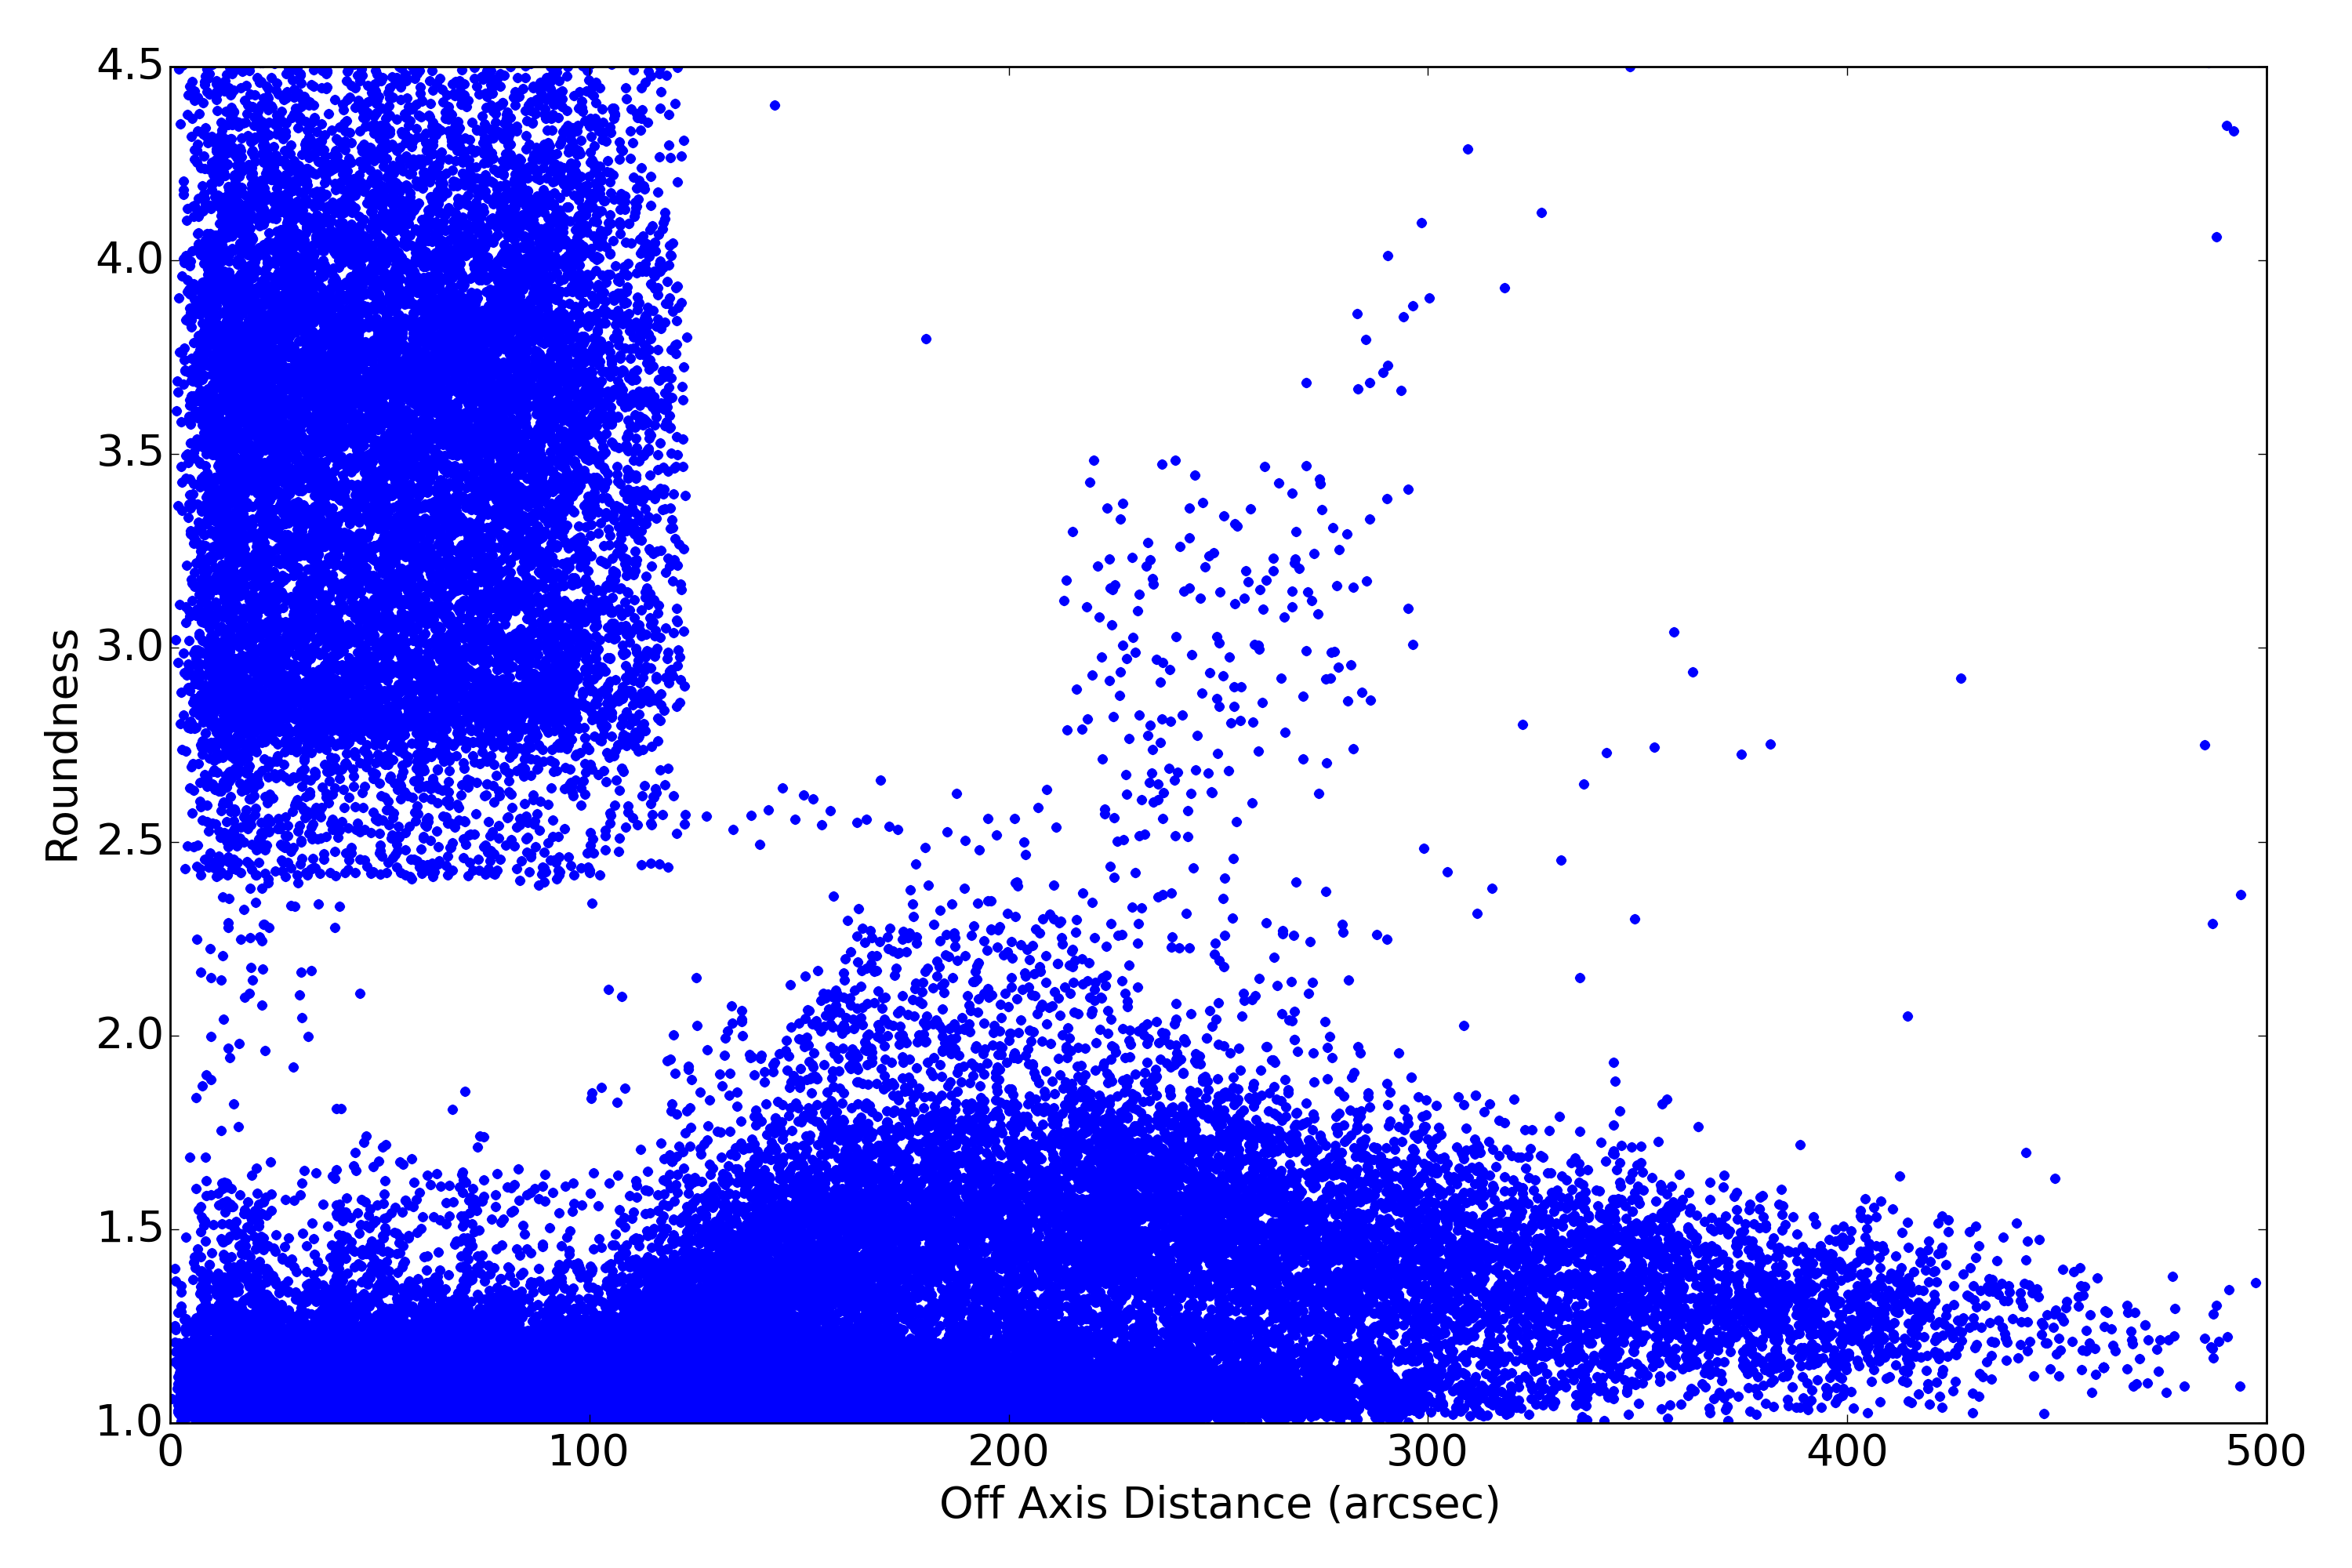
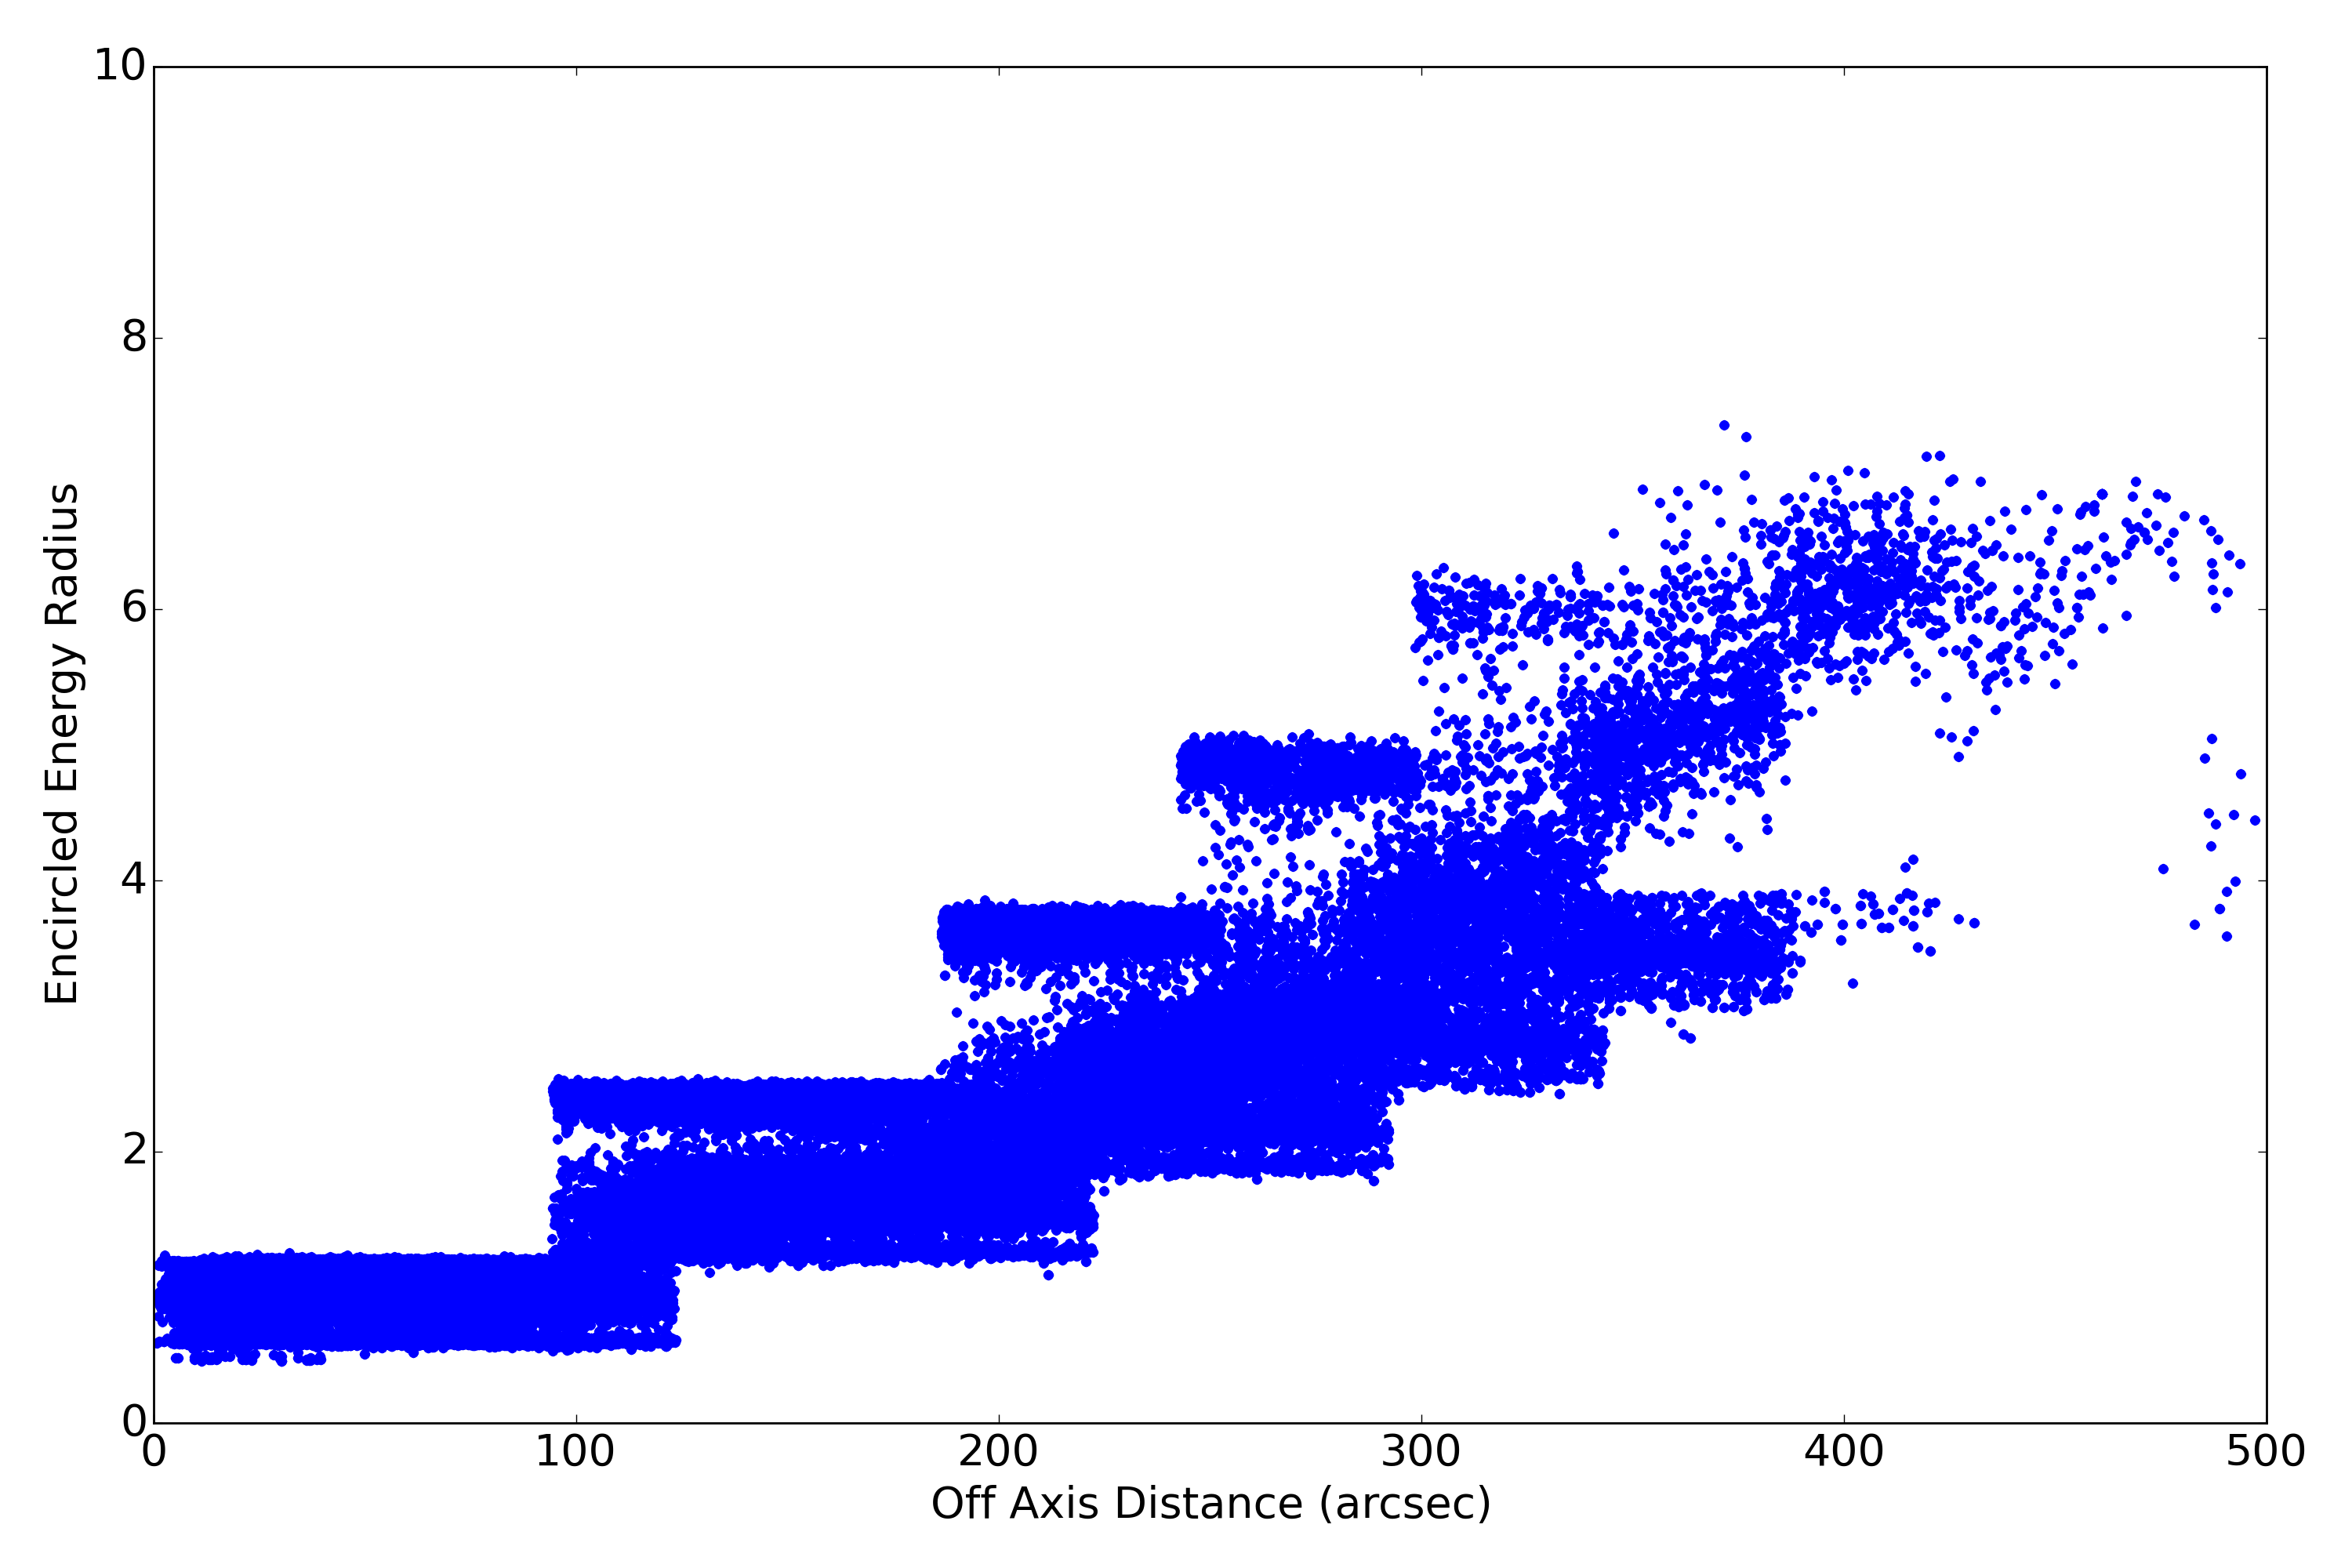
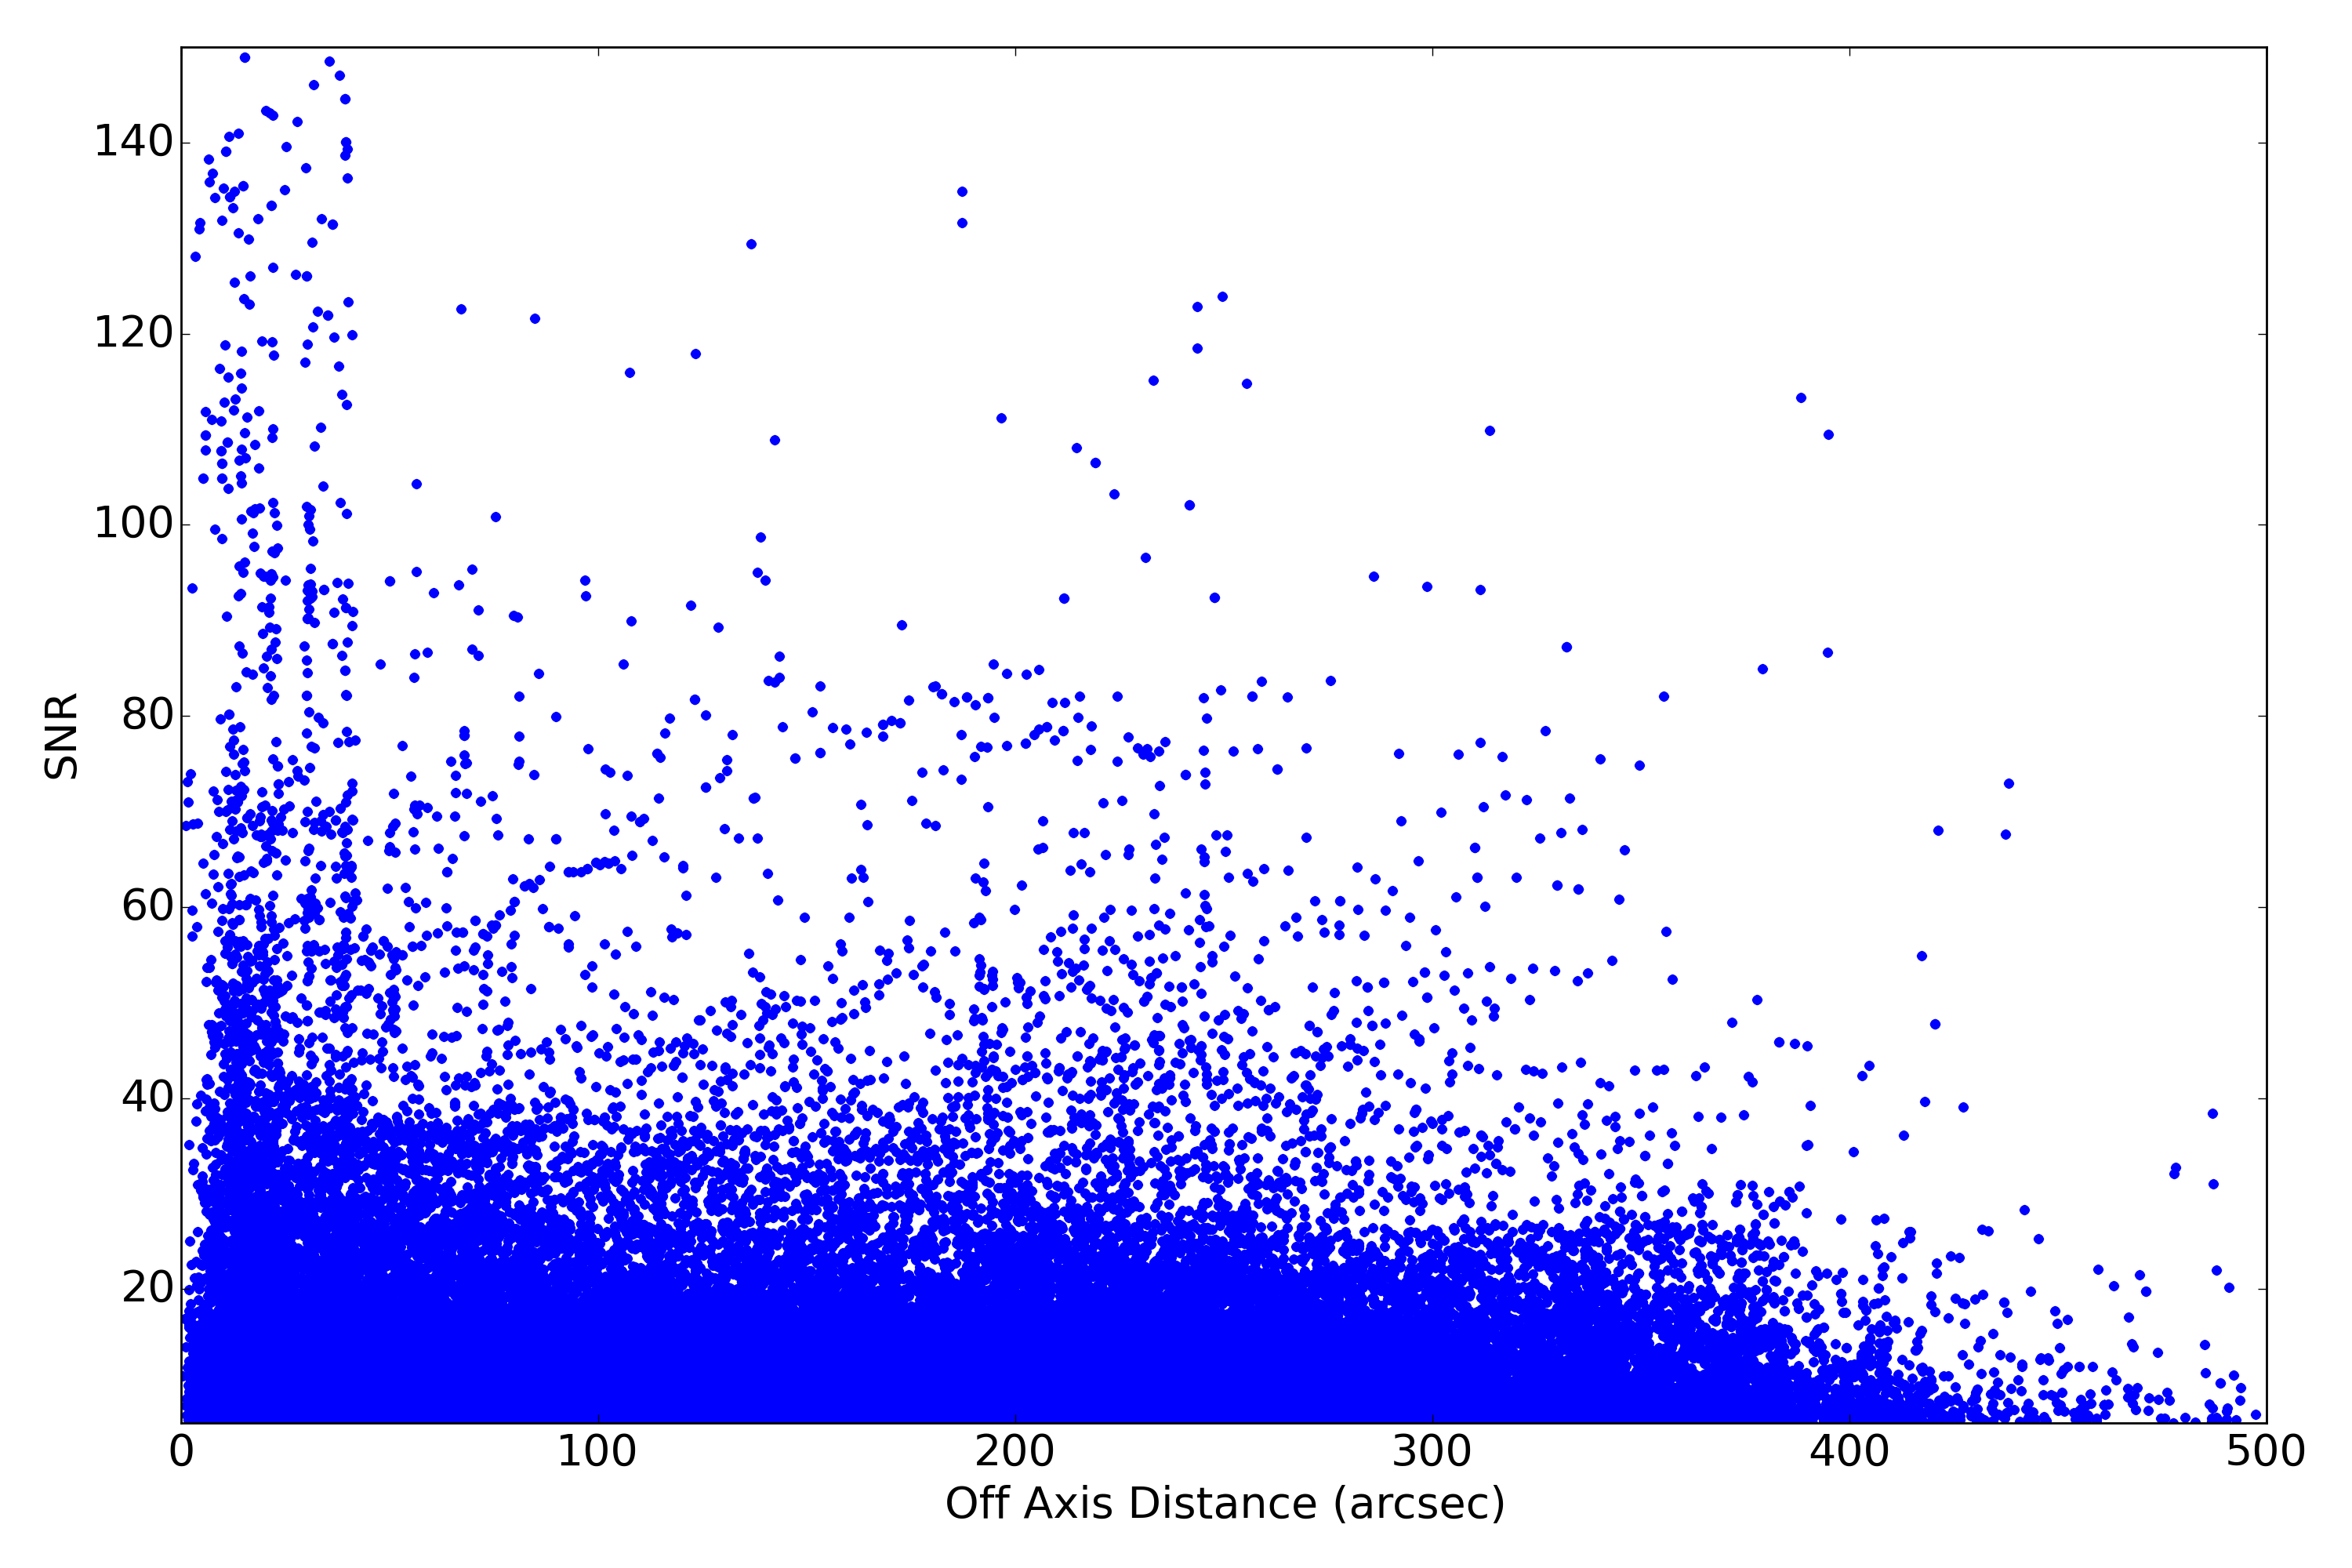
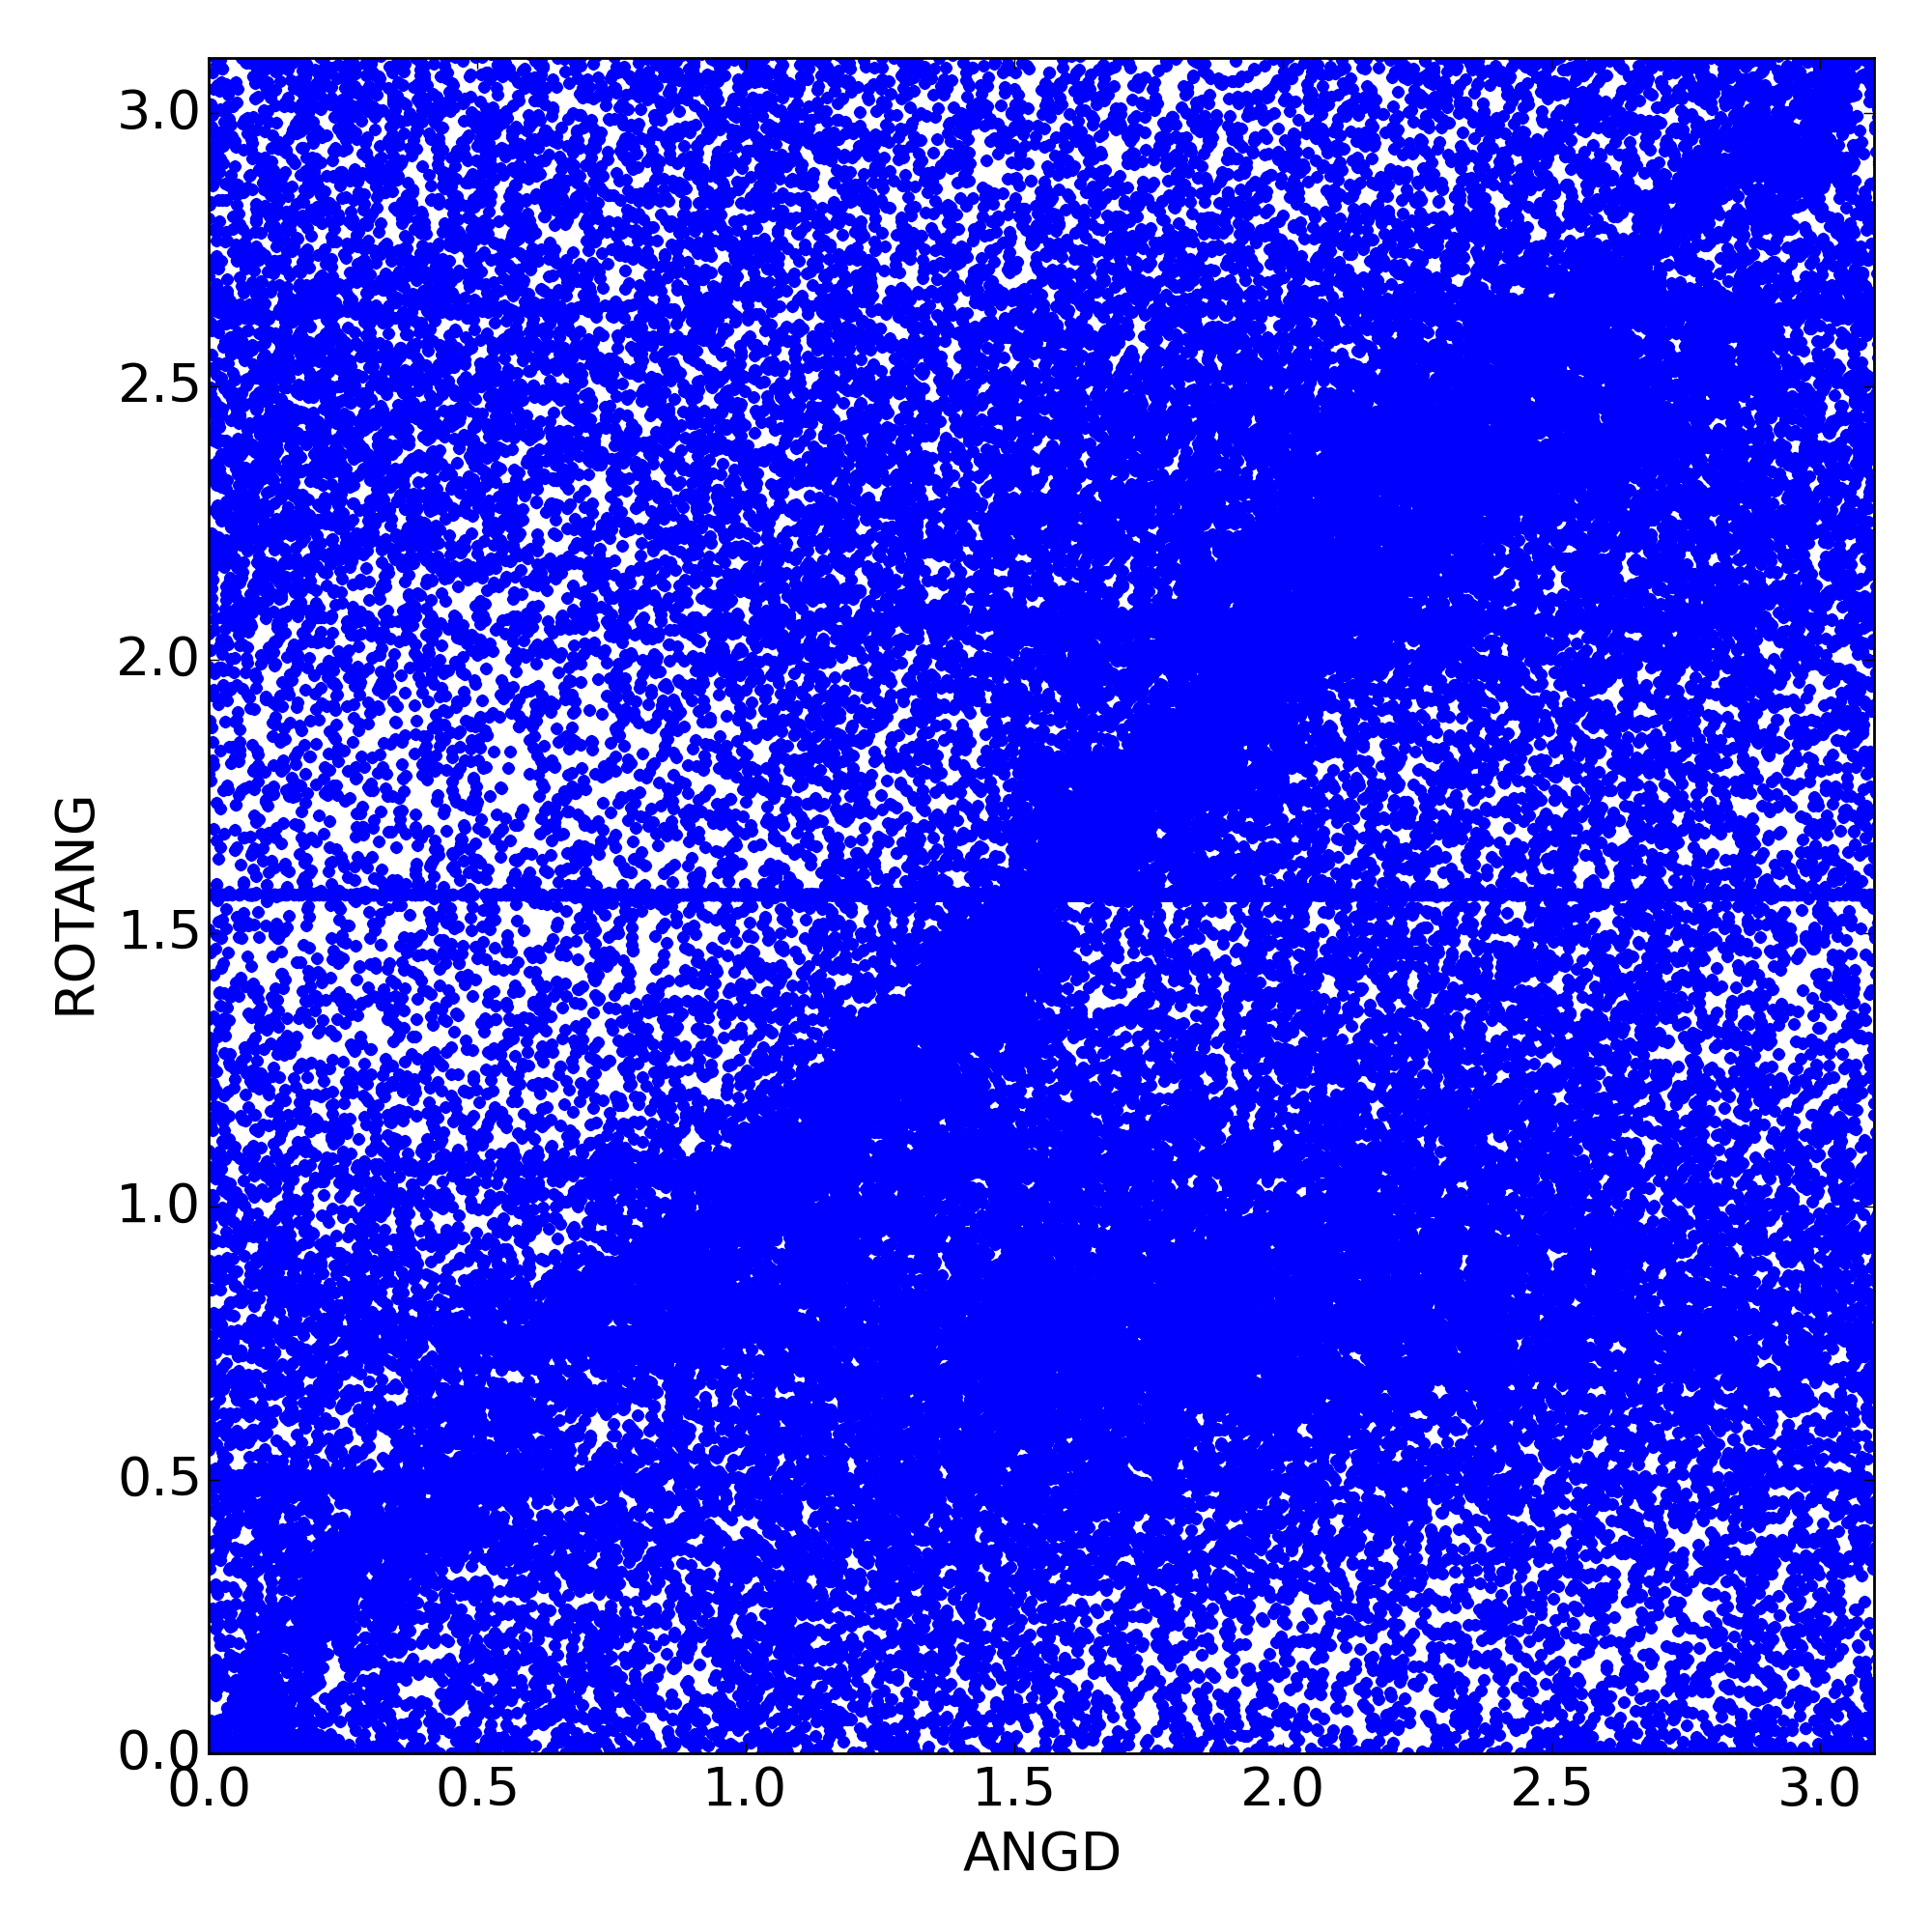
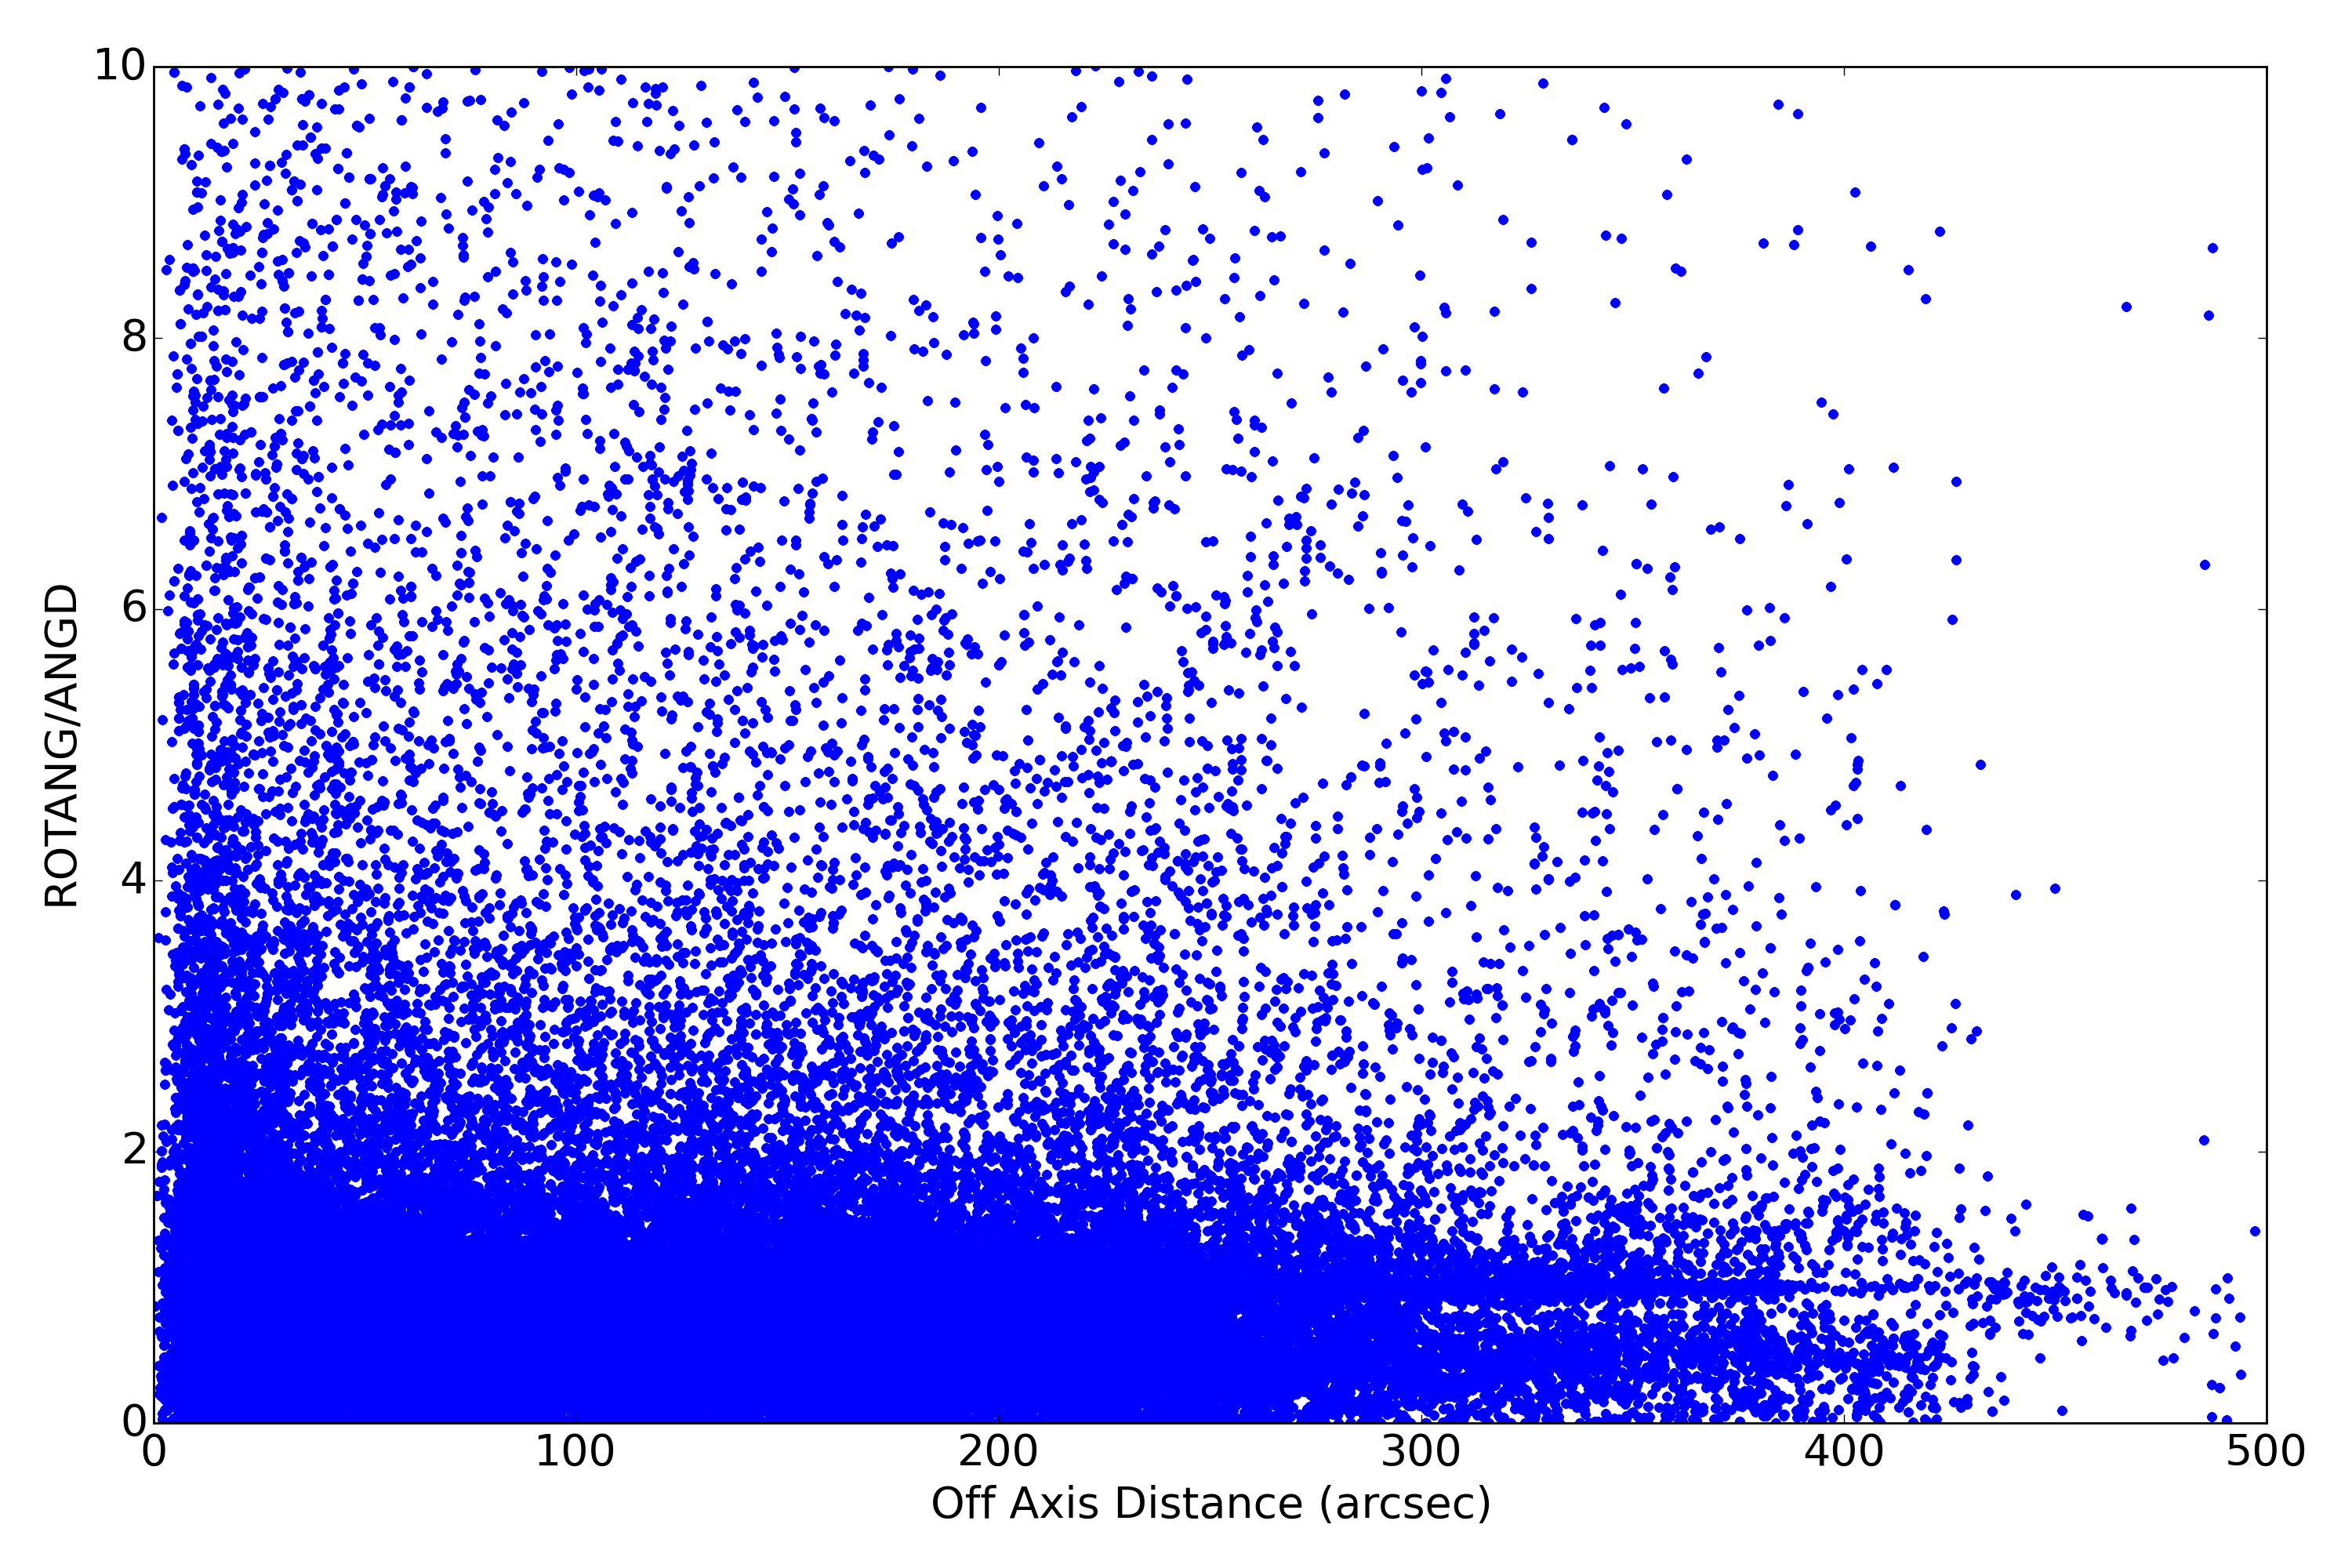
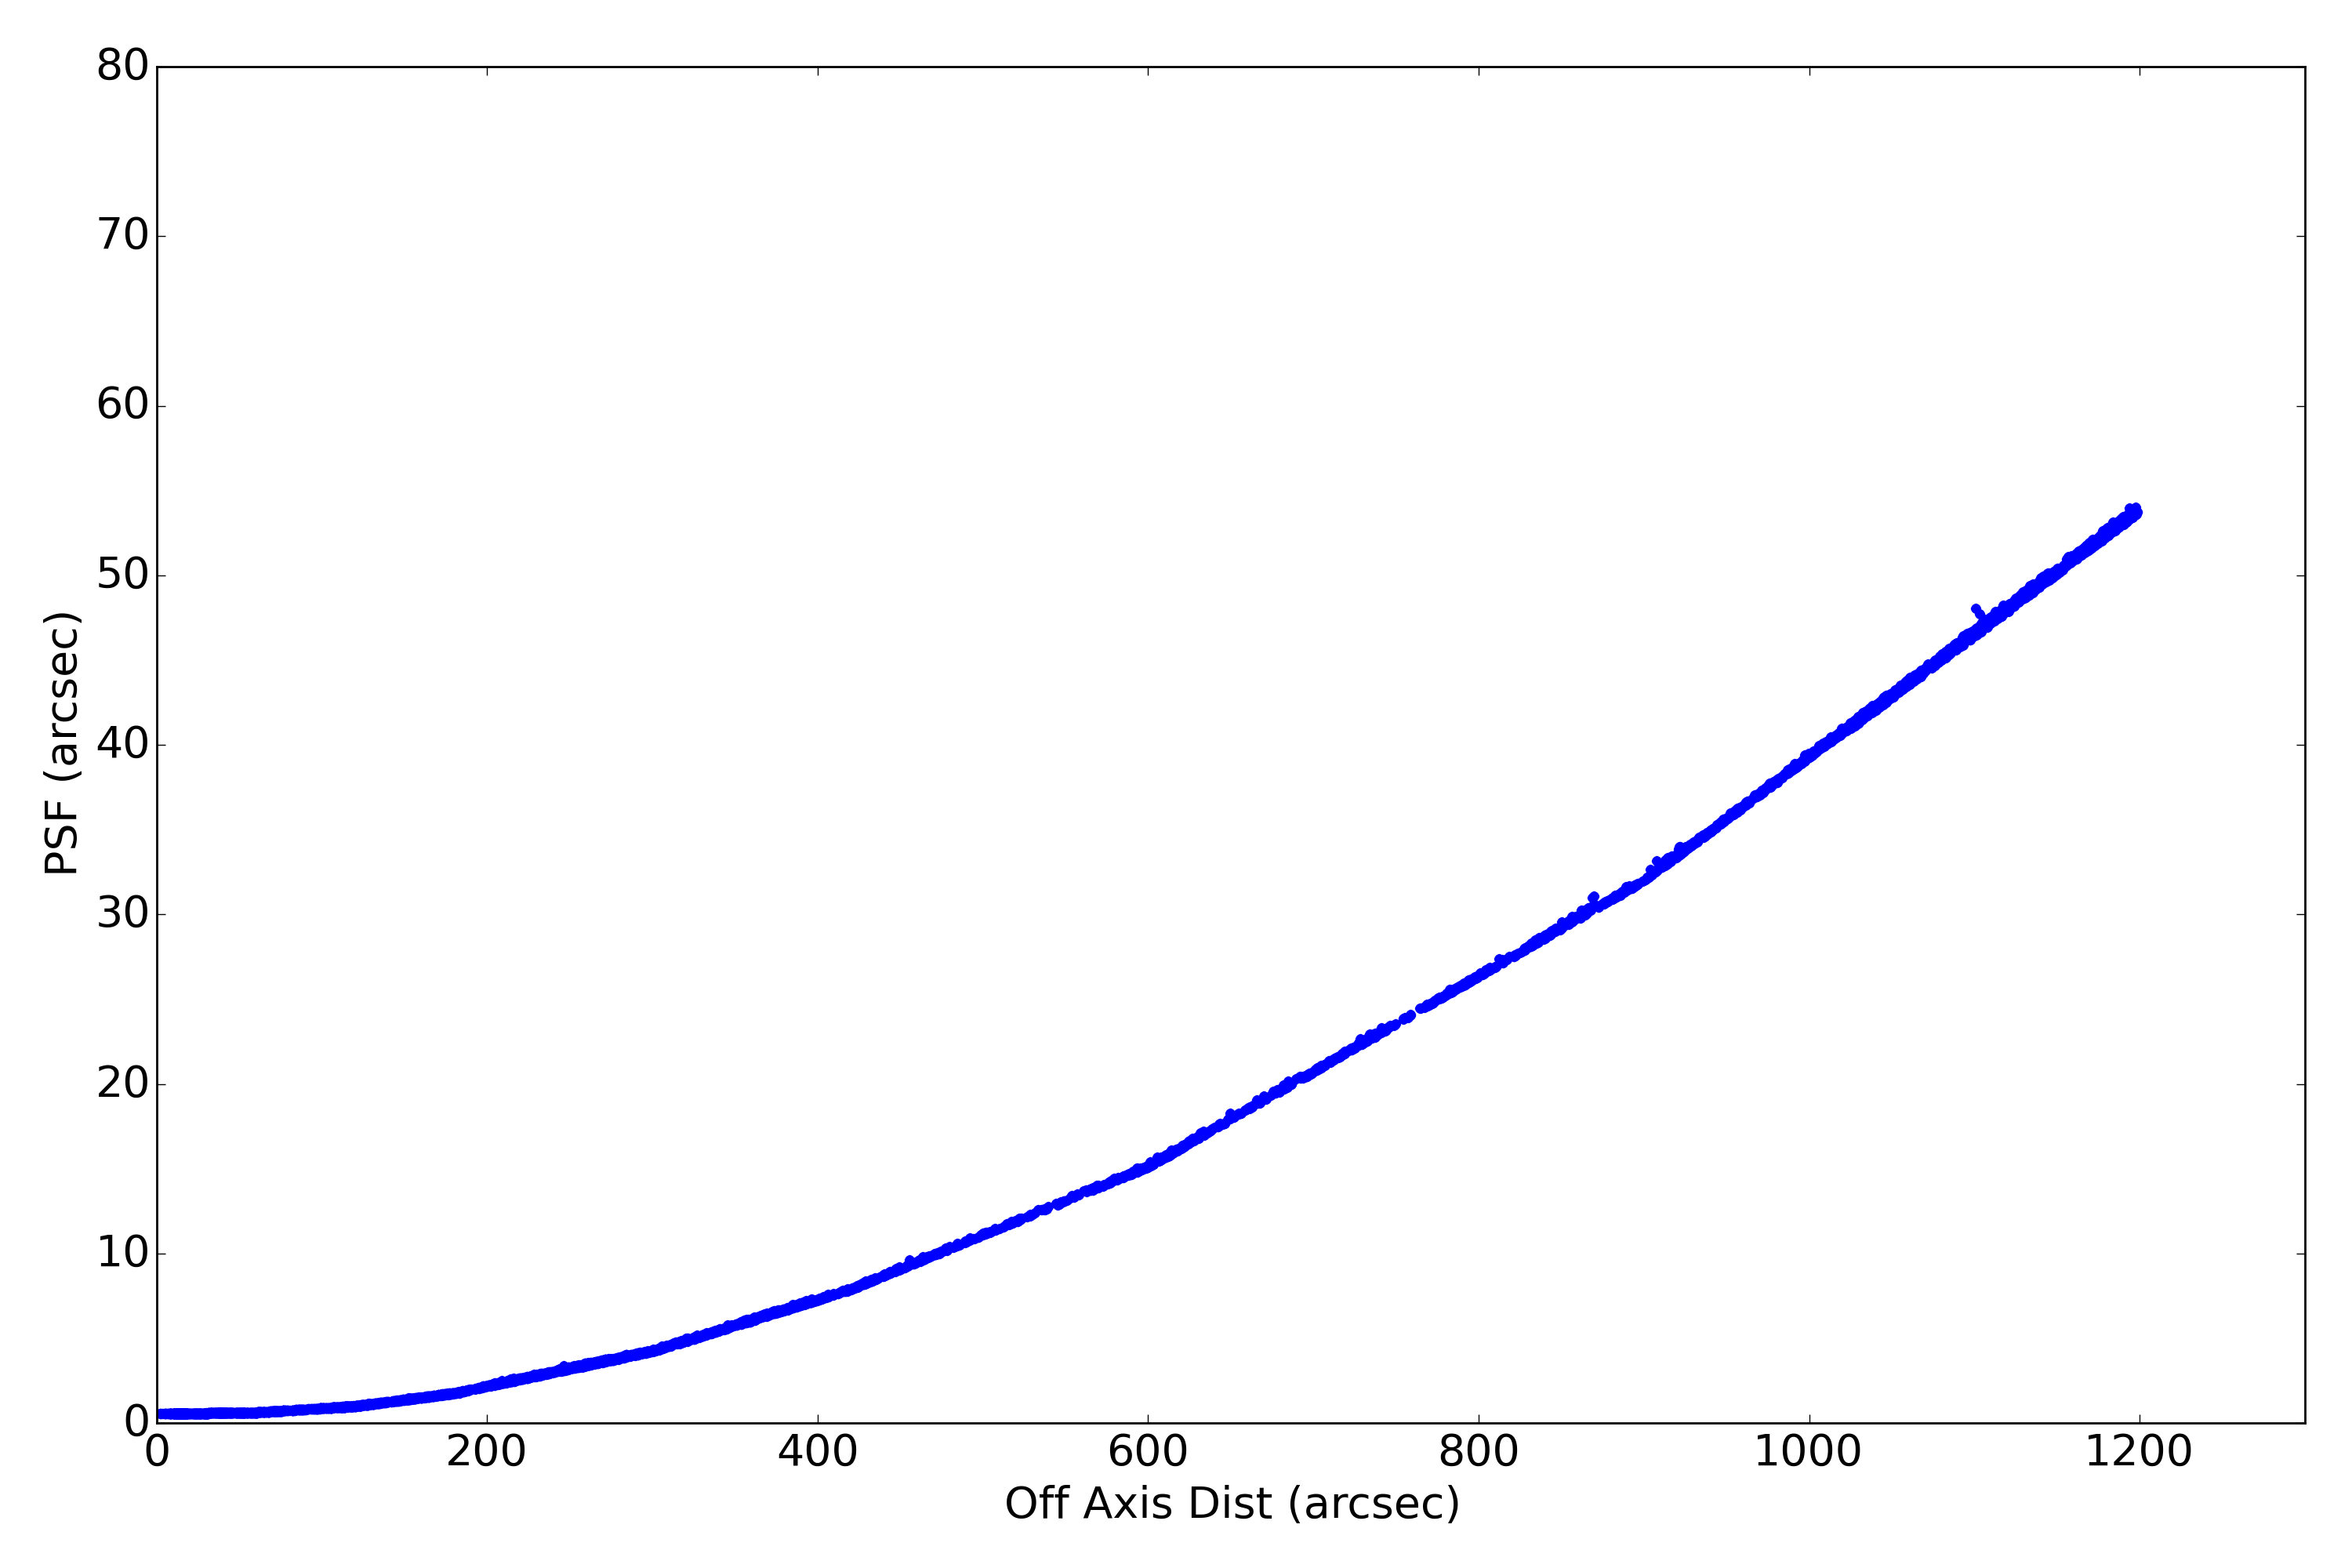
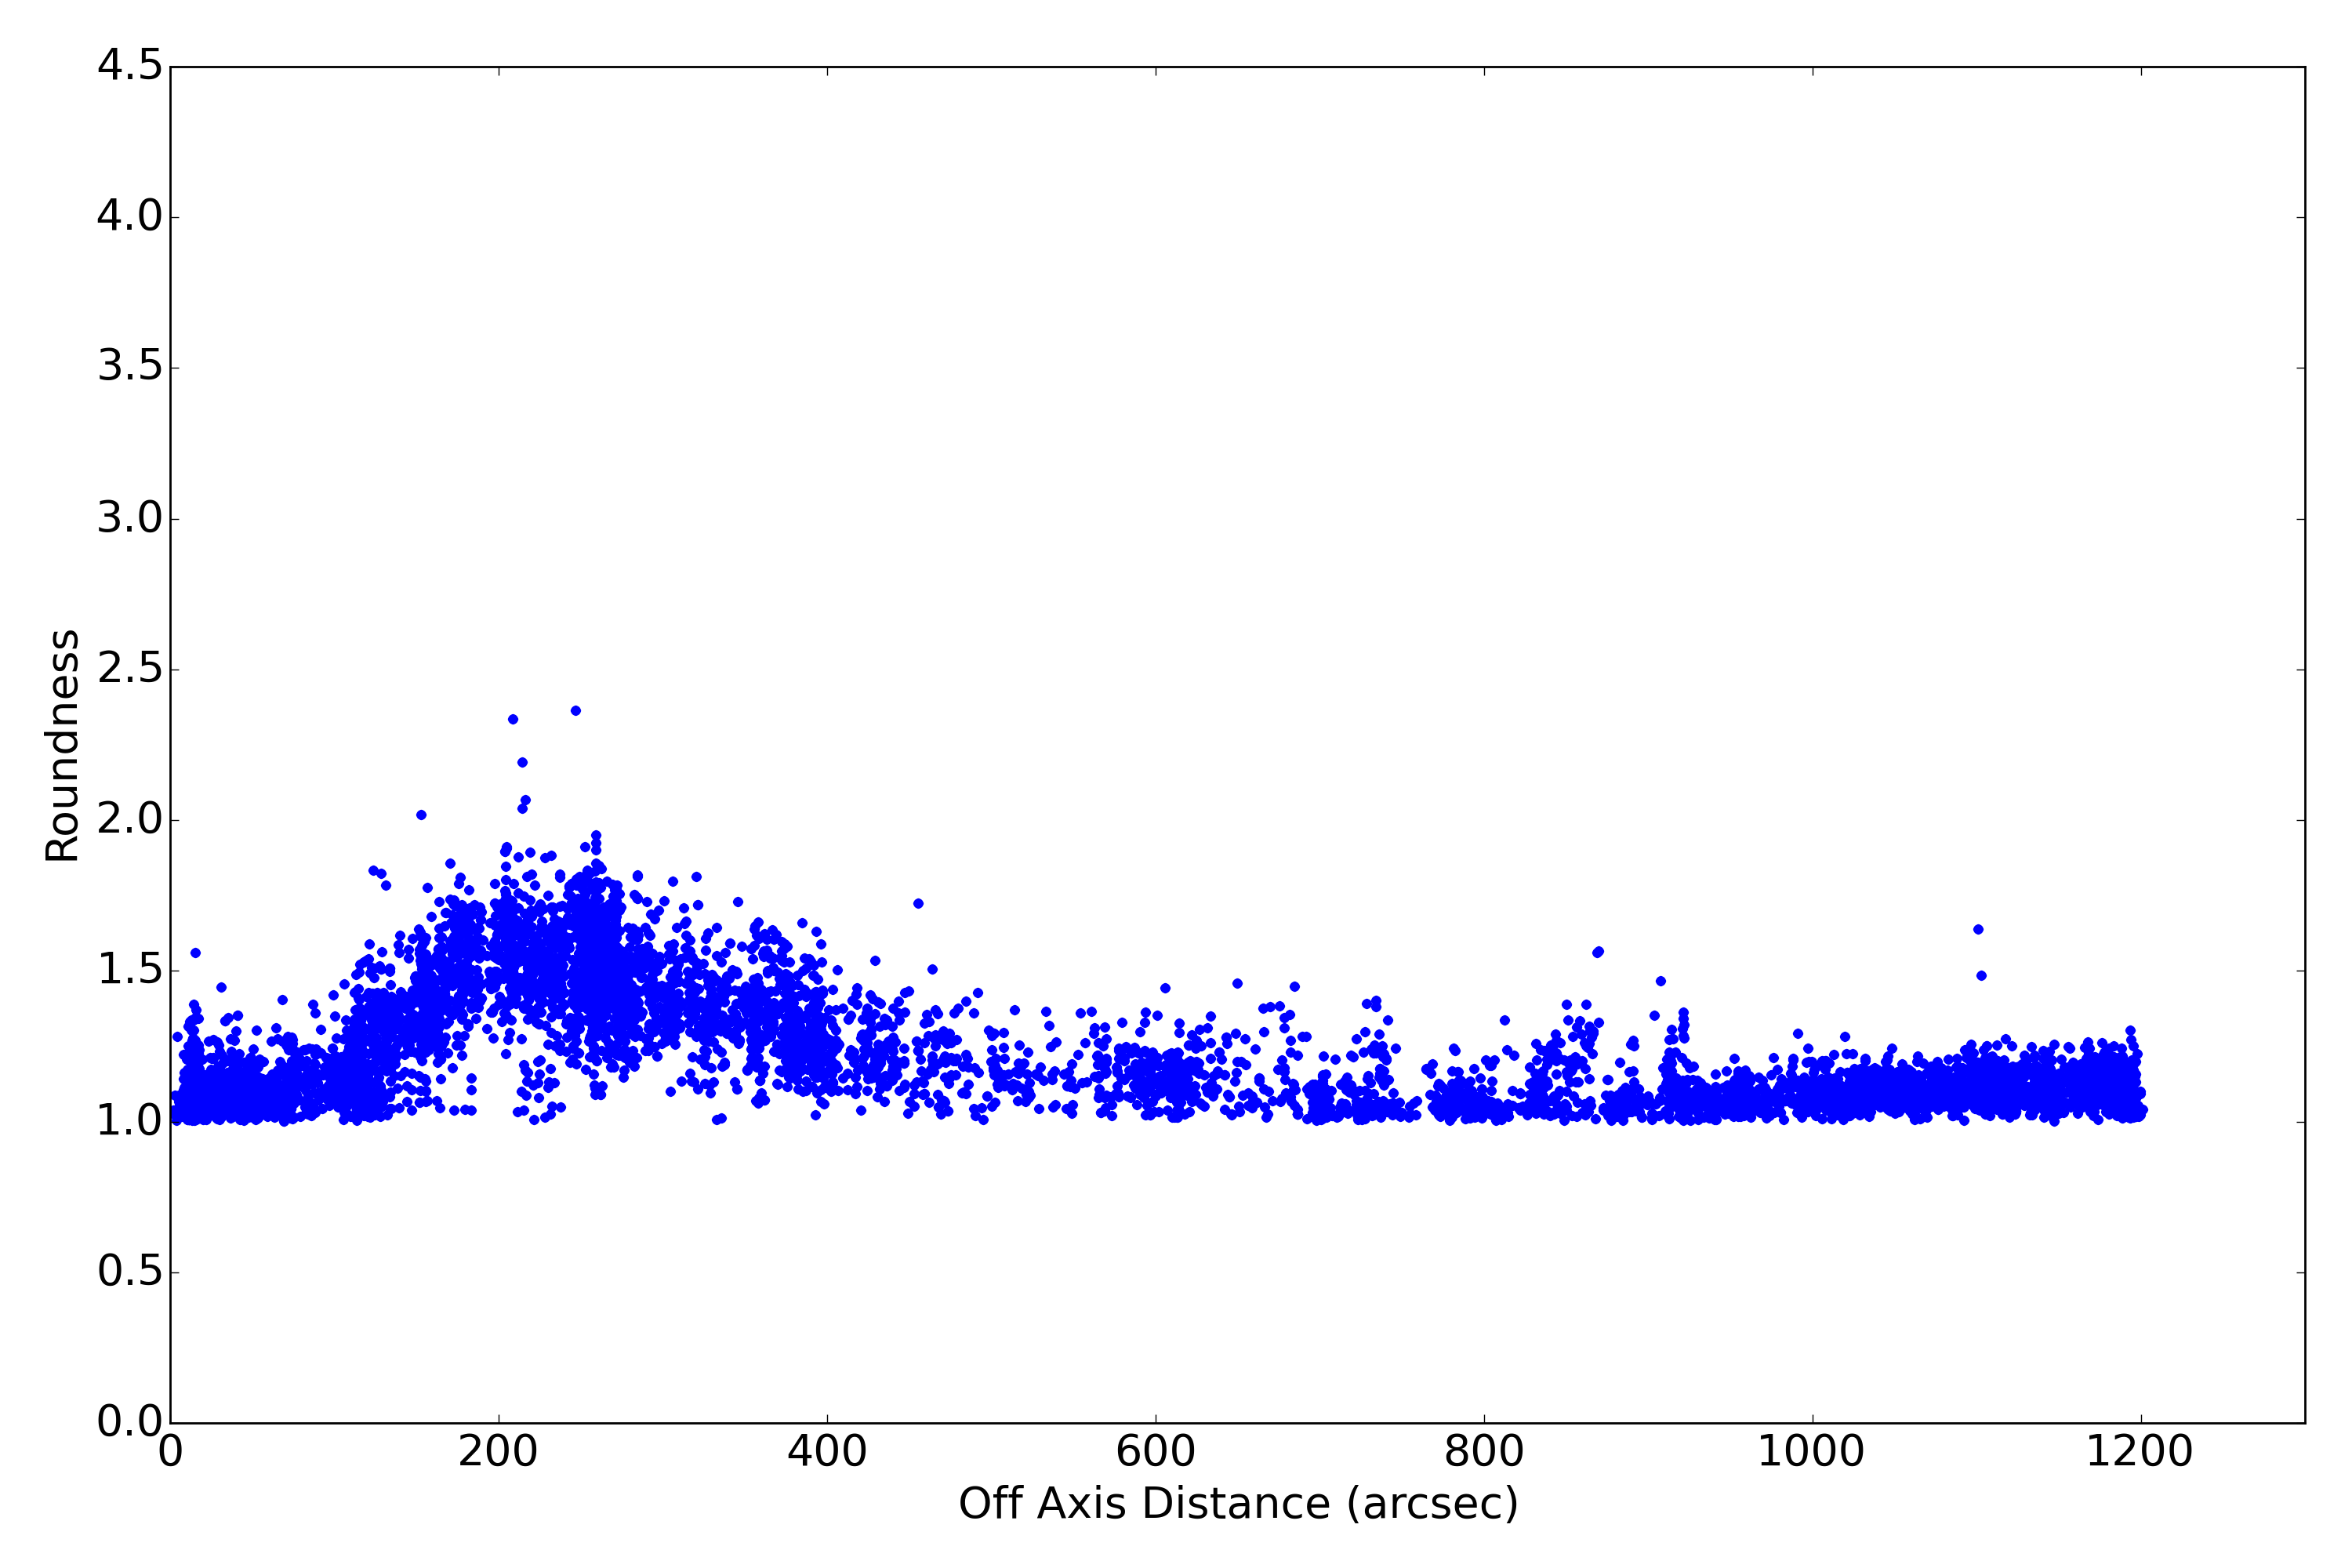
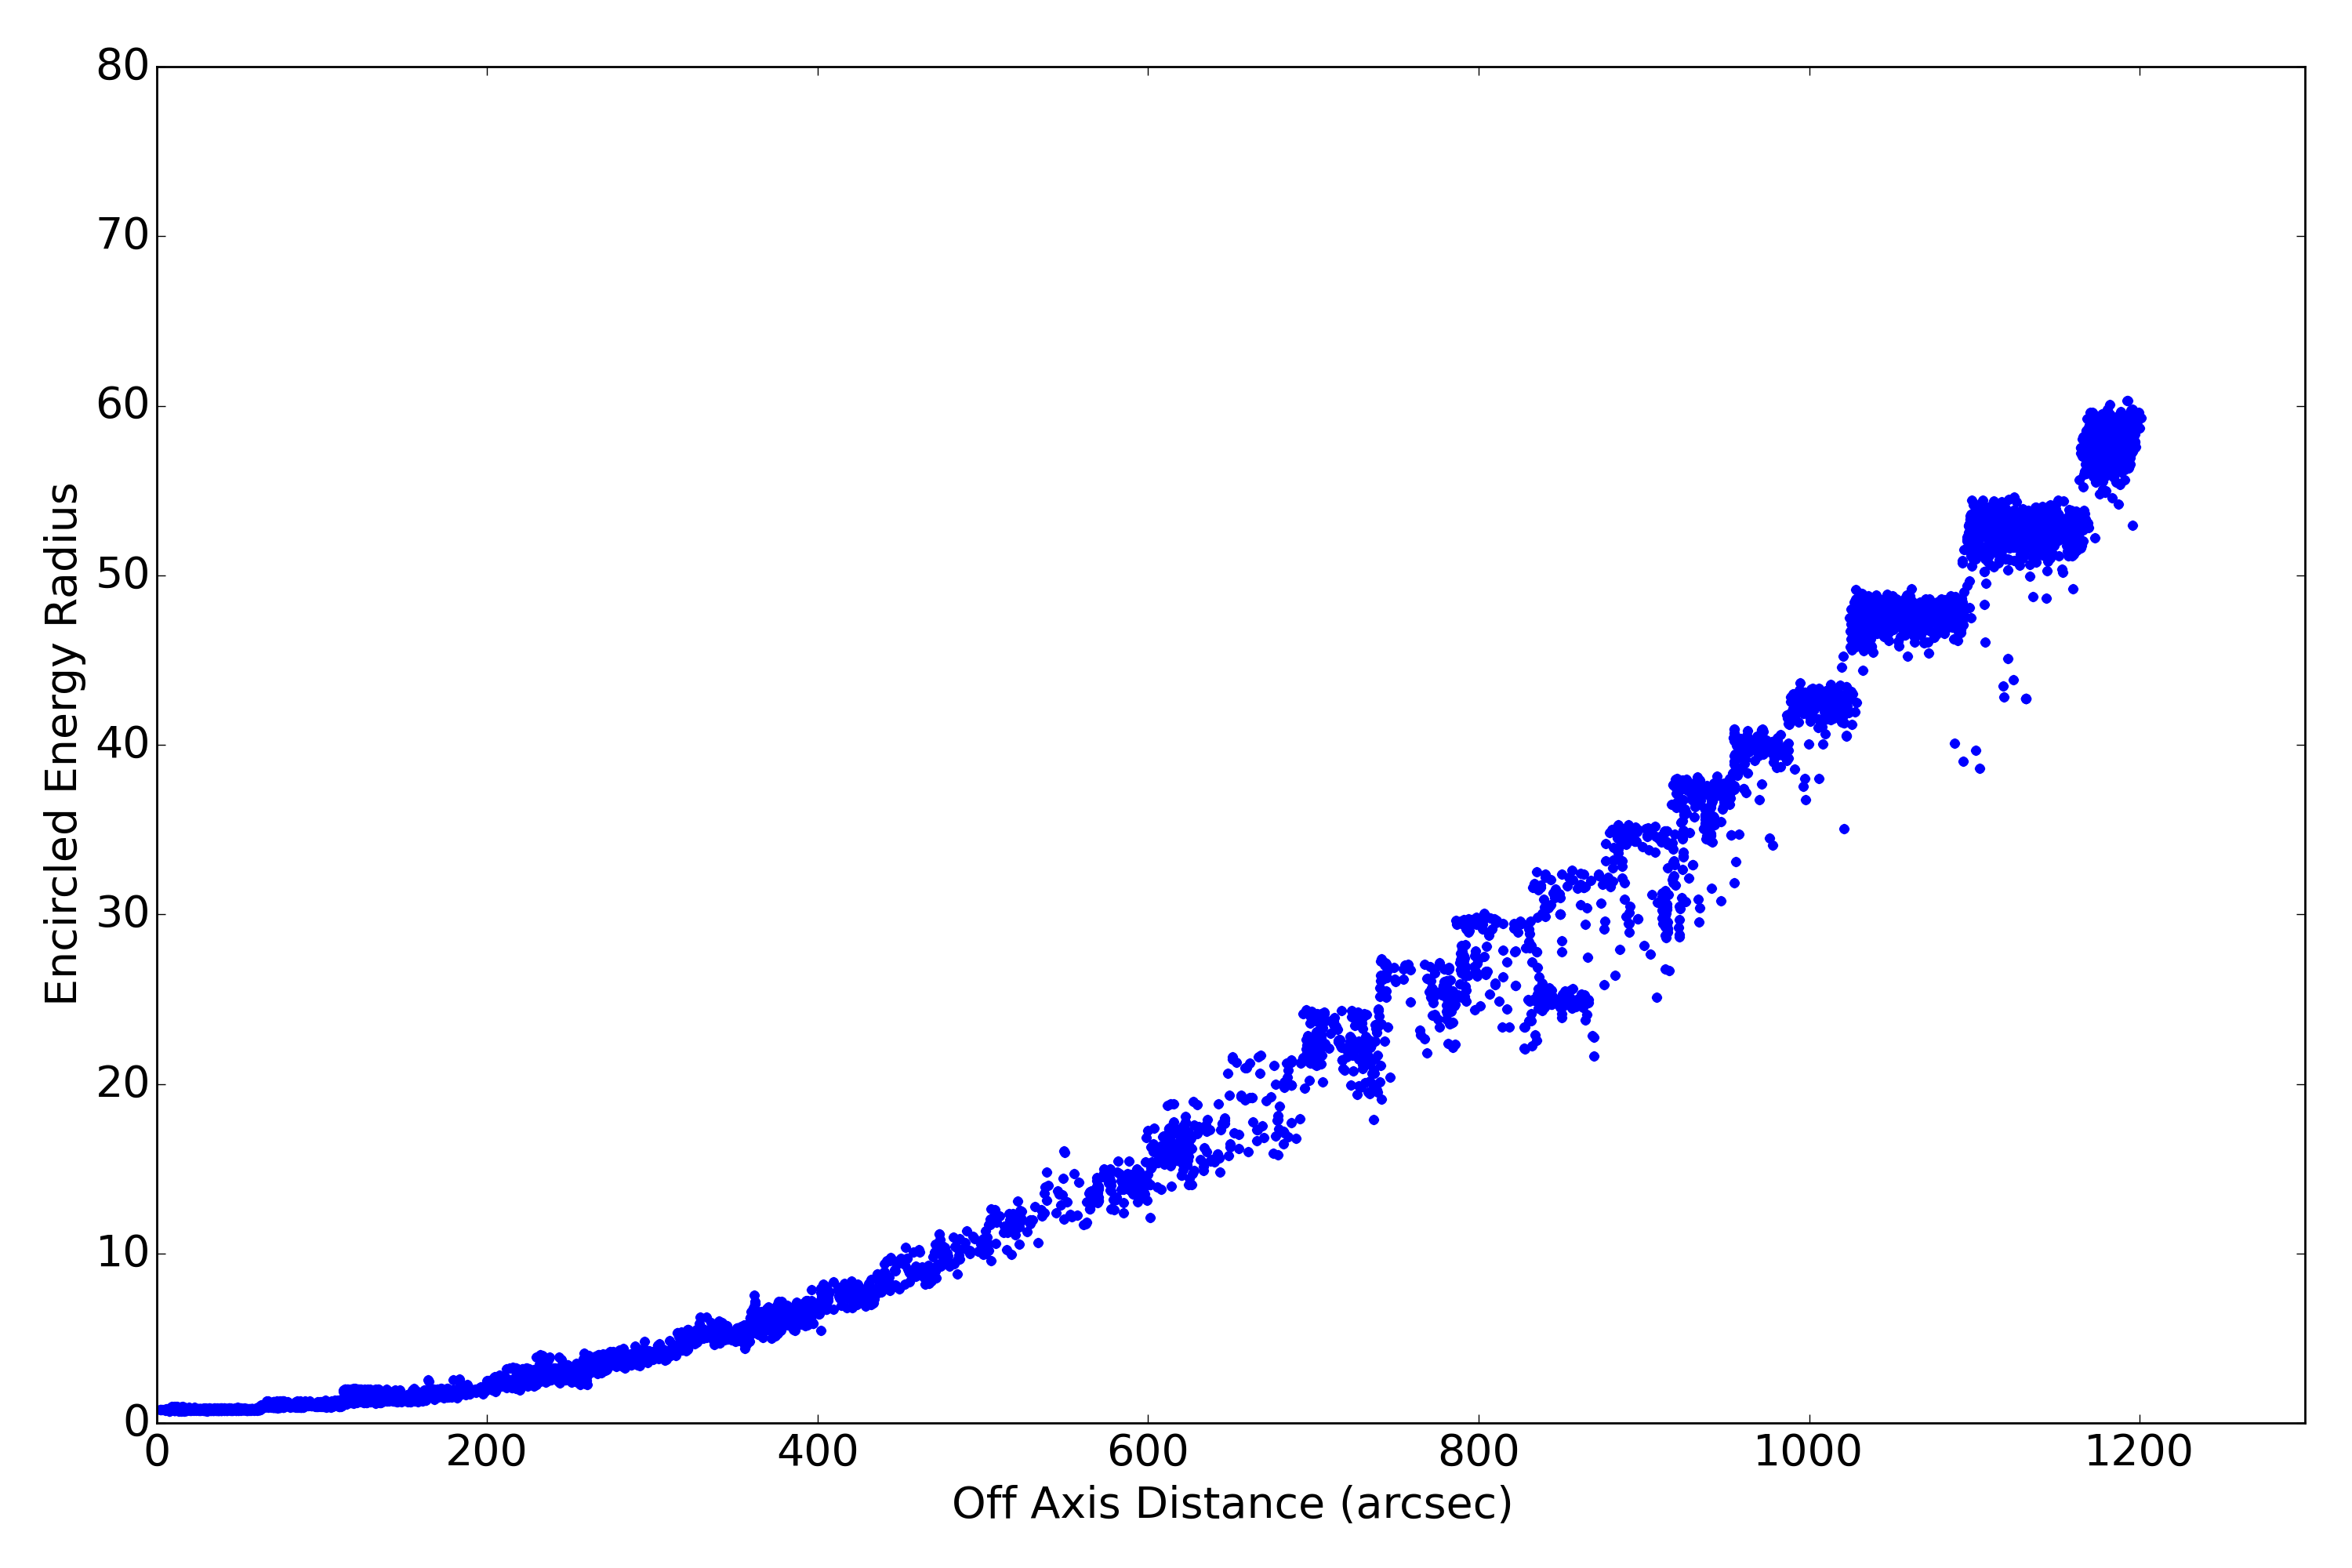
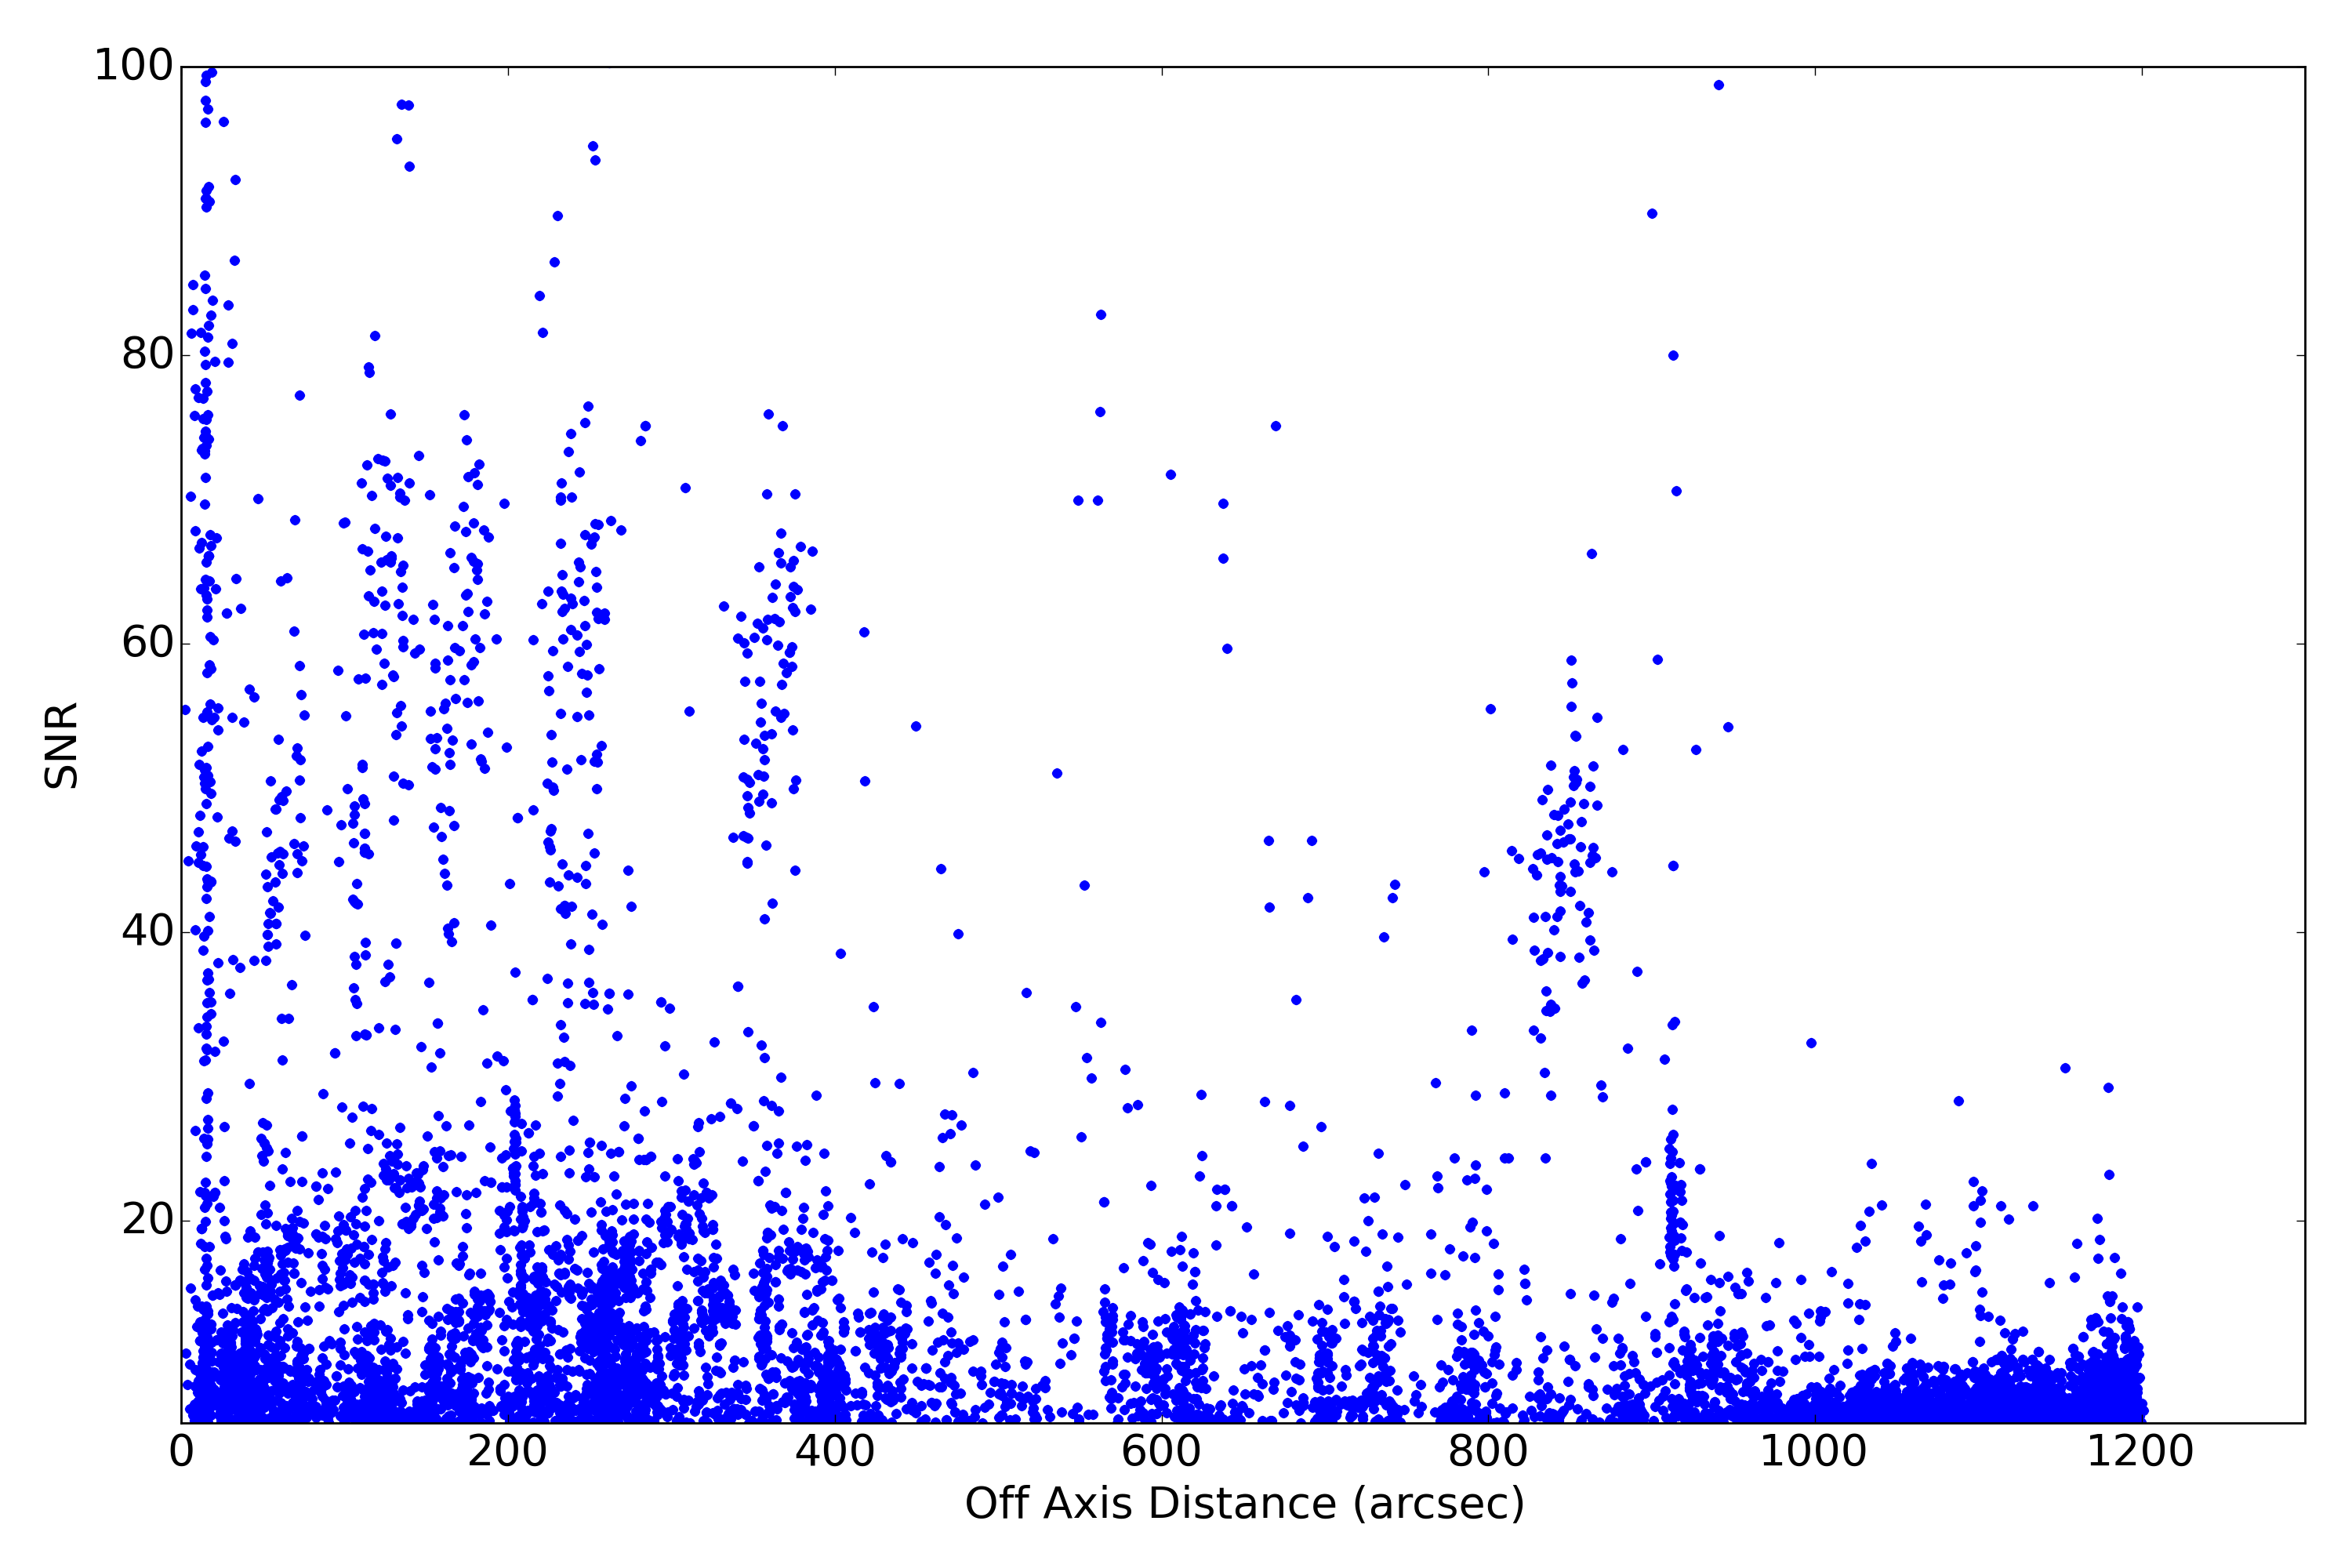
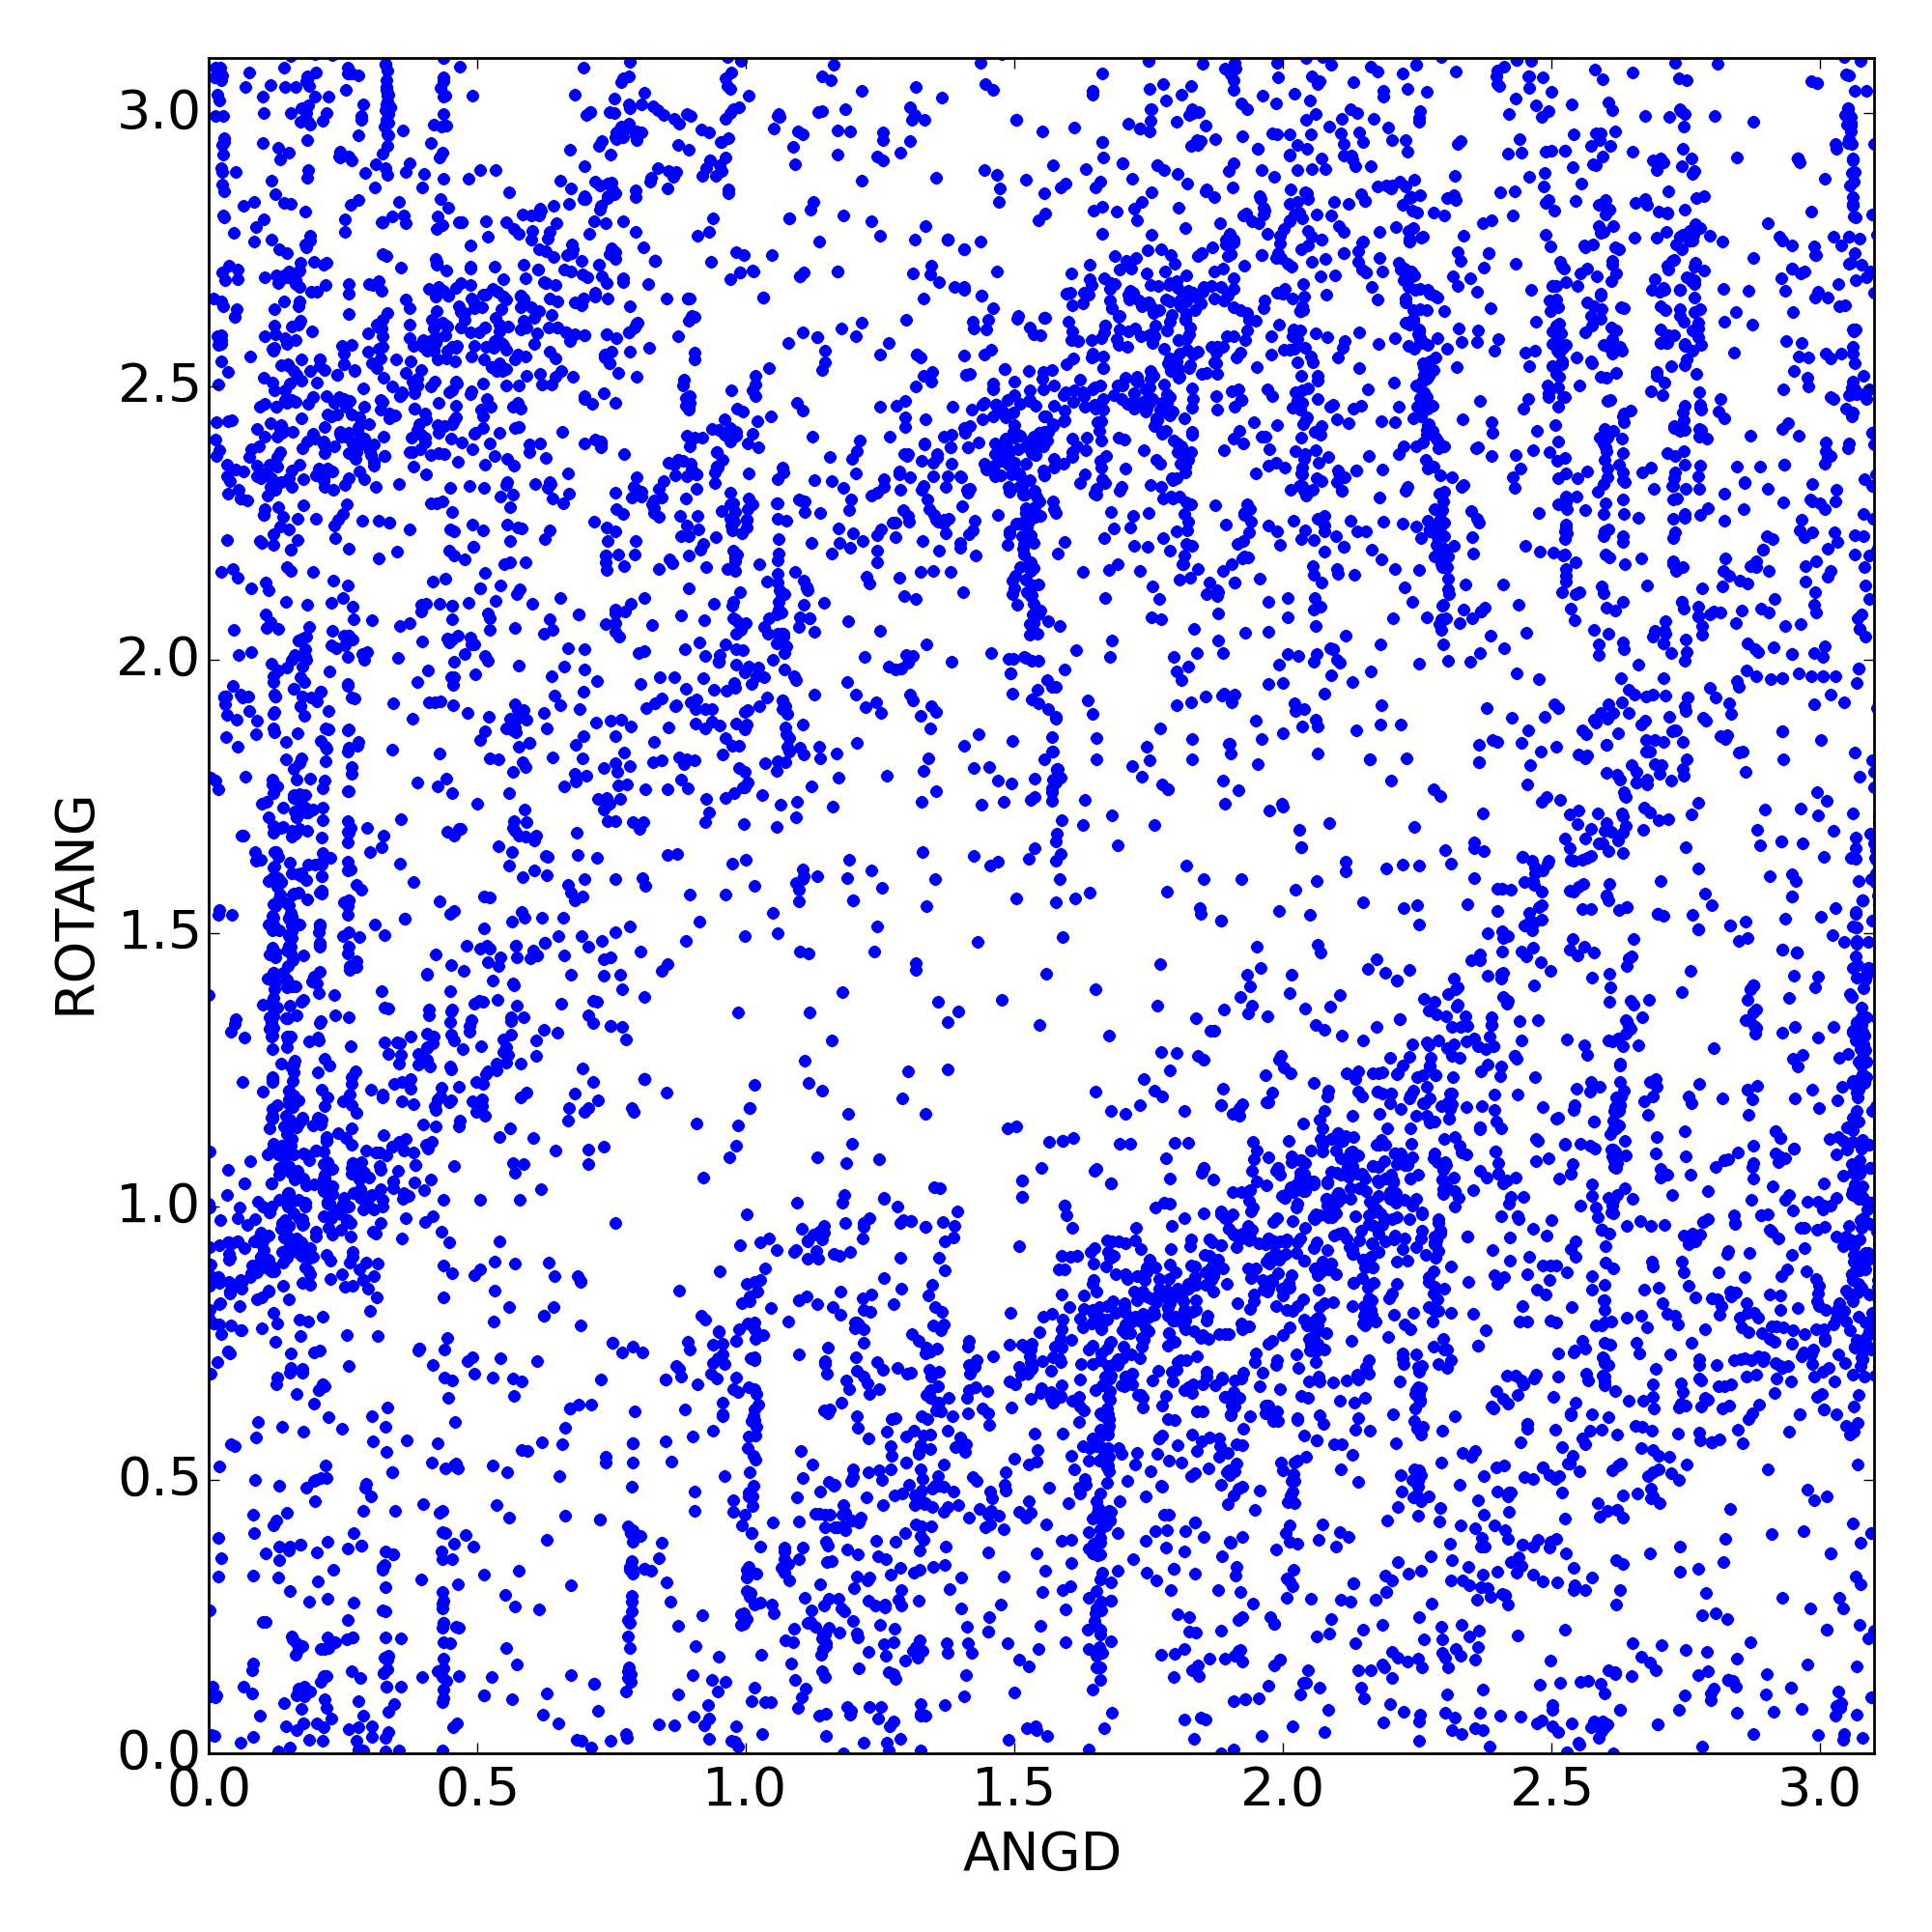
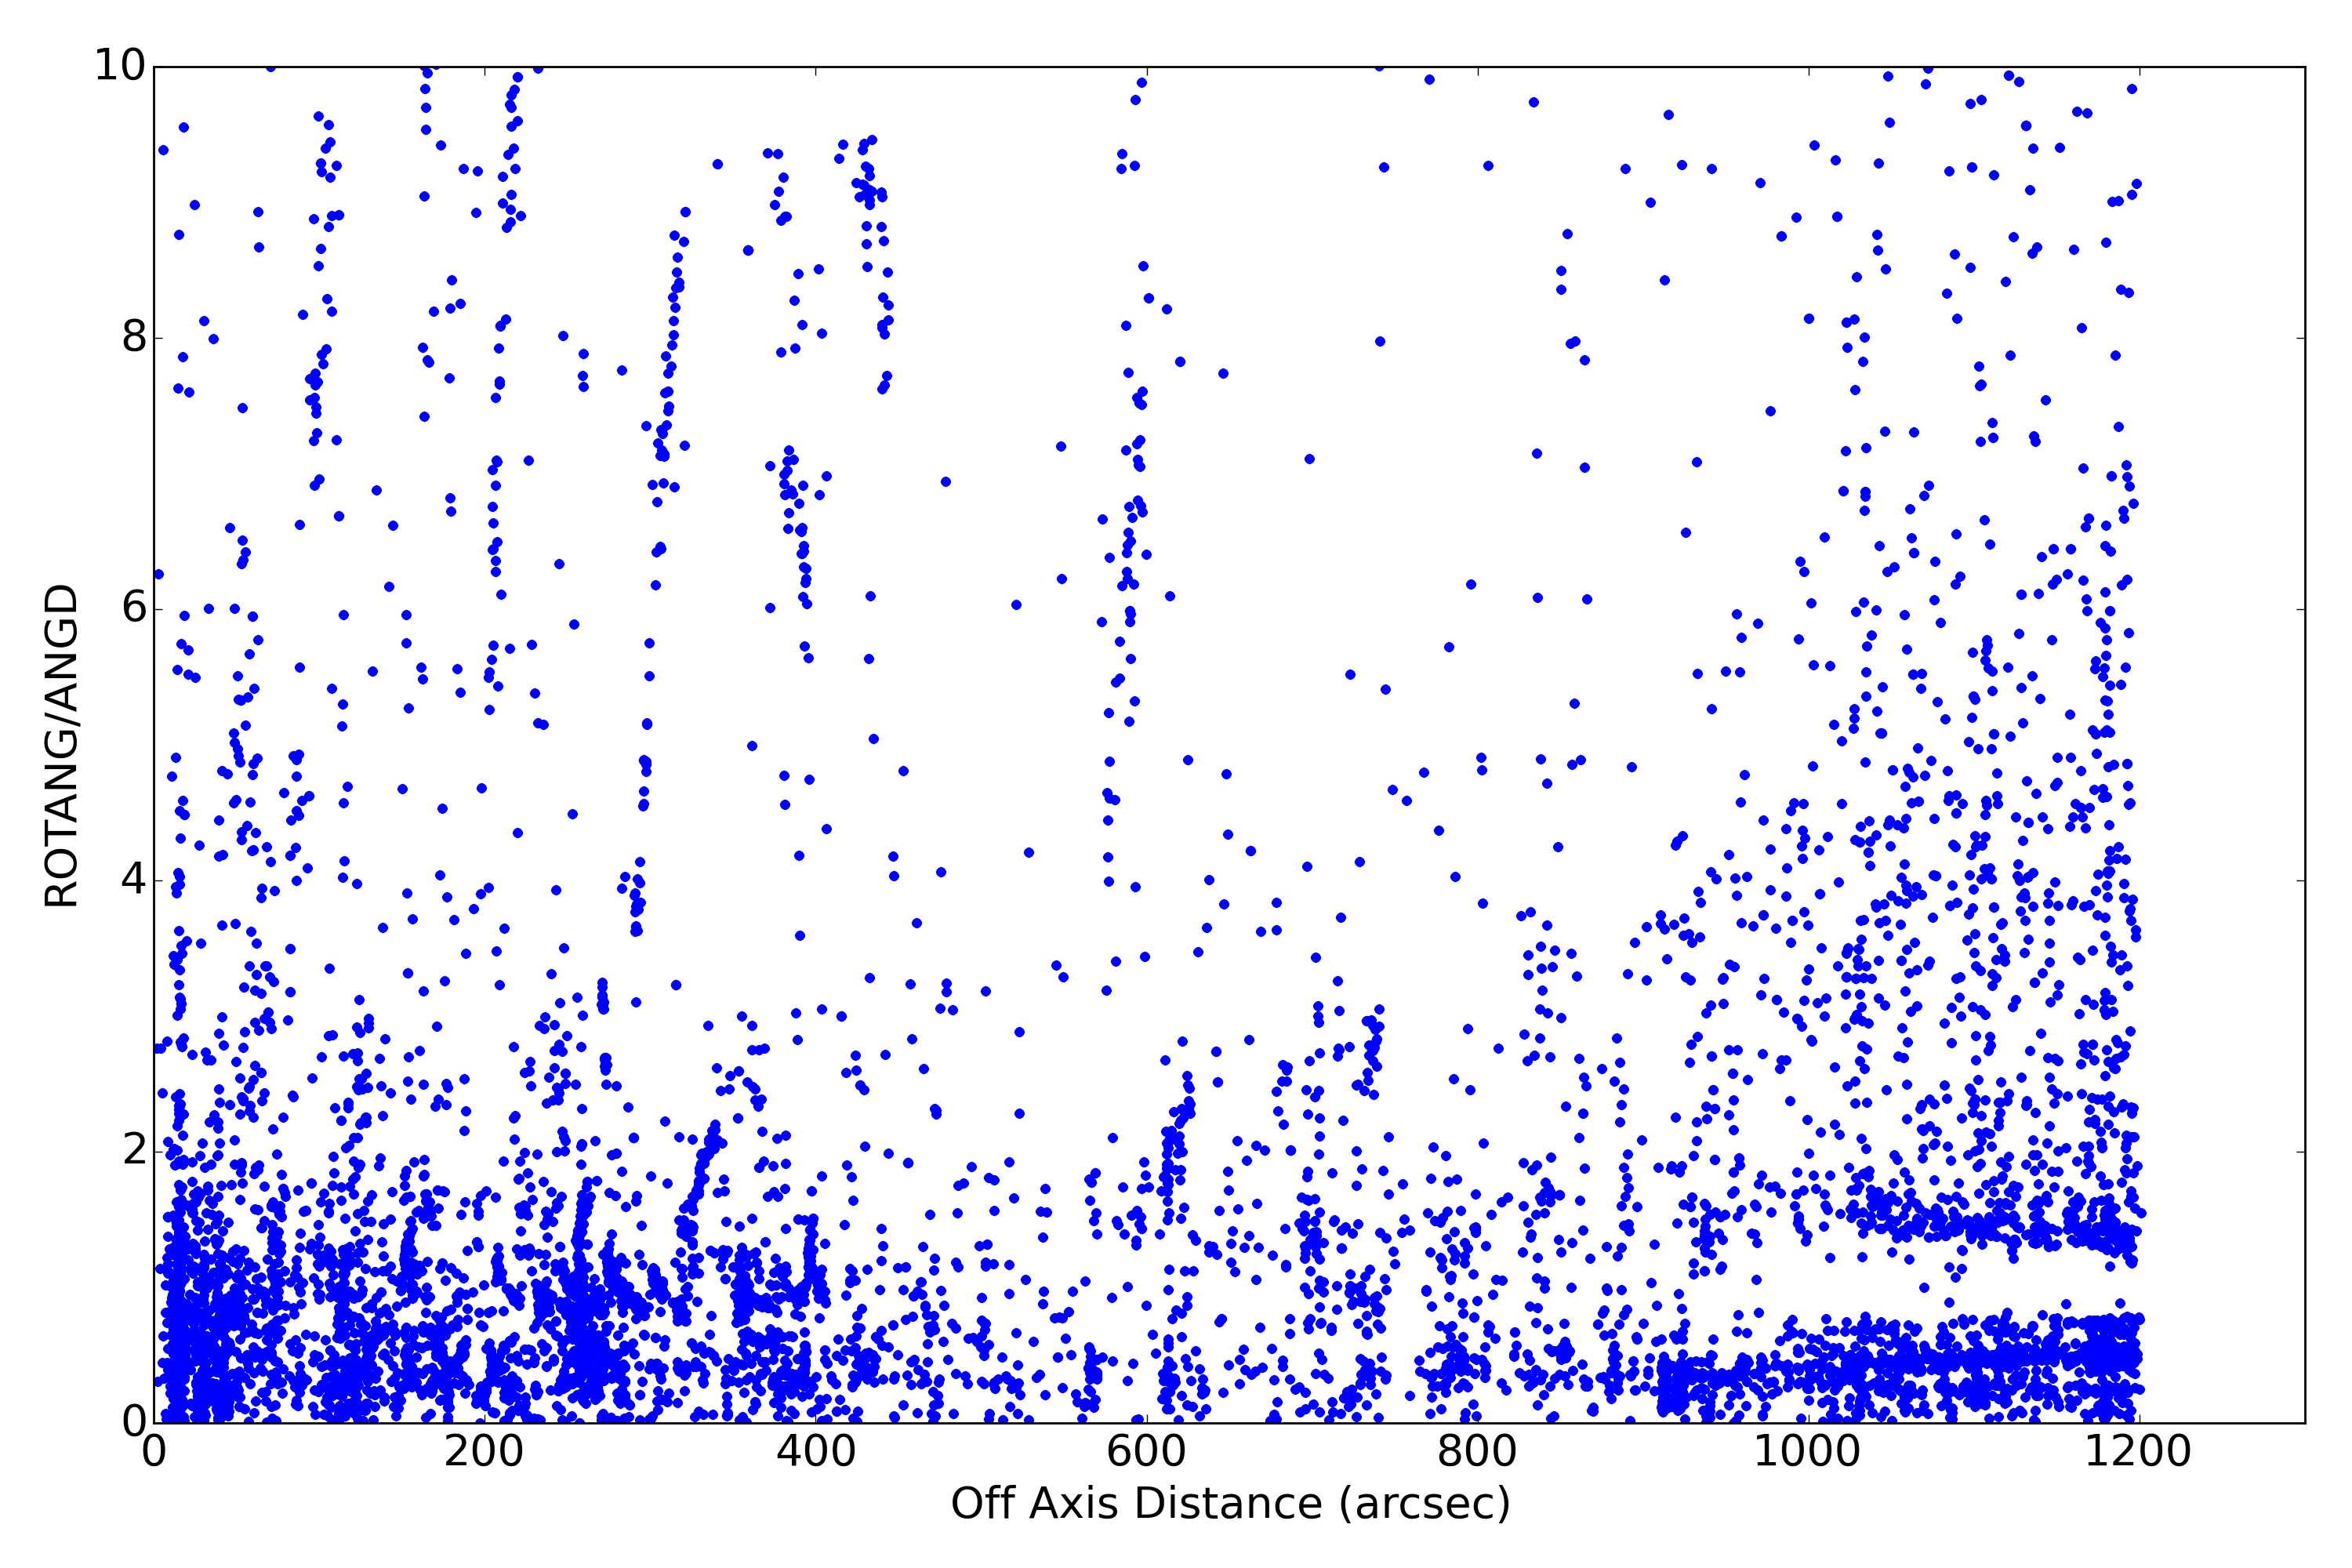
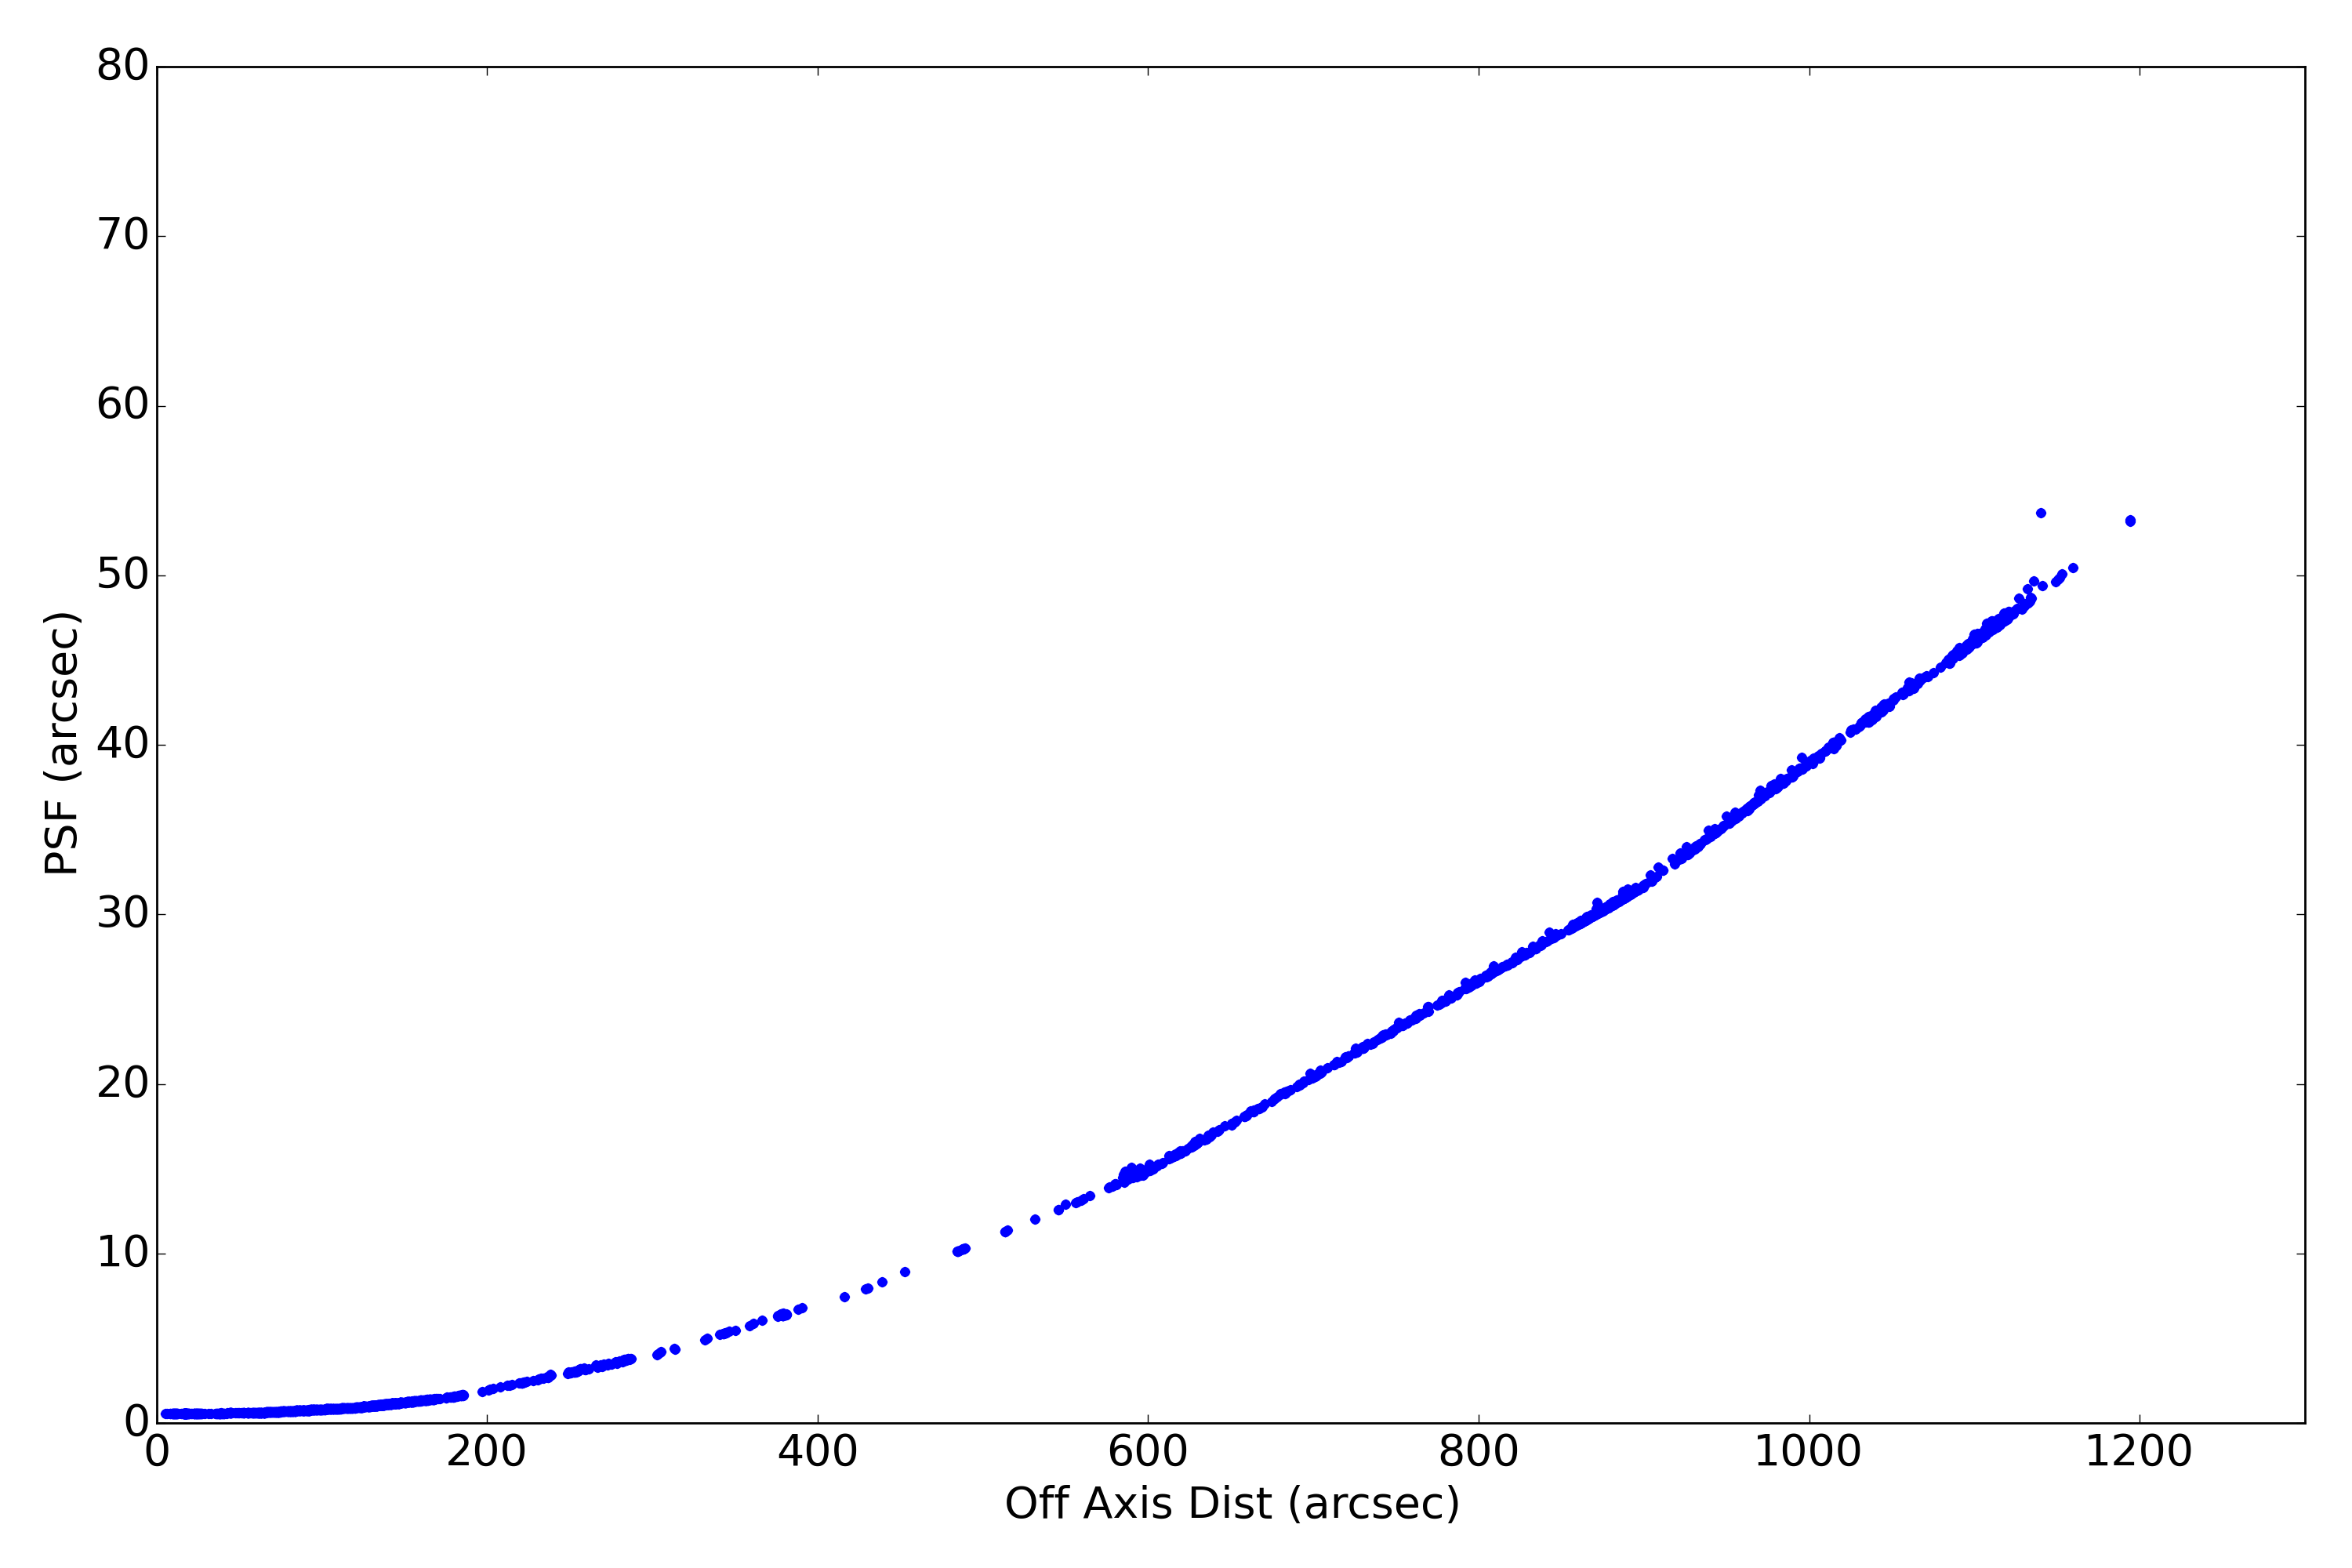
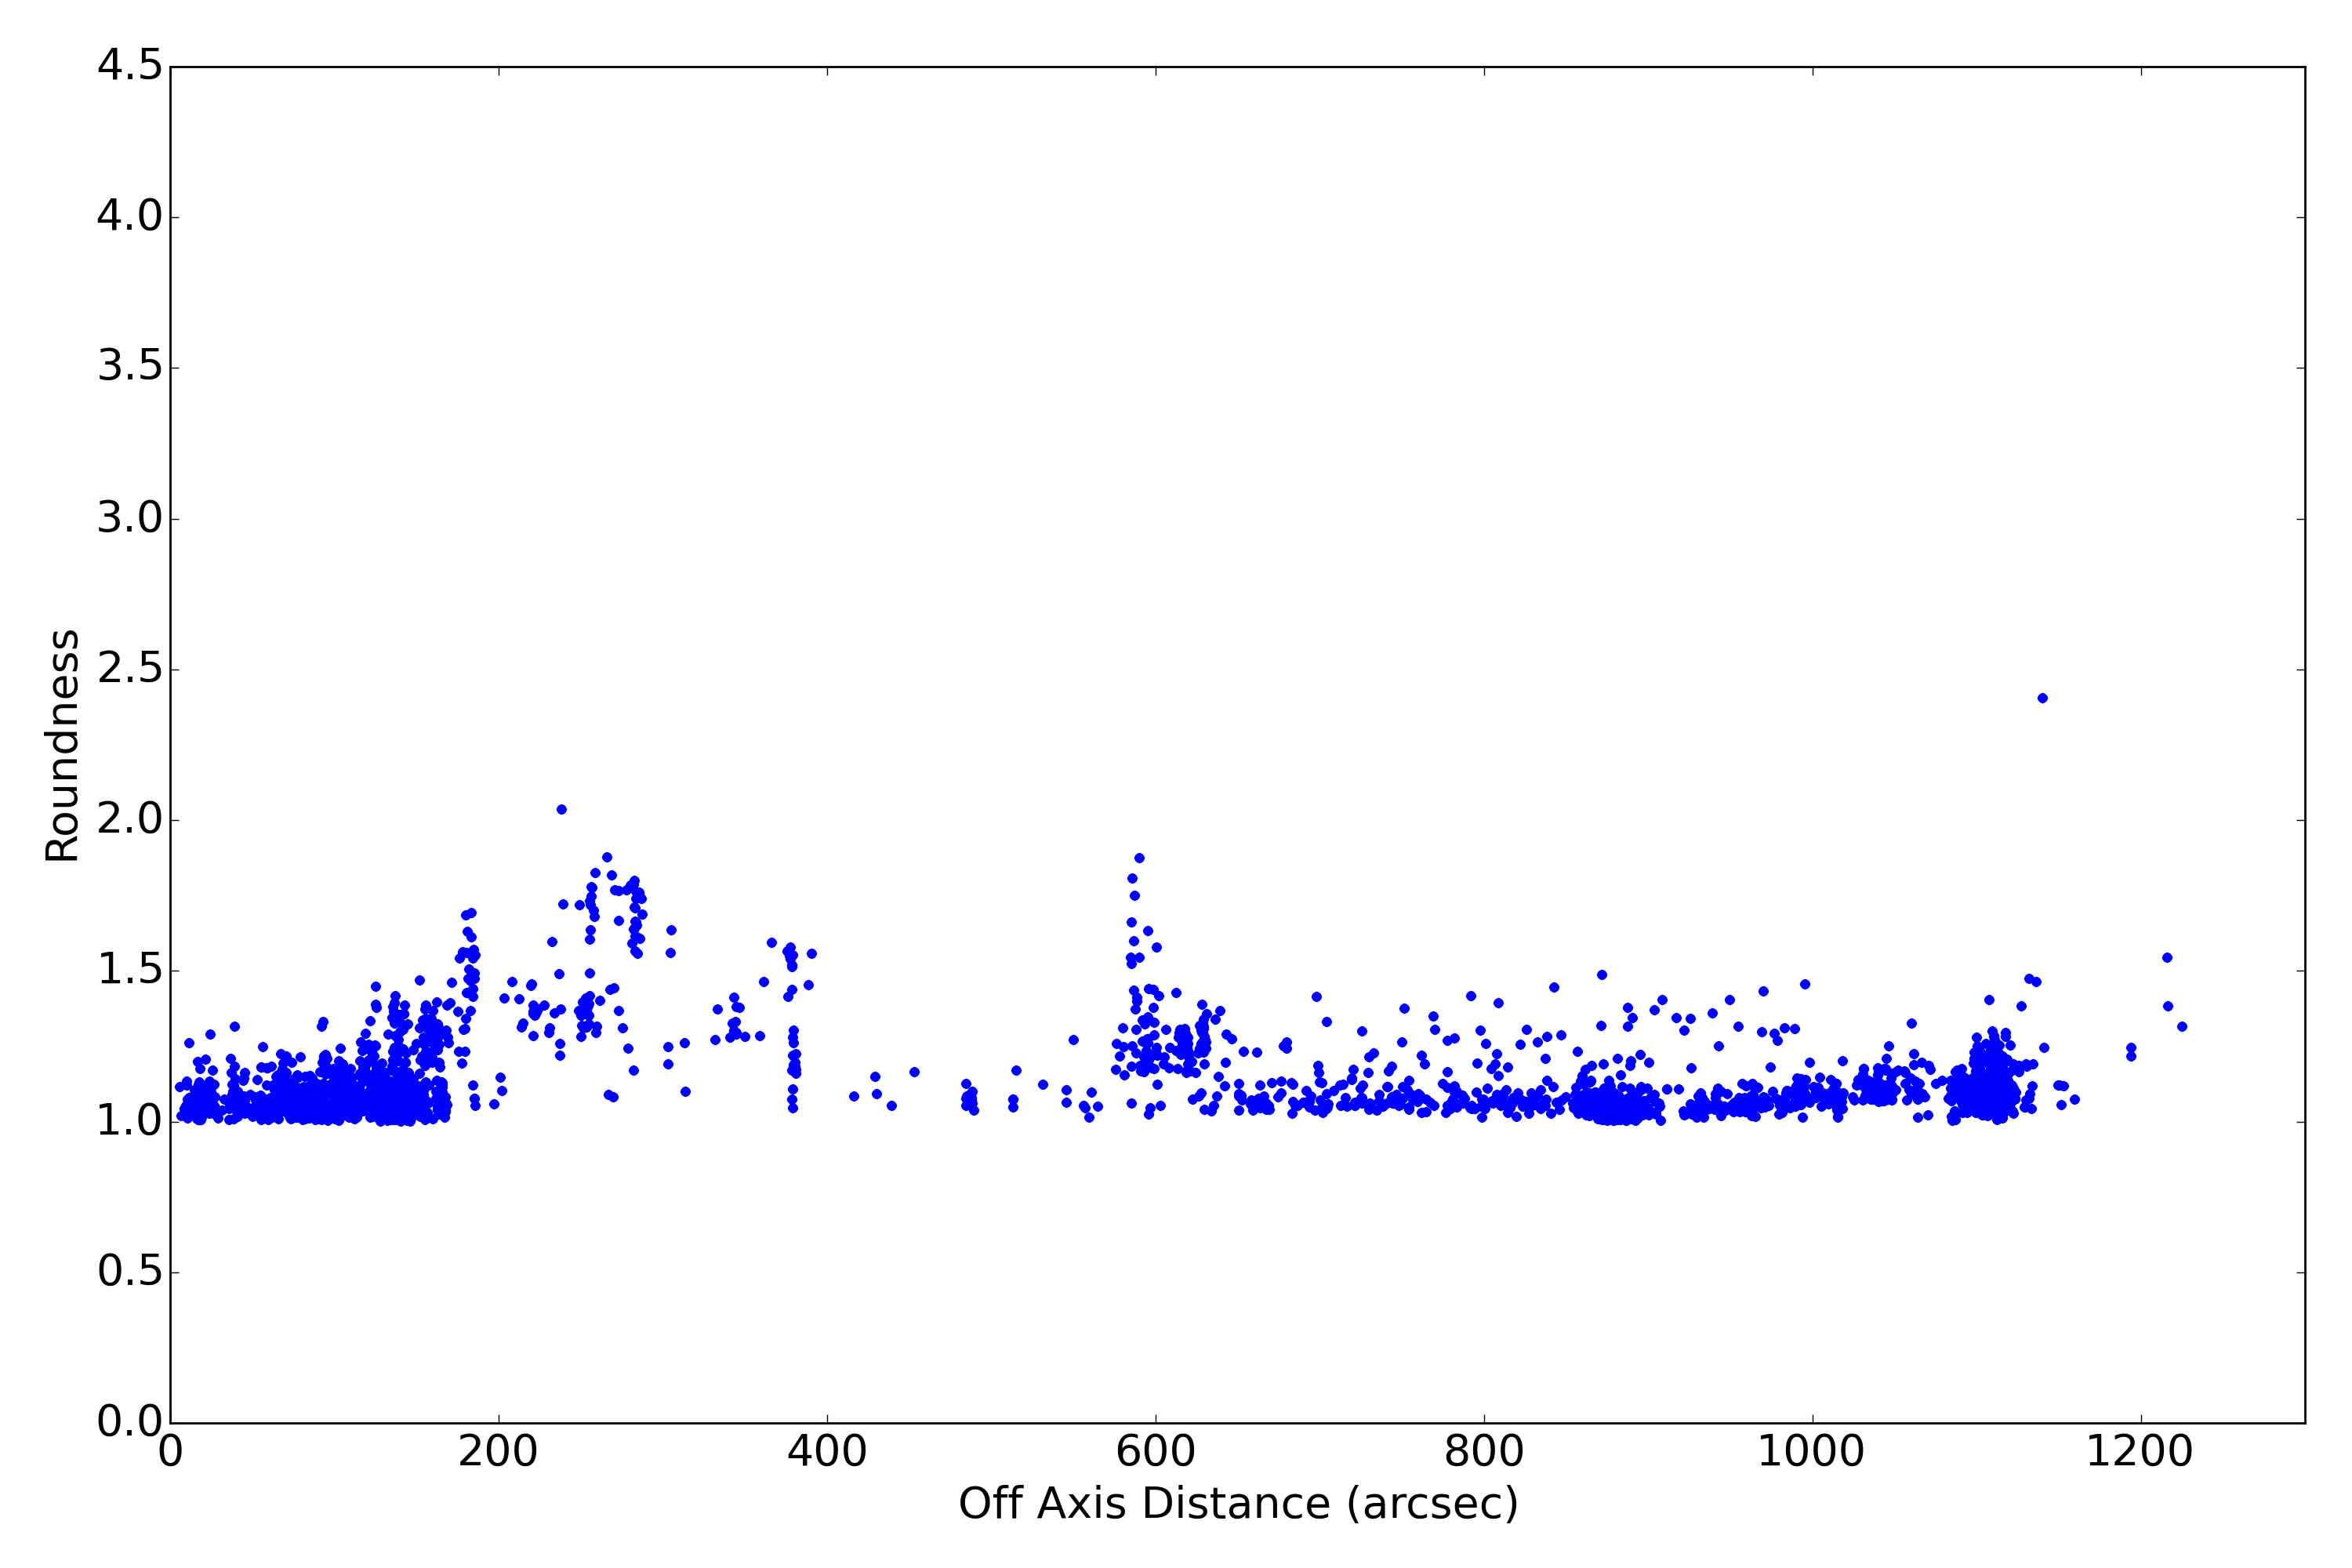
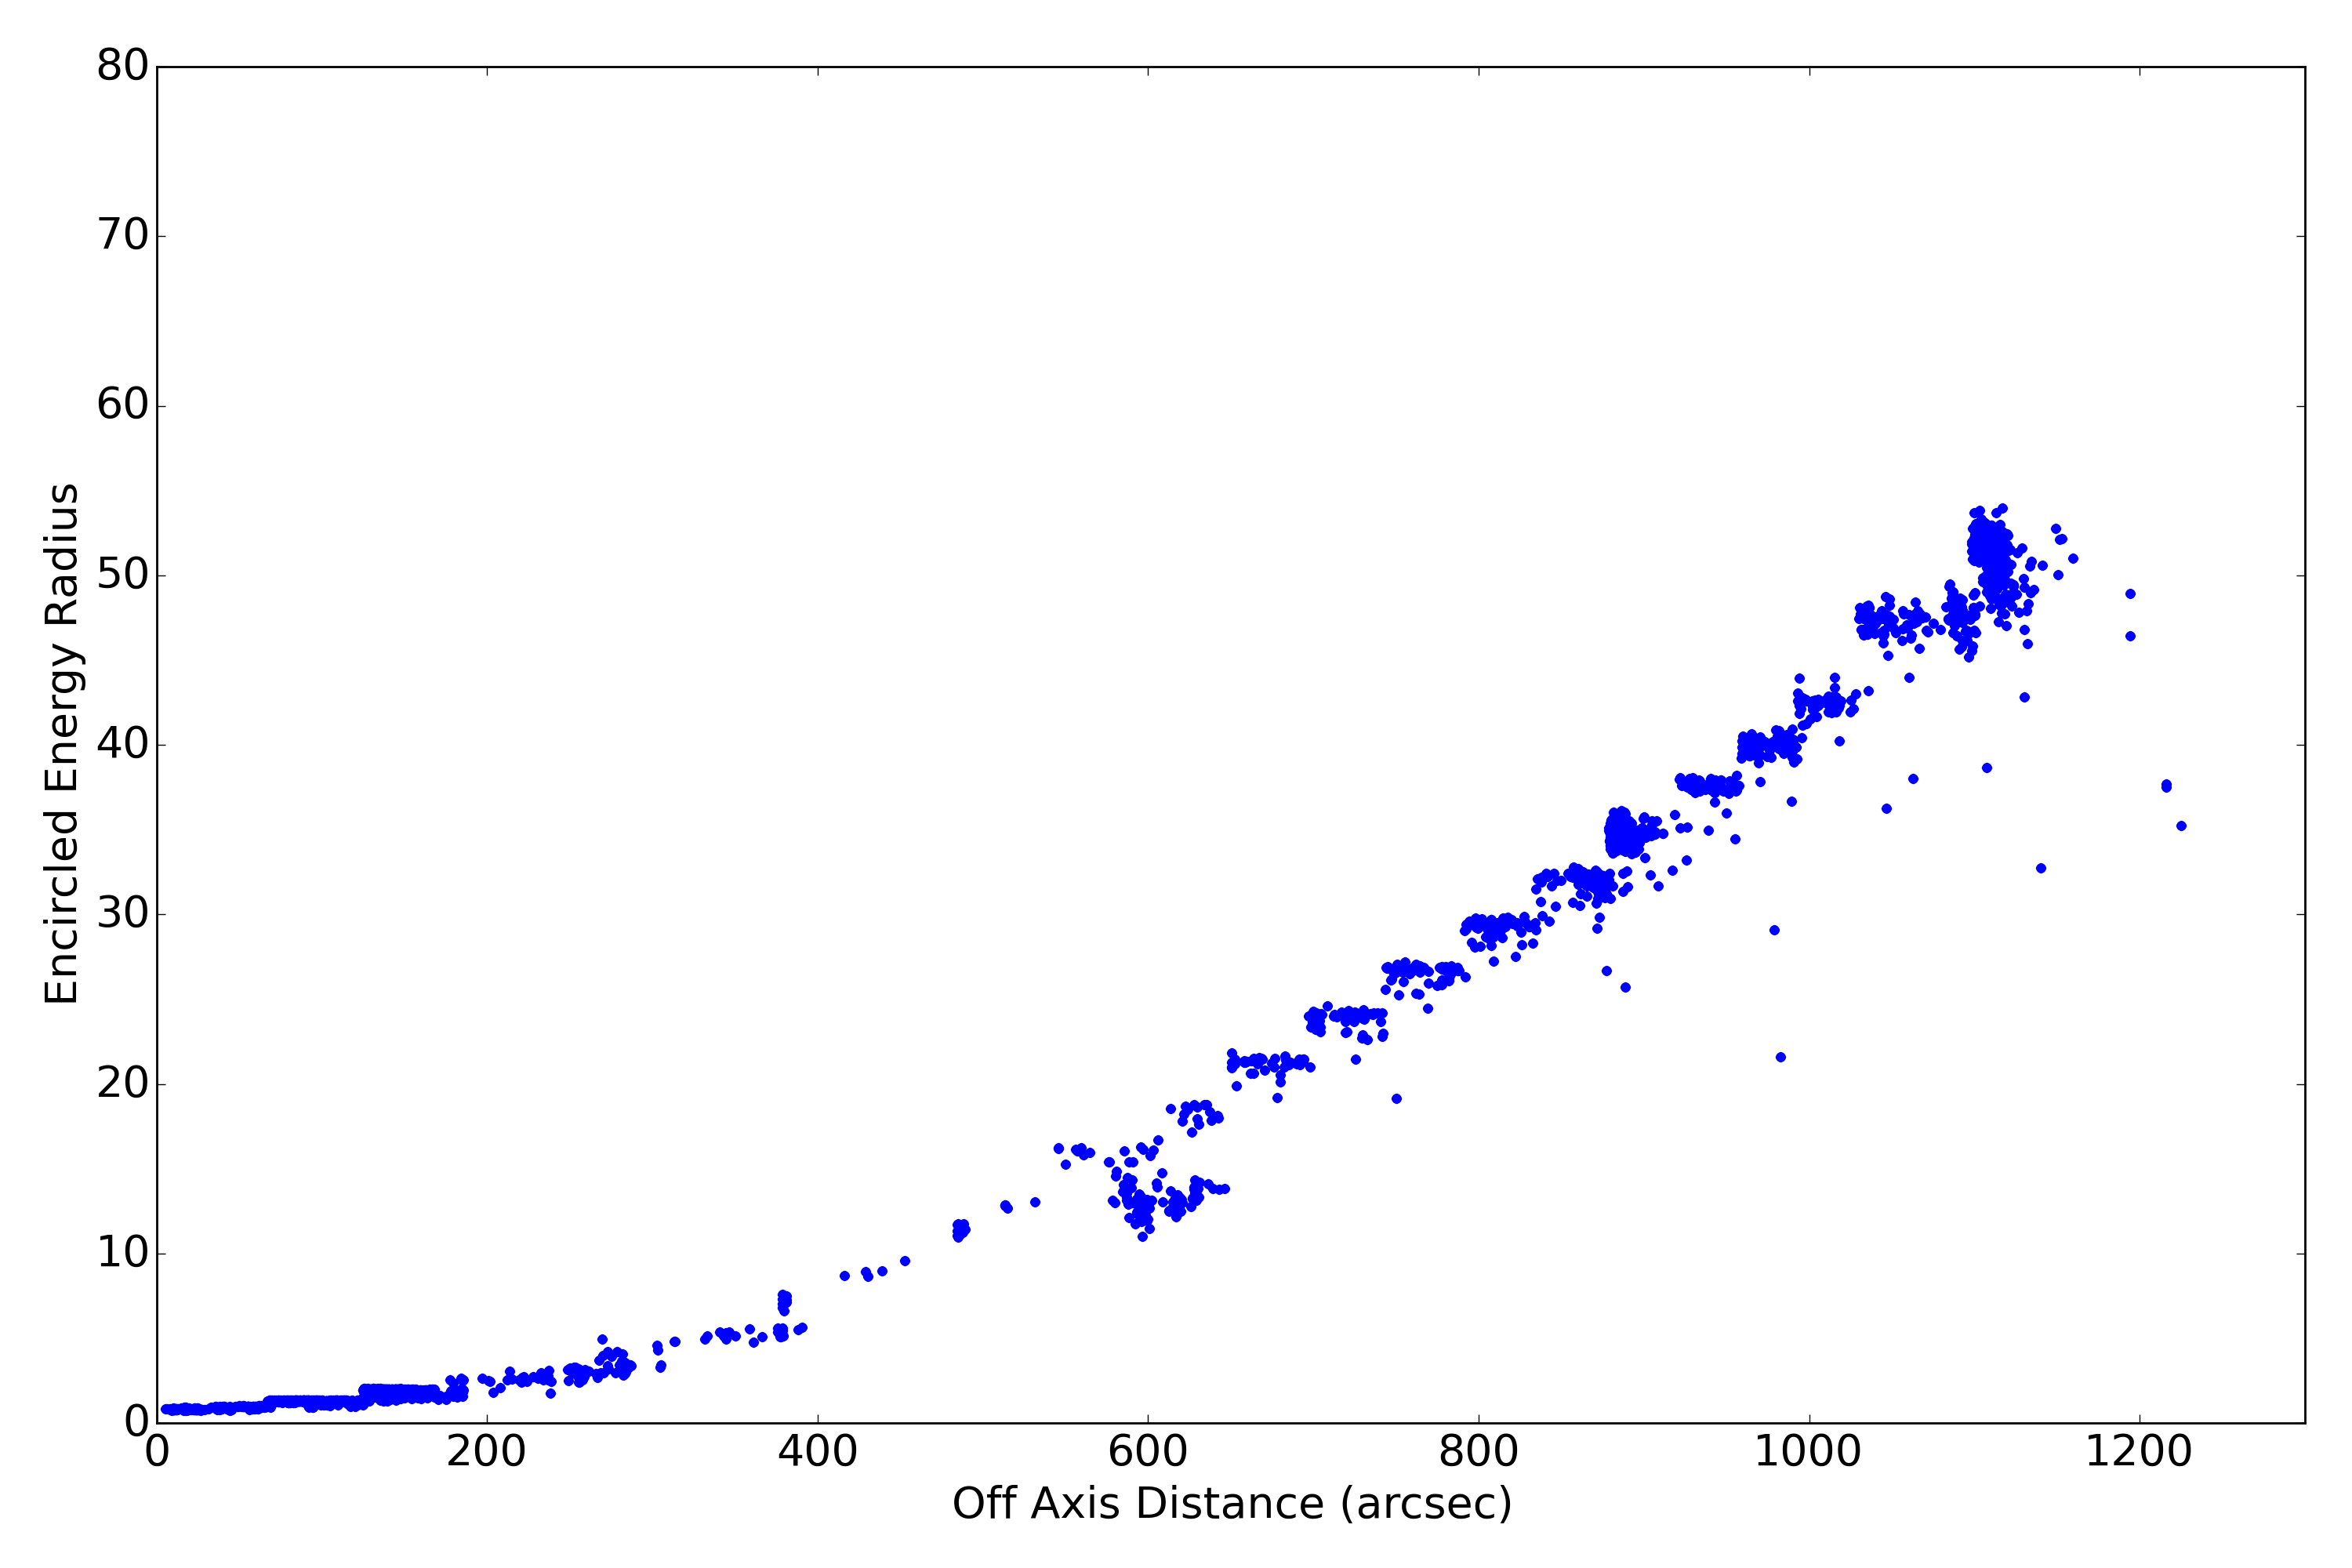
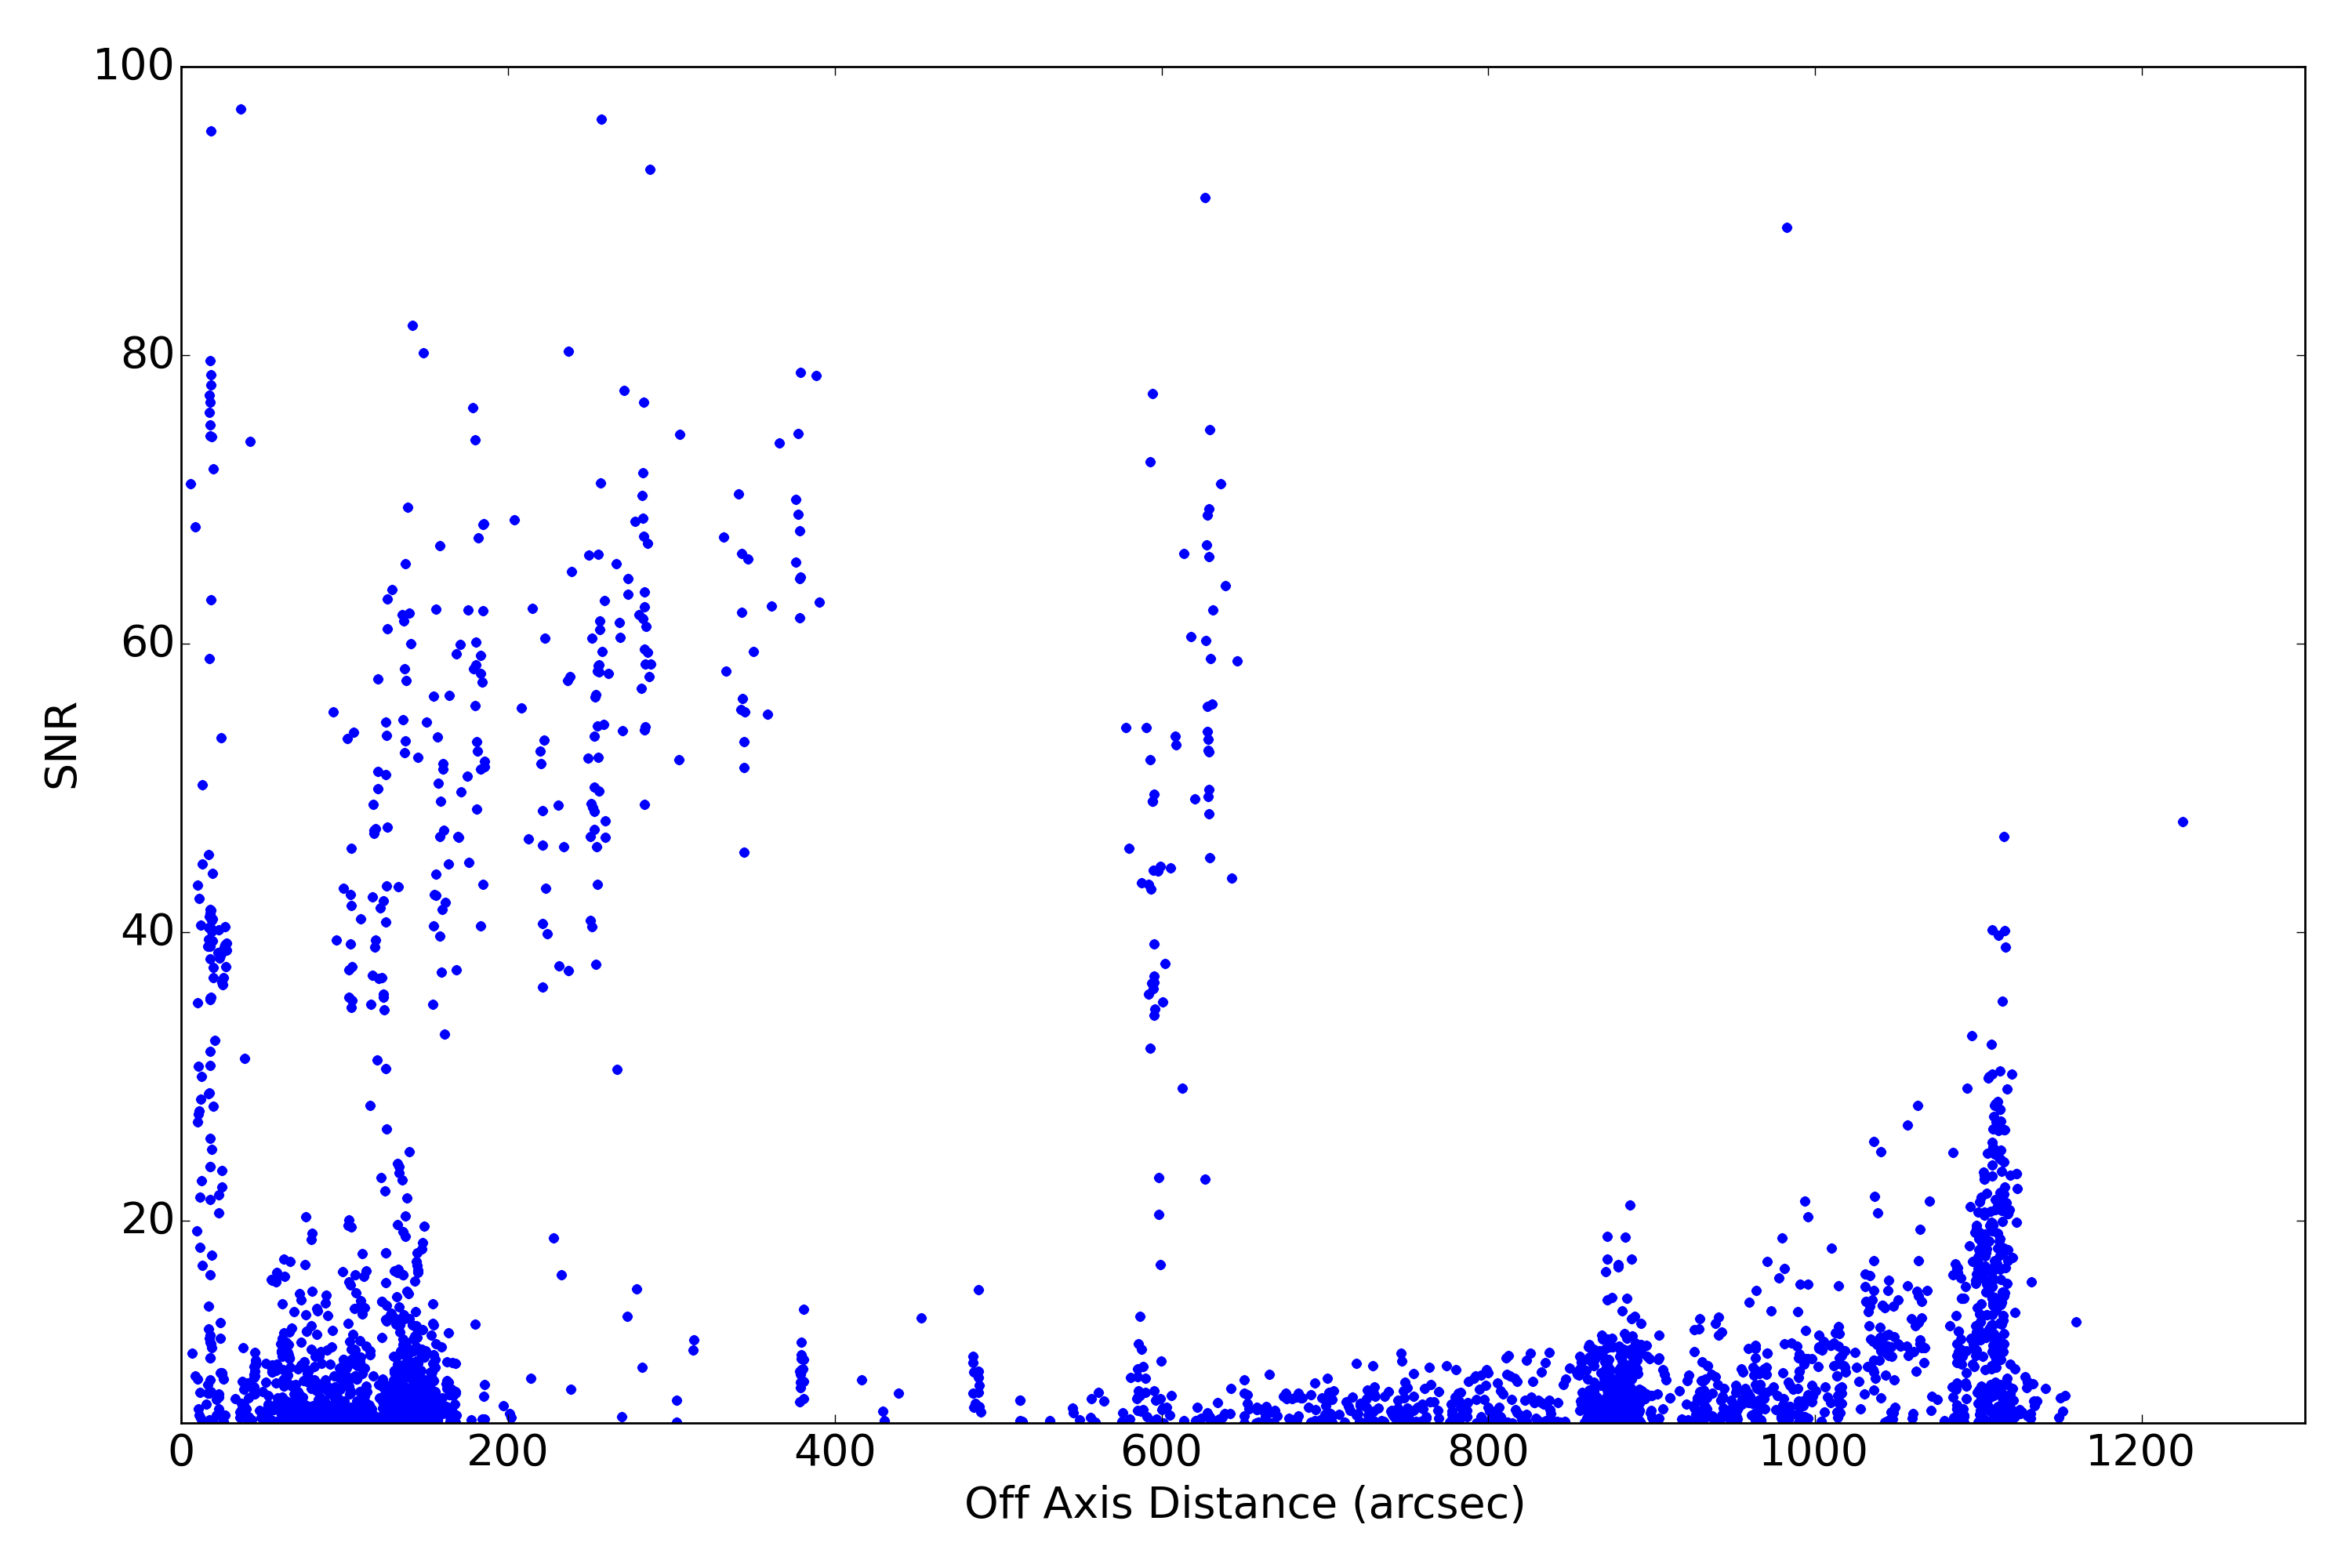
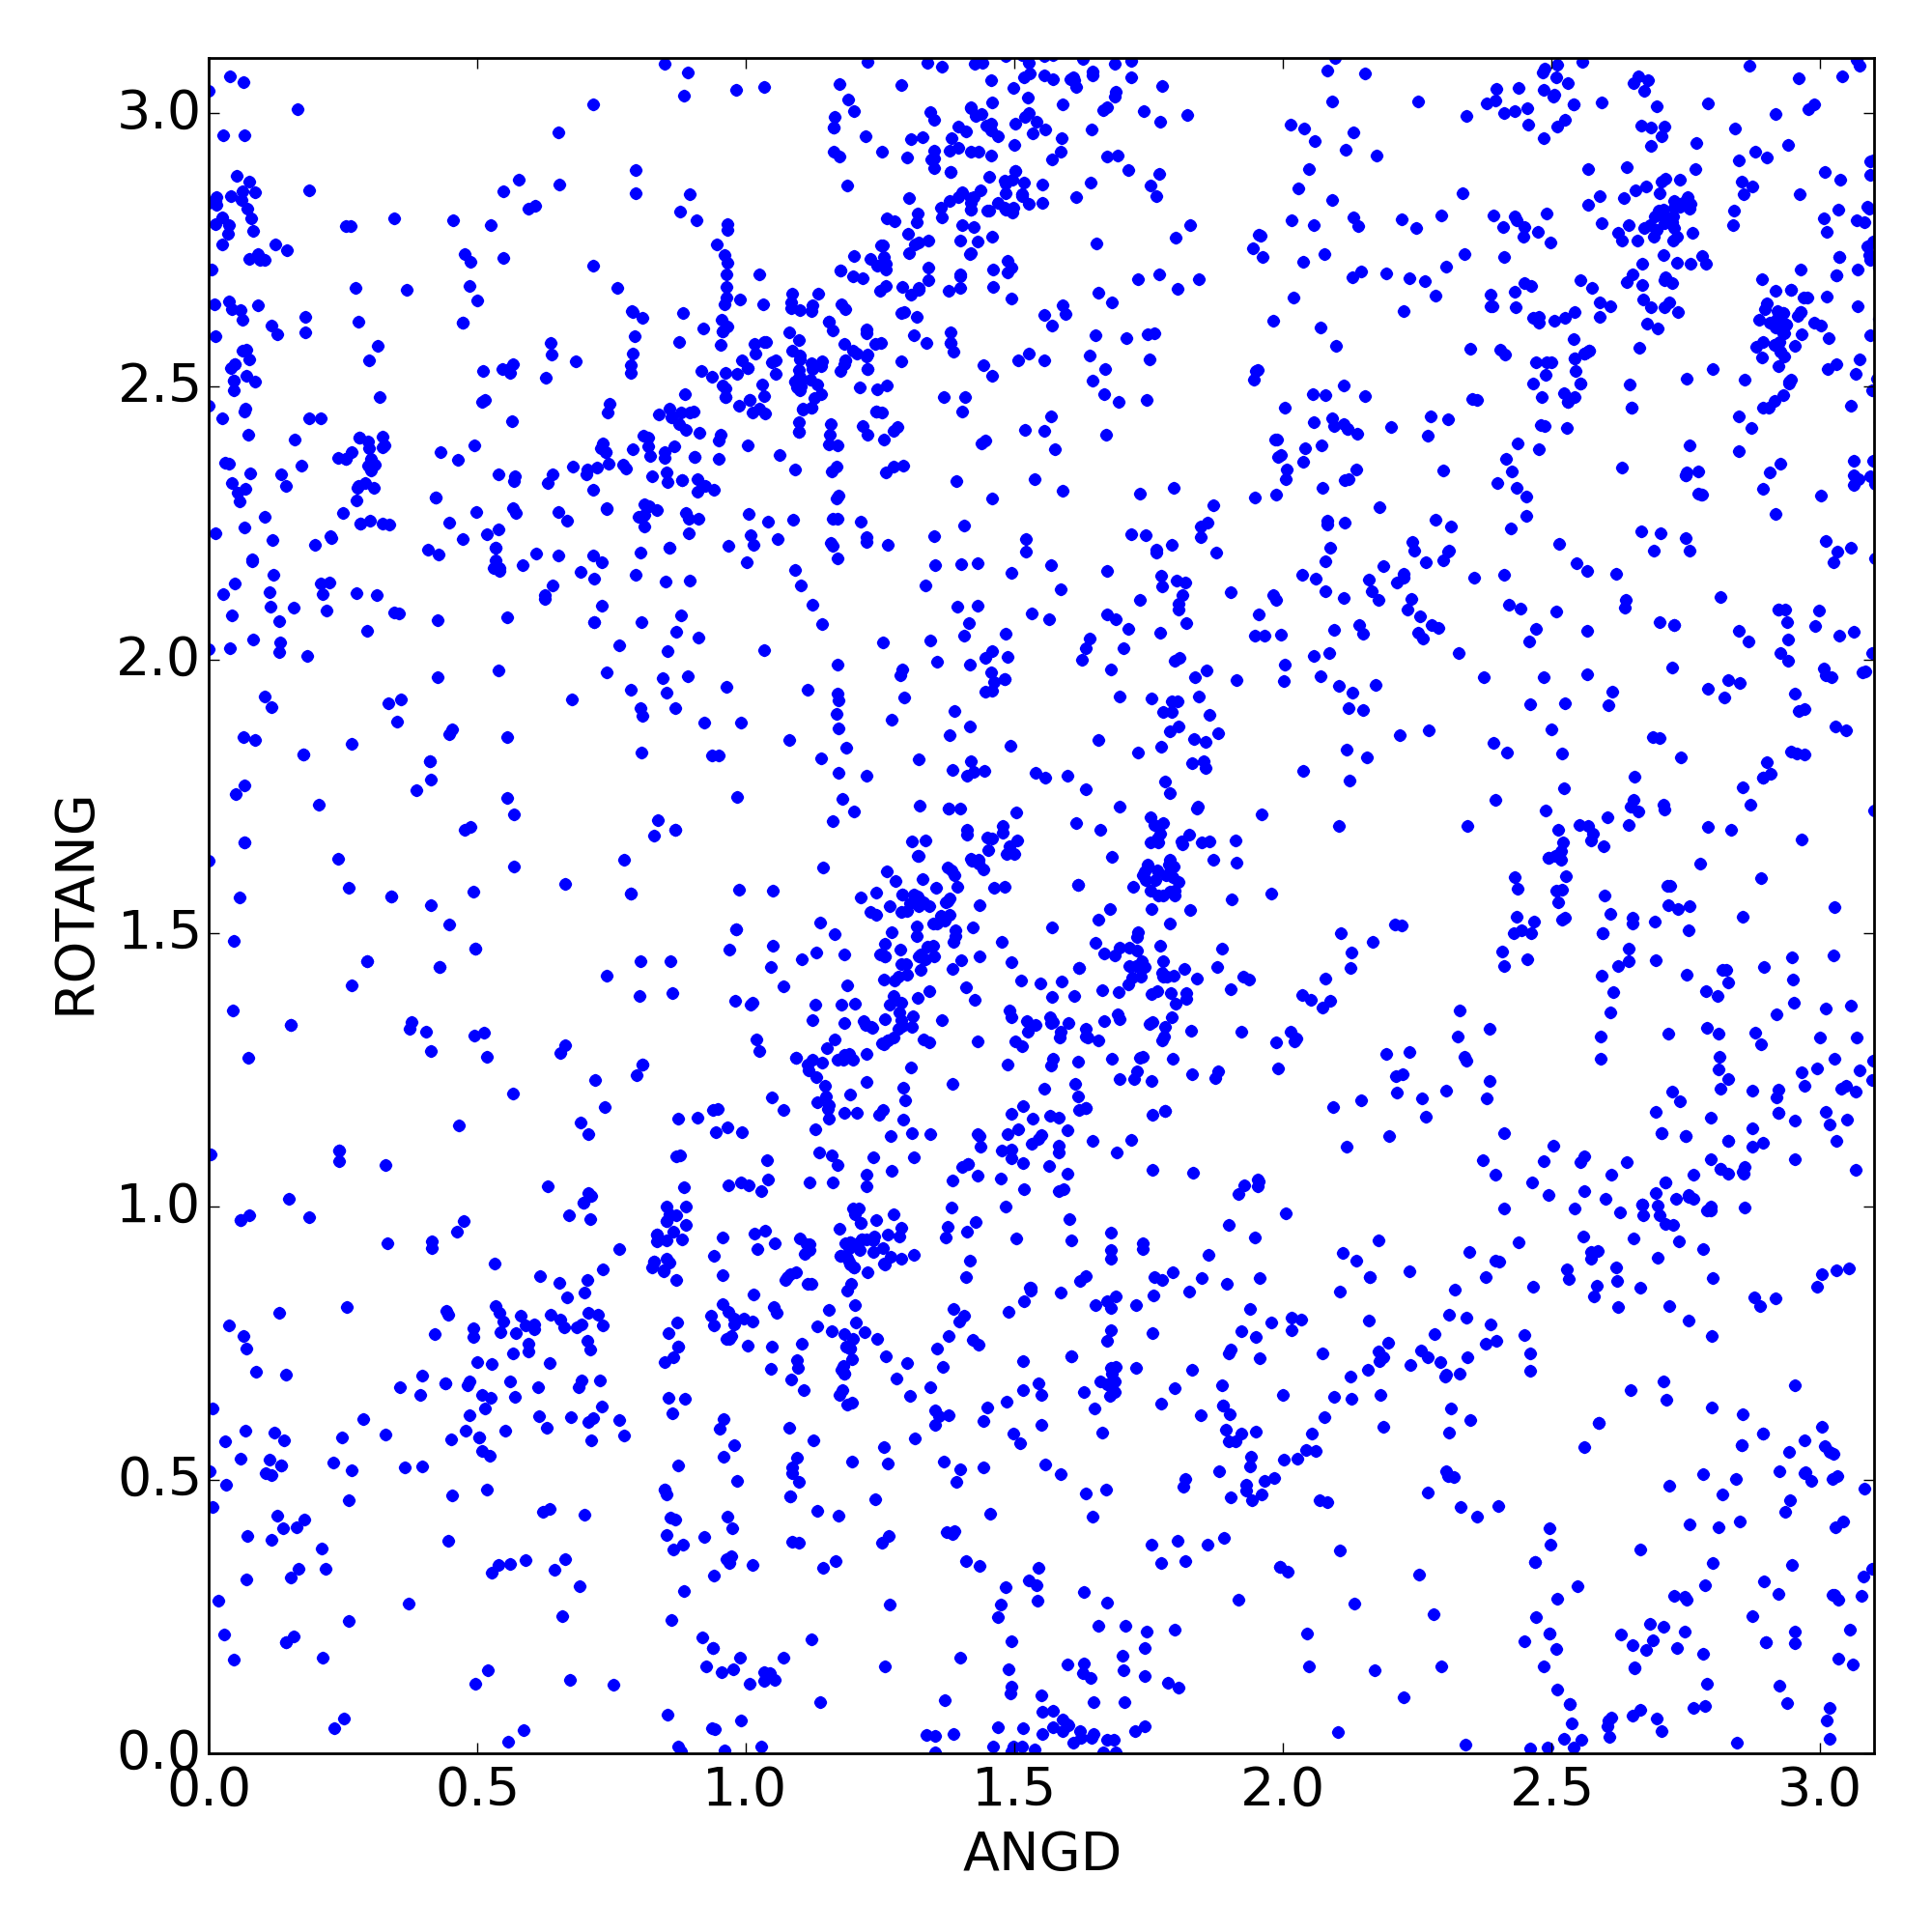
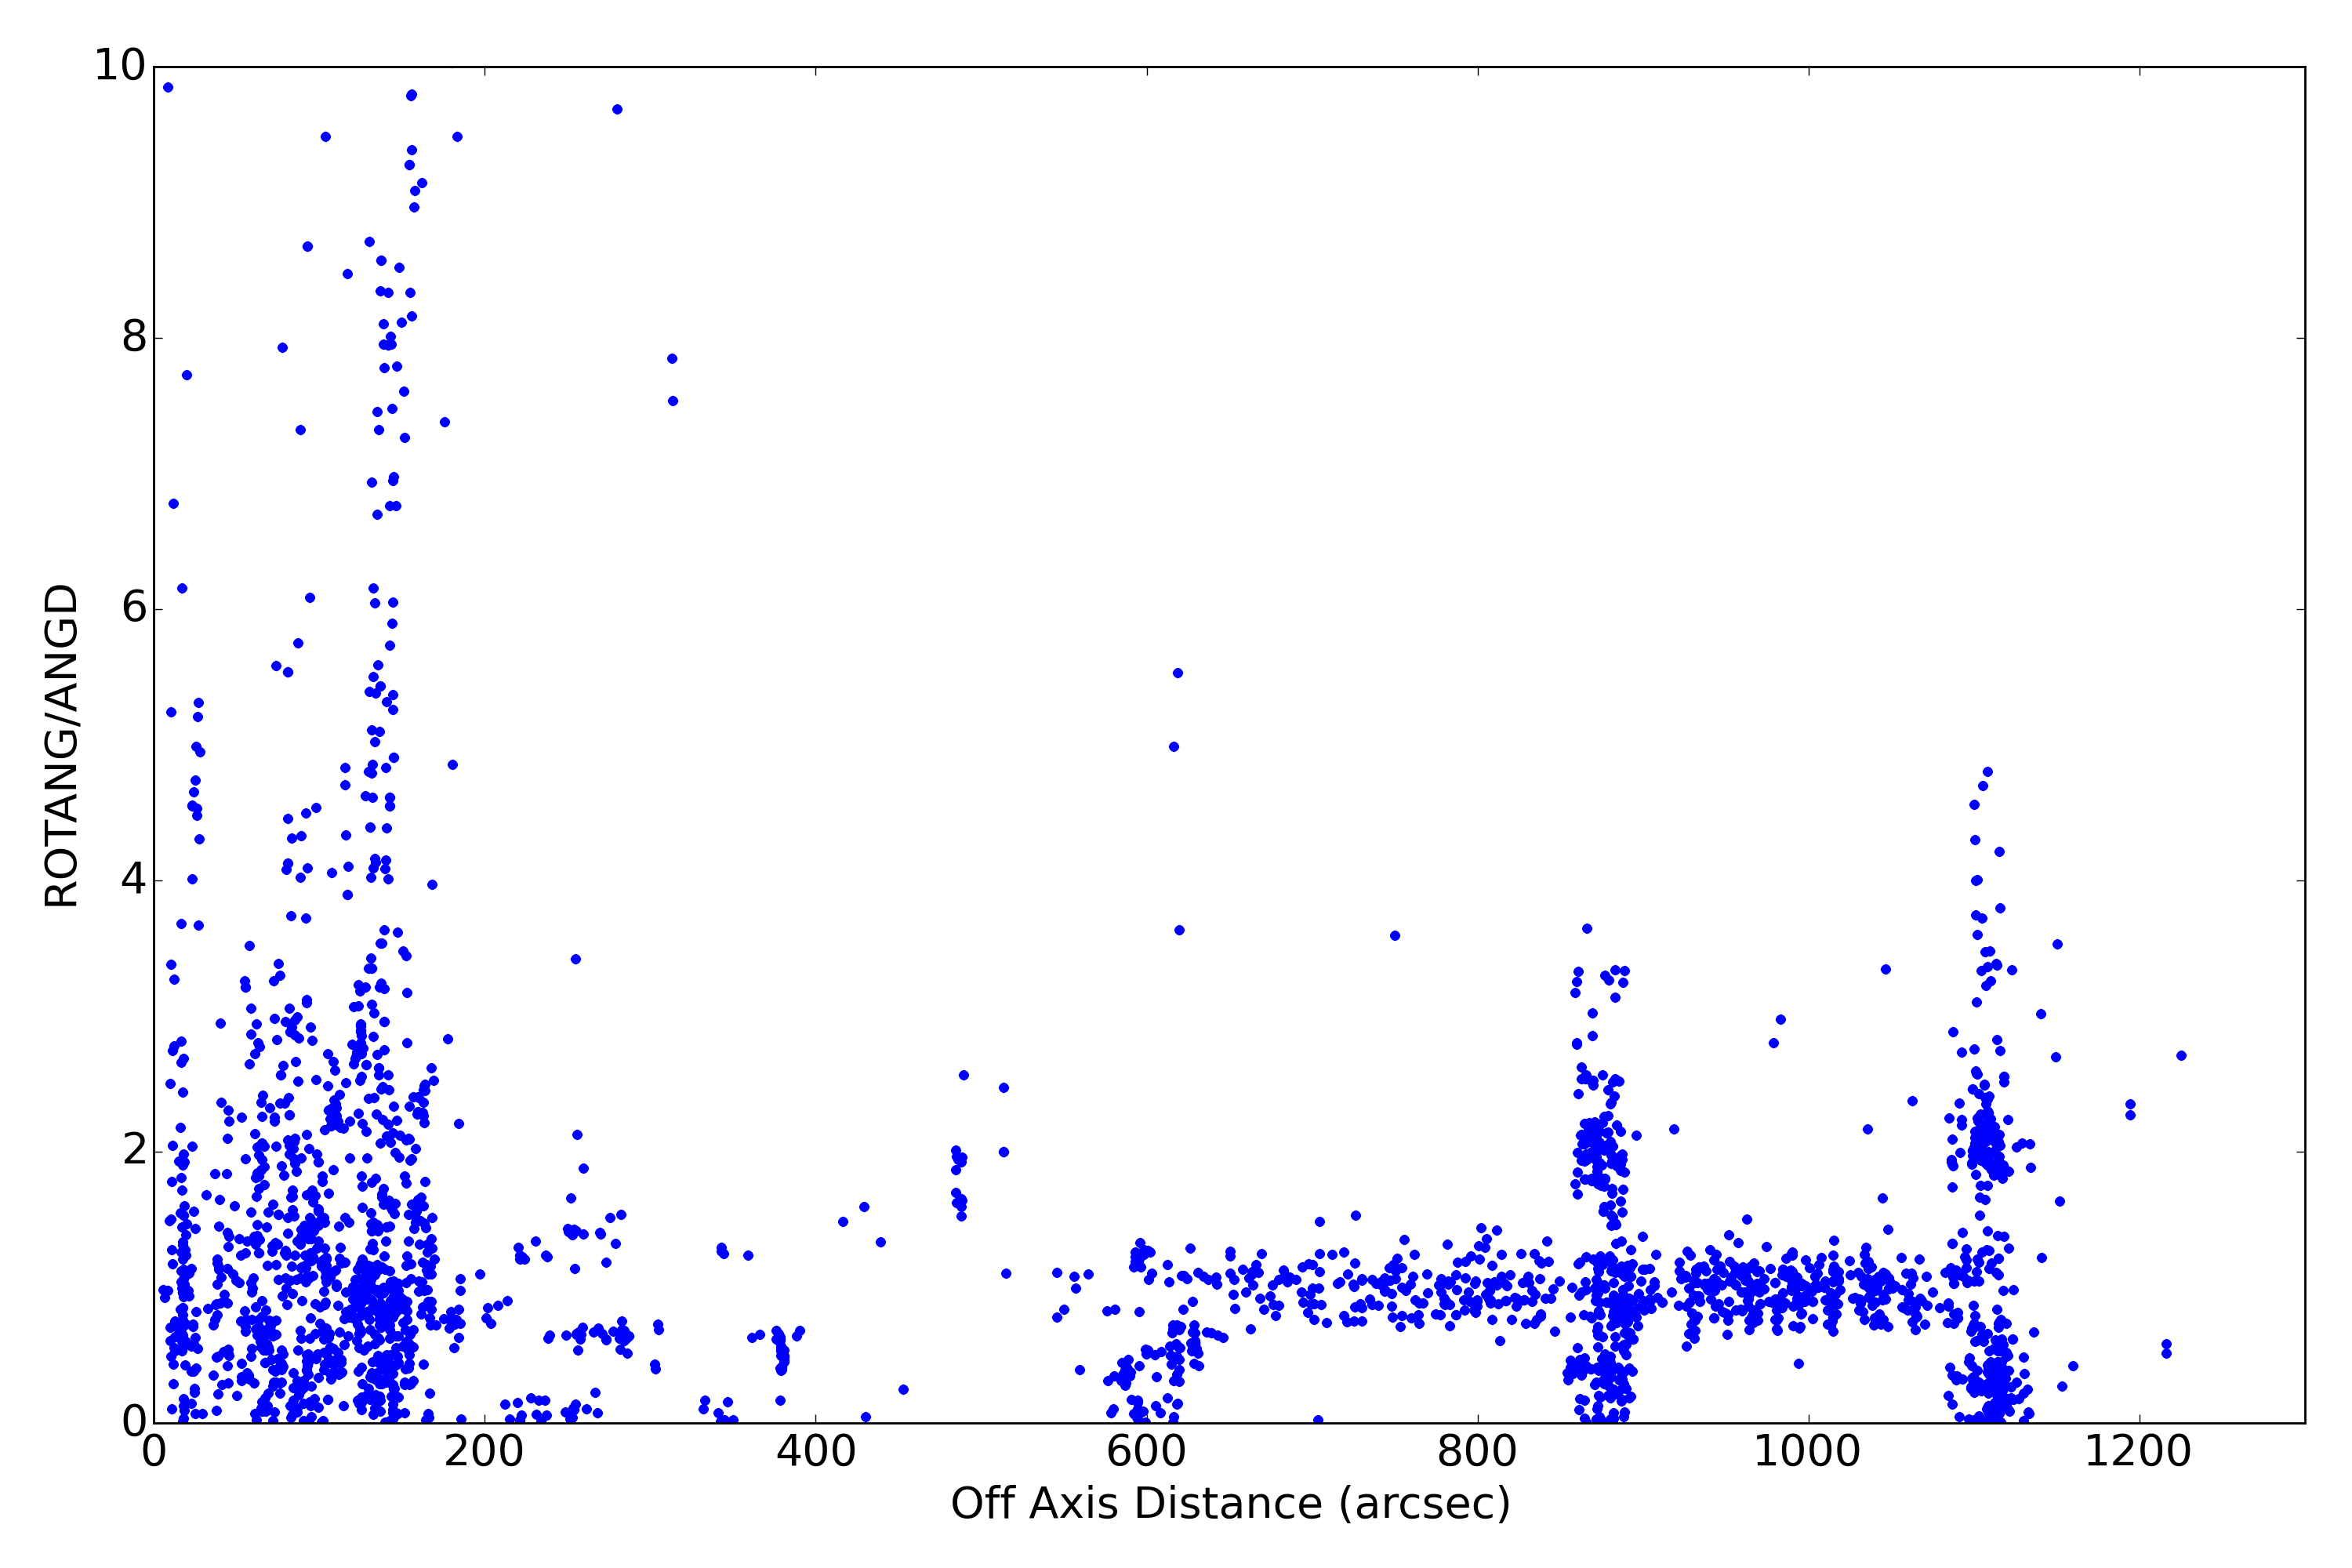
Plots below show various characteristics of detected imaging sources. Standard level 2 data products (*src2.fits) are used. Only observations with focus (sim_x) within 0.01 mm of nominal value for given SI configuration are used. Sources are also filtered for strength (SNR > 15).
| XY | PSF | Roundness | EE Radius | SNR | Rotation | Rotation2 | |
|---|---|---|---|---|---|---|---|
| ACIS I |  |
 |
 |
 |
 |
 |
 |
| ACIS S | 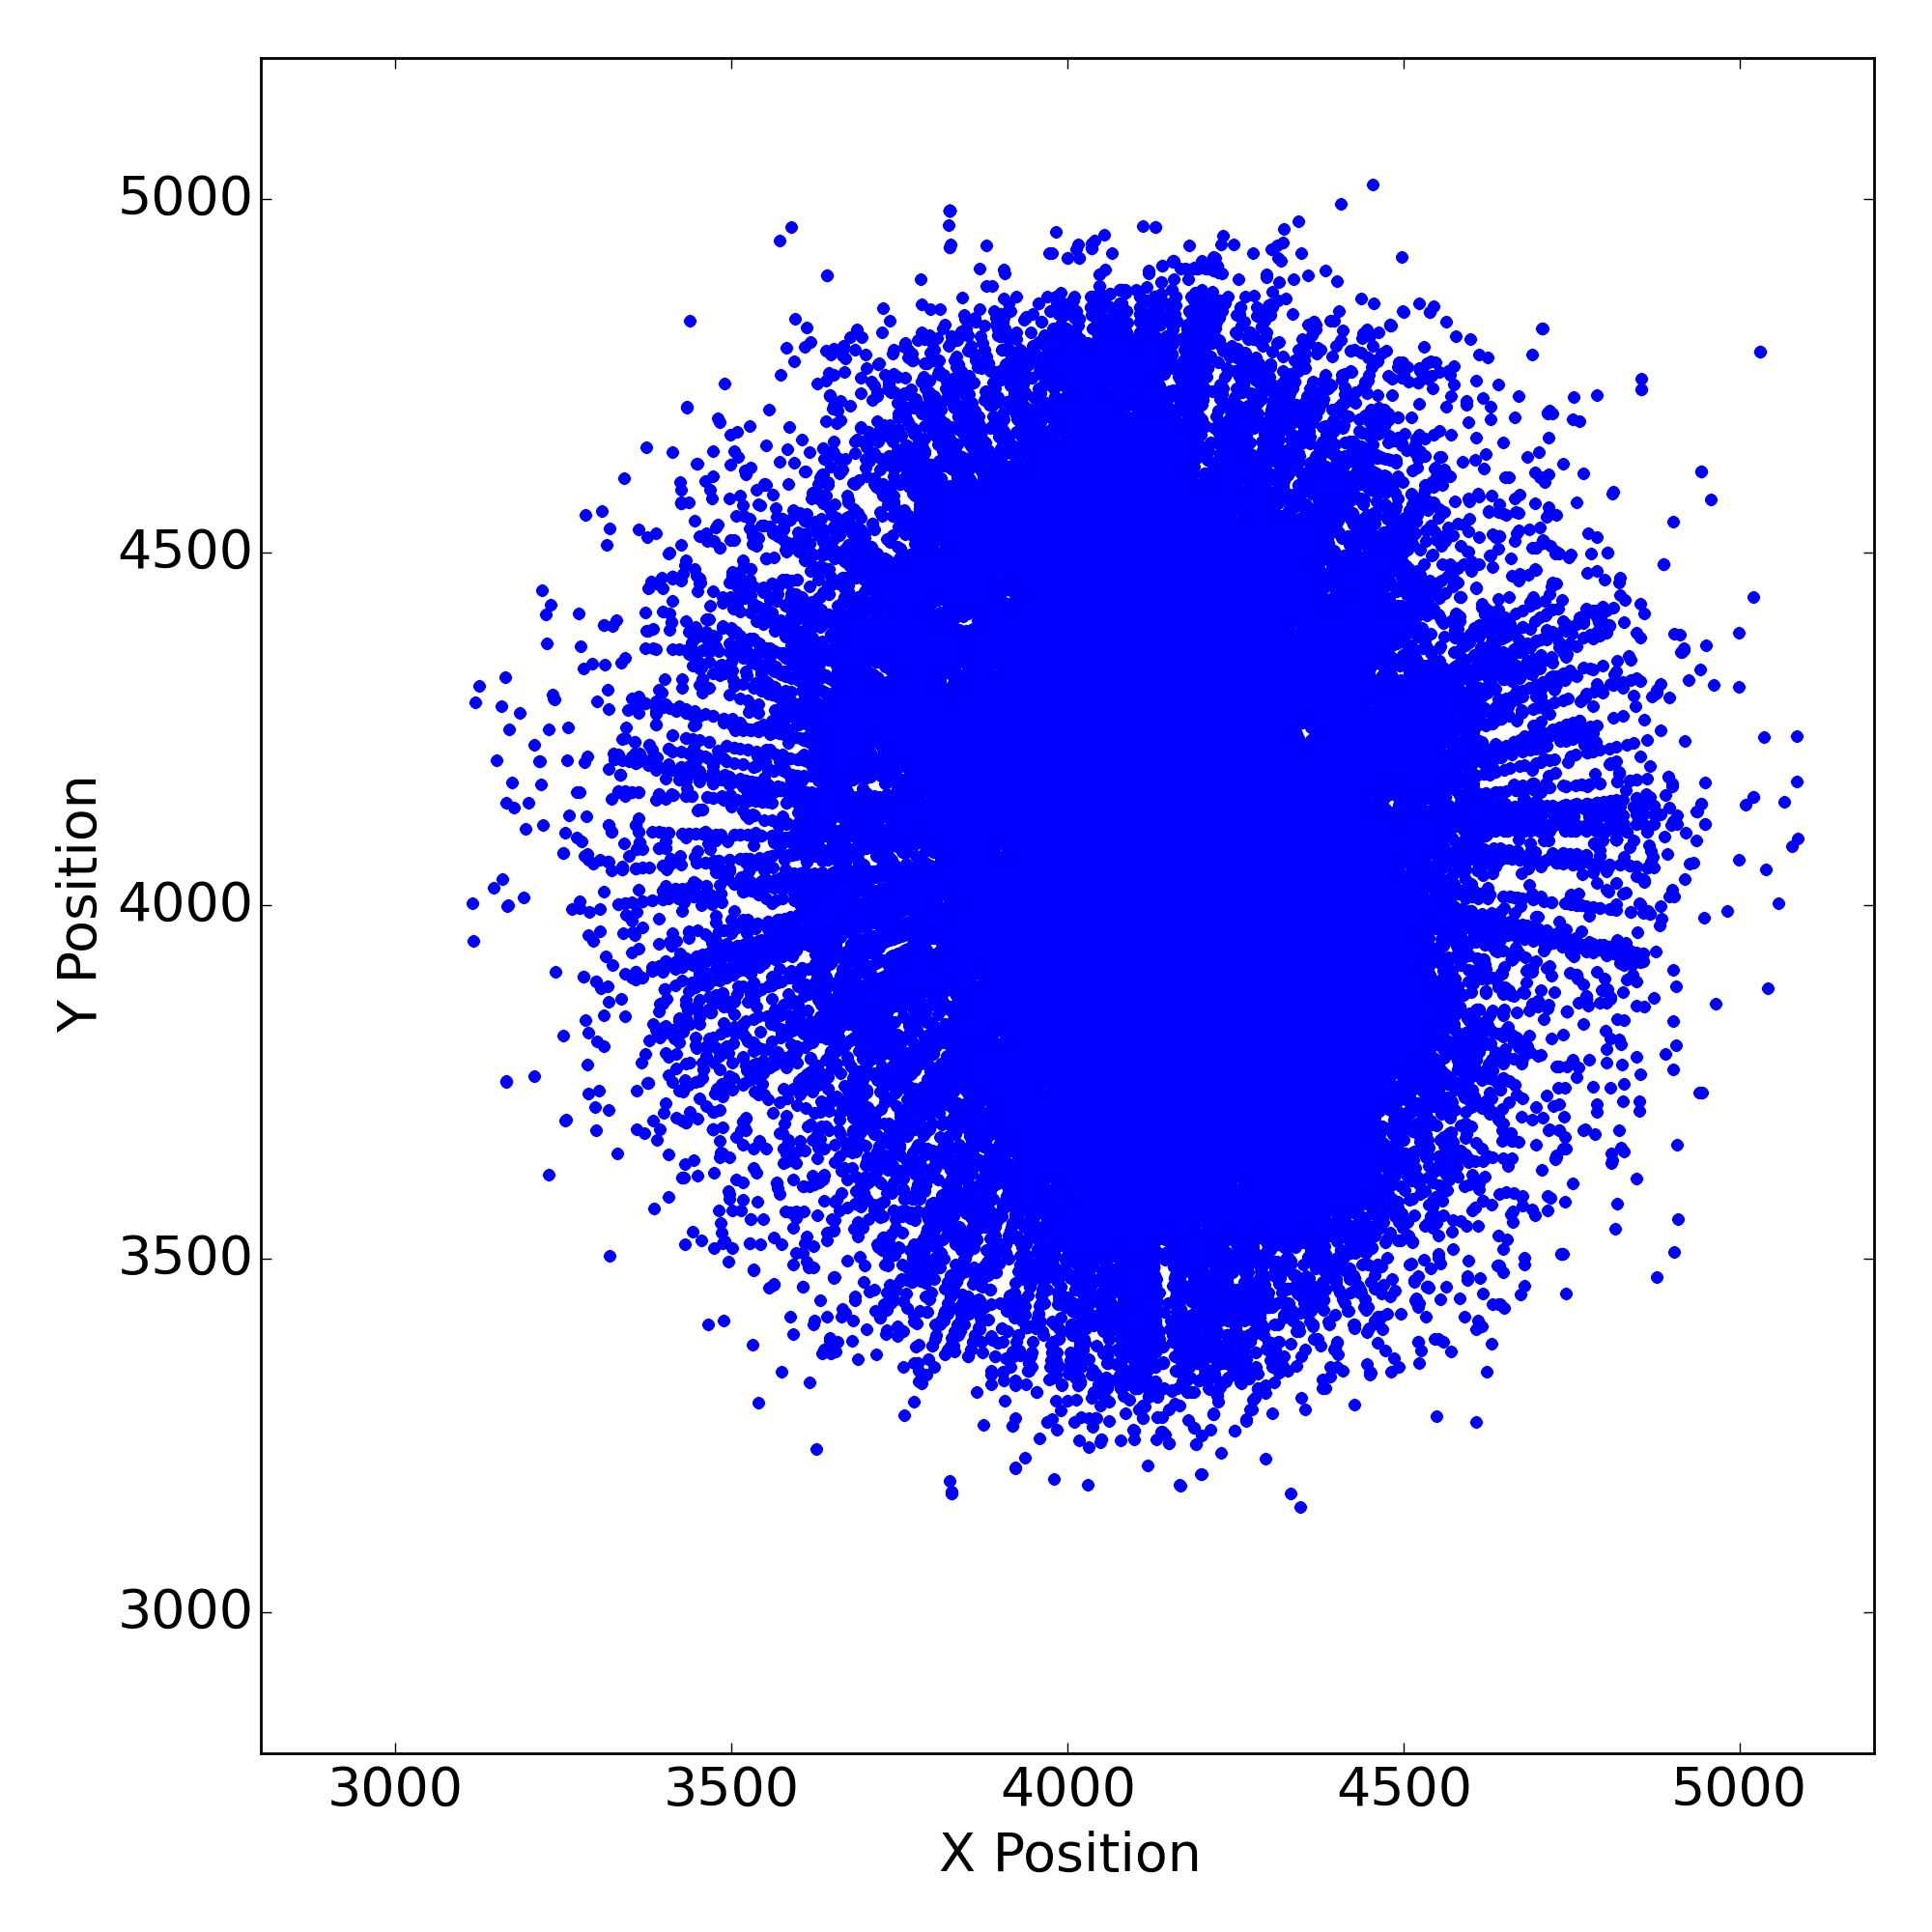 |
 |
 |
 |
 |
 |
 |
| HRC I | 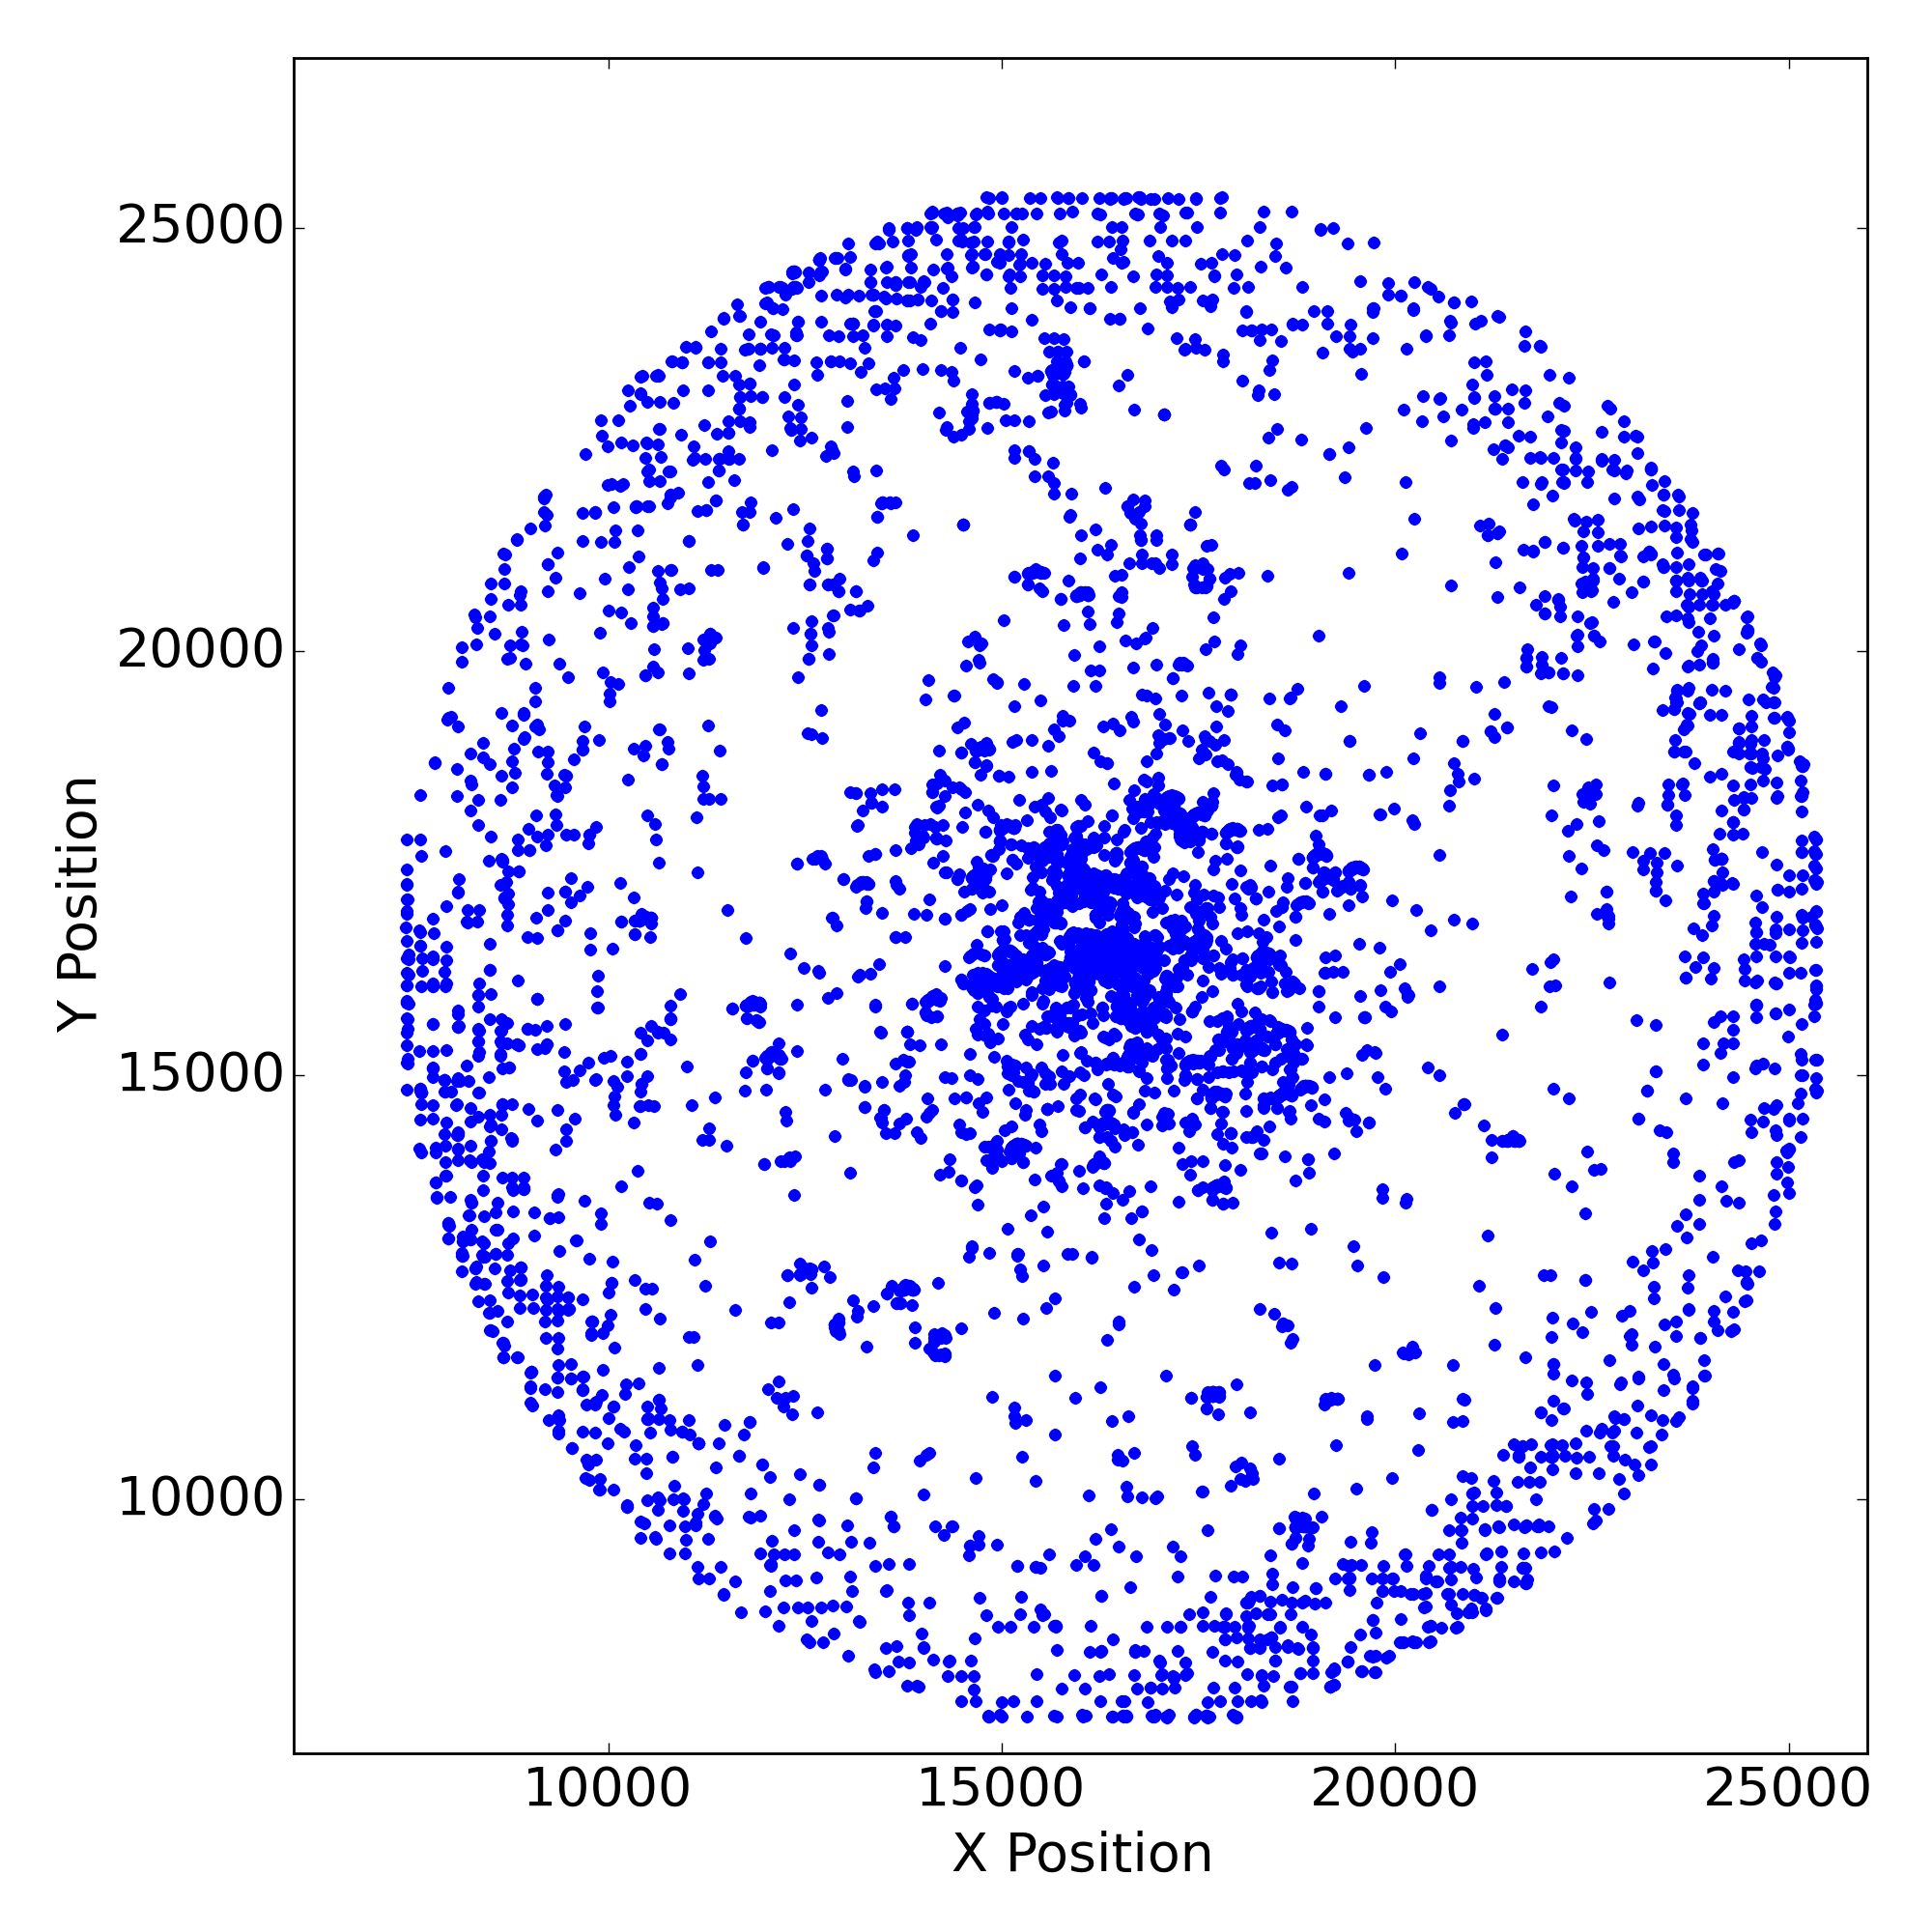 |
 |
 |
 |
 |
 |
 |
| HRC S | 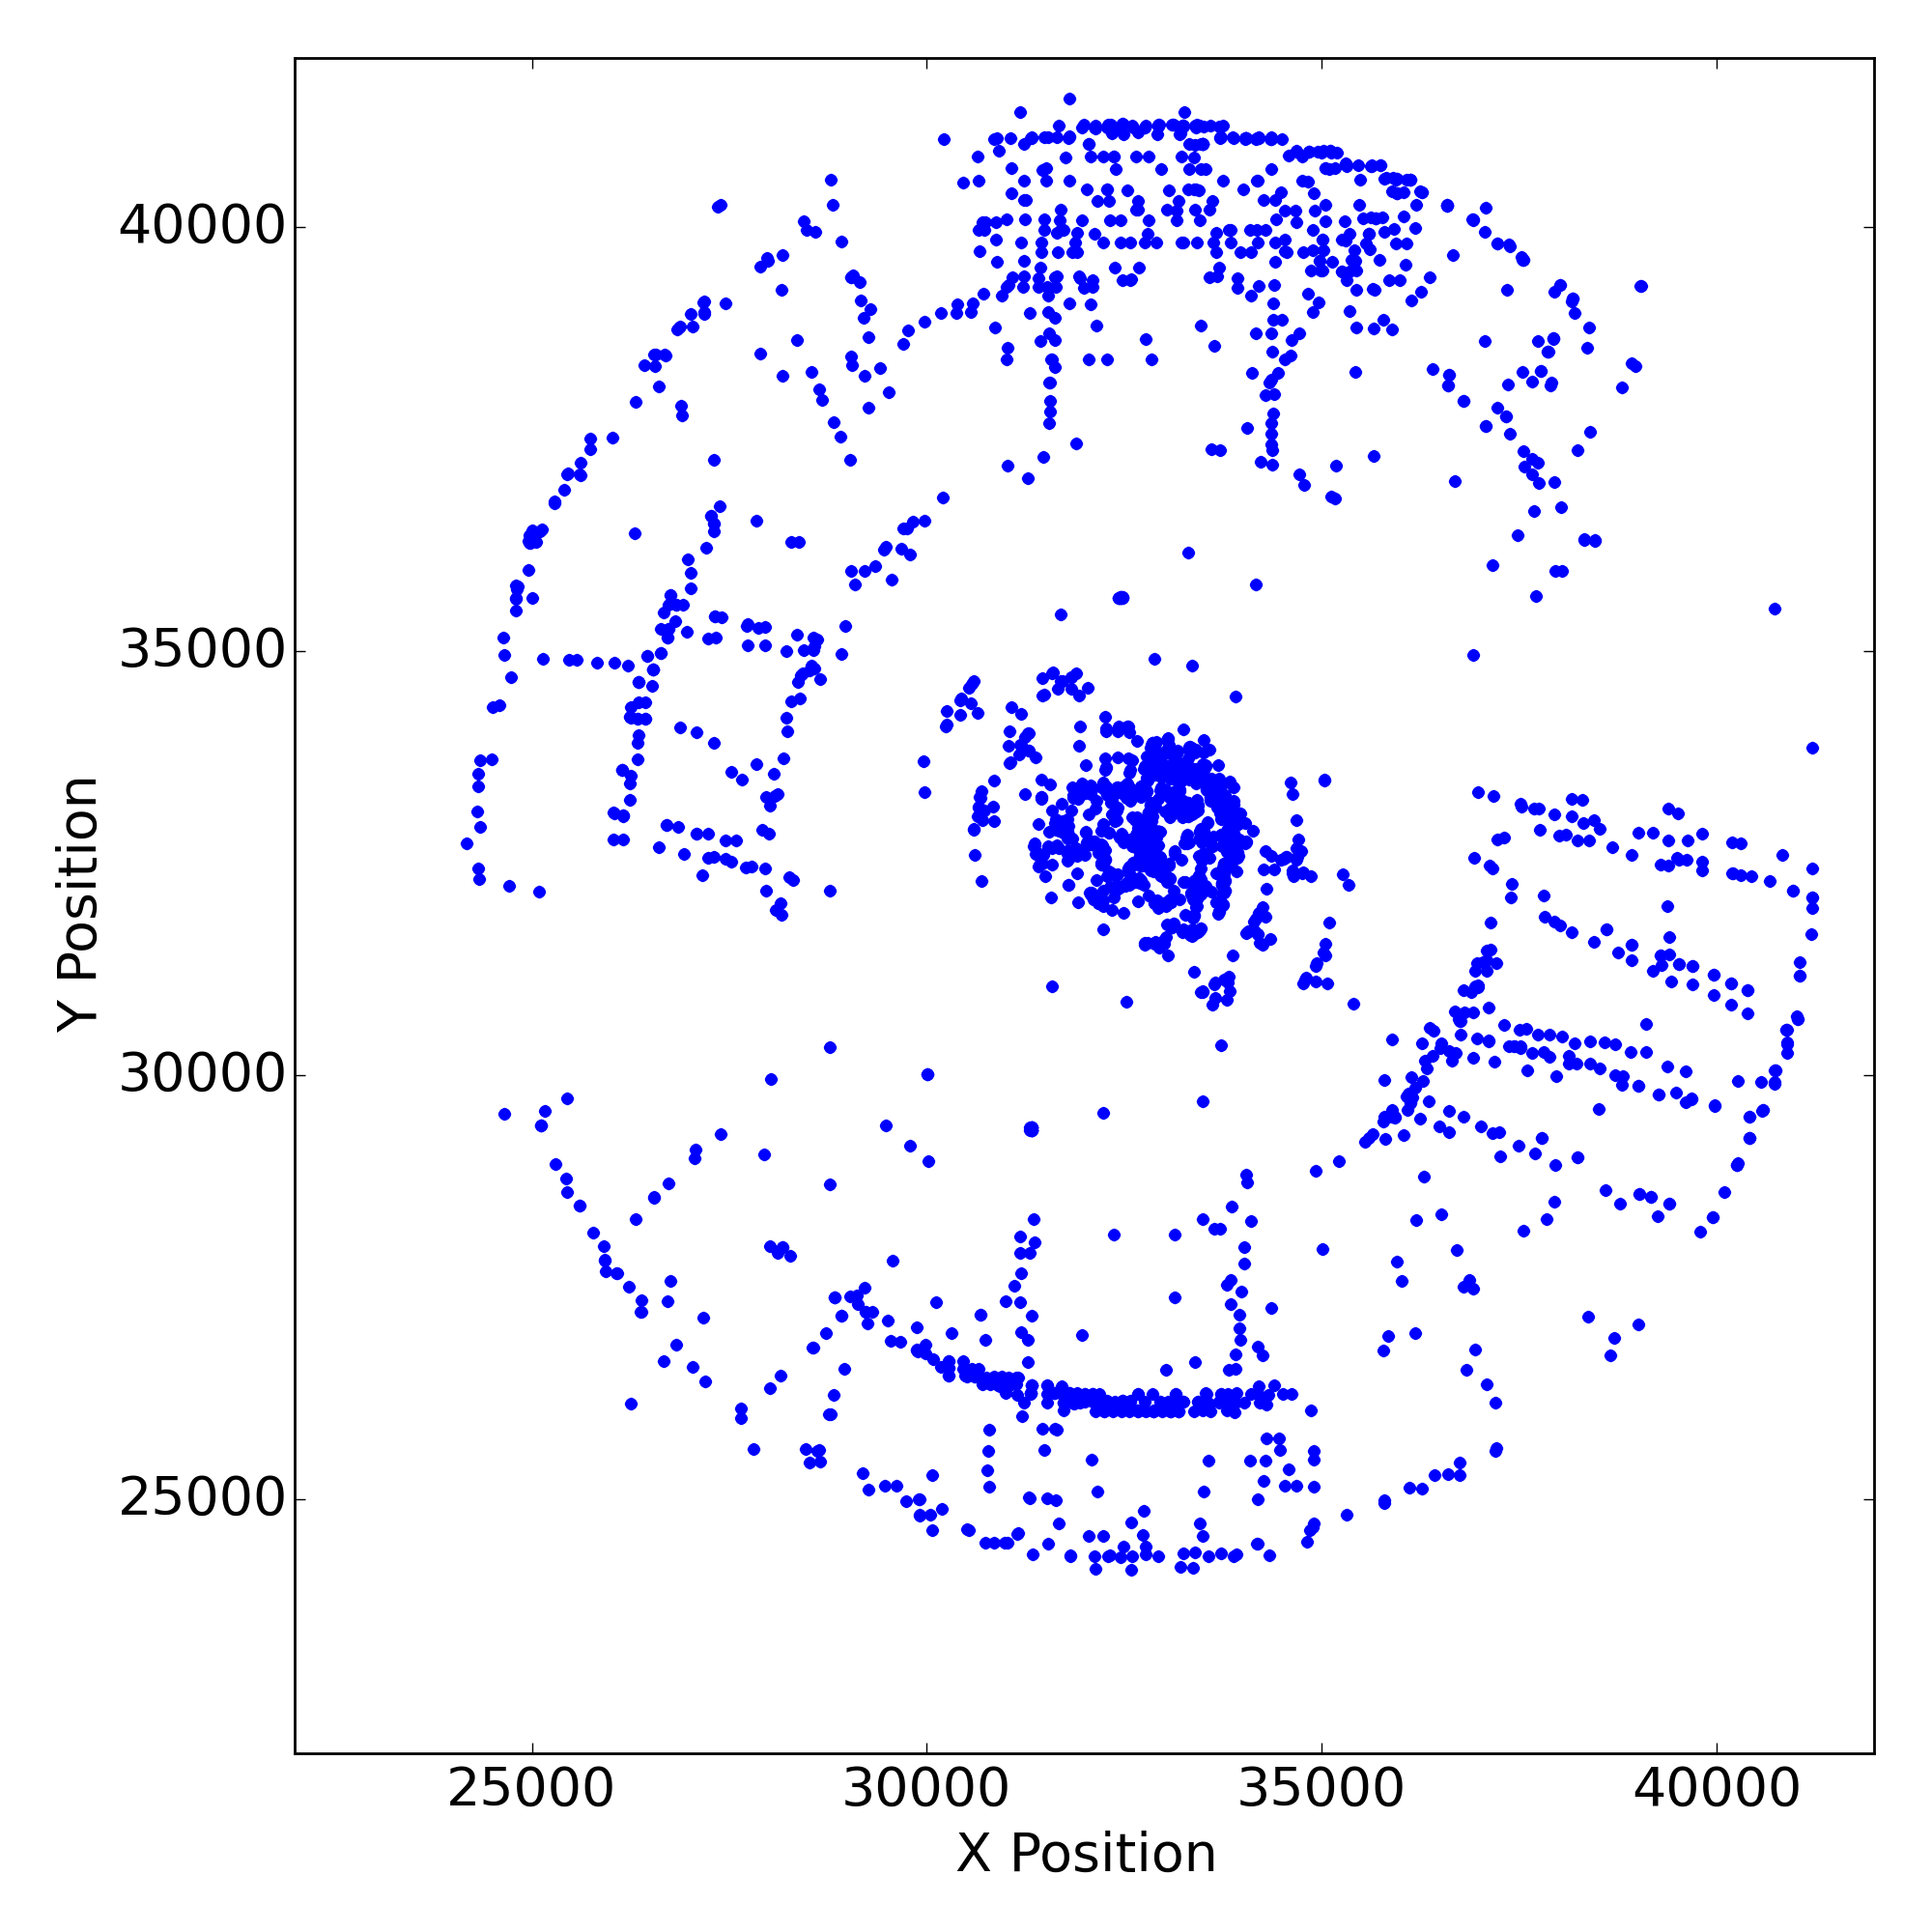 |
 |
 |
 |
 |
 |
 |
Gratings
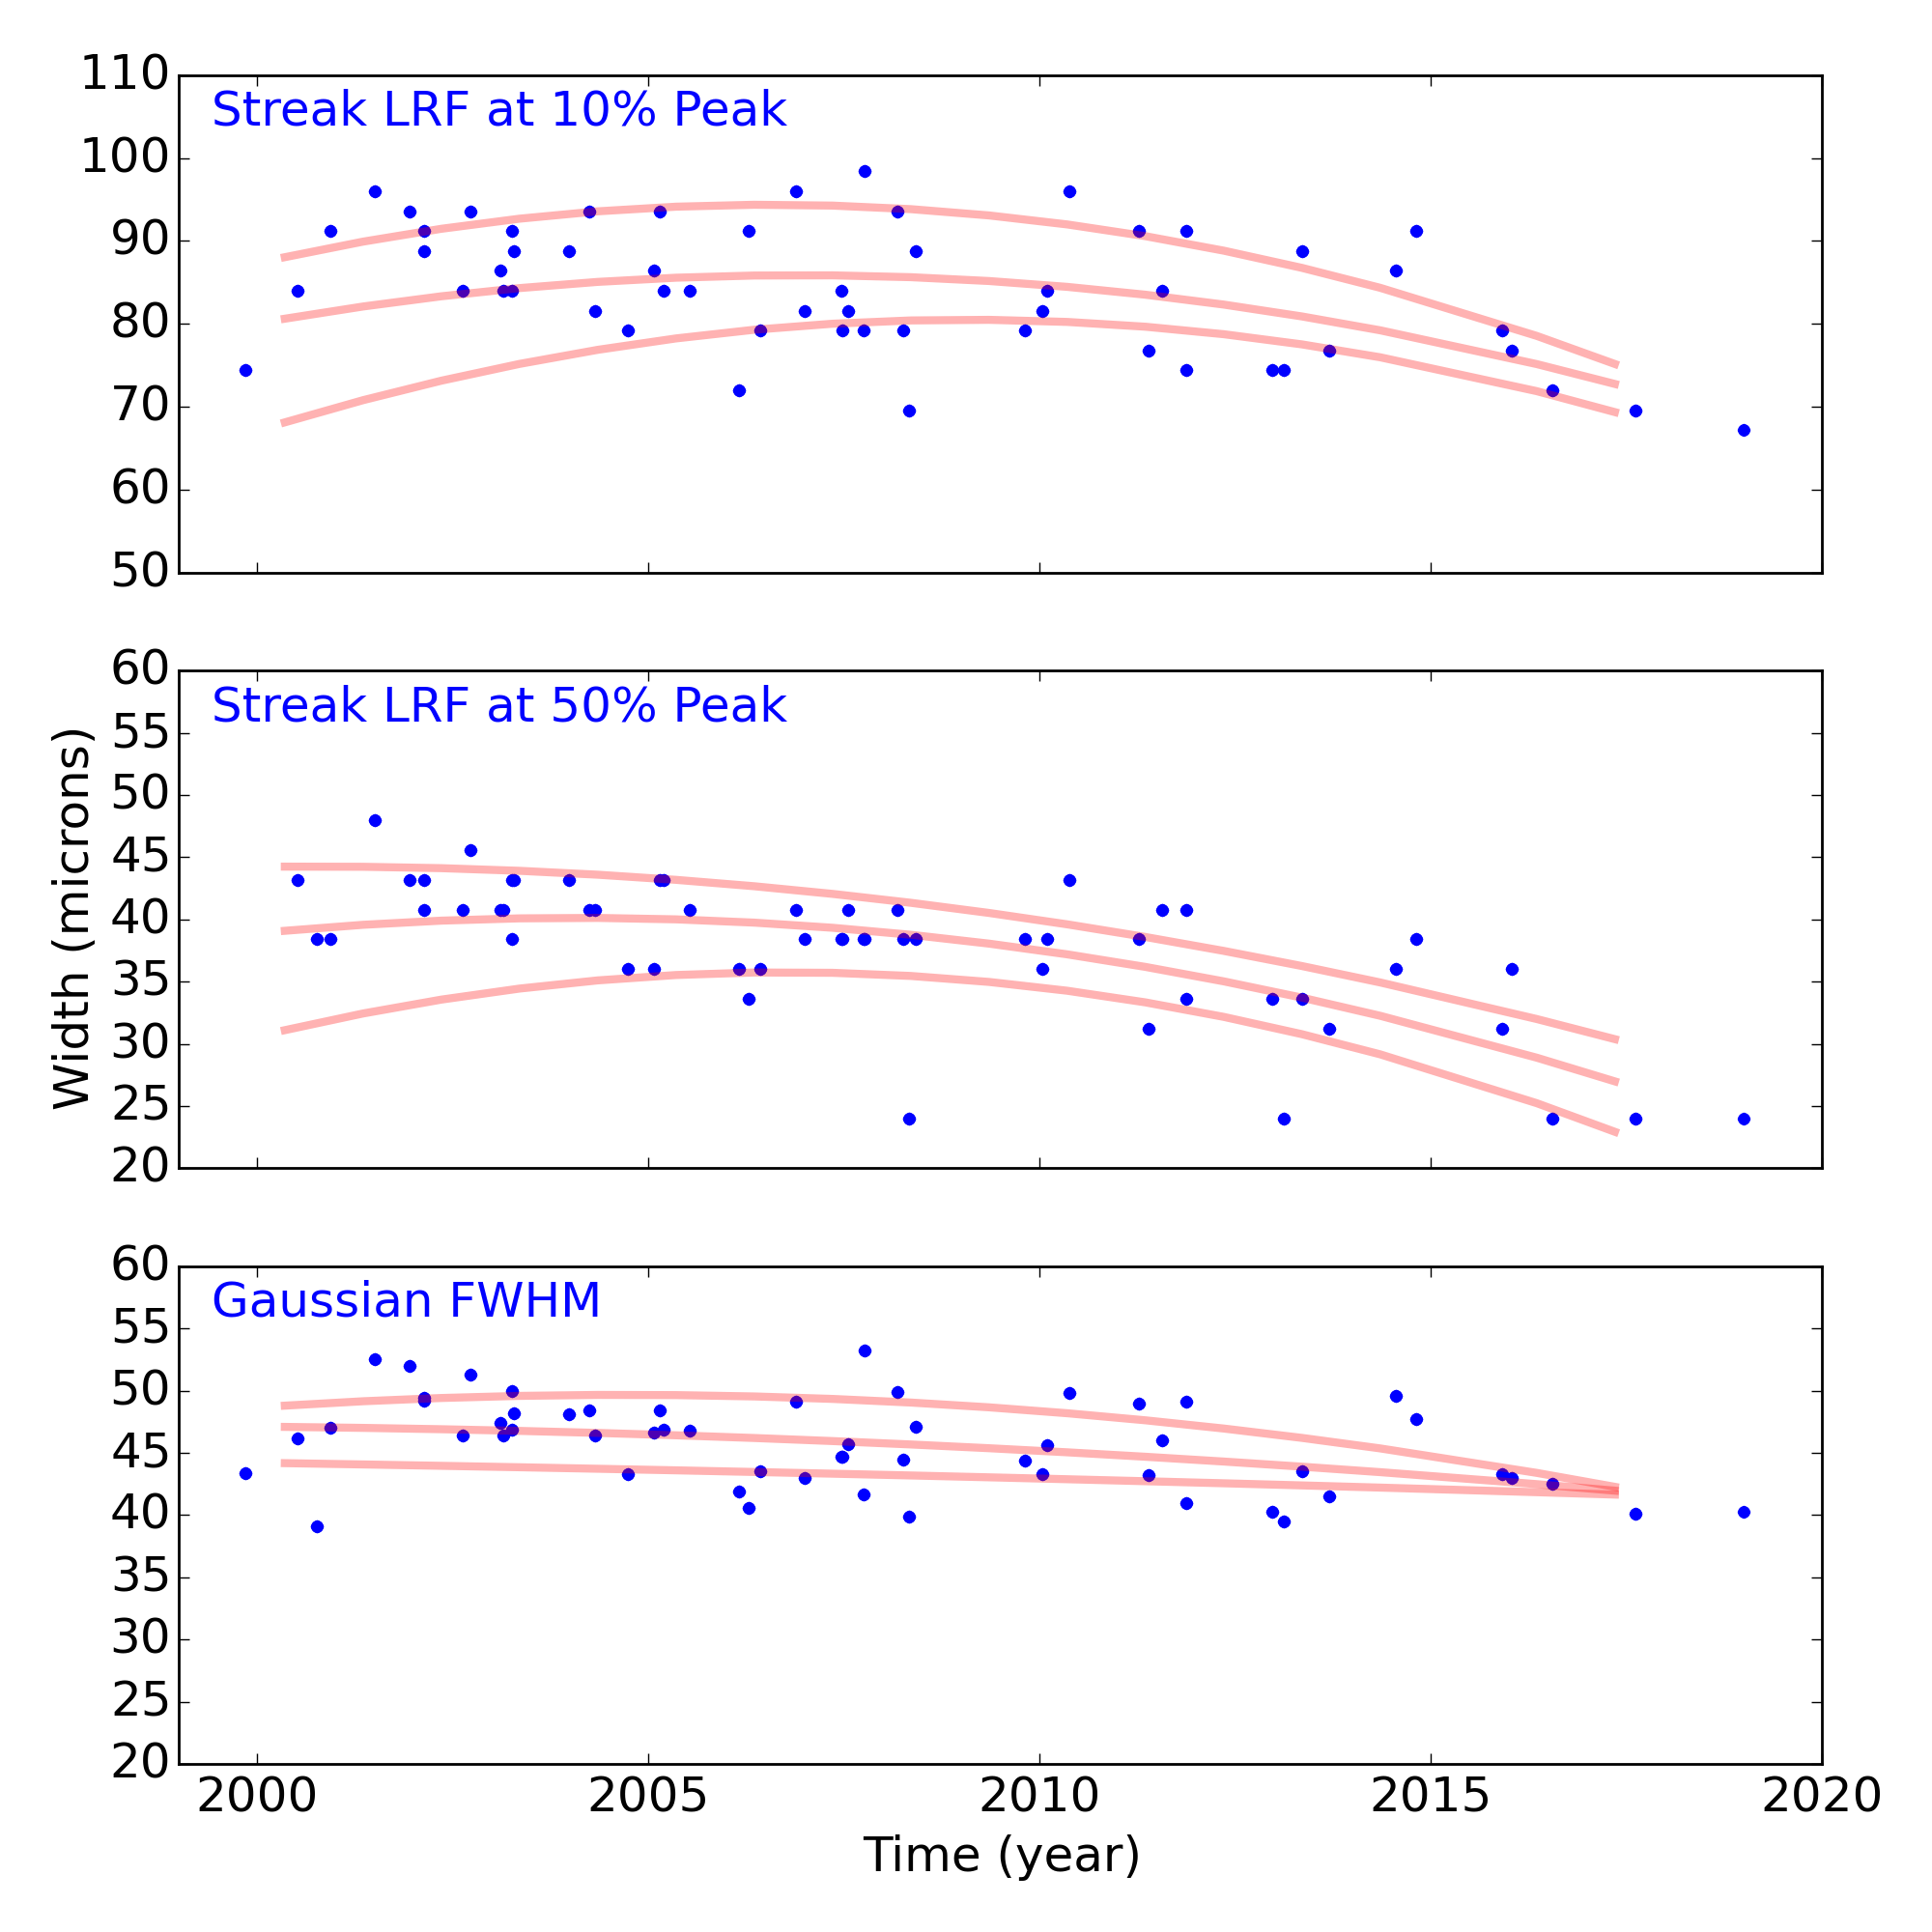
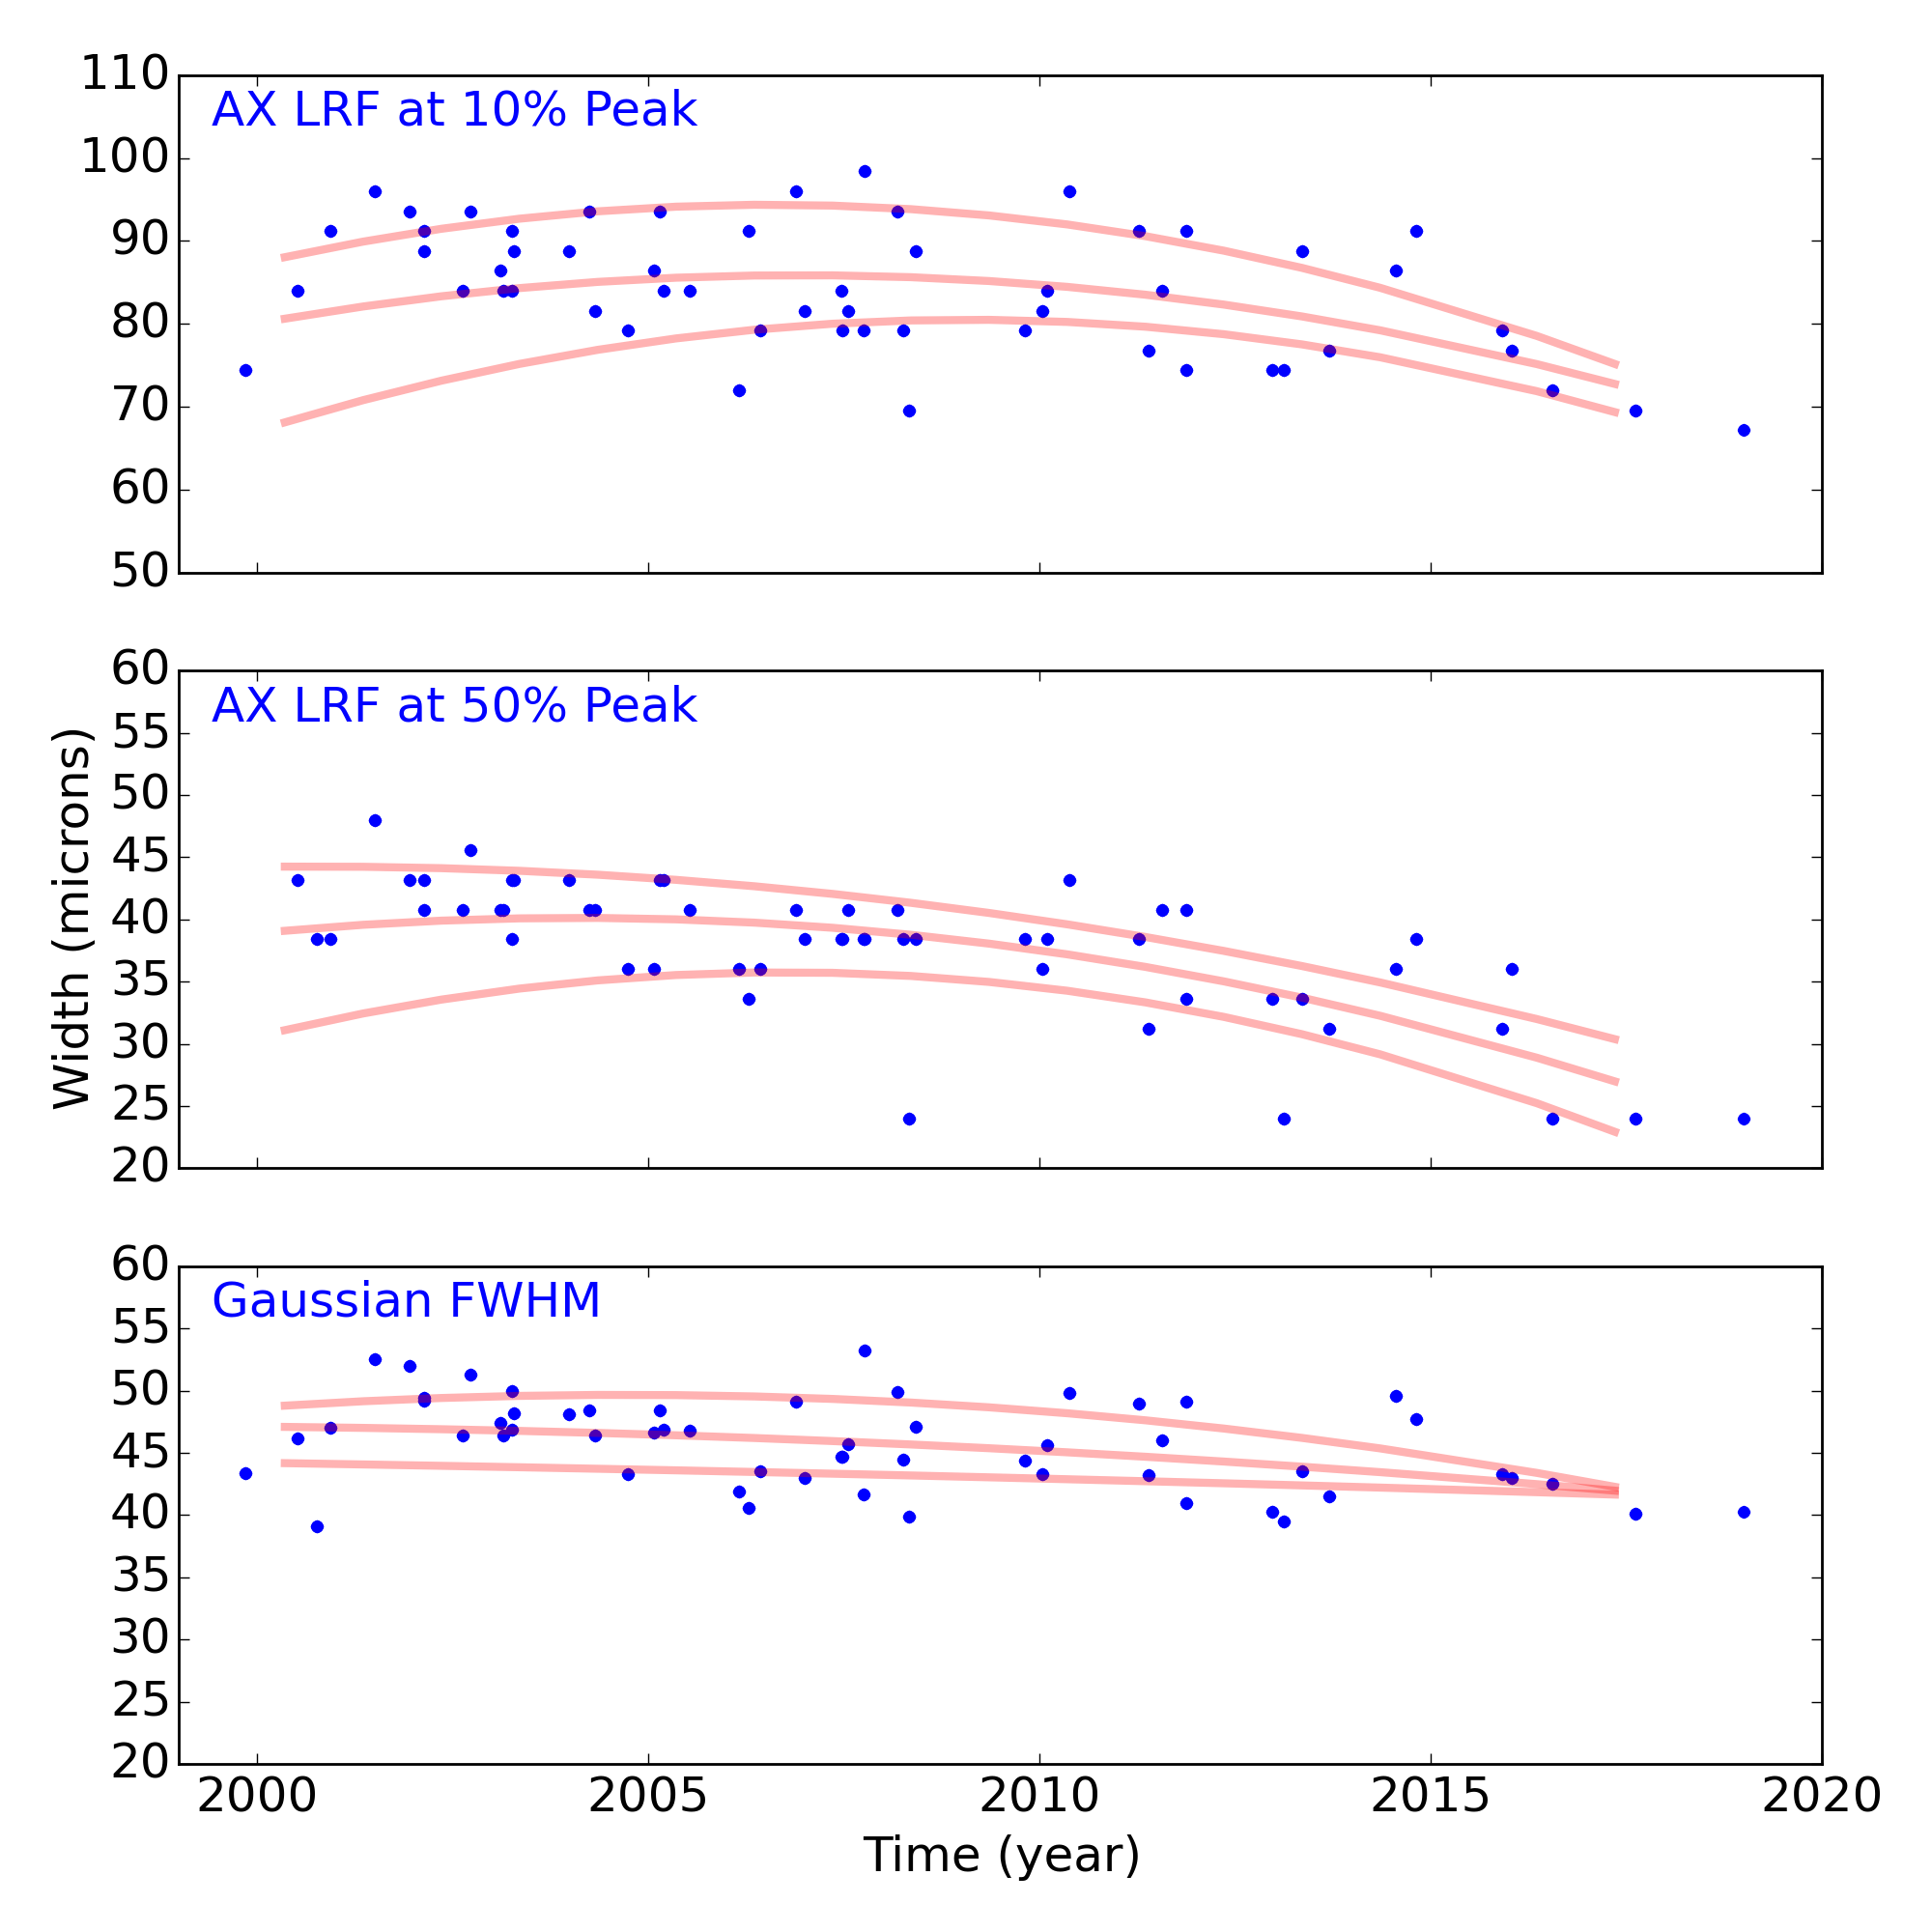
Grating Trends/Focus
We plot the width of the zero order streak of ACIS/HETG observations and the width of the zero order image for HRC/LETG observations of point sources. No significant defocusing trend is seen at this time. See Gratings Trends pages.
PCAD
ACA Trending
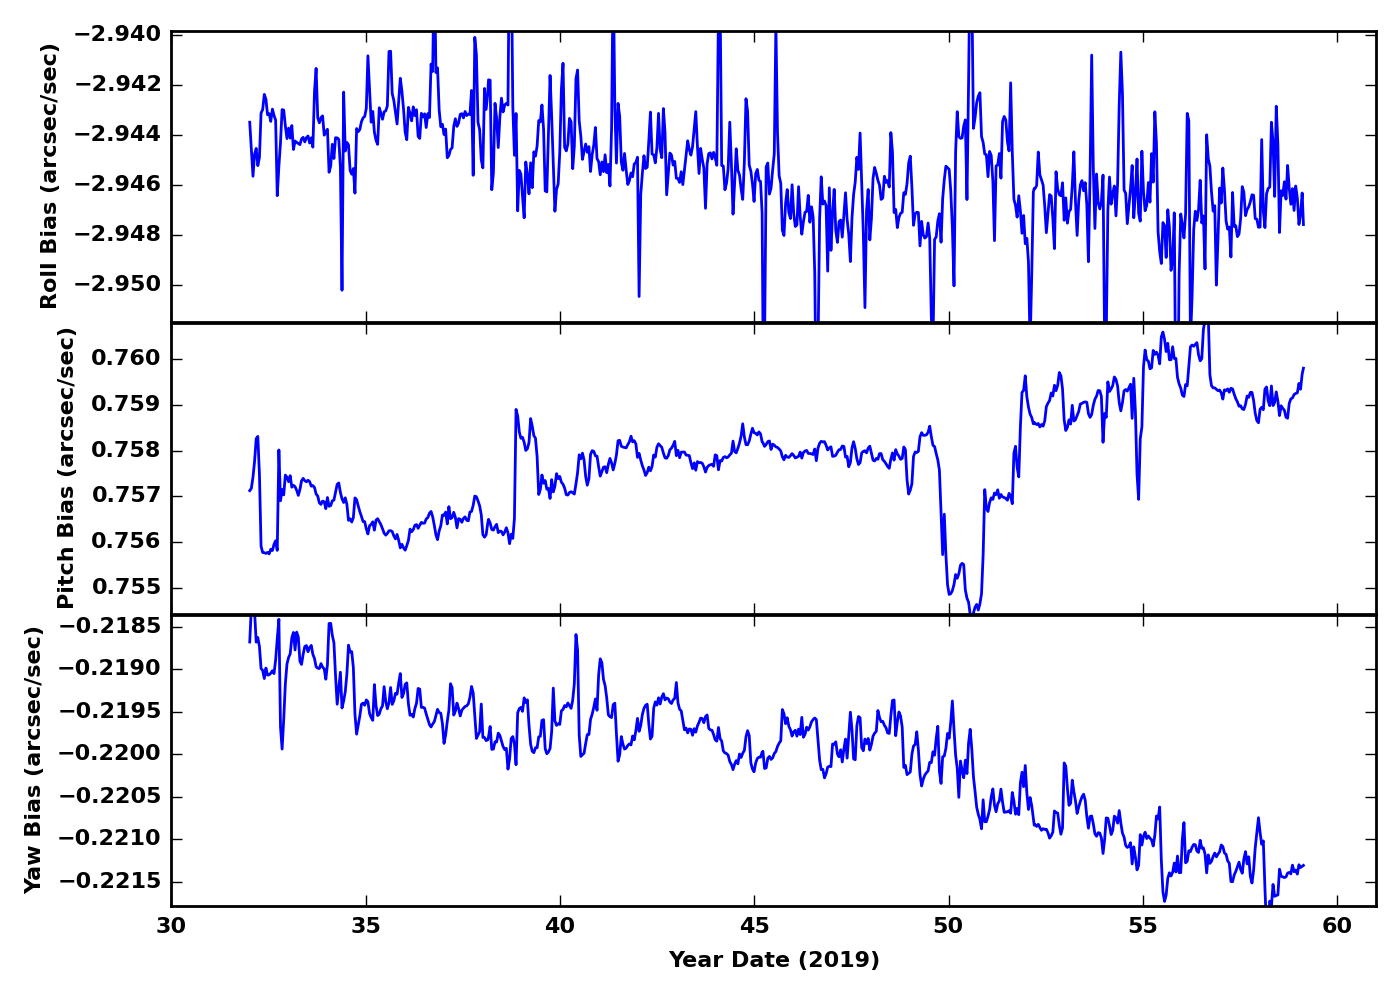
Gyro Bias Drift
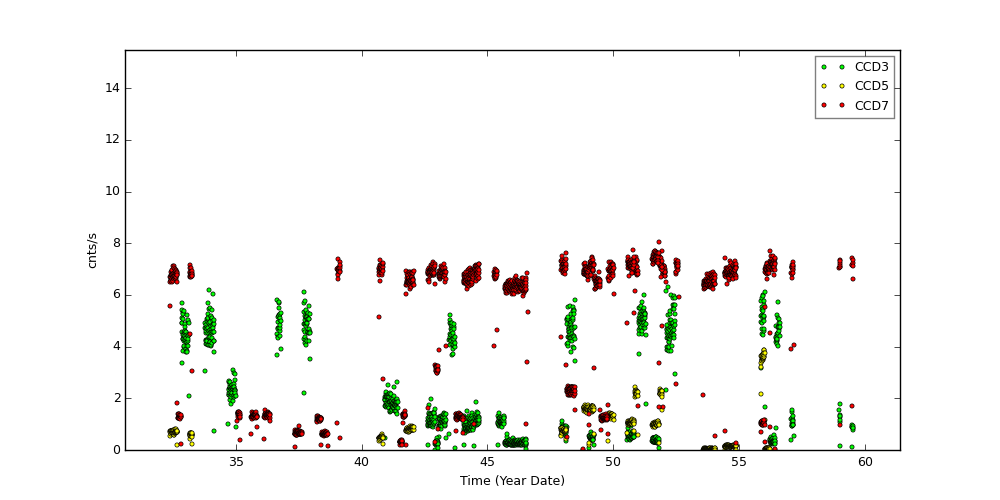
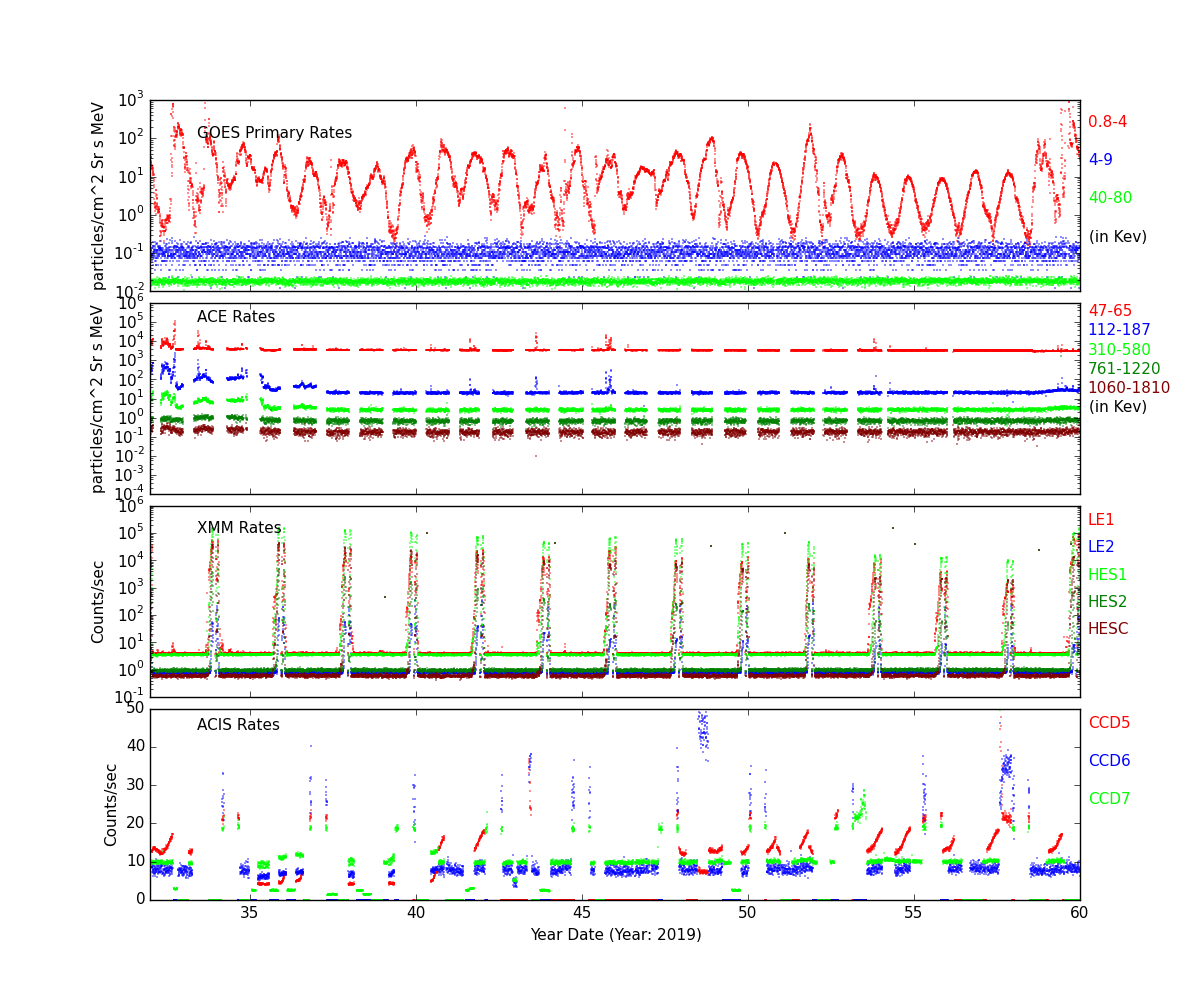
Radiation History
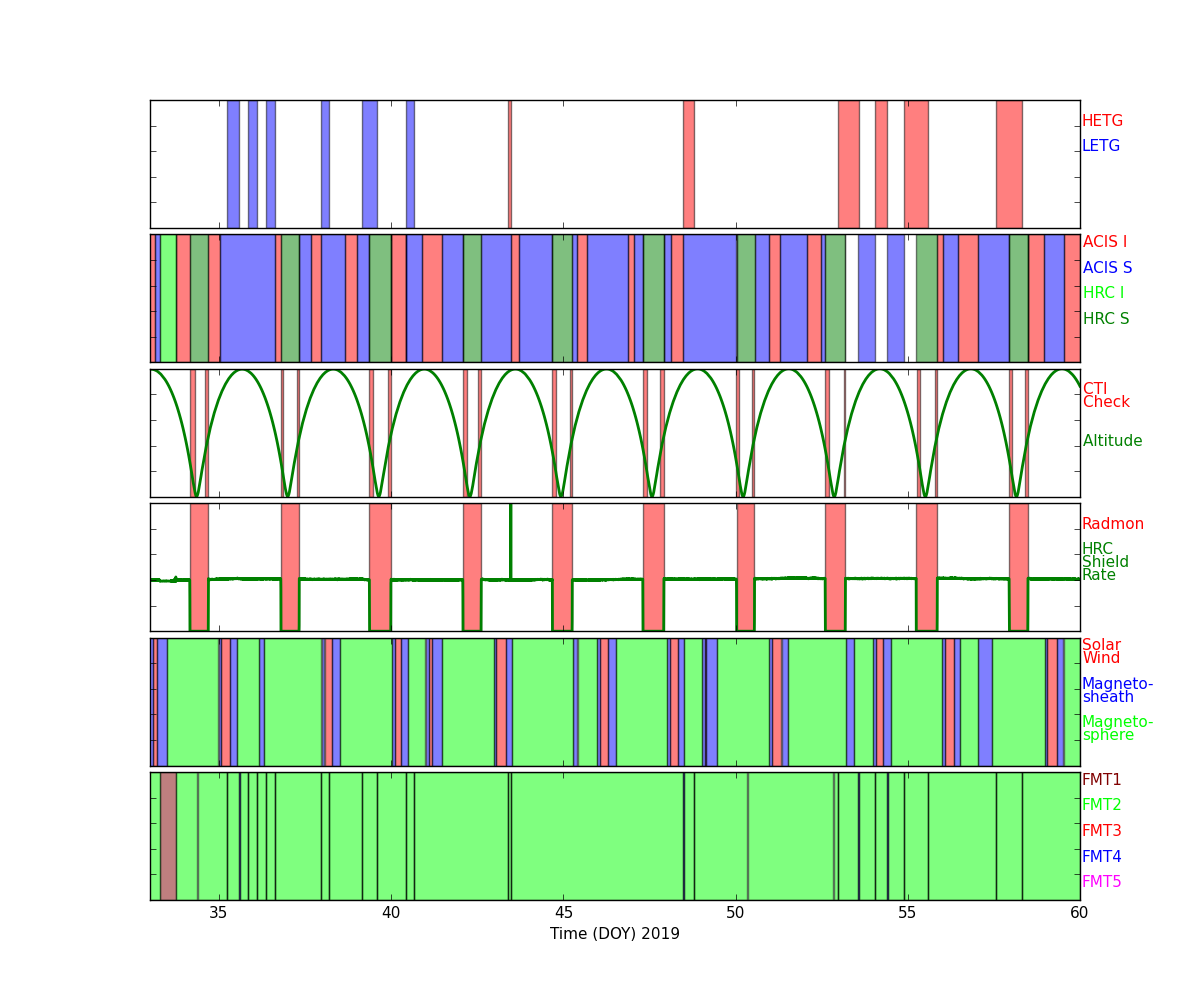
Radiation Count Rates of Feb 2019
Sun Spot History
Trending
Quarterly Trends
- HRC Temperature
| Previous Quarter | ||||||
| MSID | MEAN | RMS | DELTA/YR | DELTA/YR/YR | UNITS | DESCRIPTION |
| 2ceahvpt | 300.516 | 2.348 | 0.009+/-0.000 | -0.026+/-0.021 | K | CEA RADIATOR TEMPERATURE AT CENTER |
|---|---|---|---|---|---|---|
| 2chtrpzt | 297.040 | 2.341 | 0.009+/-0.000 | -0.015+/-0.021 | K | CENTRAL ELECTRONICS BOX TEMP |
| 2condmxt | 293.765 | 2.610 | 0.008+/-0.000 | 0.049+/-0.022 | K | CONDUIT -X FACE TEMPERATURE |
| 2dcentrt | 292.879 | 2.184 | 0.010+/-0.000 | 0.083+/-0.021 | K | DETECTOR HOUSING TEMP 2 |
| 2dtstatt | 293.594 | 2.150 | 0.009+/-0.000 | 0.101+/-0.023 | K | DETECTOR HOUSING TEMP 1 |
| 2fhtrmzt | 295.728 | 2.323 | 0.007+/-0.000 | 0.124+/-0.026 | K | FRONT END ELECTRONICS BOX TEMPERATURE |
| 2fradpyt | 291.449 | 2.386 | 0.006+/-0.000 | 0.136+/-0.027 | K | FRONT END ASSEMBLY +Y AT RADIATOR CENTER TEMP |
| 2pmt1t | 294.972 | 2.826 | 0.012+/-0.000 | 0.063+/-0.027 | K | PMT 1 TEMPERATURE |
| 2pmt2t | 297.395 | 3.034 | 0.011+/-0.000 | -0.012+/-0.027 | K | PMT 2 TEMPERATURE |
| 2uvlspxt | 288.859 | 2.536 | 0.011+/-0.000 | 0.093+/-0.024 | K | UV LIGHT SHIELD |
- HRC HK
| Previous Quarter | ||||||
| MSID | MEAN | RMS | DELTA/YR | DELTA/YR/YR | UNITS | DESCRIPTION |
| fe00atm | 22.249 | 1.802 | 0.006+/-0.000 | 0.108+/-0.021 | C | FRONT END TEMPERATURE RT2 |
|---|---|---|---|---|---|---|
| fepratm | 24.932 | 2.059 | 0.006+/-0.000 | 0.122+/-0.024 | C | FE PREAMP CARD TEMPERATURE |
| imhvatm | 31.932 | 1.743 | 0.007+/-0.000 | -0.088+/-0.016 | C | IMAGING DET HVPS TEMPERATURE |
| iminatm | 19.320 | 2.104 | 0.009+/-0.000 | 0.088+/-0.020 | C | IMAGING DETECTOR TEMPERATURE (INSIDE) |
| lvplatm | 28.286 | 1.780 | 0.007+/-0.000 | 0.010+/-0.016 | C | LVPS PLATE TEMP |
| prbscr | 1.558 | 0.035 | (-9.44+/-0.22)e-5 | -0.001+/-0.000 | AMP | PRIMARY BUS CURRENT |
| prbsvl | 27.390 | 0.292 | -0.002+/-0.000 | 0.039+/-0.001 | V | PRIMARY BUS VOLTAGE |
| smtratm | 5.716 | 0.153 | (4.87+/-0.03)e-4 | 0.003+/-0.000 | C | SELECTED MOTOR TEMPERATURE |
| sphvatm | 32.068 | 2.172 | 0.006+/-0.000 | -0.010+/-0.017 | C | SPECTROSCOPY DET HVPS TEMPERATURE |
| spinatm | 20.586 | 2.106 | 0.009+/-0.000 | 0.070+/-0.020 | C | SPECTROSCOPY DETECTOR TEMPERATURE (INSIDE) |
- PCAD Temperature
| Previous Quarter | ||||||
| MSID | MEAN | RMS | DELTA/YR | DELTA/YR/YR | UNITS | DESCRIPTION |
| aacccdpt | 261.677 | 2.673 | 0.008+/-0.000 | 0.009+/-0.014 | K | AC CCD TEMP (PRI) |
|---|---|---|---|---|---|---|
| aacccdrt | 305.399 | 1.624 | 0.008+/-0.000 | 0.008+/-0.015 | K | AC CCD TEMP (RDNT) |
| aach1t | 302.706 | 1.657 | 0.008+/-0.000 | 0.006+/-0.014 | K | AC HOUSING TEMP (ACH1) |
| aach2t | 302.759 | 1.662 | 0.008+/-0.000 | 0.011+/-0.014 | K | AC HOUSING TEMP (ACH2) |
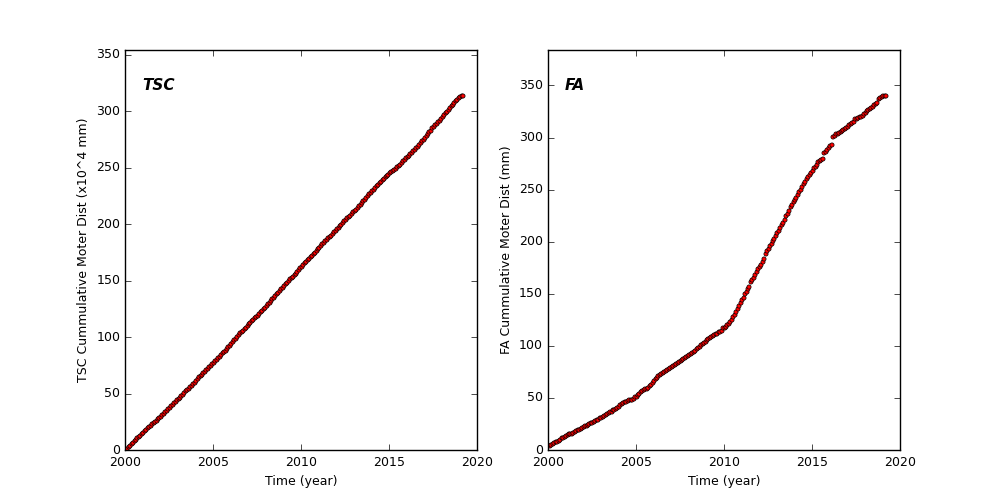
Spacecraft Motions
TSC and FA Cummulative Moter Distance
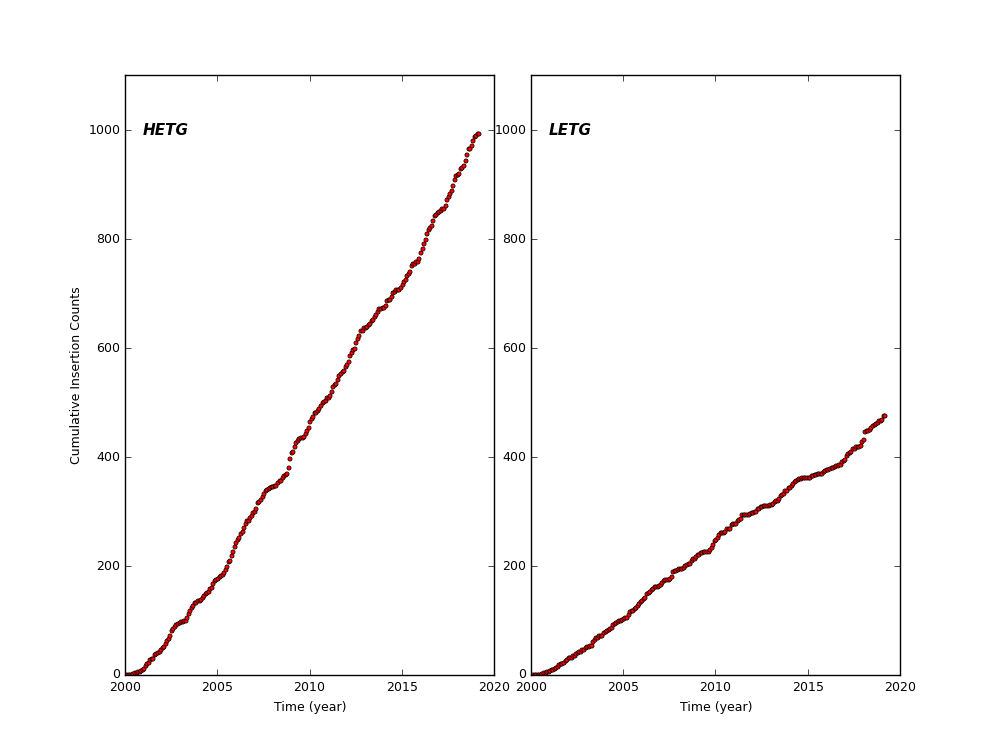
HETG and LETG Cummulative Insertion Counts
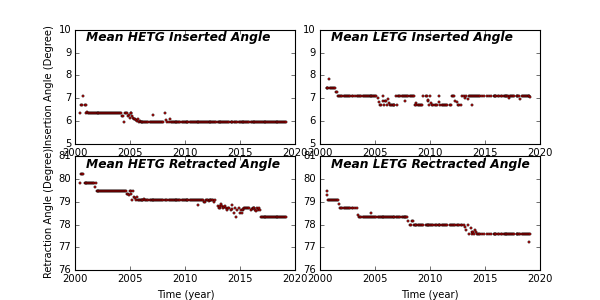
HETG/LETG Insertion/Retraction Angle
Reaction Wheel Rotations
