ACIS
ACIS DOSE Registered-Photon-Map
The steps we took to compute the dose map are;
- Level 1 Event files for a specified month are obtained from archive.
- Image data including I2, I3, S2, S3 CCDs are extracted from all event files.
- All the extracted image data were merged to create a month long exposure map for the month.
- The exposure map is opened with ds9, and check a distribution of count rates against energy. From this, estimate the upper threshold value. Any events beyond this upper threshold are assumed erroneous events such as bad pixels.
- Using this upper threshold, the data is filtered, and create a cleaned exposure map for the month.
- The exposure map from each month from the Sep 1999 is added up to create a cumulative exposure map for each month.
- Using fimgstatistic, we compute count rate statistics for each CCDs.
- For observations with high data drop rates (e.g., Crab nebula, Cas A), we corrected the observations by adding events.
Please check more detail plots at Telemetered Photon Dose Trend page.
)
)
)
Statistics:
# IMAGE     NPIX     MEAN        RMS        MIN     MAX
ACIS_jan19 6004901       7.764         12.435           0.0     2199


I2 node 0  262654	9.373582	3.919209	0.0	 83.0
I2 node 1  262654	9.998715	5.748476	0.0	1965.0
I2 node 2  262654	9.742765	3.921385	0.0	114.0
I2 node 3  262654	9.722067	4.673465	0.0	1091.0

I3 node 0  262654	10.507078	6.101518	0.0	2199.0
I3 node 1  262654	10.585112	5.610241	0.0	168.0
I3 node 2  262654	10.113654	3.973637	0.0	126.0
I3 node 3  262654	10.060734	4.256798	0.0	717.0

S2 node 0  262654	9.164687	9.911055	0.0	1595.0
S2 node 1  262654	9.532341	7.768655	0.0	1074.0
S2 node 2  262654	9.879266	7.820398	0.0	643.0
S2 node 3  262654	10.139860	8.190752	0.0	687.0

S3 node 0  262654	10.940020	9.996547	0.0	253.0
S3 node 1  262654	12.507049	11.915981	0.0	734.0
S3 node 2  262654	11.937630	13.119647	0.0	295.0
S3 node 3  262654	9.513620	5.128163	0.0	257.0
)
)
)
Statistics:
 IMAGE     NPIX      MEAN        RMS           MIN      MAX
ACIS_total   6004901       2266.221         2931.526           0.0   127253


I2 node 0  262654	1962.769799	389.405085	419.0	11200.0
I2 node 1  262654	2065.582809	543.512773	433.0	87531.0
I2 node 2  262654	2095.864699	444.080588	433.0	11167.0
I2 node 3  262654	2101.163180	542.913246	419.0	28536.0

I3 node 0  262654	2226.356417	550.498173	412.0	8815.0
I3 node 1  262654	2307.887009	1684.363615	437.0	55150.0
I3 node 2  262654	2034.066676	377.598085	410.0	11543.0
I3 node 3  262654	2024.885152	405.921471	367.0	31784.0

S2 node 0  262654	2636.749207	413.255854	1489.0	21831.0
S2 node 1  262654	2795.447767	623.982909	1638.0	15390.0
S2 node 2  262654	3090.425908	631.718677	2081.0	27736.0
S2 node 3  262654	3040.335372	482.582778	1838.0	56845.0

S3 node 0  262654	4665.495098	2098.053529	2054.0	27217.0
S3 node 1  262654	5892.999304	2240.463629	0.0	29077.0
S3 node 2  262654	4655.108904	1235.549821	1992.0	25098.0
S3 node 3  262654	3595.459497	650.854604	2206.0	24659.0
)
|
)
|
)
|
)
|
| Oct 2018 | Jul 2018 | Apr 2018 | Jan 2018 |
|---|
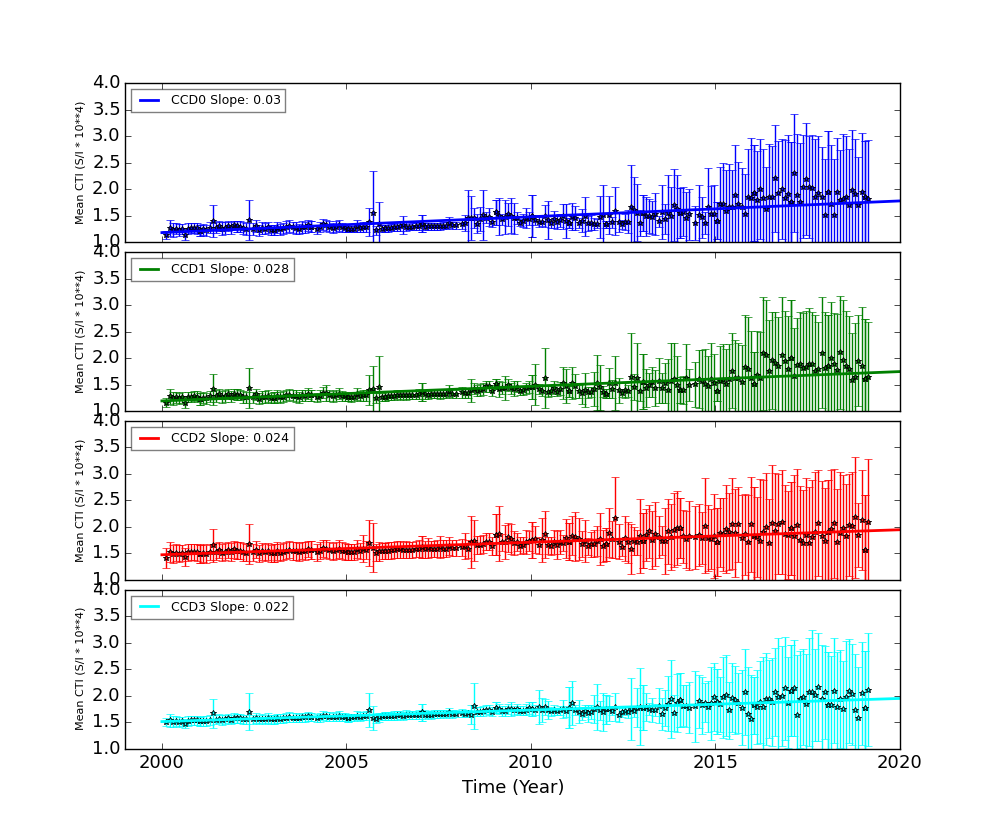
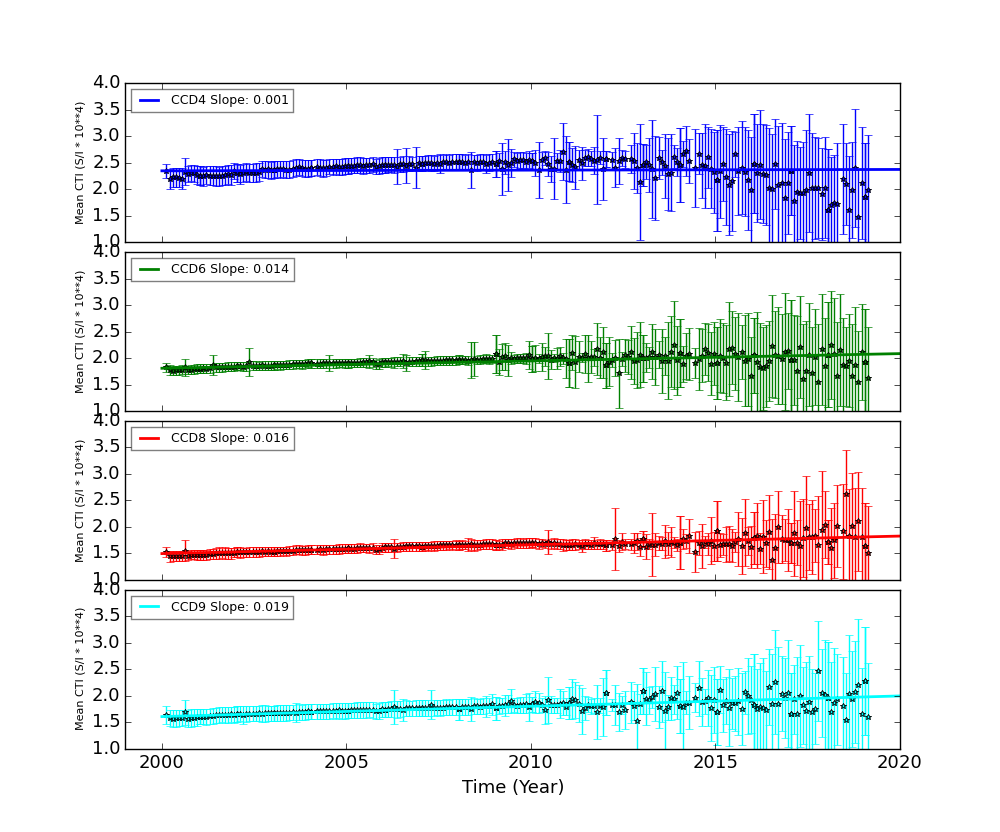
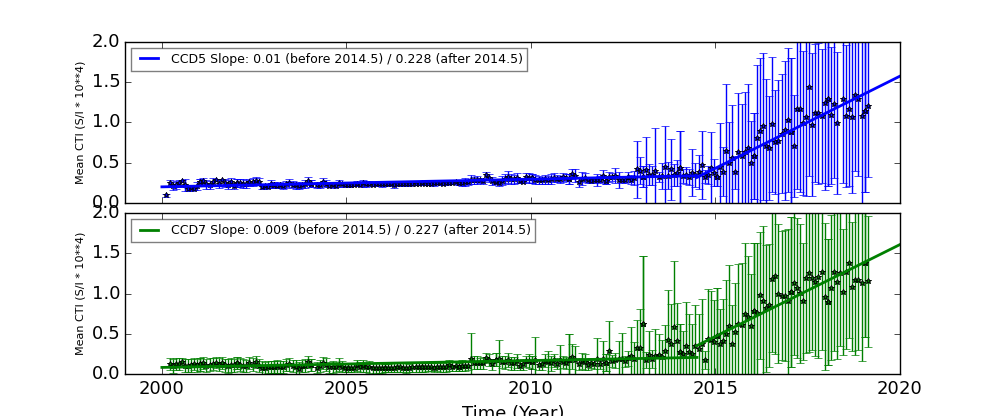
The Mean Detrended CTI
We report CTIs with a refined data definition. CTIs were computed for the temperature dependency corrected data. Please see CTI page for detailed explanation. CTI's are computed for Mn K alpha, and defined as slope/intercept x10^4 of row # vs ADU. Data file: here
Imaging CCDs
Spectral CCDs
Backside CCDs
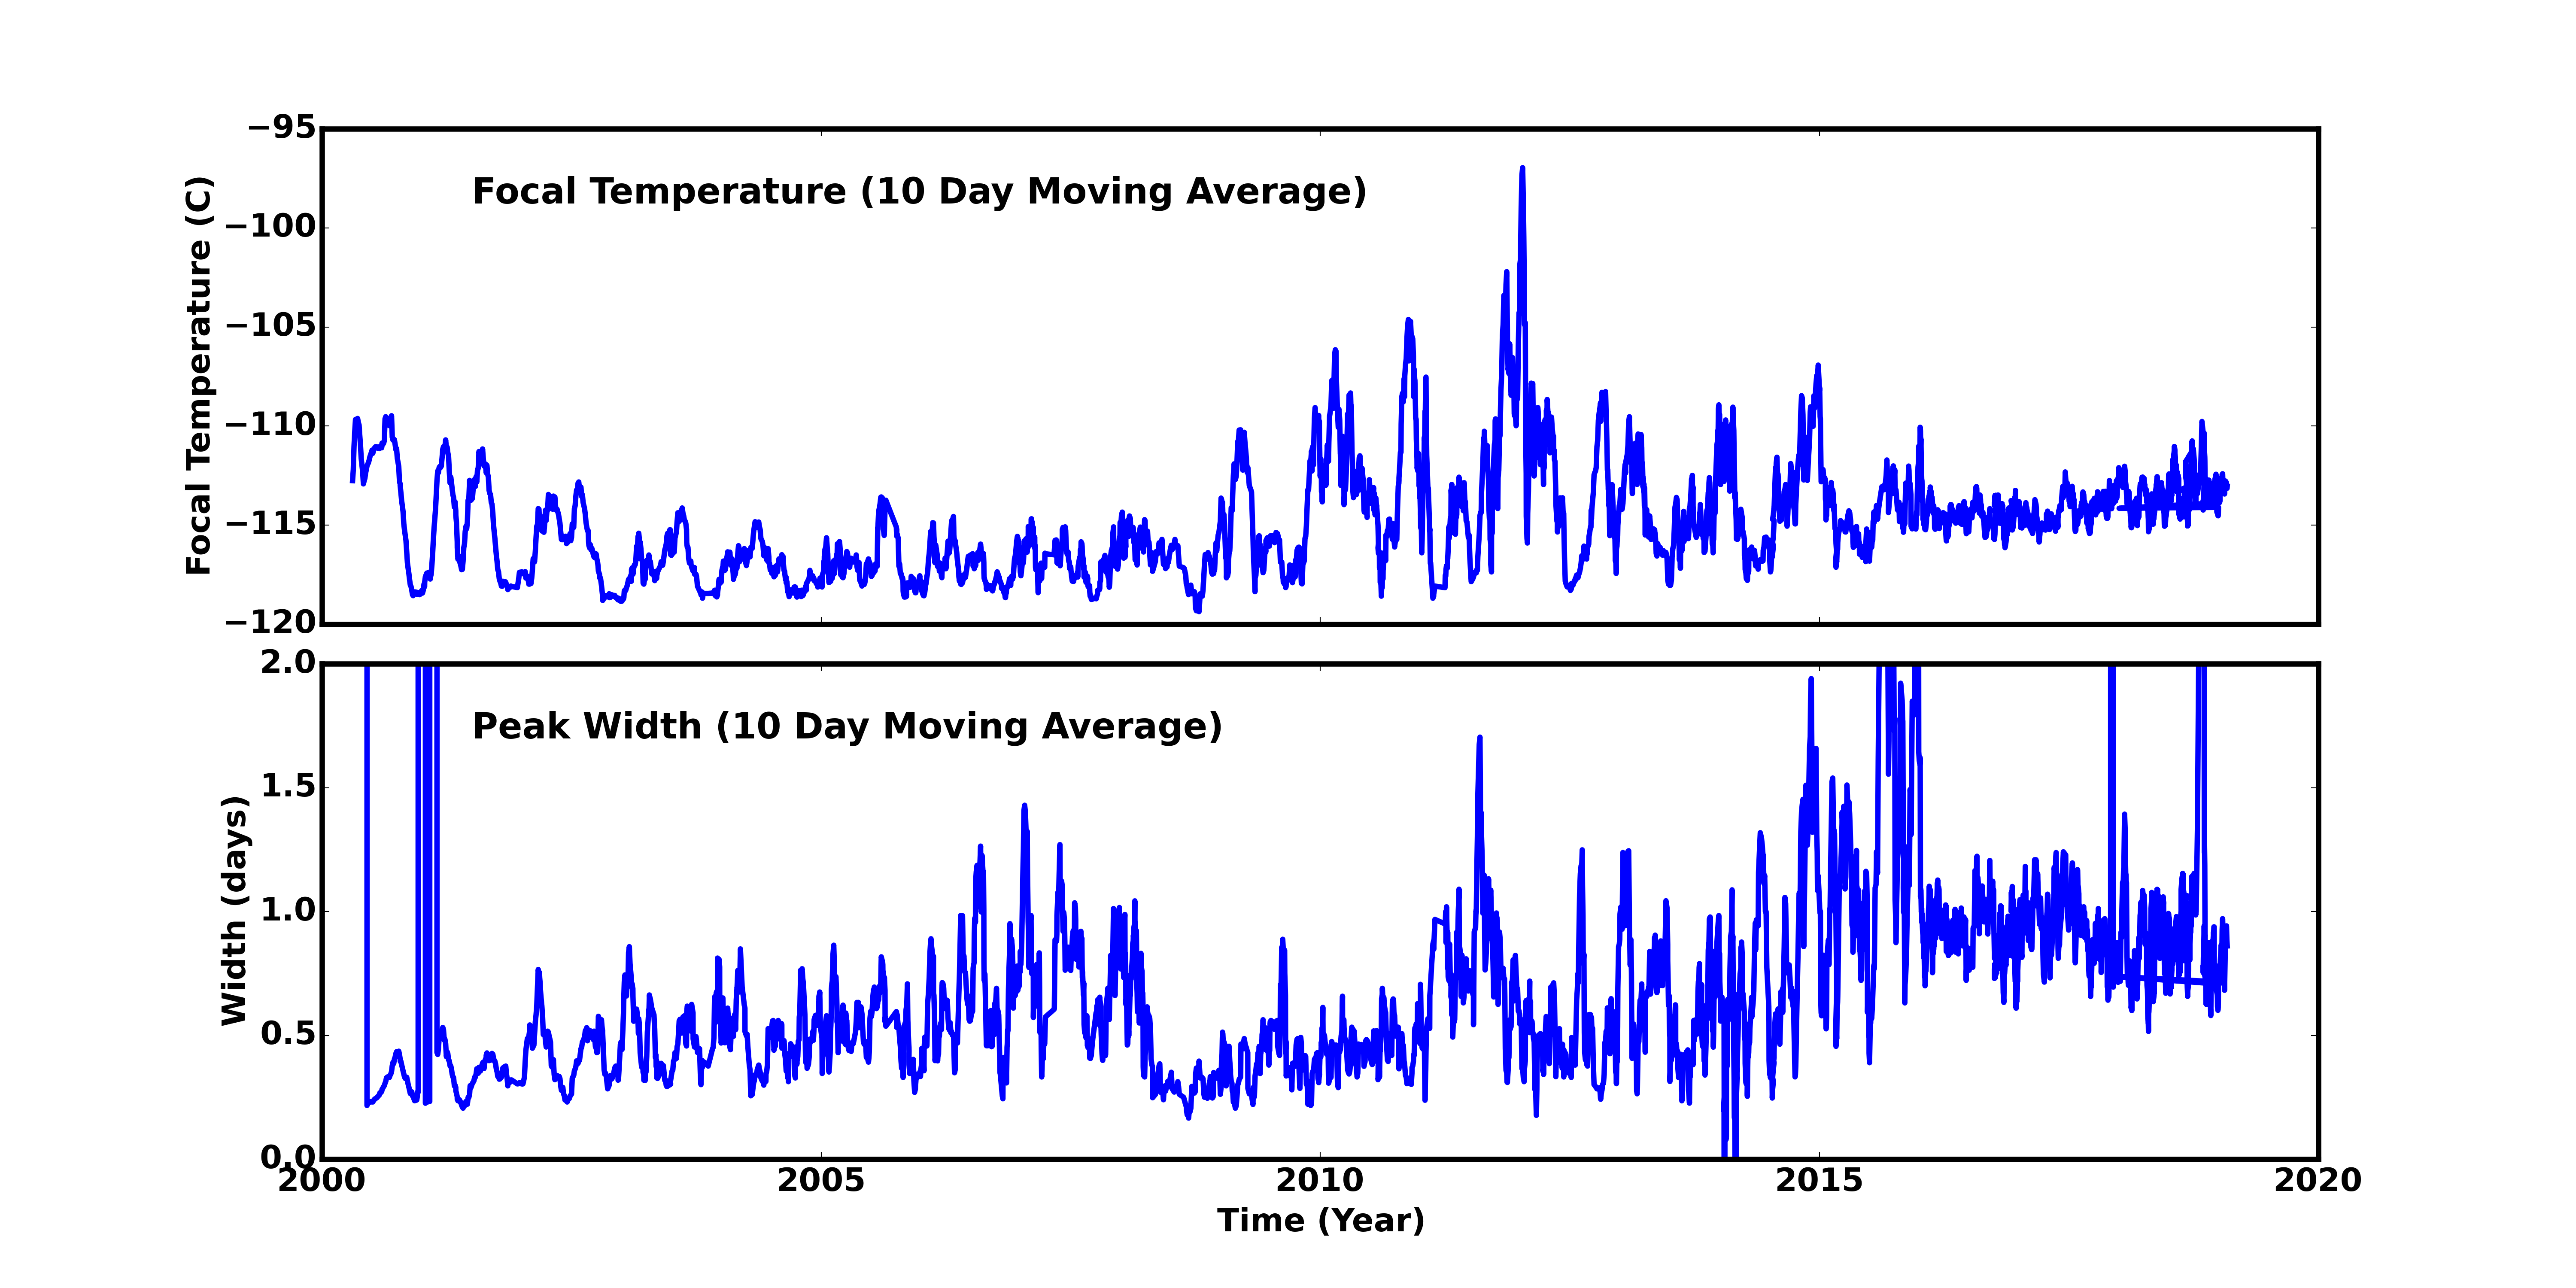
Focal Plane Temperature
Jan 2019 Focal Temperature
| The Mean (max) FPT: | |
|---|---|
| -112.98 | +/- 1.57 C |
| Mean Width: | |
| 0.82 | +/- 0.34 days |
Averaged Focal Plane Temperature
We are using 10 period moving averages to show trends of peak temperatures and peak widths. Note, the gaps in the width plot are due to missing/corrupted data.
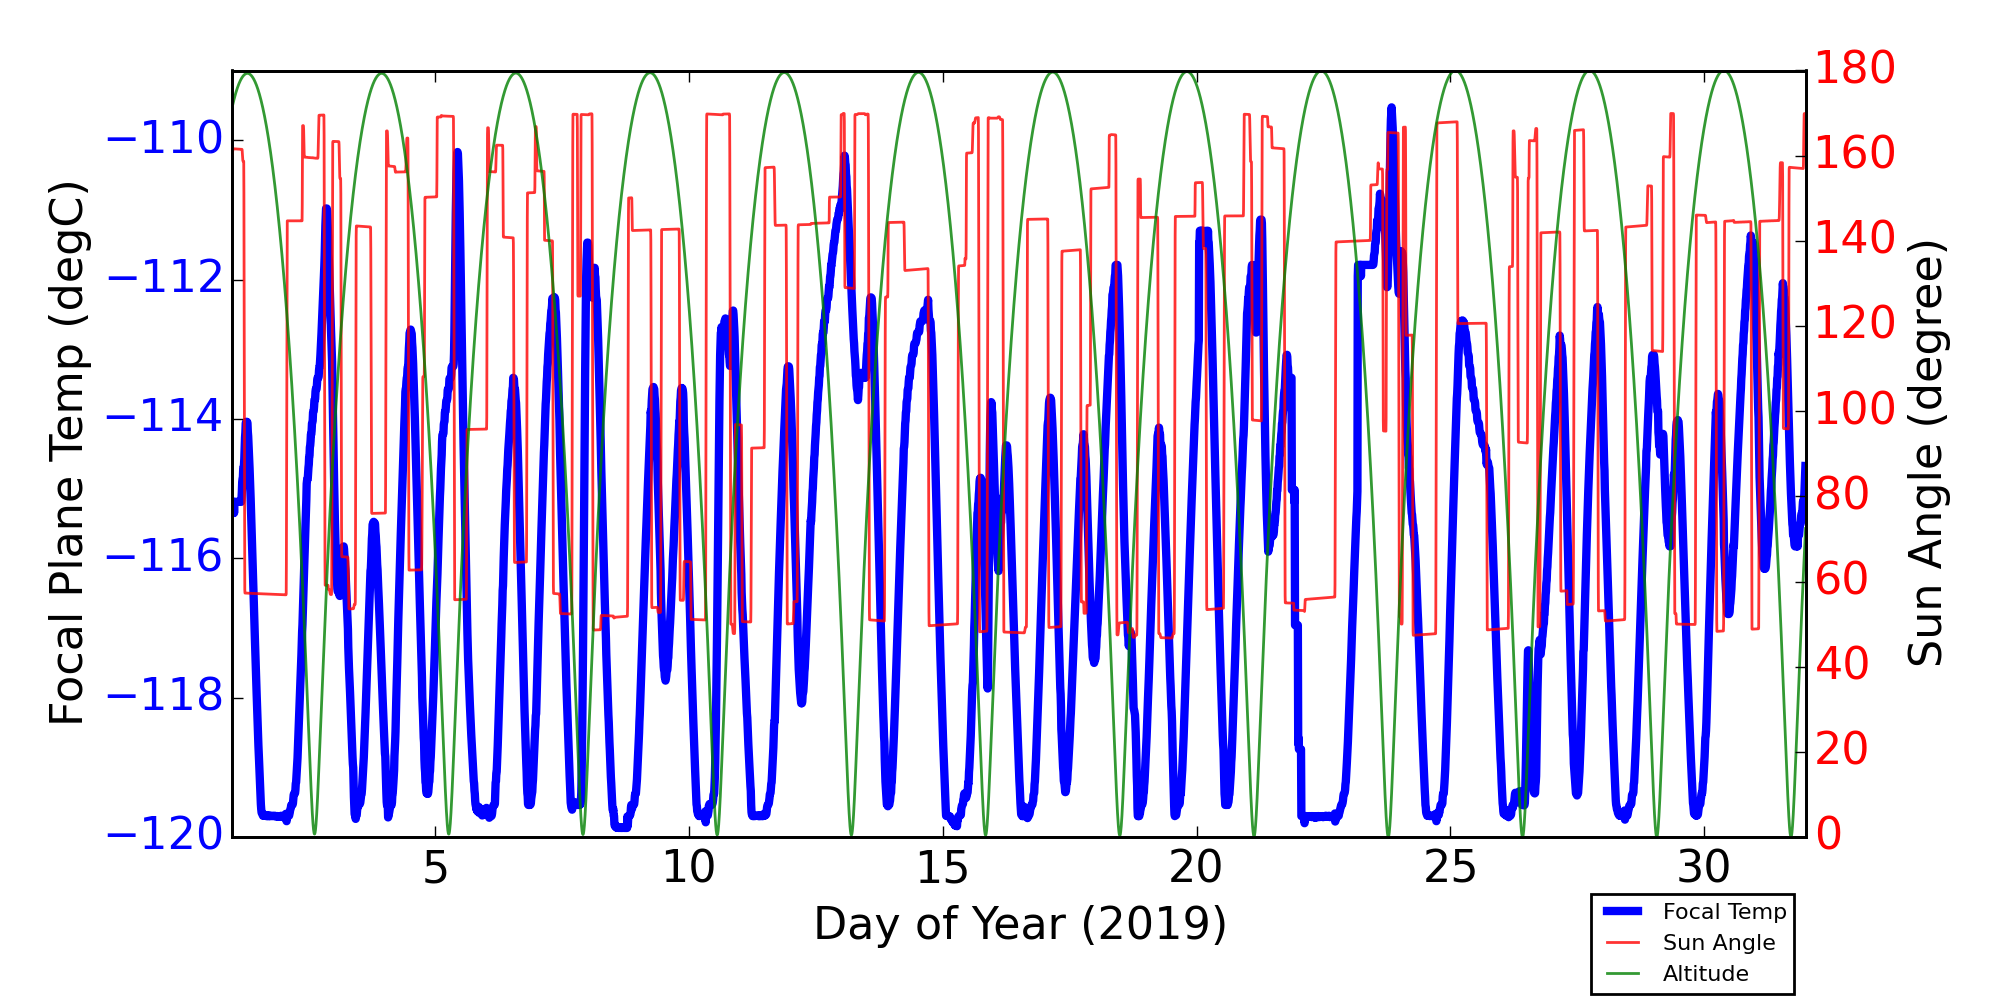
Focal Plane Temperature, Sun Angle and Altitude
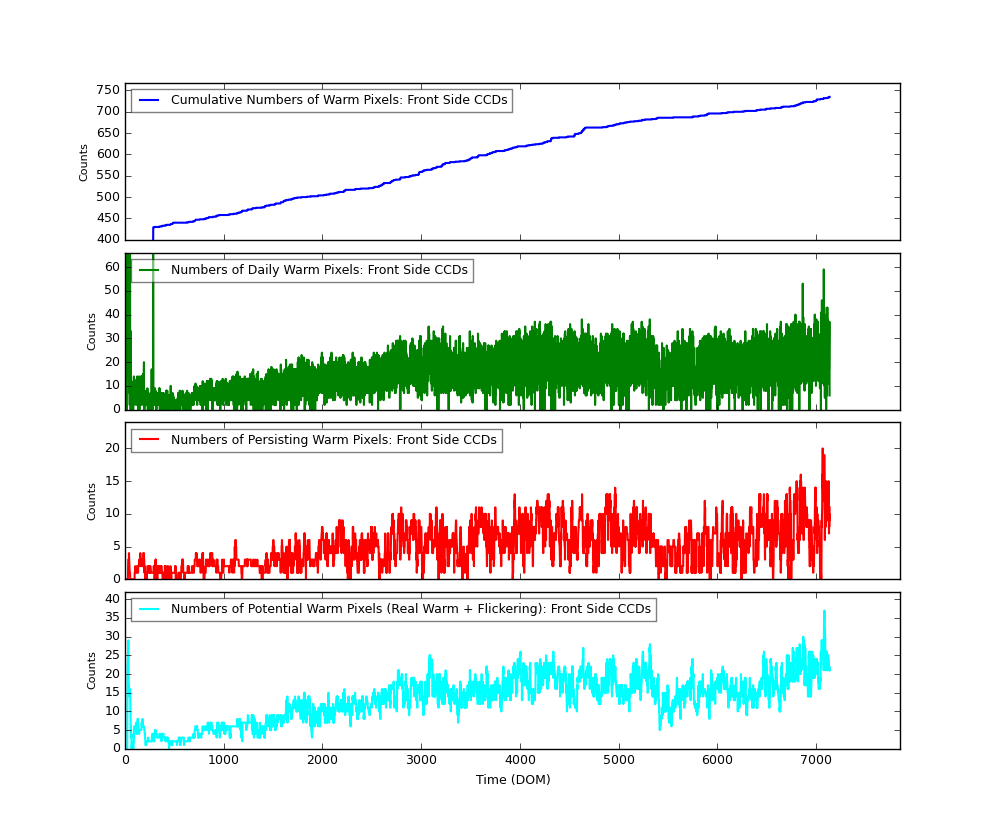
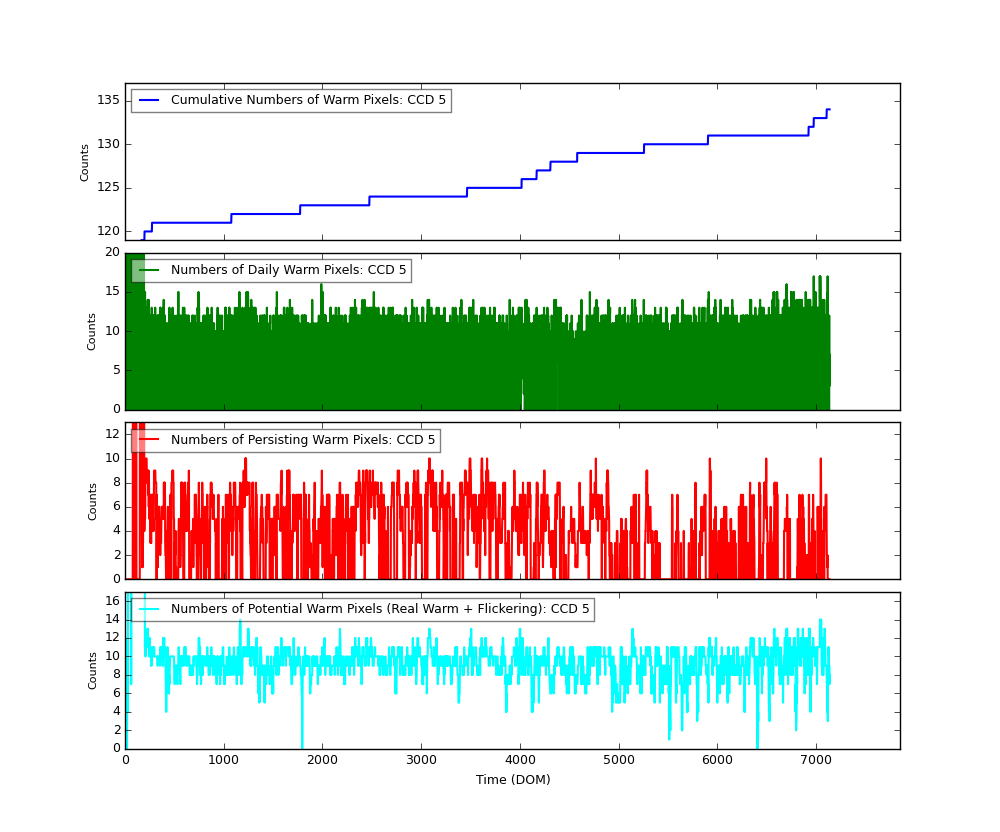
Bad Pixels
The plots below were generated with a new warm pixel finding script. Please see Acis Bad Pixel Page for details.
Front Side CCDs
Back Side CCD (CCD5)
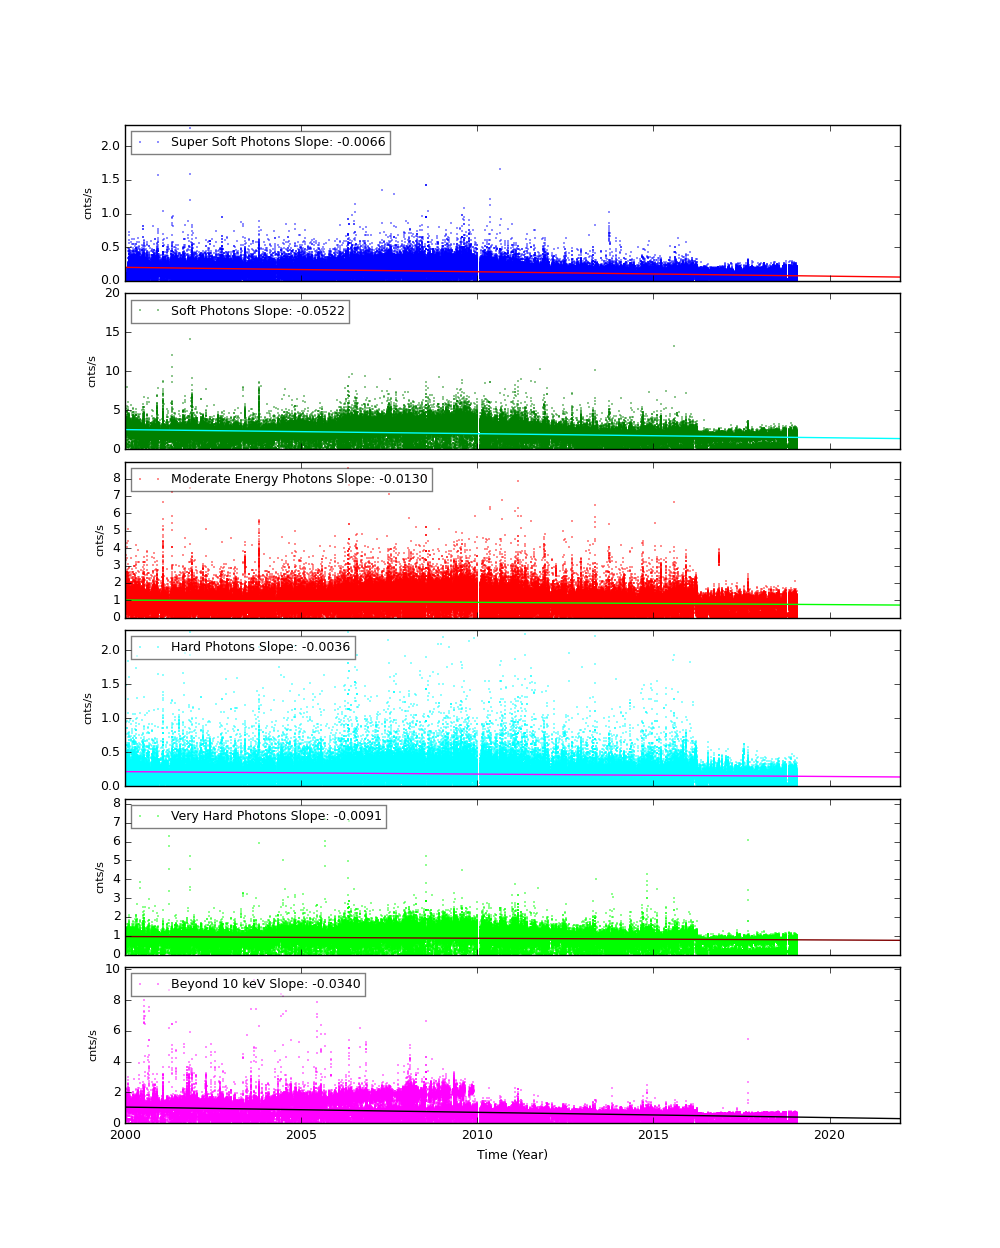
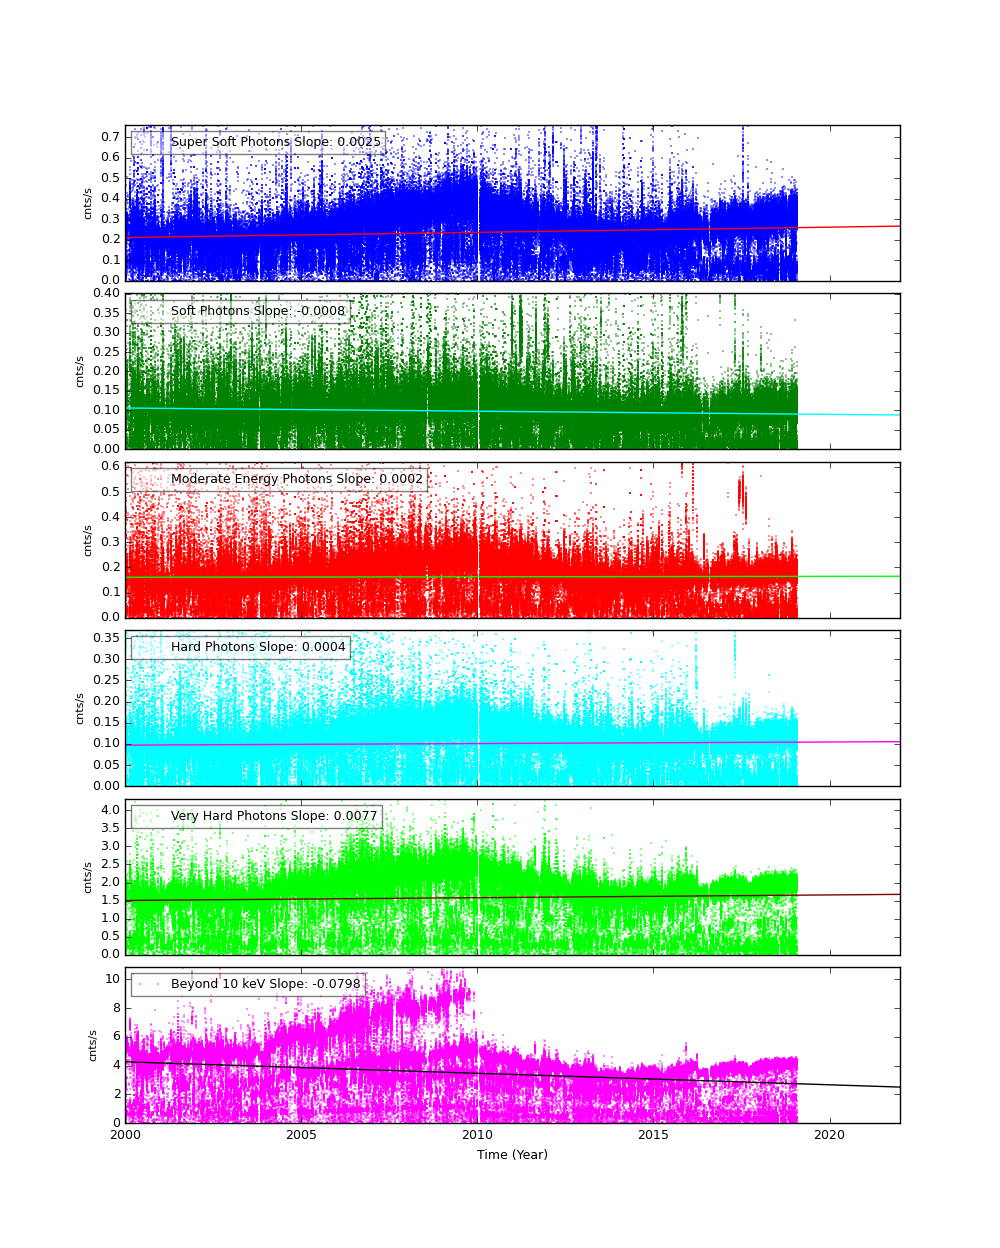
Science Instrument Background Rates
| Name | Low (keV) | High(KeV) | Description |
|---|---|---|---|
| SSoft | 0.00 | 0.50 | Super soft photons |
| Soft | 0.50 | 1.00 | Soft photons |
| Med | 1.00 | 3.00 | Moderate energy photons |
| Hard | 3.00 | 5.00 | Hard Photons |
| Harder | 5.00 | 10.00 | Very Hard photons |
| Hardest | 10.00 | Beyond 10 keV |
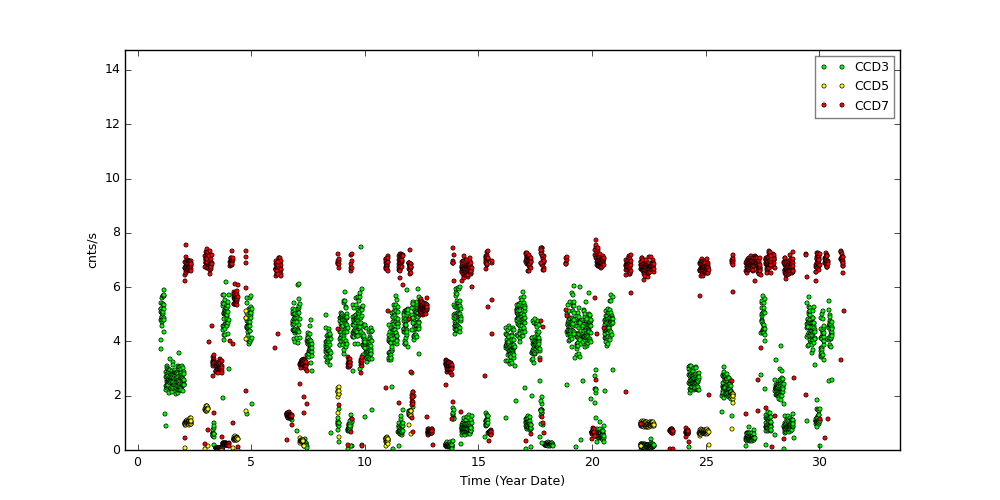
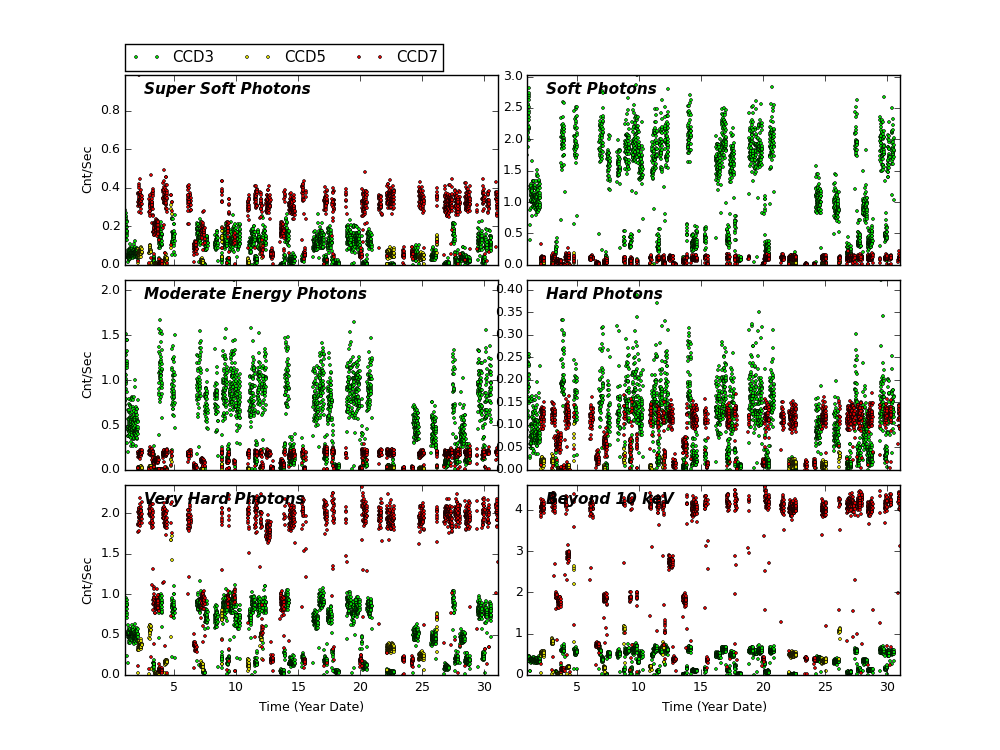
The following three plots show trends of SIB from year 2000. CCDs shown here are CCD3, CCD5, and CCD7. Fitted lines are linear fit after eliminating extreme outliers. For >10 keV plots, 2 lines are fit. One is with a 13 keV filter, and another without.
CCD 3
CCD 5
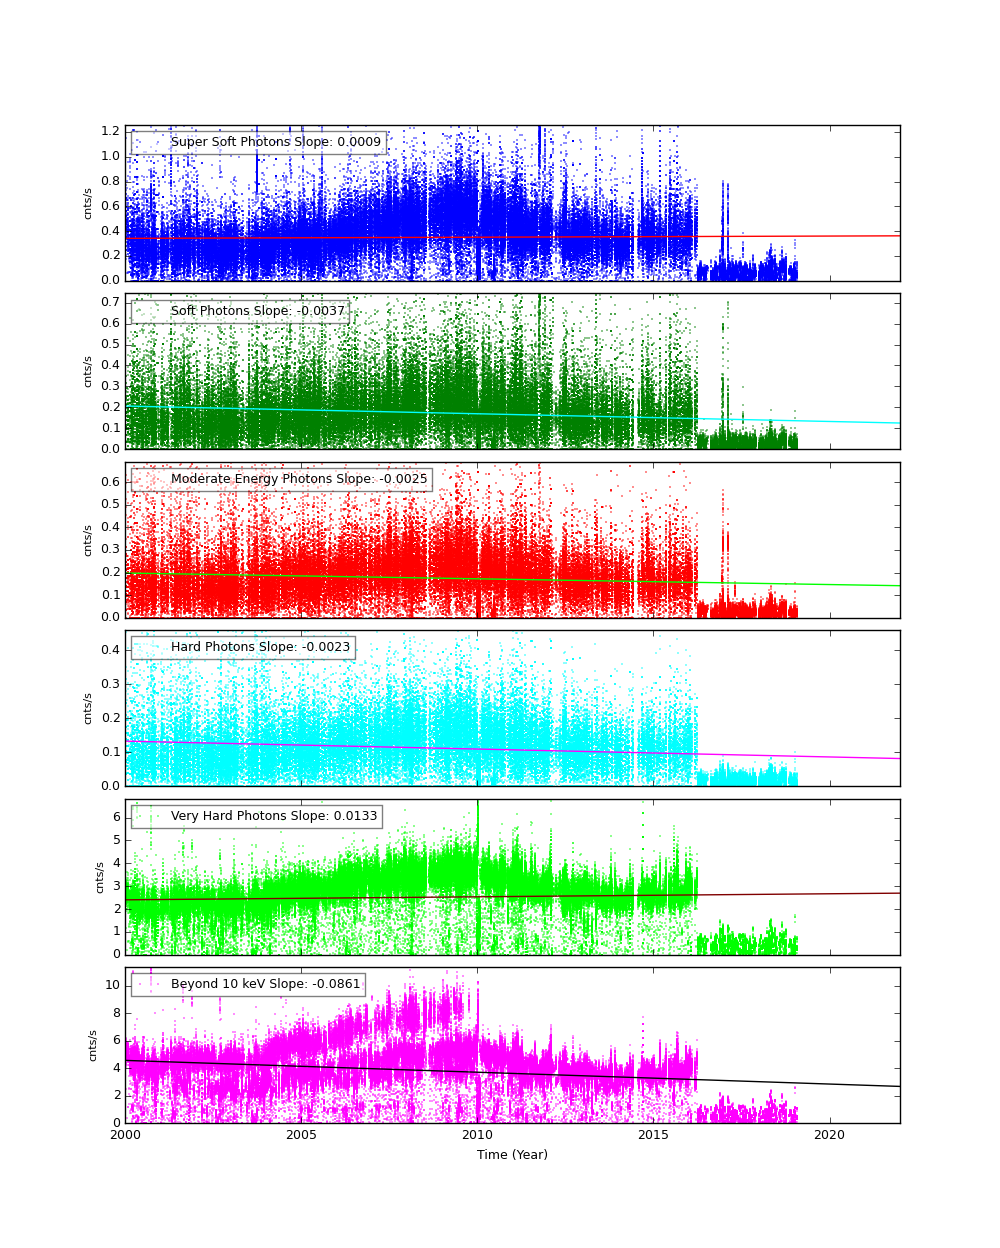
CCD 7
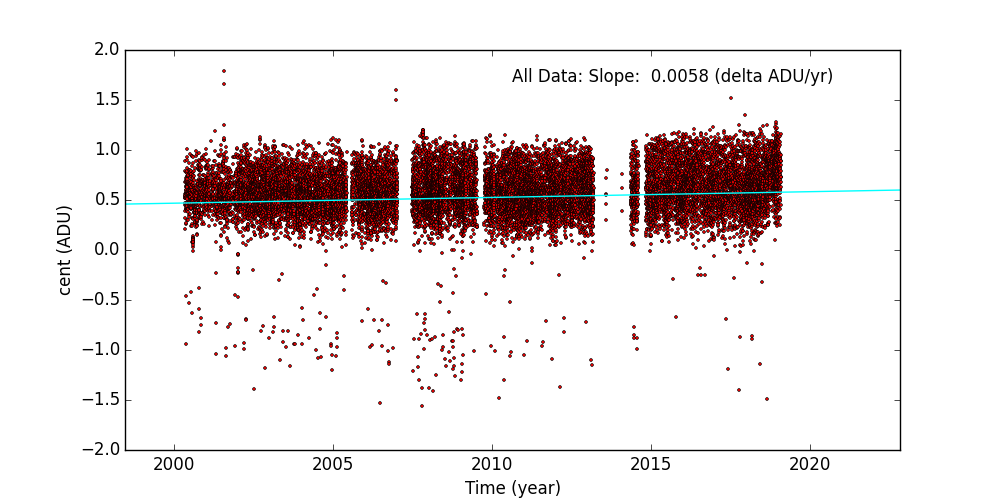
ACIS Corner Pixels
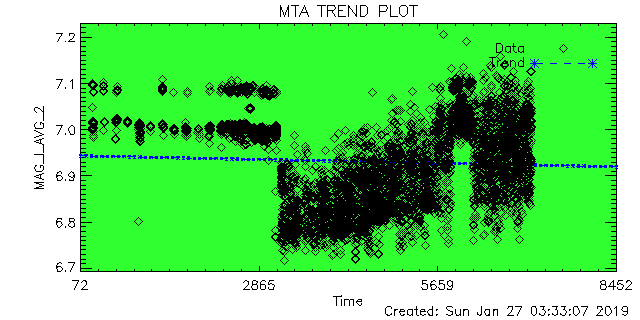
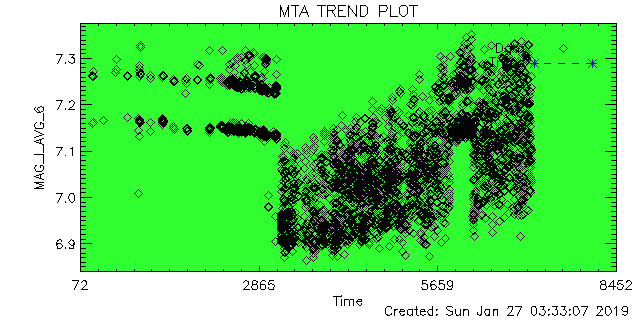
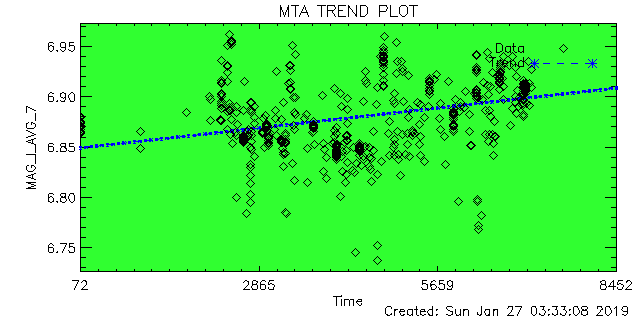
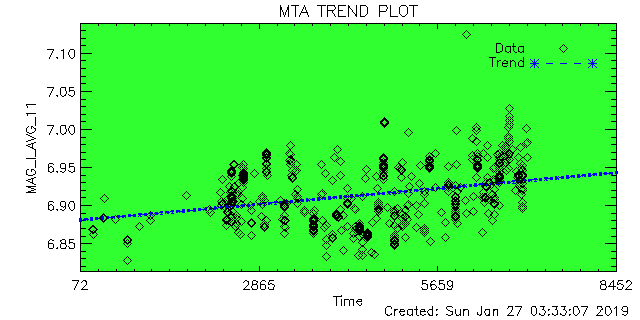
We plot the average corner pixel centroid slope and mean for ACIS observations. Separate plots are shown for FAINT MODE (3X3) and VFAINT MODE (5X5) observations. Metric is the centroid of a Gaussian fit to the histogram of corner pixel PHA values of detected events. Plus signs are FAINT observations, diamonds are VFAINT observations, and boxes are VFAINT observations with centroids computed using only the corner pixels of a 3X3 event island (referred to as AFAINT). We see a very small upward trend.
CCD: I3
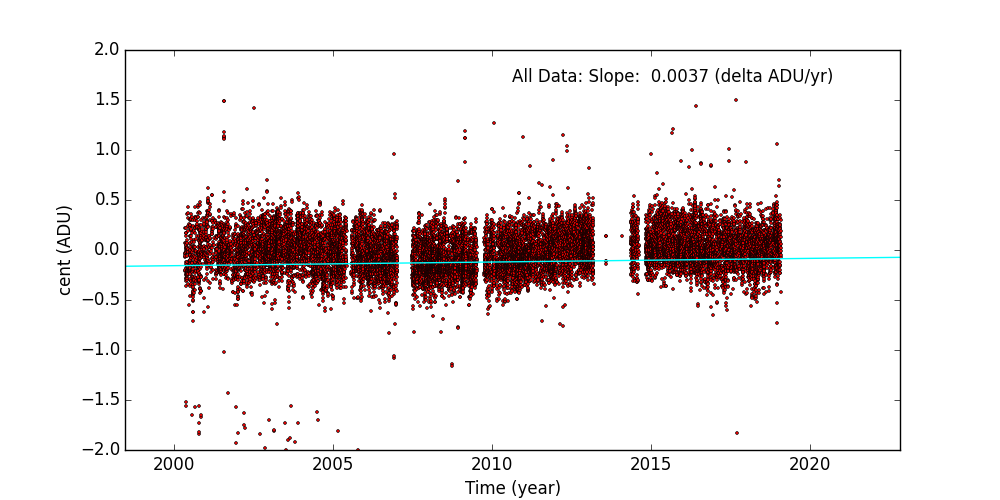
CCD: S3
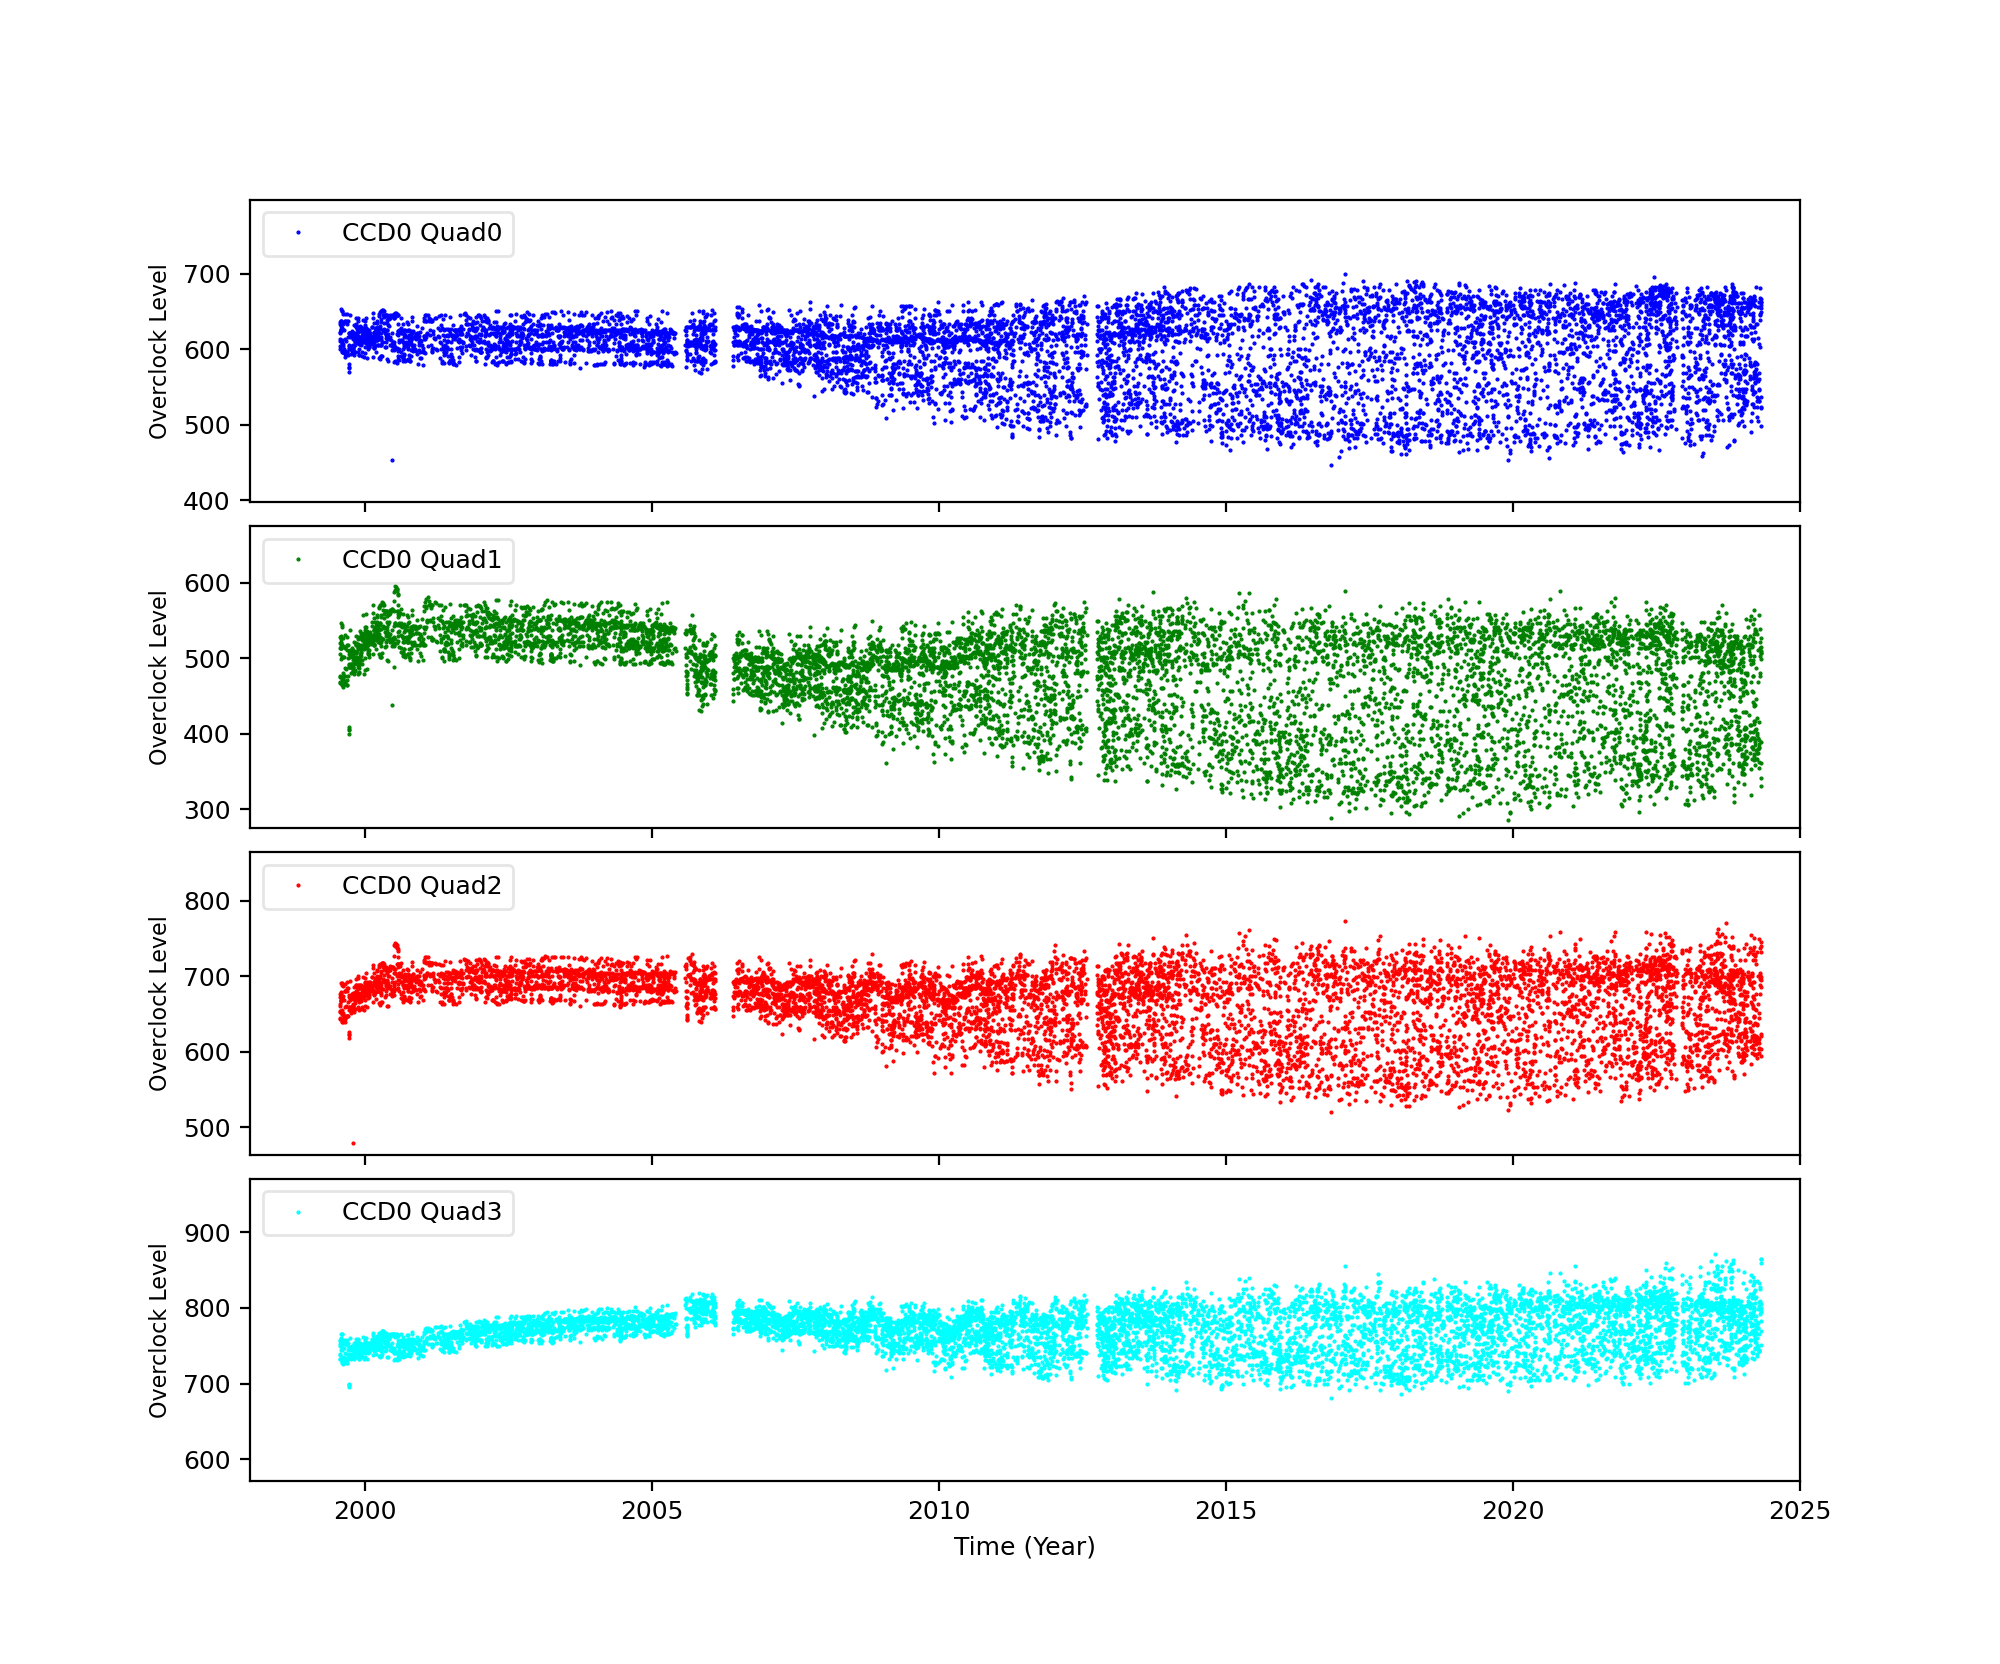
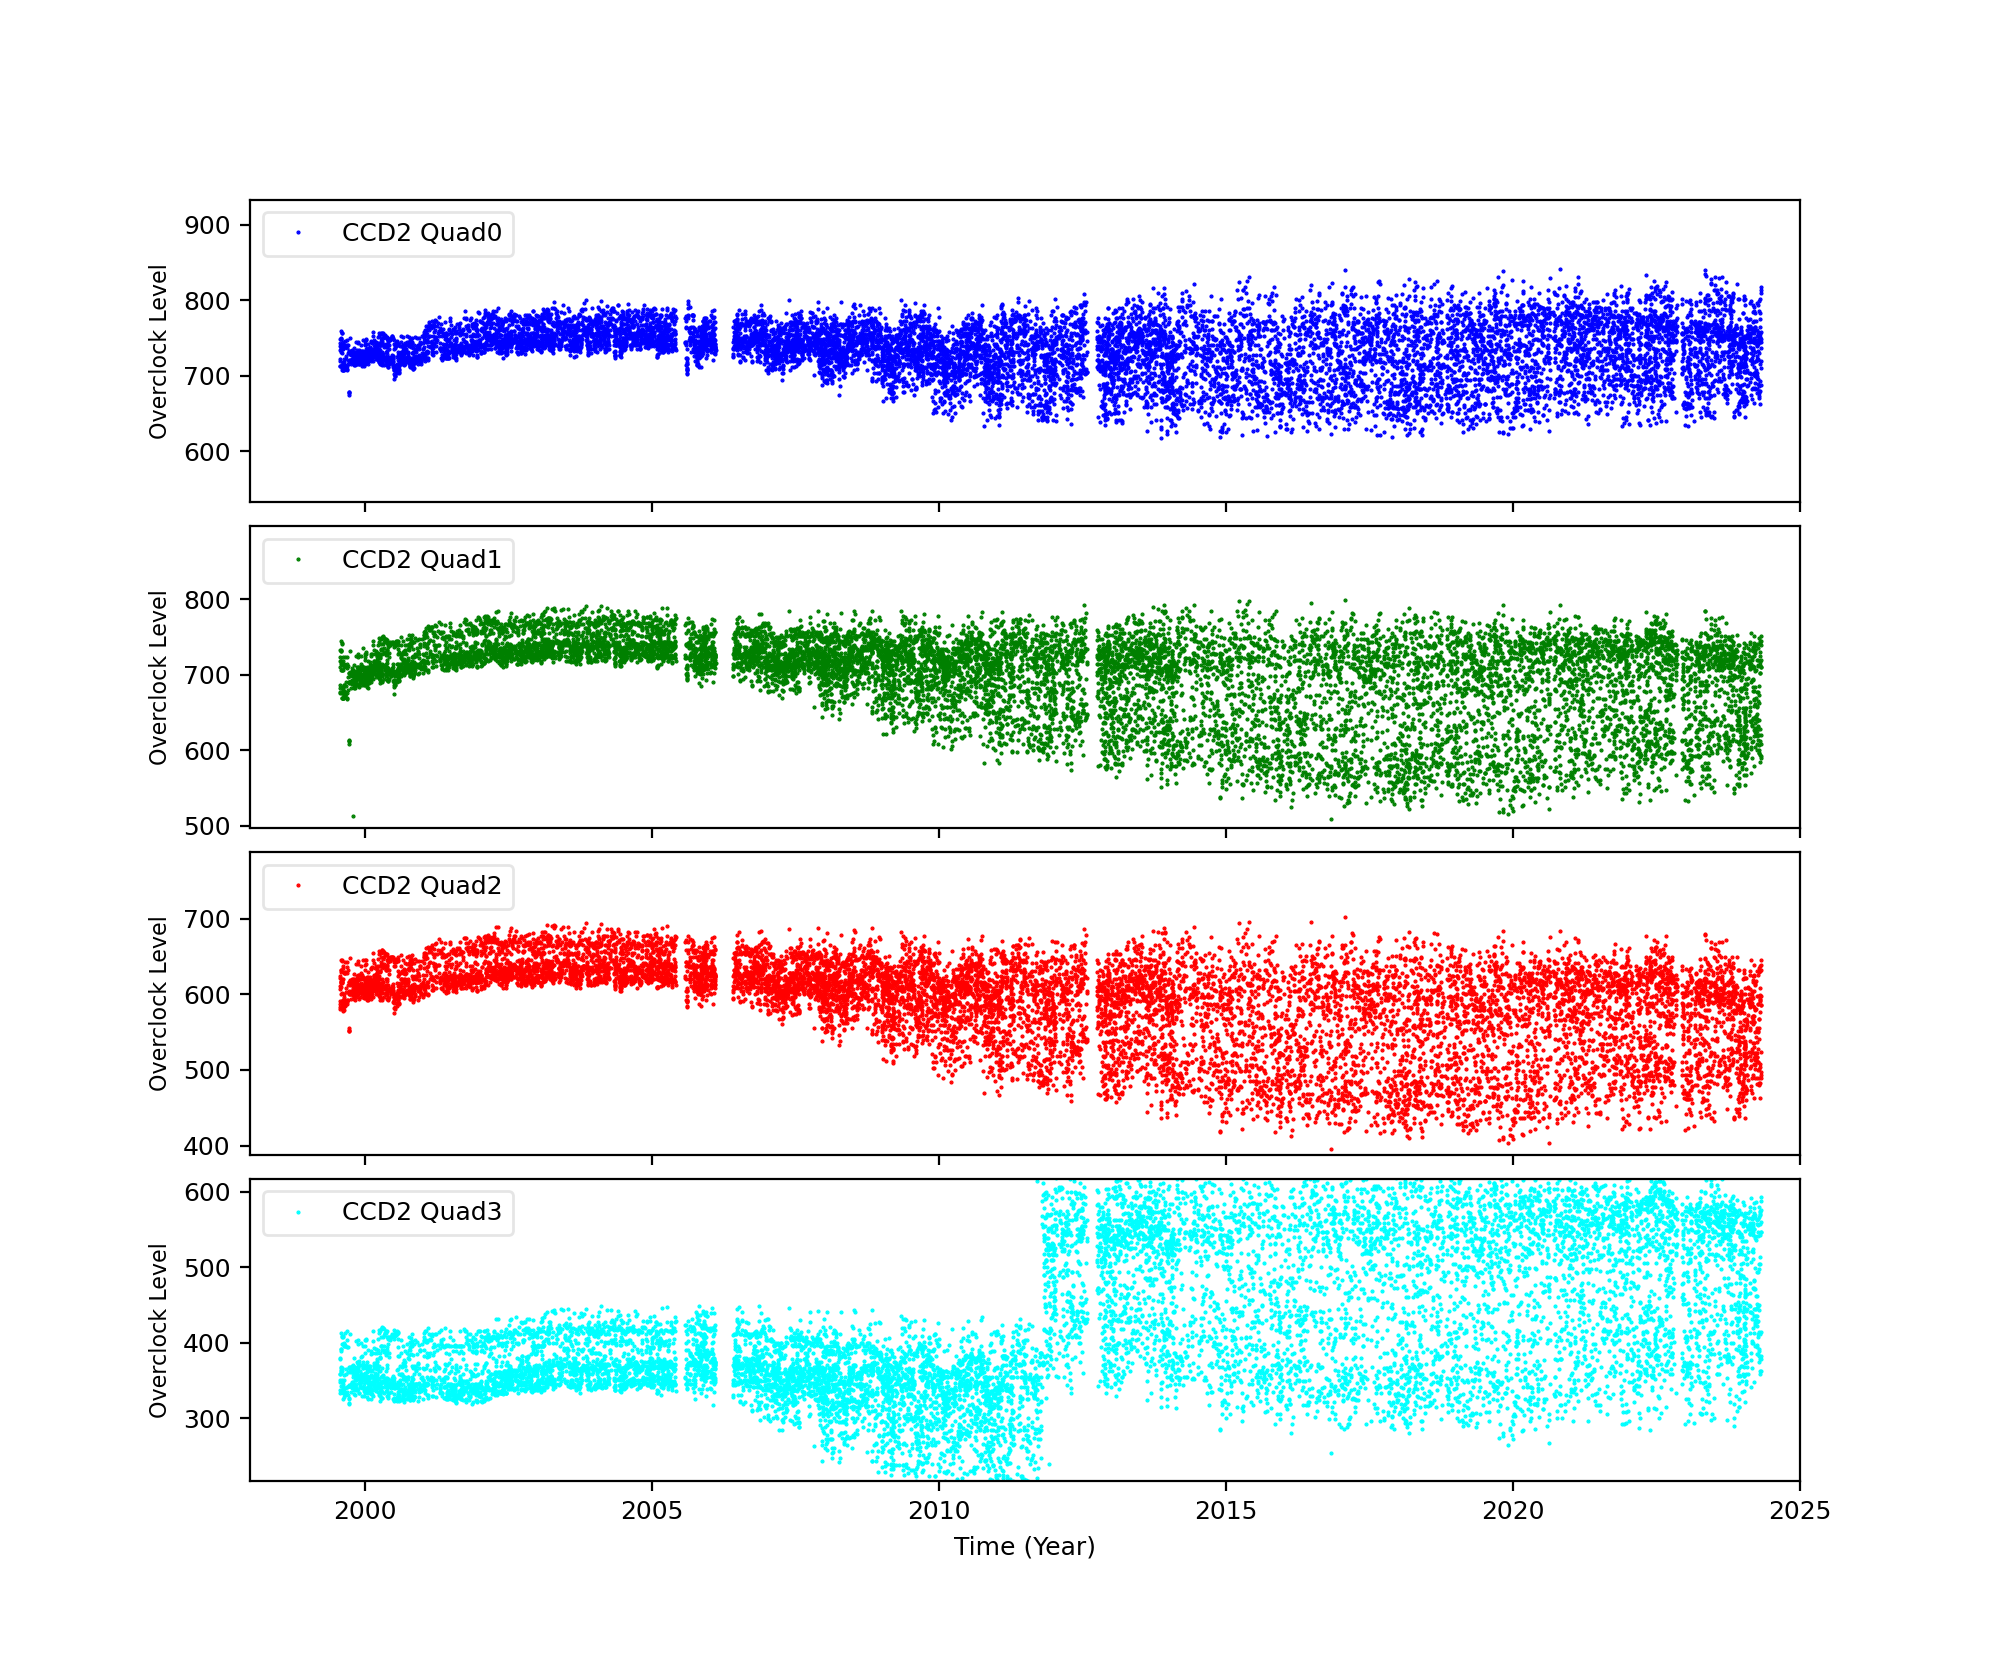
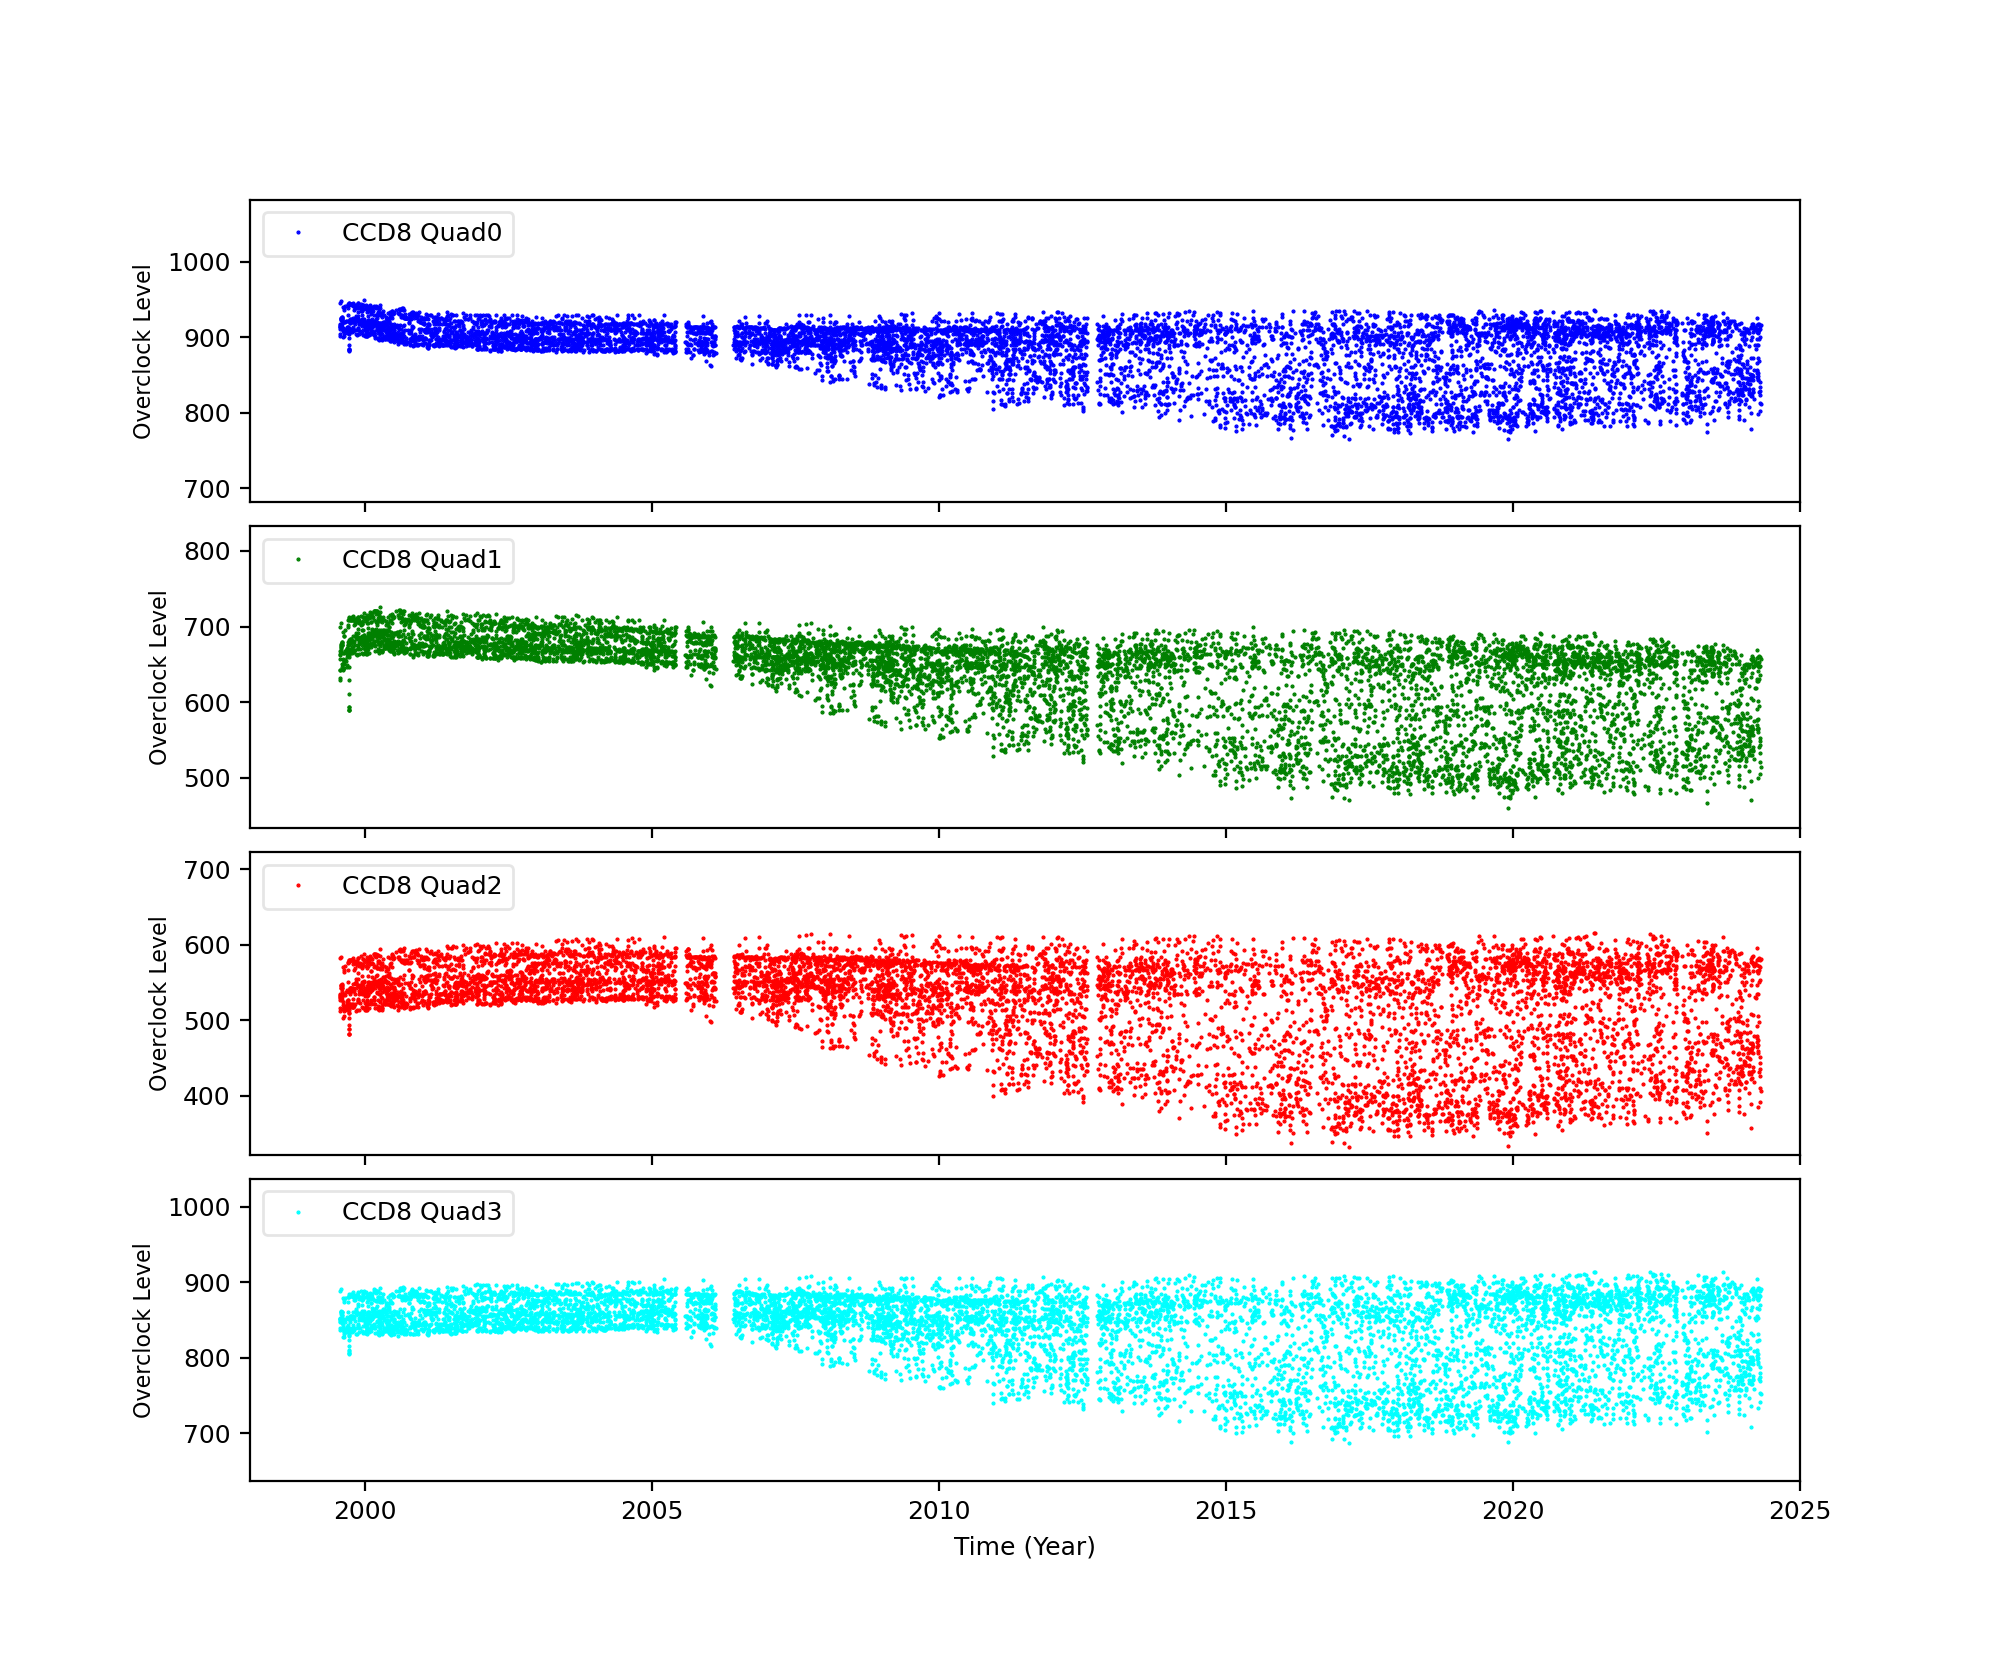
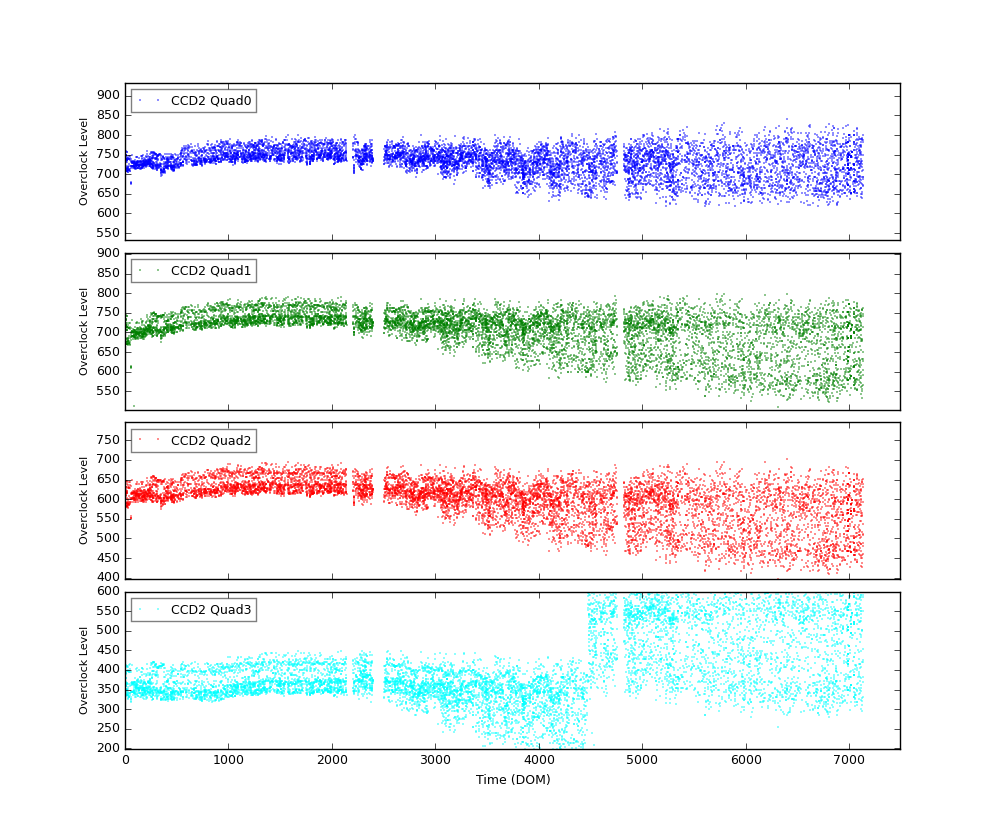
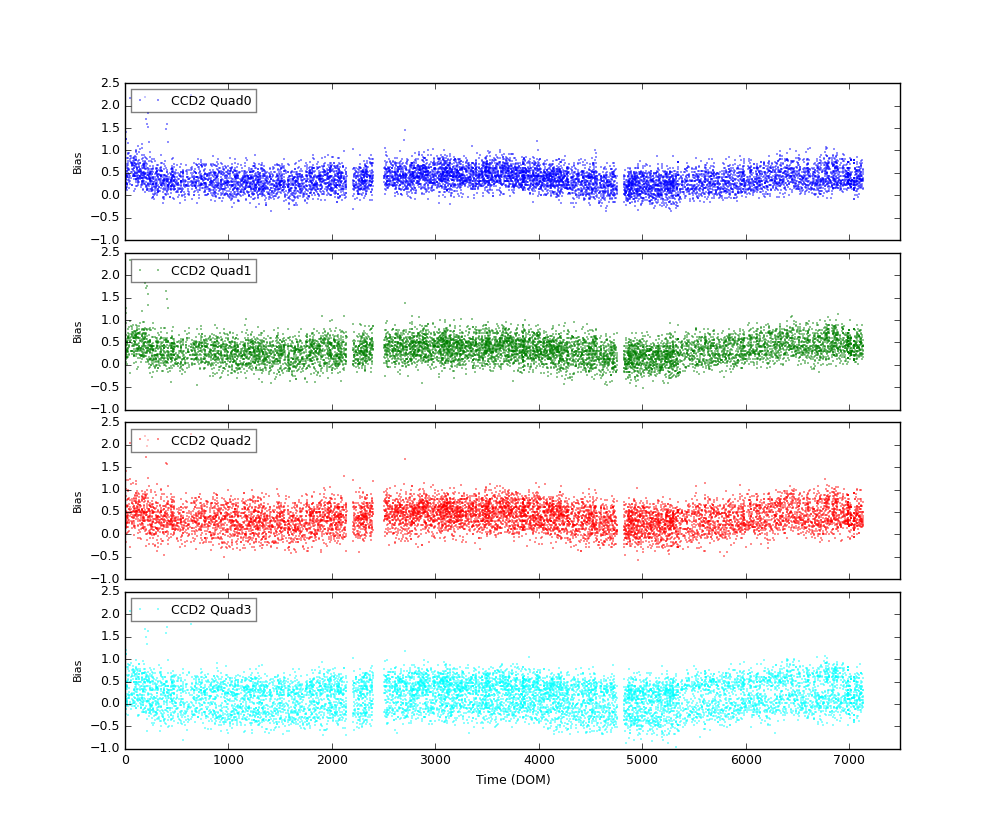
ACIS Bias Trends
The bias plus overclock level was calculated as follows:
- Get acisf*bias0.fits is obtained from a database or /dsops/ap/sdp/cache/*/acis/
- Data with timed mode exposure is selected.
- Fits files were divided into 4 quads, then an average of bias level for each quad is computed. No corrections for dead spots, columns etc were included.
An example of Overclock values as reported in FITS file header:
An example of mean bias minus overclock value:
HRC
DOSE of Central 4K Pore-Pairs
Please refer to Maximum Dose Trends for more details.
)
|
|---|
IMAGE                NPIX      MEAN    STDDEV      MIN       MAX
HRCI_01_2019.fits  16777216	0.025 	0.157 	0.000 	3.000
)
IMAGE                       NPIX      MEAN    STDDEV      MIN       MAX
HRCI_08_1999_01_2019.fits  16777216	5.625 	5.729 	0.000 	302.000
No Data
)
IMAGE                       NPIX      MEAN    STDDEV      MIN       MAX
HRCS_08_1999_01_2019.fits  16777216	17.945 	32.735 	0.000 	1730.000
|
|
Max dose trend plots corrected for events that "pile-up"
in the center of the taps due to bad position information.
|
)
|
)
|
)
|
)
|
| Oct 2018 | Jul 2018 | Apr 2018 | Jan 2018 |
|---|
)
|
)
|
)
|
)
|
| Oct 2018 | Jul 2018 | Apr 2018 | Jan 2018 |
|---|
Gratings
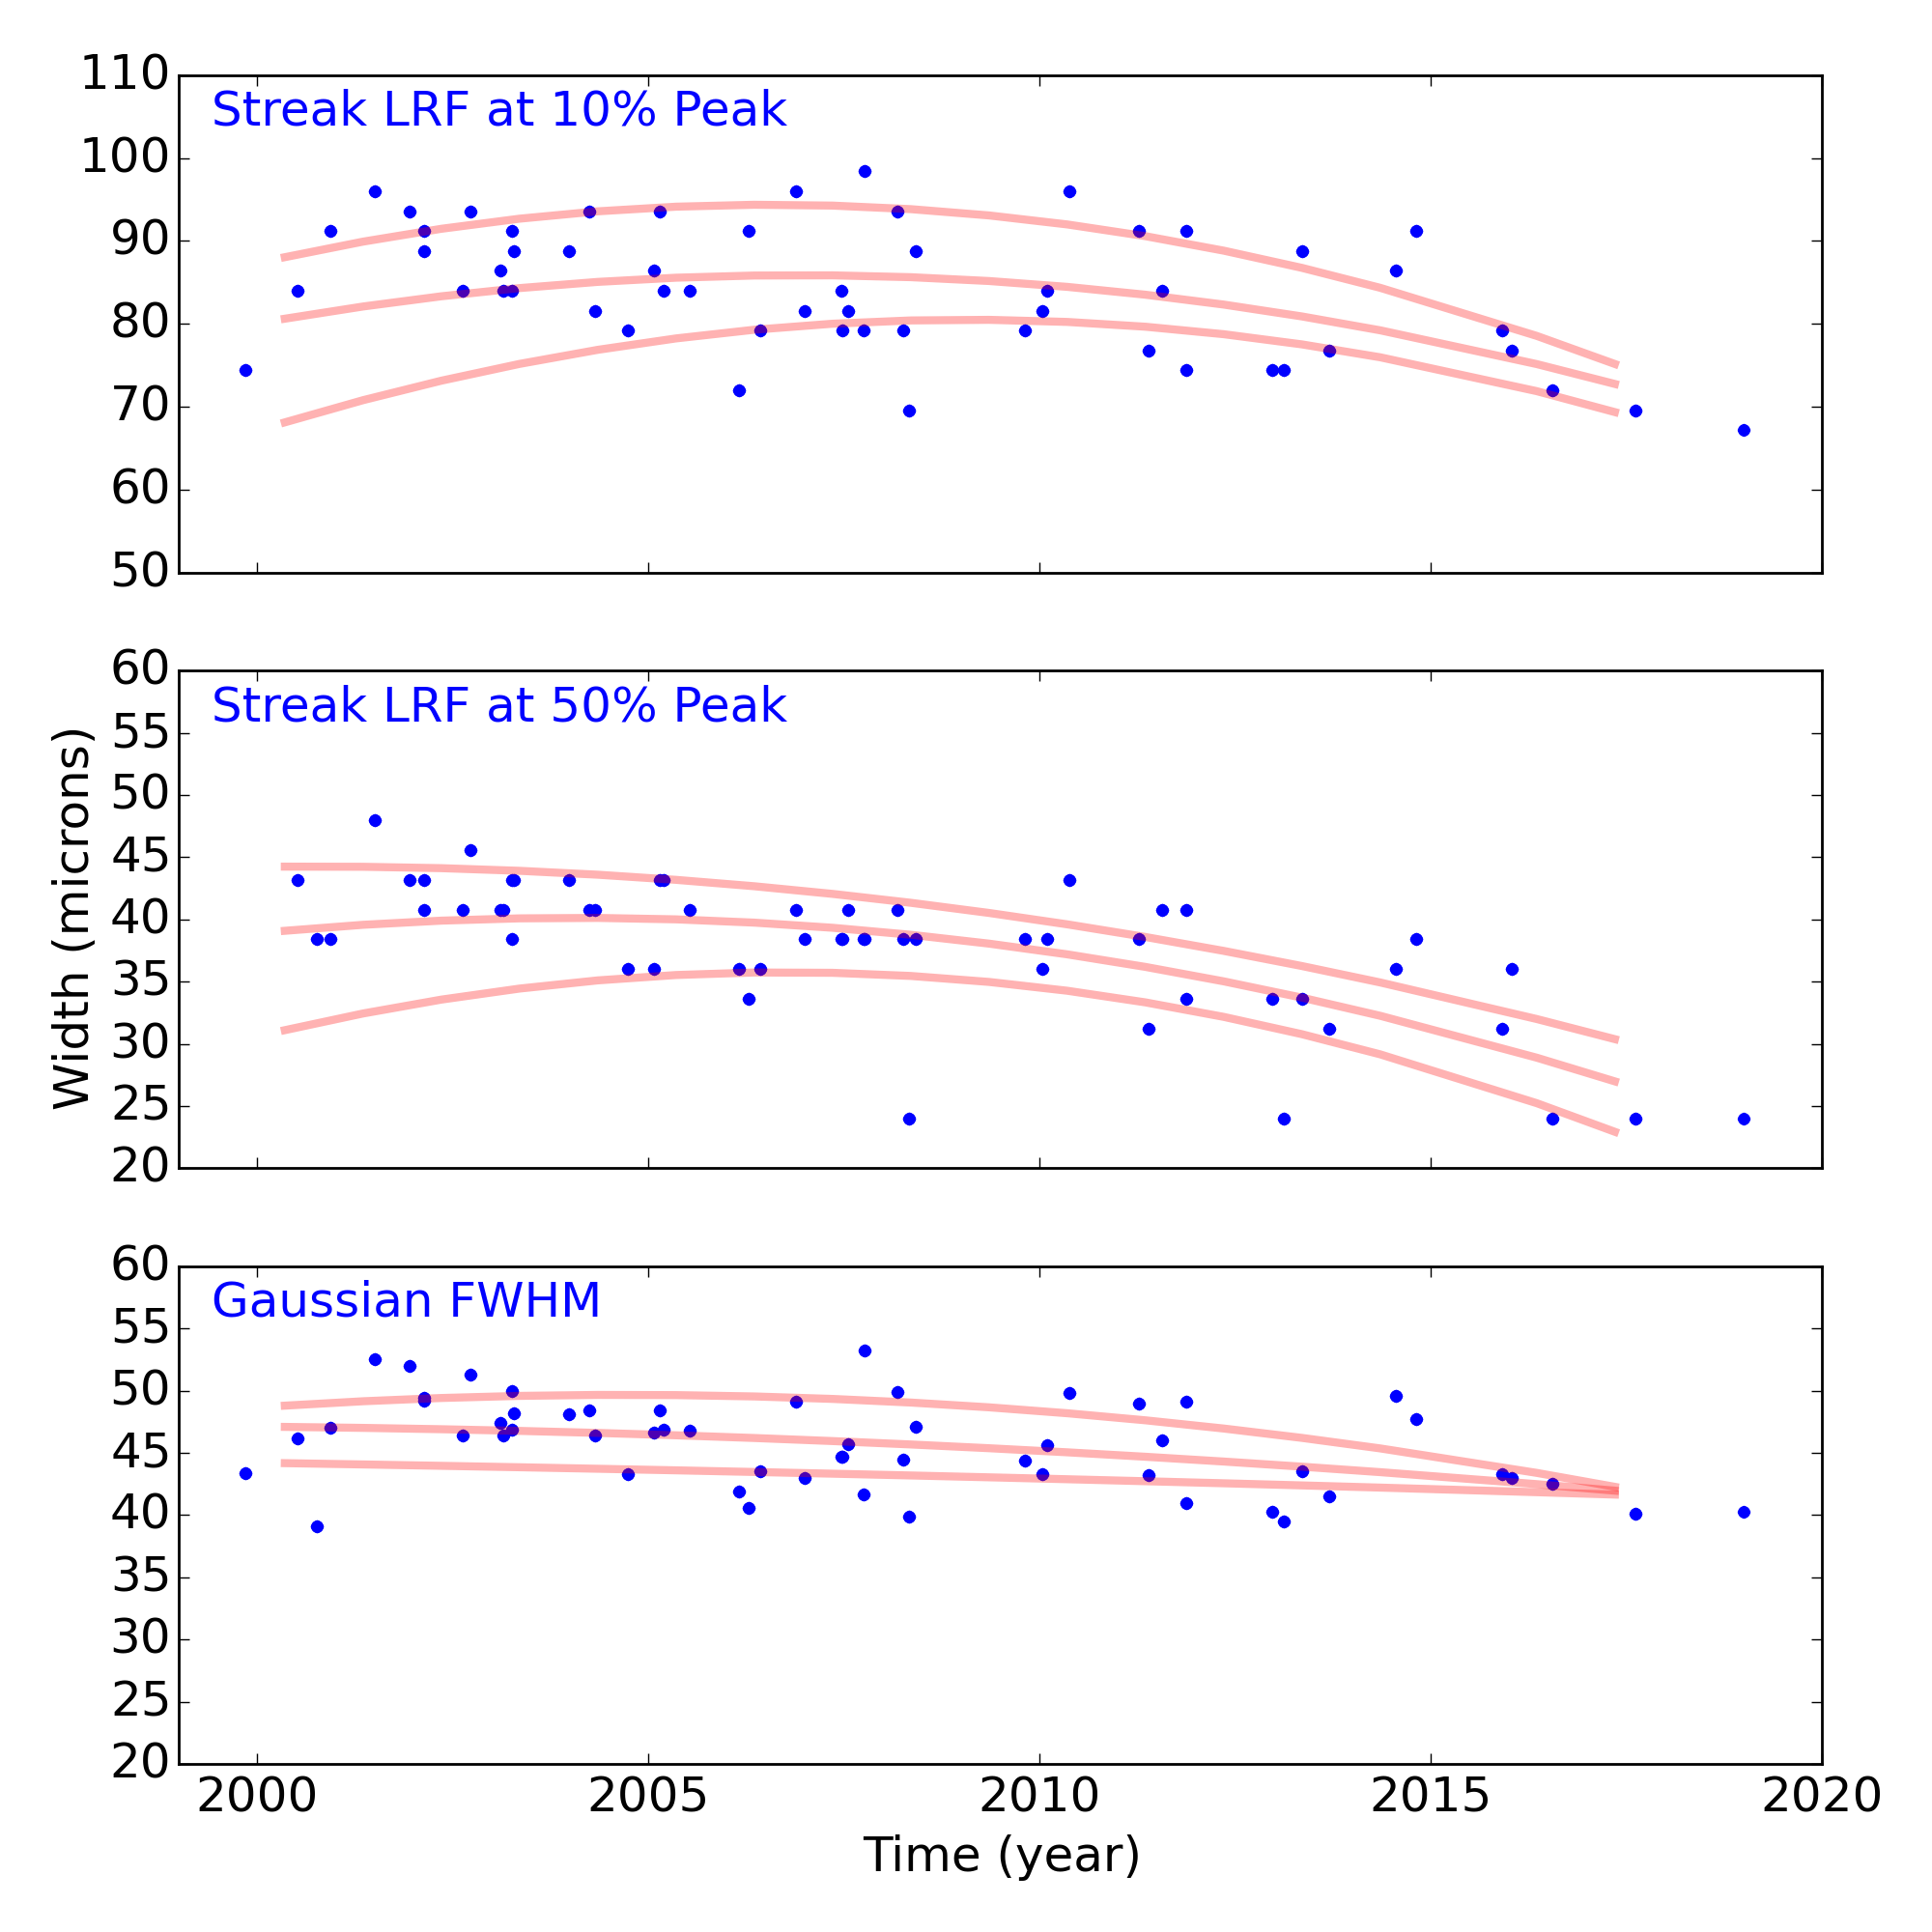
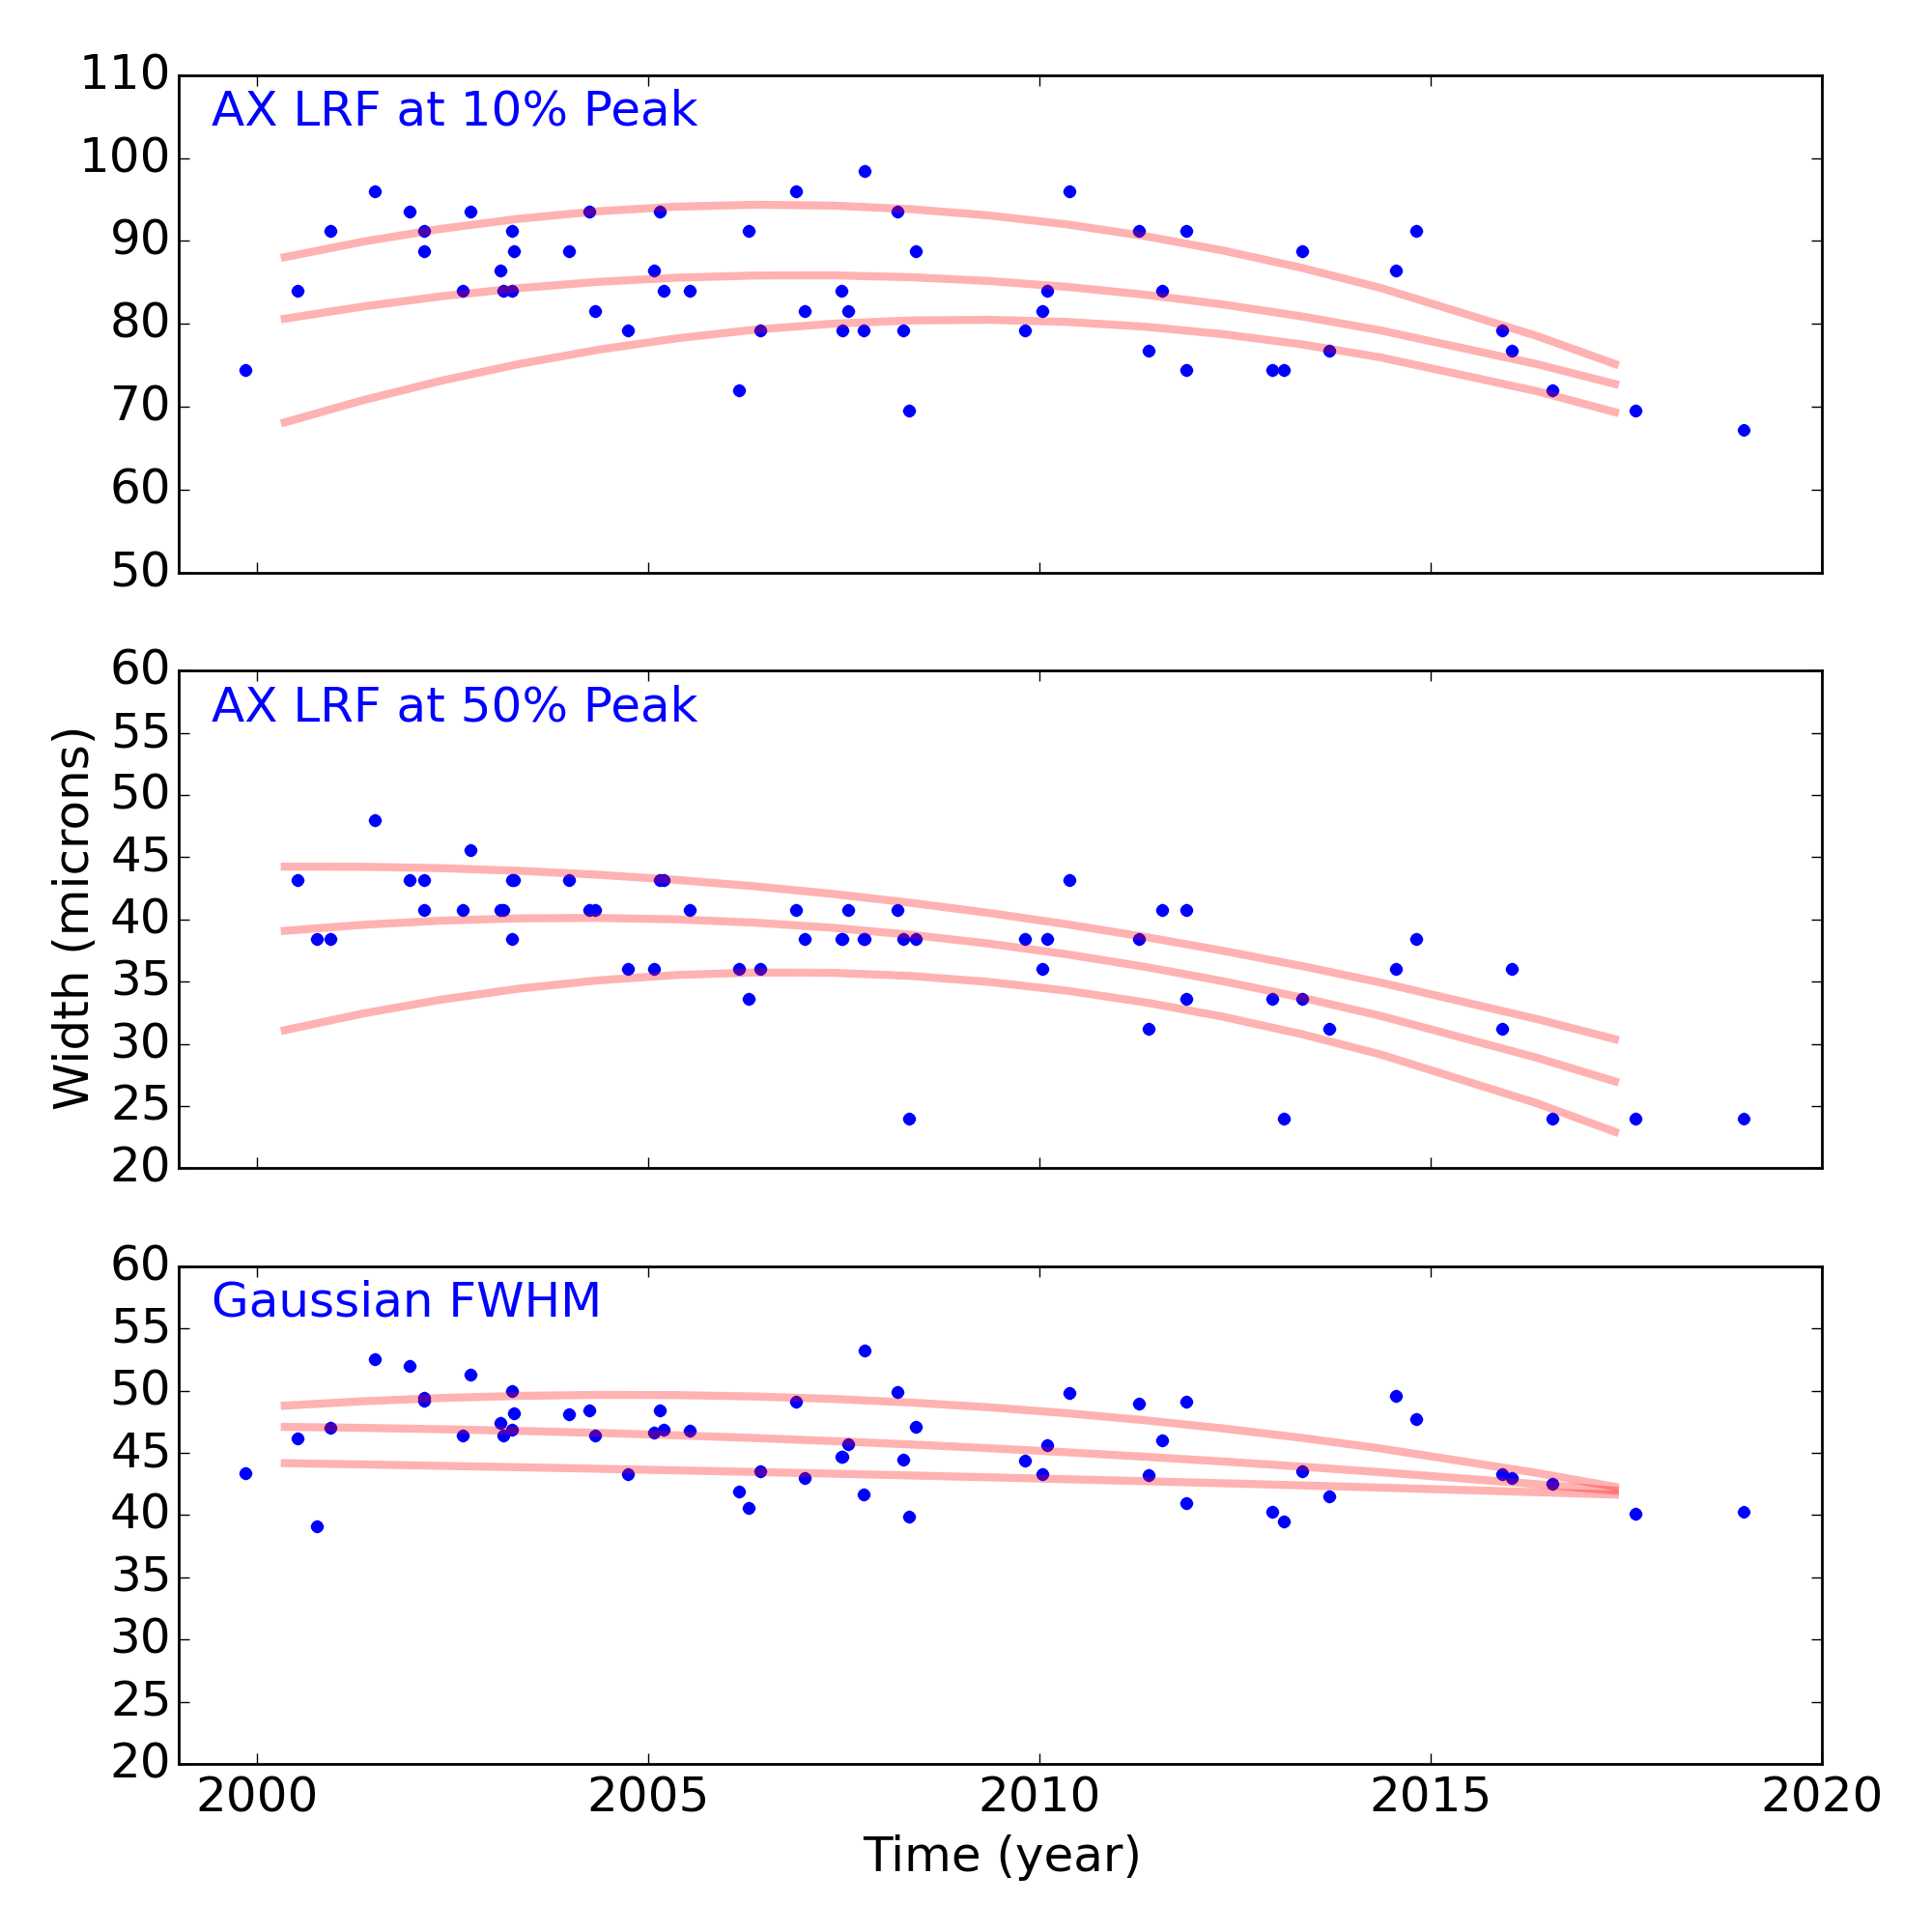
Grating Trends/Focus
We plot the width of the zero order streak of ACIS/HETG observations and the width of the zero order image for HRC/LETG observations of point sources. No significant defocusing trend is seen at this time. See Gratings Trends pages.
PCAD
ACA Trending
ACIS-1
ACIS-6
HRC-I-1
HRC-S-1
Gyro Bias Drift

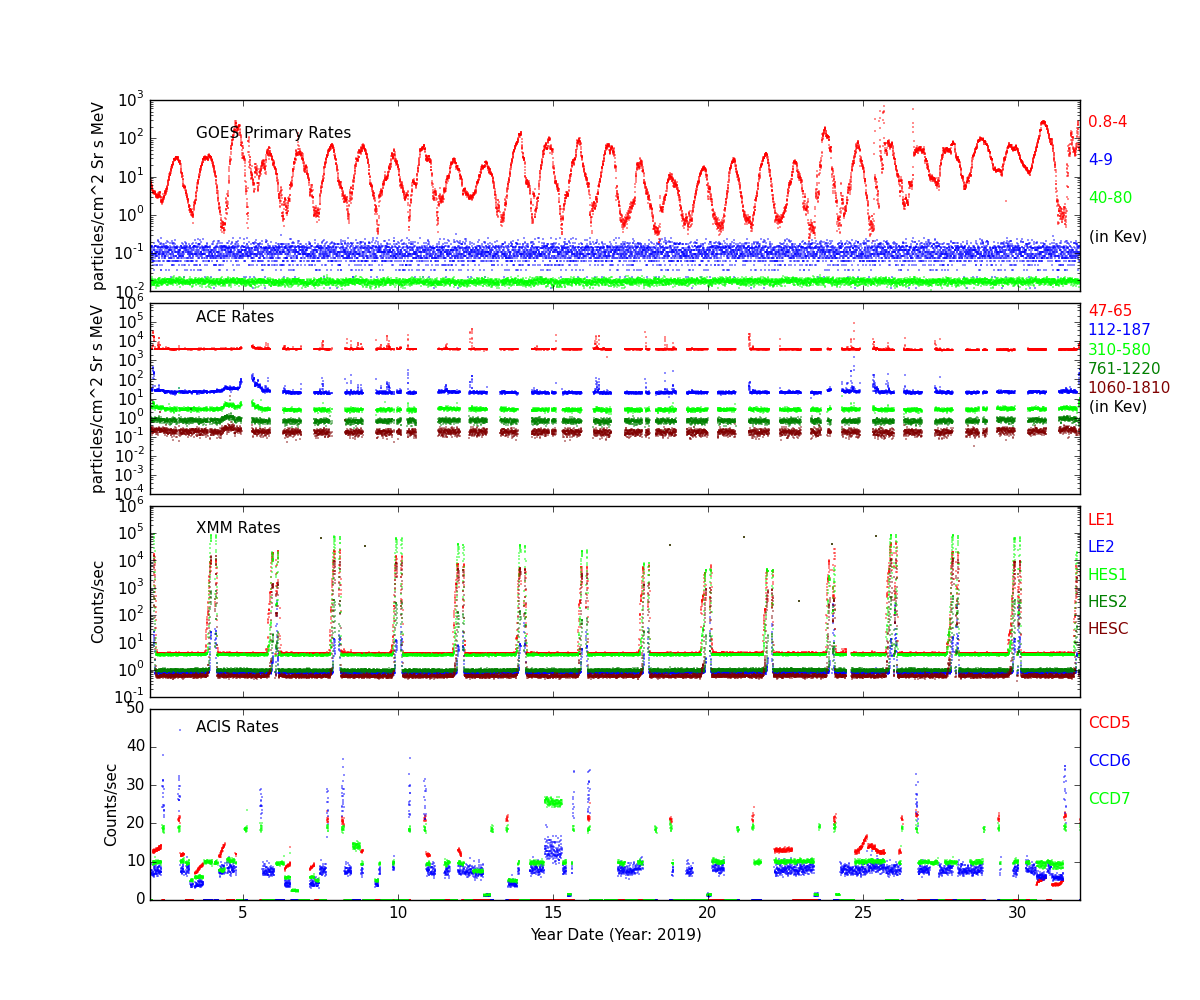
Radiation History
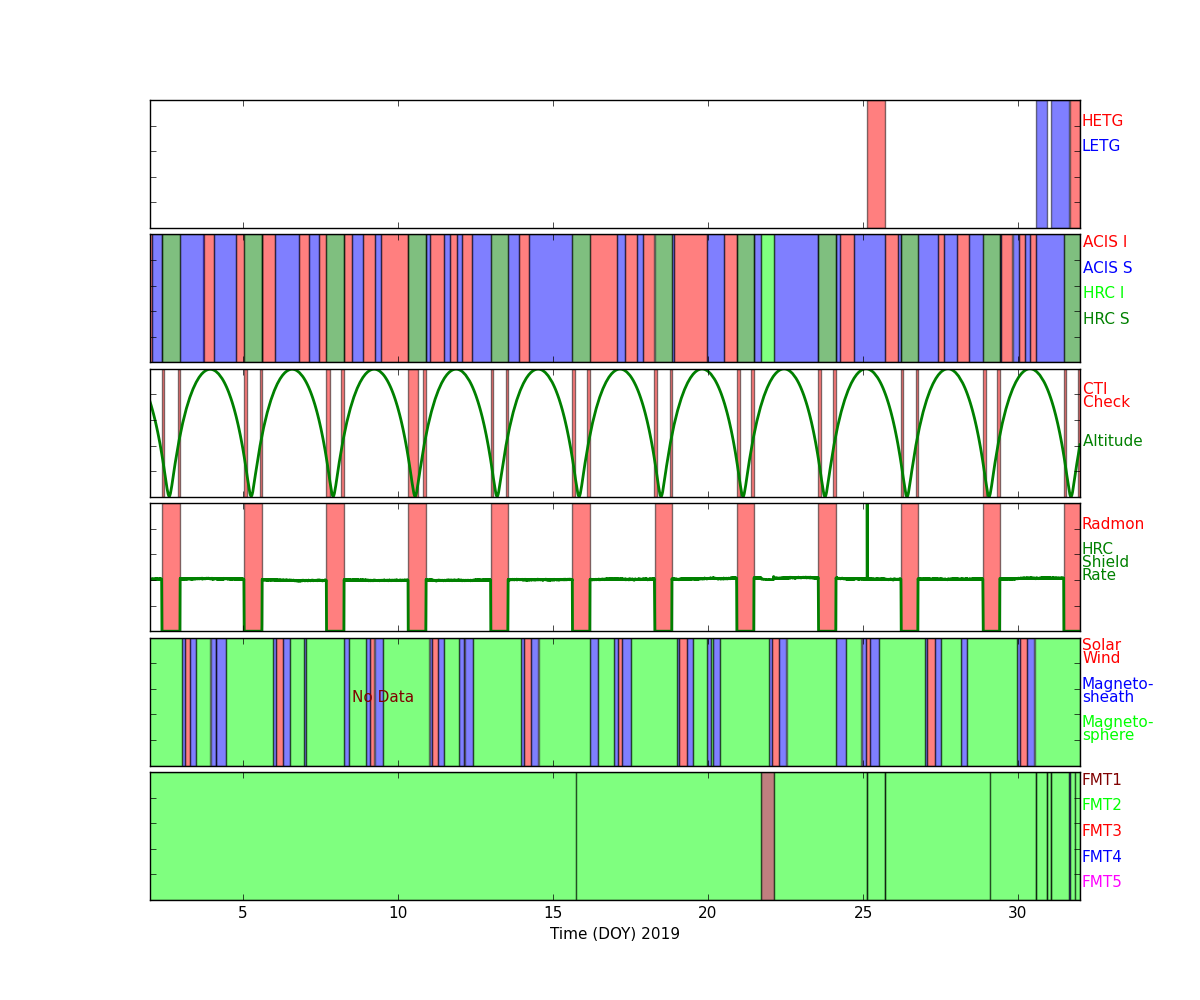
Radiation Count Rates of Jan 2019
Sun Spot History
Trending
Quarterly Trends
- ACIS Temperature
| Previous Quarter | ||||||
| MSID | MEAN | RMS | DELTA/YR | DELTA/YR/YR | UNITS | DESCRIPTION |
| 1cbat | 209.285 | 2.596 | (3.18+/-1.98)e-4 | 0.675+/-0.020 | K | CAMERA BODY TEMP. A |
|---|---|---|---|---|---|---|
| 1crat | 149.139 | 2.945 | 0.002+/-0.000 | 0.726+/-0.022 | K | COLD RADIATOR TEMP. A |
| 1crbt | 149.876 | 3.033 | 0.001+/-0.000 | 0.736+/-0.022 | K | COLD RADIATOR TEMP. B |
| 1dactbt | 258.835 | 3.272 | 0.002+/-0.000 | 0.227+/-0.022 | K | DA COLLIMATOR-TOP TEMP. B |
| 1deamzt | 292.061 | 8.406 | -0.005+/-0.001 | 2.061+/-0.061 | K | DEA -Z PANEL TEMP (RT830) |
| 1dpamyt | 292.387 | 8.348 | -0.004+/-0.001 | 1.620+/-0.063 | K | DPA -Y PANEL TEMP (RT810) |
| 1dpamzt | 295.400 | 8.169 | -0.004+/-0.001 | 1.748+/-0.061 | K | DPA -Z PANEL TEMP (RT830) |
| 1oahat | 246.451 | 2.542 | 0.002+/-0.000 | 0.595+/-0.019 | K | OPEN ACTUATOR TEMPERATURE |
| 1oahbt | 242.407 | 2.368 | 0.002+/-0.000 | 0.528+/-0.017 | K | OPEN ACTUATOR HOUSING TEMP. B |
| 1pdeaat | 304.646 | 6.965 | 0.011+/-0.001 | 0.712+/-0.046 | K | PSMC DEA POWER SUPPLY TEMP A |
| 1pdeabt | 296.885 | 6.751 | 0.013+/-0.001 | 0.752+/-0.047 | K | PSMC DEA POWER SUPPLY TEMP B |
| 1pin1at | 338.713 | 11.890 | -0.046+/-0.002 | -0.546+/-0.068 | K | PSMC TEMP 1A |
| 1wrat | 192.131 | 2.608 | (-9.33+/-1.82)e-4 | 0.647+/-0.020 | K | WARM RADIATOR TEMP A |
| 1wrbt | 191.815 | 2.579 | (-5.20+/-1.85)e-4 | 0.606+/-0.019 | K | WARM RADIATOR TEMP B |
- ACIS Electronics Side B
| Previous Quarter | ||||||
| MSID | MEAN | RMS | DELTA/YR | DELTA/YR/YR | UNITS | DESCRIPTION |
| 1dahbcu | 1.118e-05 | 9.009e-05 | (1.23+/-9.02)e-10 | (3.62+/-0.27)e-6 | AMP | DETECTOR ASSY. HTR CURRENT B |
|---|---|---|---|---|---|---|
| 1dahbvo | 0.000e+00 | 0.000e+00 | (0.00+/-0.00)e0 | (0.00+/-0.00)e0 | V | DETECTOR ASSY. HTR VOLTAGE B |
| 1dahhbvo | 1.609e-04 | 1.441e-02 | (0.00+/-0.00)e0 | (-4.03+/-0.79)e-4 | V | DA HOUSING HTR +28V INPUT B |
| 1de28bvo | 28.035 | 0.293 | -0.001+/-0.000 | 0.024+/-0.001 | V | DEA +28V INPUT B |
| 1deicbcu | 16.392 | 0.022 | (4.27+/-0.17)e-5 | 0.002+/-0.000 | AMP | DEA INPUT CURRENT B |
| 1den0bvo | -0.161 | 0.018 | (7.78+/-1.38)e-6 | (3.27+/-15.10)e-5 | V | DEA -6V VOLTAGE B |
| 1den1bvo | -0.340 | 0.045 | (3.25+/-0.36)e-5 | 0.002+/-0.000 | V | DEA -15V VOLTAGE B |
| 1dep0bvo | 0.055 | 0.017 | (-1.67+/-0.14)e-5 | (-6.75+/-1.52)e-4 | V | DEA +6V VOLTAGE B |
| 1dep1bvo | 0.145 | 0.045 | (-4.02+/-0.35)e-5 | -0.001+/-0.000 | V | DEA +15V ANALOG B |
| 1dep2bvo | 0.224 | 0.068 | (-6.13+/-0.54)e-5 | -0.001+/-0.001 | V | DEA +24V ANALOG B |
| 1dep3bvo | 0.278 | 0.087 | (-8.16+/-0.69)e-5 | -0.003+/-0.001 | V | DEA +28V ANALOG B |
| 1dp28bvo | 28.051 | 0.291 | -0.001+/-0.000 | 0.022+/-0.001 | V | DPA +28V INPUT B |
| 1dpicbcu | 0.955 | 0.305 | (-3.86+/-0.25)e-4 | -0.013+/-0.003 | AMP | DPA INPUT CURRENT B |
| 1dpp0bvo | 5.227 | 0.043 | (-4.03+/-0.35)e-5 | -0.001+/-0.000 | V | DPA +5V ANALOG B |
- EPHIN Temperature and Voltage
| Previous Quarter | ||||||
| MSID | MEAN | RMS | DELTA/YR | DELTA/YR/YR | UNITS | DESCRIPTION |
| 5eiot | 339.737 | 30.629 | -0.175+/-0.002 | -1.725+/-0.136 | K | EIO TEMP |
|---|---|---|---|---|---|---|
| 5ephint | 332.984 | 7.099 | -0.030+/-0.001 | -0.328+/-0.045 | K | EPHIN TEMP |
| hkeboxtemp | 324.949 | 72.735 | -0.043+/-0.003 | -11.584+/-3.783 | K | EPHIN HOUSEKEEPING EBOX: TEMPERATURE (5EHSE300) |
| teio | 324.331 | 24.204 | -0.062+/-0.002 | -1.497+/-0.137 | K | EPHIN ELECTRONICS HOUSING TEMP |
| tephin | 333.026 | 7.222 | -0.032+/-0.001 | -0.434+/-0.045 | K | EPHIN SENSOR HOUSING TEMP |
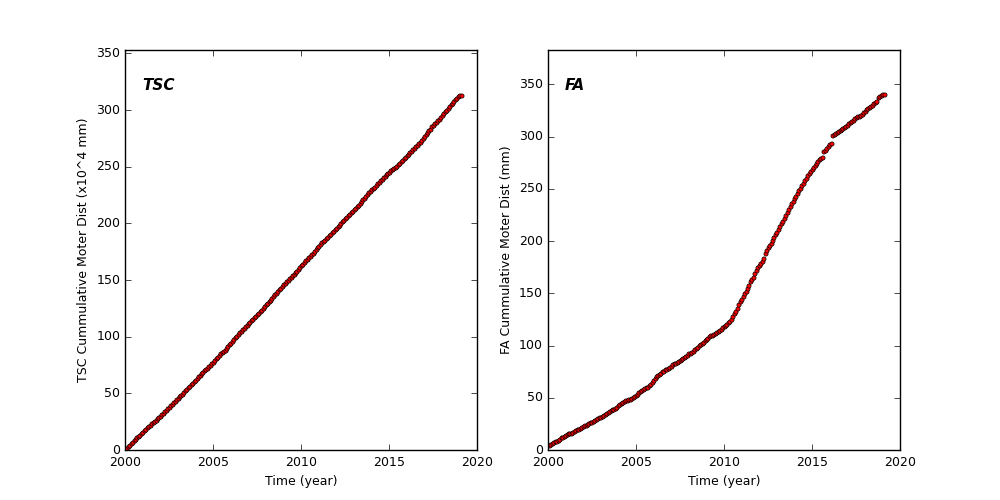
Spacecraft Motions
TSC and FA Cummulative Moter Distance
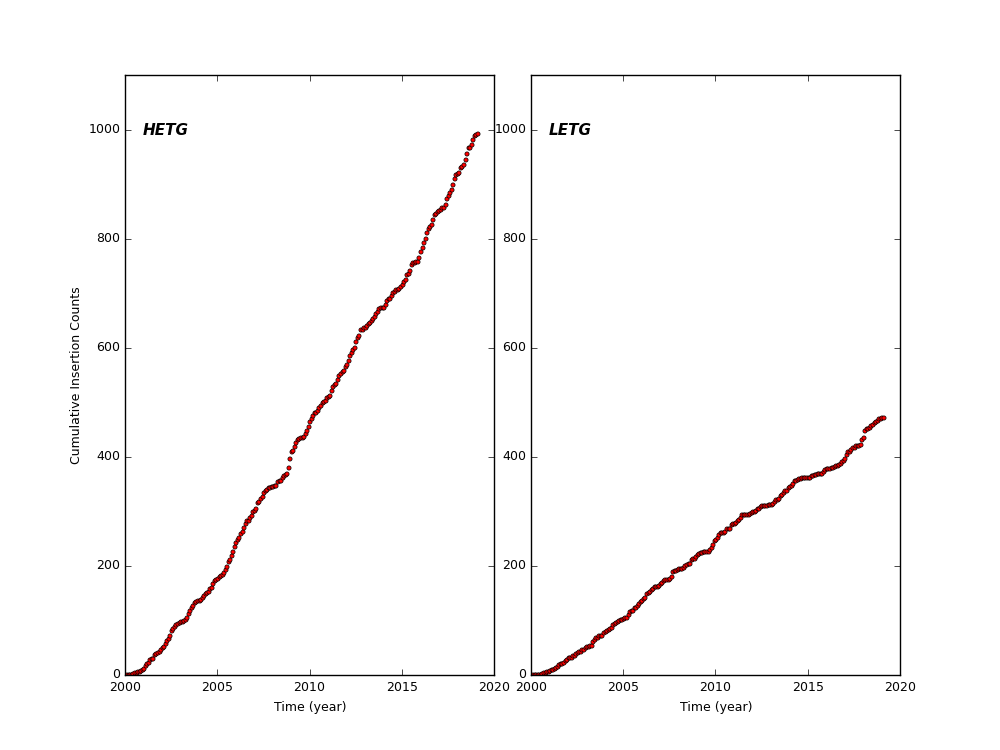
HETG and LETG Cummulative Insertion Counts
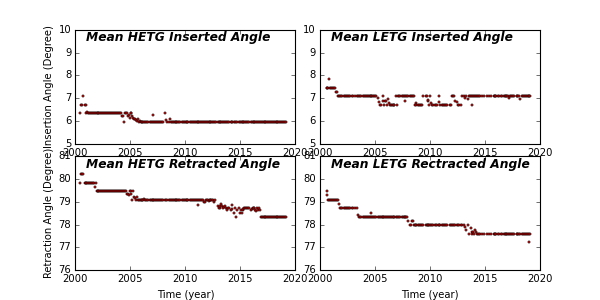
HETG/LETG Insertion/Retraction Angle
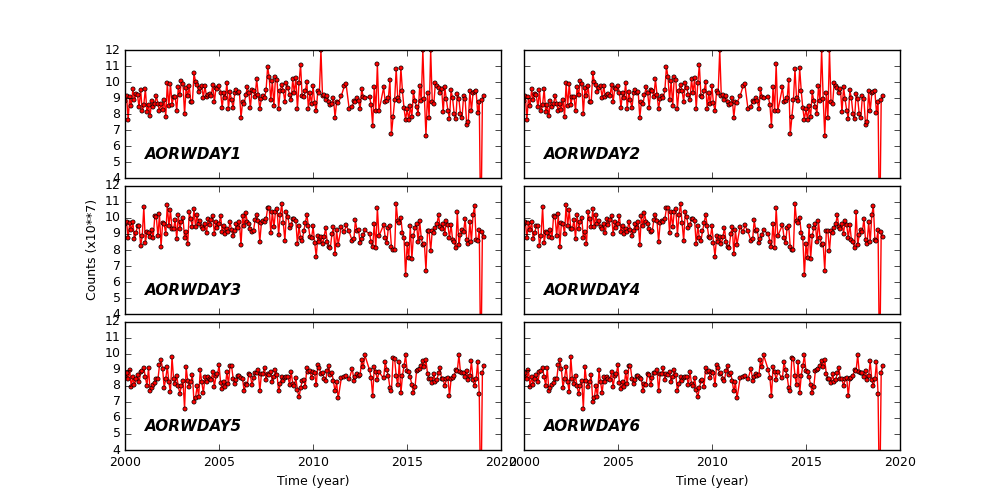
Reaction Wheel Rotations