ACIS
ACIS DOSE Registered-Photon-Map
The steps we took to compute the dose map are;
- Level 1 Event files for a specified month are obtained from archive.
- Image data including I2, I3, S2, S3 CCDs are extracted from all event files.
- All the extracted image data were merged to create a month long exposure map for the month.
- The exposure map is opened with ds9, and check a distribution of count rates against energy. From this, estimate the upper threshold value. Any events beyond this upper threshold are assumed erroneous events such as bad pixels.
- Using this upper threshold, the data is filtered, and create a cleaned exposure map for the month.
- The exposure map from each month from the Sep 1999 is added up to create a cumulative exposure map for each month.
- Using fimgstatistic, we compute count rate statistics for each CCDs.
- For observations with high data drop rates (e.g., Crab nebula, Cas A), we corrected the observations by adding events.
Please check more detail plots at Telemetered Photon Dose Trend page.
)
)
)
Statistics:
# IMAGE     NPIX     MEAN        RMS        MIN     MAX
ACIS_apr19 6004901       8.995         12.926           0.0     5589


I2 node 0  262654	7.307676	3.367884	0.0	 63.0
I2 node 1  262654	7.662656	3.906845	0.0	872.0
I2 node 2  262654	7.413302	3.300274	0.0	 74.0
I2 node 3  262654	7.587092	8.502548	0.0	3952.0

I3 node 0  262654	13.183545	5.024927	0.0	647.0
I3 node 1  262654	13.348501	10.676352	0.0	4291.0
I3 node 2  262654	12.612194	4.482190	0.0	139.0
I3 node 3  262654	12.409789	7.219233	0.0	2803.0

S2 node 0  262654	12.246722	7.256510	0.0	2343.0
S2 node 1  262654	12.554385	5.155332	0.0	134.0
S2 node 2  262654	12.900647	12.621868	0.0	4286.0
S2 node 3  262654	12.825525	13.729442	0.0	5589.0

S3 node 0  262654	13.512240	4.819078	0.0	104.0
S3 node 1  262654	16.064247	6.658464	0.0	1885.0
S3 node 2  262654	14.929680	4.353680	1.0	 89.0
S3 node 3  262654	14.472070	10.986562	0.0	213.0
)
)
)
Statistics:
 IMAGE     NPIX      MEAN        RMS           MIN      MAX
ACIS_total   6004901       2289.782         2959.110           0.0   128651


I2 node 0  262654	1982.515388	393.779385	424.0	11385.0
I2 node 1  262654	2086.292121	549.951218	433.0	90218.0
I2 node 2  262654	2116.071215	448.207575	436.0	11366.0
I2 node 3  262654	2121.406202	547.835388	427.0	28561.0

I3 node 0  262654	2255.943338	556.941409	417.0	8884.0
I3 node 1  262654	2337.283058	1694.658528	440.0	55304.0
I3 node 2  262654	2061.860210	383.051789	417.0	11714.0
I3 node 3  262654	2052.790052	411.608991	370.0	32089.0

S2 node 0  262654	2668.087178	418.282674	1497.0	21875.0
S2 node 1  262654	2827.942134	630.889831	1656.0	15544.0
S2 node 2  262654	3125.768256	636.249106	2090.0	27770.0
S2 node 3  262654	3076.989927	486.709386	1847.0	58214.0

S3 node 0  262654	4706.352531	2105.506778	2079.0	27293.0
S3 node 1  262654	5937.440075	2244.213835	0.0	29215.0
S3 node 2  262654	4698.336026	1238.558794	2031.0	25153.0
S3 node 3  262654	3634.241589	652.740418	2233.0	24706.0
)
|
)
|
)
|
)
|
| Jan 2019 | Oct 2018 | Jul 2018 | Apr 2018 |
|---|
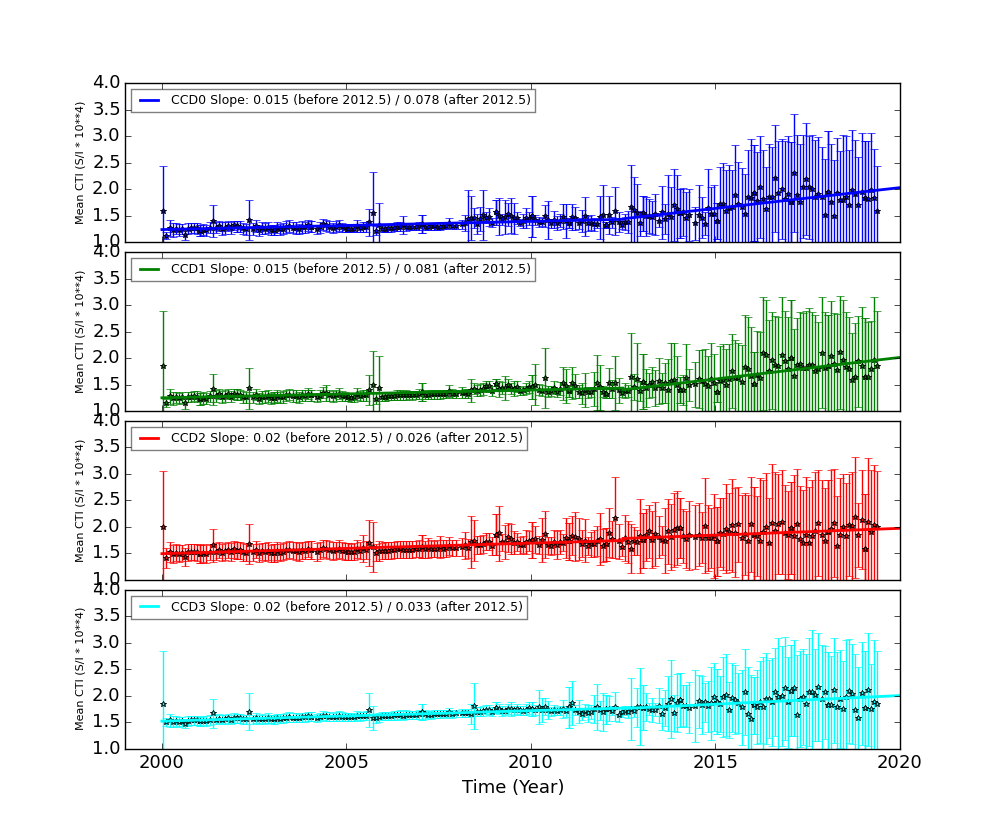
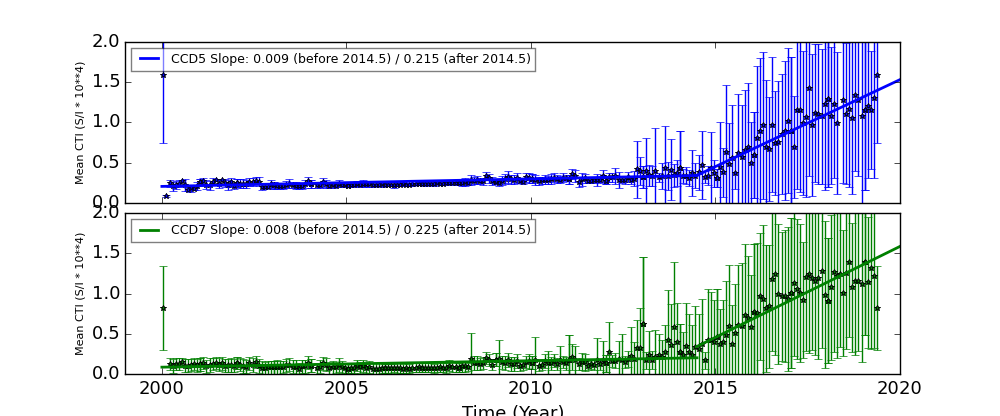
The Mean Detrended CTI
We report CTIs with a refined data definition. CTIs were computed for the temperature dependency corrected data. Please see CTI page for detailed explanation. CTI's are computed for Mn K alpha, and defined as slope/intercept x10^4 of row # vs ADU. Data file: here
Imaging CCDs
Spectral CCDs
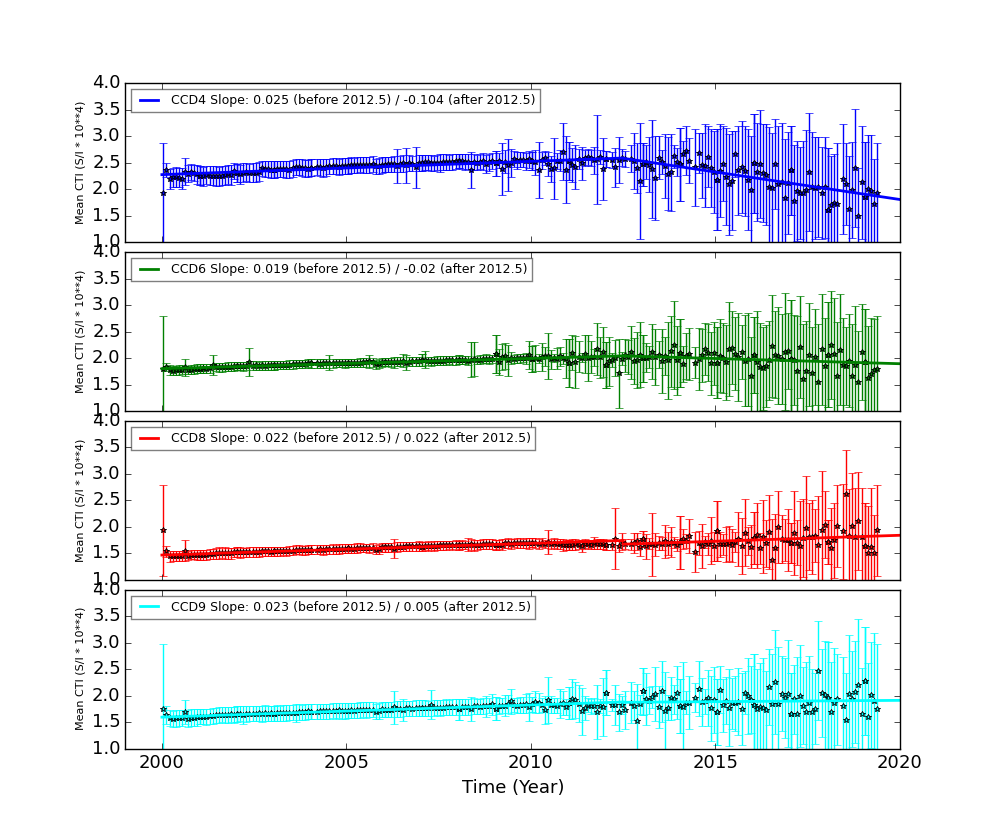
Backside CCDs
Focal Plane Temperature
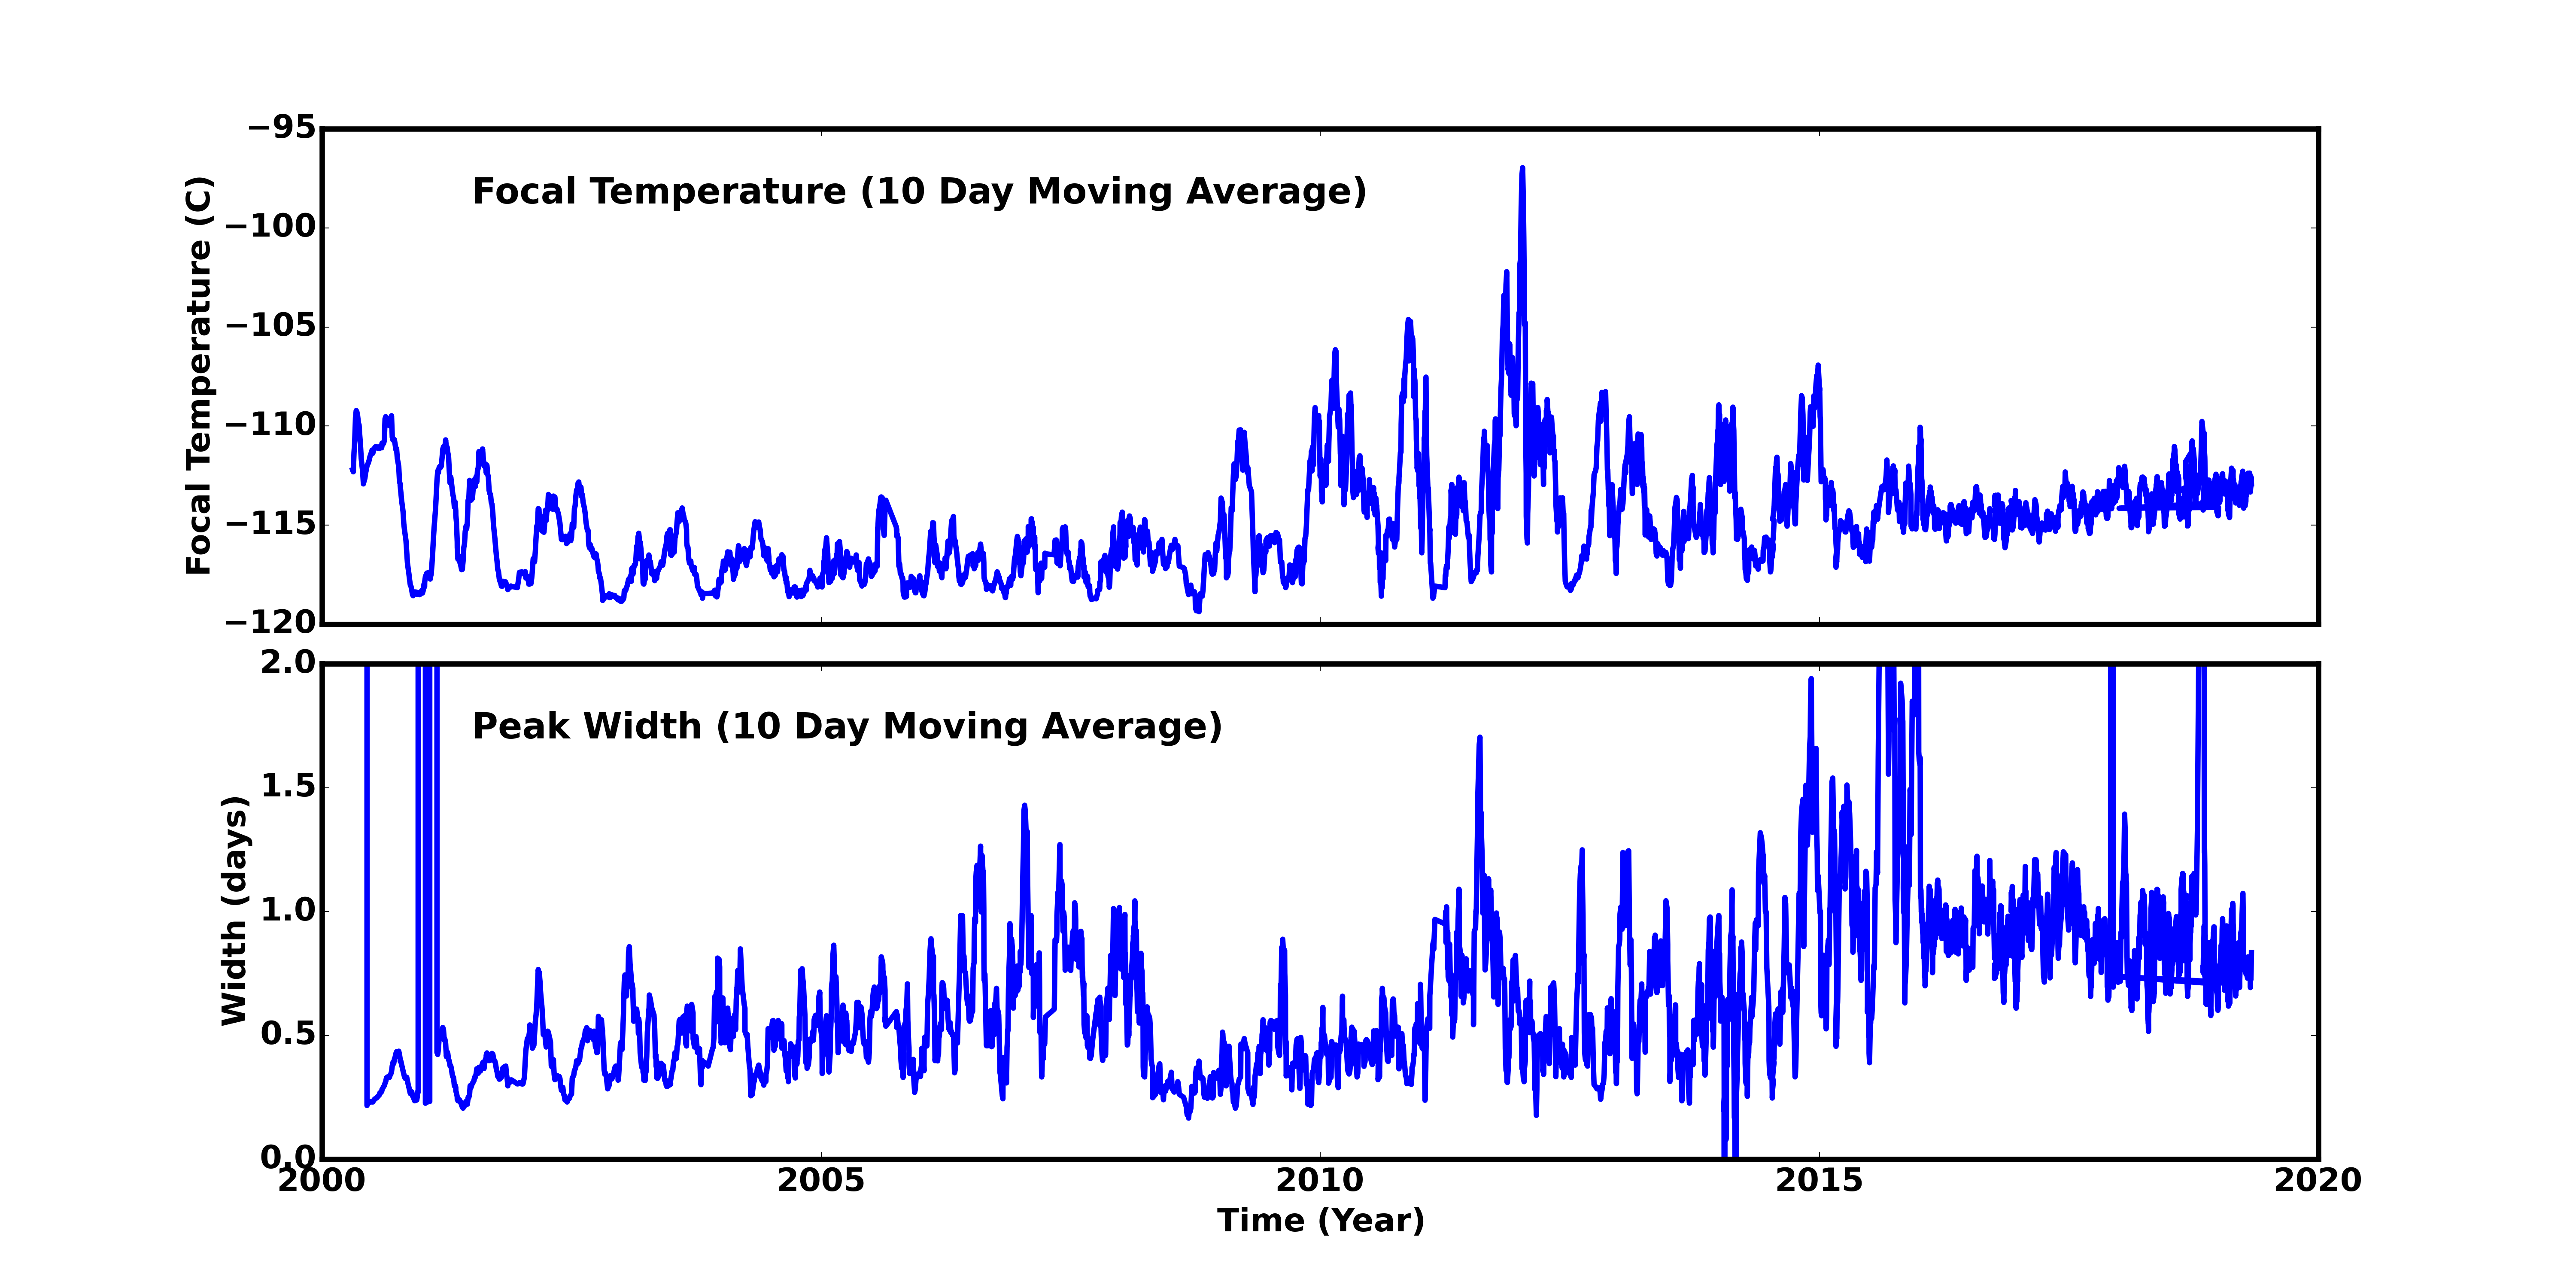
Apr 2019 Focal Temperature
| The Mean (max) FPT: | |
|---|---|
| -113.03 | +/- 2.78 C |
| Mean Width: | |
| 0.79 | +/- 0.3 days |
Averaged Focal Plane Temperature
We are using 10 period moving averages to show trends of peak temperatures and peak widths. Note, the gaps in the width plot are due to missing/corrupted data.
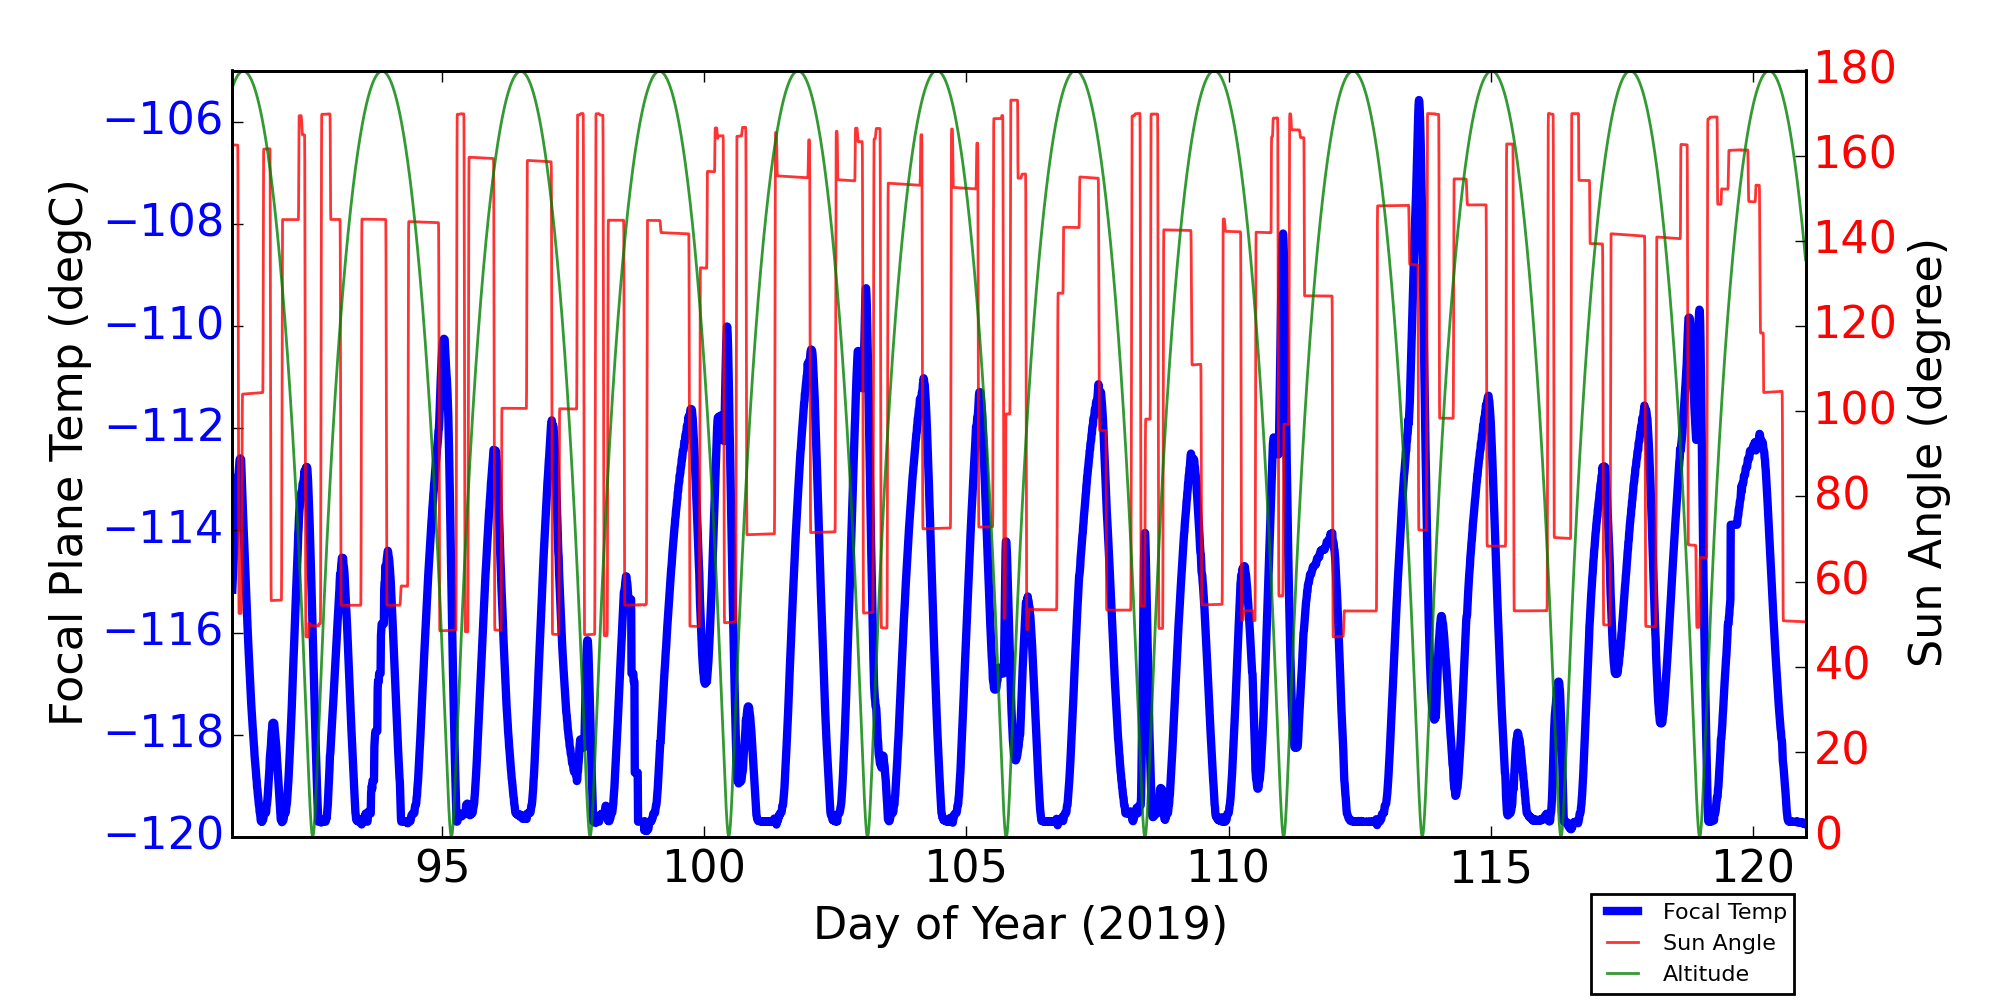
Focal Plane Temperature, Sun Angle and Altitude
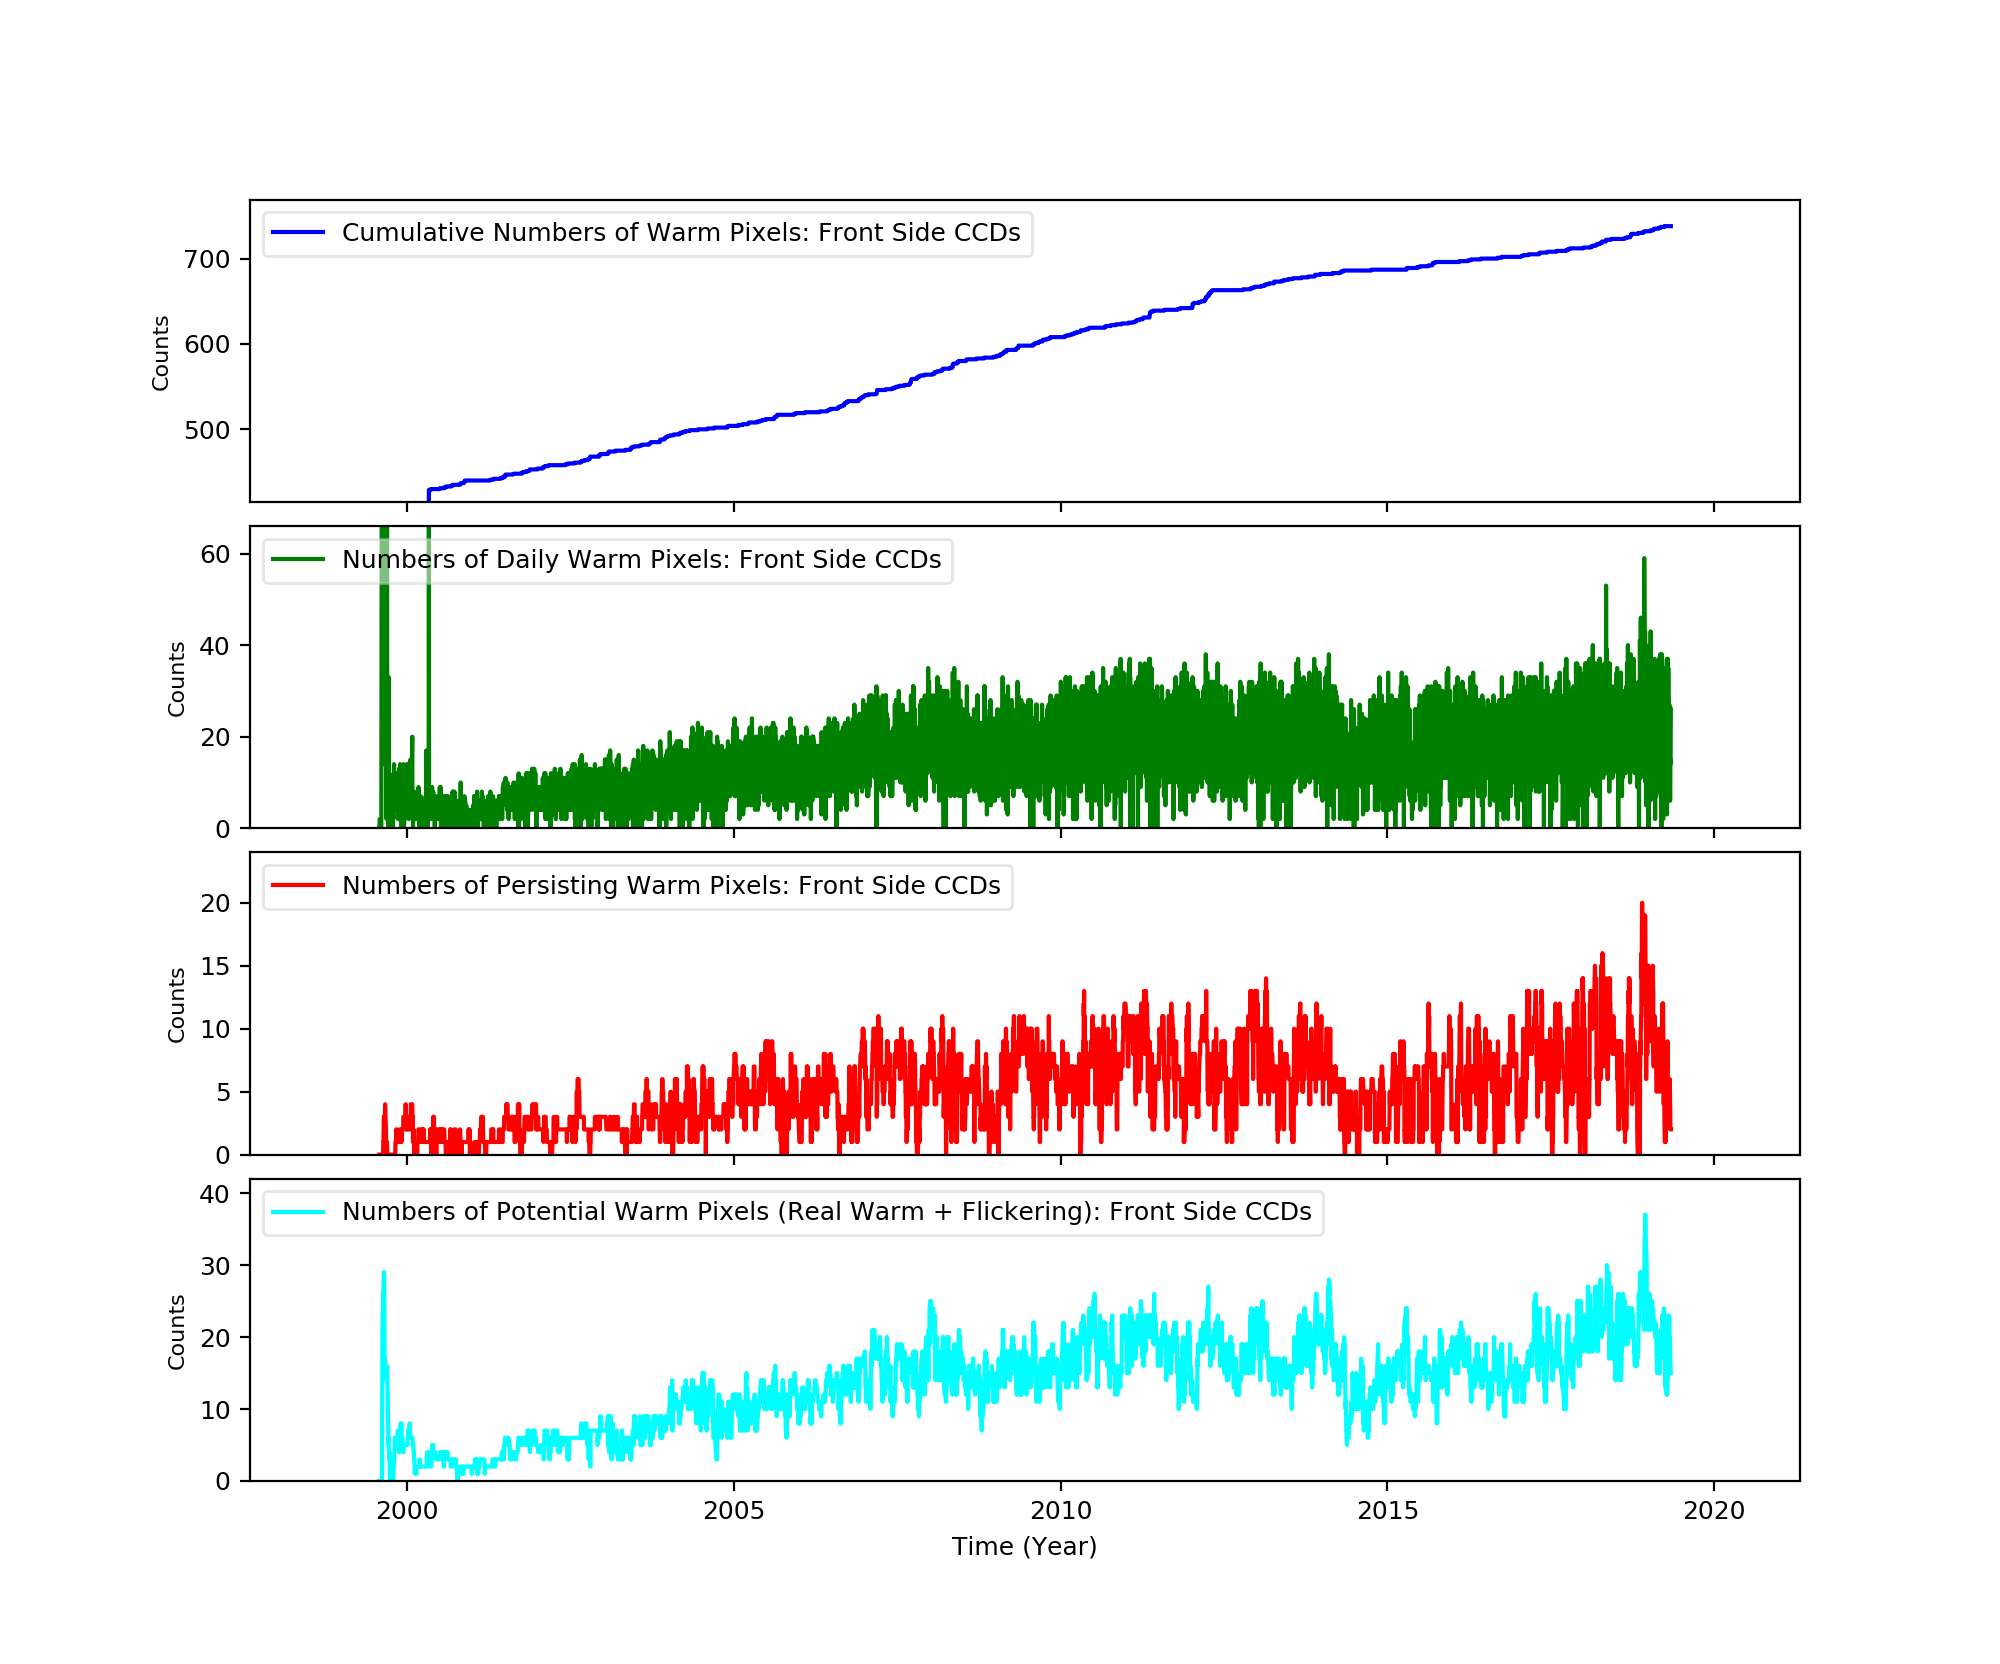
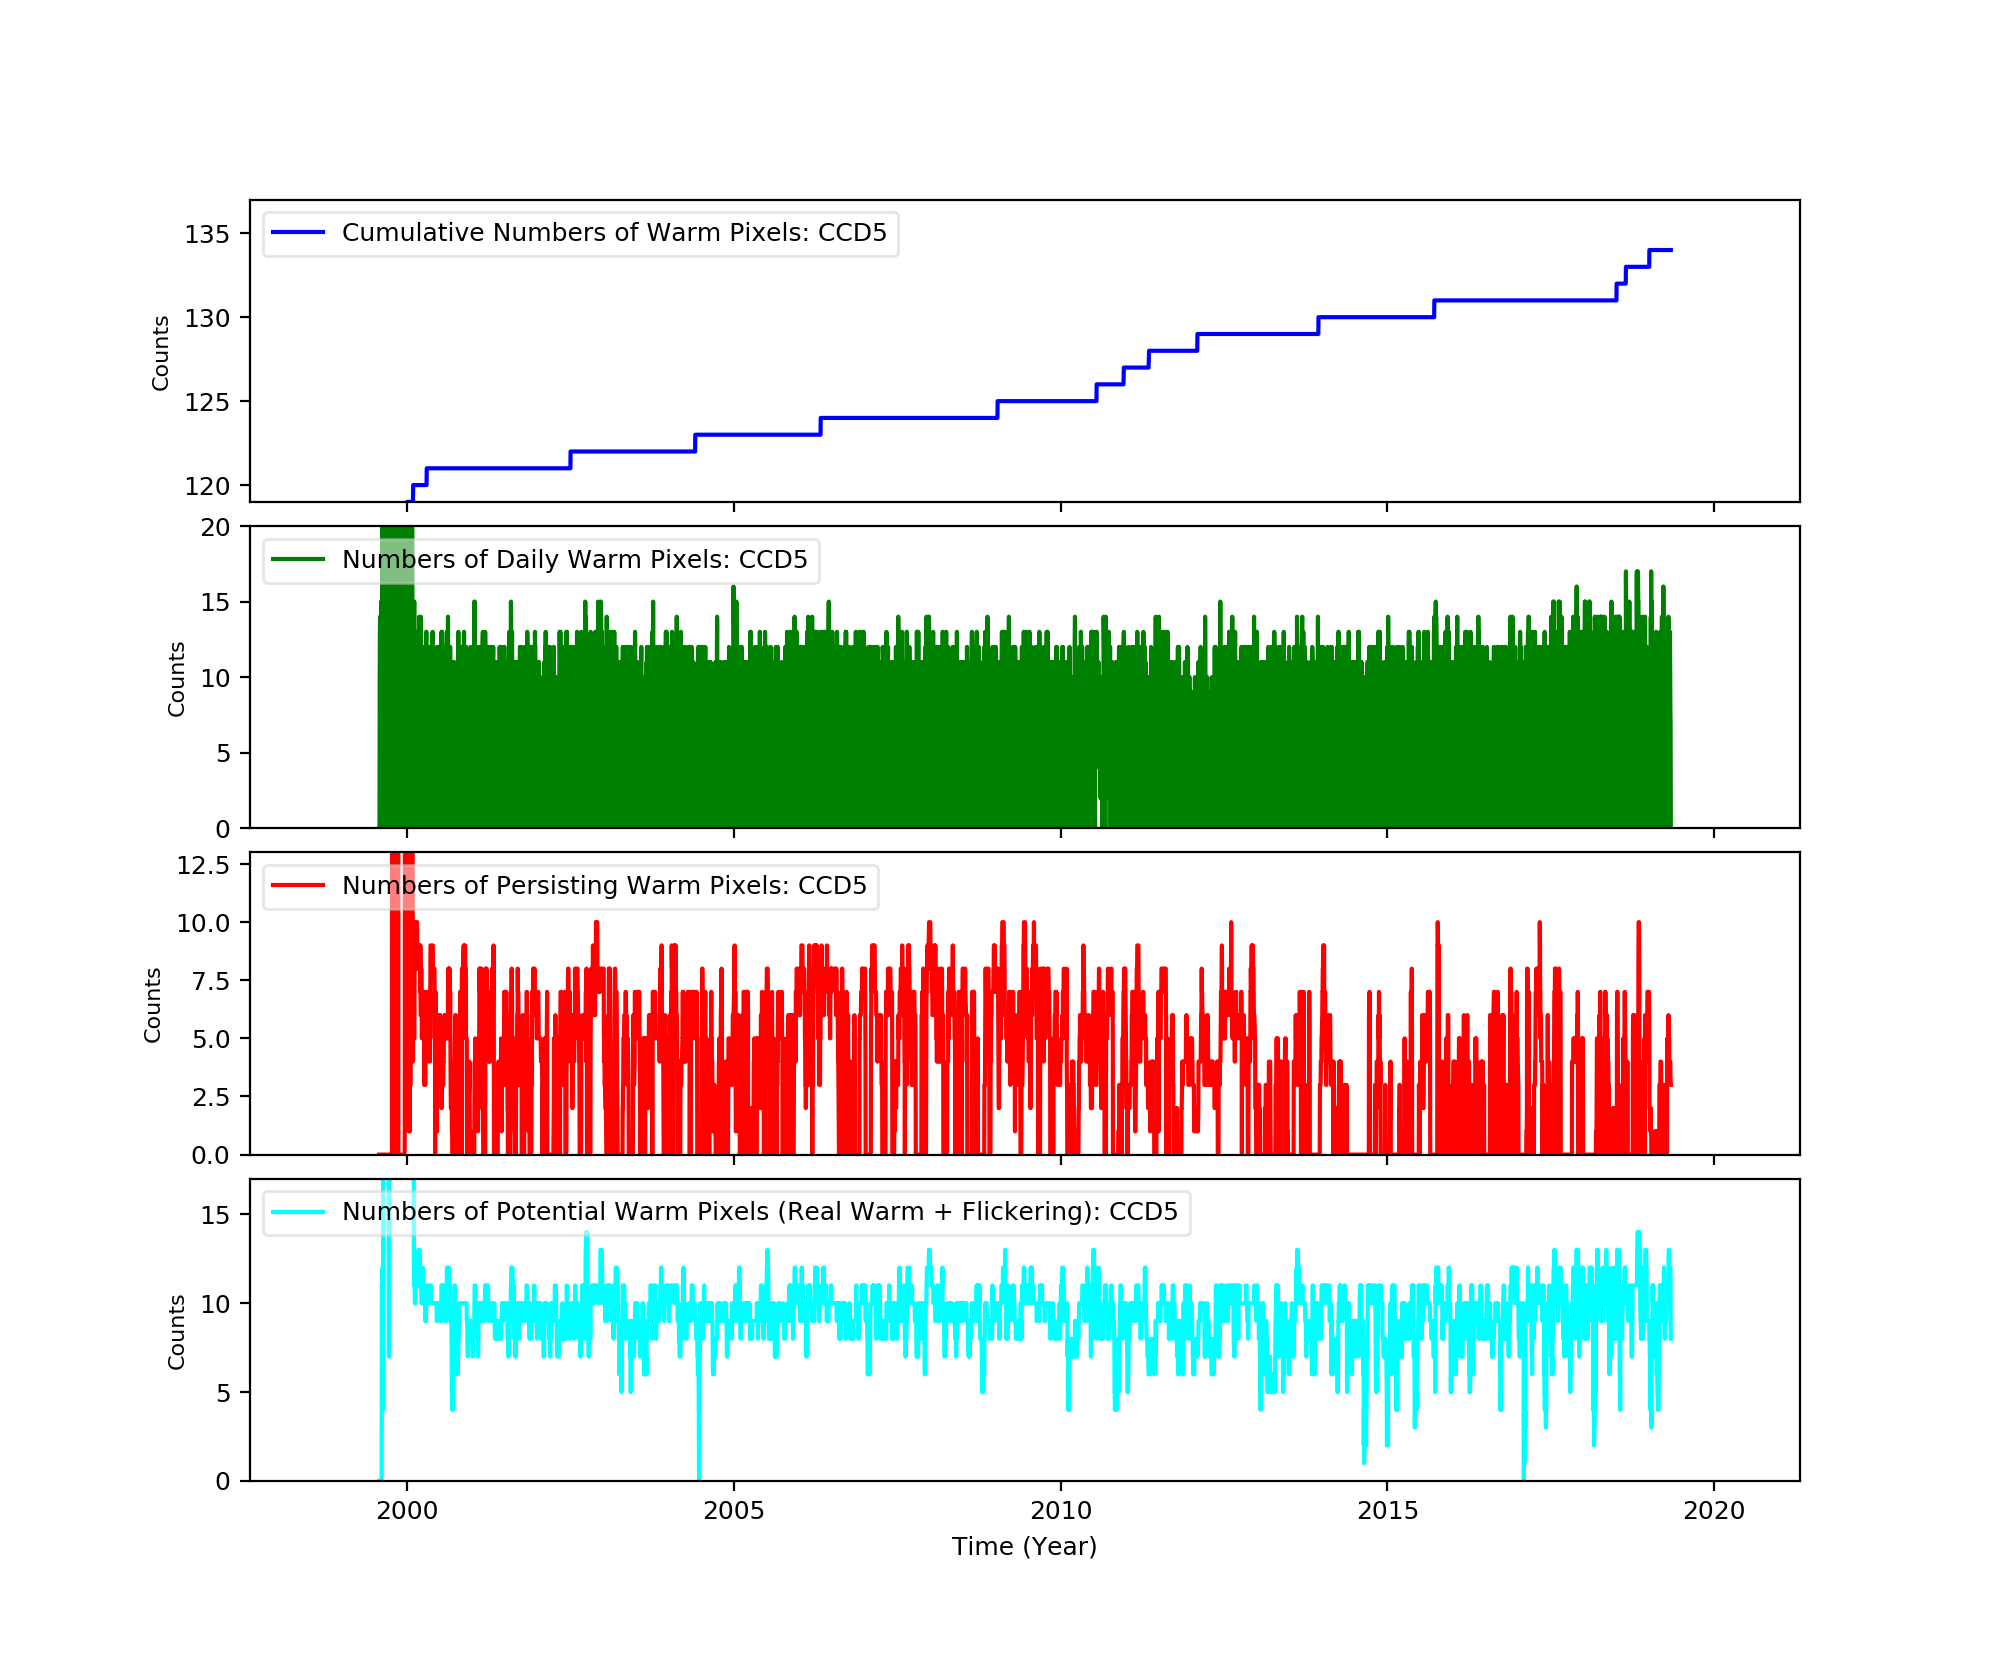
Bad Pixels
The plots below were generated with a new warm pixel finding script. Please see Acis Bad Pixel Page for details.
Front Side CCDs
Back Side CCD (CCD5)
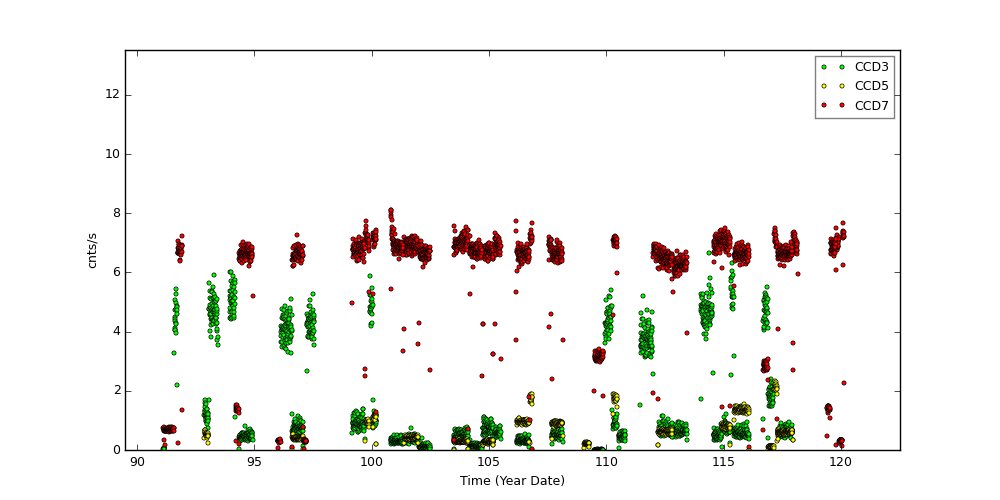
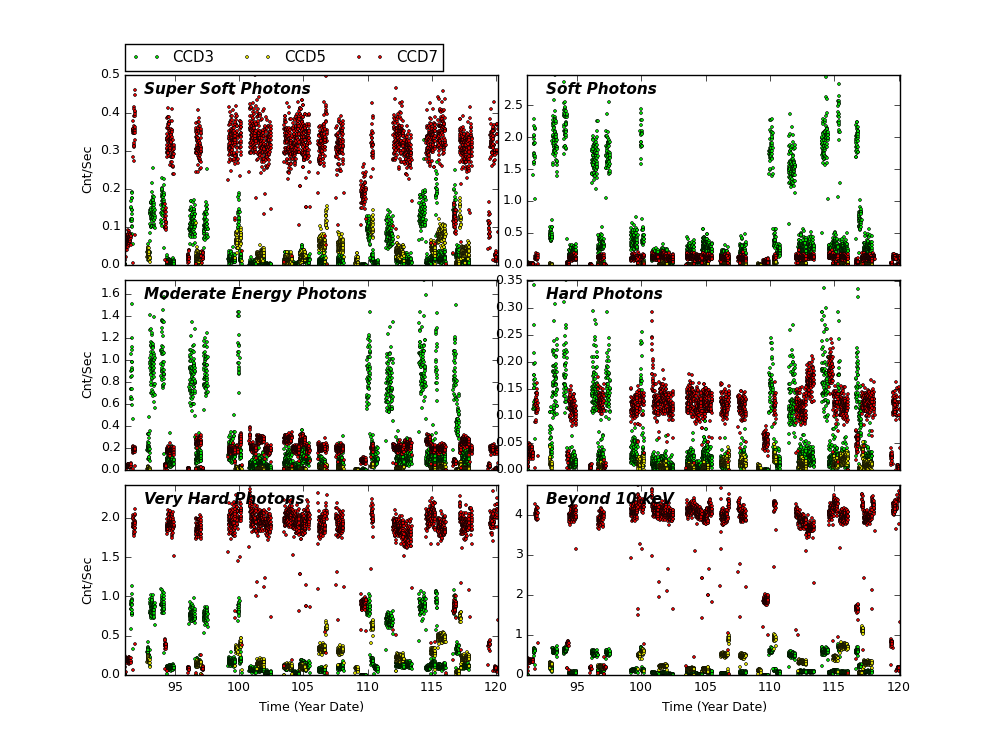
Science Instrument Background Rates
| Name | Low (keV) | High(KeV) | Description |
|---|---|---|---|
| SSoft | 0.00 | 0.50 | Super soft photons |
| Soft | 0.50 | 1.00 | Soft photons |
| Med | 1.00 | 3.00 | Moderate energy photons |
| Hard | 3.00 | 5.00 | Hard Photons |
| Harder | 5.00 | 10.00 | Very Hard photons |
| Hardest | 10.00 | Beyond 10 keV |
HRC
DOSE of Central 4K Pore-Pairs
Please refer to Maximum Dose Trends for more details.
)
|
|---|
IMAGE                NPIX      MEAN    STDDEV      MIN       MAX
HRCI_04_2019.fits  16777216	0.036 	0.200 	0.000 	13.000
)
IMAGE                       NPIX      MEAN    STDDEV      MIN       MAX
HRCI_08_1999_04_2019.fits  16777216	5.731 	5.767 	0.000 	302.000
)
|
|---|
IMAGE                NPIX      MEAN    STDDEV      MIN       MAX
HRCS_04_2019.fits  16777216	0.053 	0.433 	0.000 	53.000
)
IMAGE                       NPIX      MEAN    STDDEV      MIN       MAX
HRCS_08_1999_04_2019.fits  16777216	18.042 	32.810 	0.000 	1730.000
|
|
Max dose trend plots corrected for events that "pile-up"
in the center of the taps due to bad position information.
|
)
|
)
|
)
|
)
|
| Jan 2019 | Oct 2018 | Jul 2018 | Apr 2018 |
|---|
)
|
)
|
)
|
)
|
| Jan 2019 | Oct 2018 | Jul 2018 | Apr 2018 |
|---|
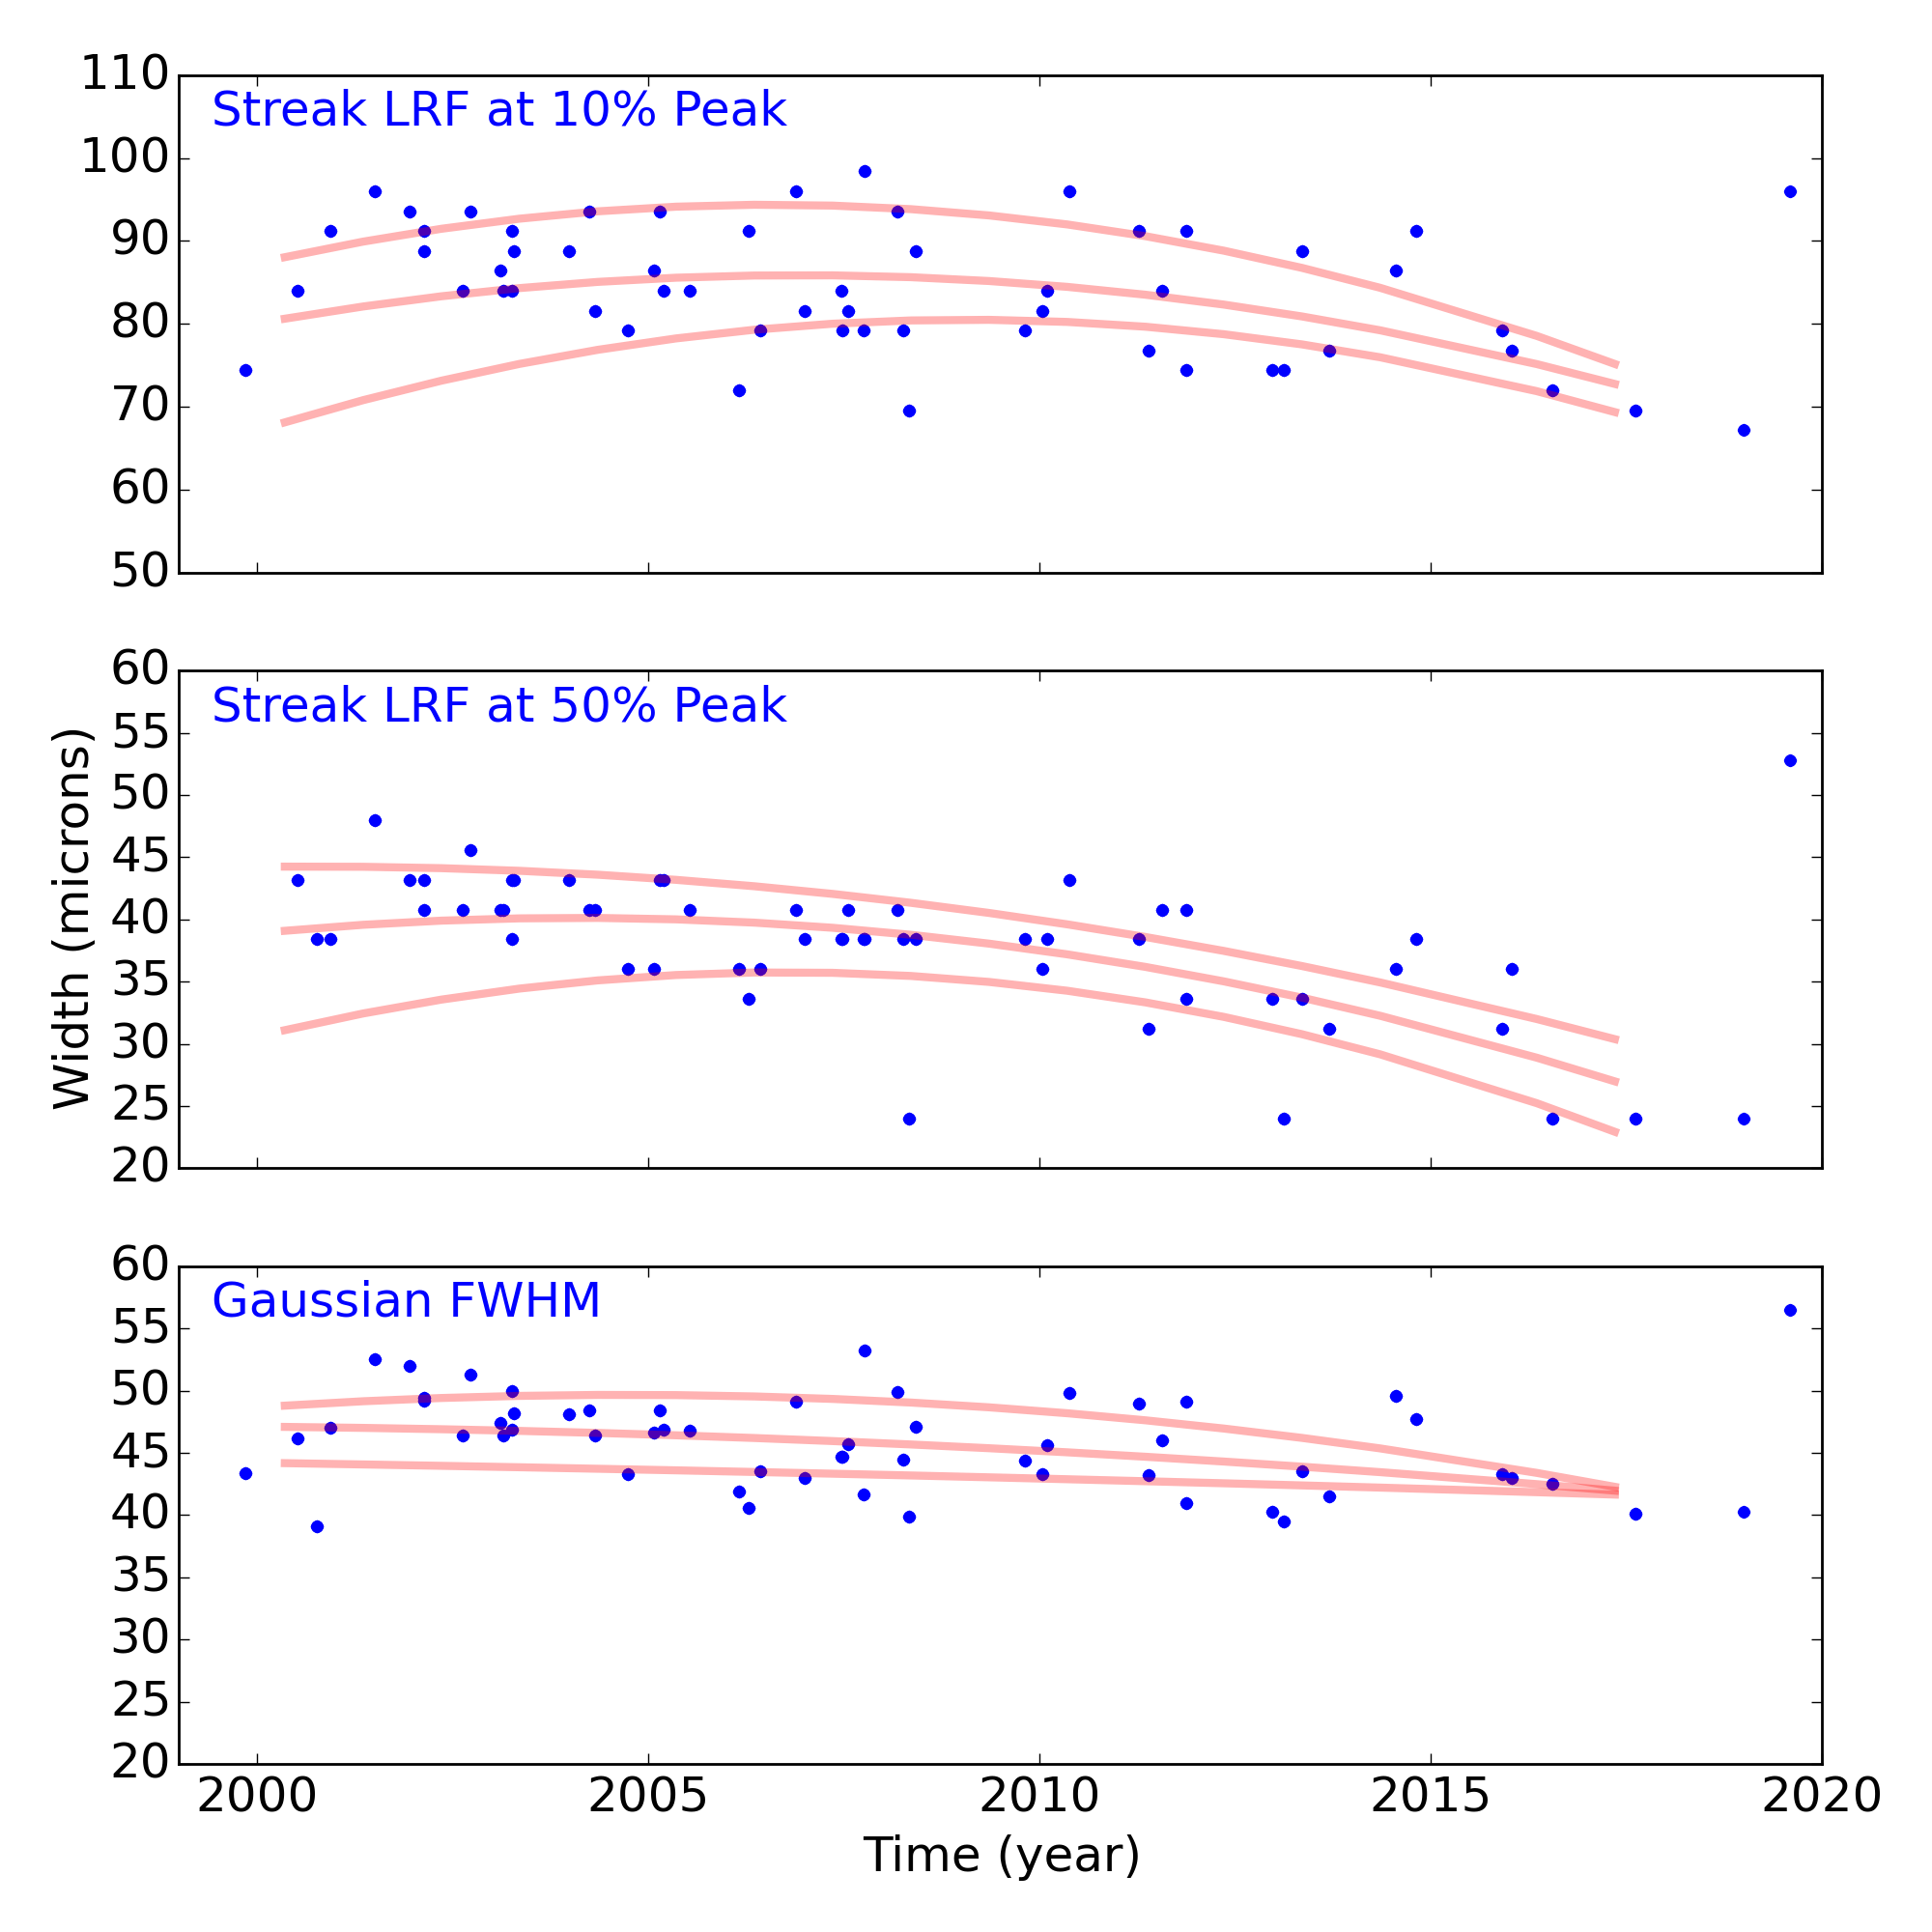
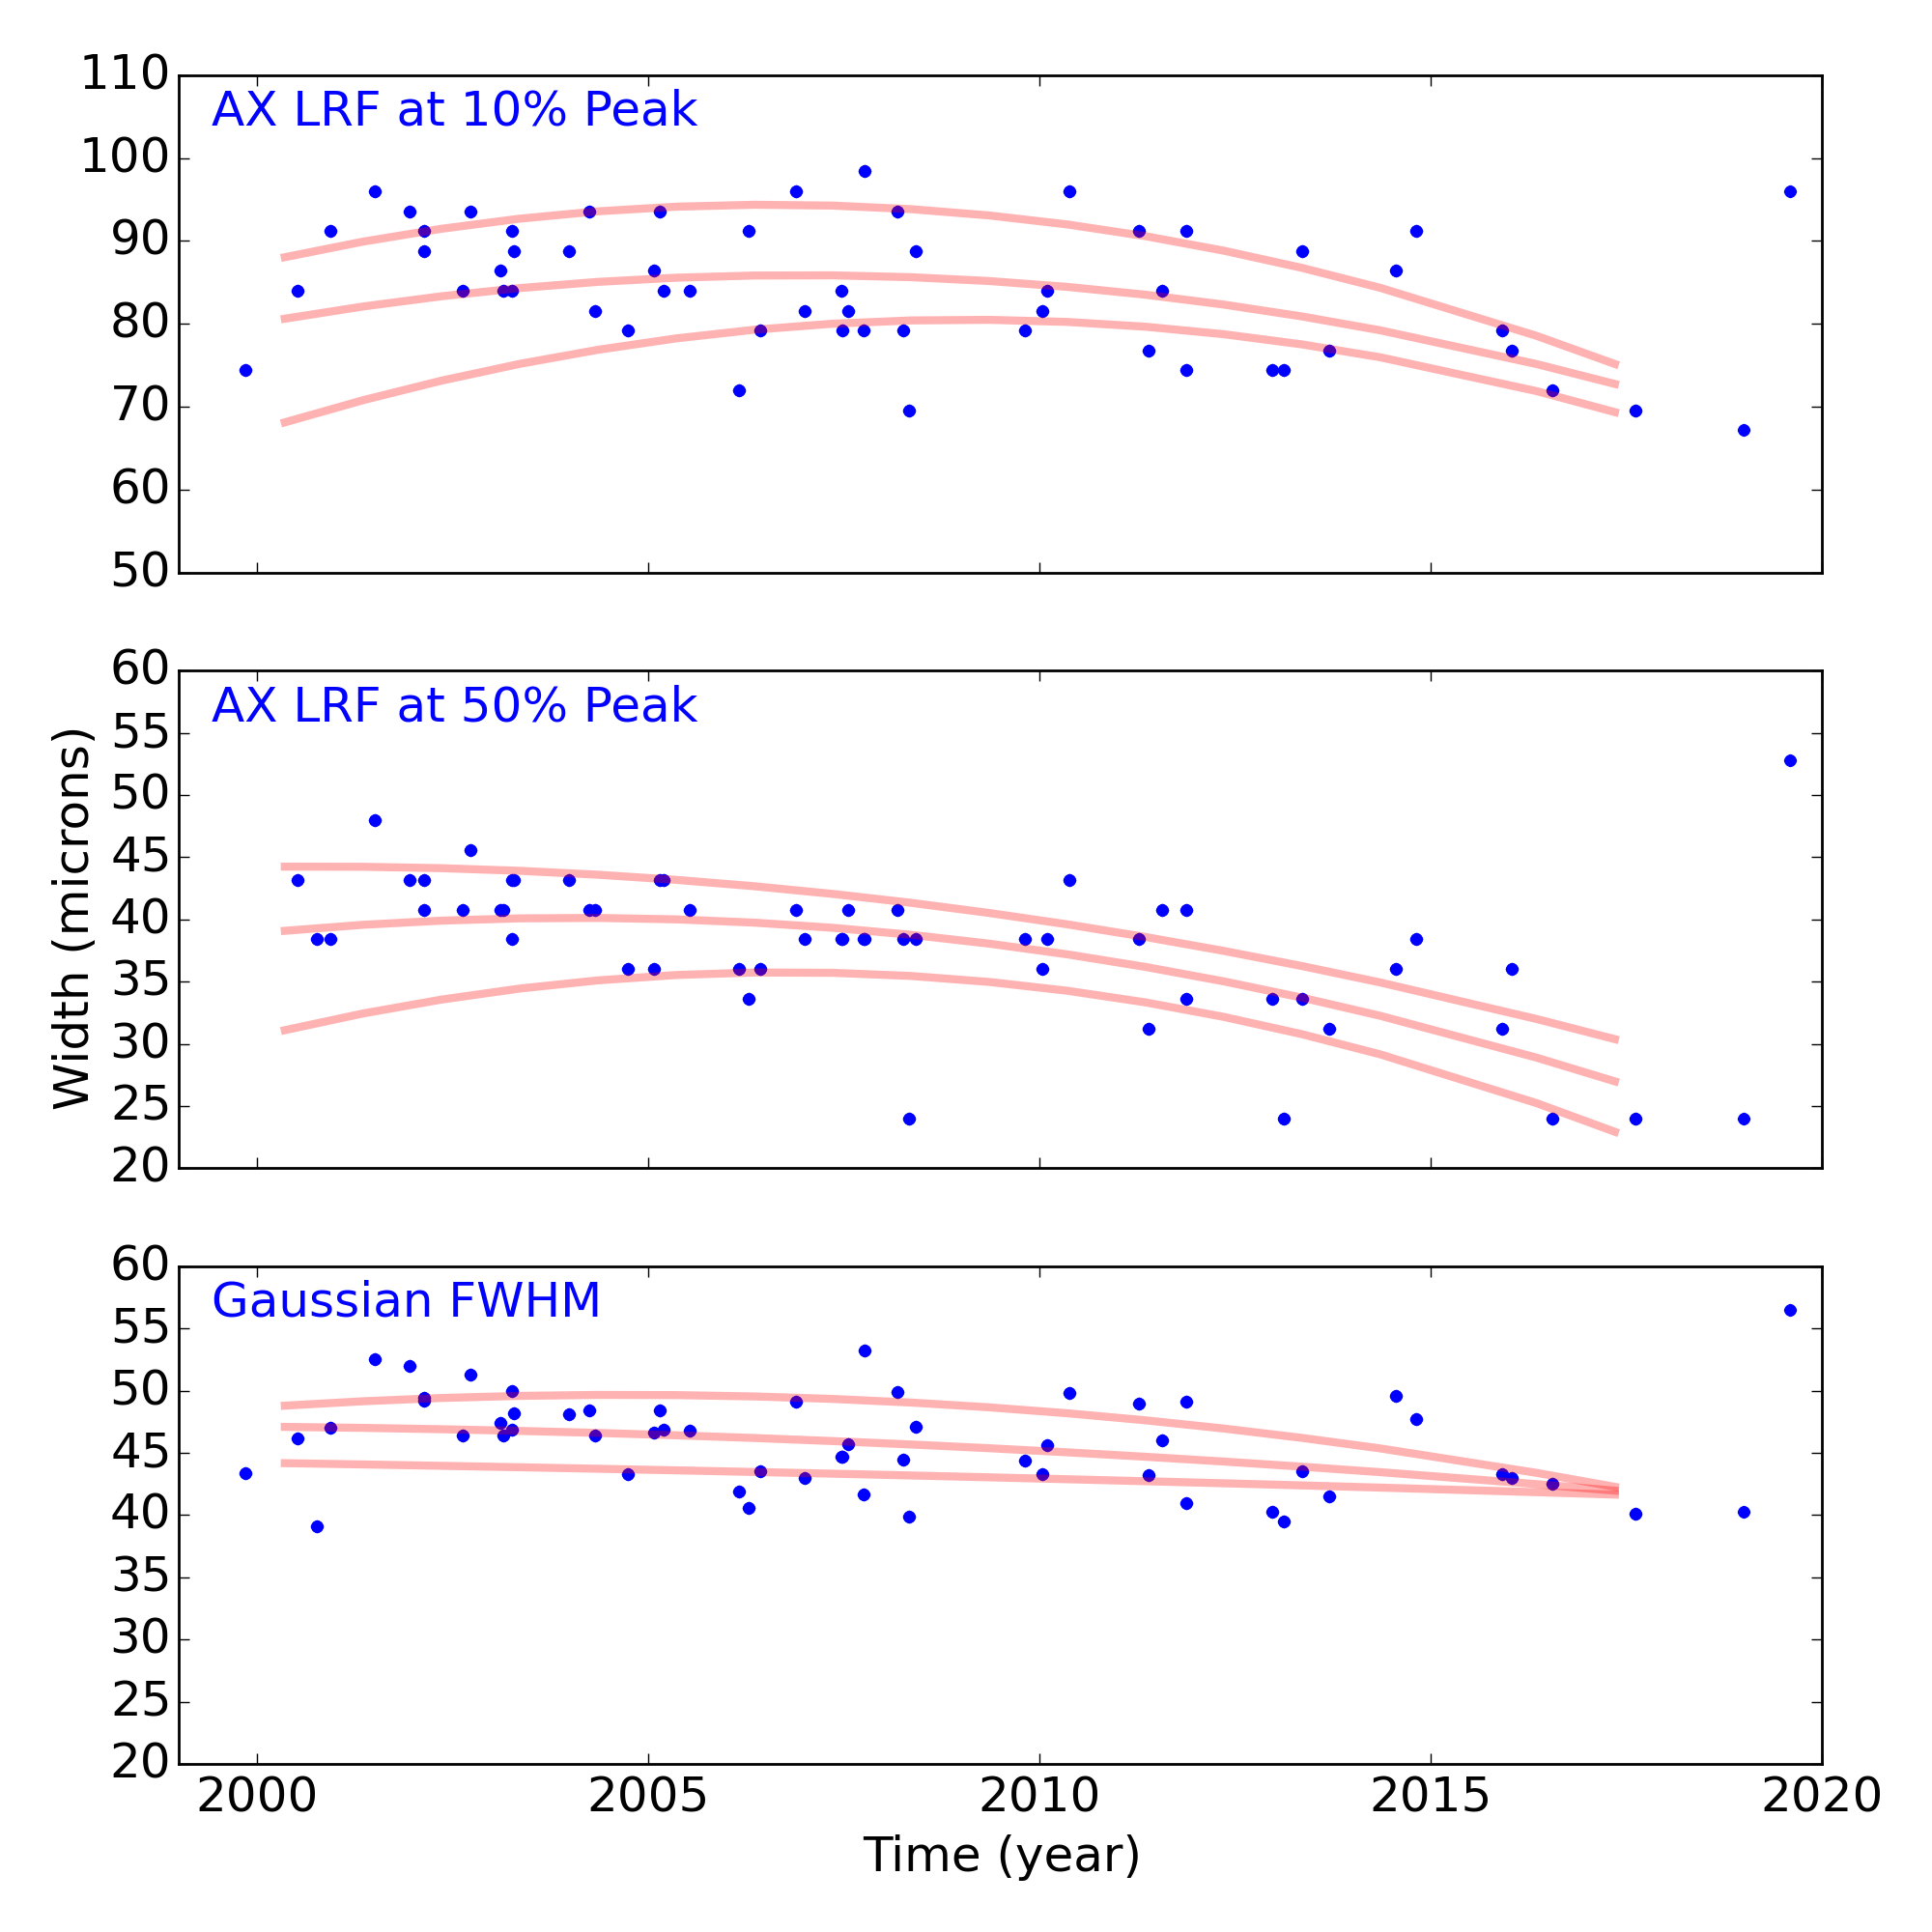
Gratings
Grating Trends/Focus
We plot the width of the zero order streak of ACIS/HETG observations and the width of the zero order image for HRC/LETG observations of point sources. No significant defocusing trend is seen at this time. See Gratings Trends pages.
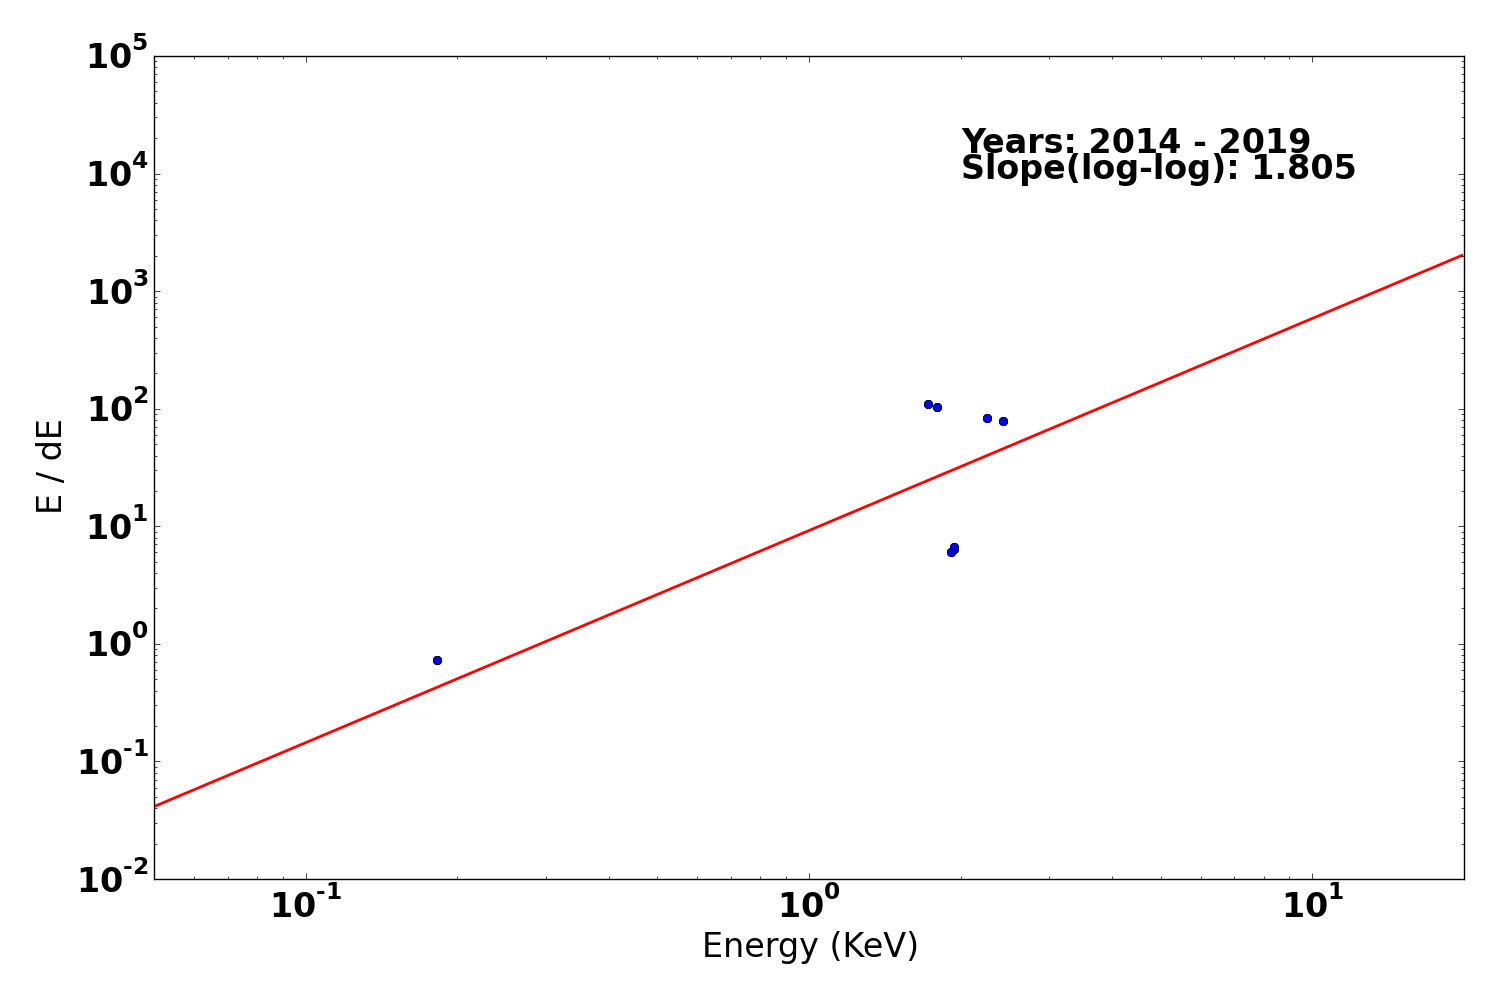
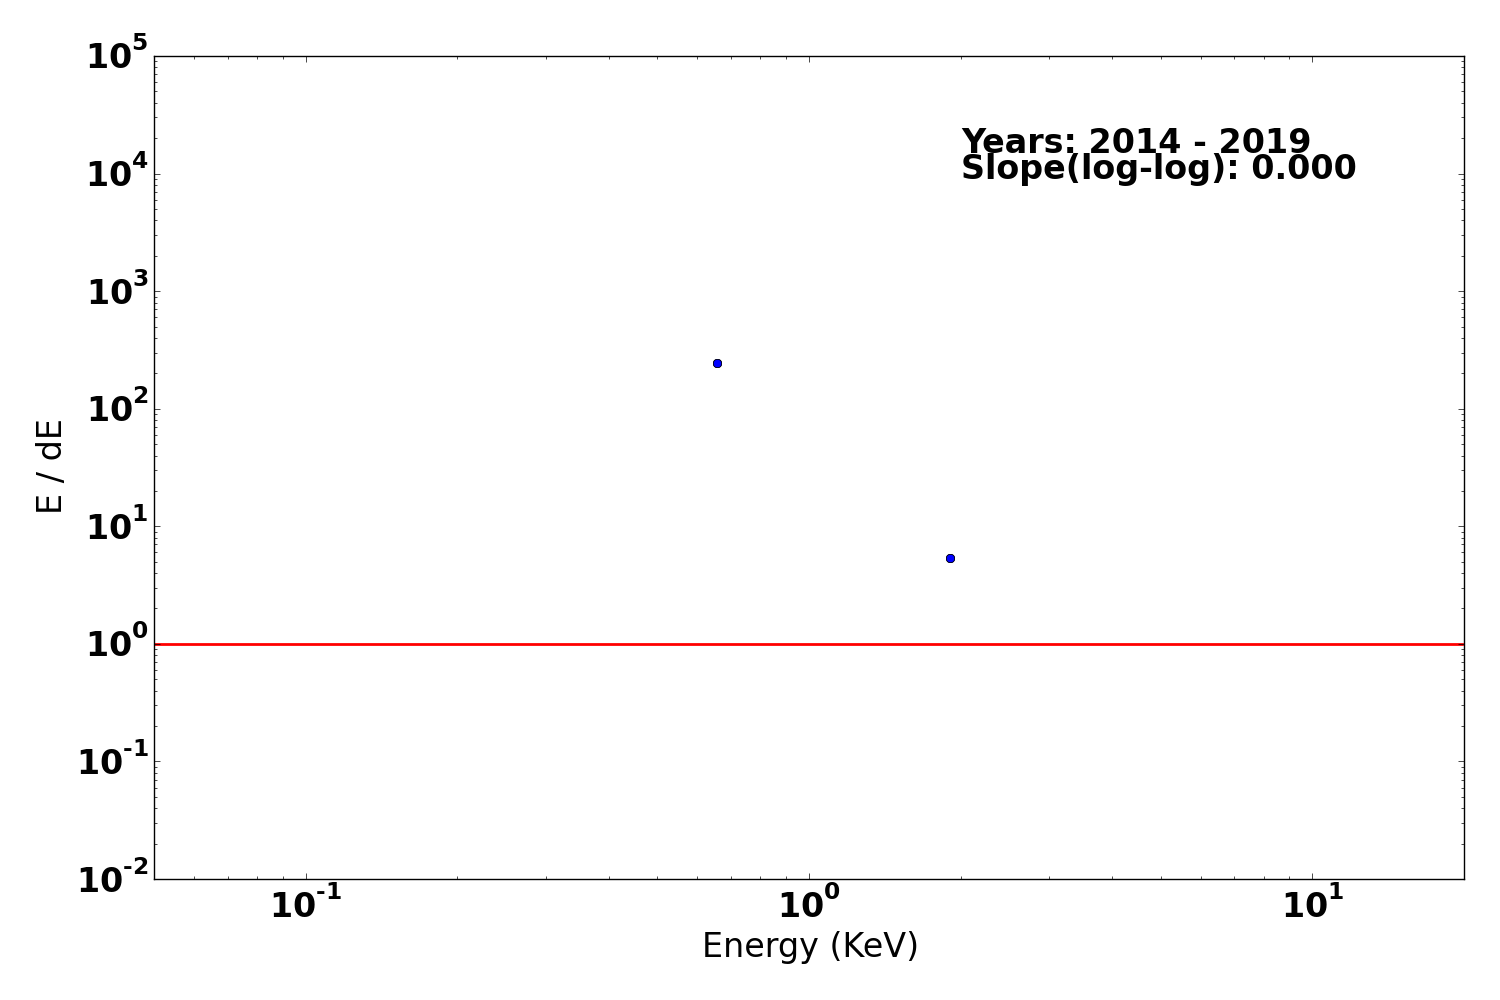
Gratings Resolving Power
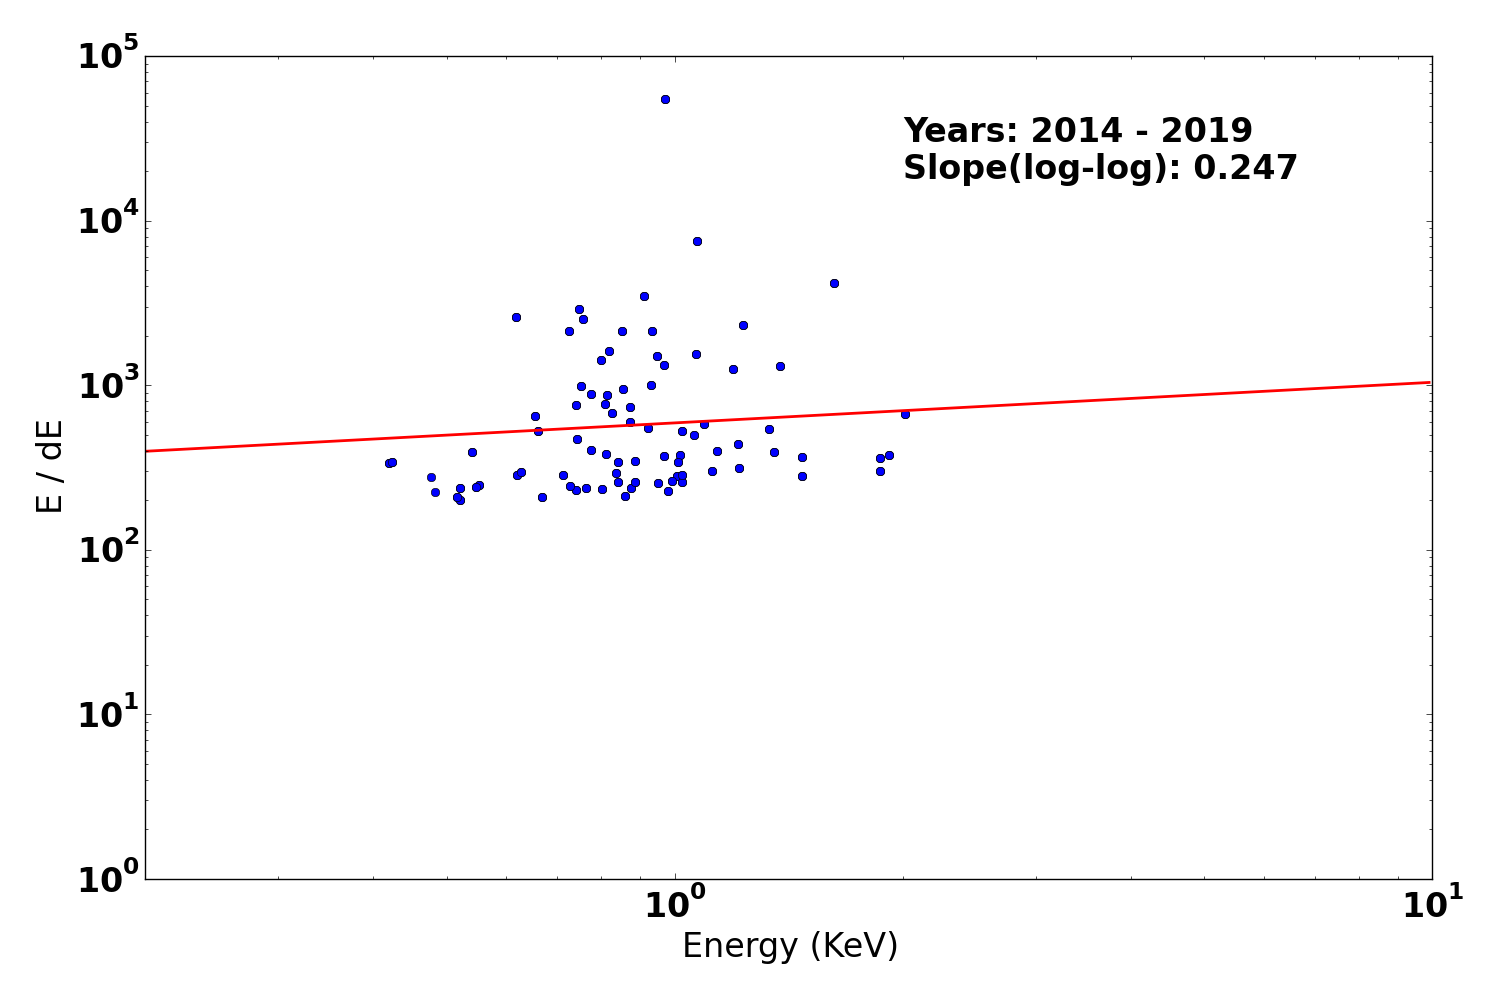
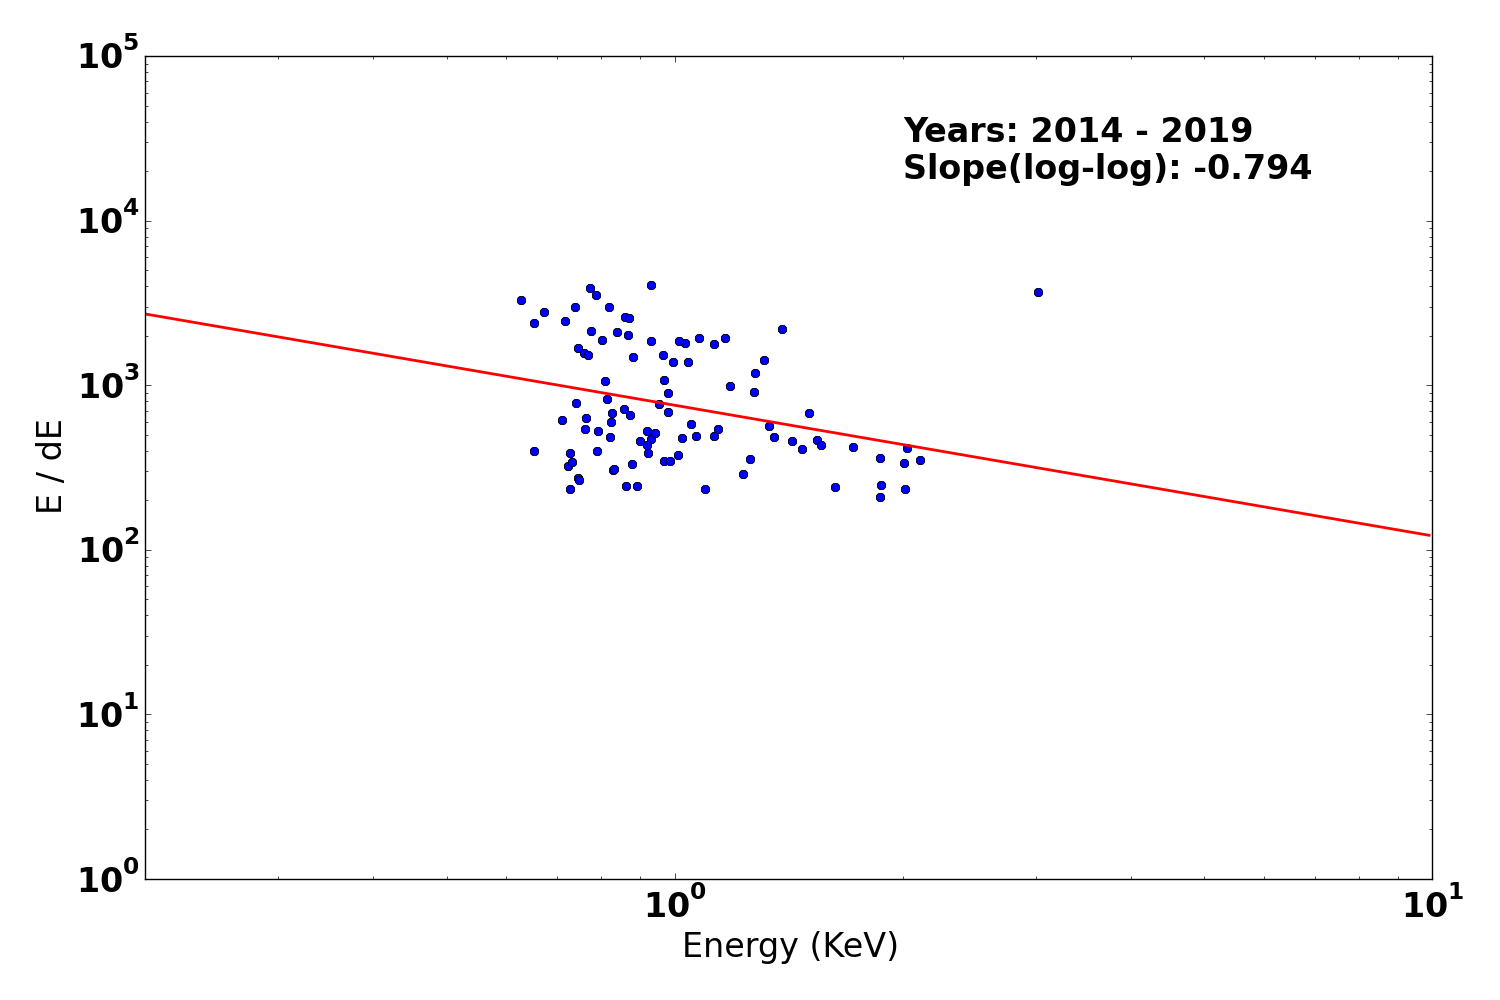
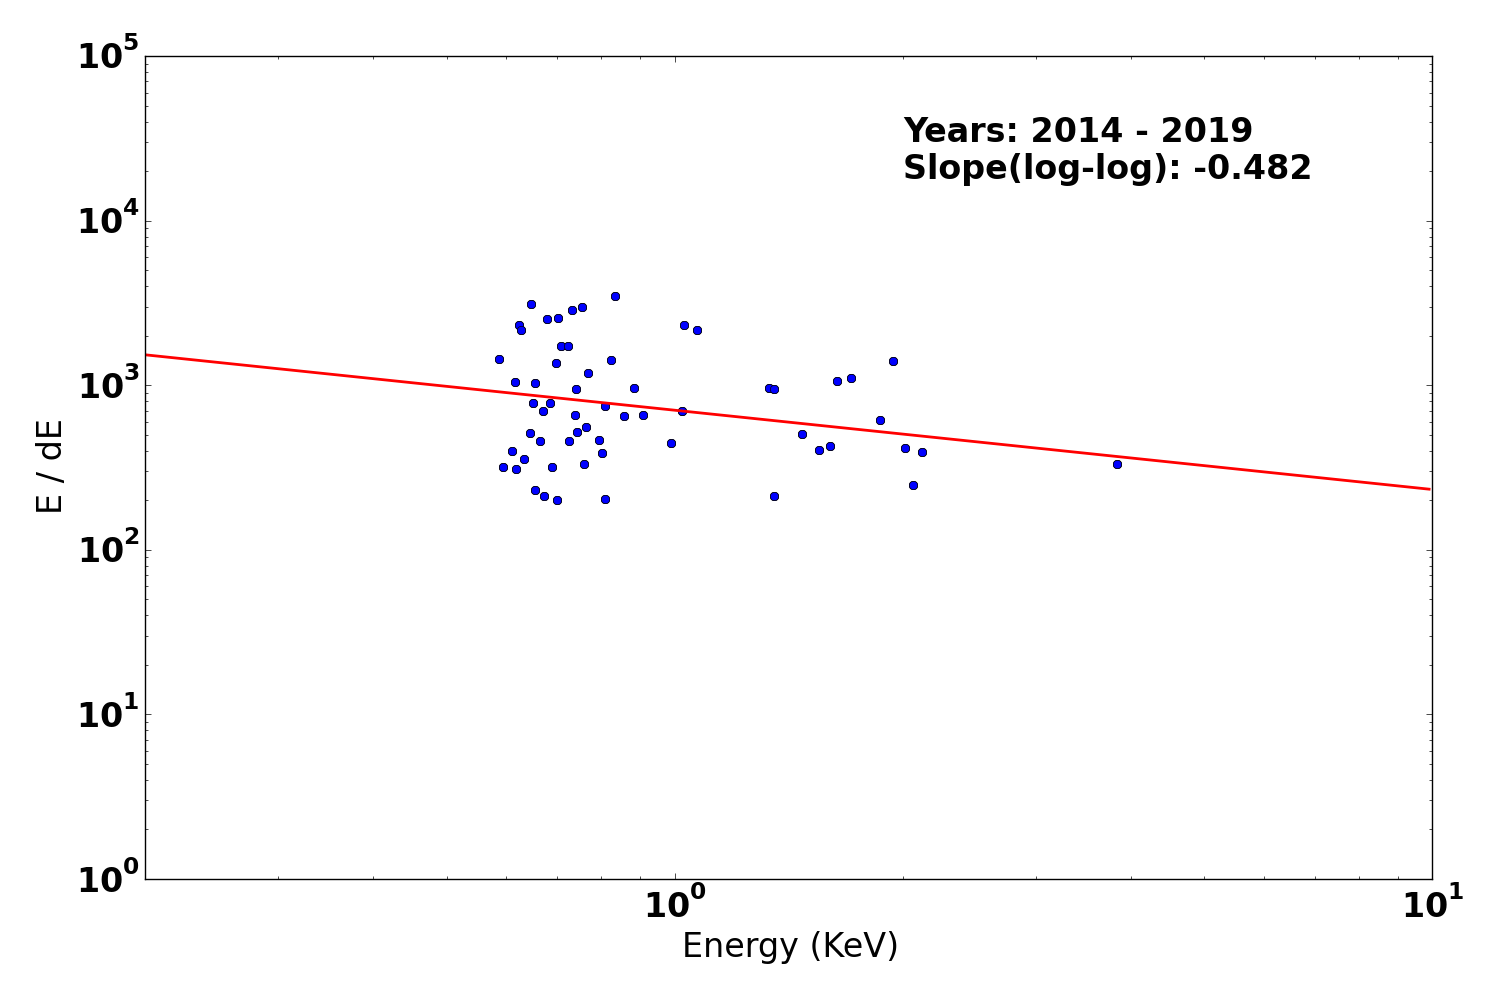
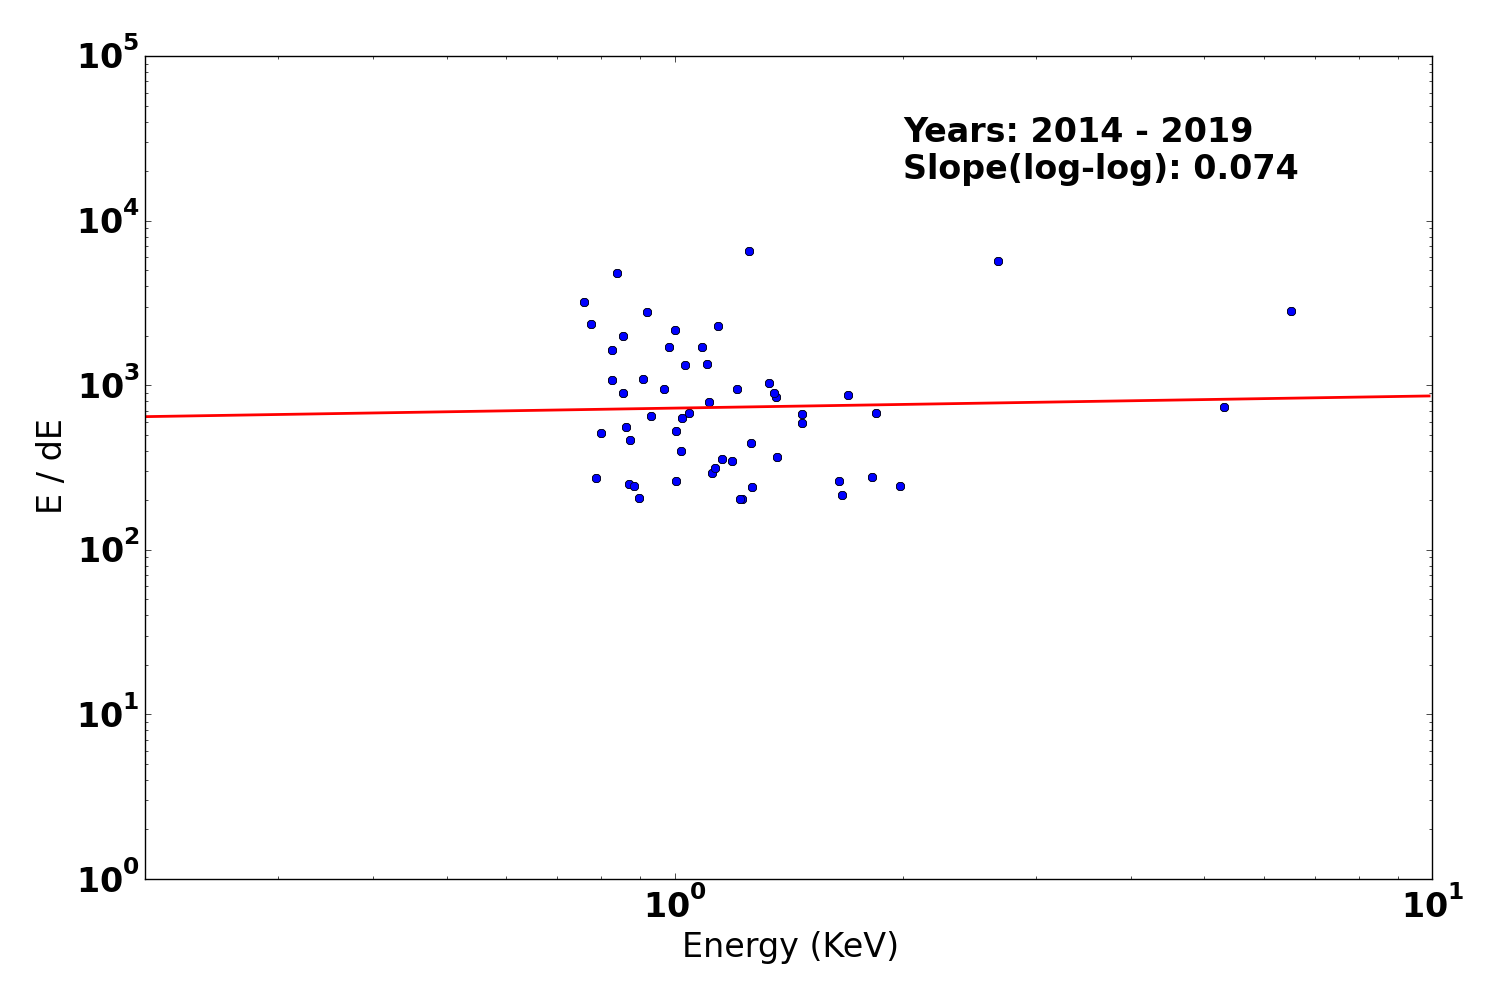
We plot E/dE vs. E for fits to detected lines with fwhm_error/fwhm less than 0.15 for the plus and minus arms of HEG, MEG, and LEG. Also shown are conservative (dotted line) and optimistic (dashed line) pre-launch resolving power expectations.
We have selected only calibration observations of Capella, HR1099, and Sigma Gem. See MIT technotes for a parallel analysis.
| Year 2014 - | |
|---|---|
| Letg minus side | Letg plus side |
 |
 |
| Metg minus side | Metg plus side |
 |
 |
| Hetg minus side | Hetg plus side |
 |
 |
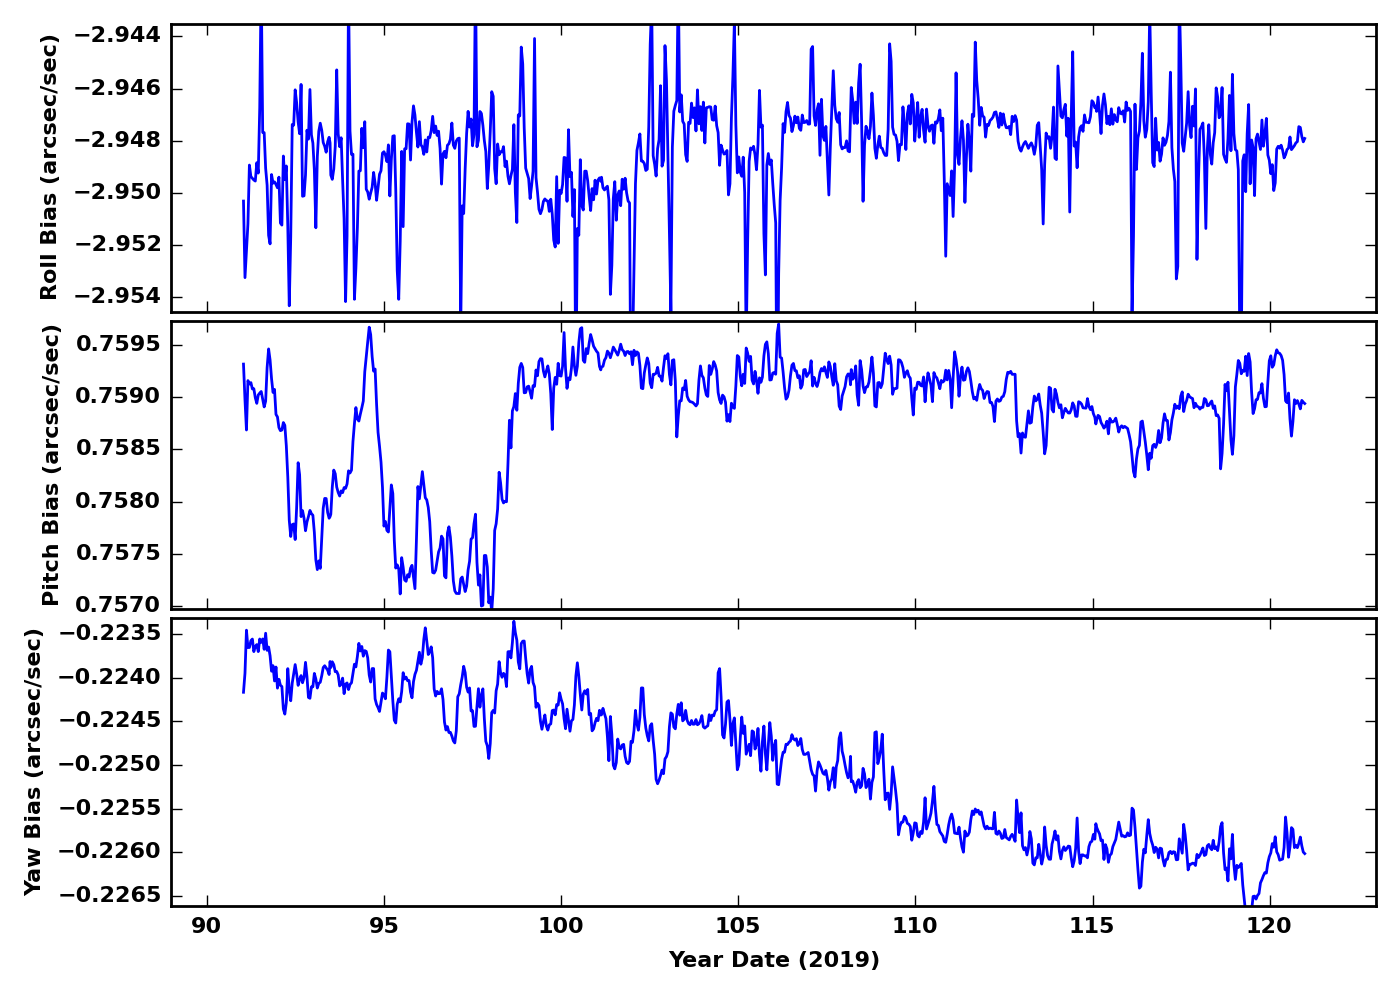
PCAD
ACA Trending
Gyro Bias Drift
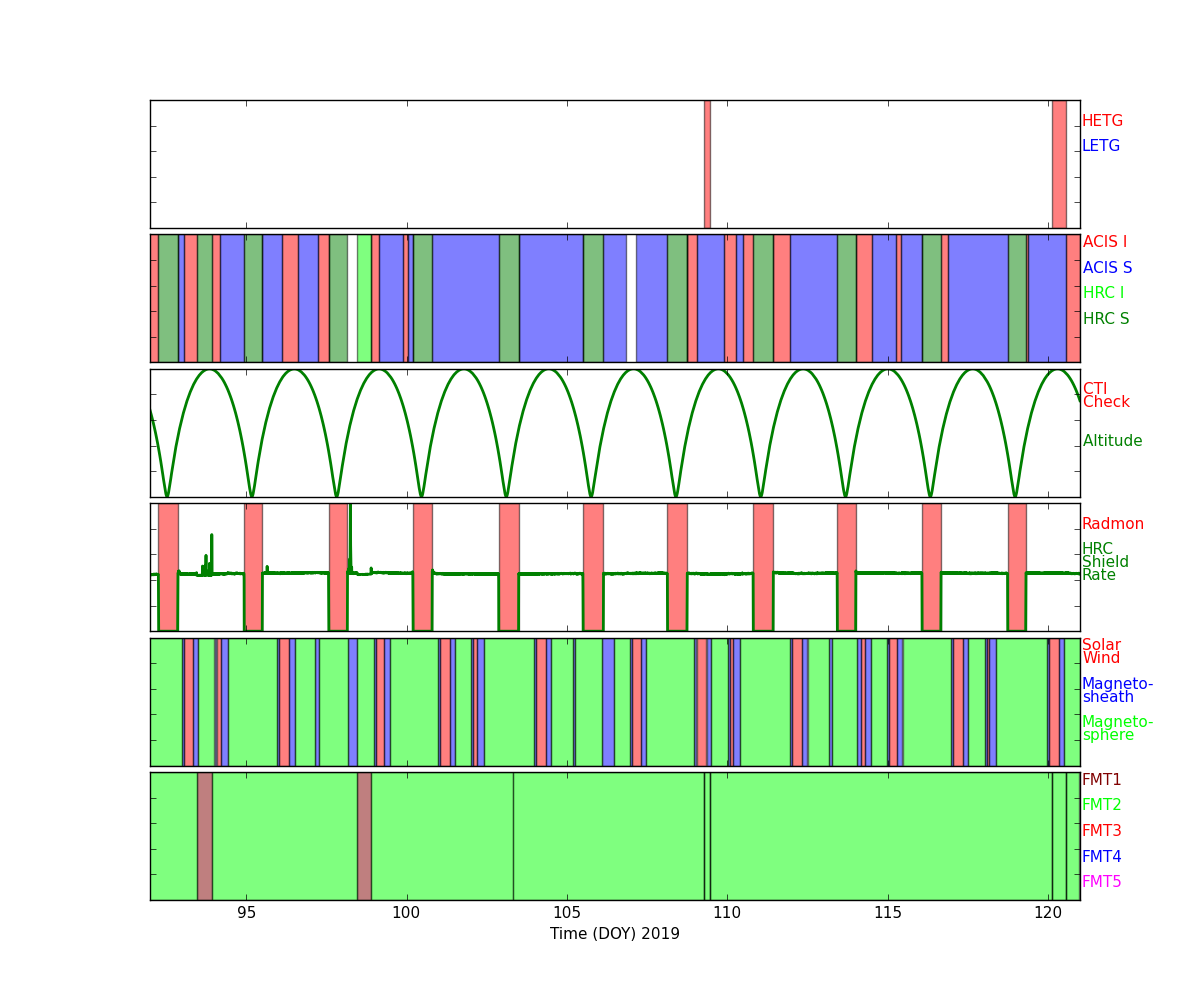
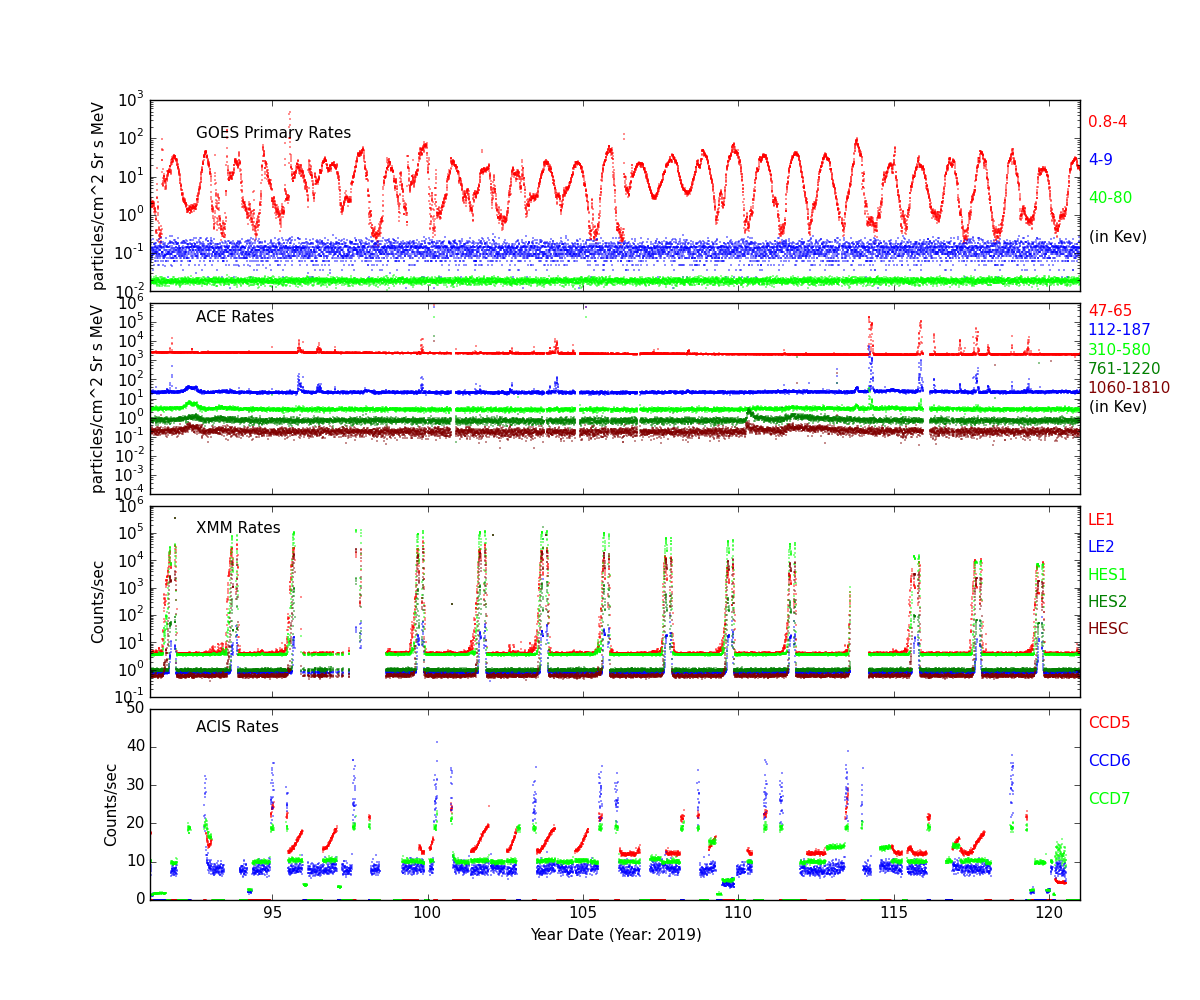
Radiation History
Radiation Count Rates of Apr 2019
Sun Spot History
SIM
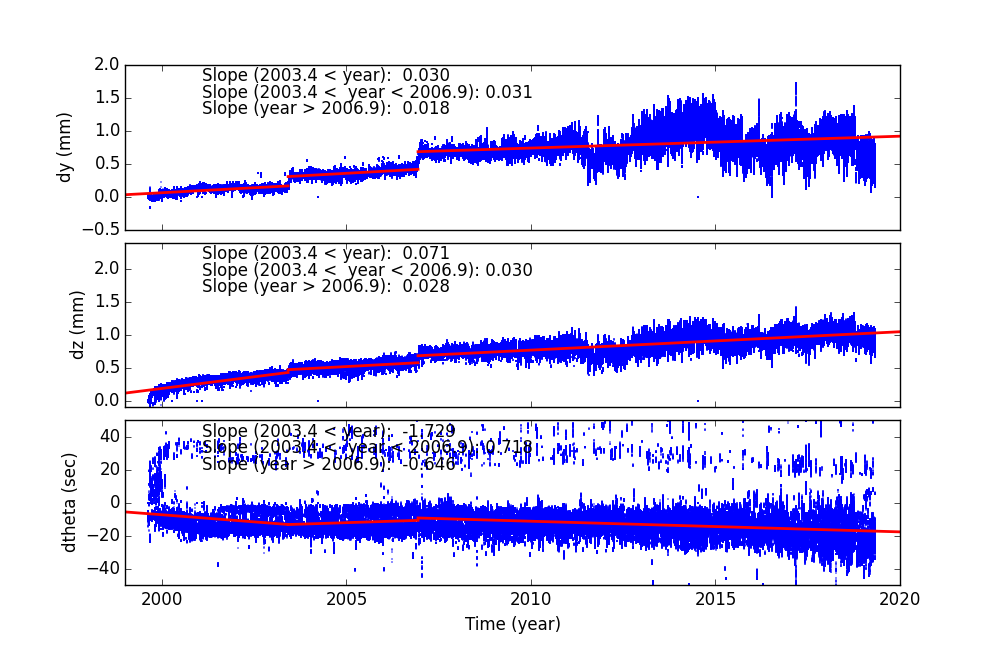
SIM Shift and Twist
SIM Shift and Twist Trend The following plots show trends of SIM shifts (dy and dz) and twist (dtheta). All quantities are directly taken from pcaf*_asol1.fits files. The units are mm for dy and dz, and degree for dtheta. We fit three lines separated before and after (Days of Mission)= 1400 (May 21, 2003), 2700 (Dec 11, 2006), and 4400 (Aug 07, 2011). The unit of slopes are mm per day or degree per day.
The sudden shift around DOM = 1400, 2700 and 4400 are due to fid light drift (see a memo by Aldcroft fiducial light drift). On the dtheta plot, two tracks are clearly observed. The track around 0.01 is due to HRC-I, and all others are clustered around -0.002. For more detail, please see SIM Shift and Twist Trend page
Trending
Quarterly Trends
- EPS Batteries
| Previous Quarter | ||||||
| MSID | MEAN | RMS | DELTA/YR | DELTA/YR/YR | UNITS | DESCRIPTION |
| eb2ci | 0.296 | 0.008 | (-1.29+/-0.05)e-4 | (-9.40+/-0.56)e-4 | AMP | BATT 2 CHARGE CURRENT |
|---|---|---|---|---|---|---|
| eb2di | 0.015 | 0.000 | (0.00+/-0.00)e0 | (3.10+/-0.12)e-8 | AMP | BATT 2 DISCHARGE CURRENT |
| eb2v | 32.334 | 0.014 | (5.02+/-6.64)e-6 | -0.002+/-0.000 | V | BATT 2 VOLTAGE |
| ecnv1v | 14.893 | 0.003 | (1.42+/-0.22)e-5 | 0.001+/-0.000 | V | CONV 1 +15V OUTPUT |
| ecnv2v | 14.846 | 0.011 | (3.49+/-0.91)e-5 | 0.005+/-0.000 | V | CONV 2 +15V OUTPUT |
| ecnv3v | 15.295 | 0.003 | (-4.57+/-2.38)e-6 | (-2.29+/-0.09)e-4 | V | CONV 3 +15V OUTPUT |
- Spacecraft Electronics
| Previous Quarter | ||||||
| MSID | MEAN | RMS | DELTA/YR | DELTA/YR/YR | UNITS | DESCRIPTION |
| elbi | 54.839 | 1.290 | -0.001+/-0.001 | -0.177+/-0.007 | AMP | LOAD BUS CURRENT |
|---|---|---|---|---|---|---|
| elbv | 28.424 | 0.141 | 0.006+/-0.000 | 0.017+/-0.001 | V | LOAD BUS VOLTAGE |
- OBA Heater
| Previous Quarter | ||||||
| MSID | MEAN | RMS | DELTA/YR | DELTA/YR/YR | UNITS | DESCRIPTION |
| oobthr04 | 299.792 | 0.600 | 0.002+/-0.000 | 0.206+/-0.011 | K | RT 27: HRMA STRUT |
|---|---|---|---|---|---|---|
| oobthr12 | 298.704 | 1.261 | 0.002+/-0.001 | 0.257+/-0.014 | K | RT 35: OBA FWD CONE |
| oobthr26 | 301.428 | 2.787 | 0.005+/-0.002 | 0.479+/-0.022 | K | RT 48: OBA AFT CONE |
| oobthr38 | 283.190 | 0.012 | (-4.98+/-0.84)e-5 | (-1.02+/-0.89)e-4 | K | RT 60: TFTE FWD CYLINDER |
| oobthr44 | 300.294 | 1.170 | 0.004+/-0.001 | 0.181+/-0.011 | K | RT 66: TFTE AFT CYLINDER |
| oobthr50 | 295.016 | 1.046 | 0.003+/-0.001 | 0.429+/-0.018 | K | RT 76: S/C STRUT |
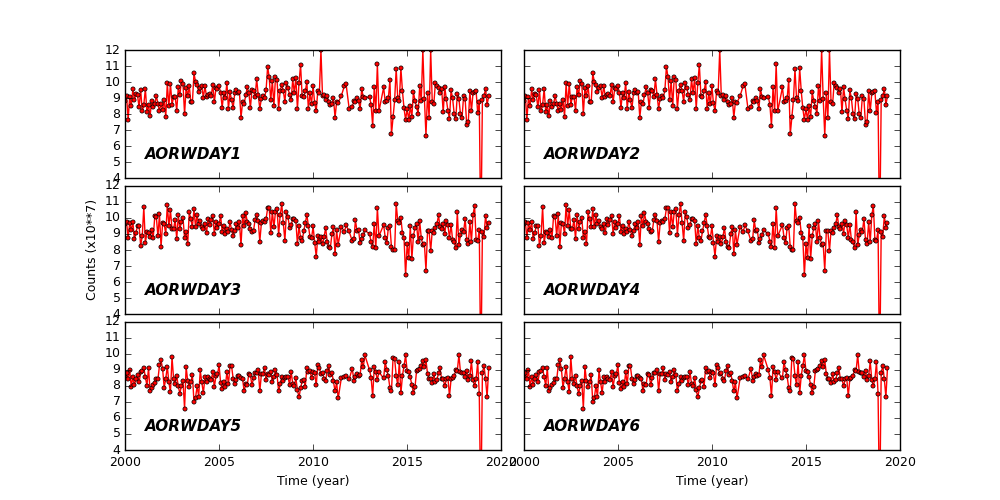
Spacecraft Motions
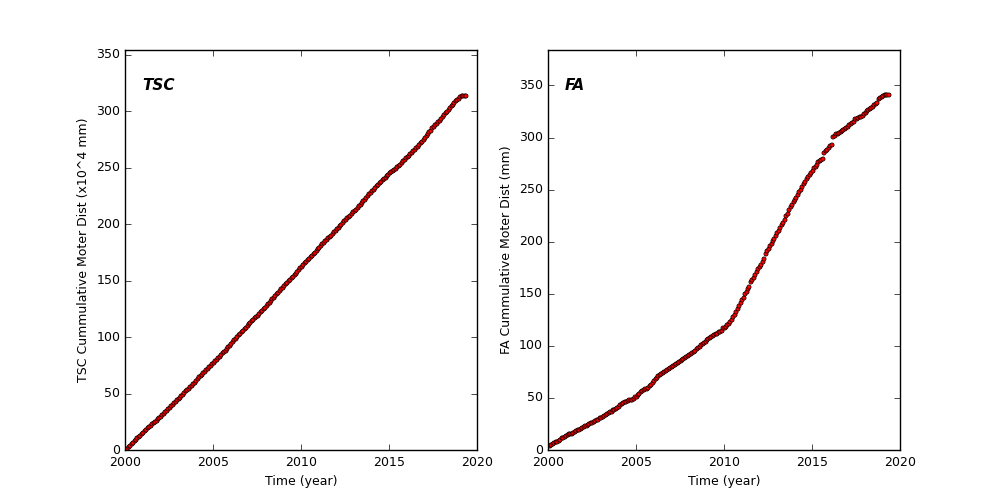
TSC and FA Cummulative Moter Distance
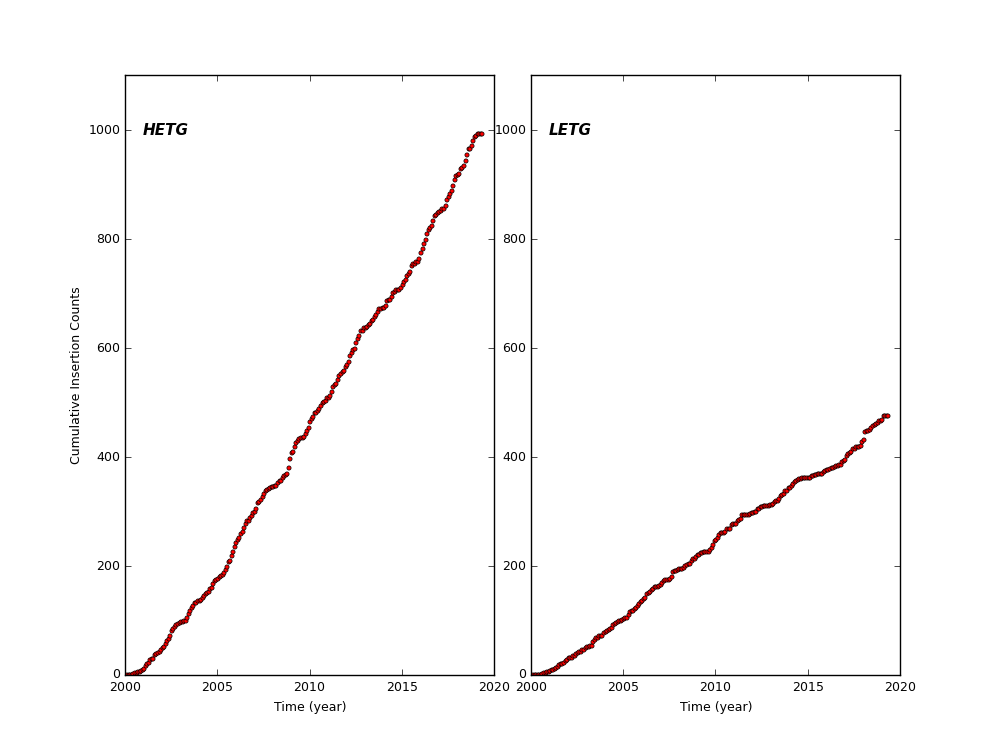
HETG and LETG Cummulative Insertion Counts
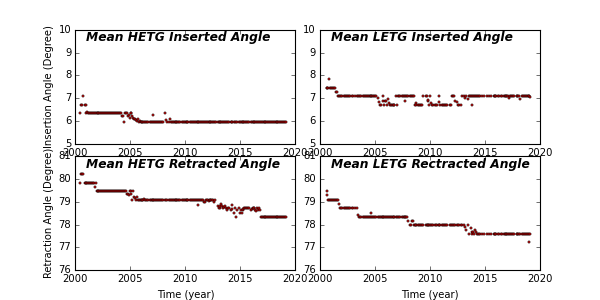
HETG/LETG Insertion/Retraction Angle
Reaction Wheel Rotations