ACIS
ACIS DOSE Registered-Photon-Map
The steps we took to compute the dose map are;
- Level 1 Event files for a specified month are obtained from archive.
- Image data including I2, I3, S2, S3 CCDs are extracted from all event files.
- All the extracted image data were merged to create a month long exposure map for the month.
- The exposure map is opened with ds9, and check a distribution of count rates against energy. From this, estimate the upper threshold value. Any events beyond this upper threshold are assumed erroneous events such as bad pixels.
- Using this upper threshold, the data is filtered, and create a cleaned exposure map for the month.
- The exposure map from each month from the Sep 1999 is added up to create a cumulative exposure map for each month.
- Using fimgstatistic, we compute count rate statistics for each CCDs.
- For observations with high data drop rates (e.g., Crab nebula, Cas A), we corrected the observations by adding events.
Please check more detail plots at Telemetered Photon Dose Trend page.
)
)
)
Statistics:
# IMAGE     NPIX     MEAN        RMS        MIN     MAX
ACIS_aug19 6004901       9.987         45.979           0.0     12370


I2 node 0  262654	8.254915	3.592014	0.0	 67.0
I2 node 1  262654	8.577560	6.918827	0.0	2911.0
I2 node 2  262654	8.373765	3.567924	0.0	117.0
I2 node 3  262654	8.448300	9.340644	0.0	2010.0

I3 node 0  262654	10.620310	4.405731	0.0	579.0
I3 node 1  262654	10.573680	4.412152	0.0	174.0
I3 node 2  262654	9.961440	3.935274	0.0	119.0
I3 node 3  262654	9.912021	4.096990	0.0	320.0

S2 node 0  262654	12.685915	32.698966	0.0	12370.0
S2 node 1  262654	13.377891	13.220599	0.0	645.0
S2 node 2  262654	15.282008	24.127258	0.0	3880.0
S2 node 3  262654	15.960632	26.722394	0.0	962.0

S3 node 0  262654	28.442743	199.068584	0.0	8765.0
S3 node 1  262654	17.229003	27.681915	0.0	4082.0
S3 node 2  262654	17.193176	29.622018	0.0	399.0
S3 node 3  262654	14.595378	21.556231	0.0	443.0
)
)
)
Statistics:
 IMAGE     NPIX      MEAN        RMS           MIN      MAX
ACIS_total   6004901       2324.191         3006.163           0.0   130194


I2 node 0  262654	2011.539506	400.265881	427.0	11599.0
I2 node 1  262654	2116.589418	562.669685	442.0	98841.0
I2 node 2  262654	2145.634850	454.419923	446.0	11717.0
I2 node 3  262654	2150.892100	555.262682	428.0	28595.0

I3 node 0  262654	2289.386478	564.648412	422.0	9099.0
I3 node 1  262654	2371.322354	1702.168009	447.0	55379.0
I3 node 2  262654	2093.310436	389.473905	421.0	12002.0
I3 node 3  262654	2084.784063	418.694895	381.0	32428.0

S2 node 0  262654	2708.112649	429.070535	1512.0	21922.0
S2 node 1  262654	2870.782940	643.190426	1675.0	15744.0
S2 node 2  262654	3174.918555	651.531070	2109.0	27807.0
S2 node 3  262654	3127.169905	507.762382	1864.0	59783.0

S3 node 0  262654	4794.342846	2300.075265	2101.0	33516.0
S3 node 1  262654	6017.334909	2279.315051	0.0	29805.0
S3 node 2  262654	4772.894229	1276.712396	2053.0	25661.0
S3 node 3  262654	3687.044254	674.741577	2262.0	25152.0
)
|
)
|
)
|
)
|
| May 2019 | Feb 2019 | Nov 2018 | Aug 2018 |
|---|
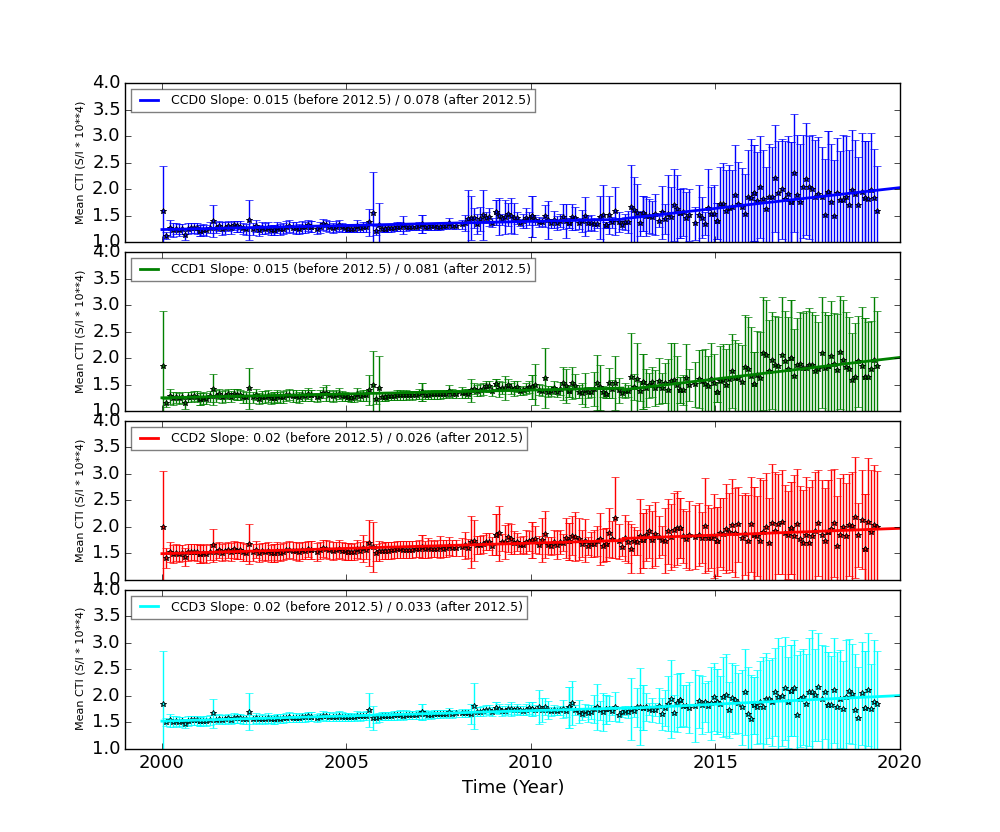
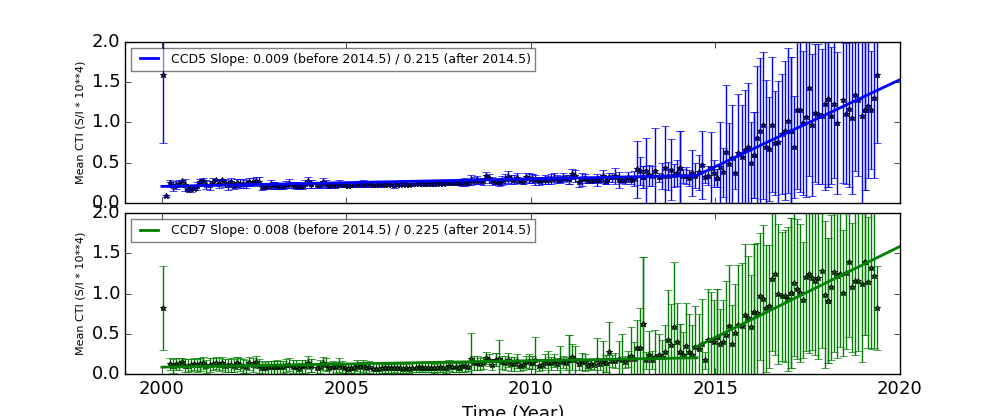
The Mean Detrended CTI
We report CTIs with a refined data definition. CTIs were computed for the temperature dependency corrected data. Please see CTI page for detailed explanation. CTI's are computed for Mn K alpha, and defined as slope/intercept x10^4 of row # vs ADU. Data file: here
Imaging CCDs
Spectral CCDs
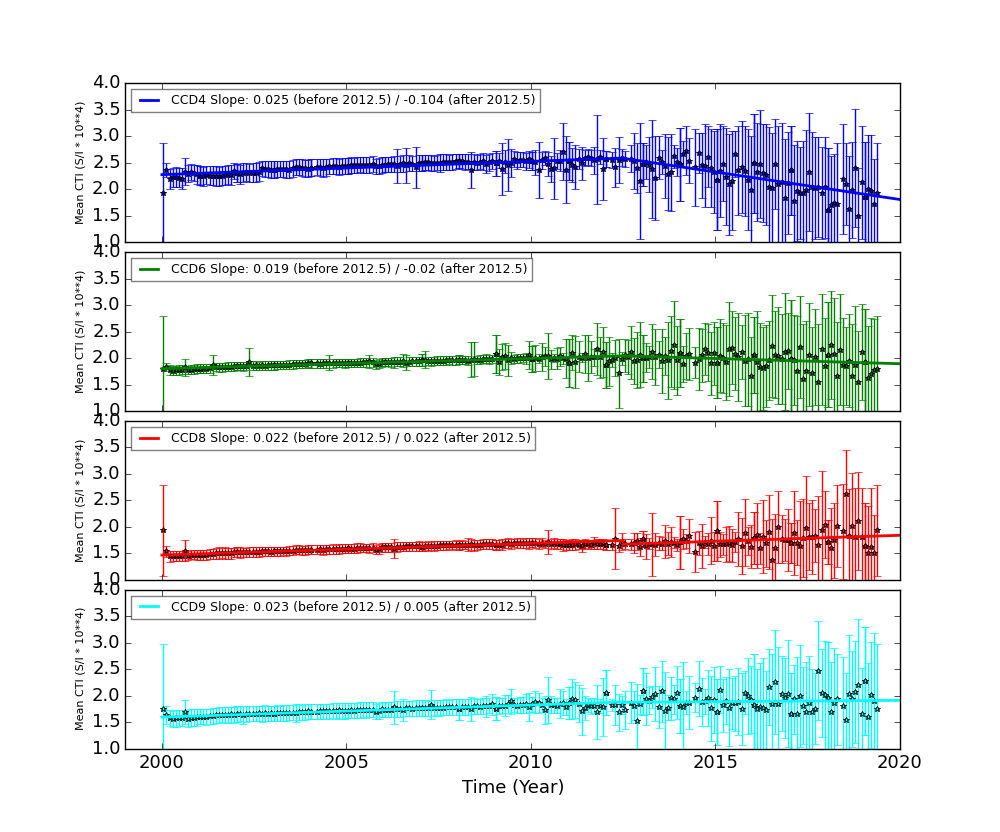
Backside CCDs
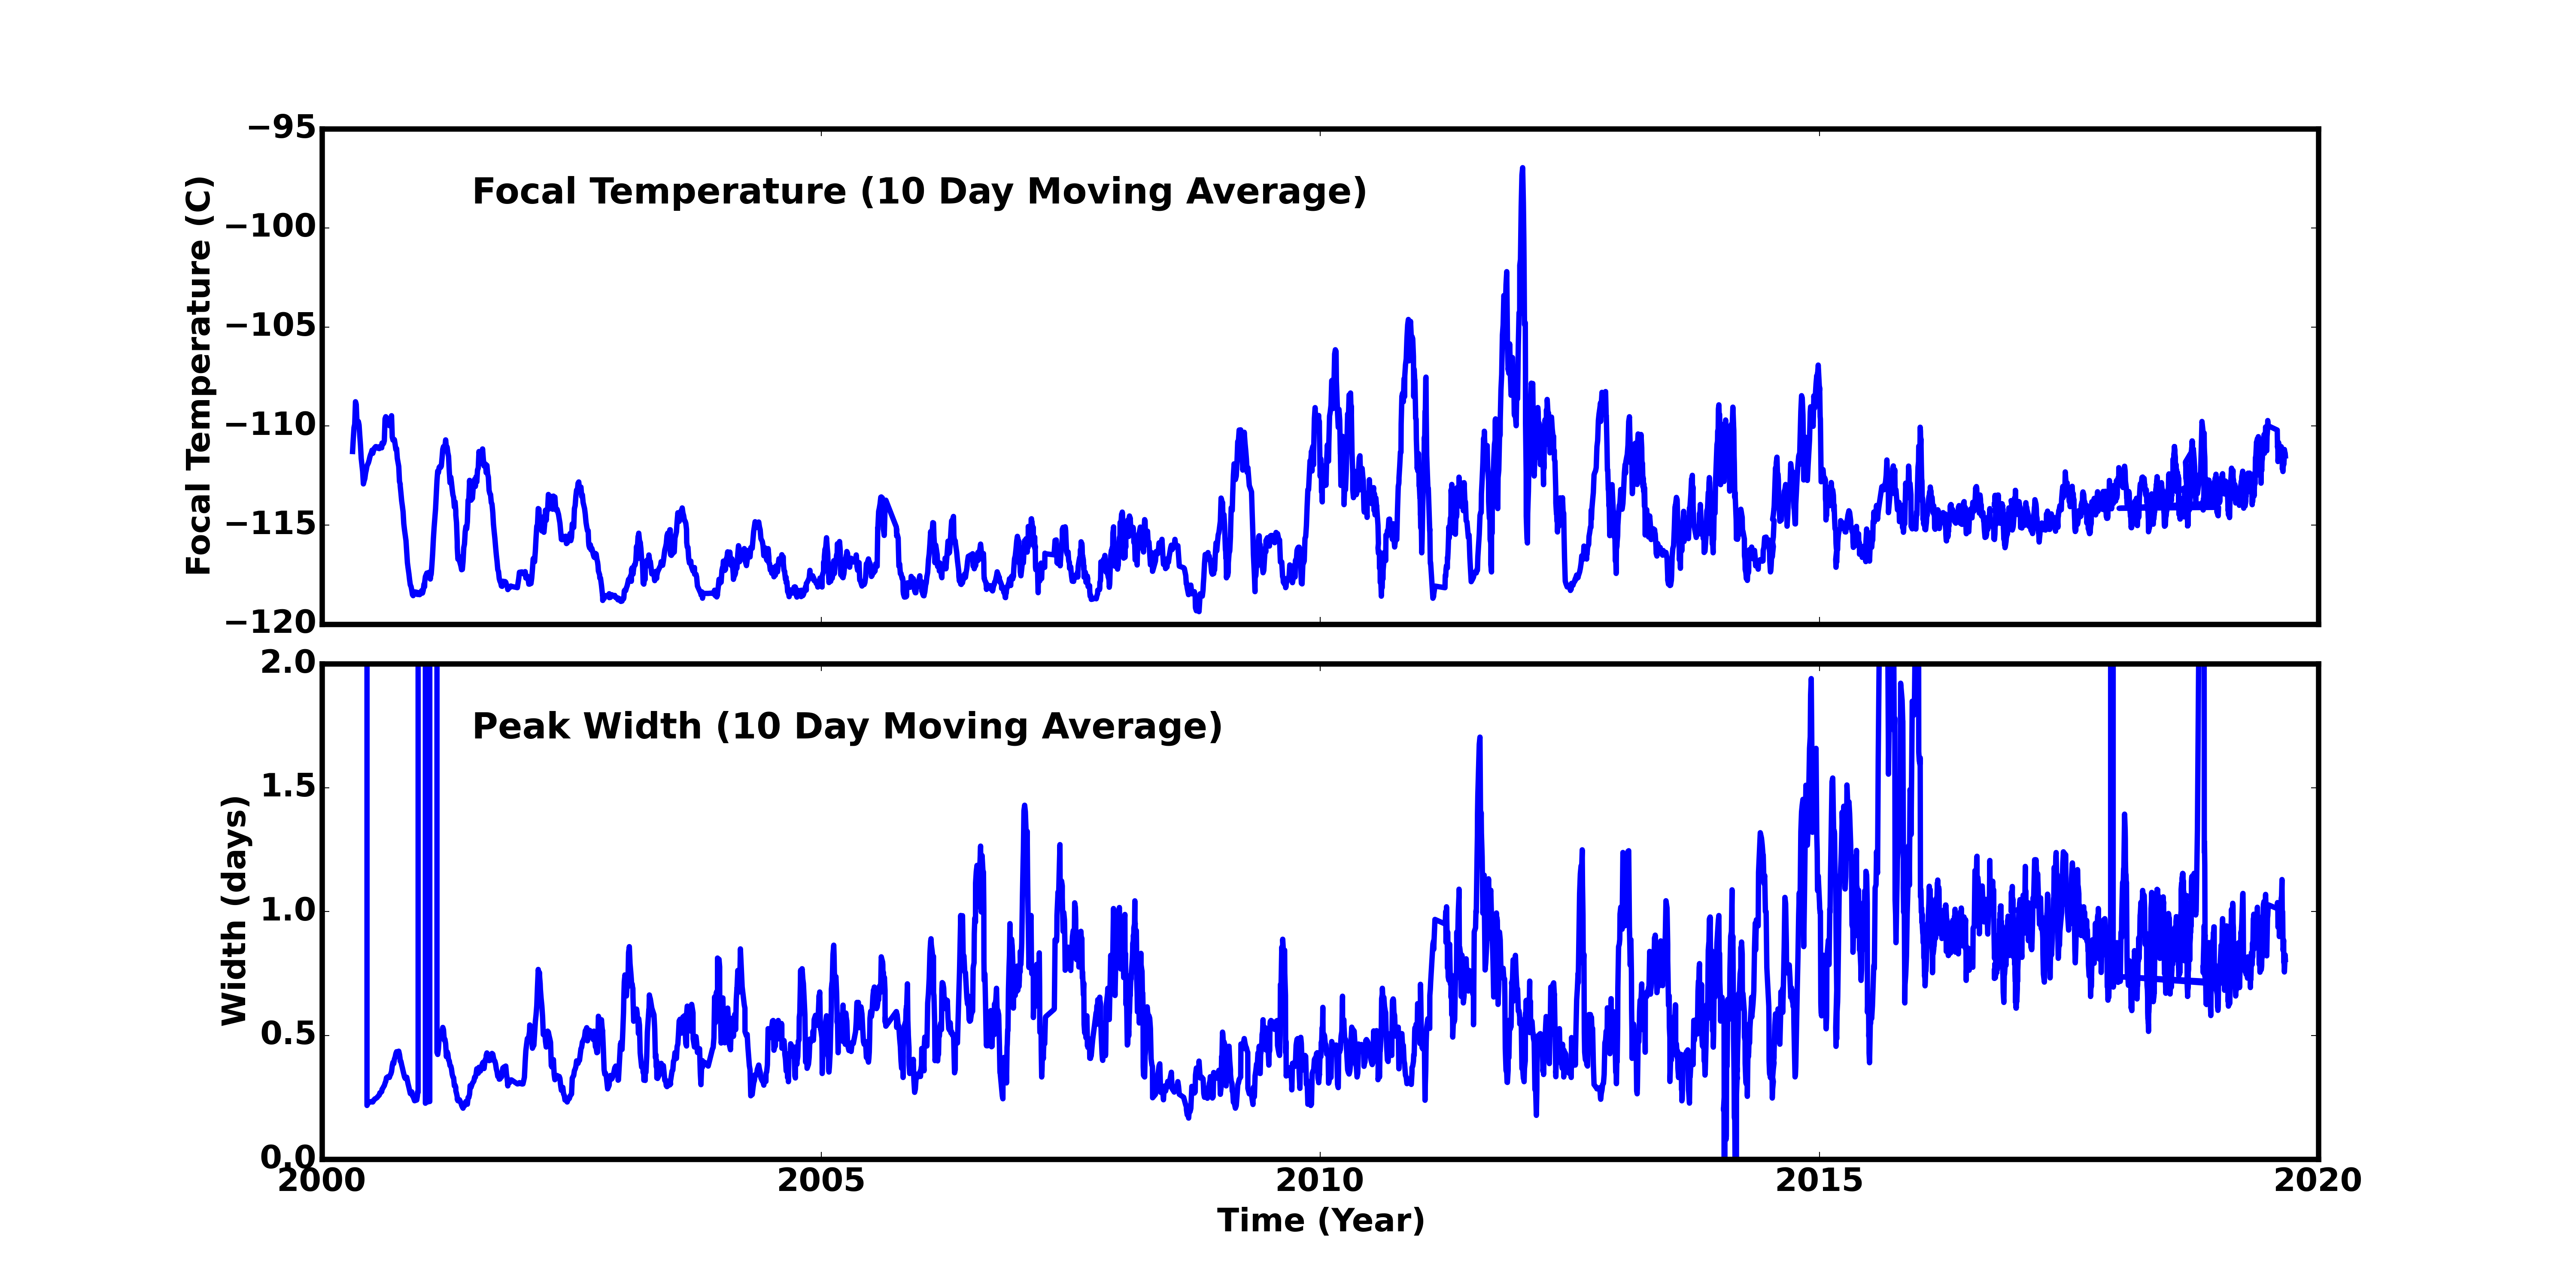
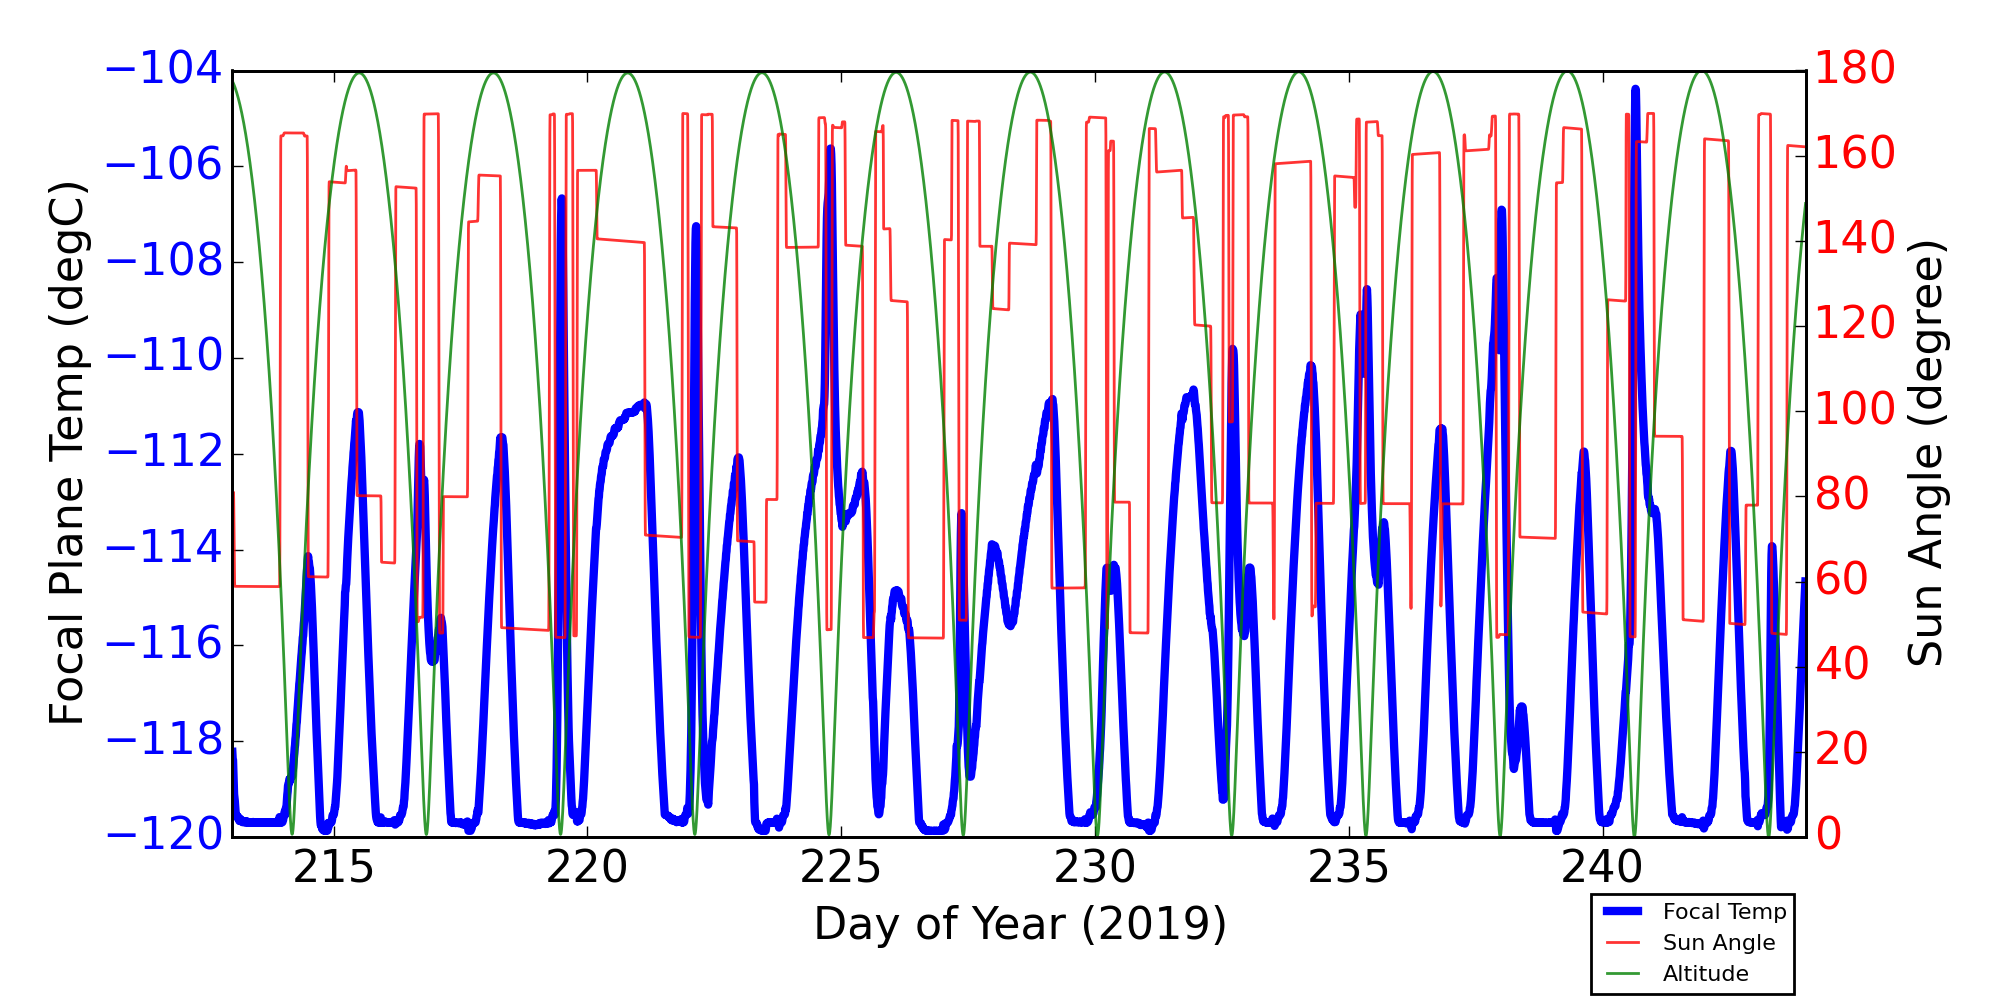
Focal Plane Temperature
Aug 2019 Focal Temperature
| The Mean (max) FPT: | |
|---|---|
| -111.69 | +/- 2.81 C |
| Mean Width: | |
| 0.89 | +/- 0.38 days |
Averaged Focal Plane Temperature
We are using 10 period moving averages to show trends of peak temperatures and peak widths. Note, the gaps in the width plot are due to missing/corrupted data.
Focal Plane Temperature, Sun Angle and Altitude
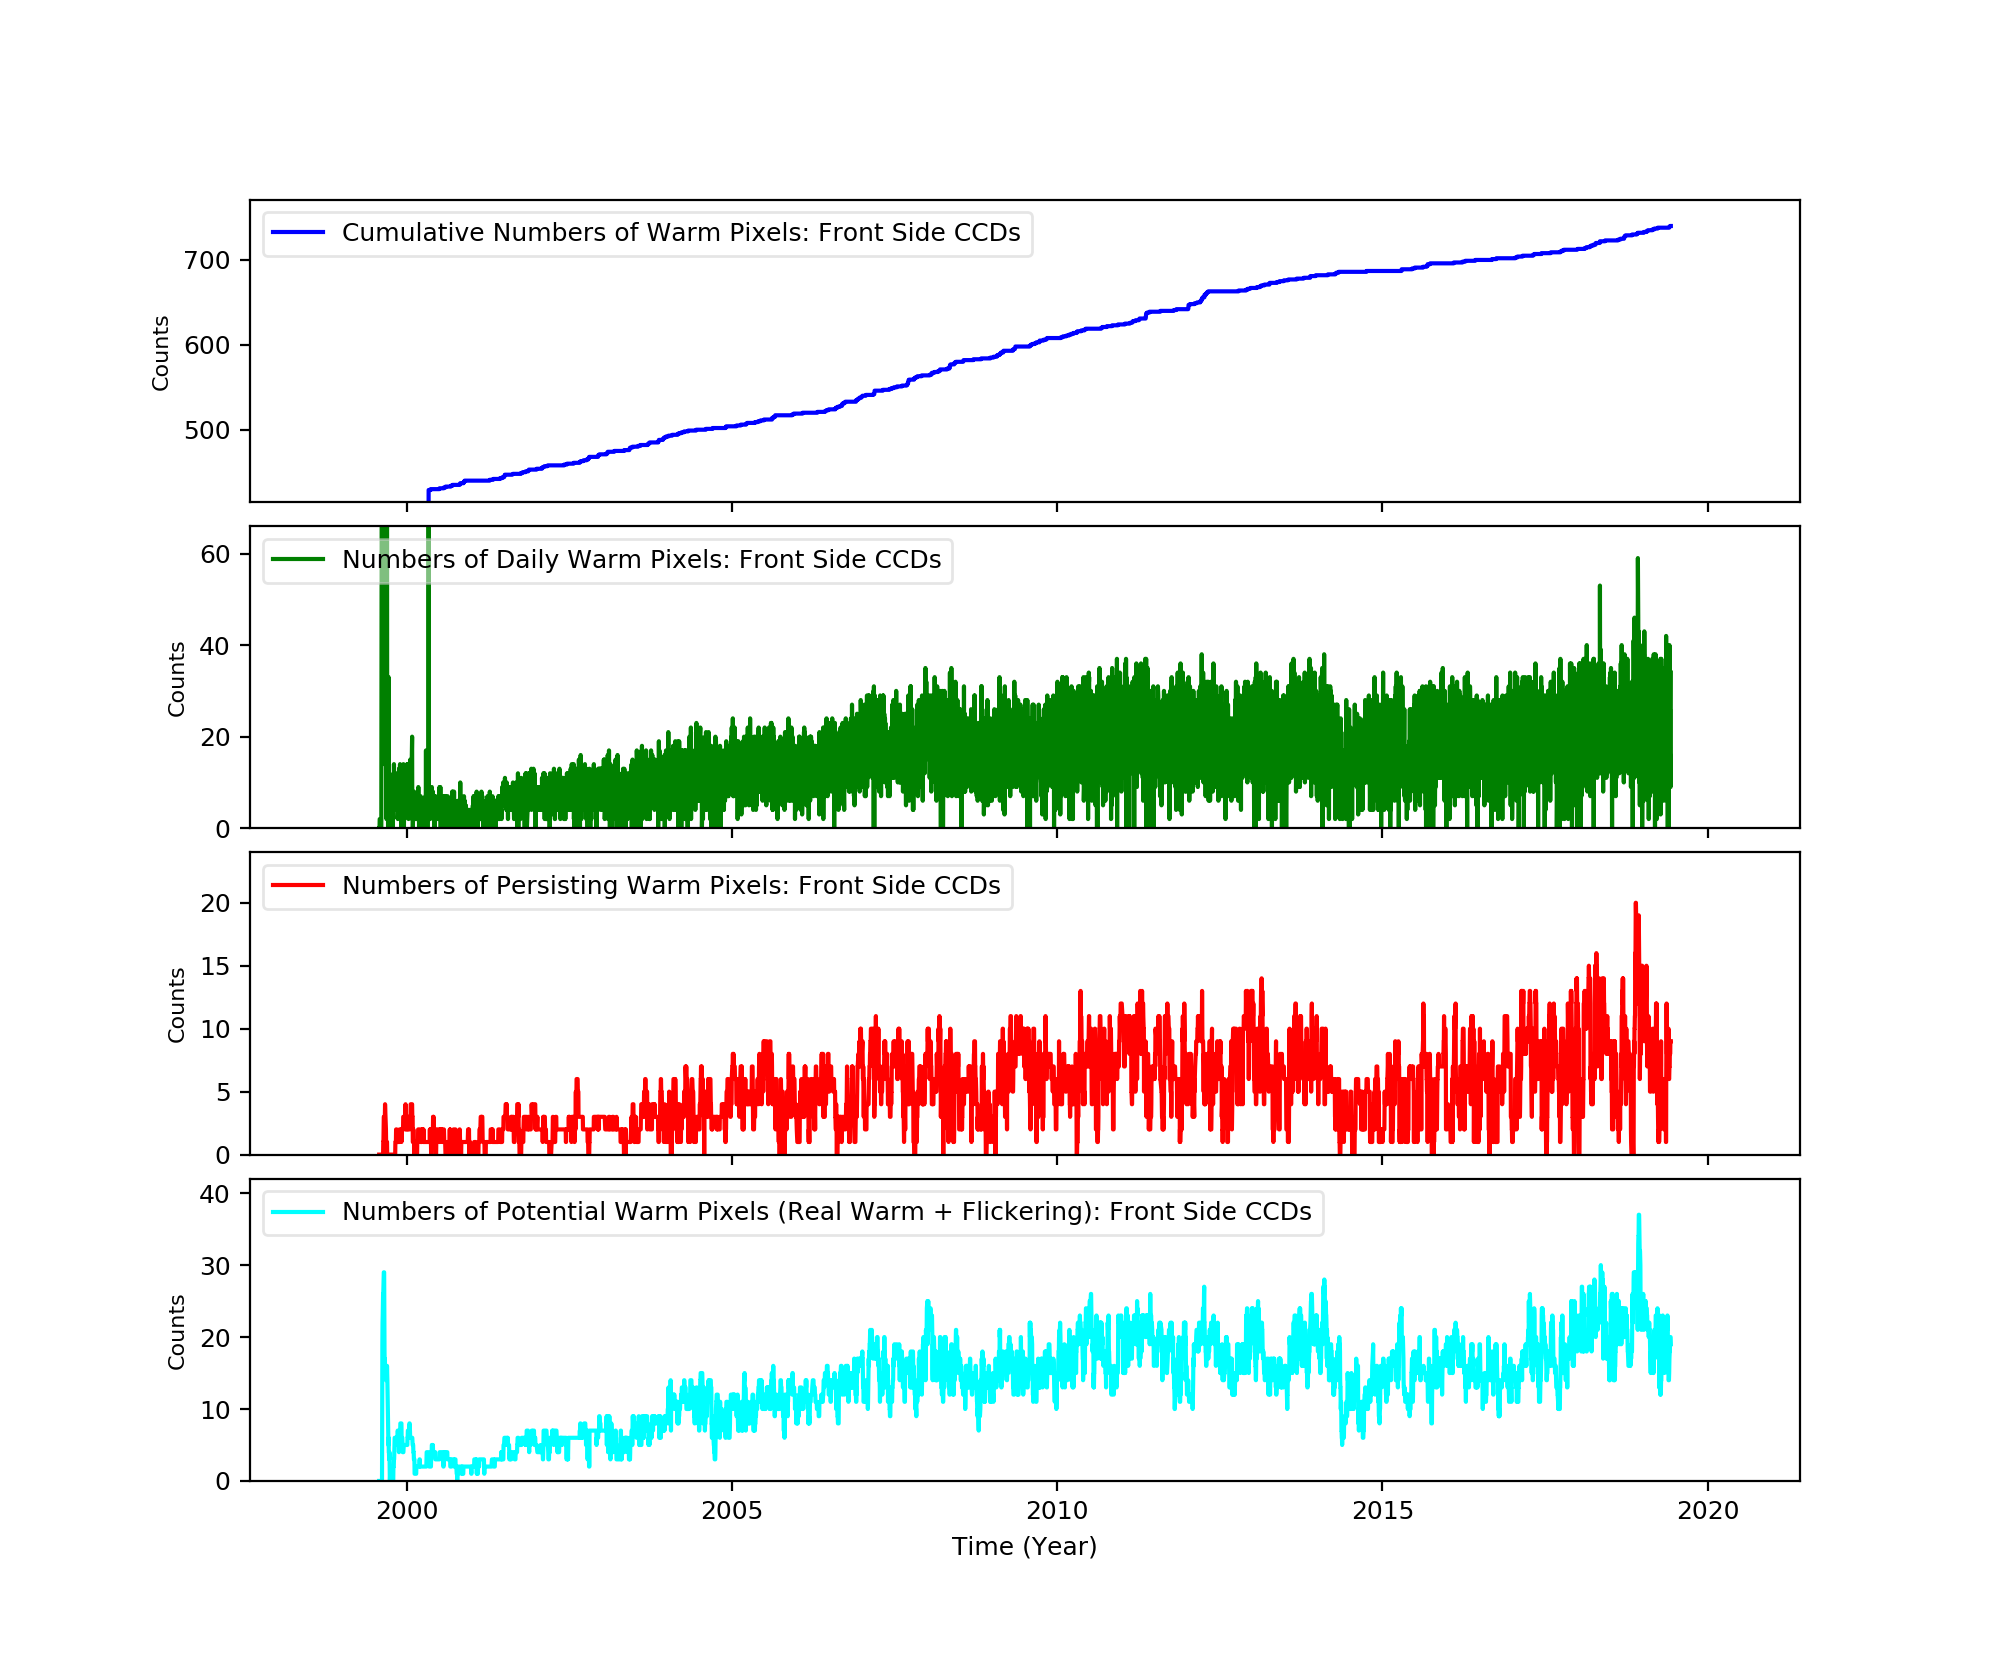
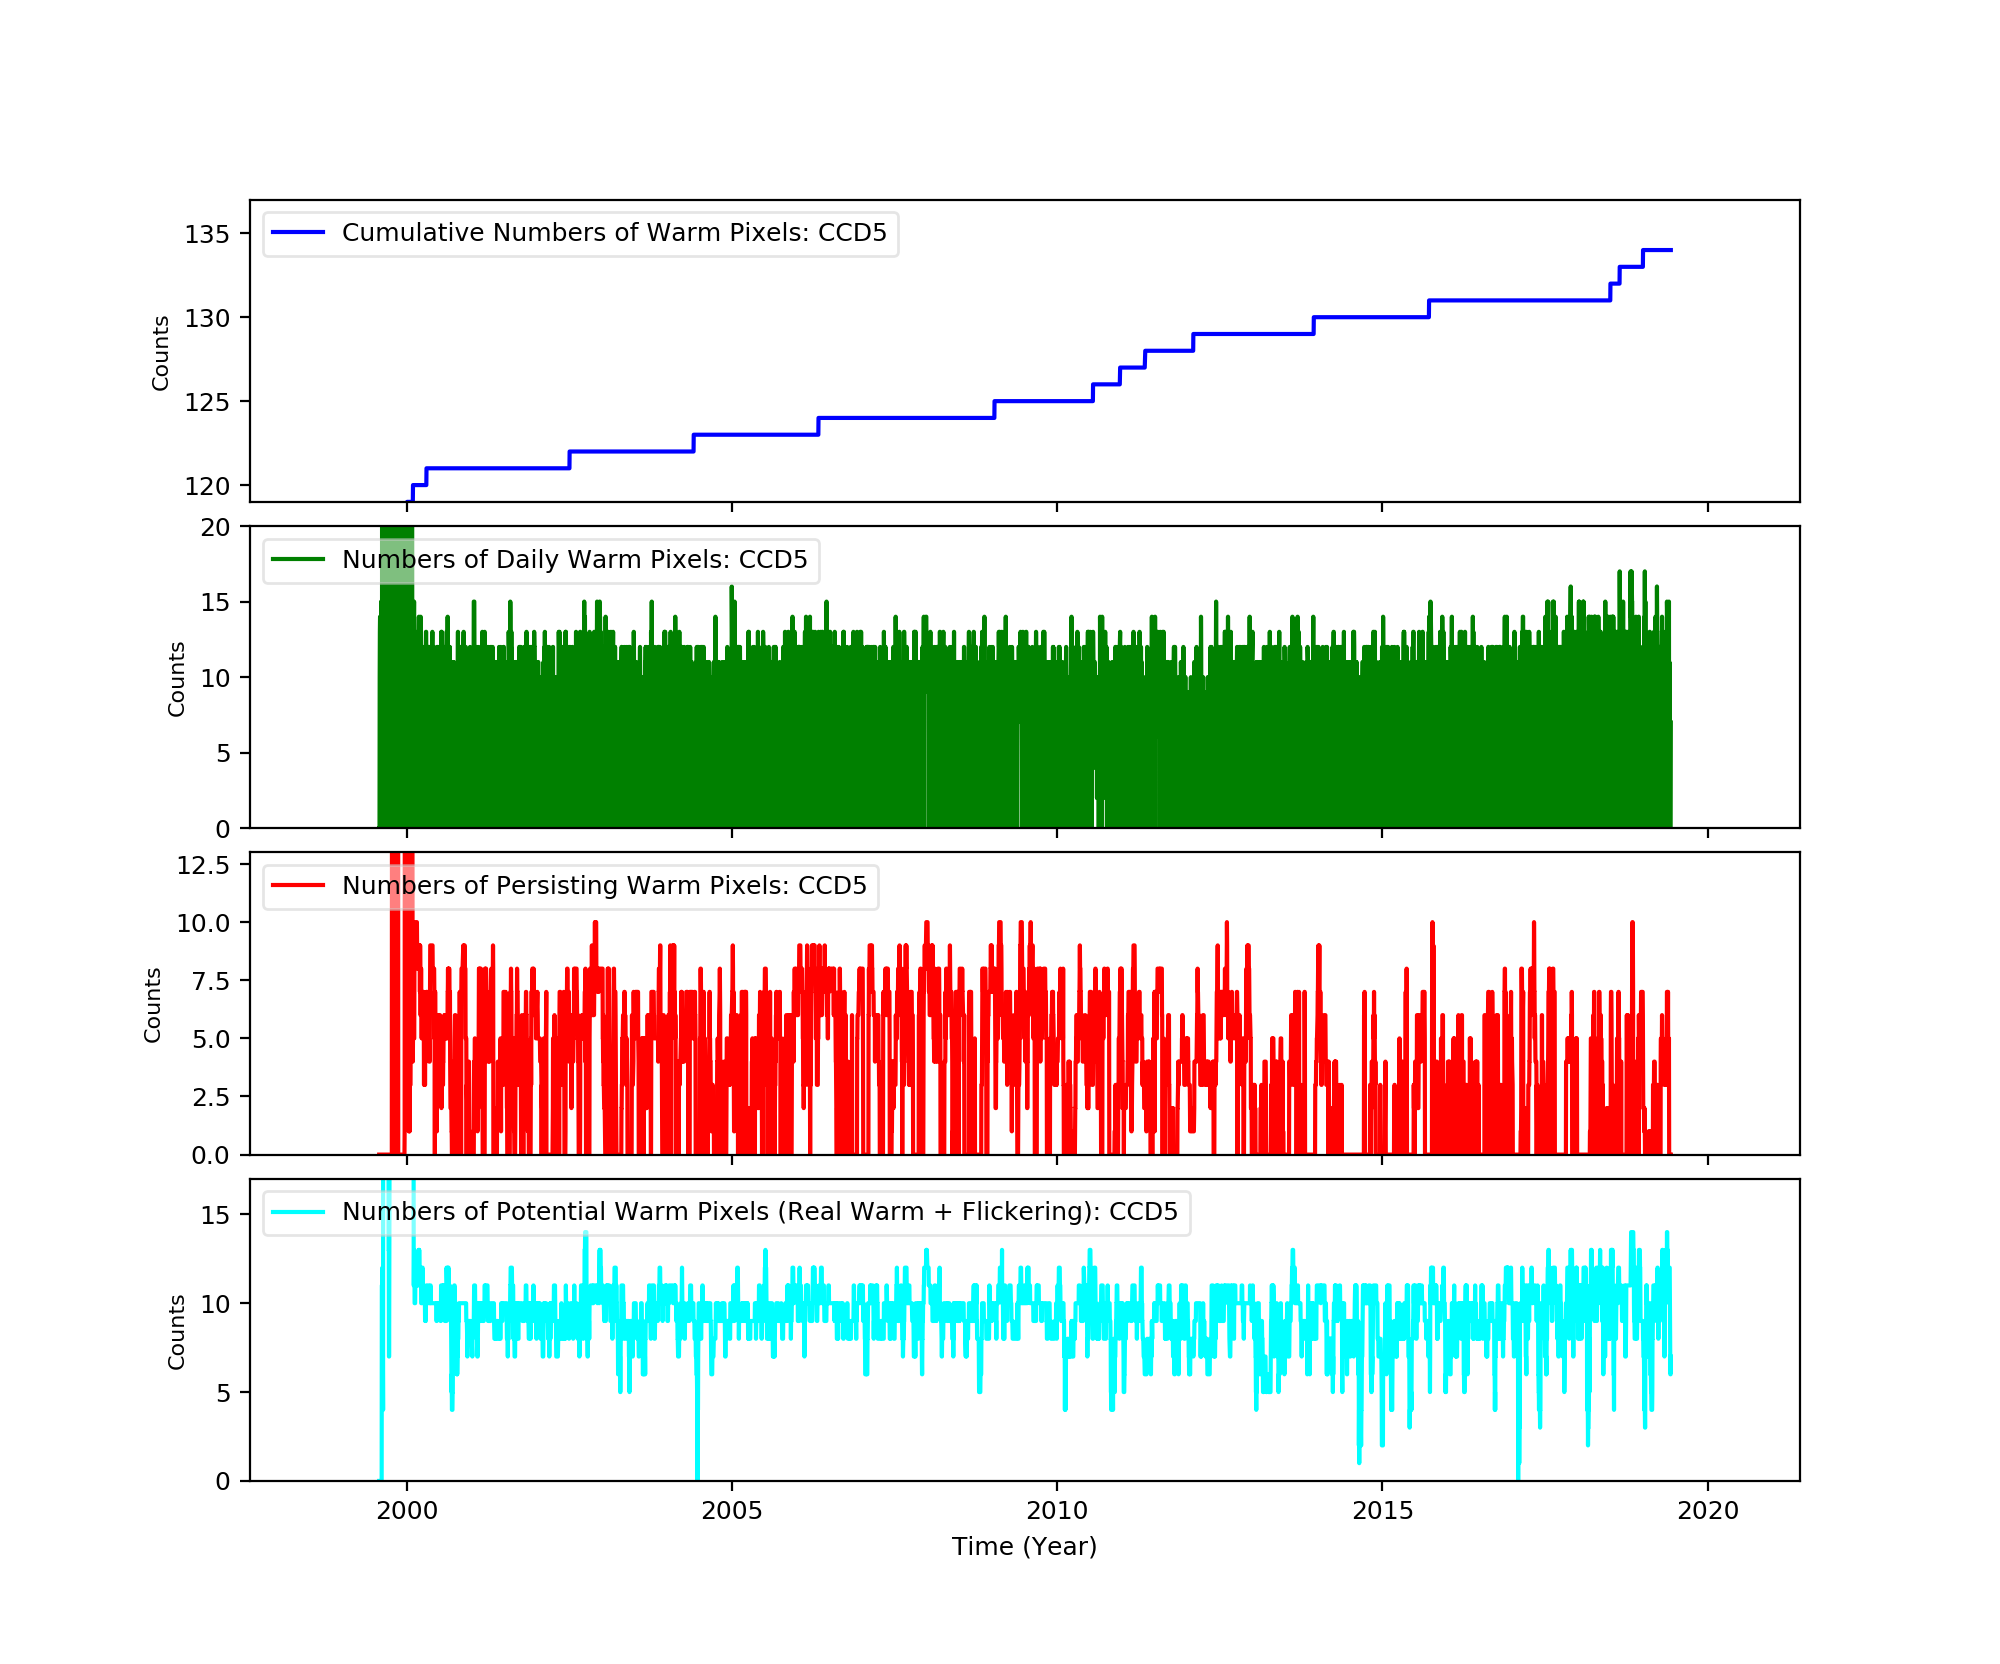
Bad Pixels
The plots below were generated with a new warm pixel finding script. Please see Acis Bad Pixel Page for details.
Front Side CCDs
Back Side CCD (CCD5)
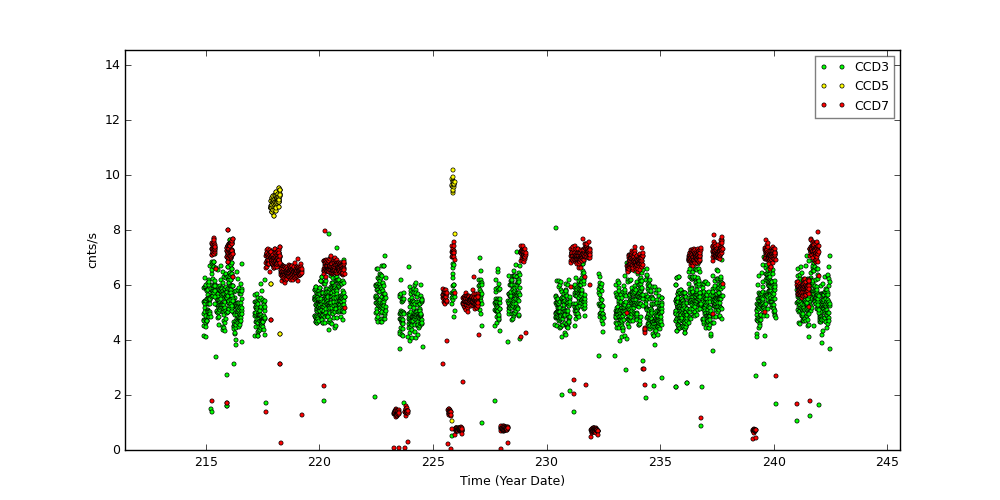
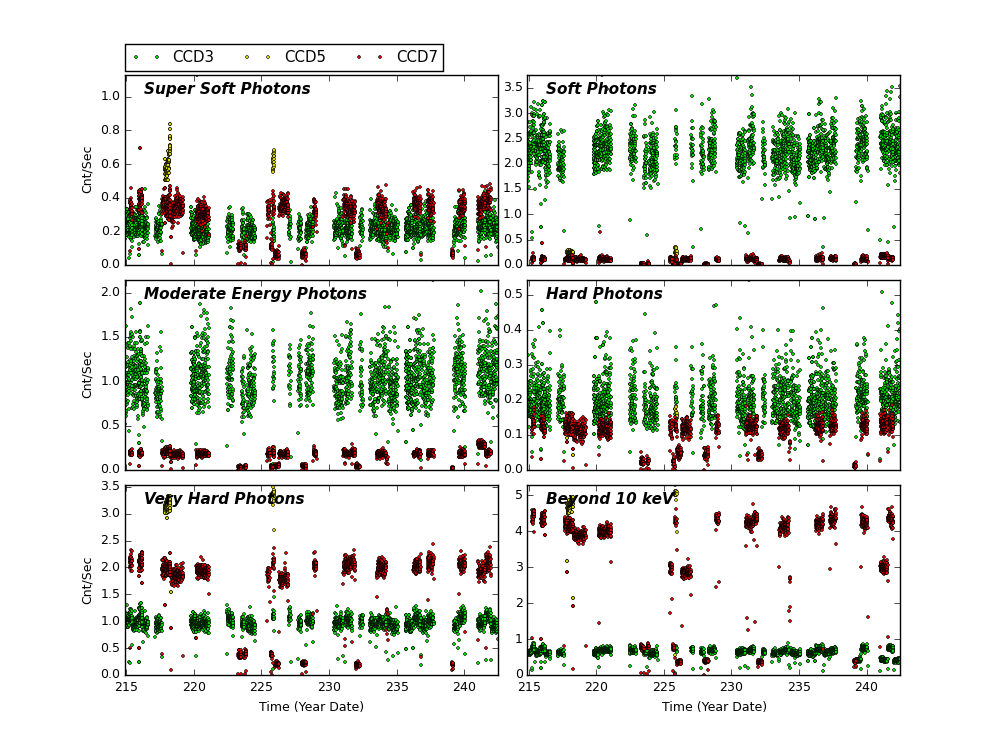
Science Instrument Background Rates
| Name | Low (keV) | High(KeV) | Description |
|---|---|---|---|
| SSoft | 0.00 | 0.50 | Super soft photons |
| Soft | 0.50 | 1.00 | Soft photons |
| Med | 1.00 | 3.00 | Moderate energy photons |
| Hard | 3.00 | 5.00 | Hard Photons |
| Harder | 5.00 | 10.00 | Very Hard photons |
| Hardest | 10.00 | Beyond 10 keV |
HRC
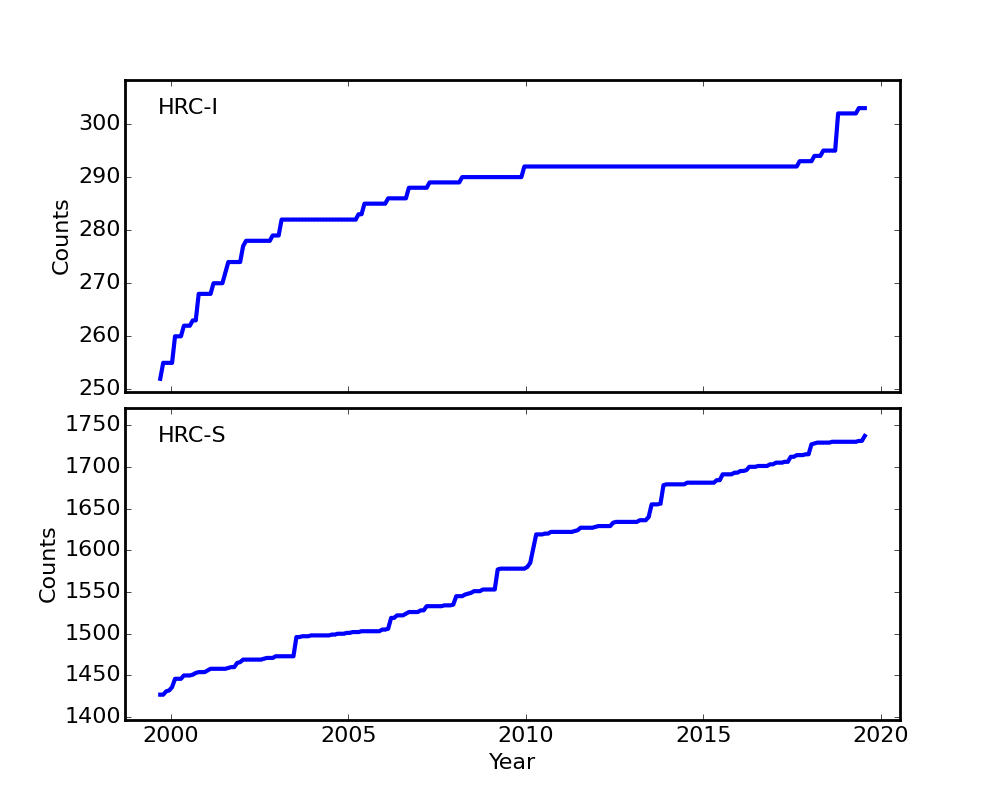
DOSE of Central 4K Pore-Pairs
Please refer to Maximum Dose Trends for more details.
No Data
)
IMAGE                       NPIX      MEAN    STDDEV      MIN       MAX
HRCI_08_1999_08_2019.fits  16777216	5.907 	5.818 	0.000 	303.000
No Data
)
IMAGE                       NPIX      MEAN    STDDEV      MIN       MAX
HRCS_08_1999_08_2019.fits  16777216	18.238 	33.374 	0.000 	1737.000
|
|
Max dose trend plots corrected for events that "pile-up"
in the center of the taps due to bad position information.
|
)
|
)
|
)
|
)
|
| May 2019 | Feb 2019 | Nov 2018 | Aug 2018 |
|---|
)
|
)
|
)
|
)
|
| May 2019 | Feb 2019 | Nov 2018 | Aug 2018 |
|---|
HRMA Focus
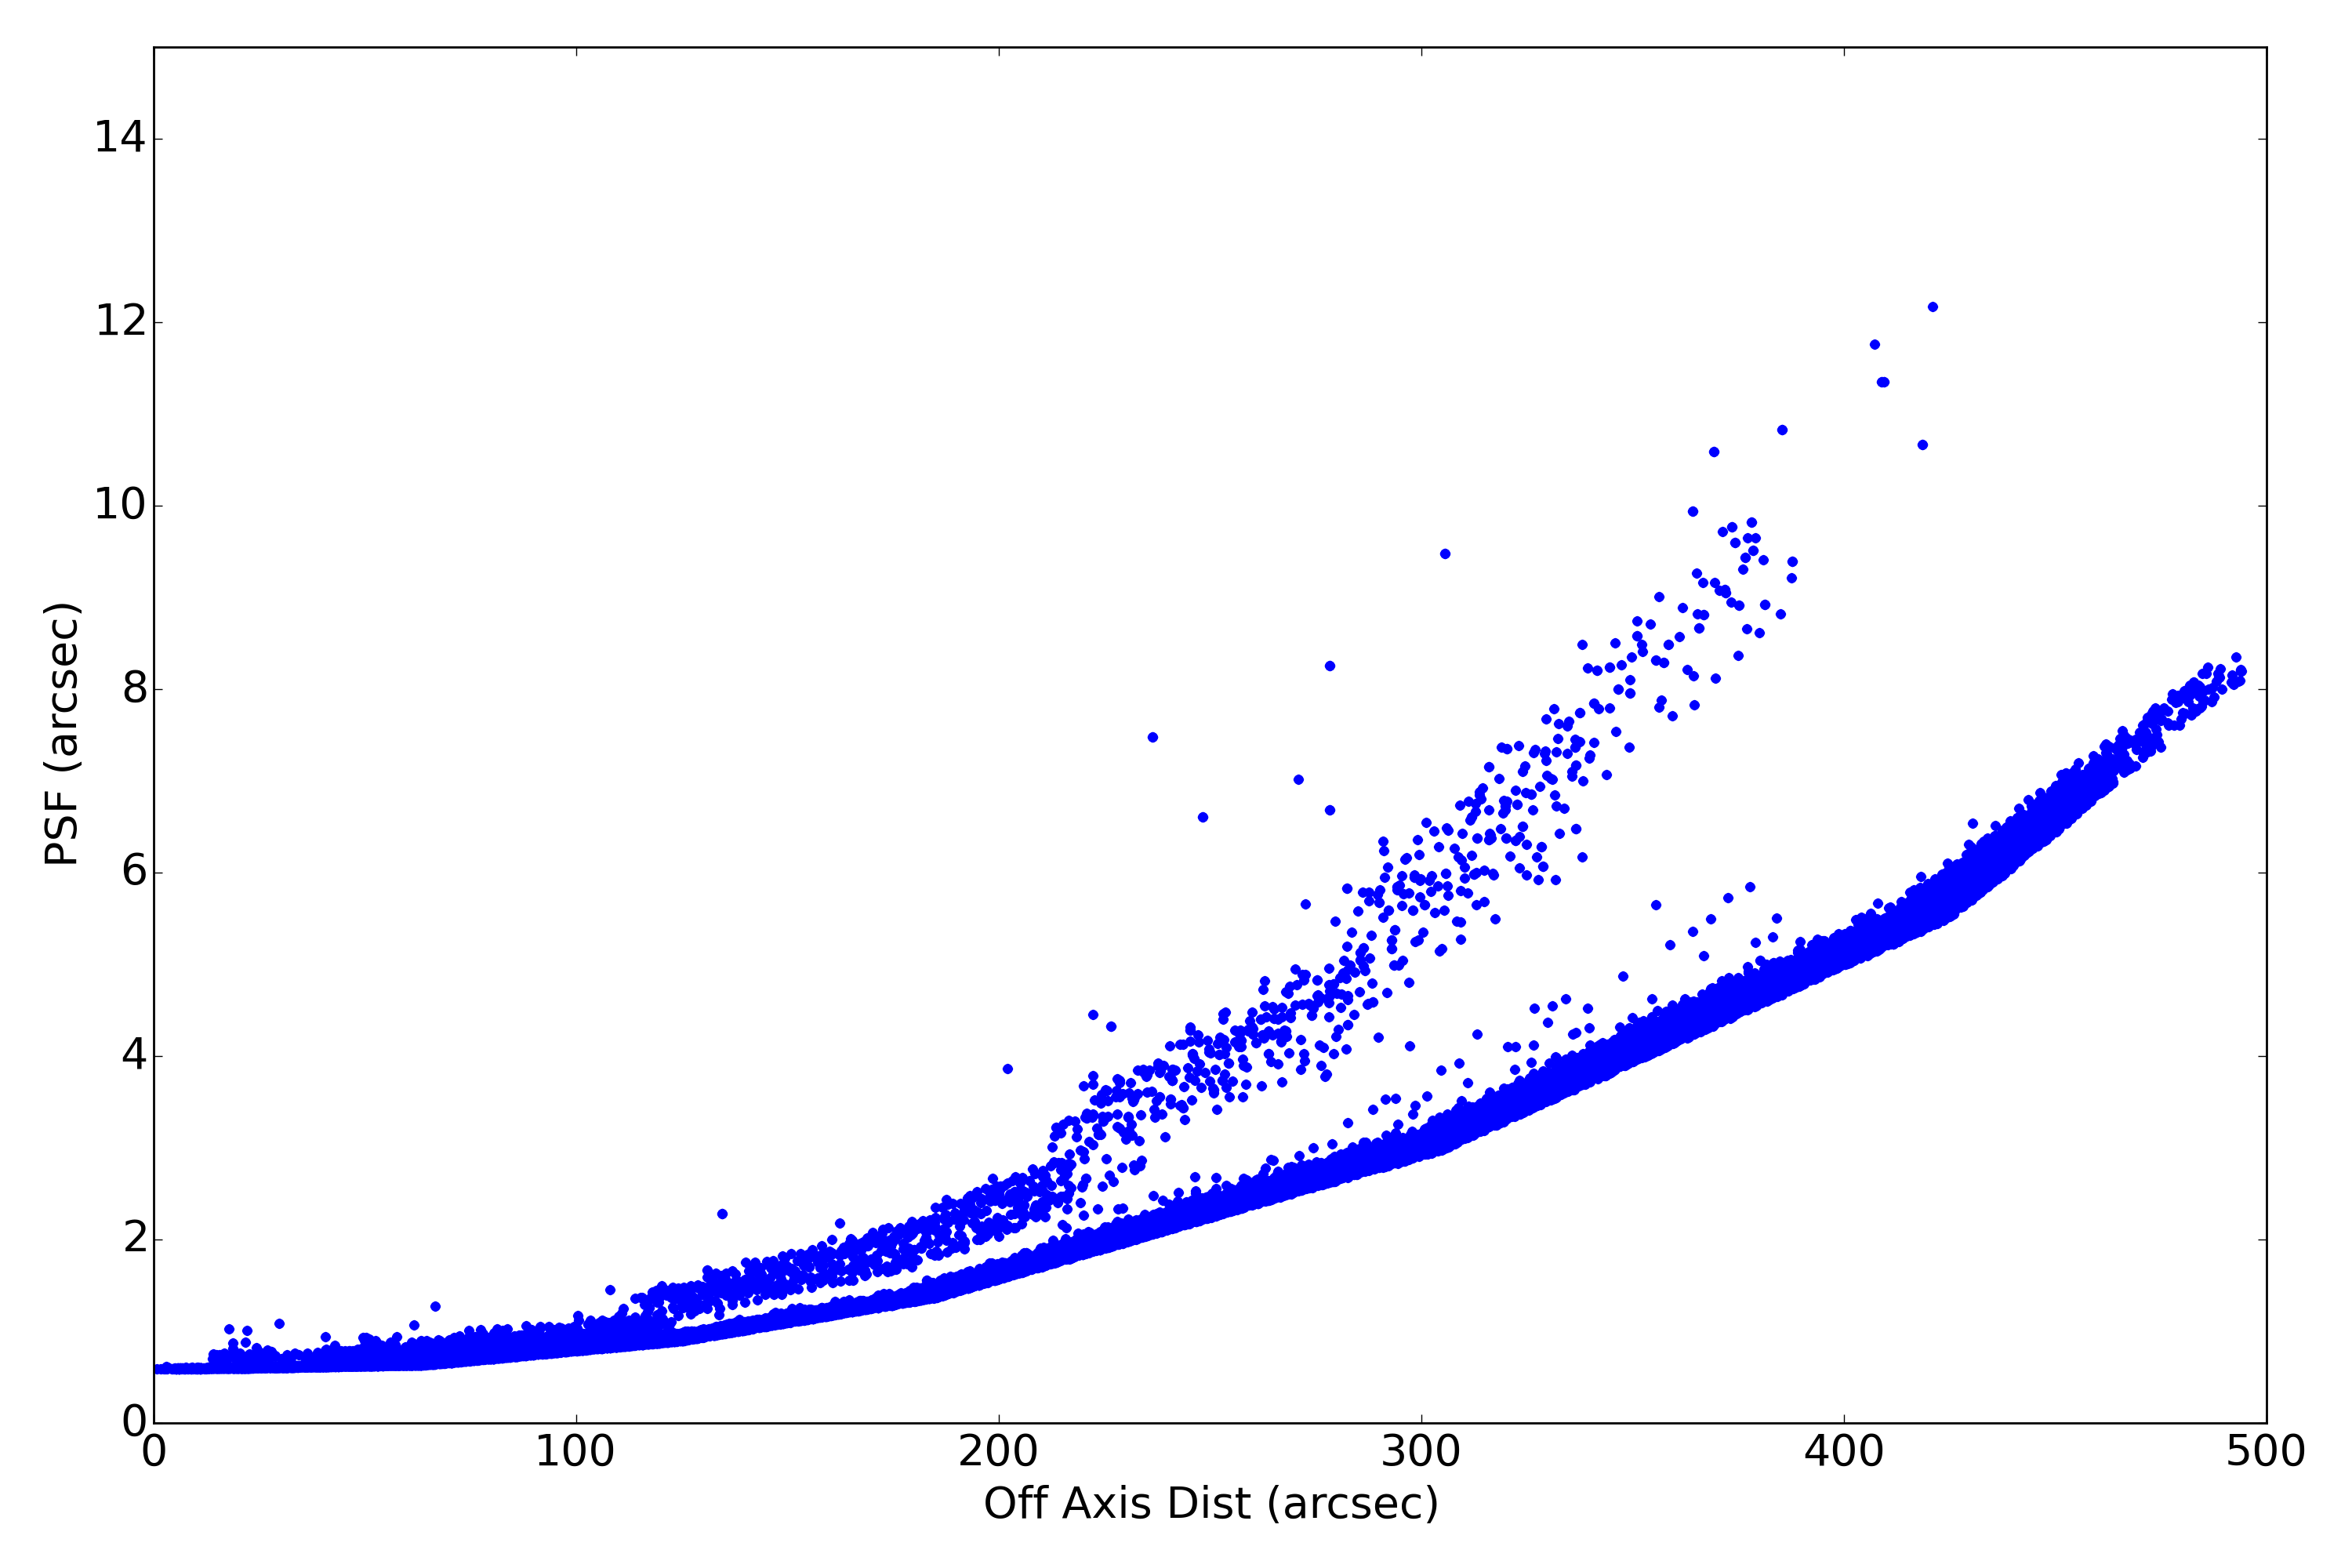
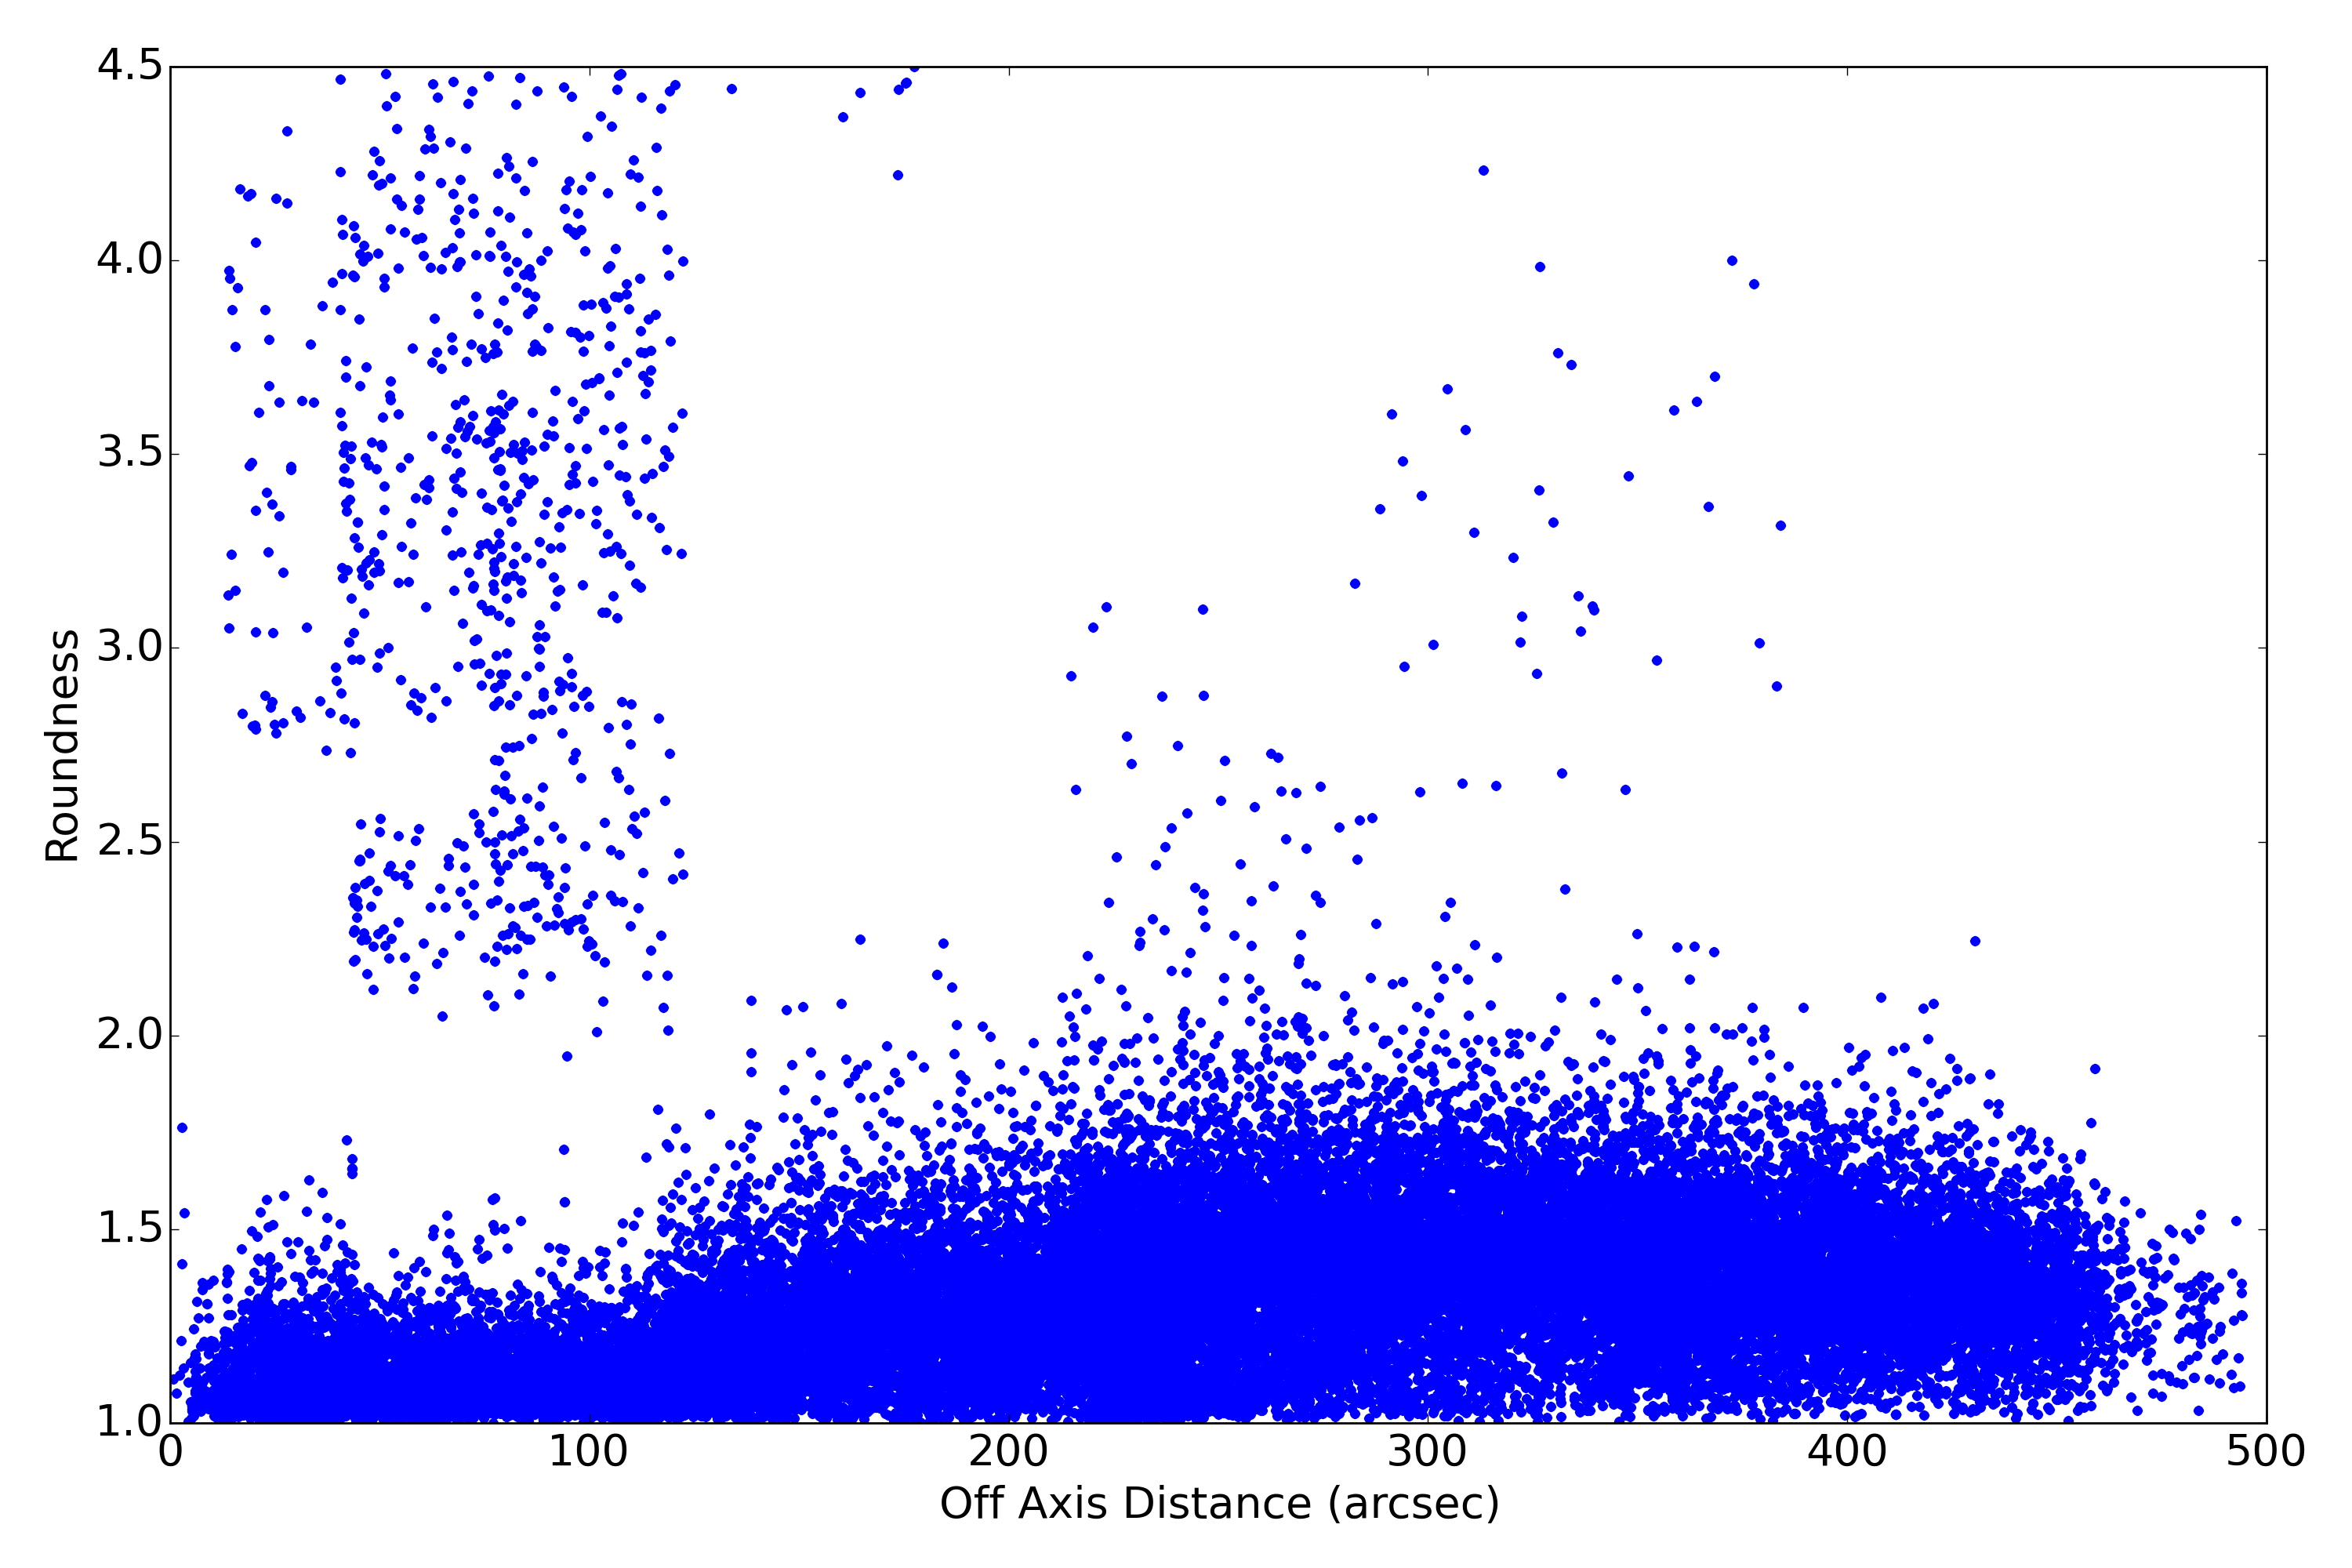
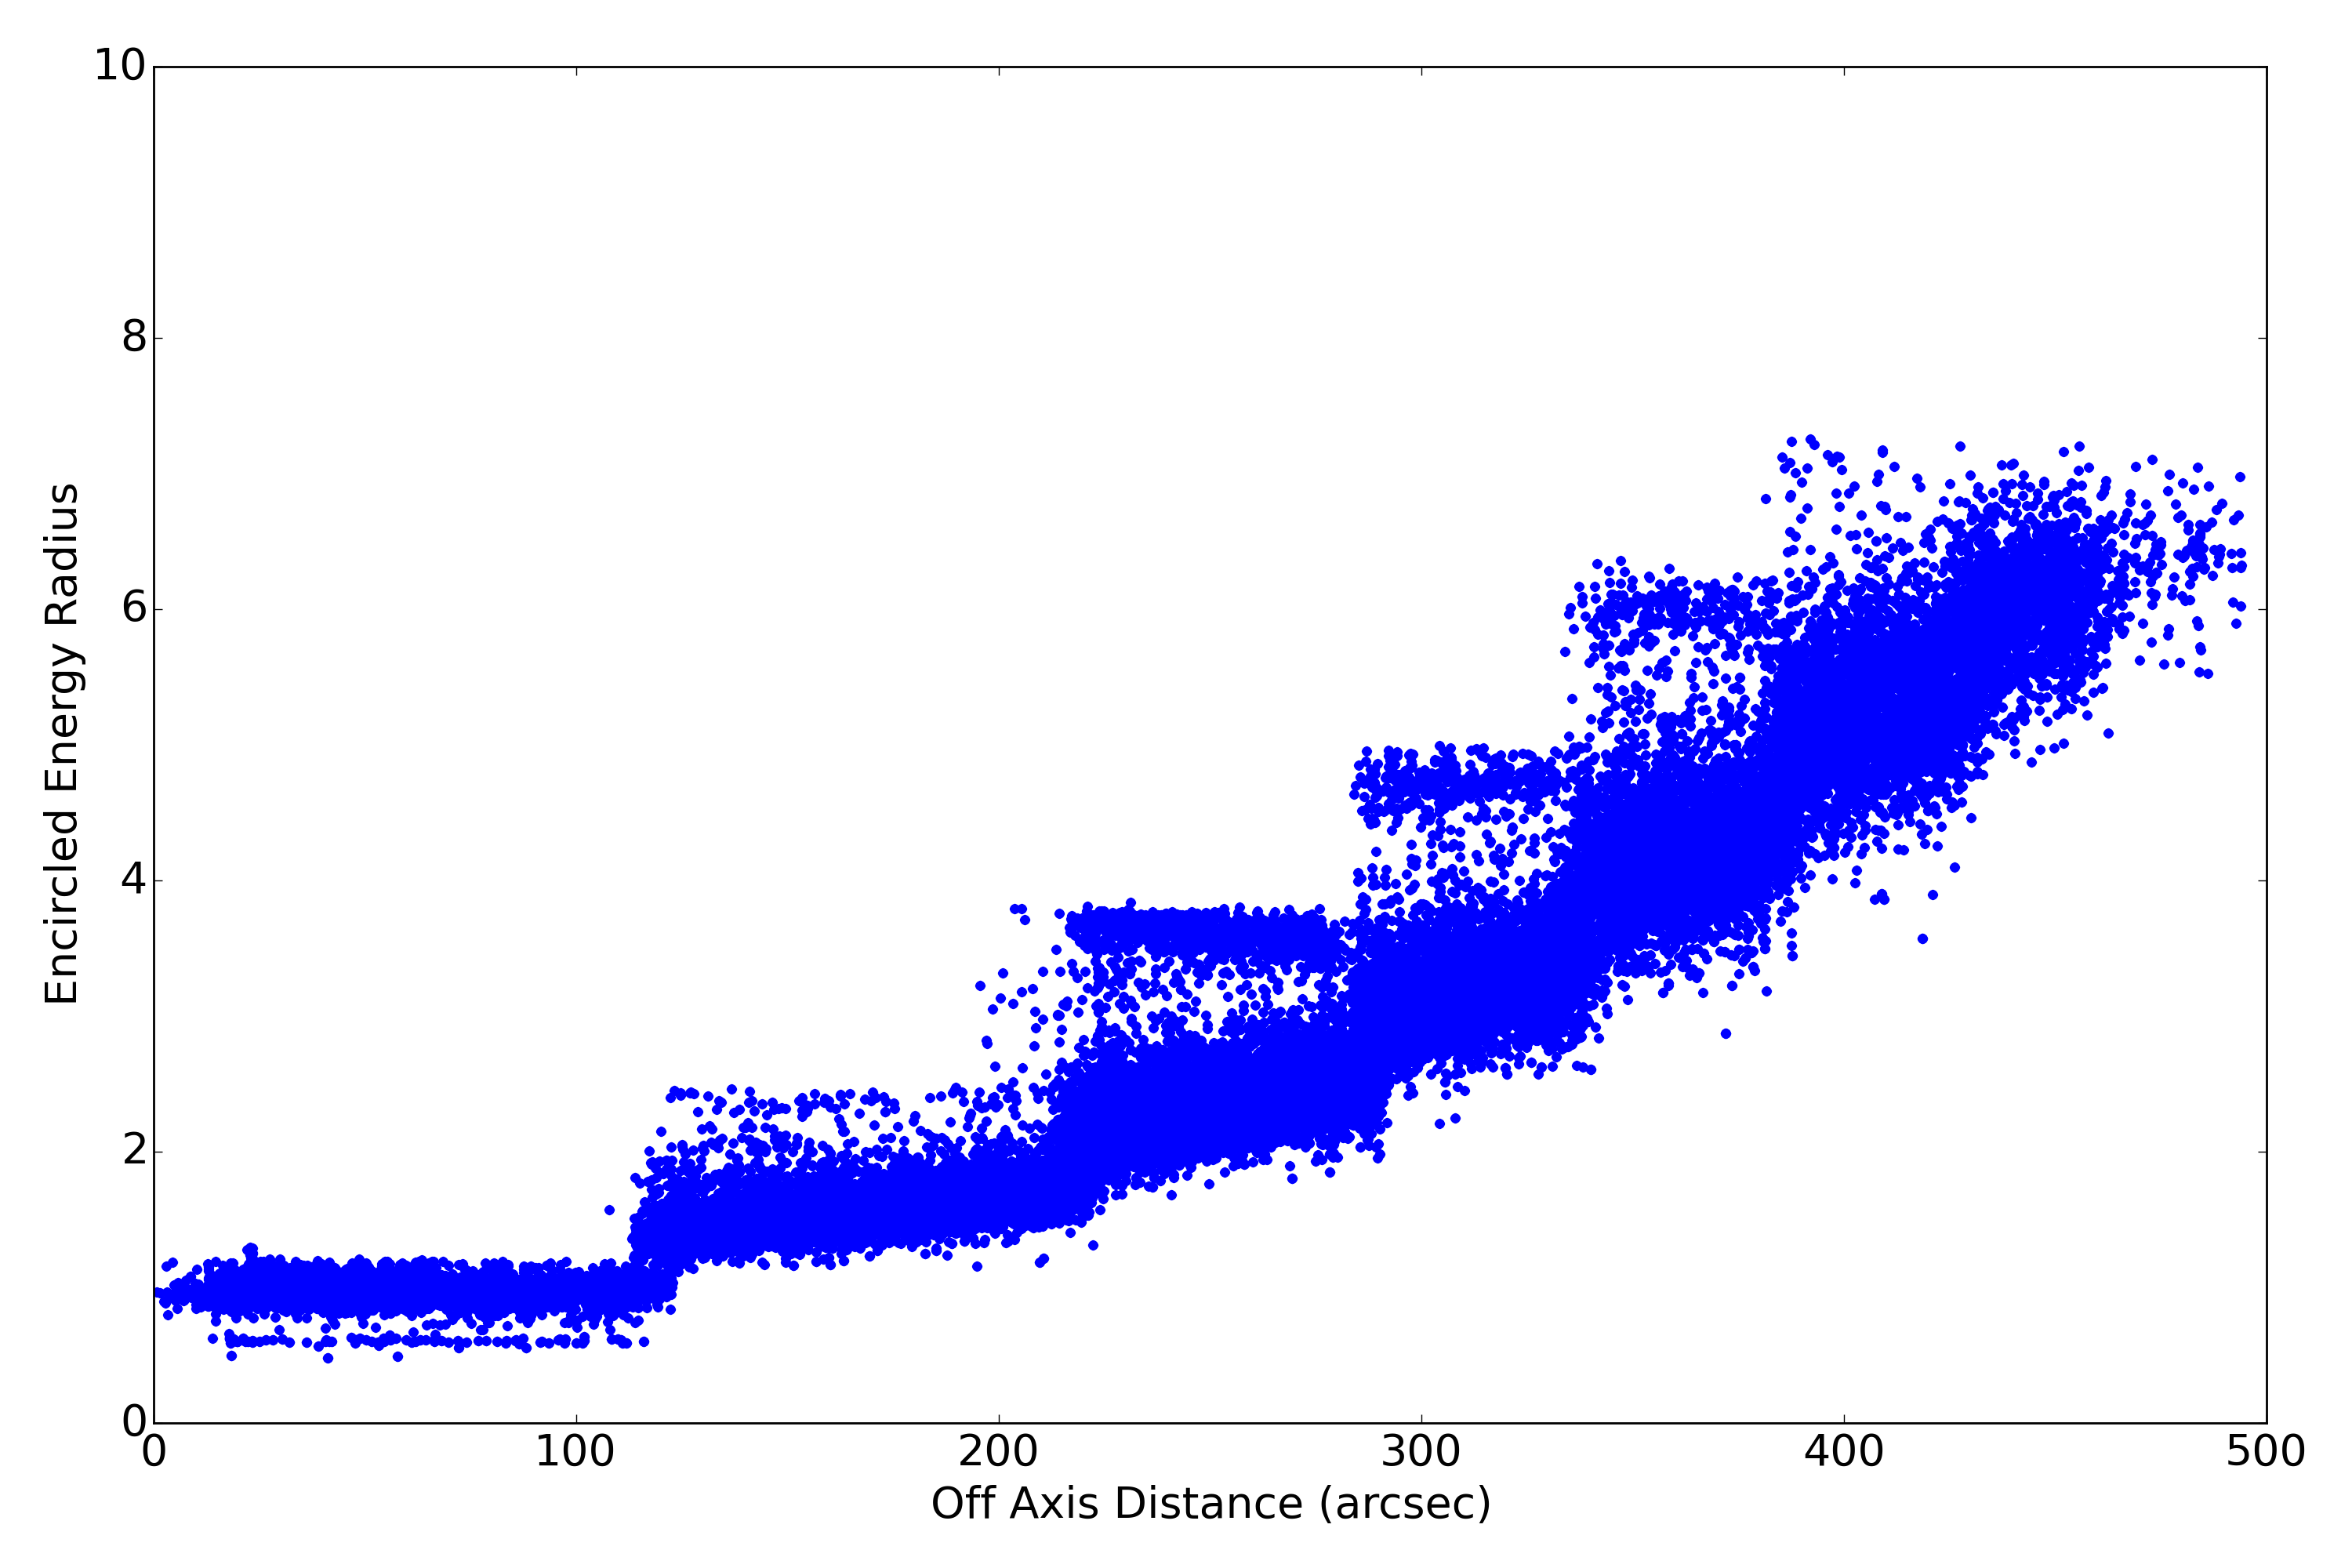
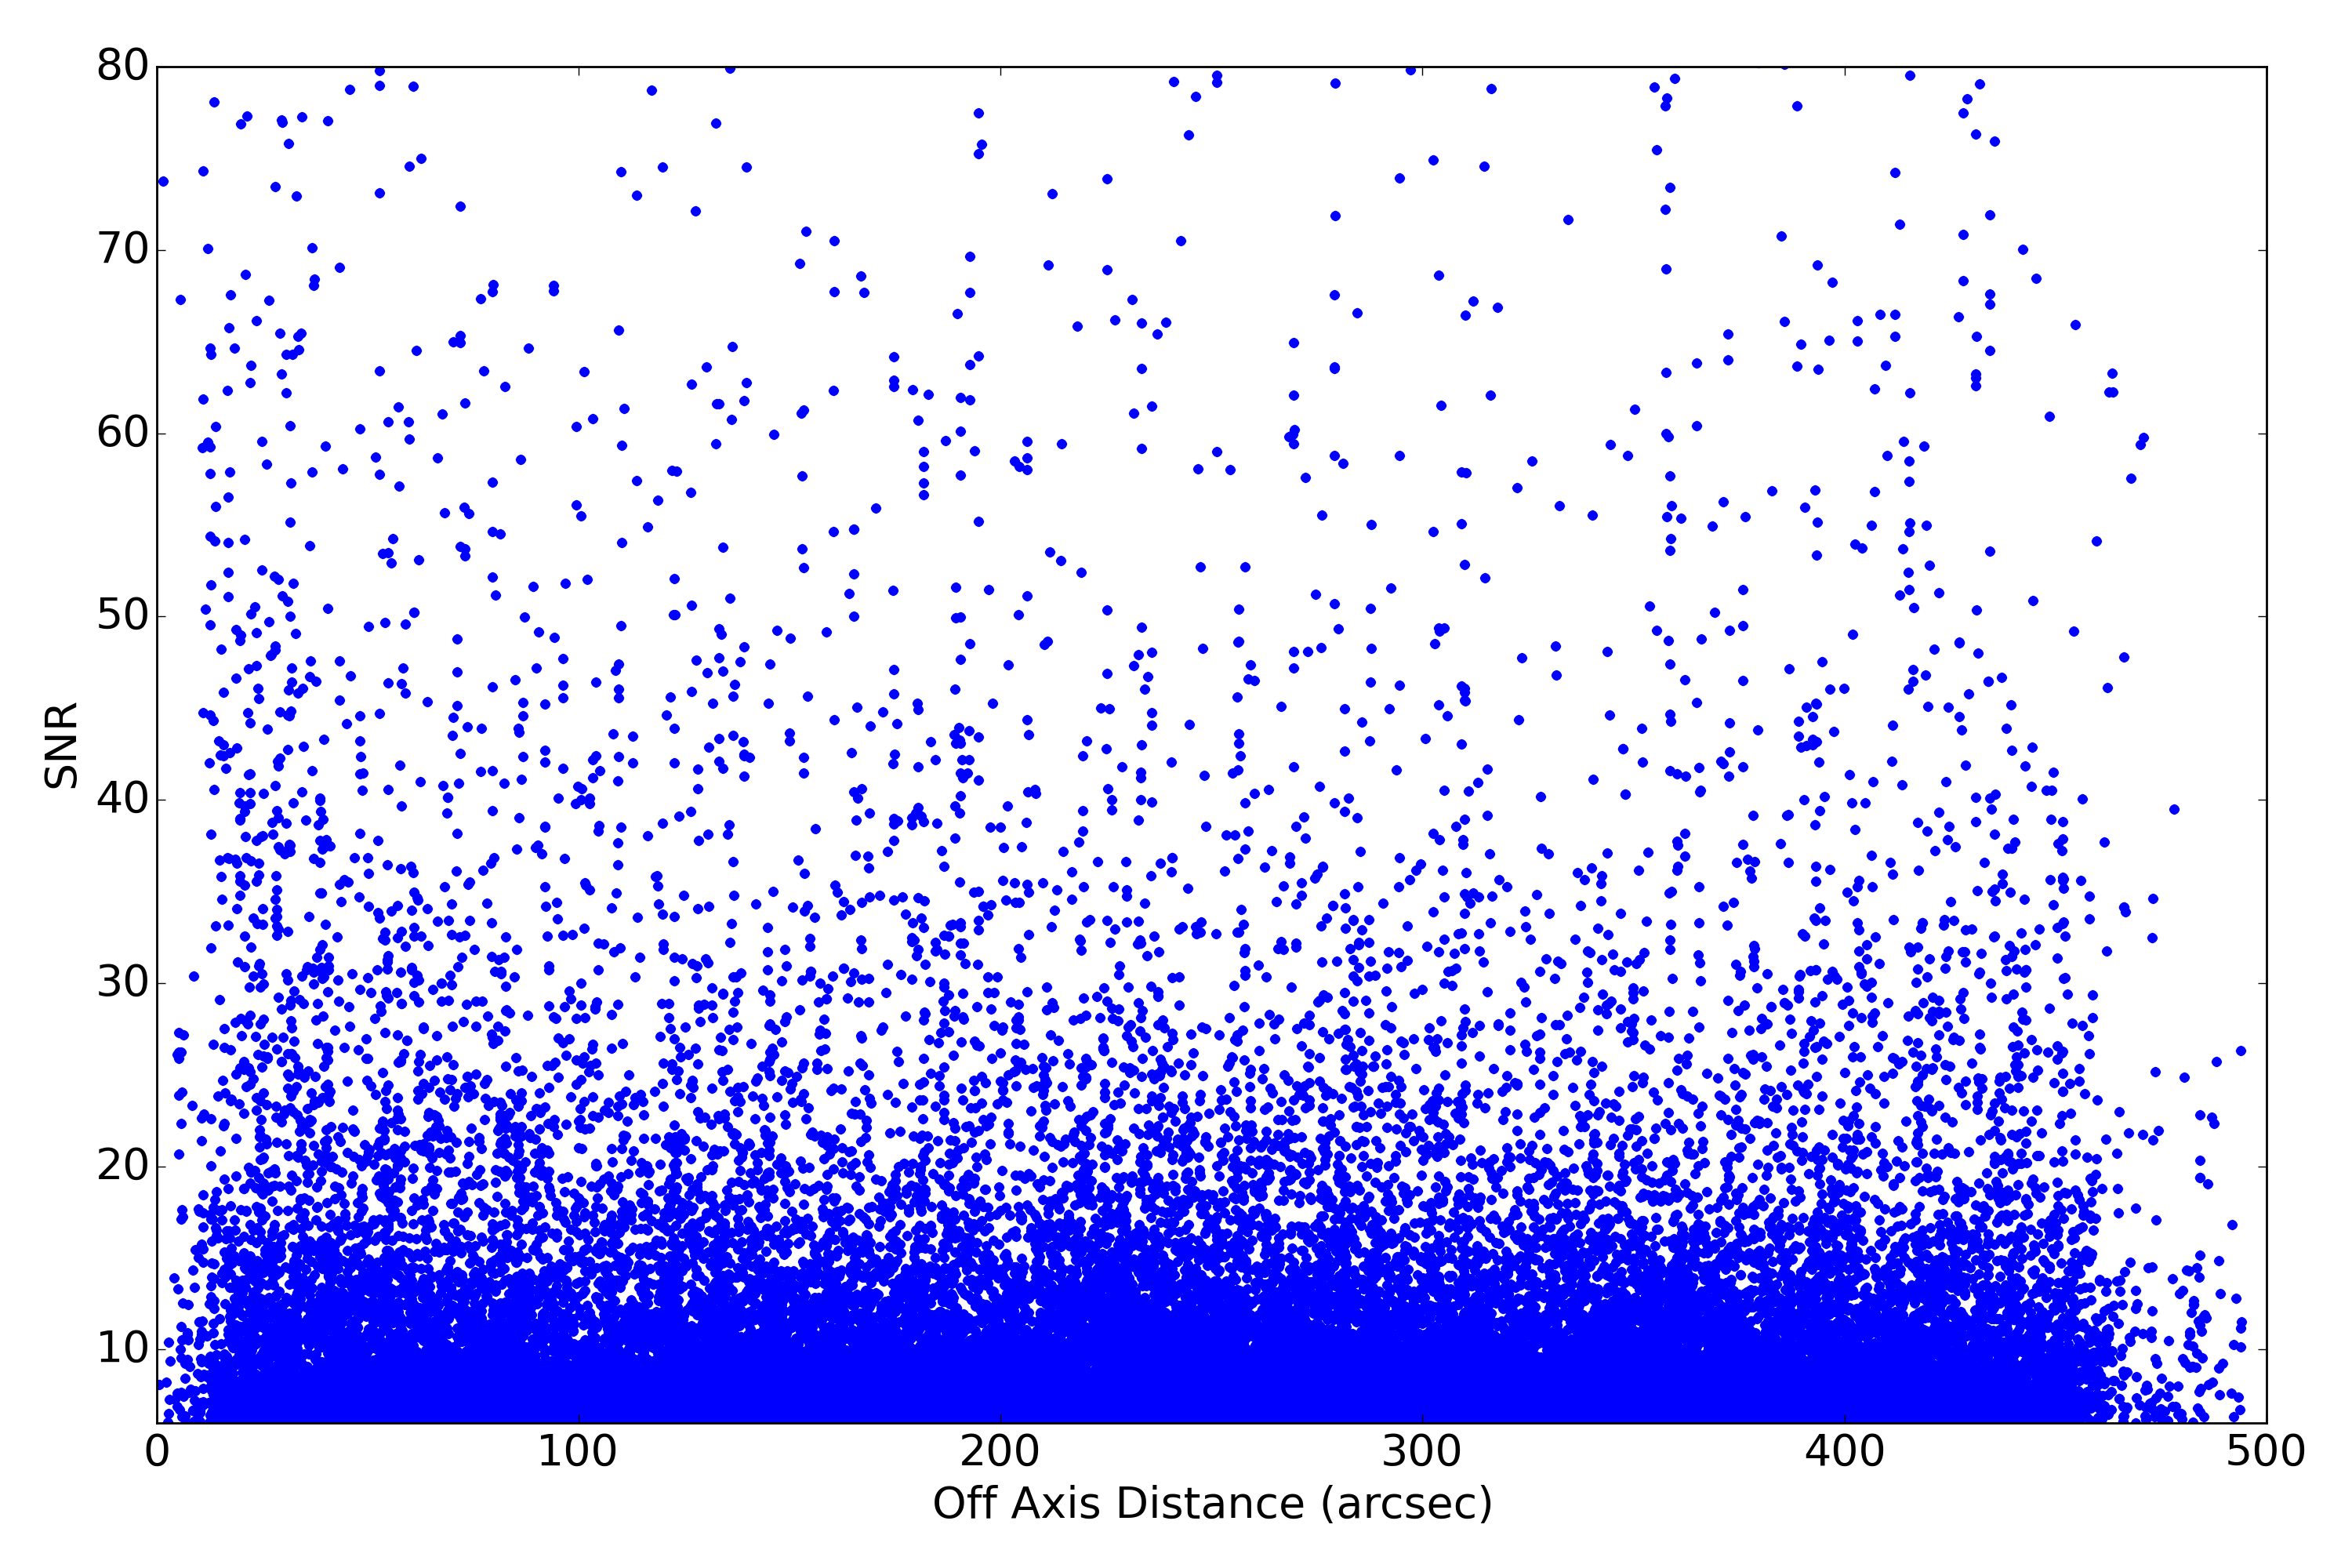
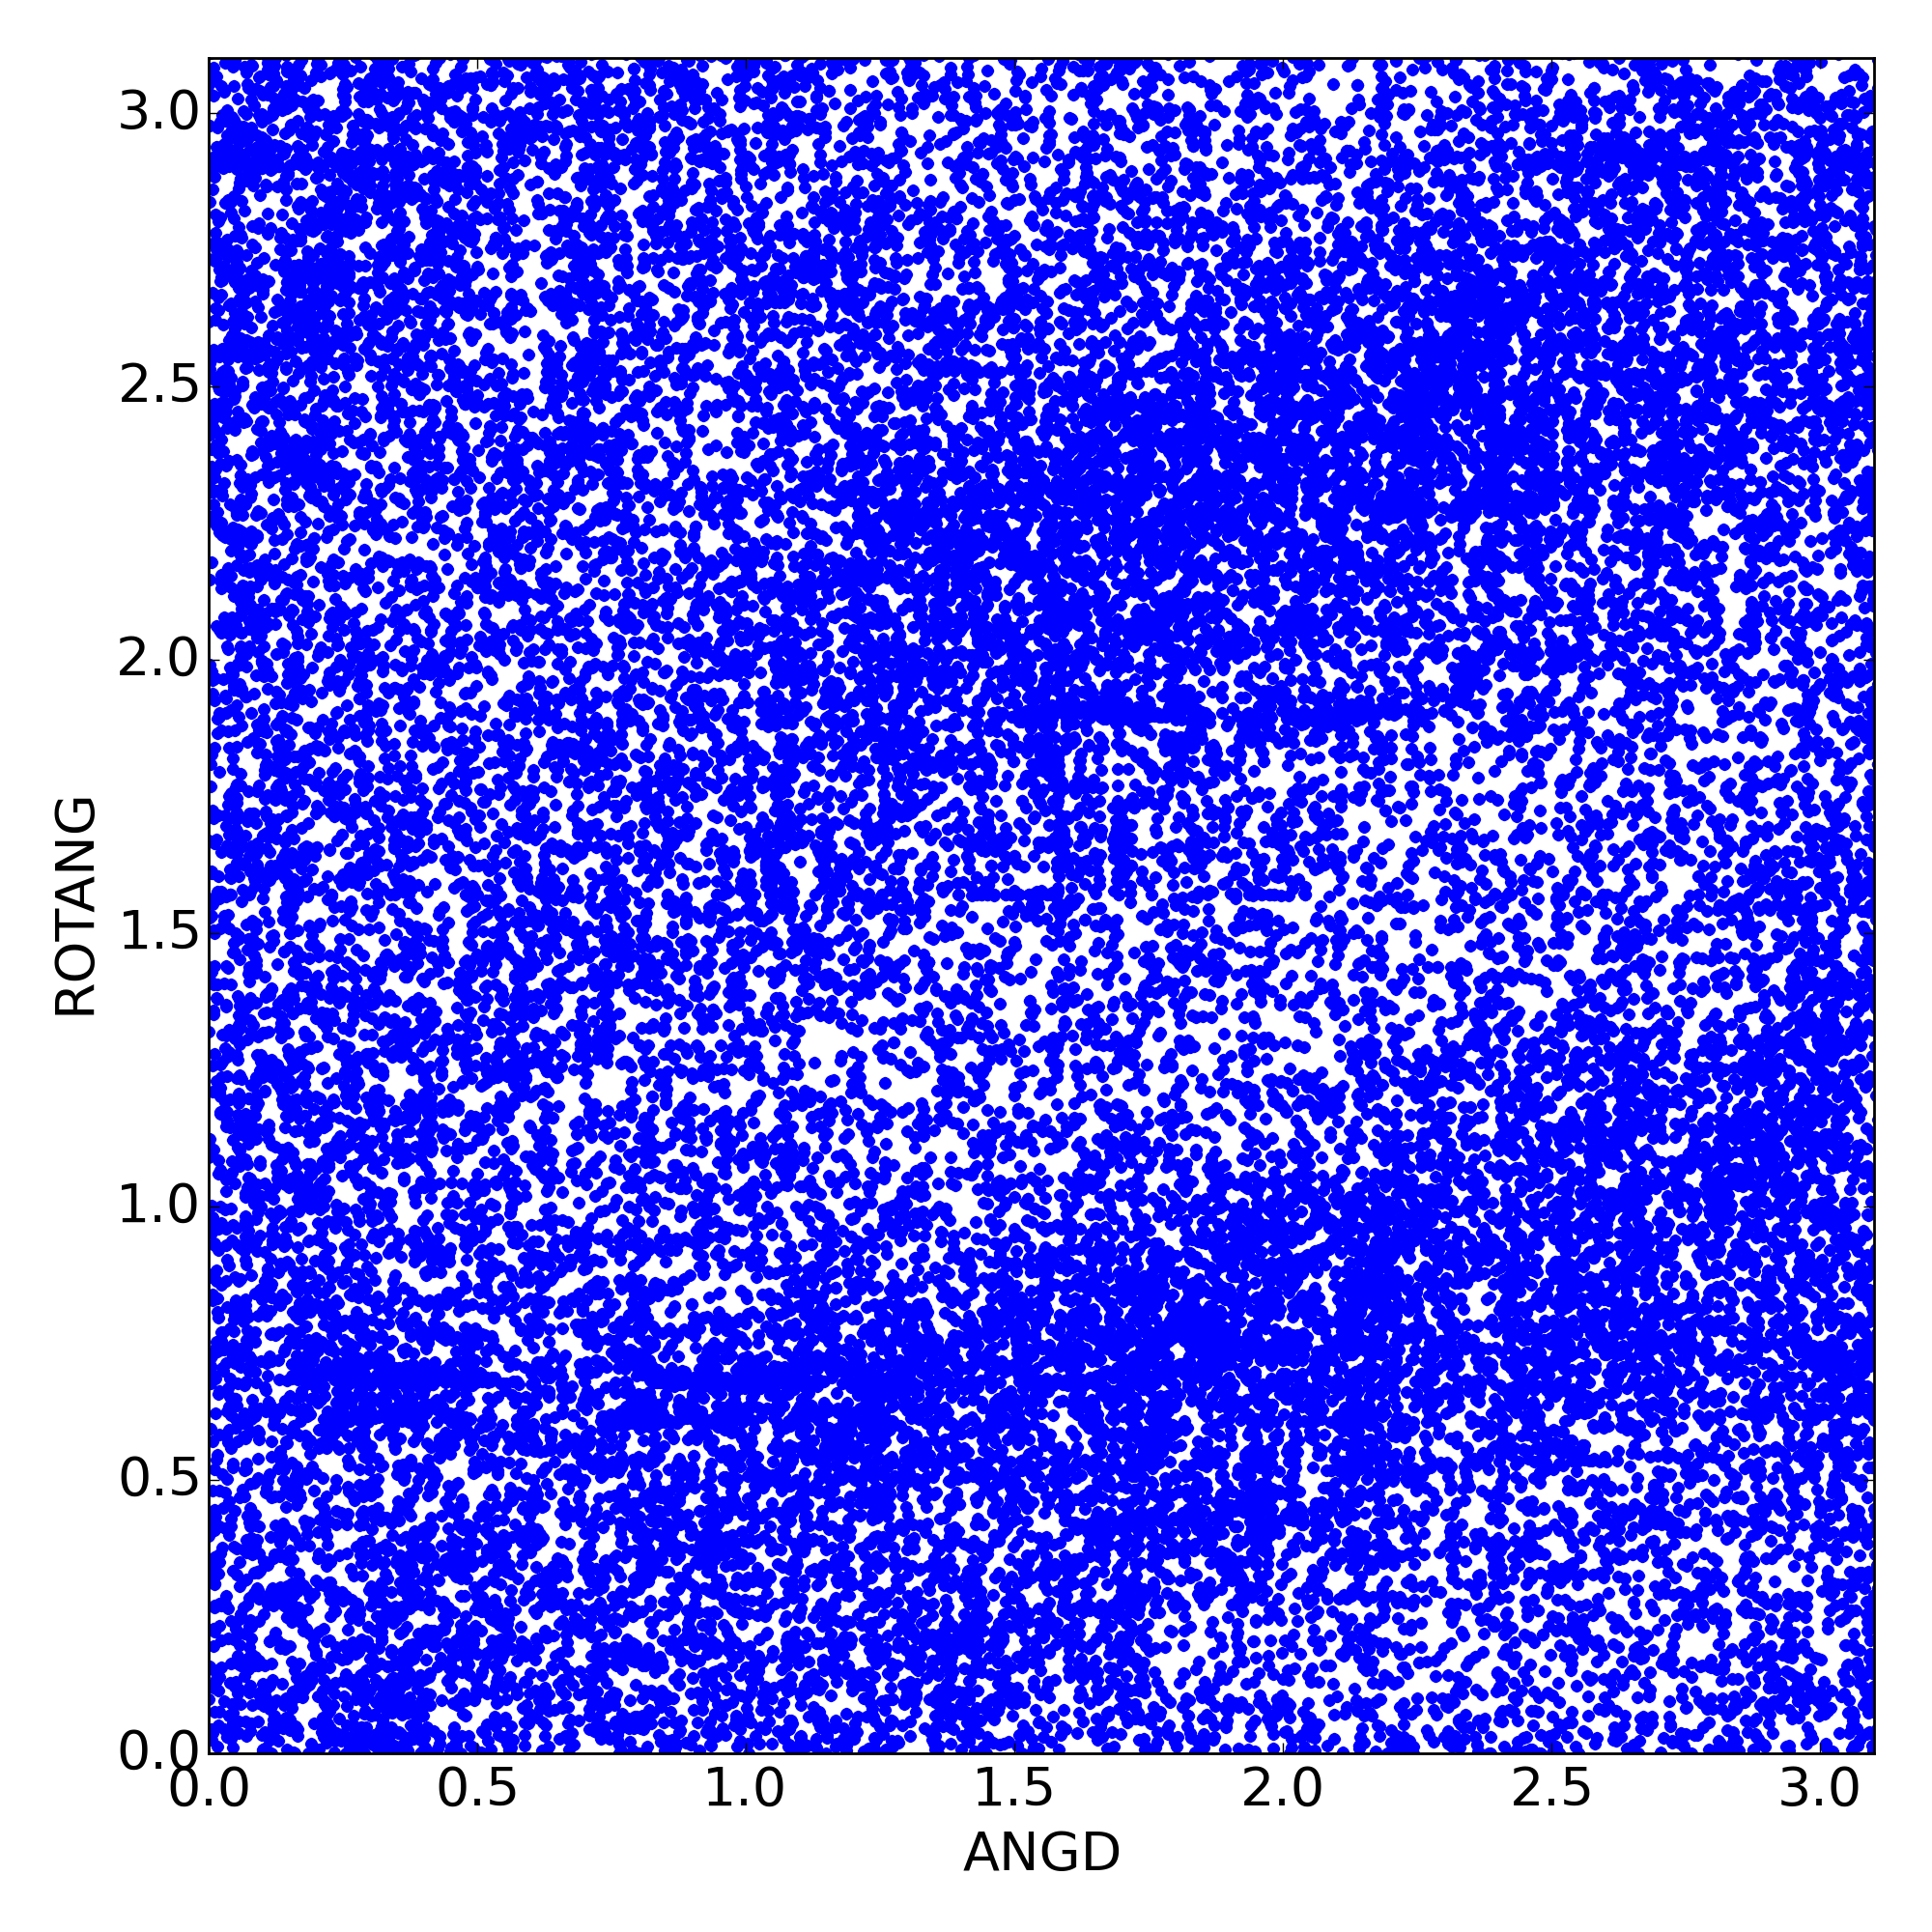
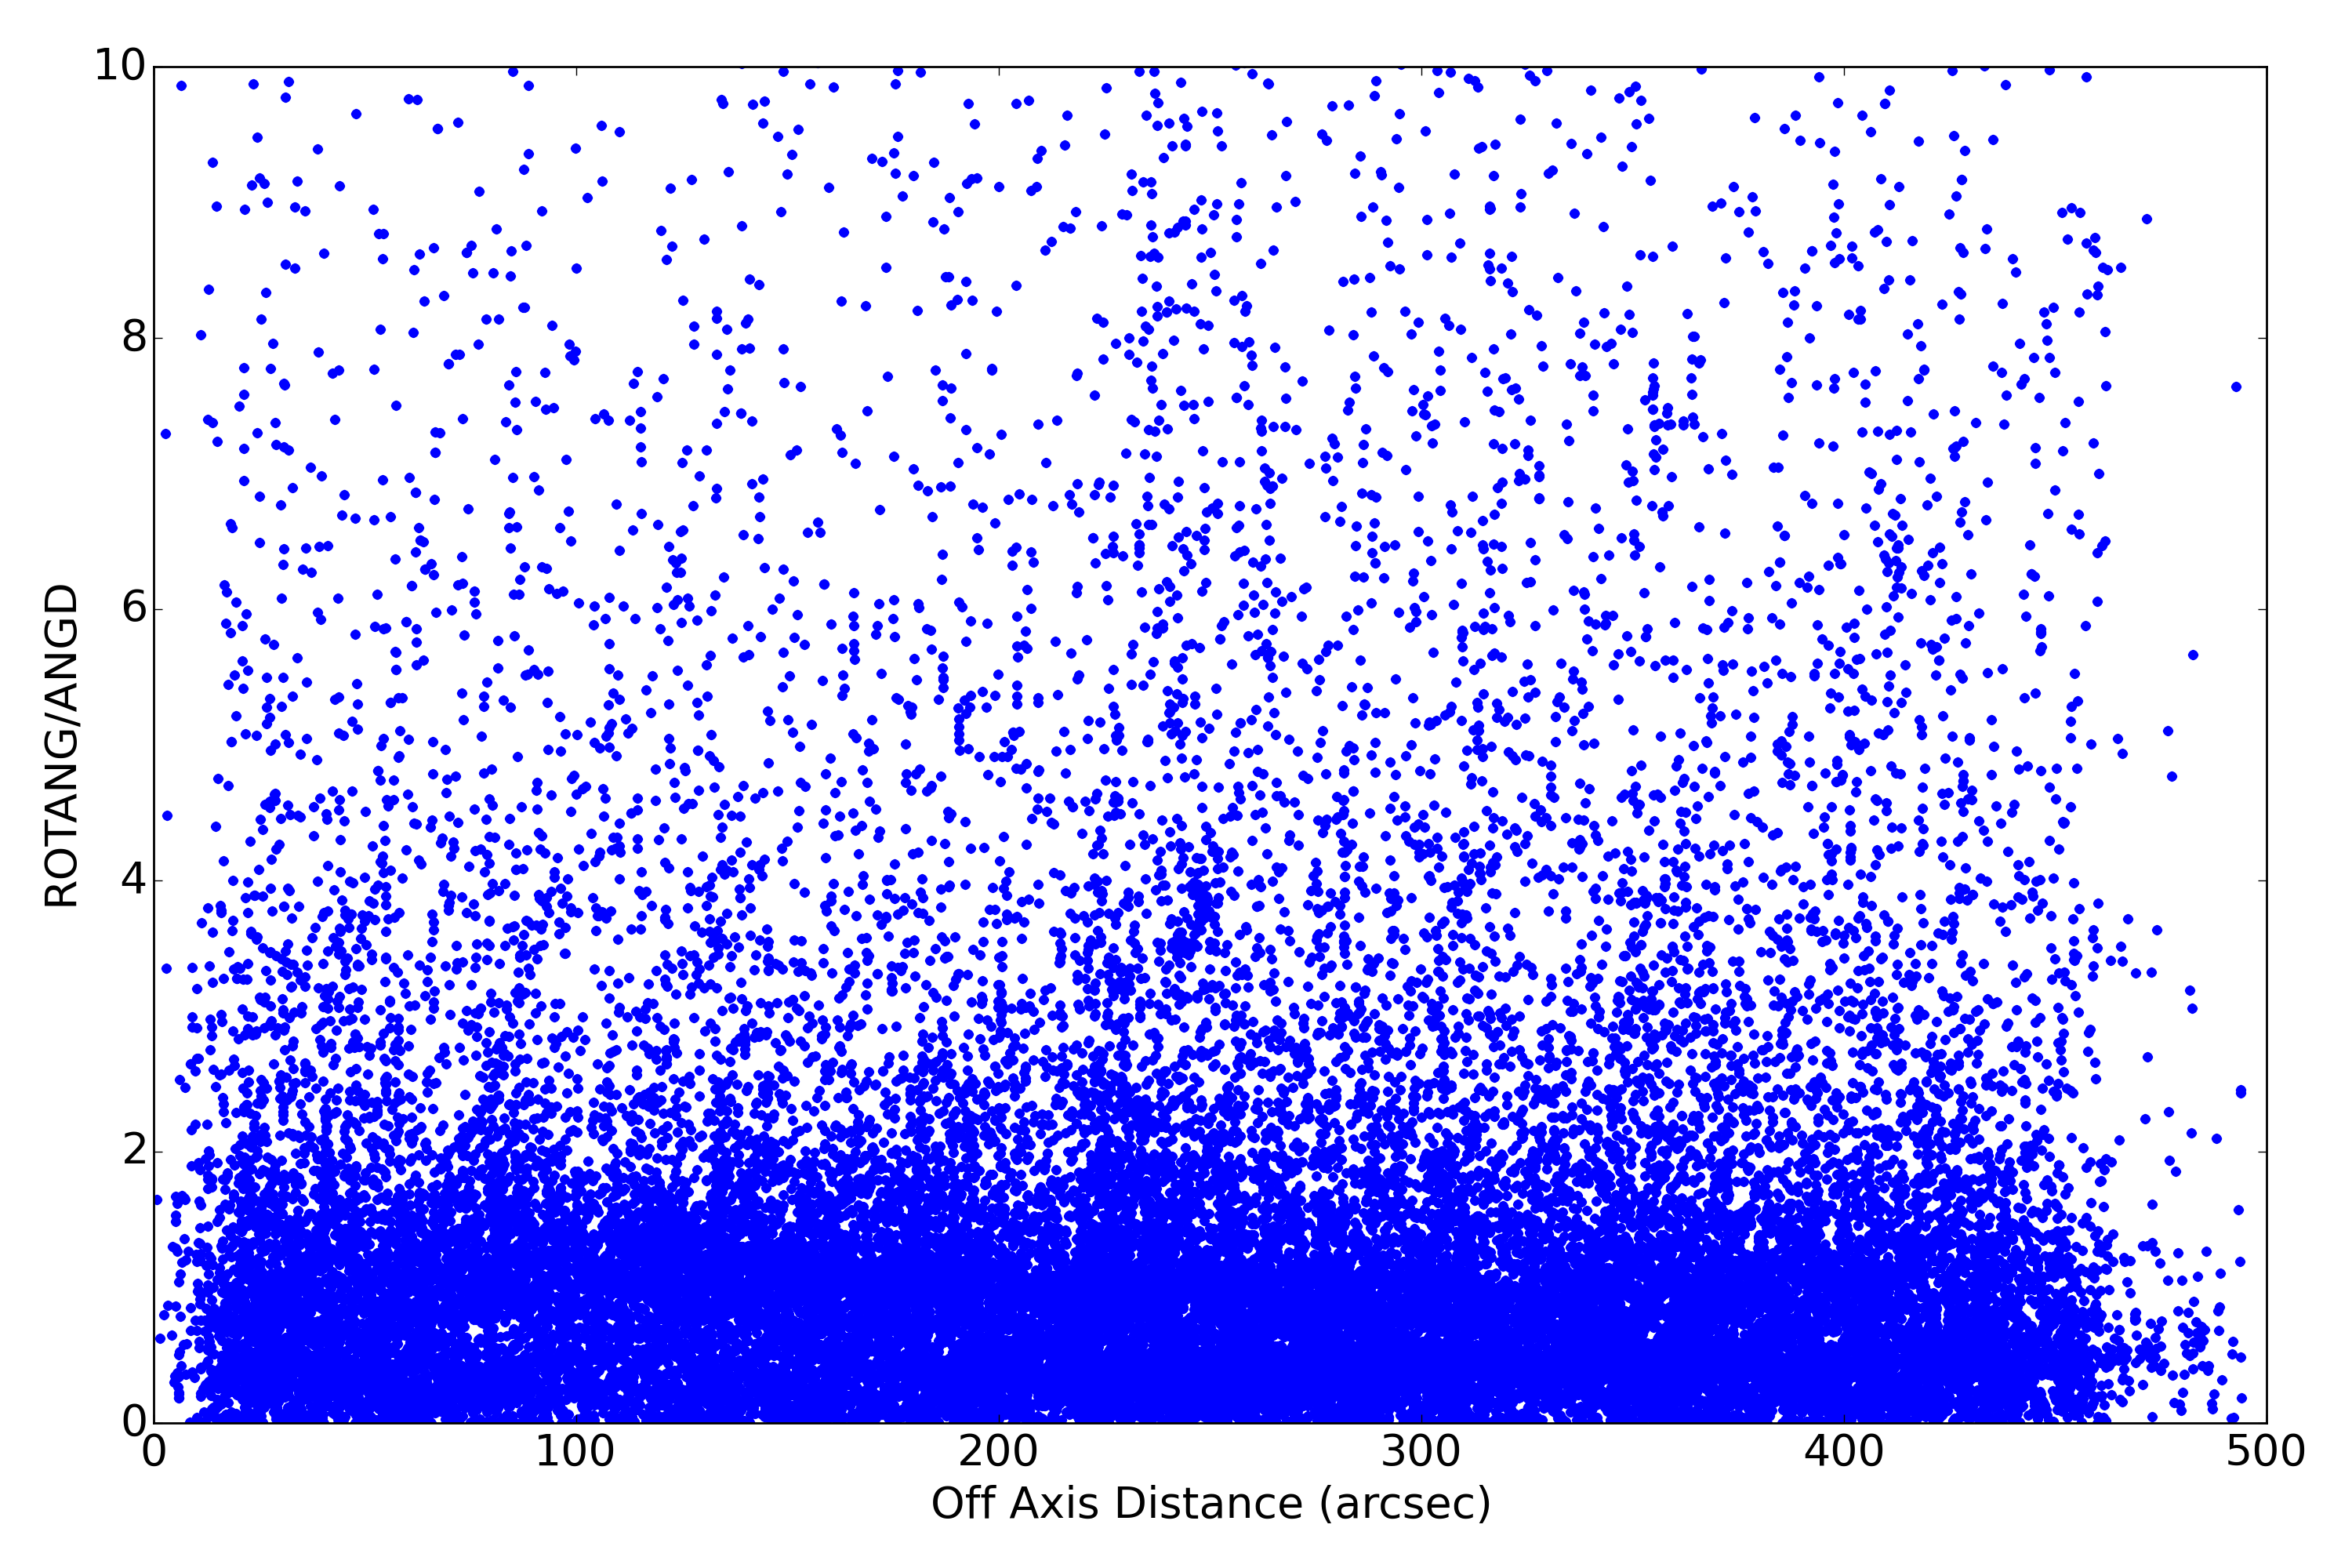
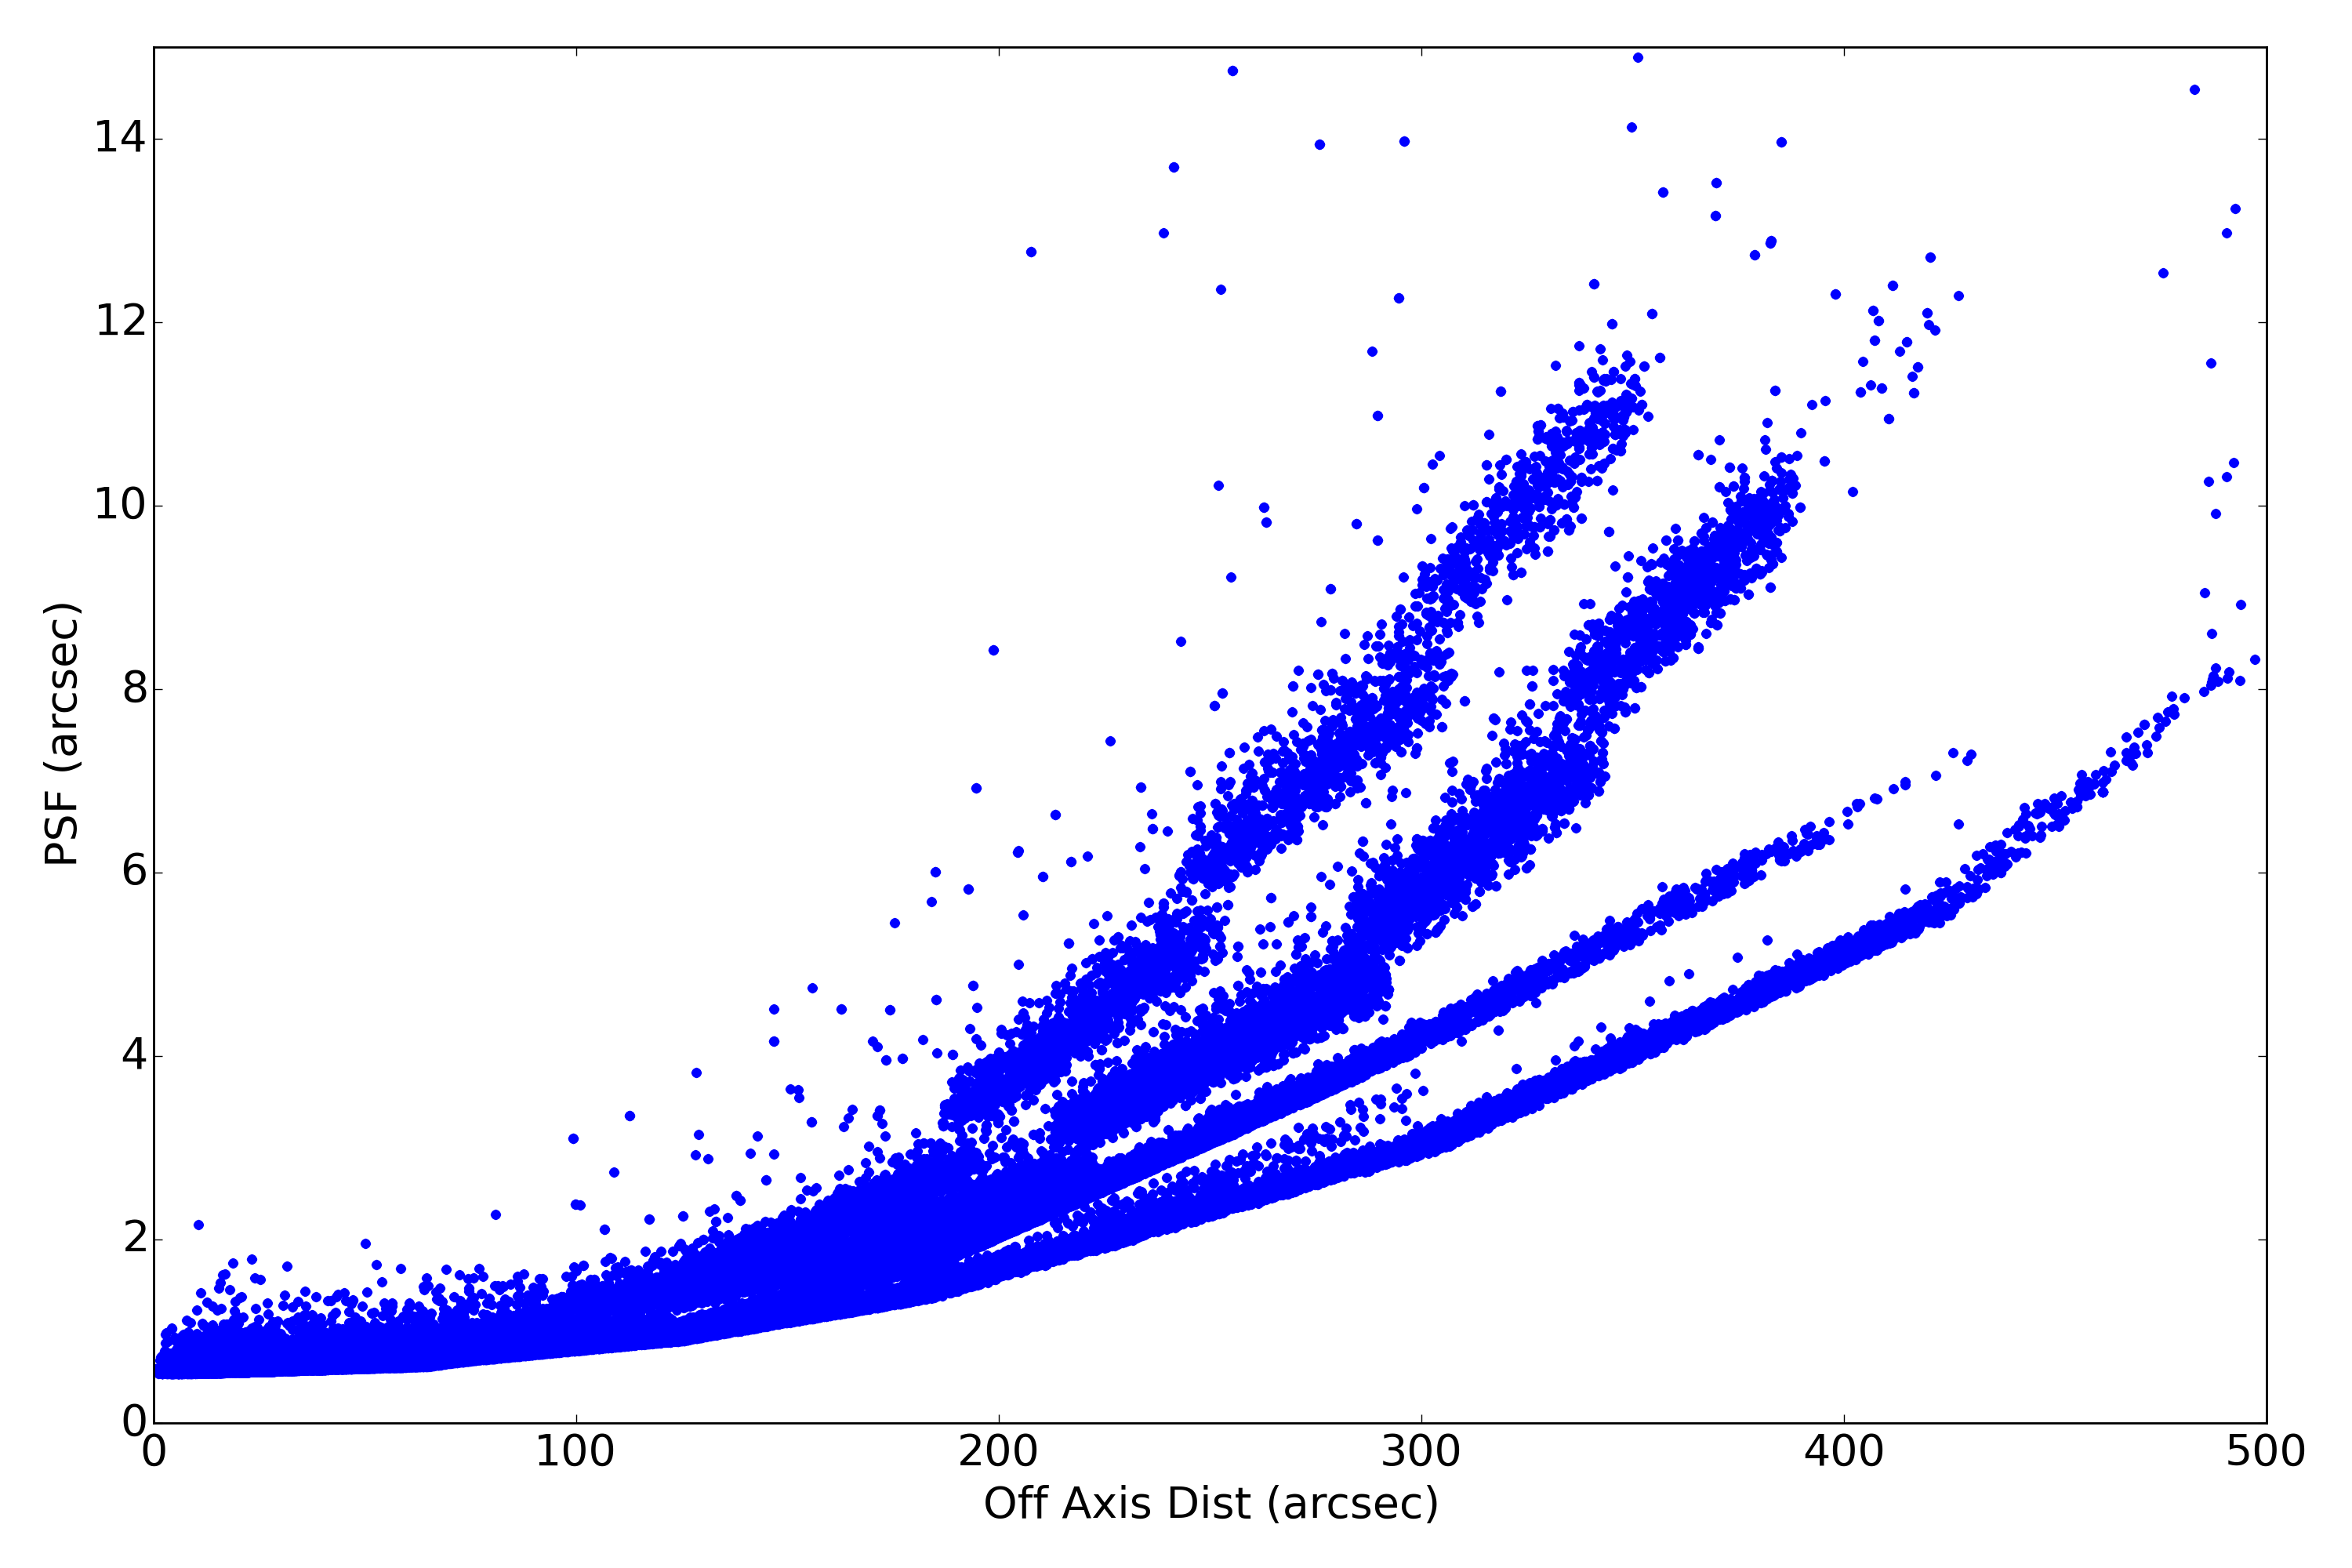
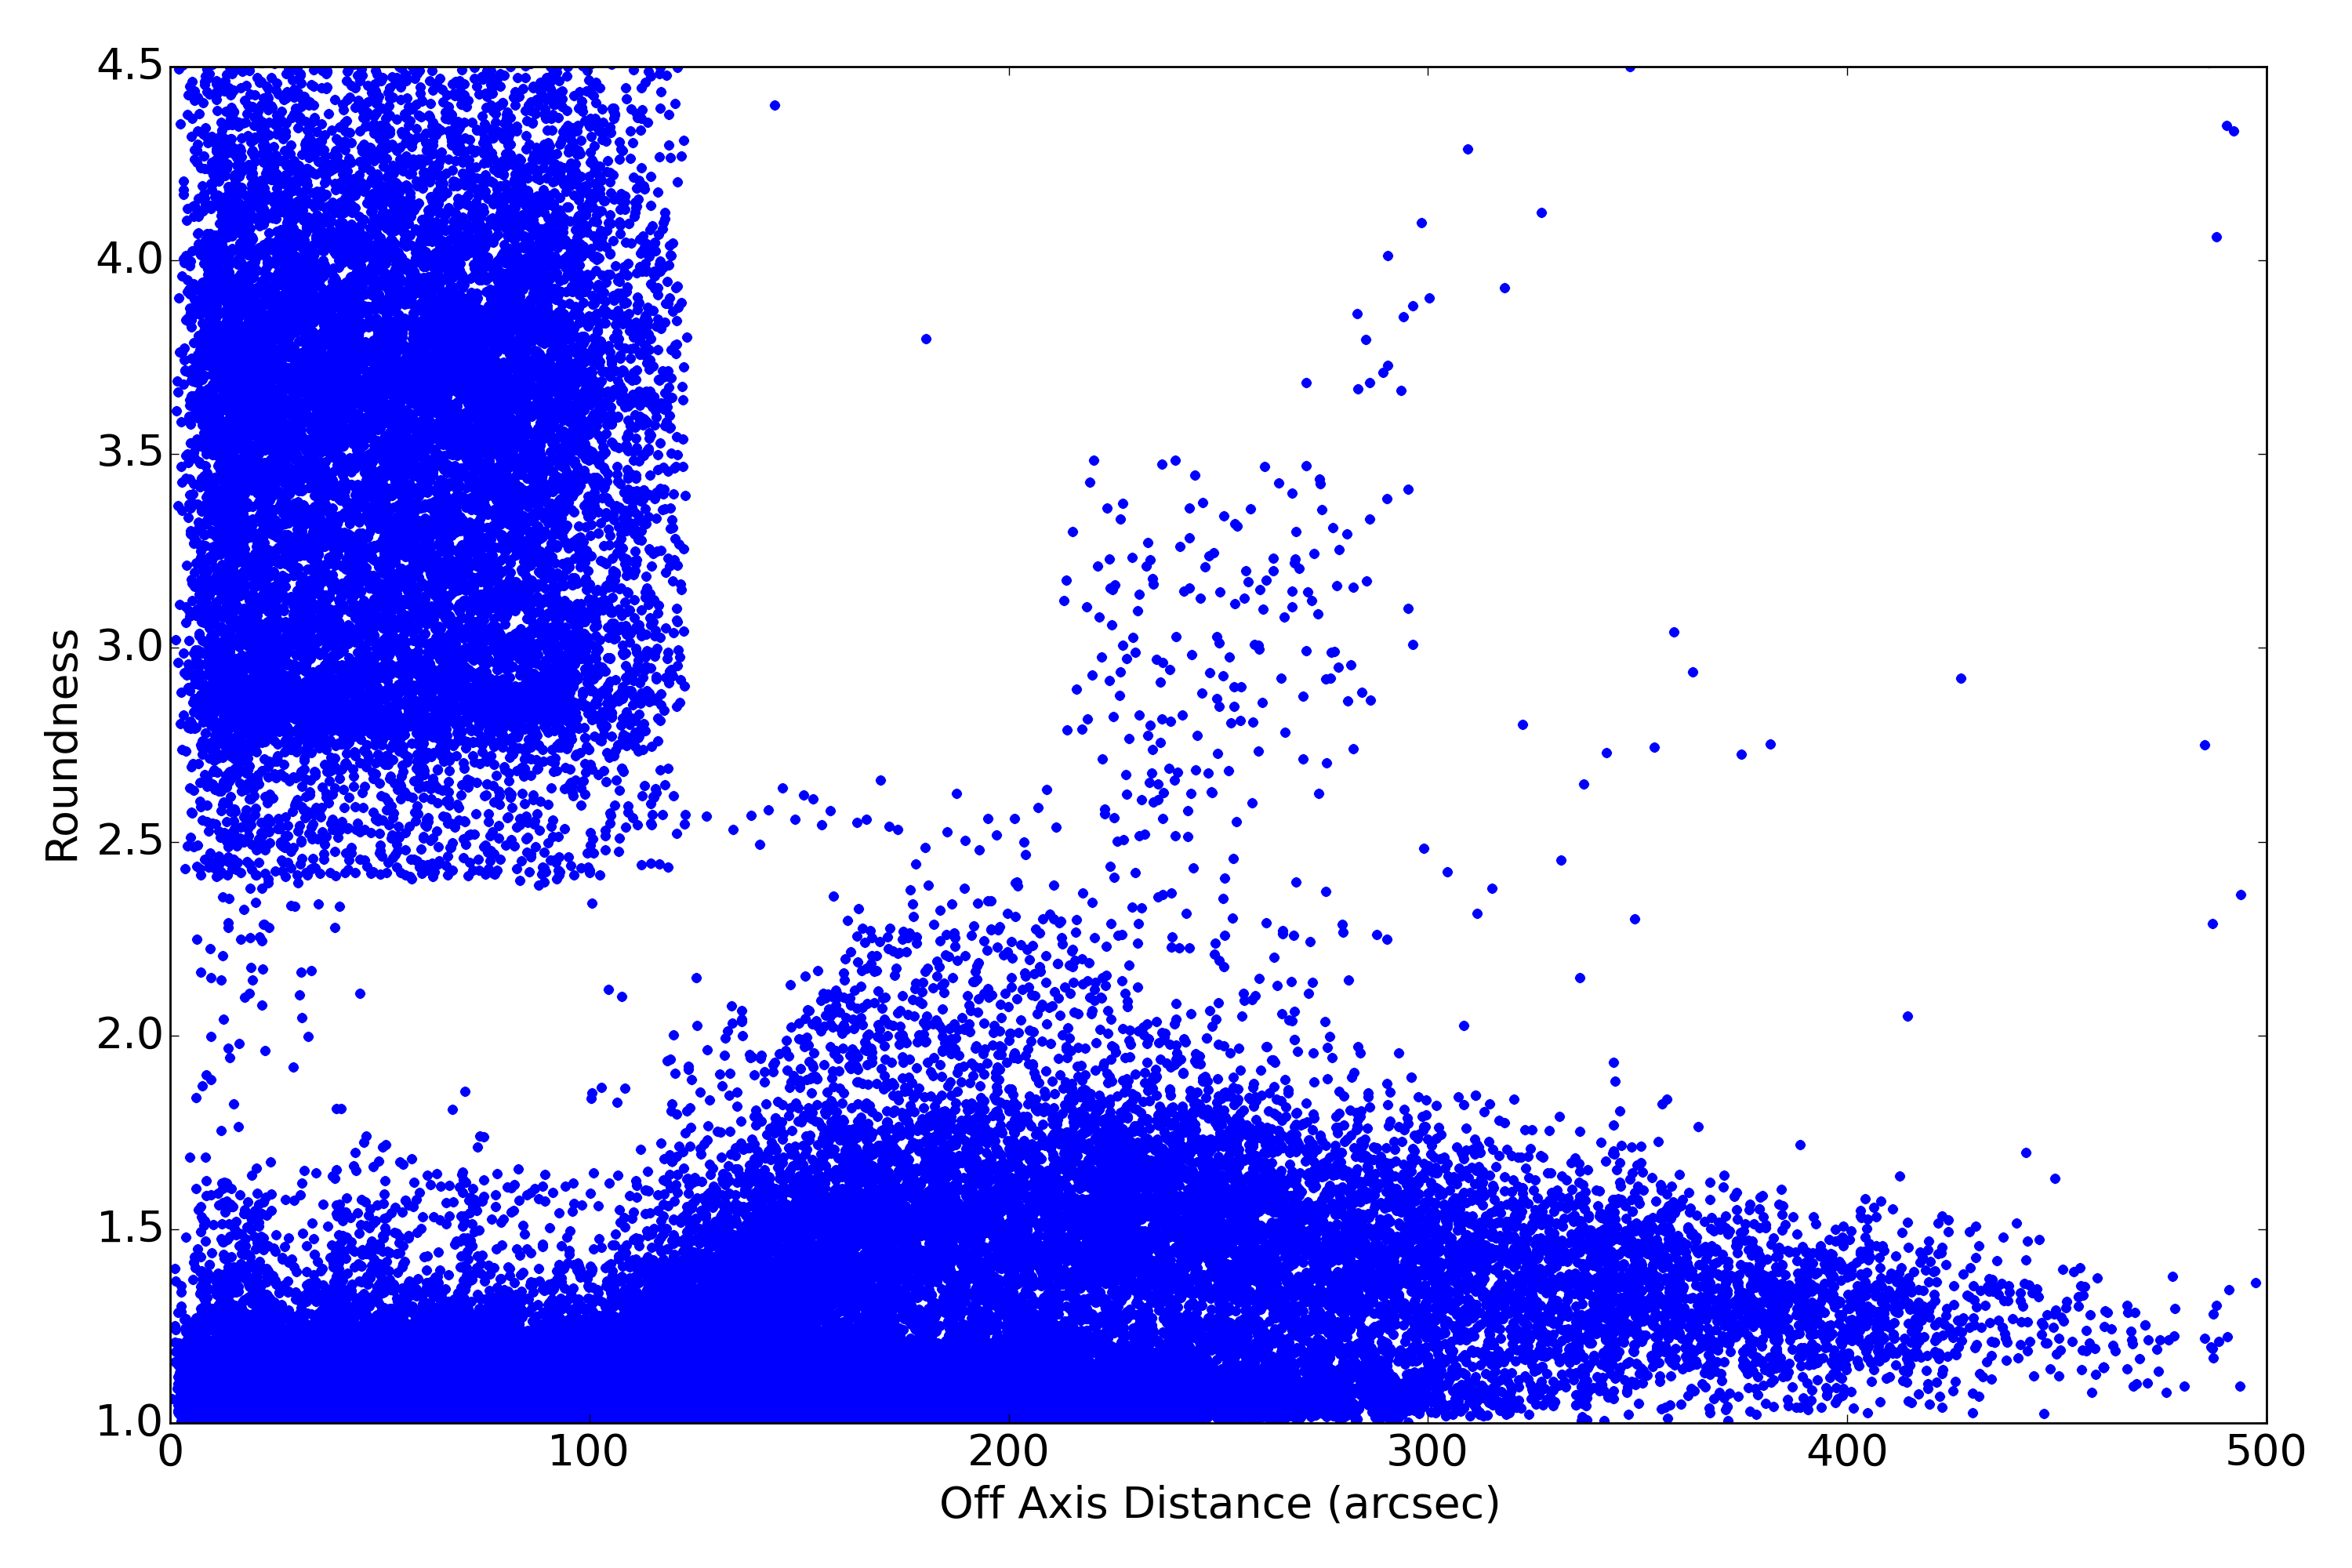
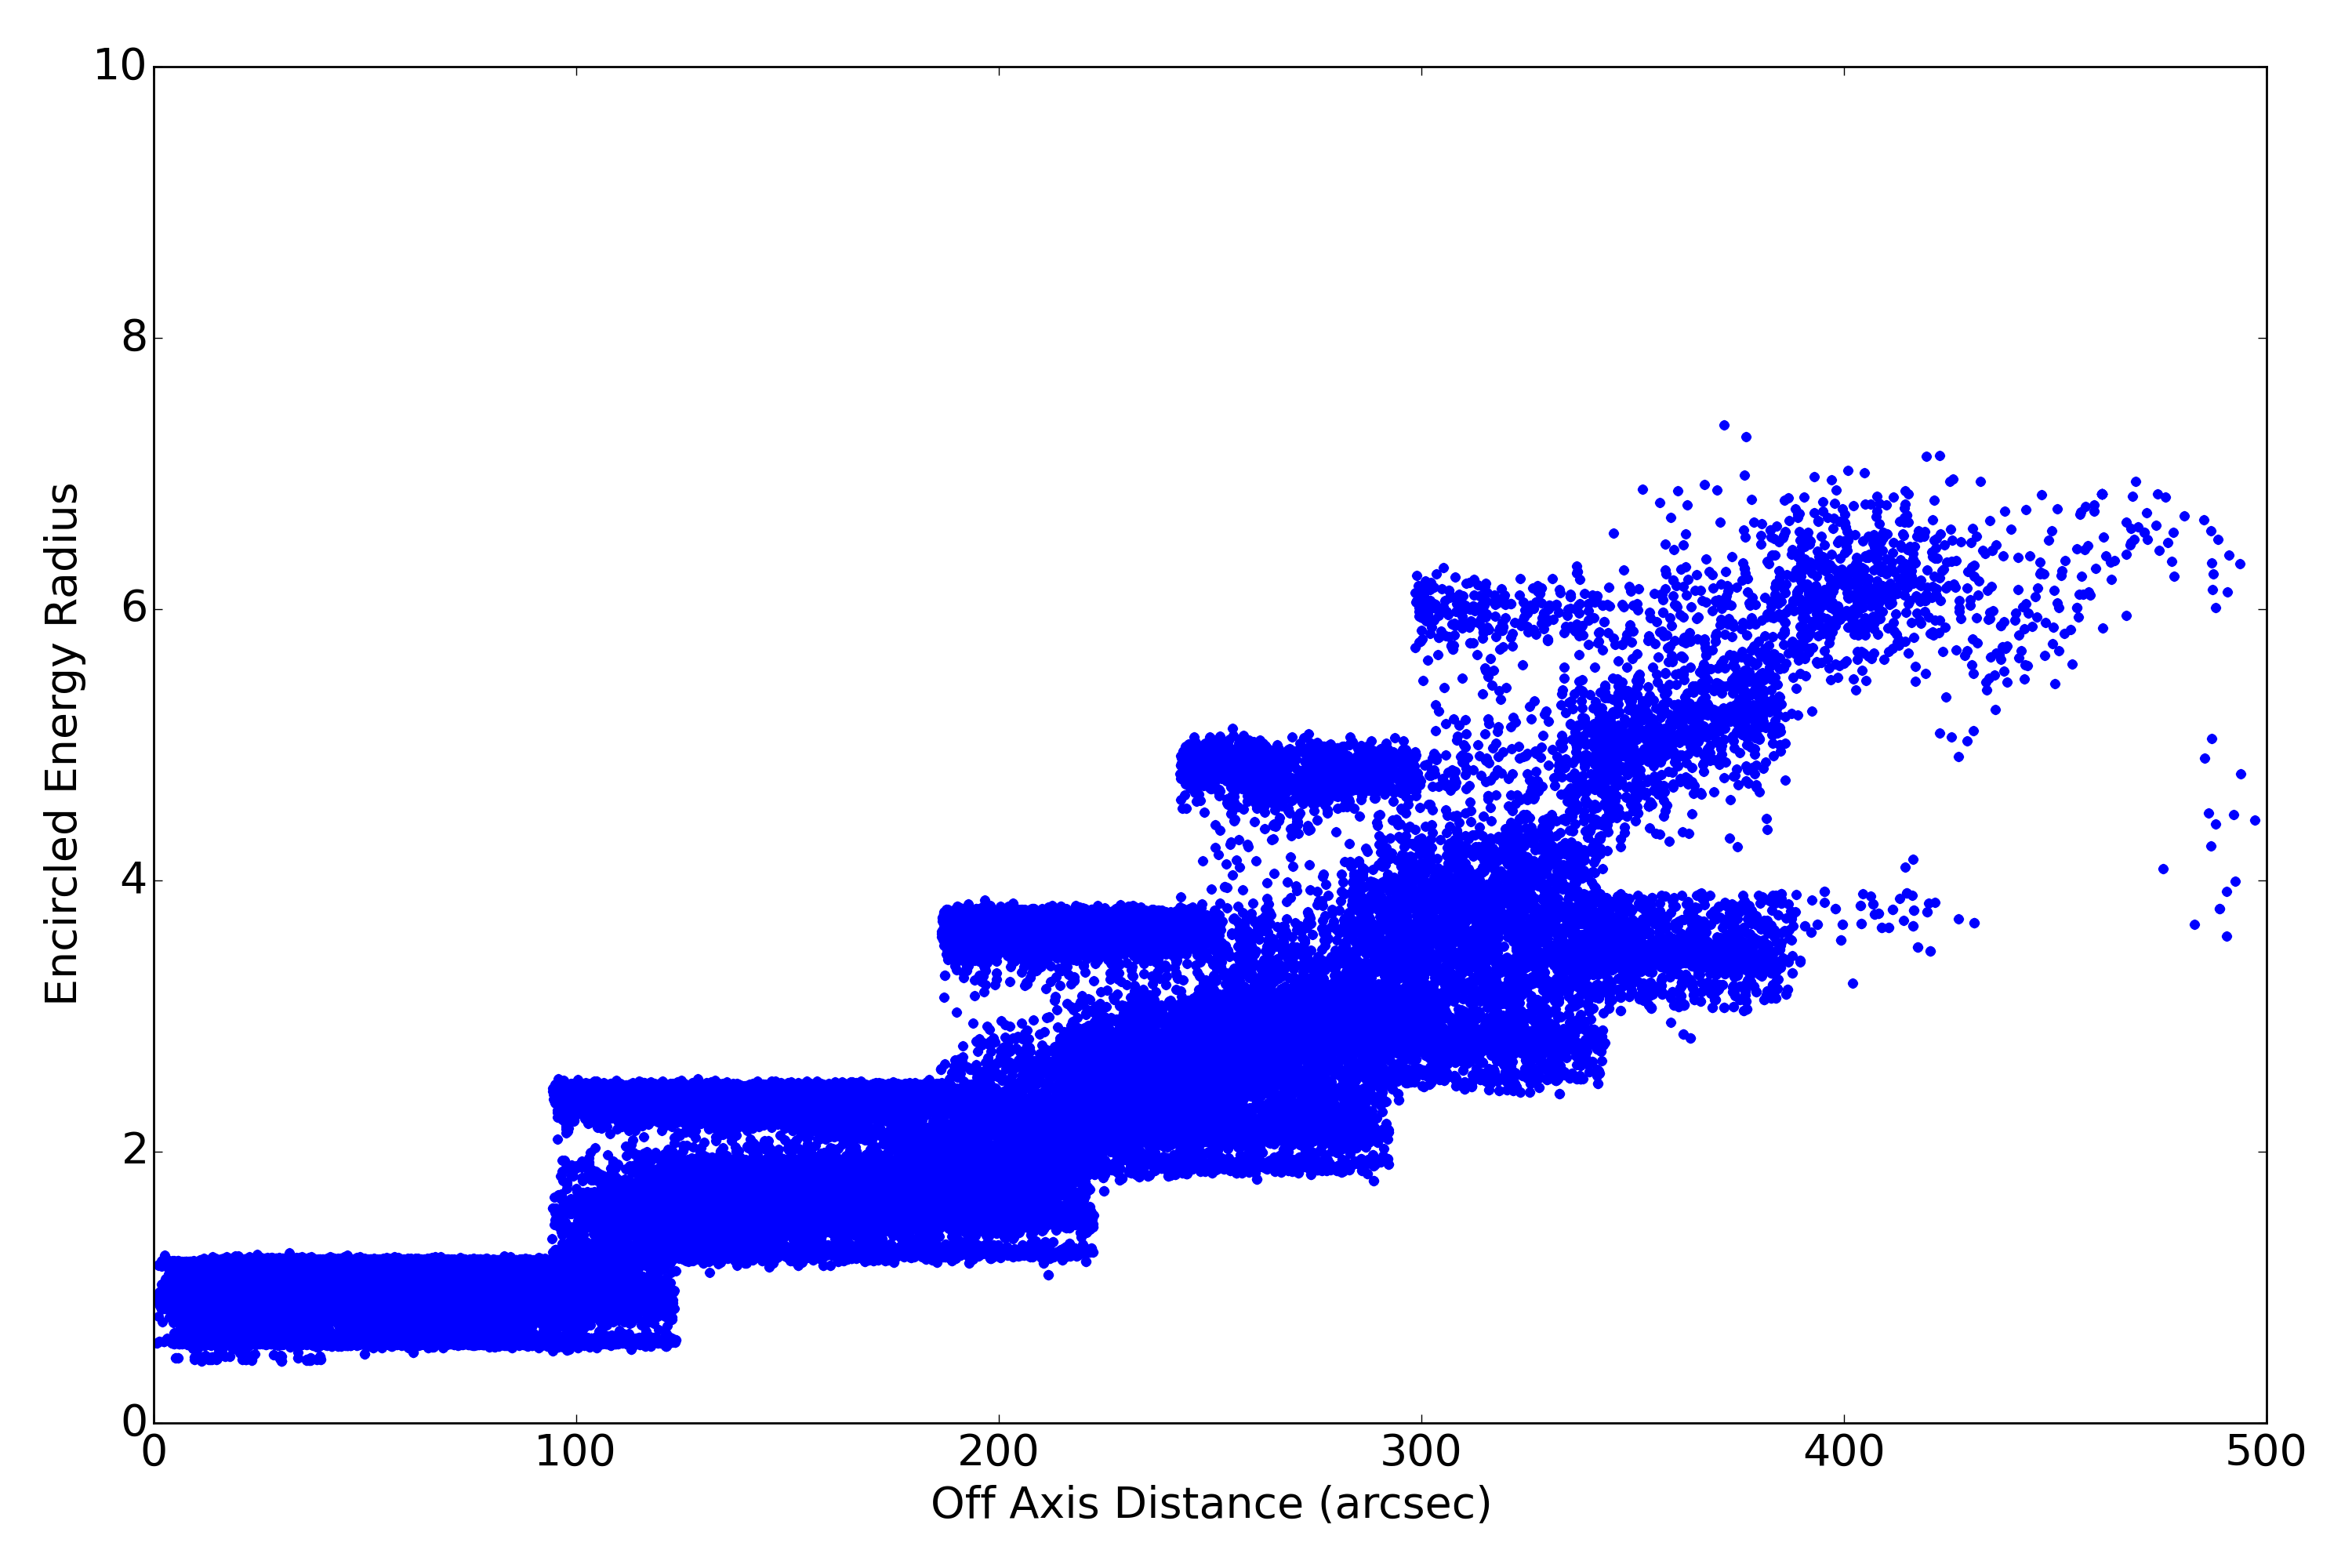
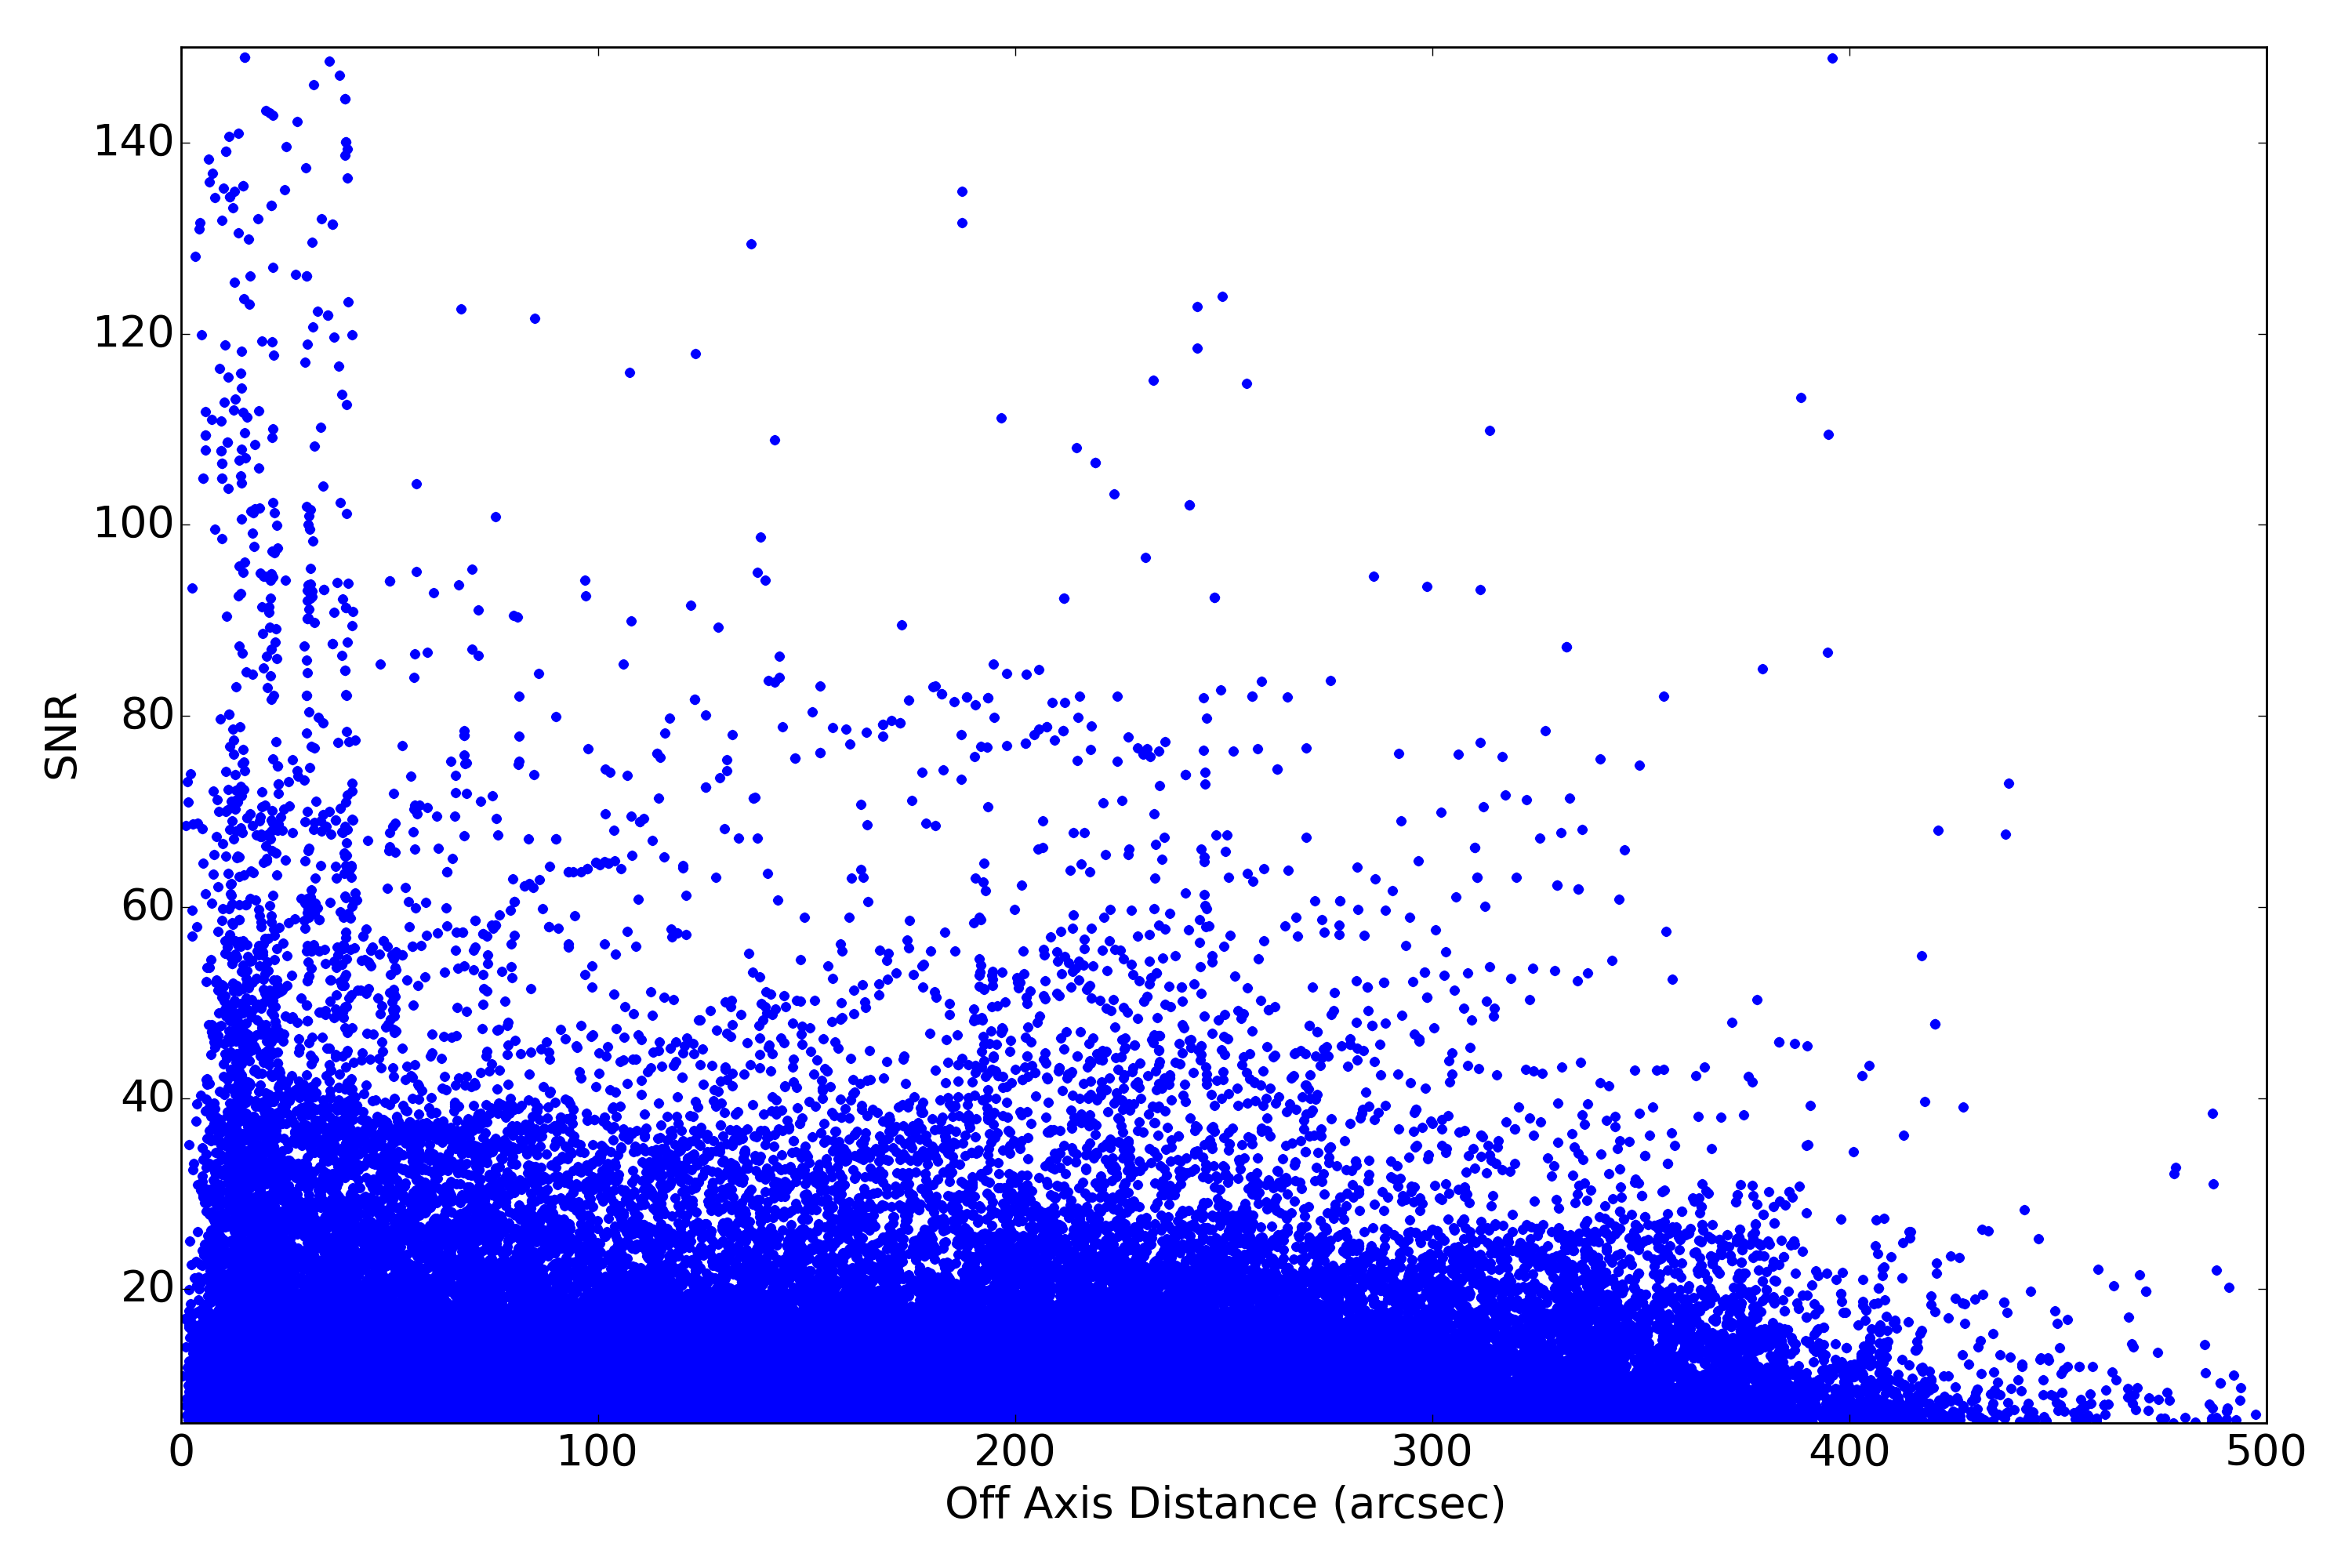
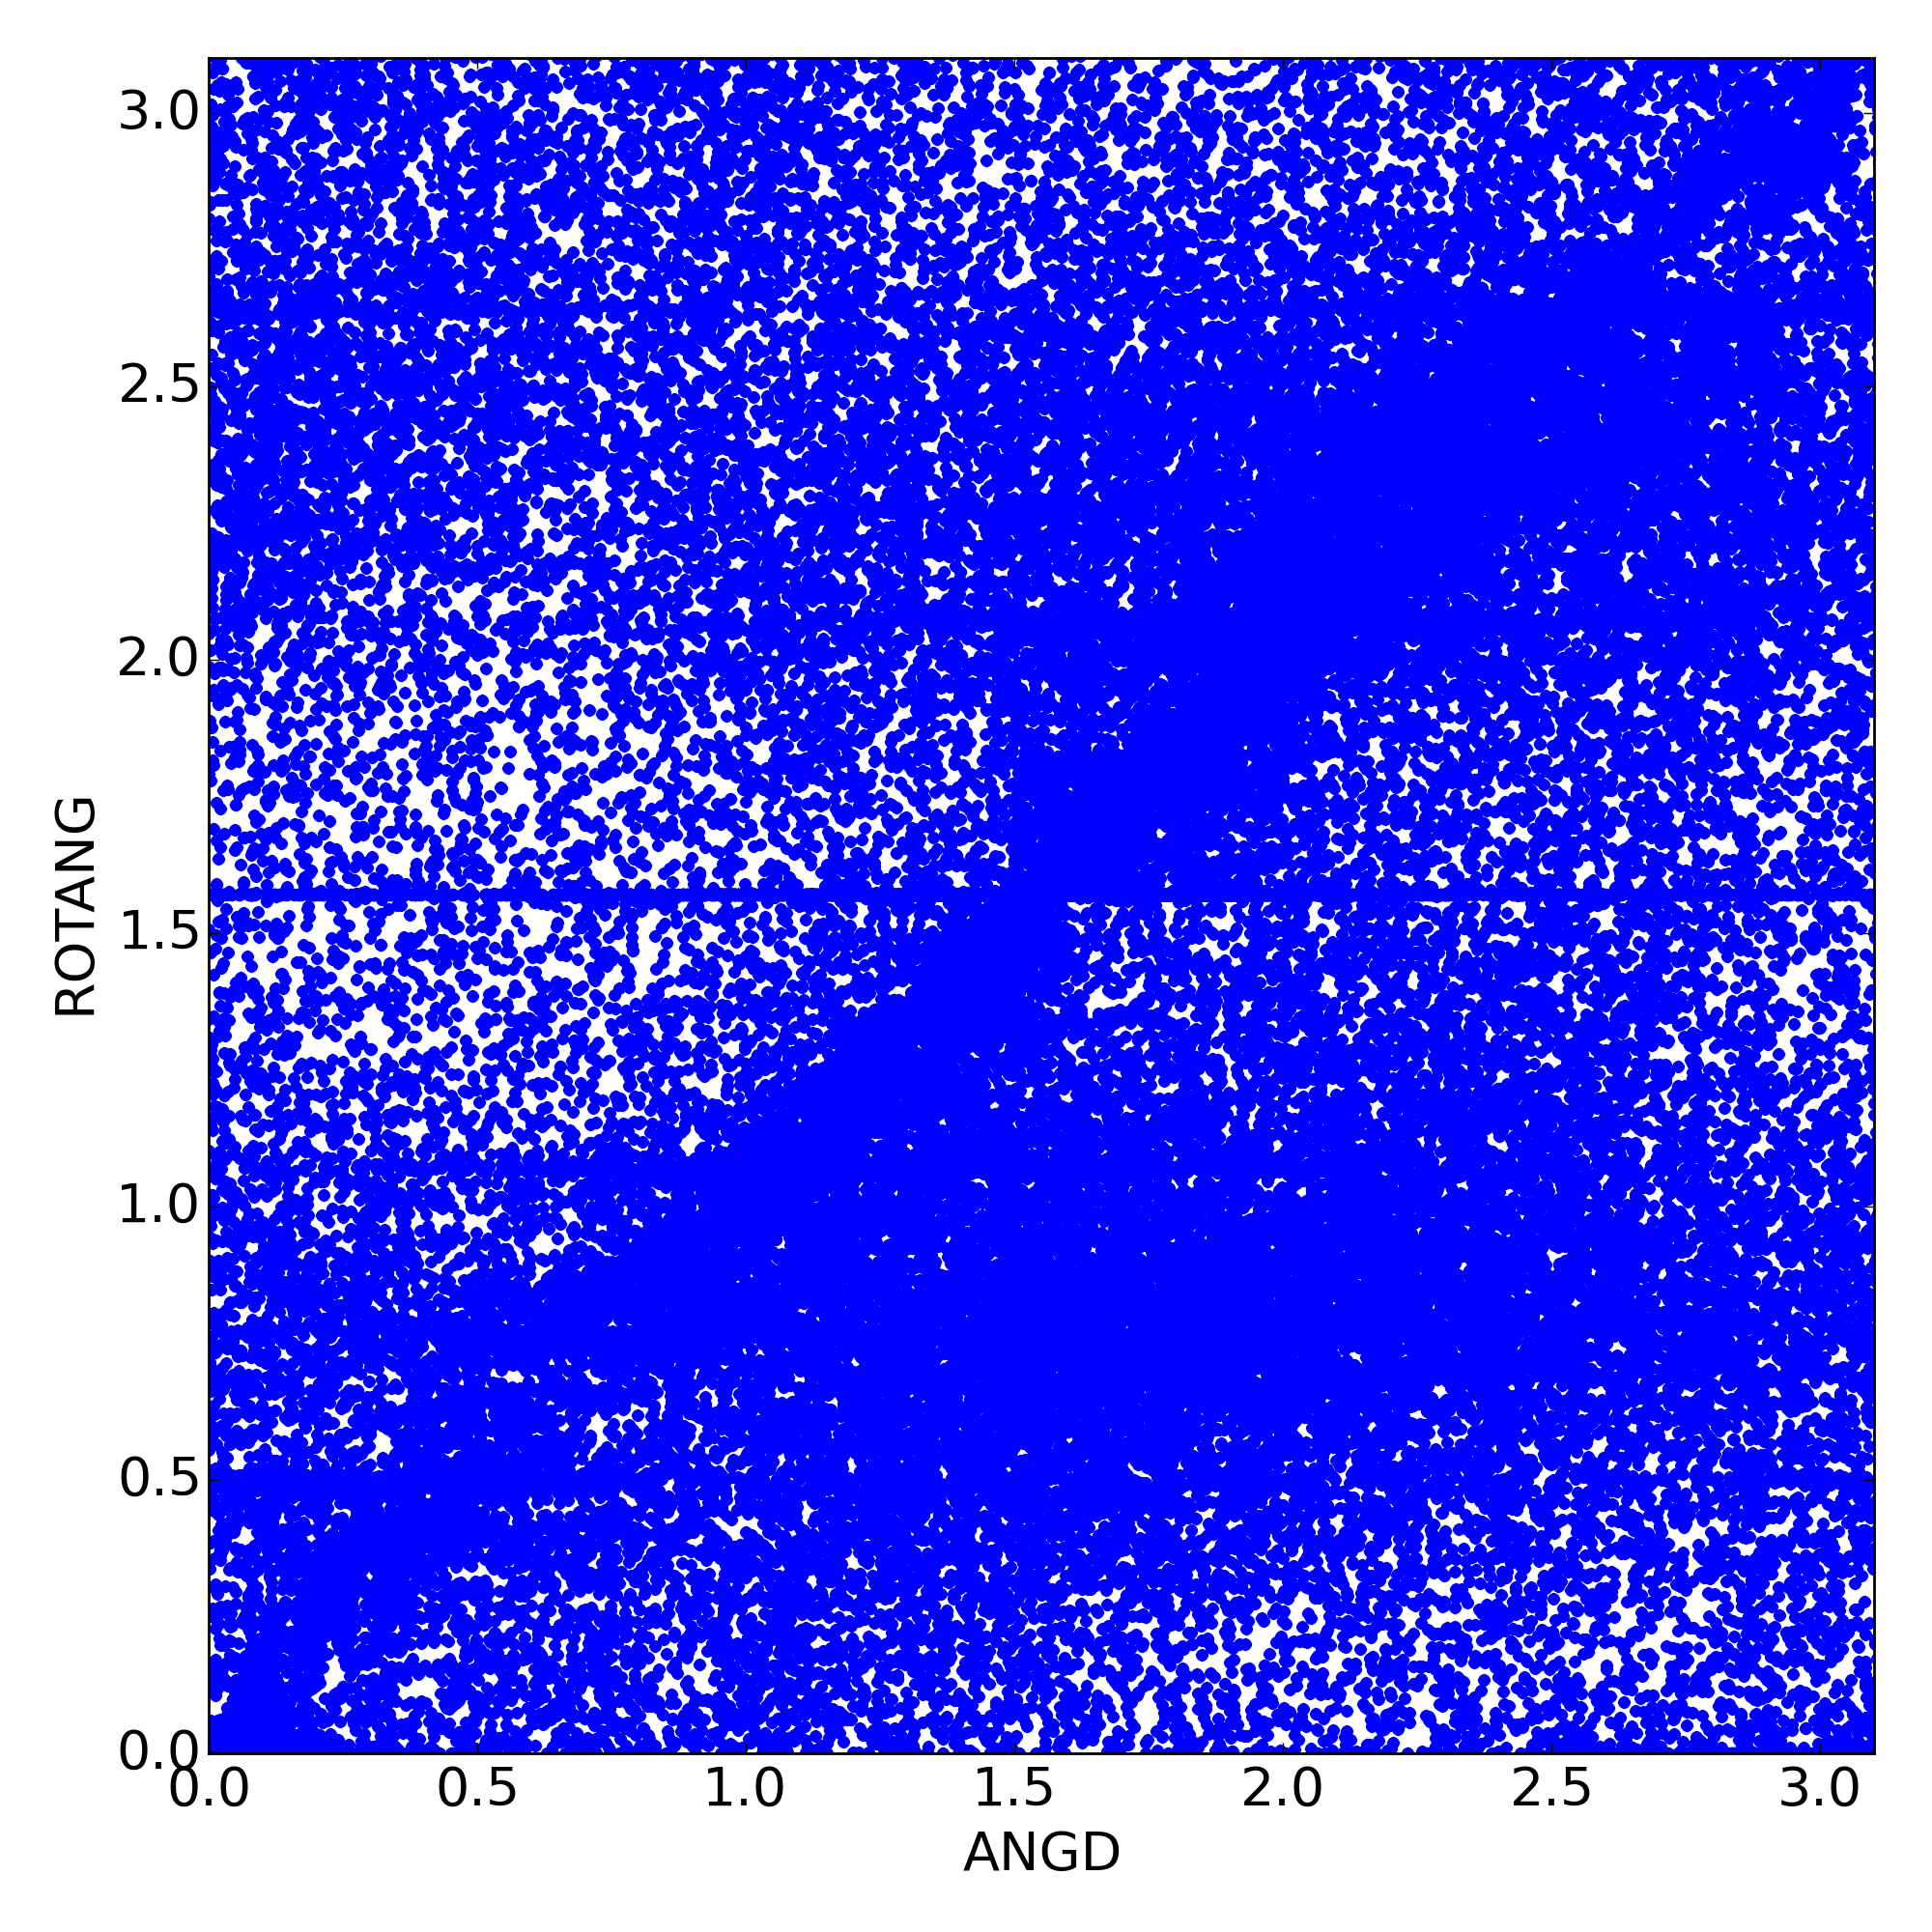
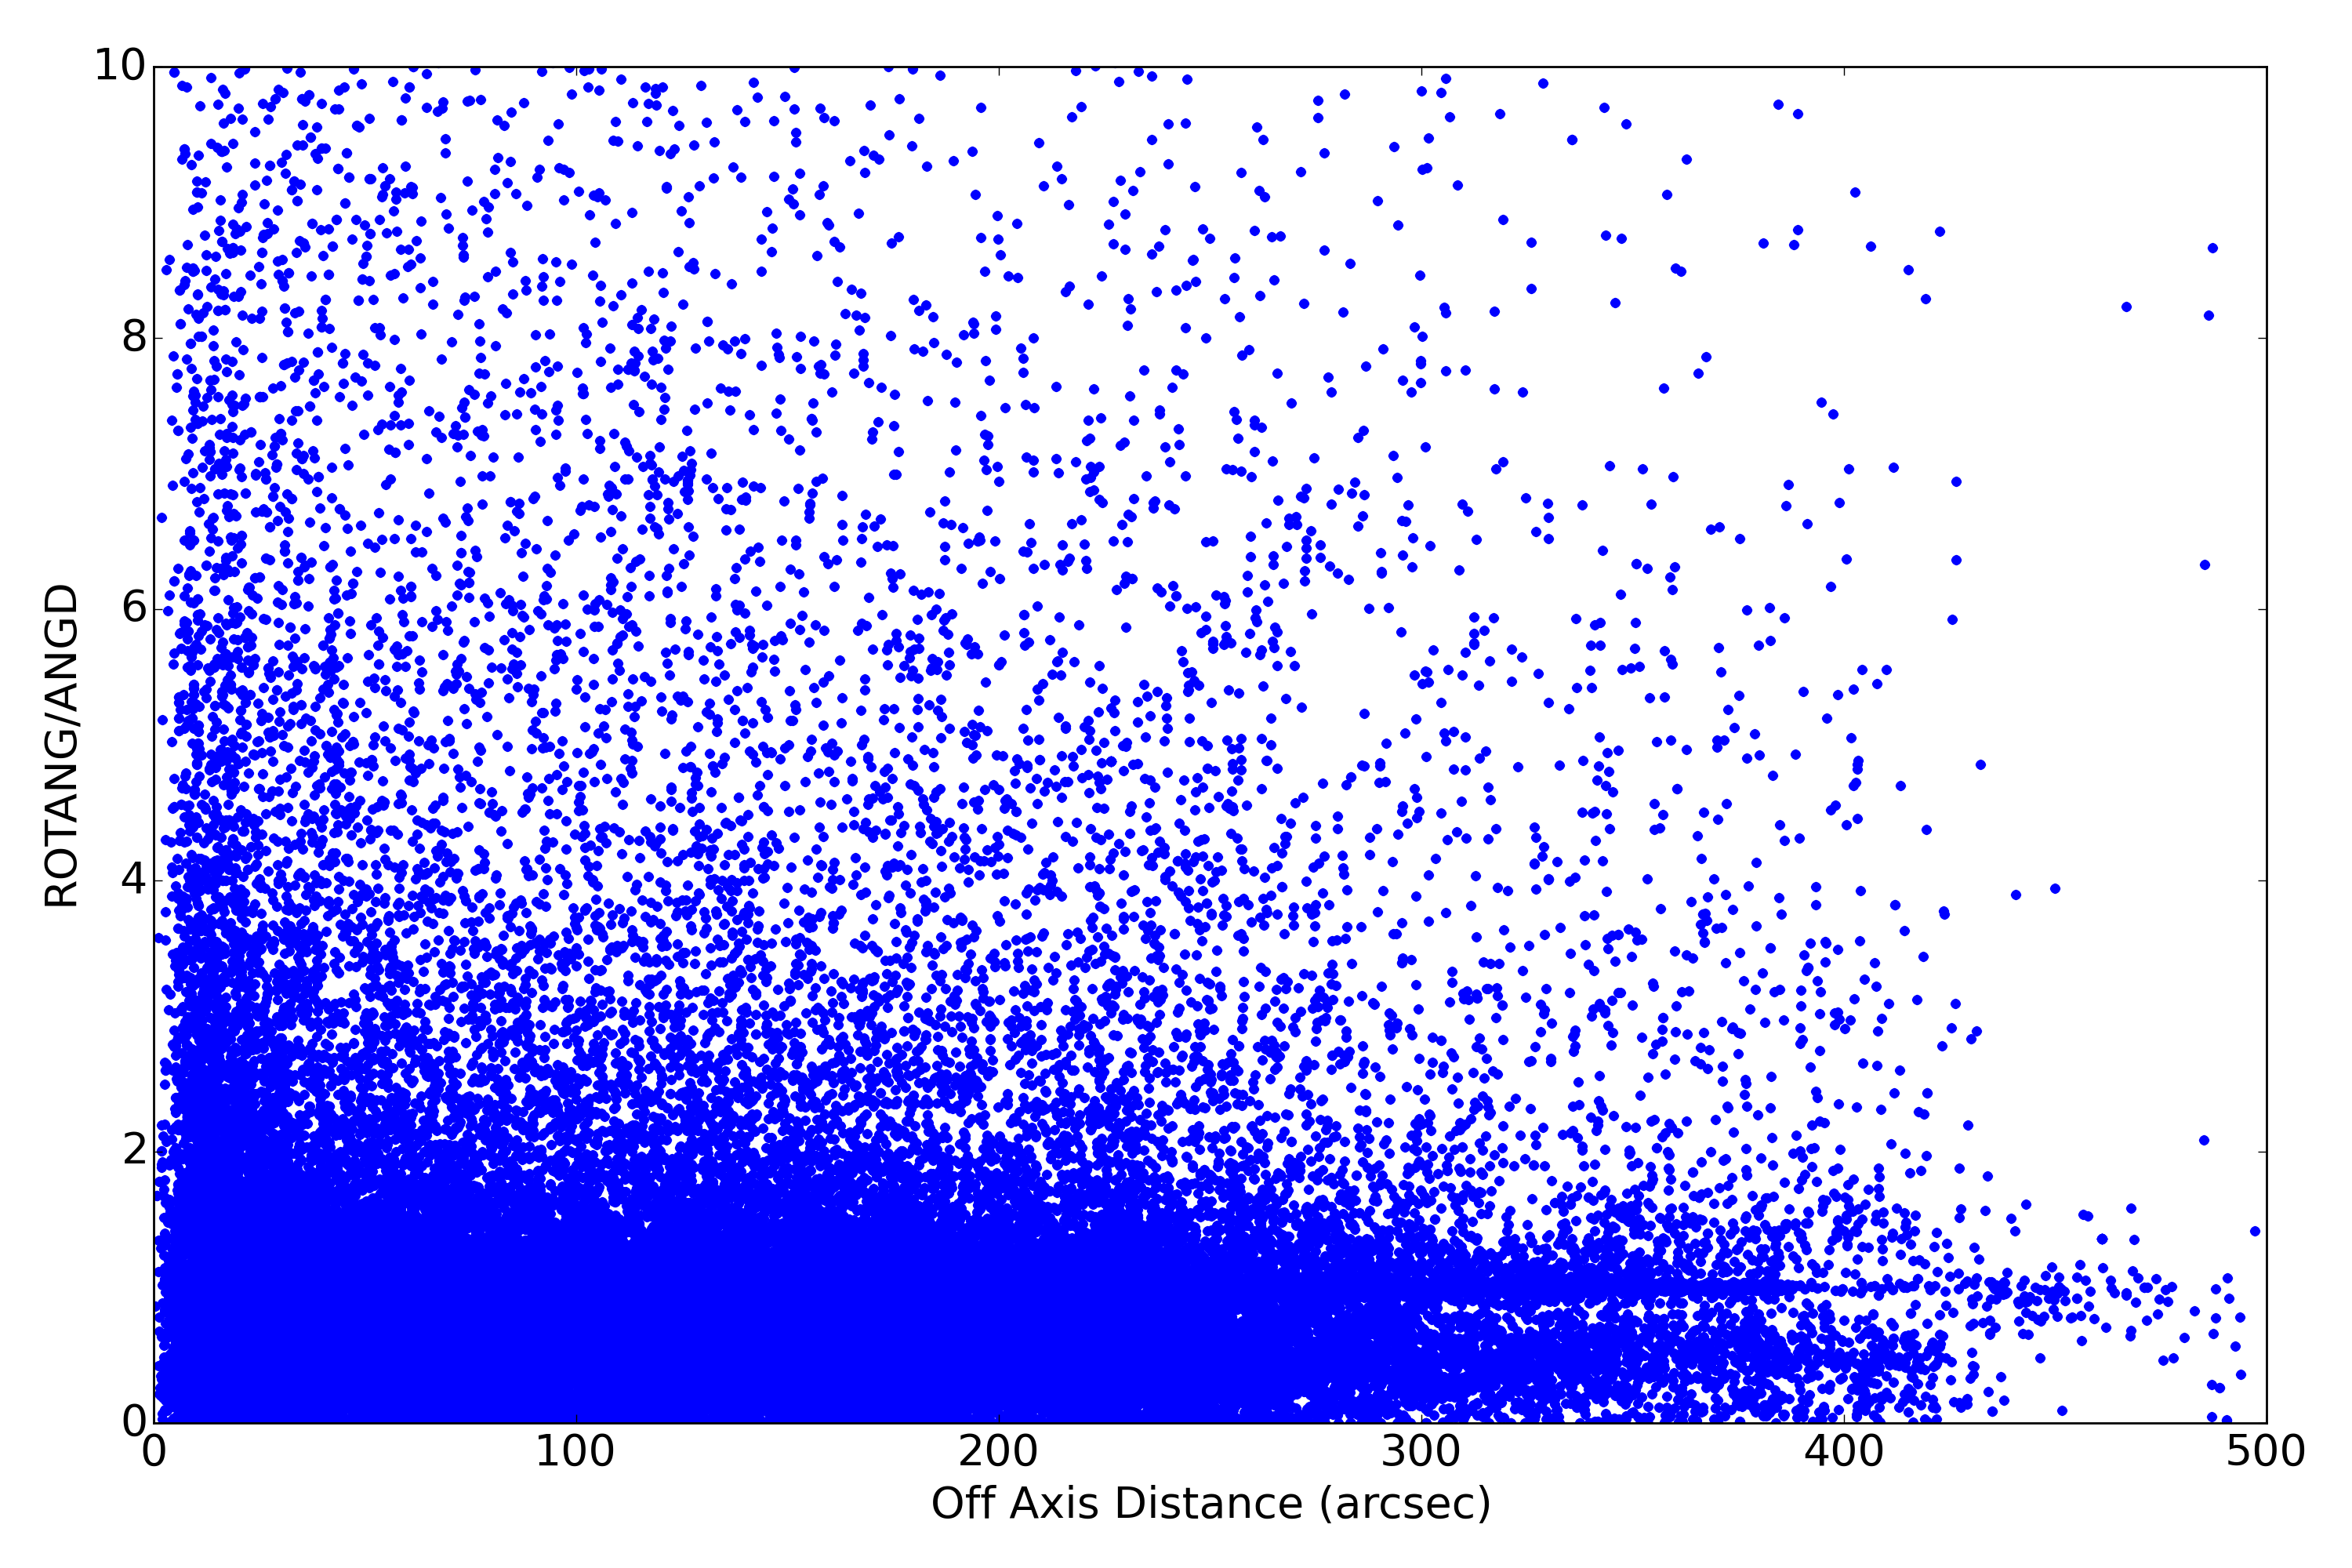
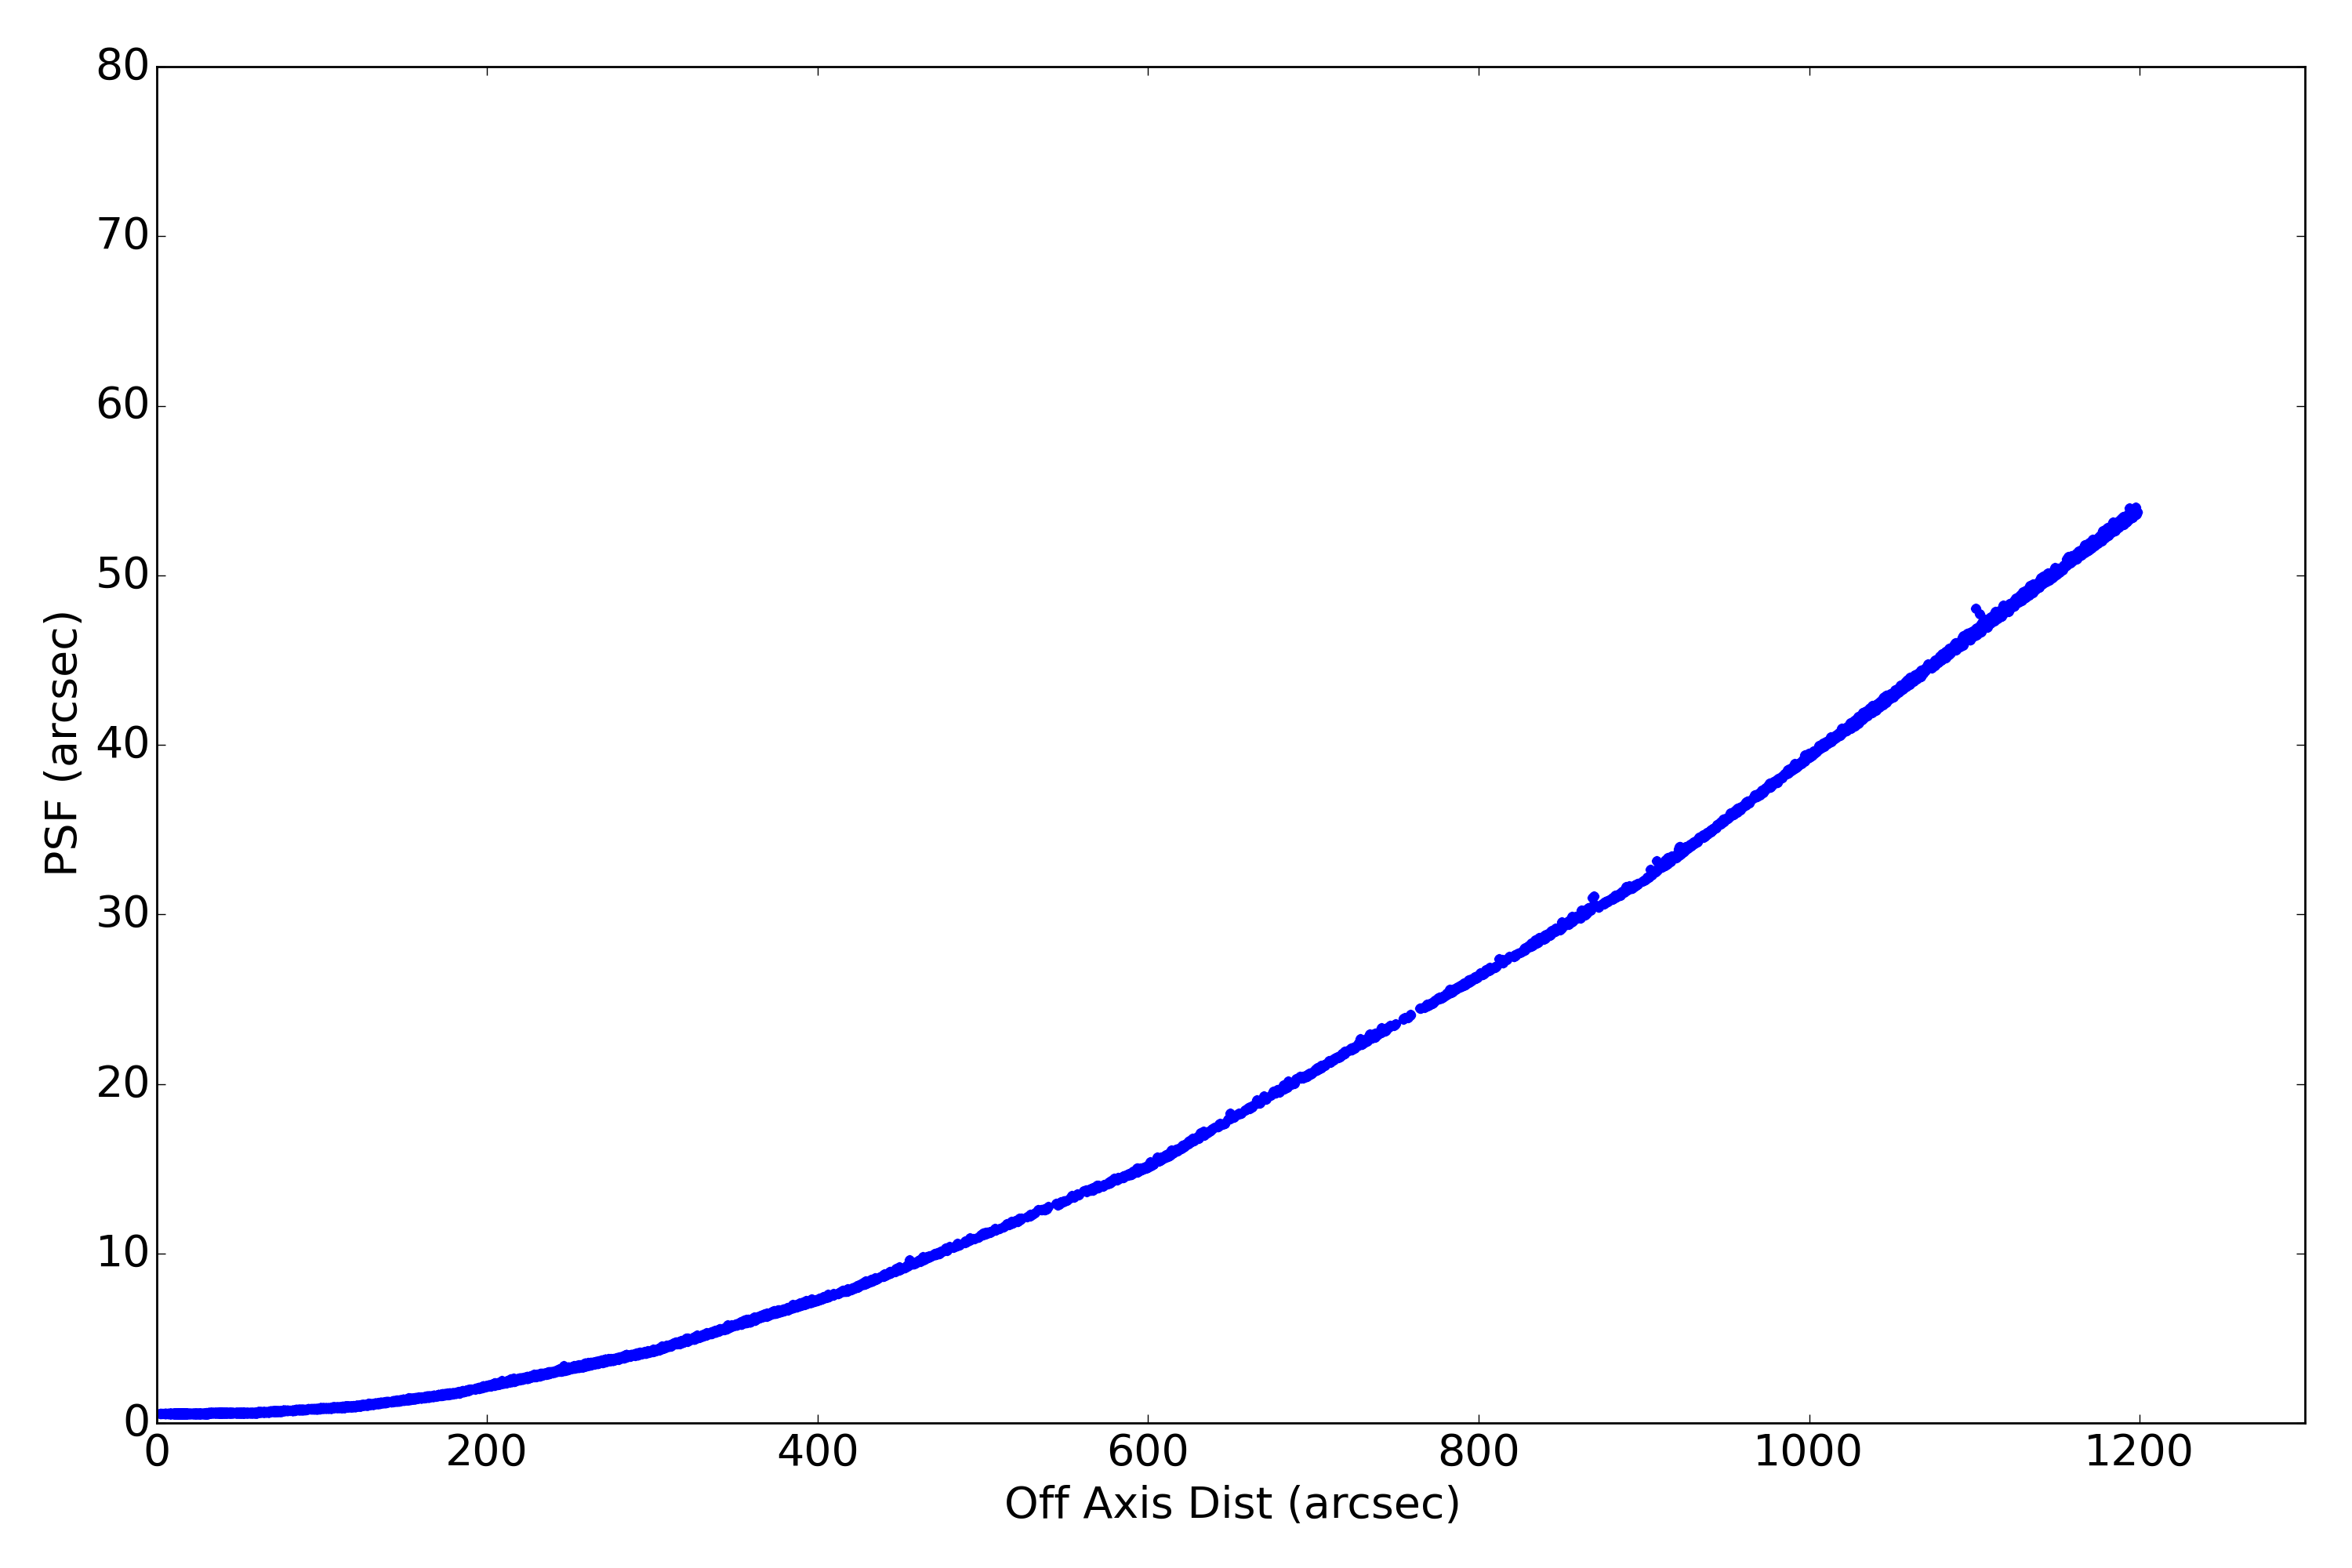
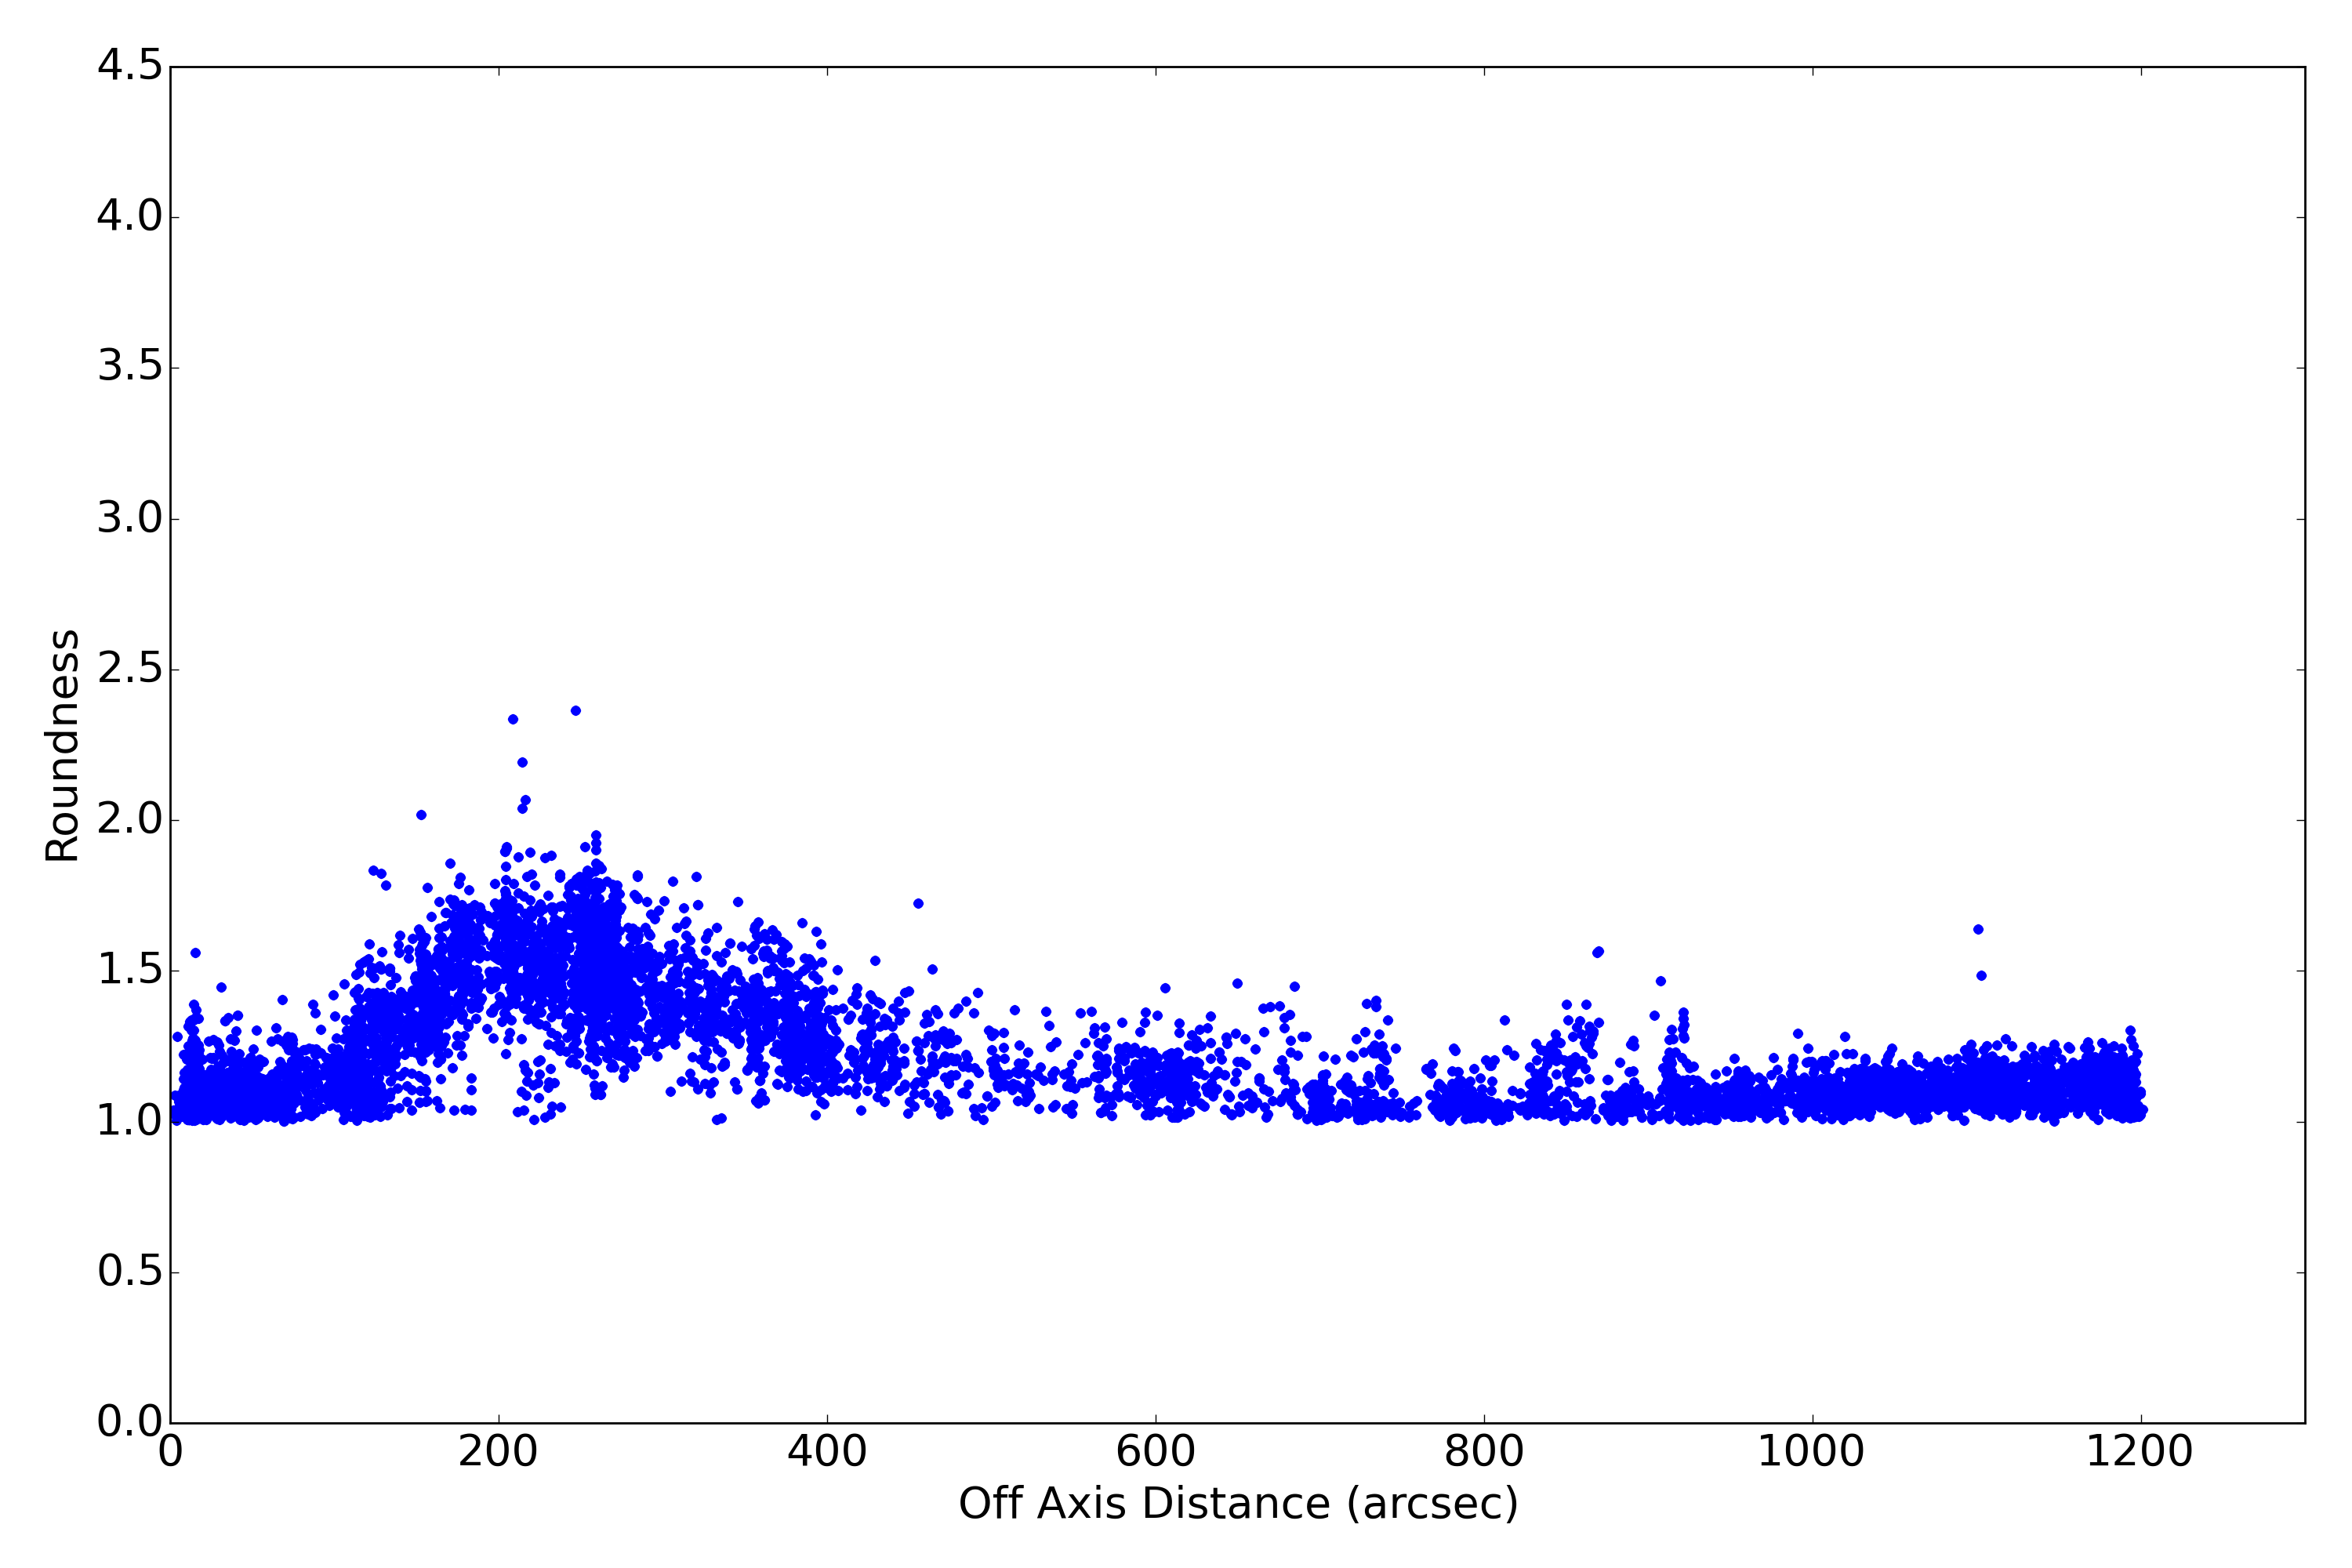
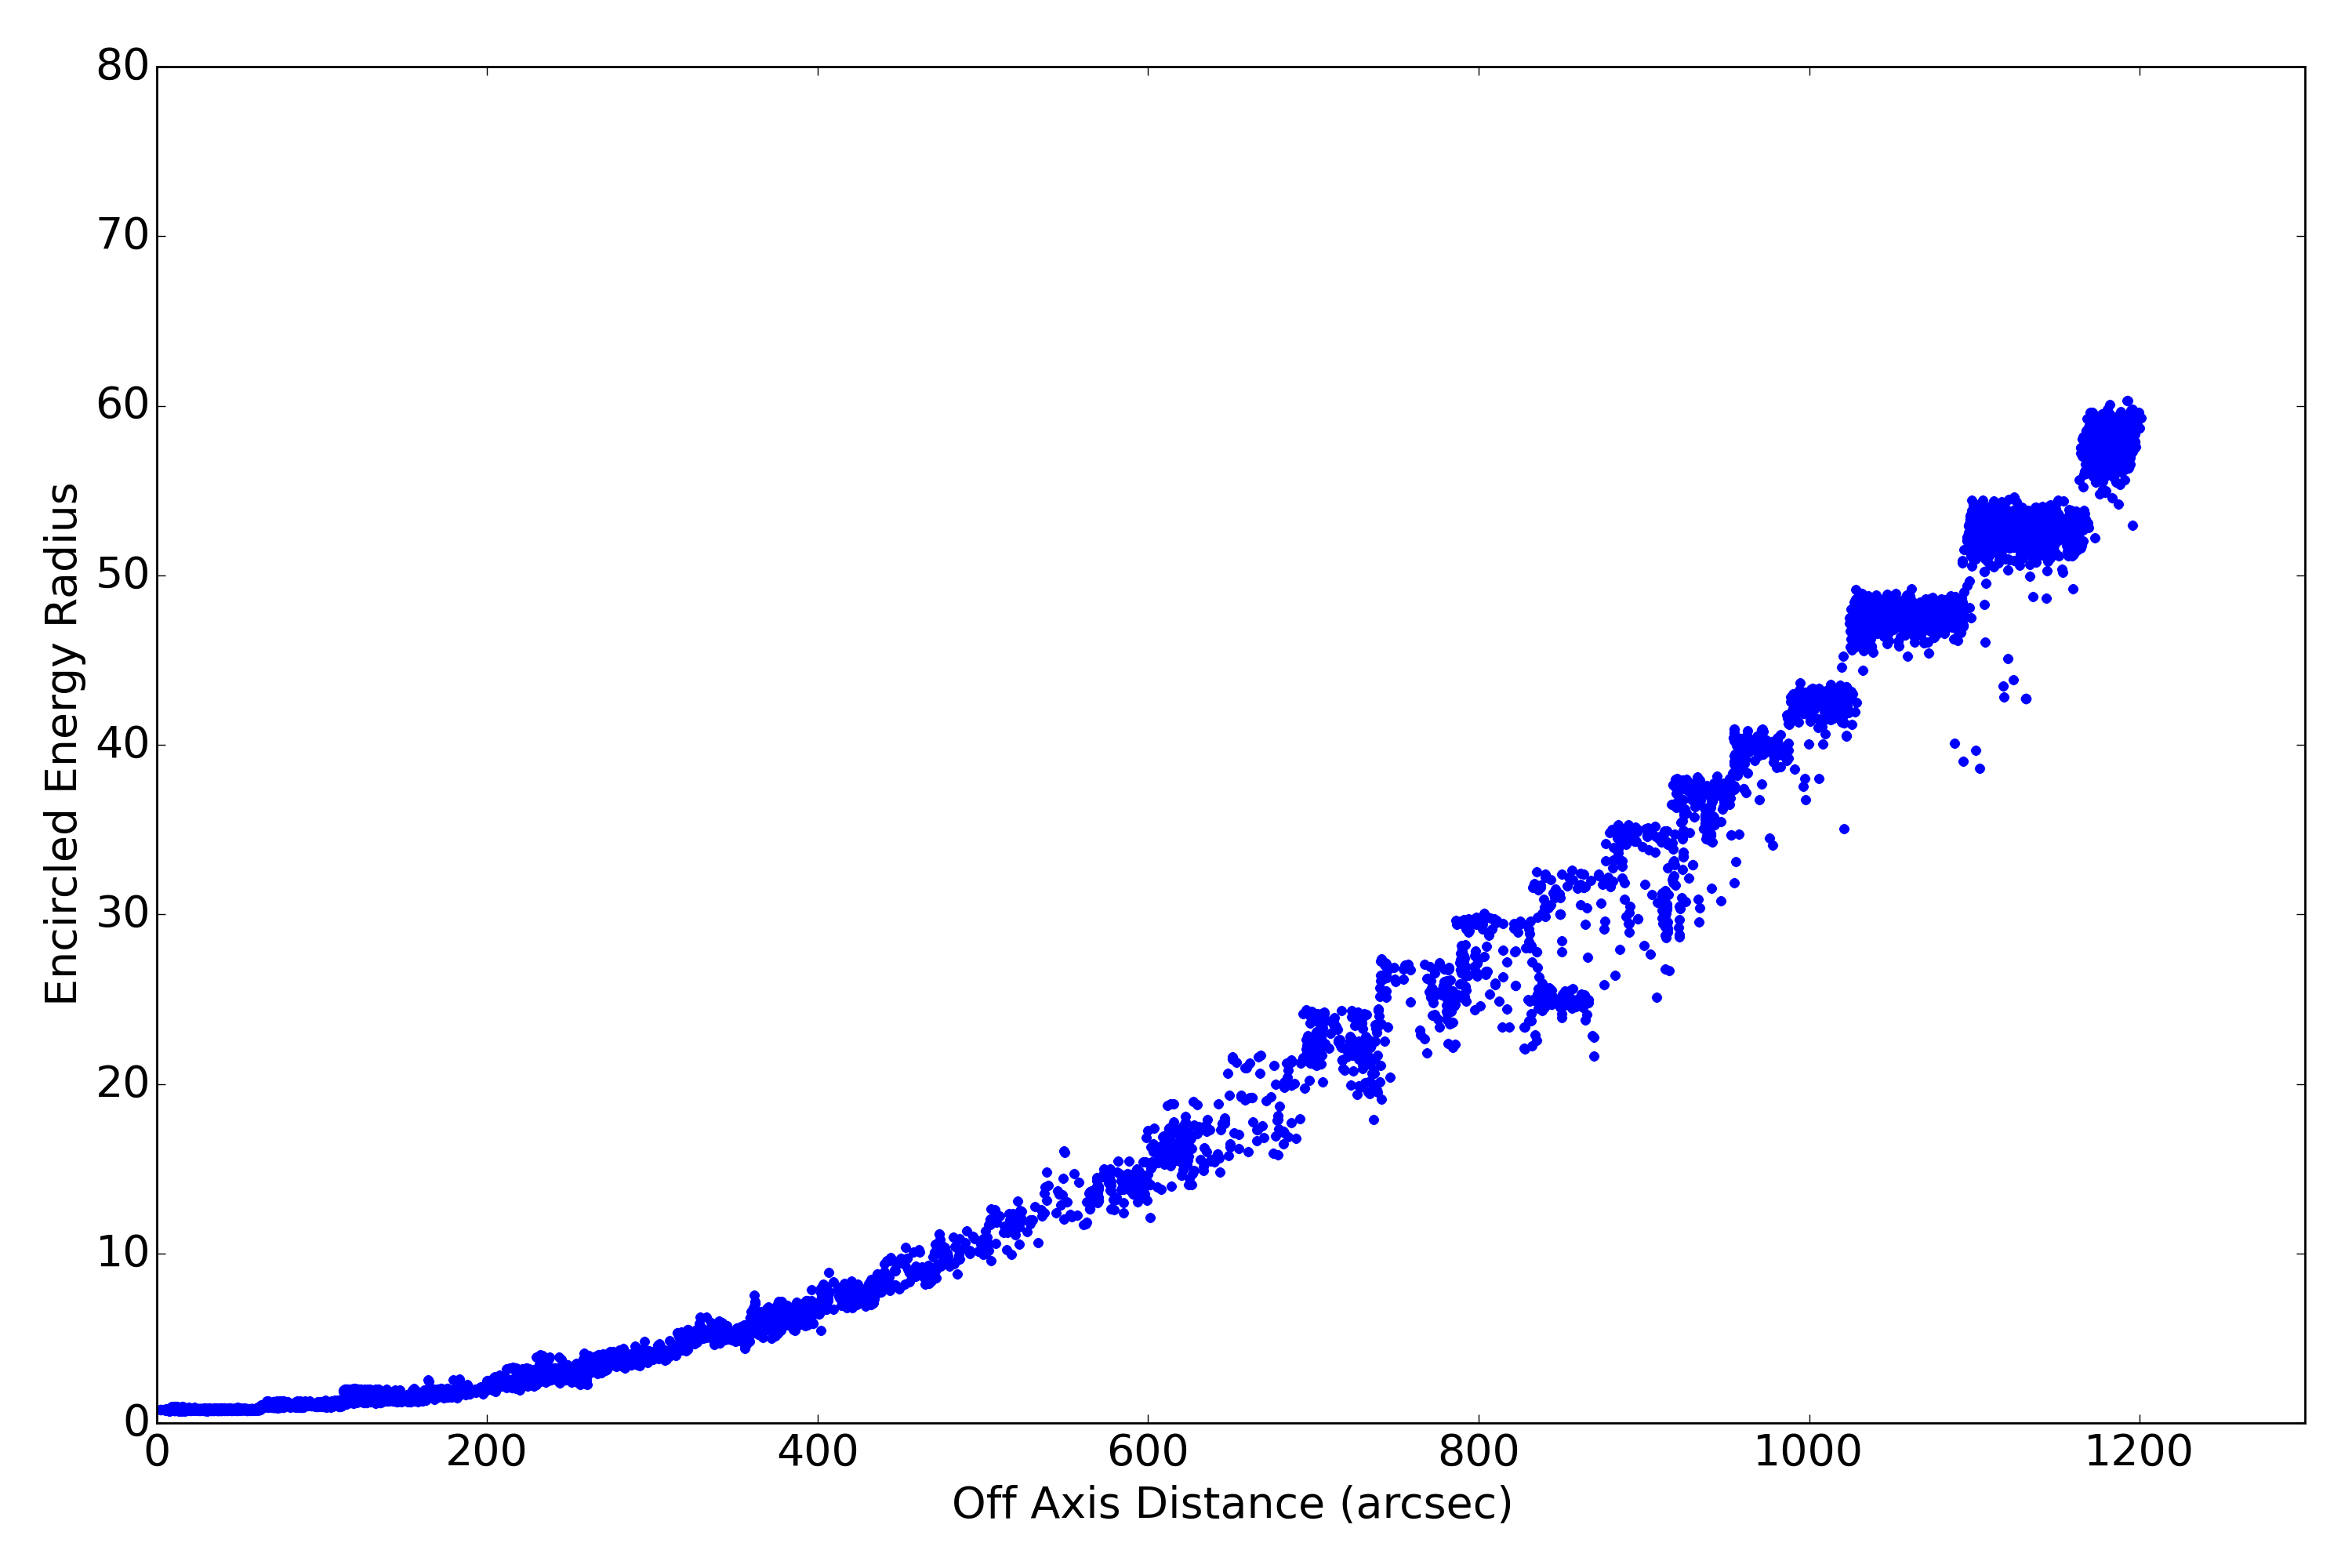
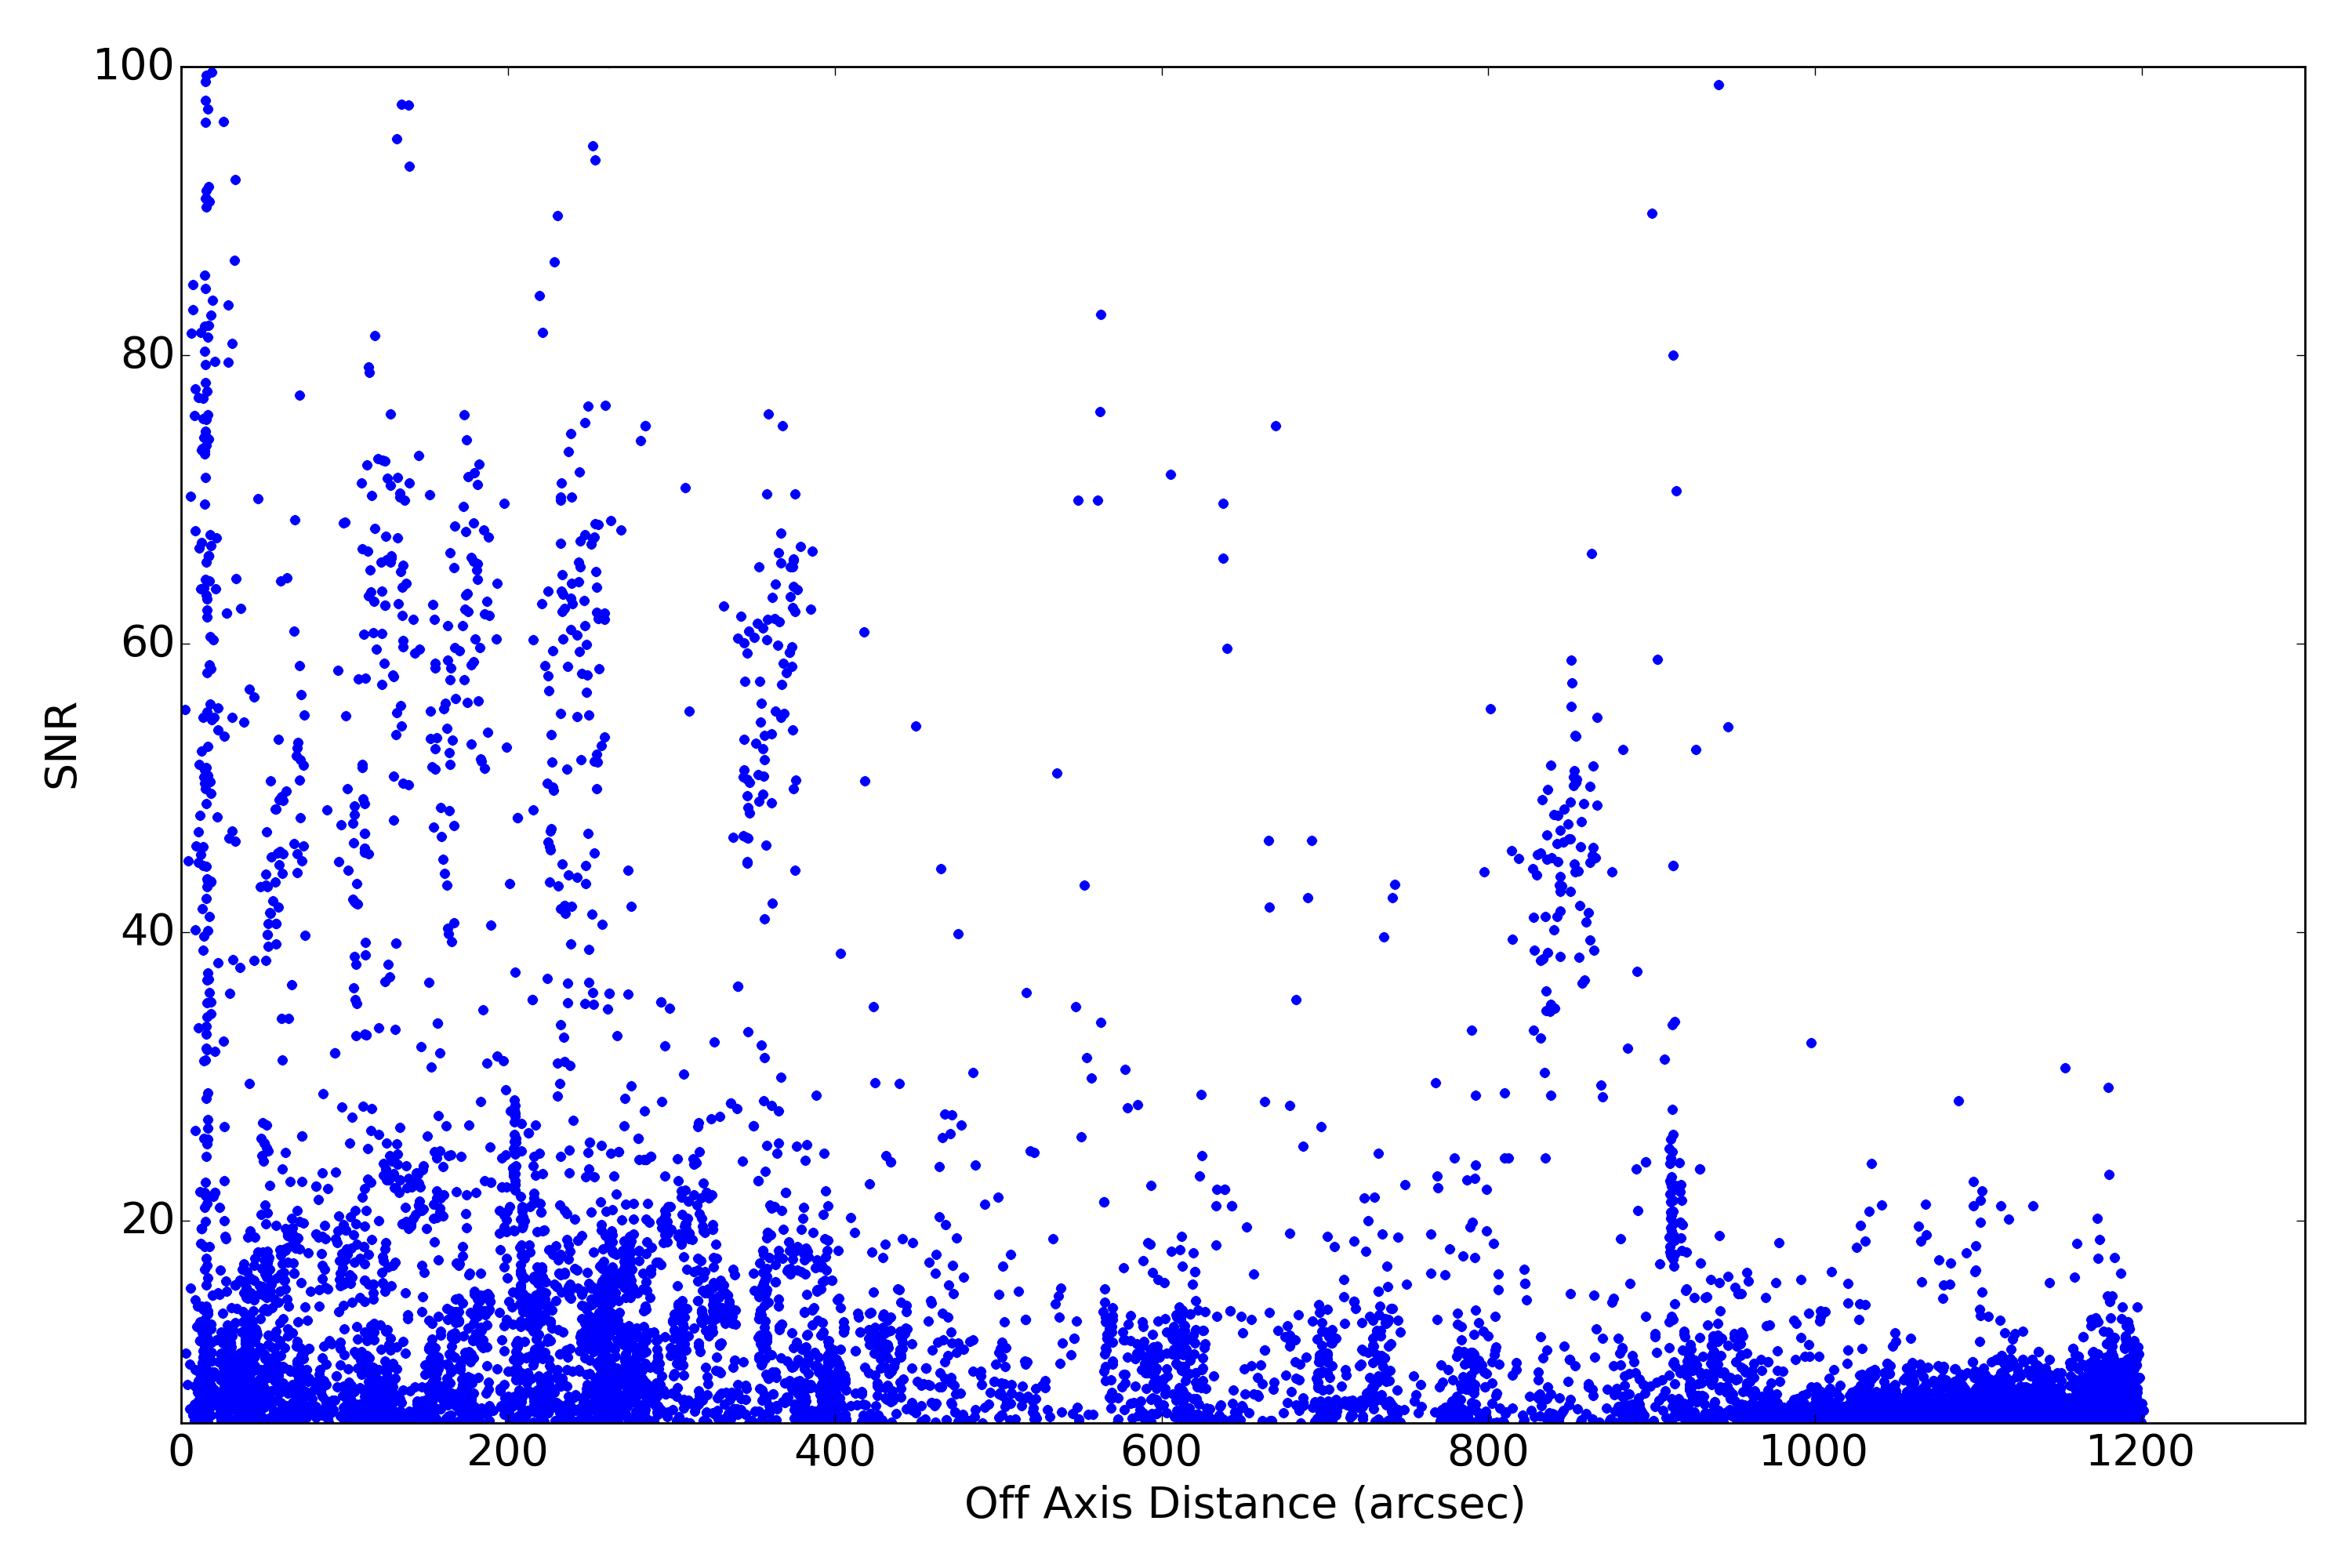
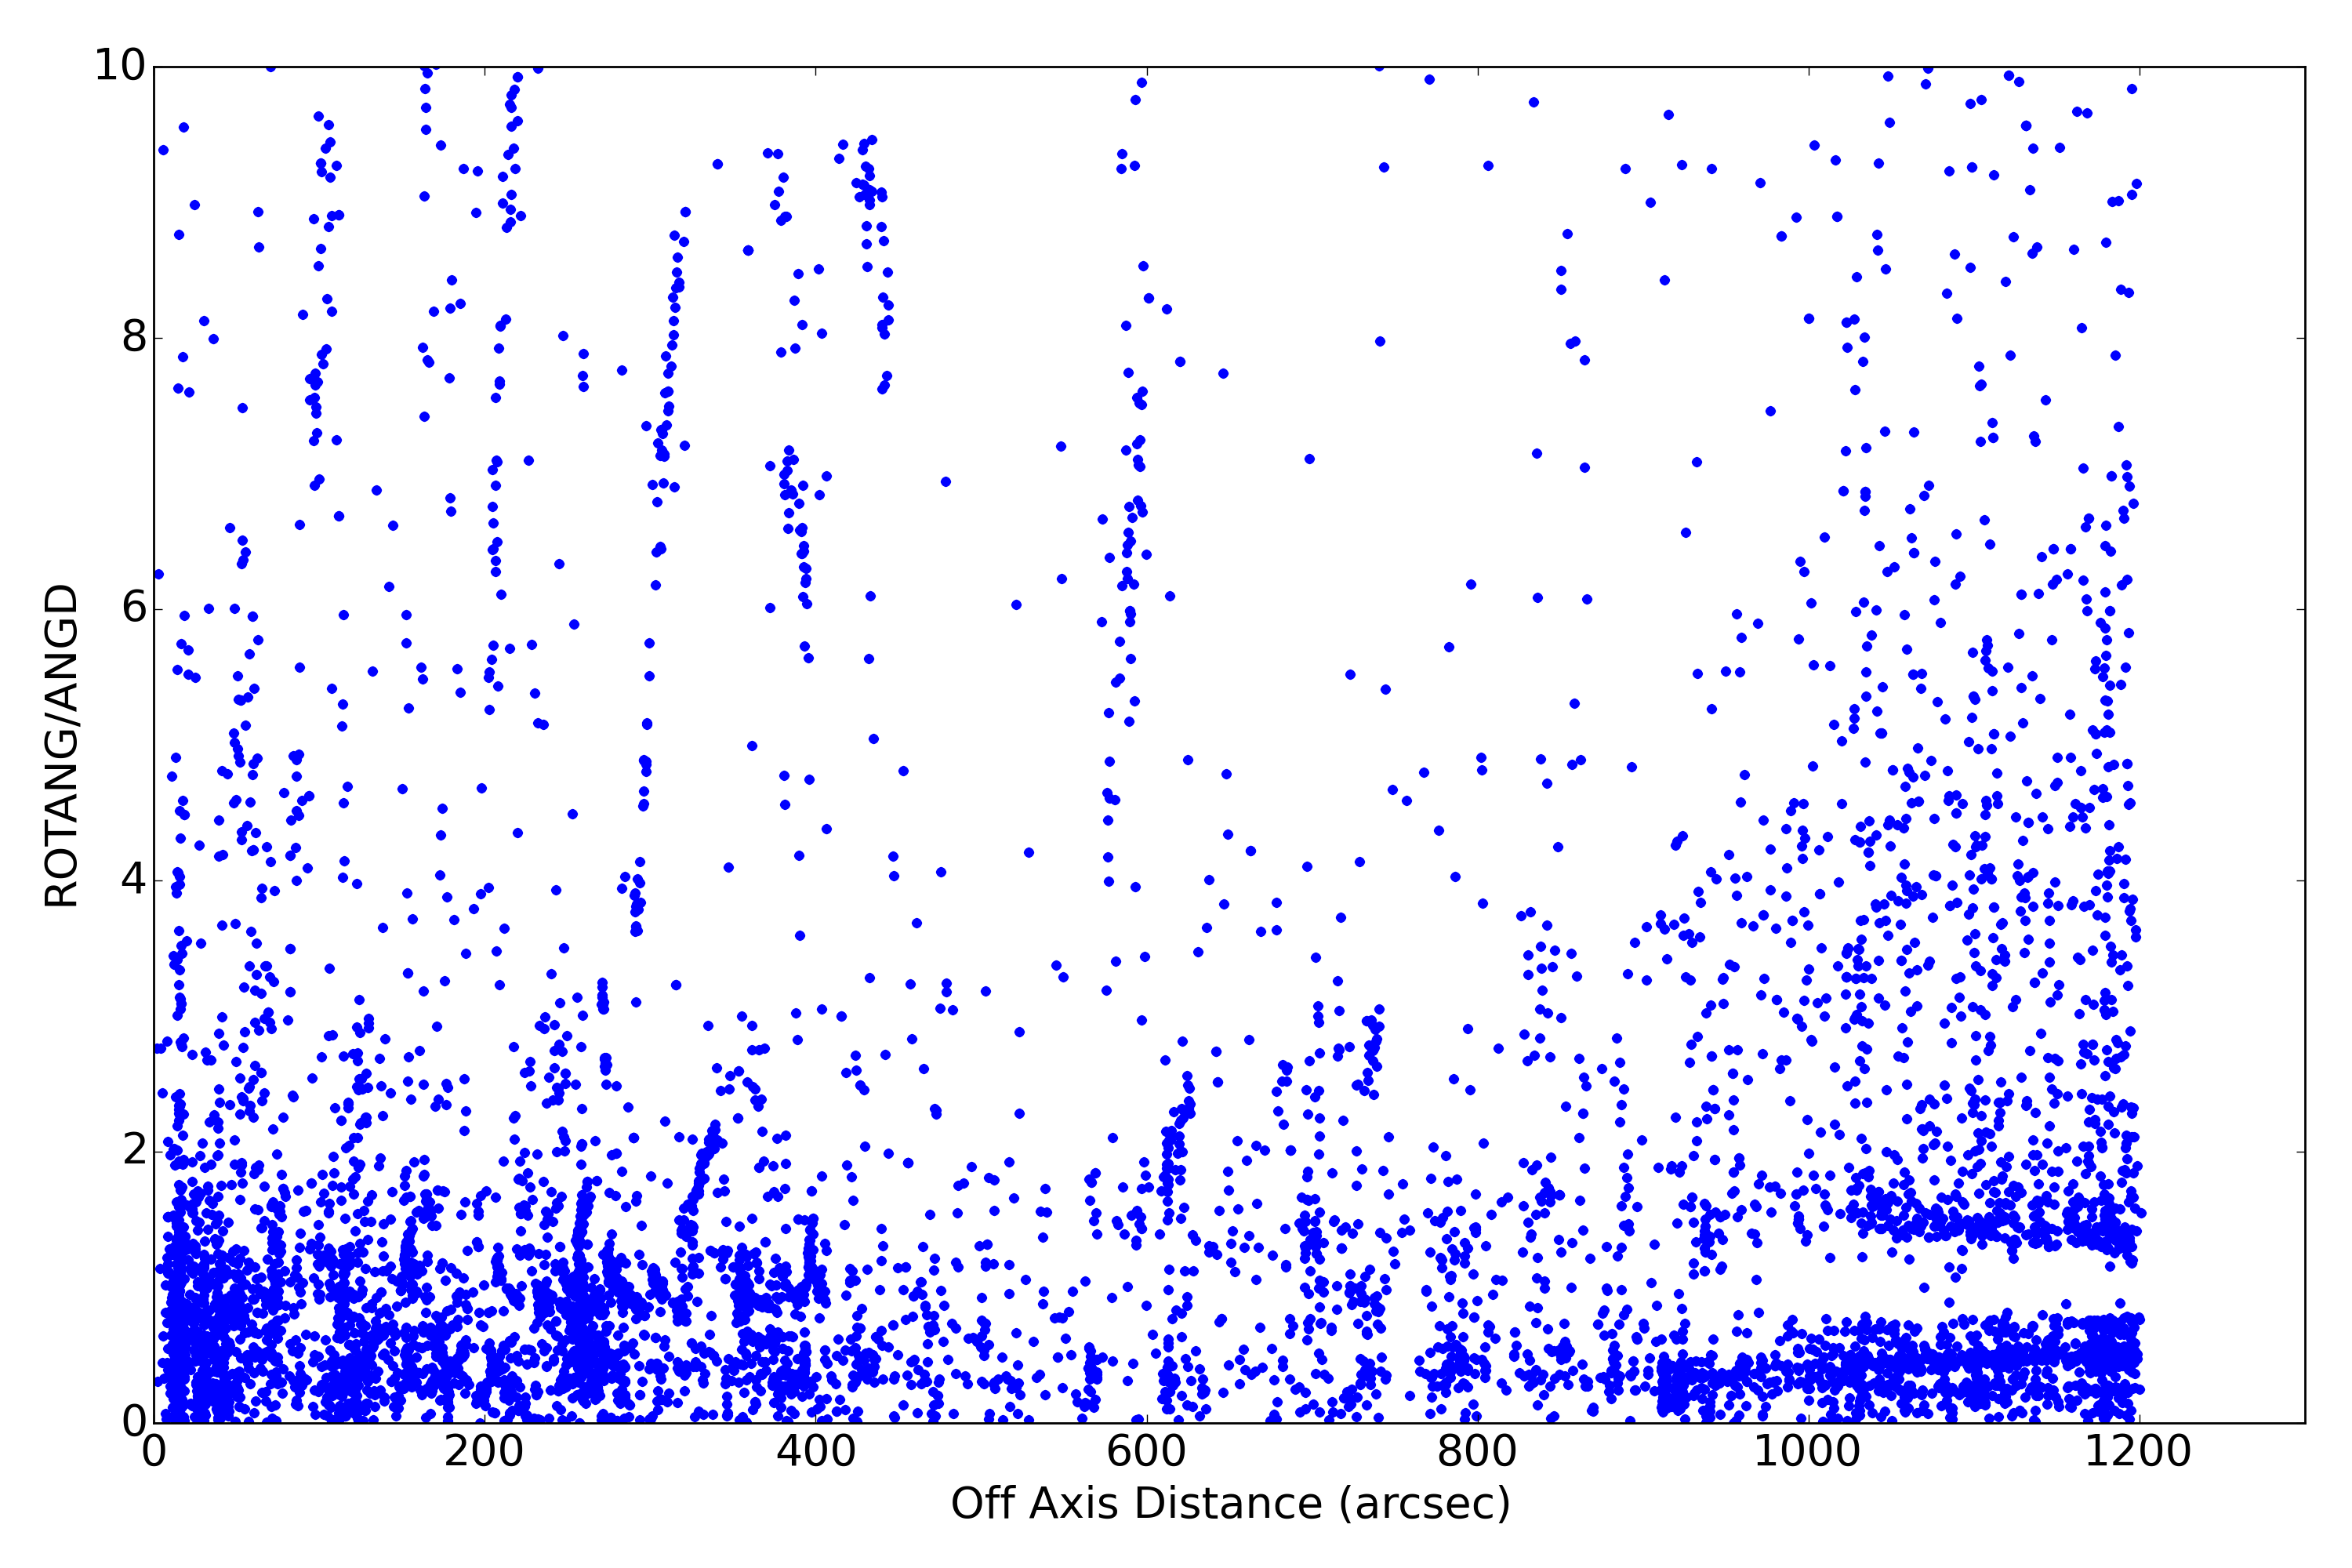
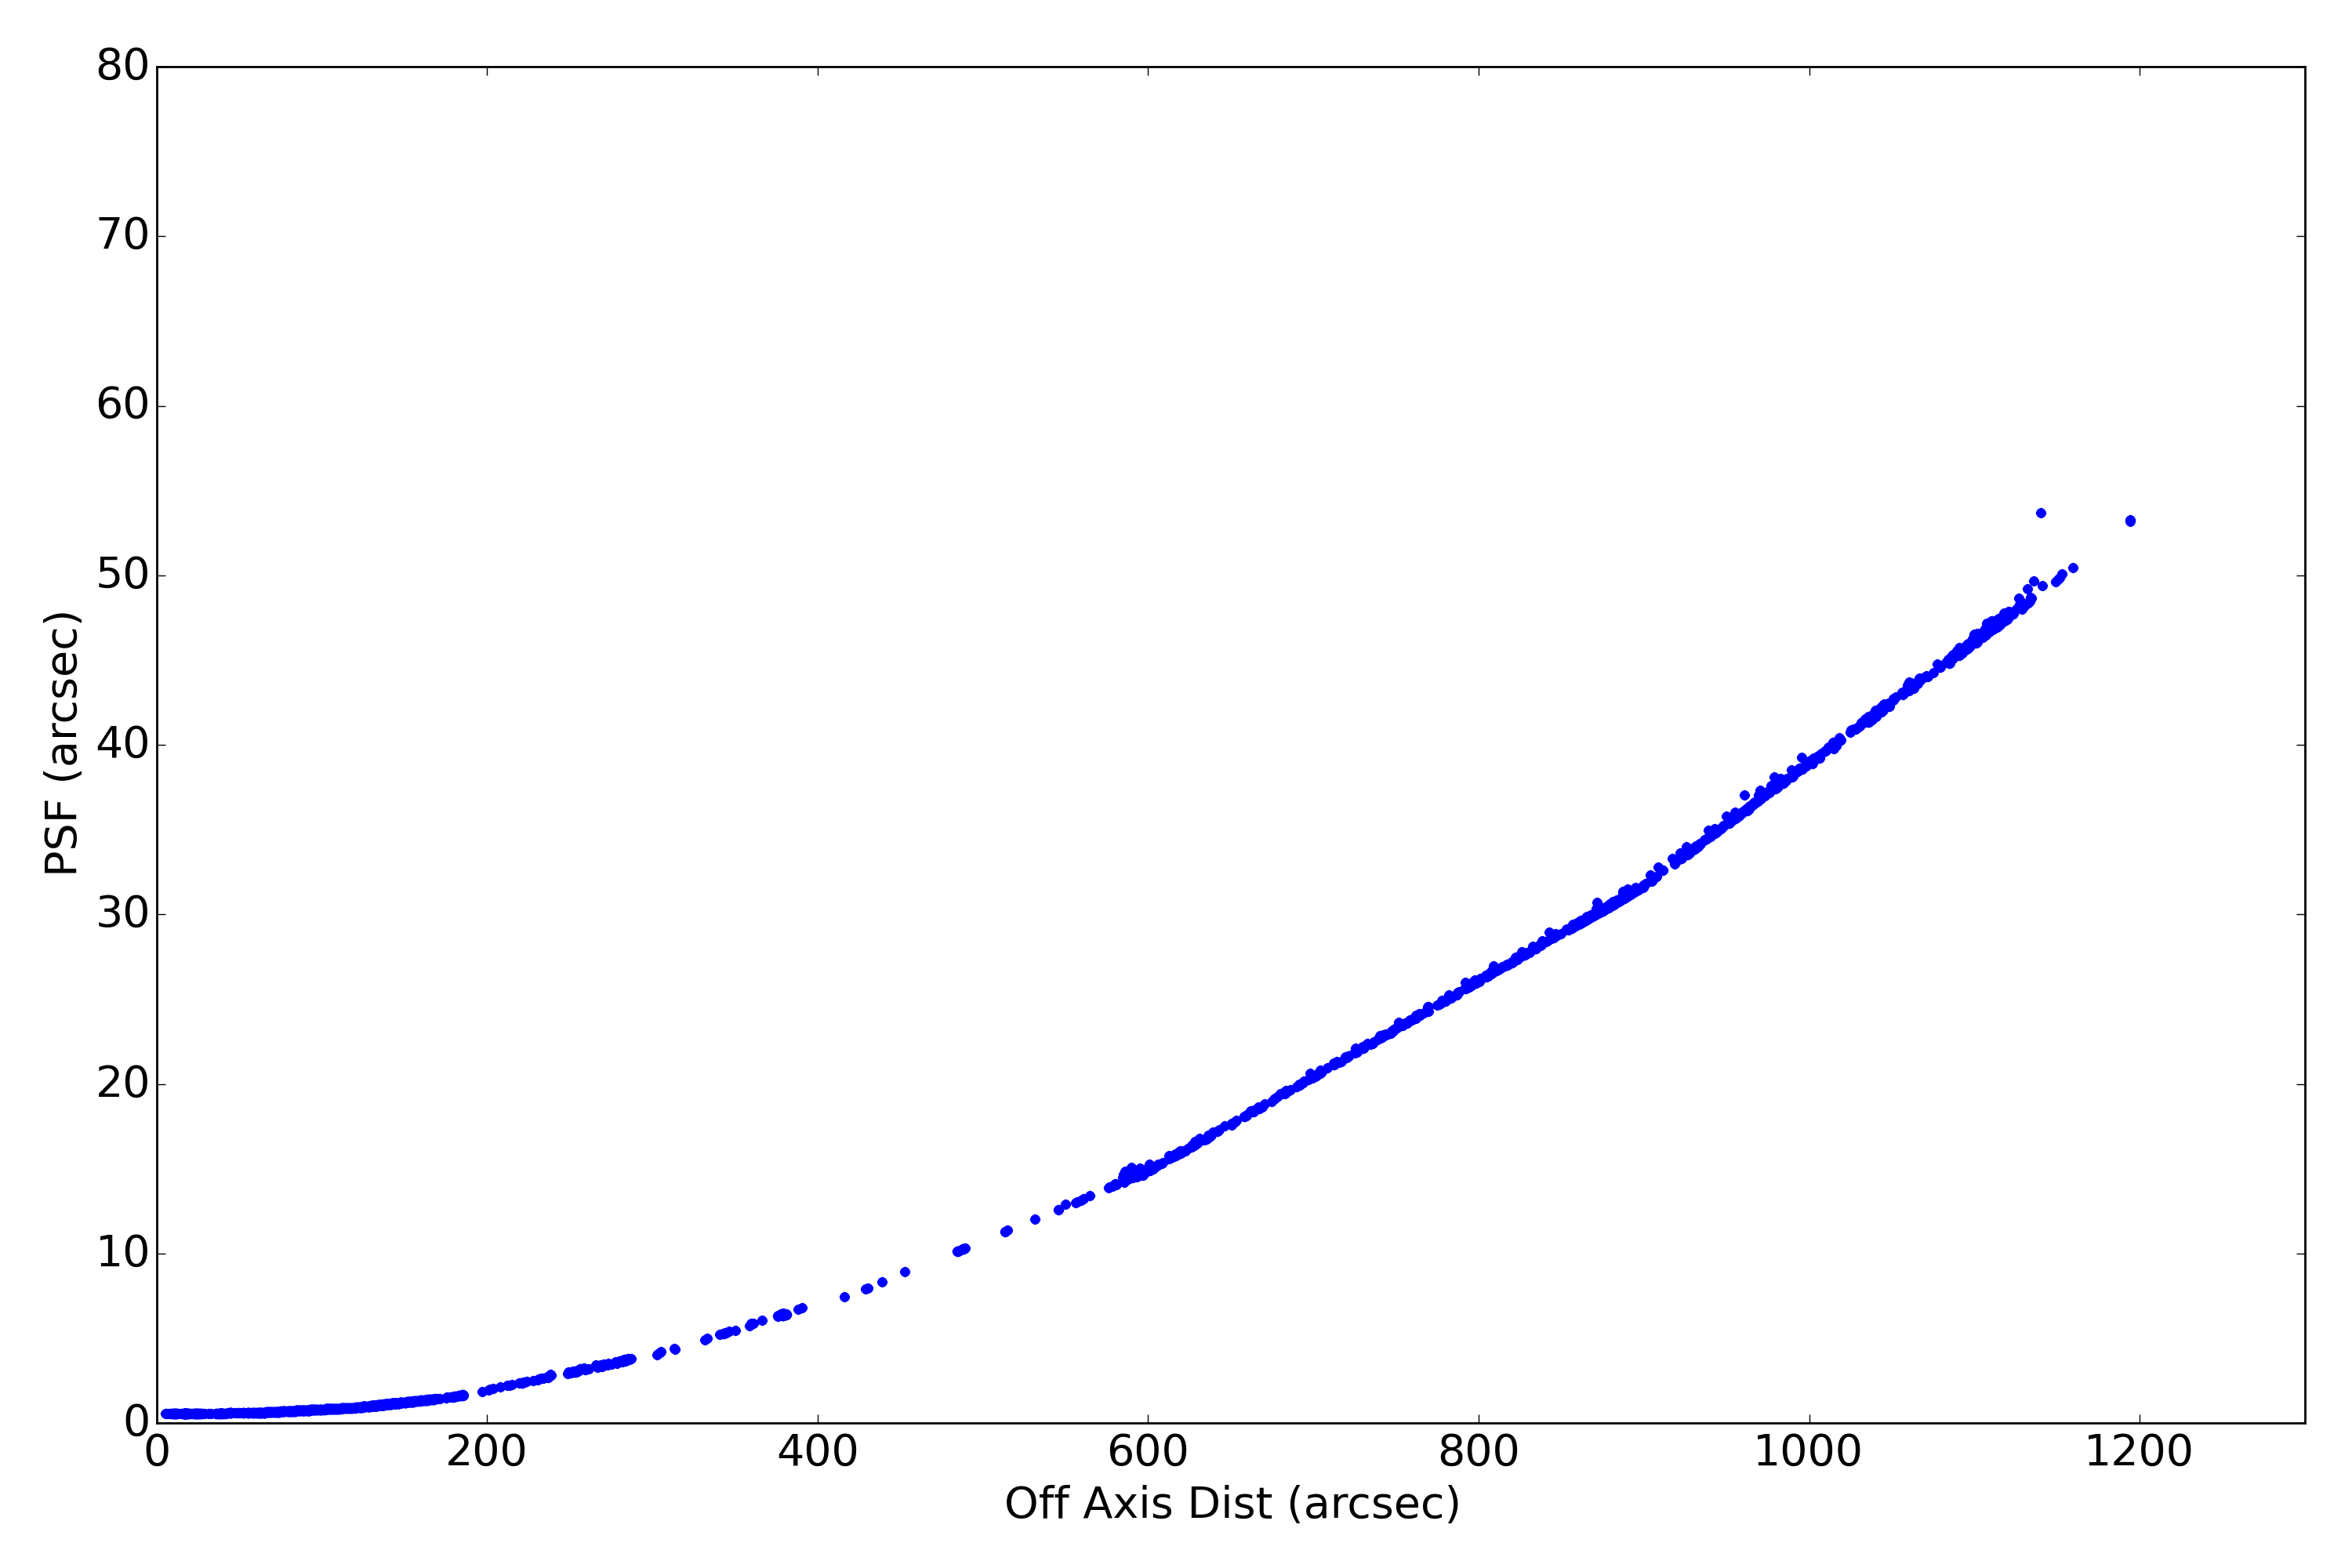
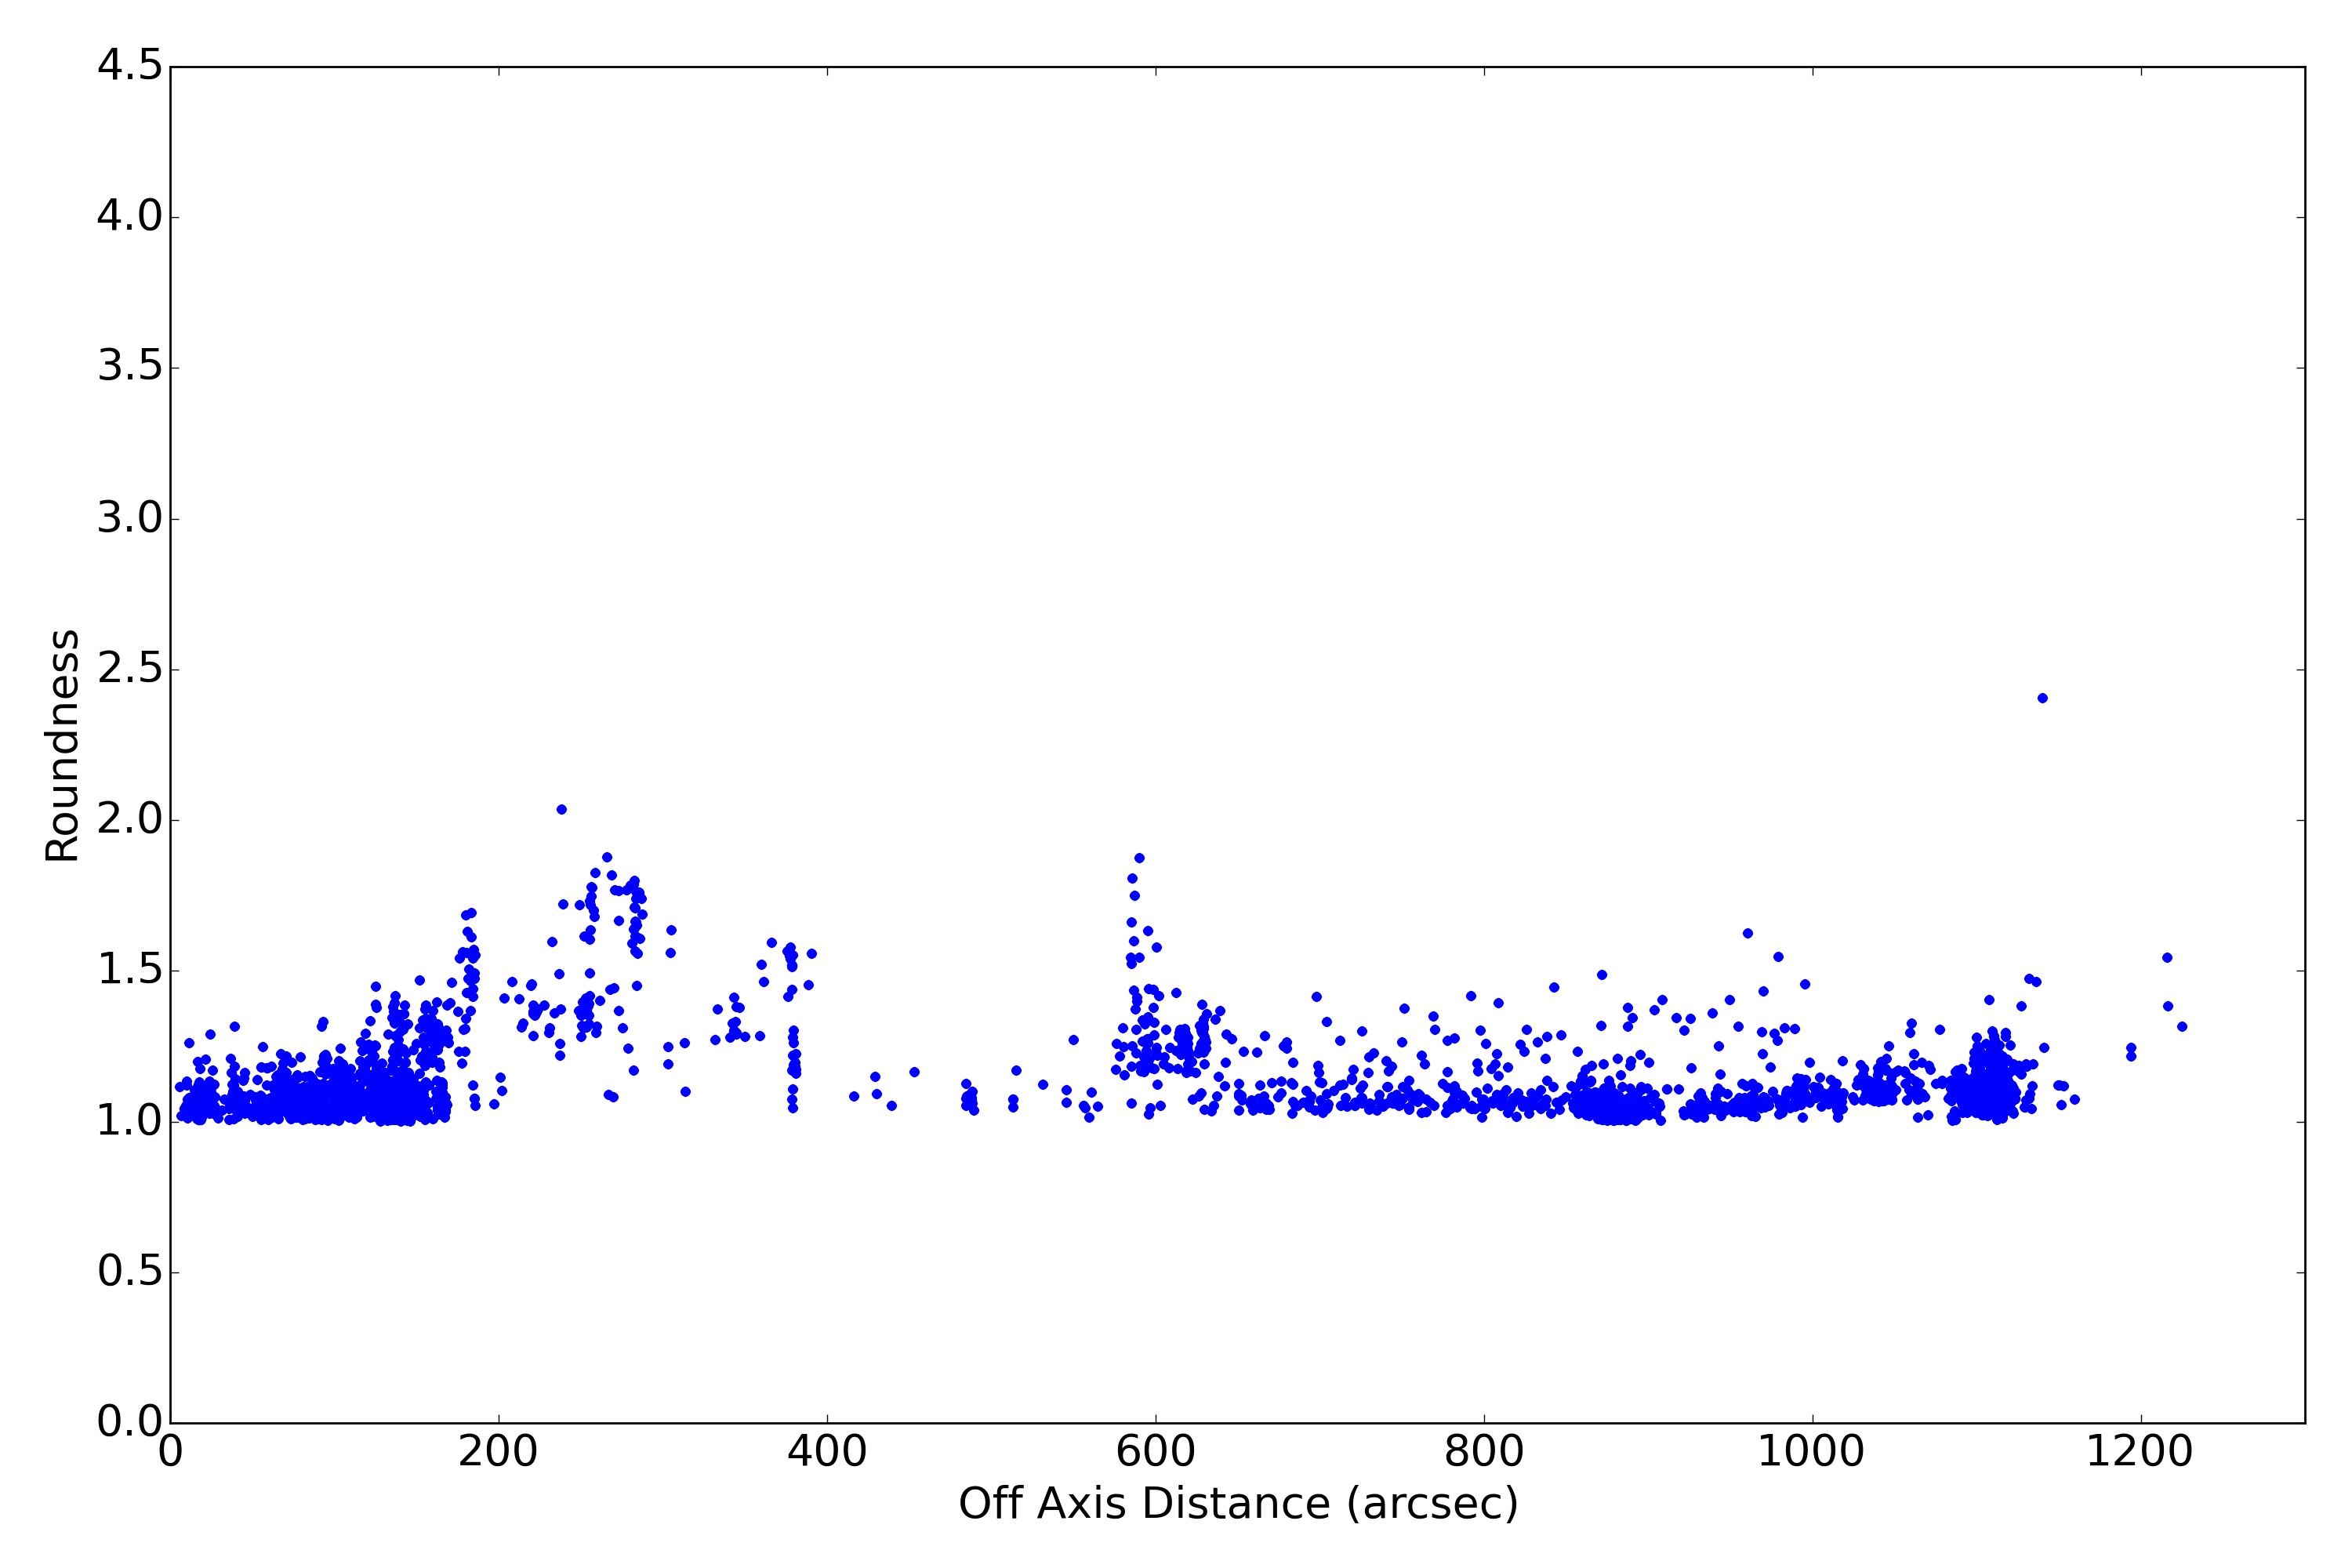
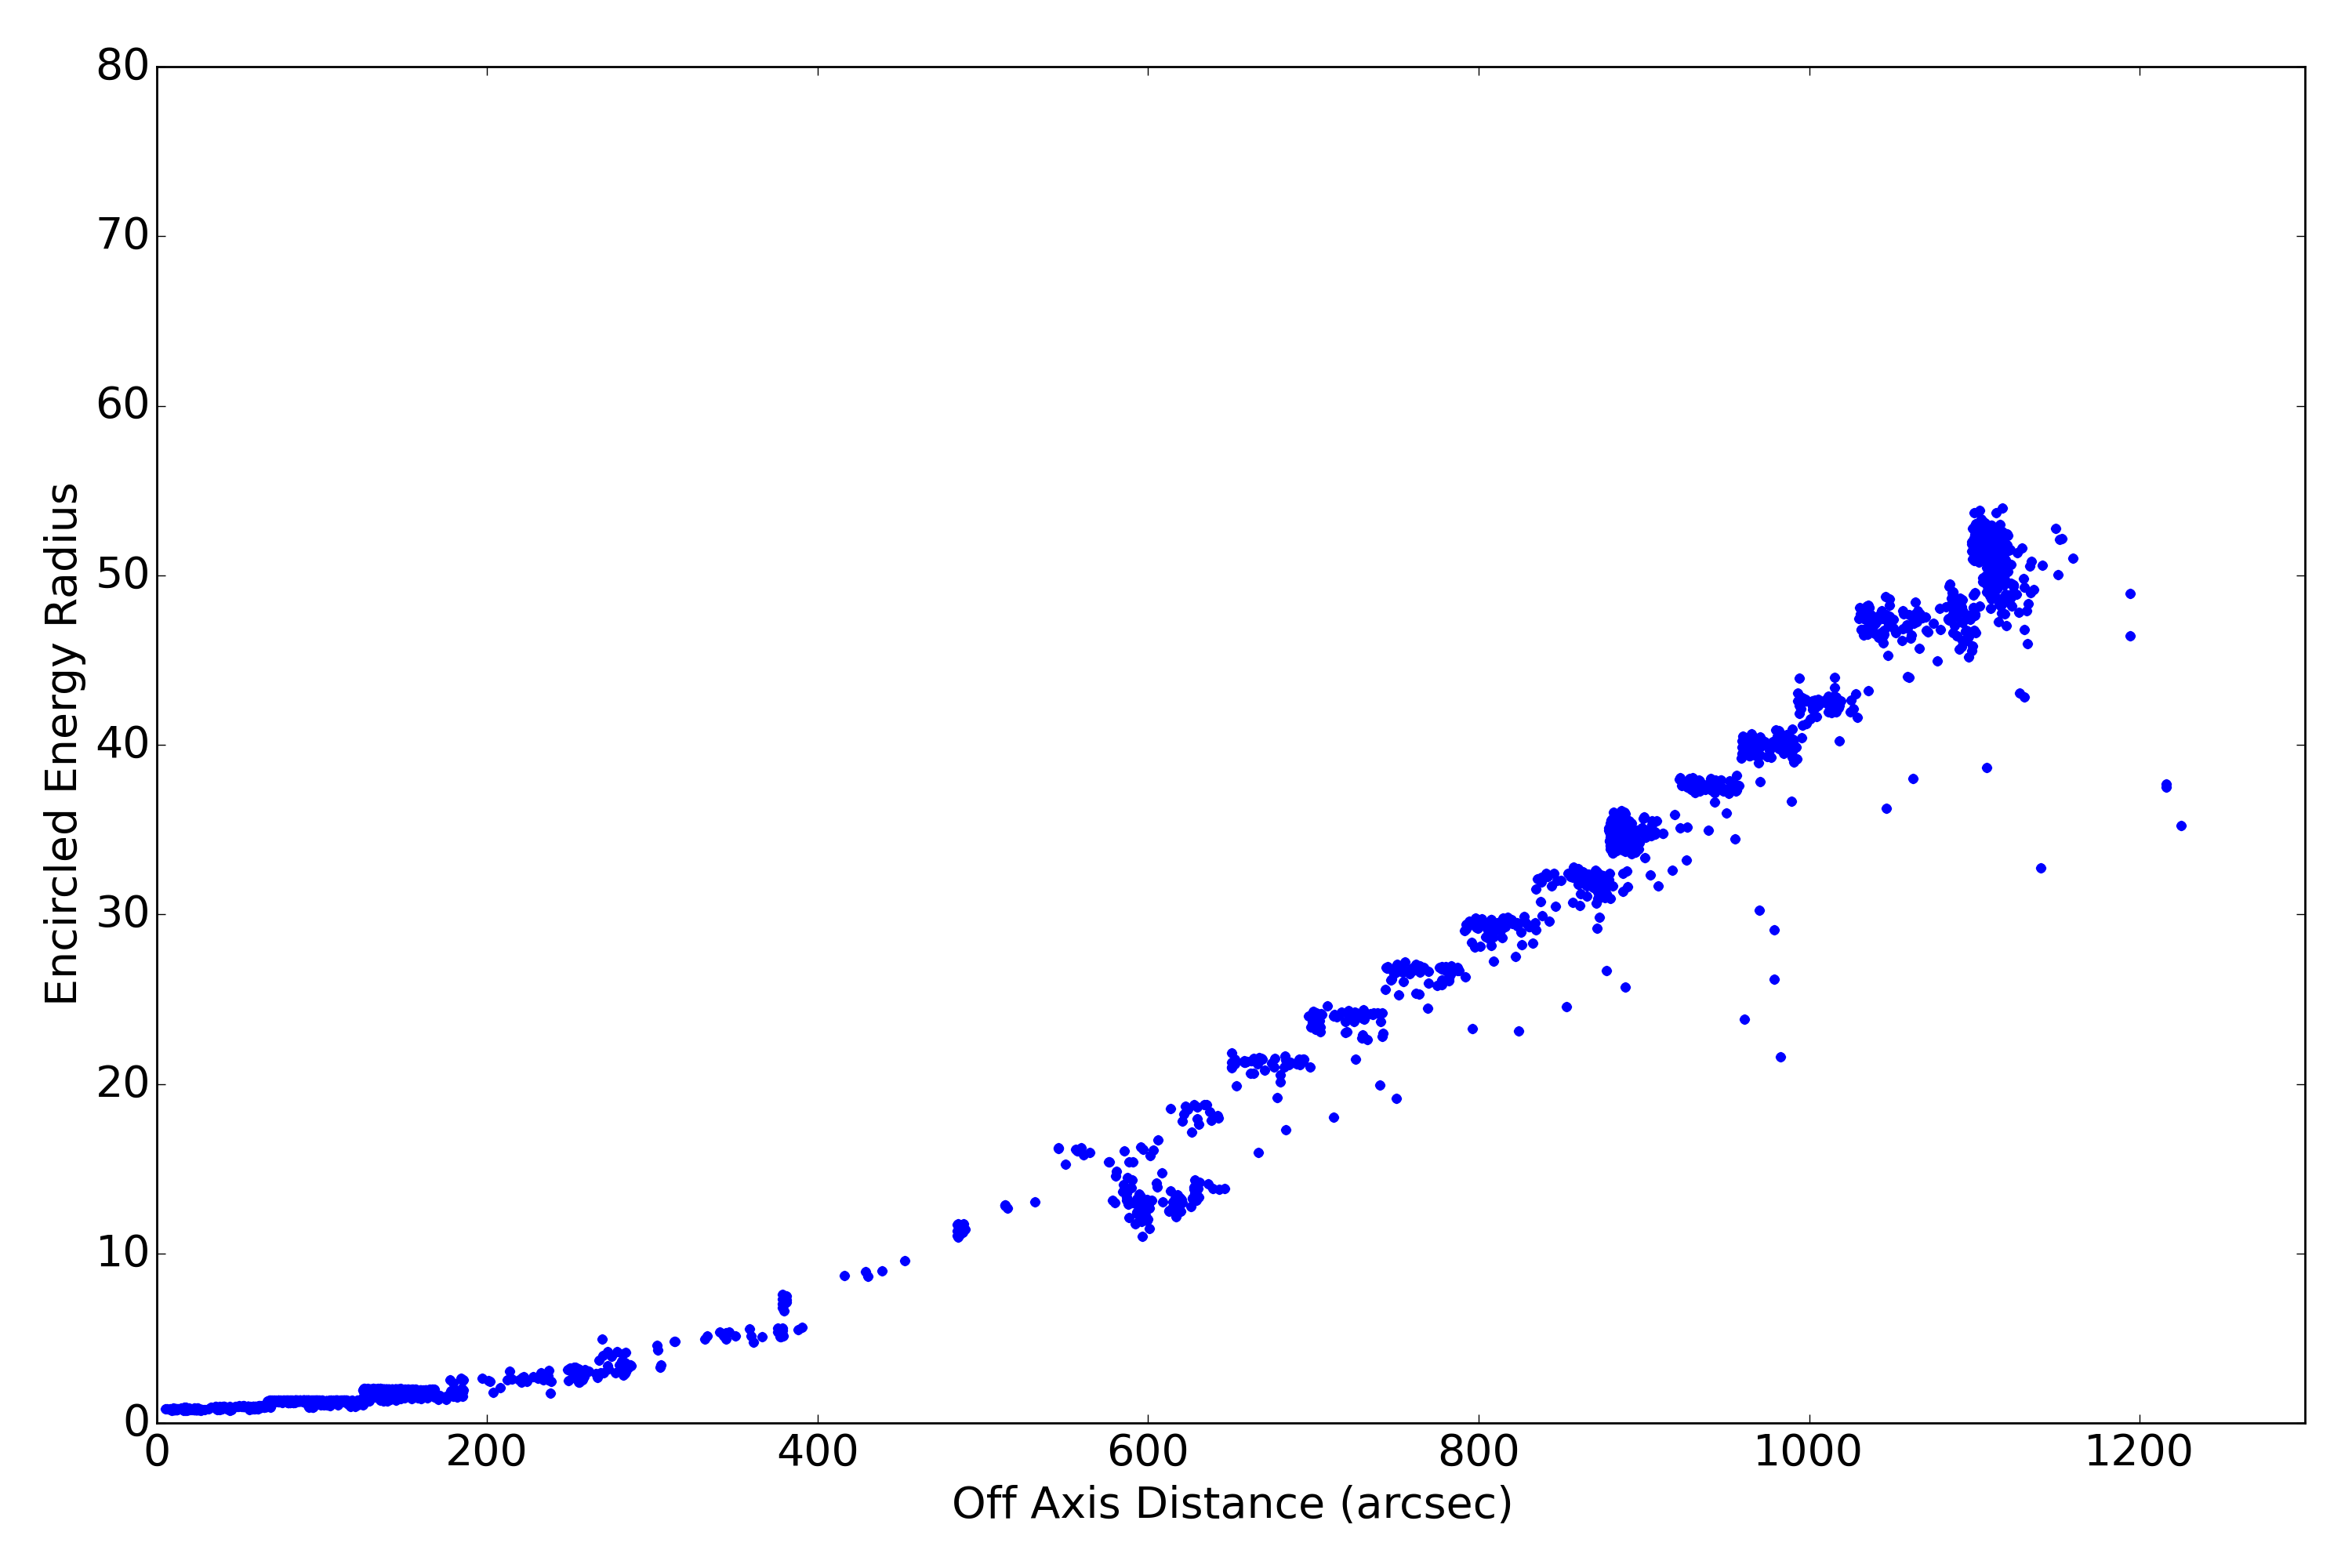
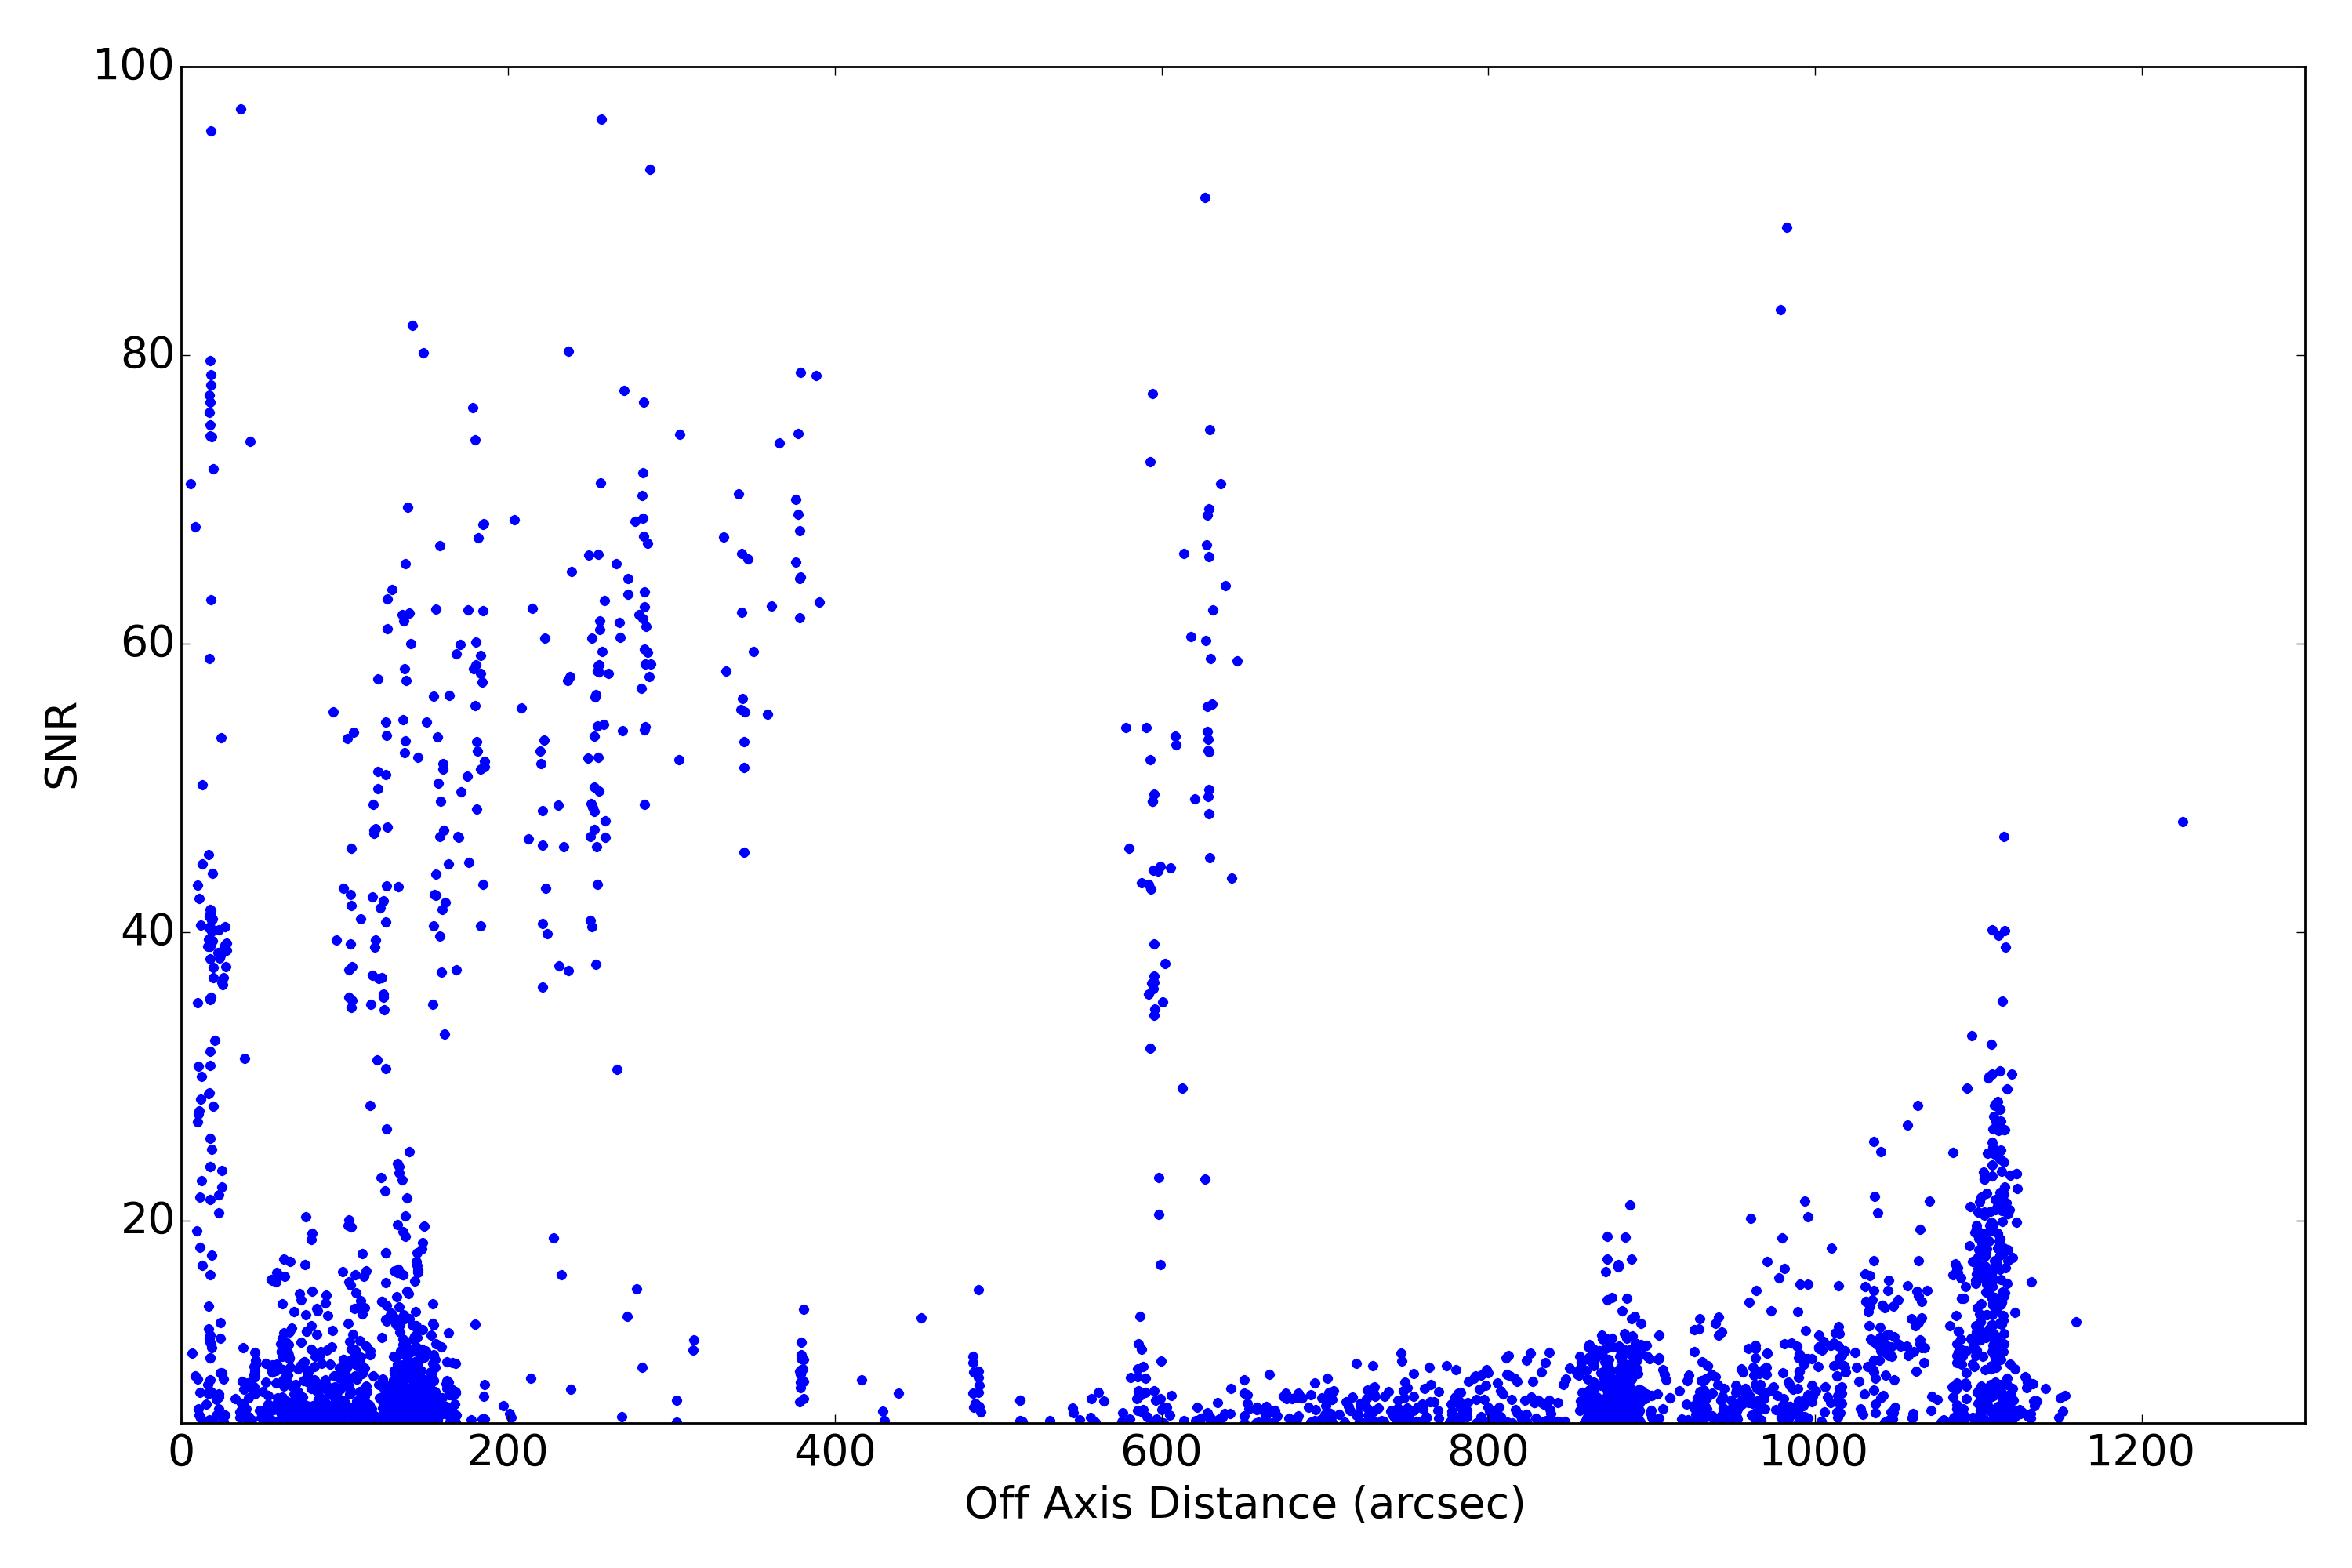
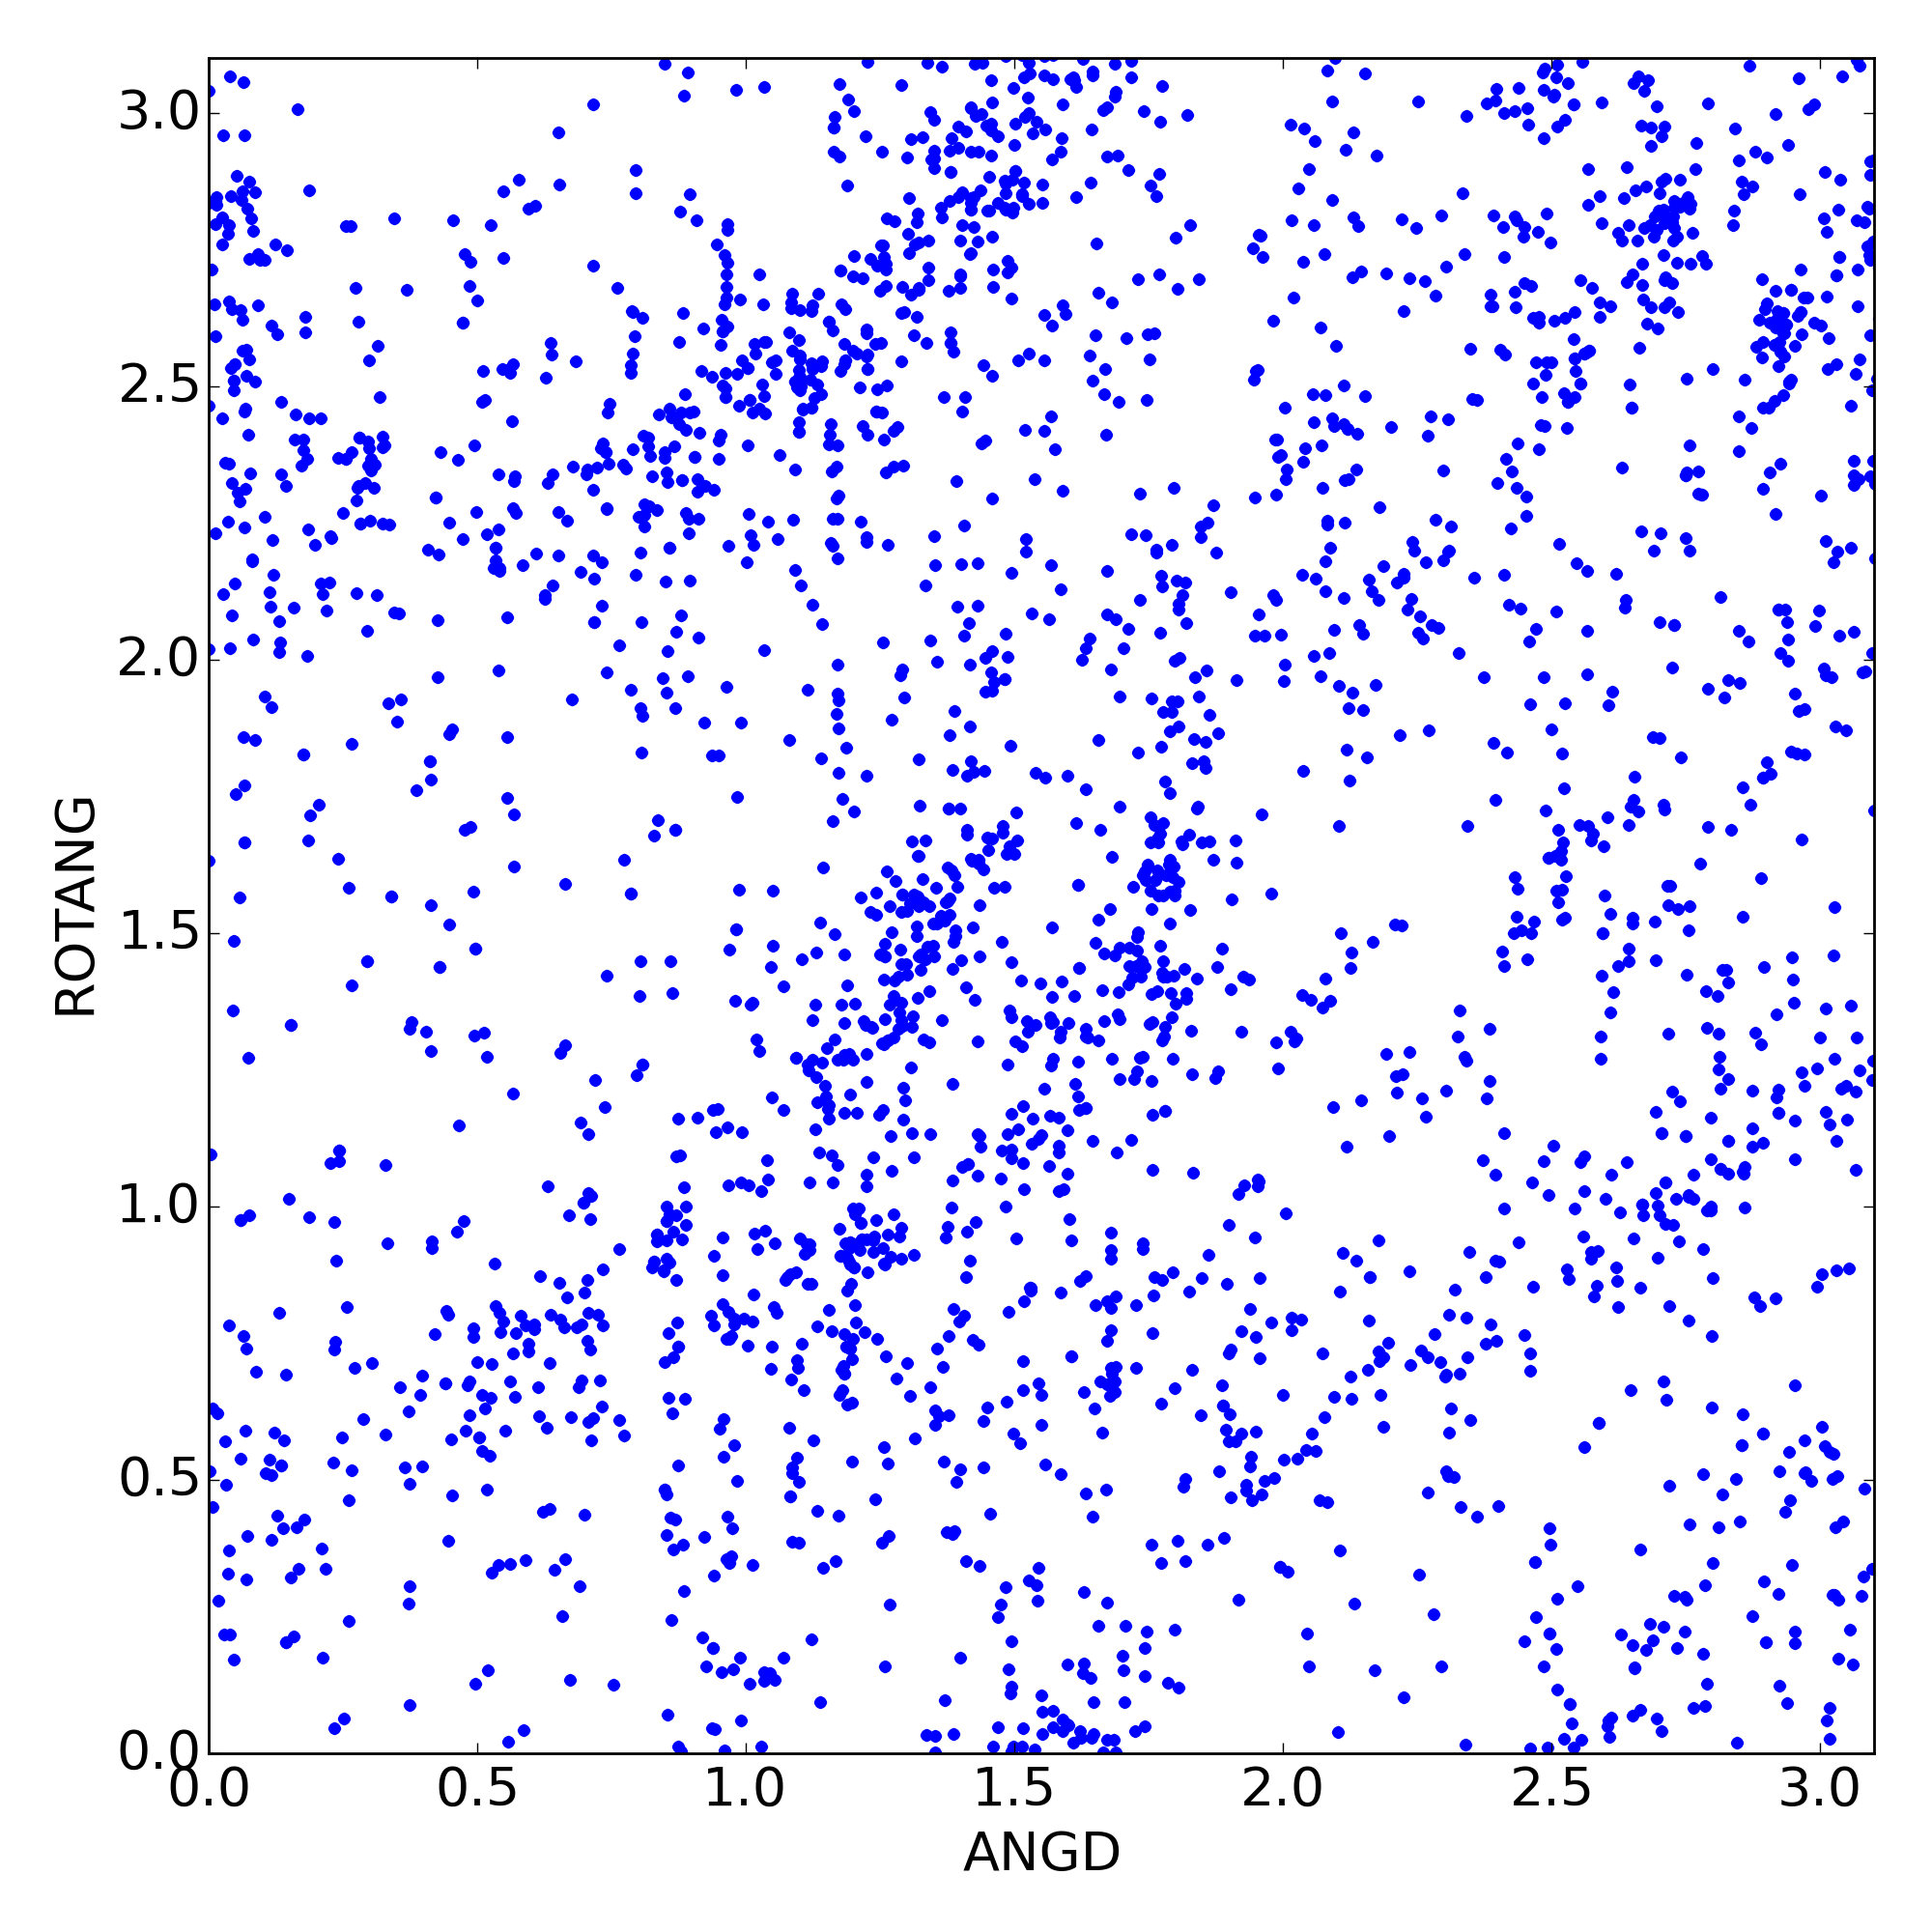
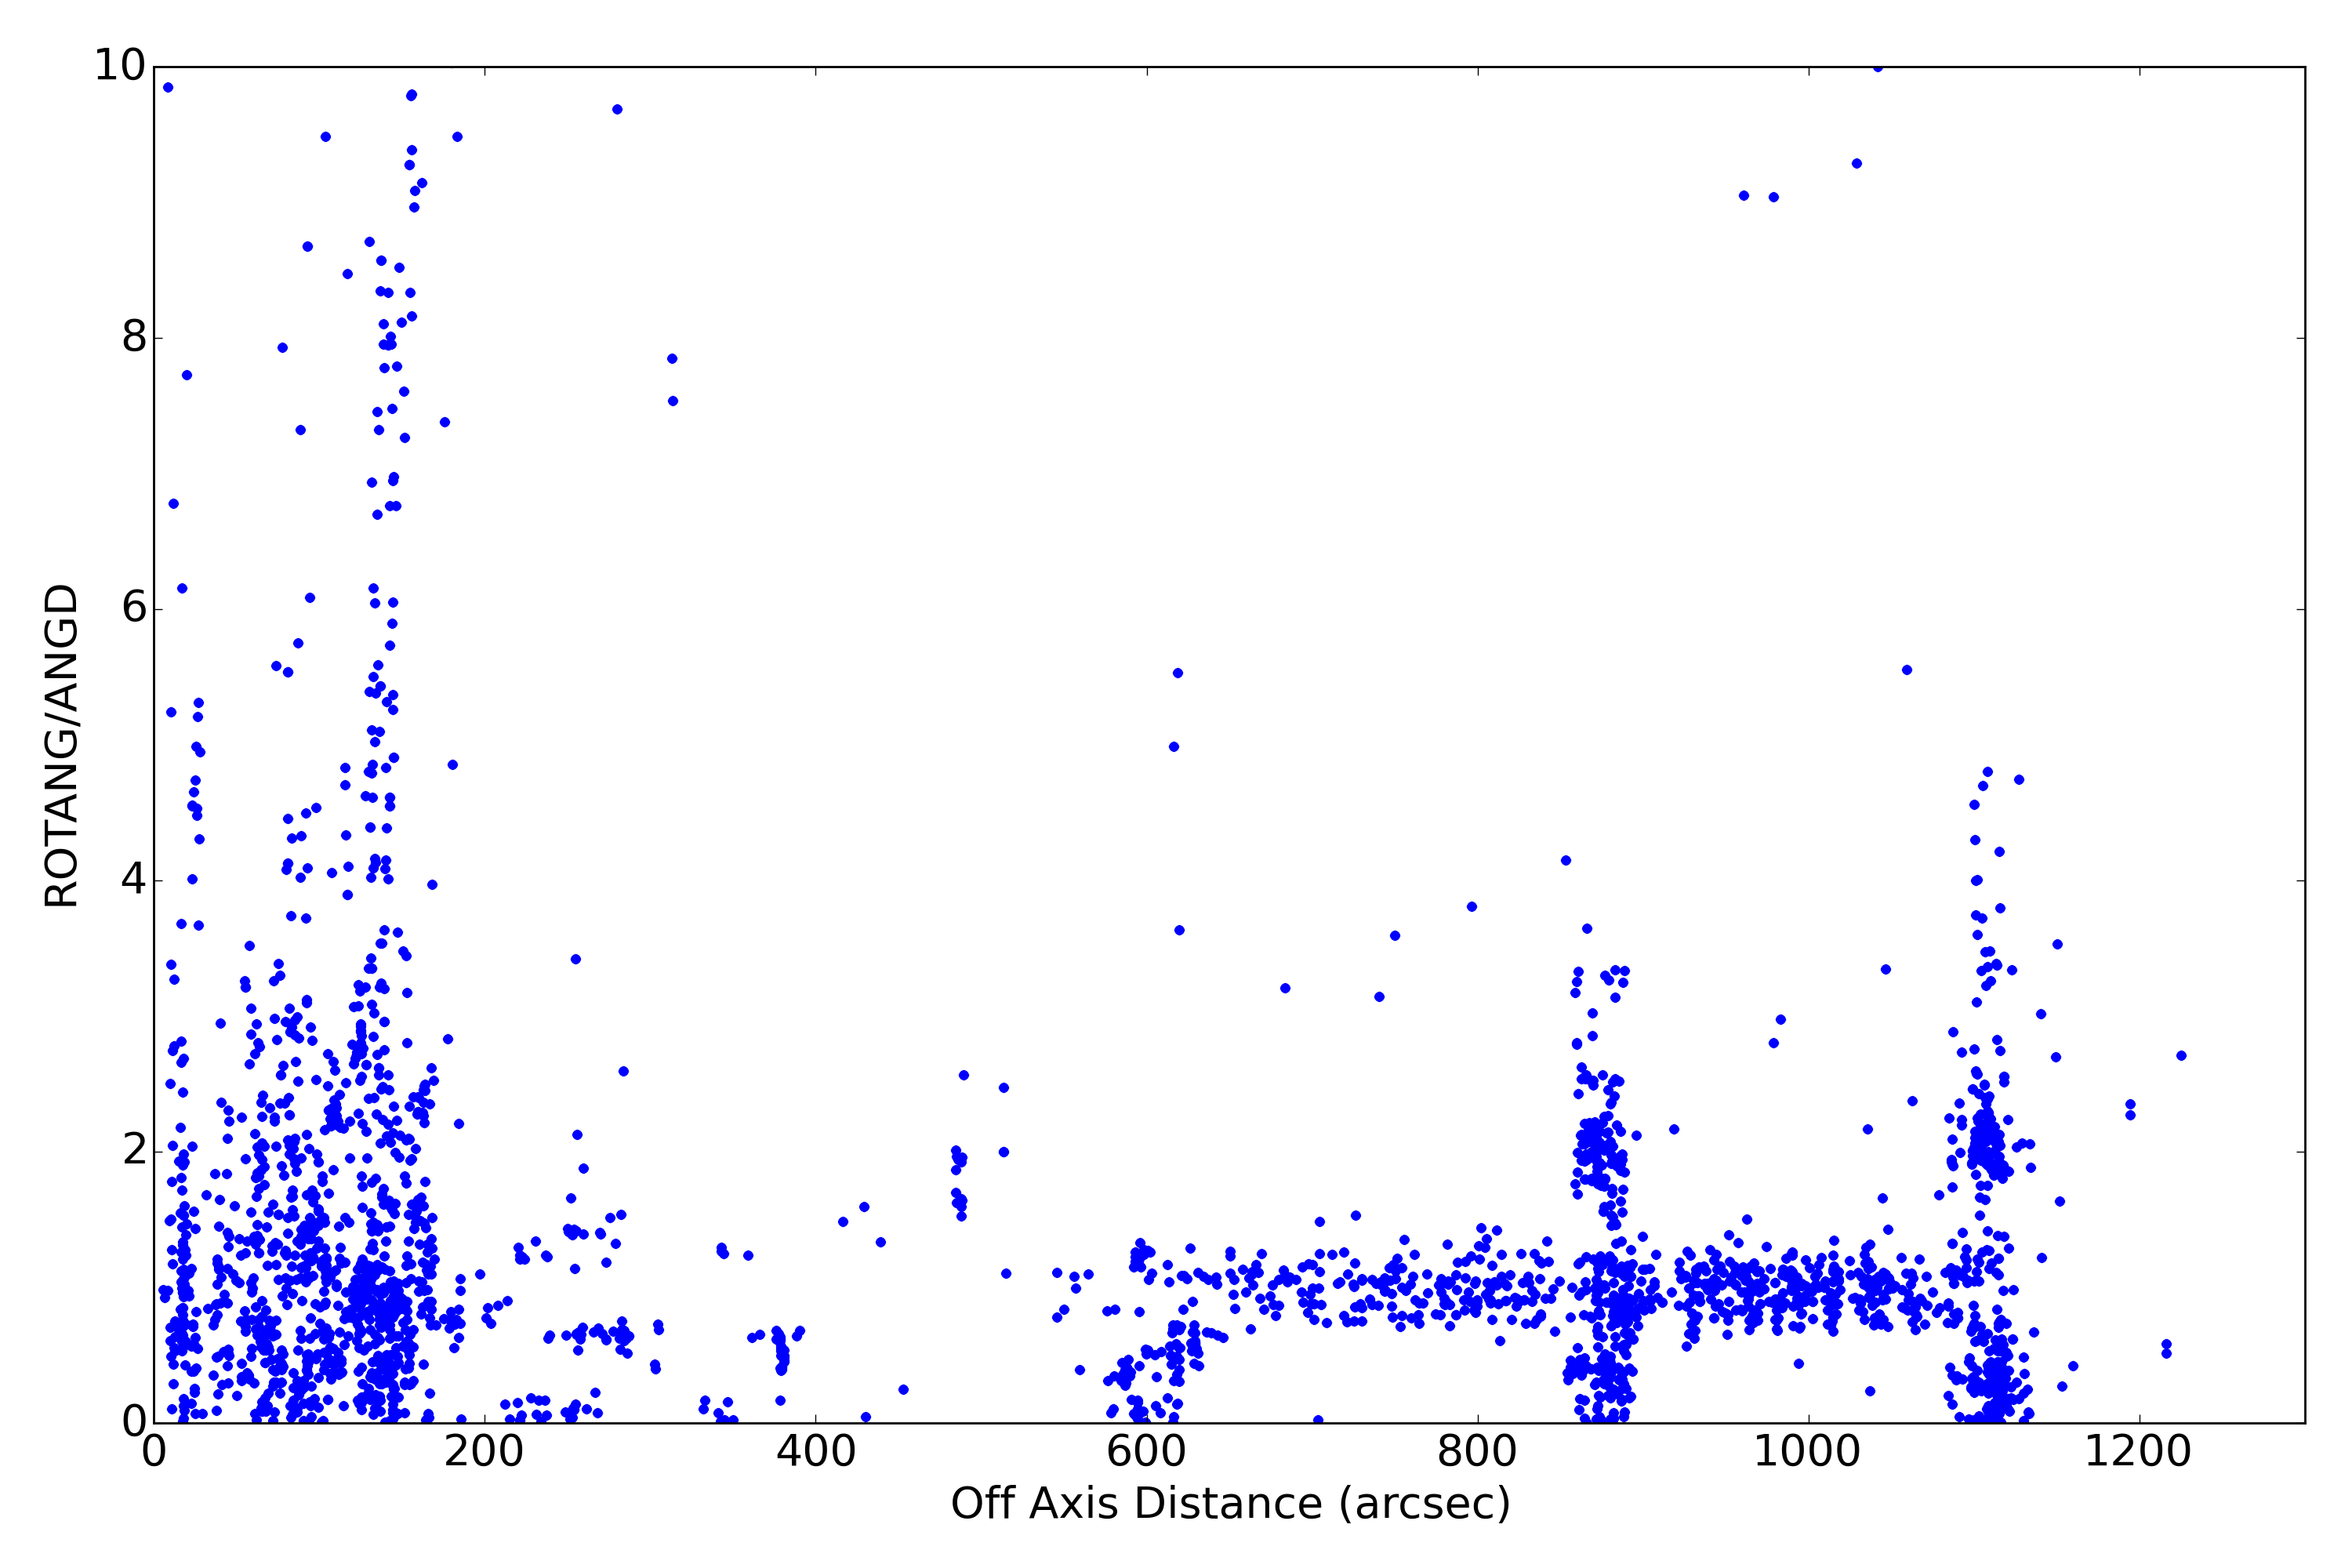
Plots below show various characteristics of detected imaging sources. Standard level 2 data products (*src2.fits) are used. Only observations with focus (sim_x) within 0.01 mm of nominal value for given SI configuration are used. Sources are also filtered for strength (SNR > 15).
| XY | PSF | Roundness | EE Radius | SNR | Rotation | Rotation2 | |
|---|---|---|---|---|---|---|---|
| ACIS I | 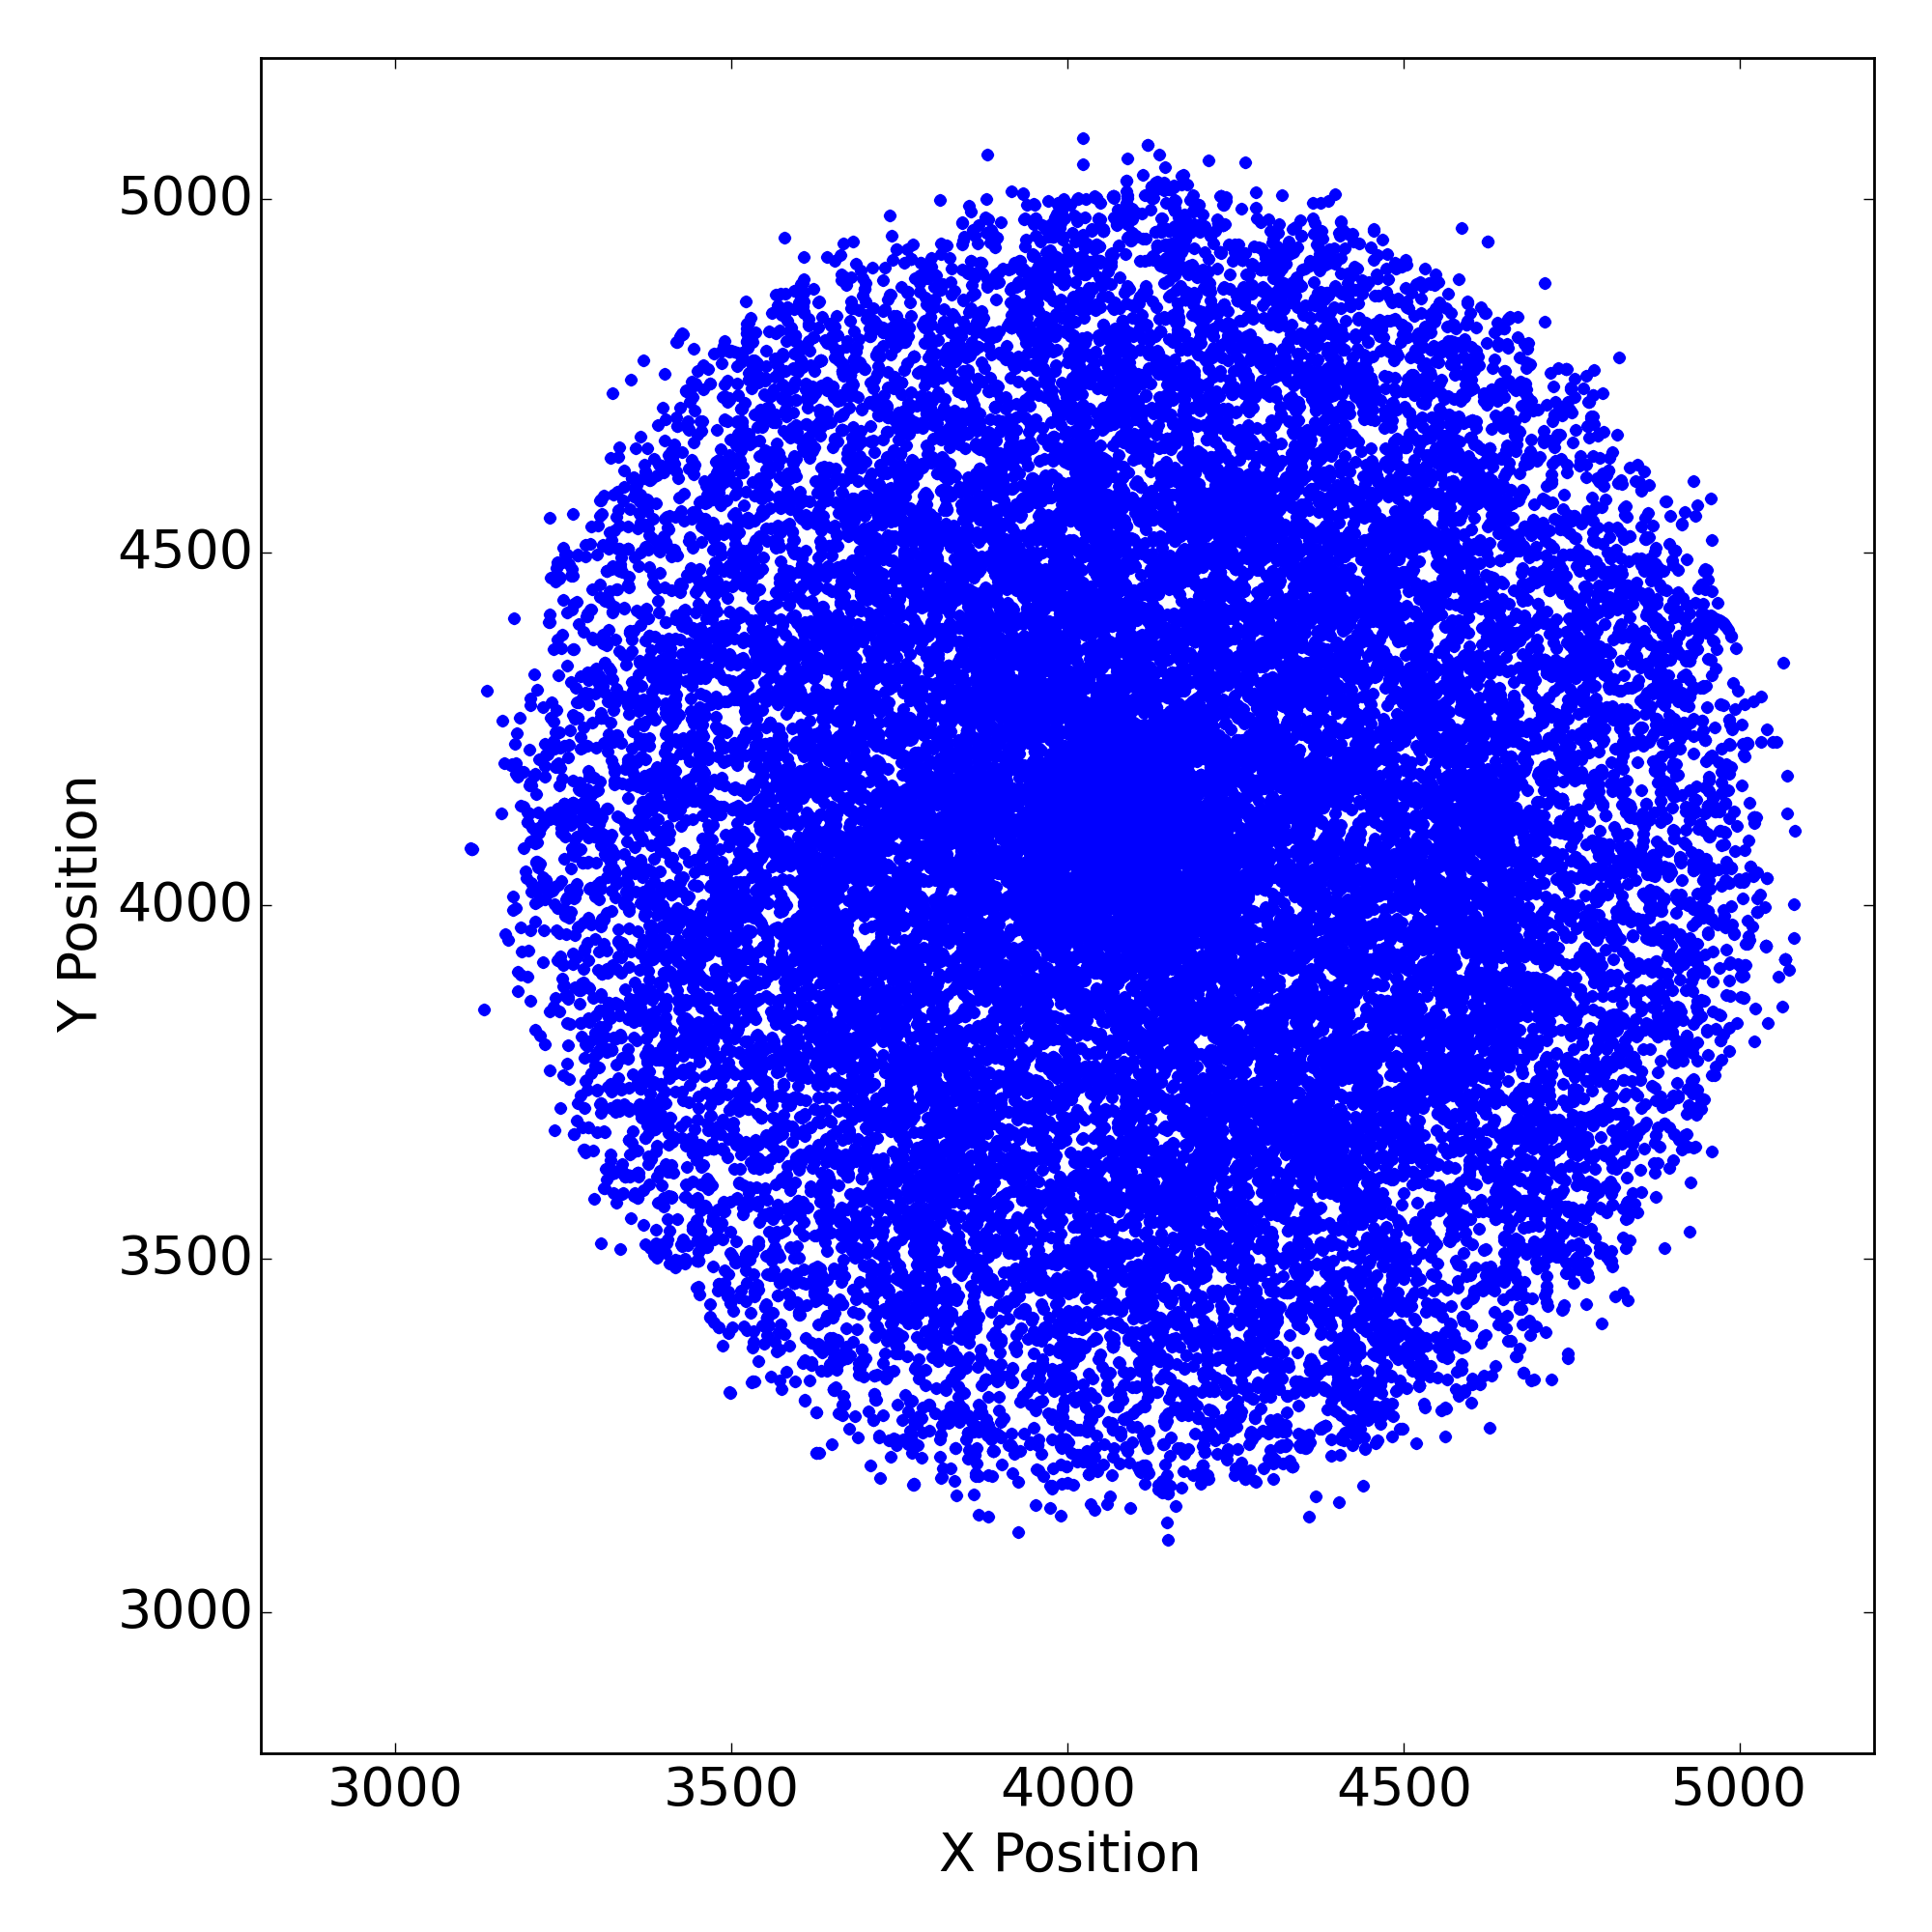 |
 |
 |
 |
 |
 |
 |
| ACIS S | 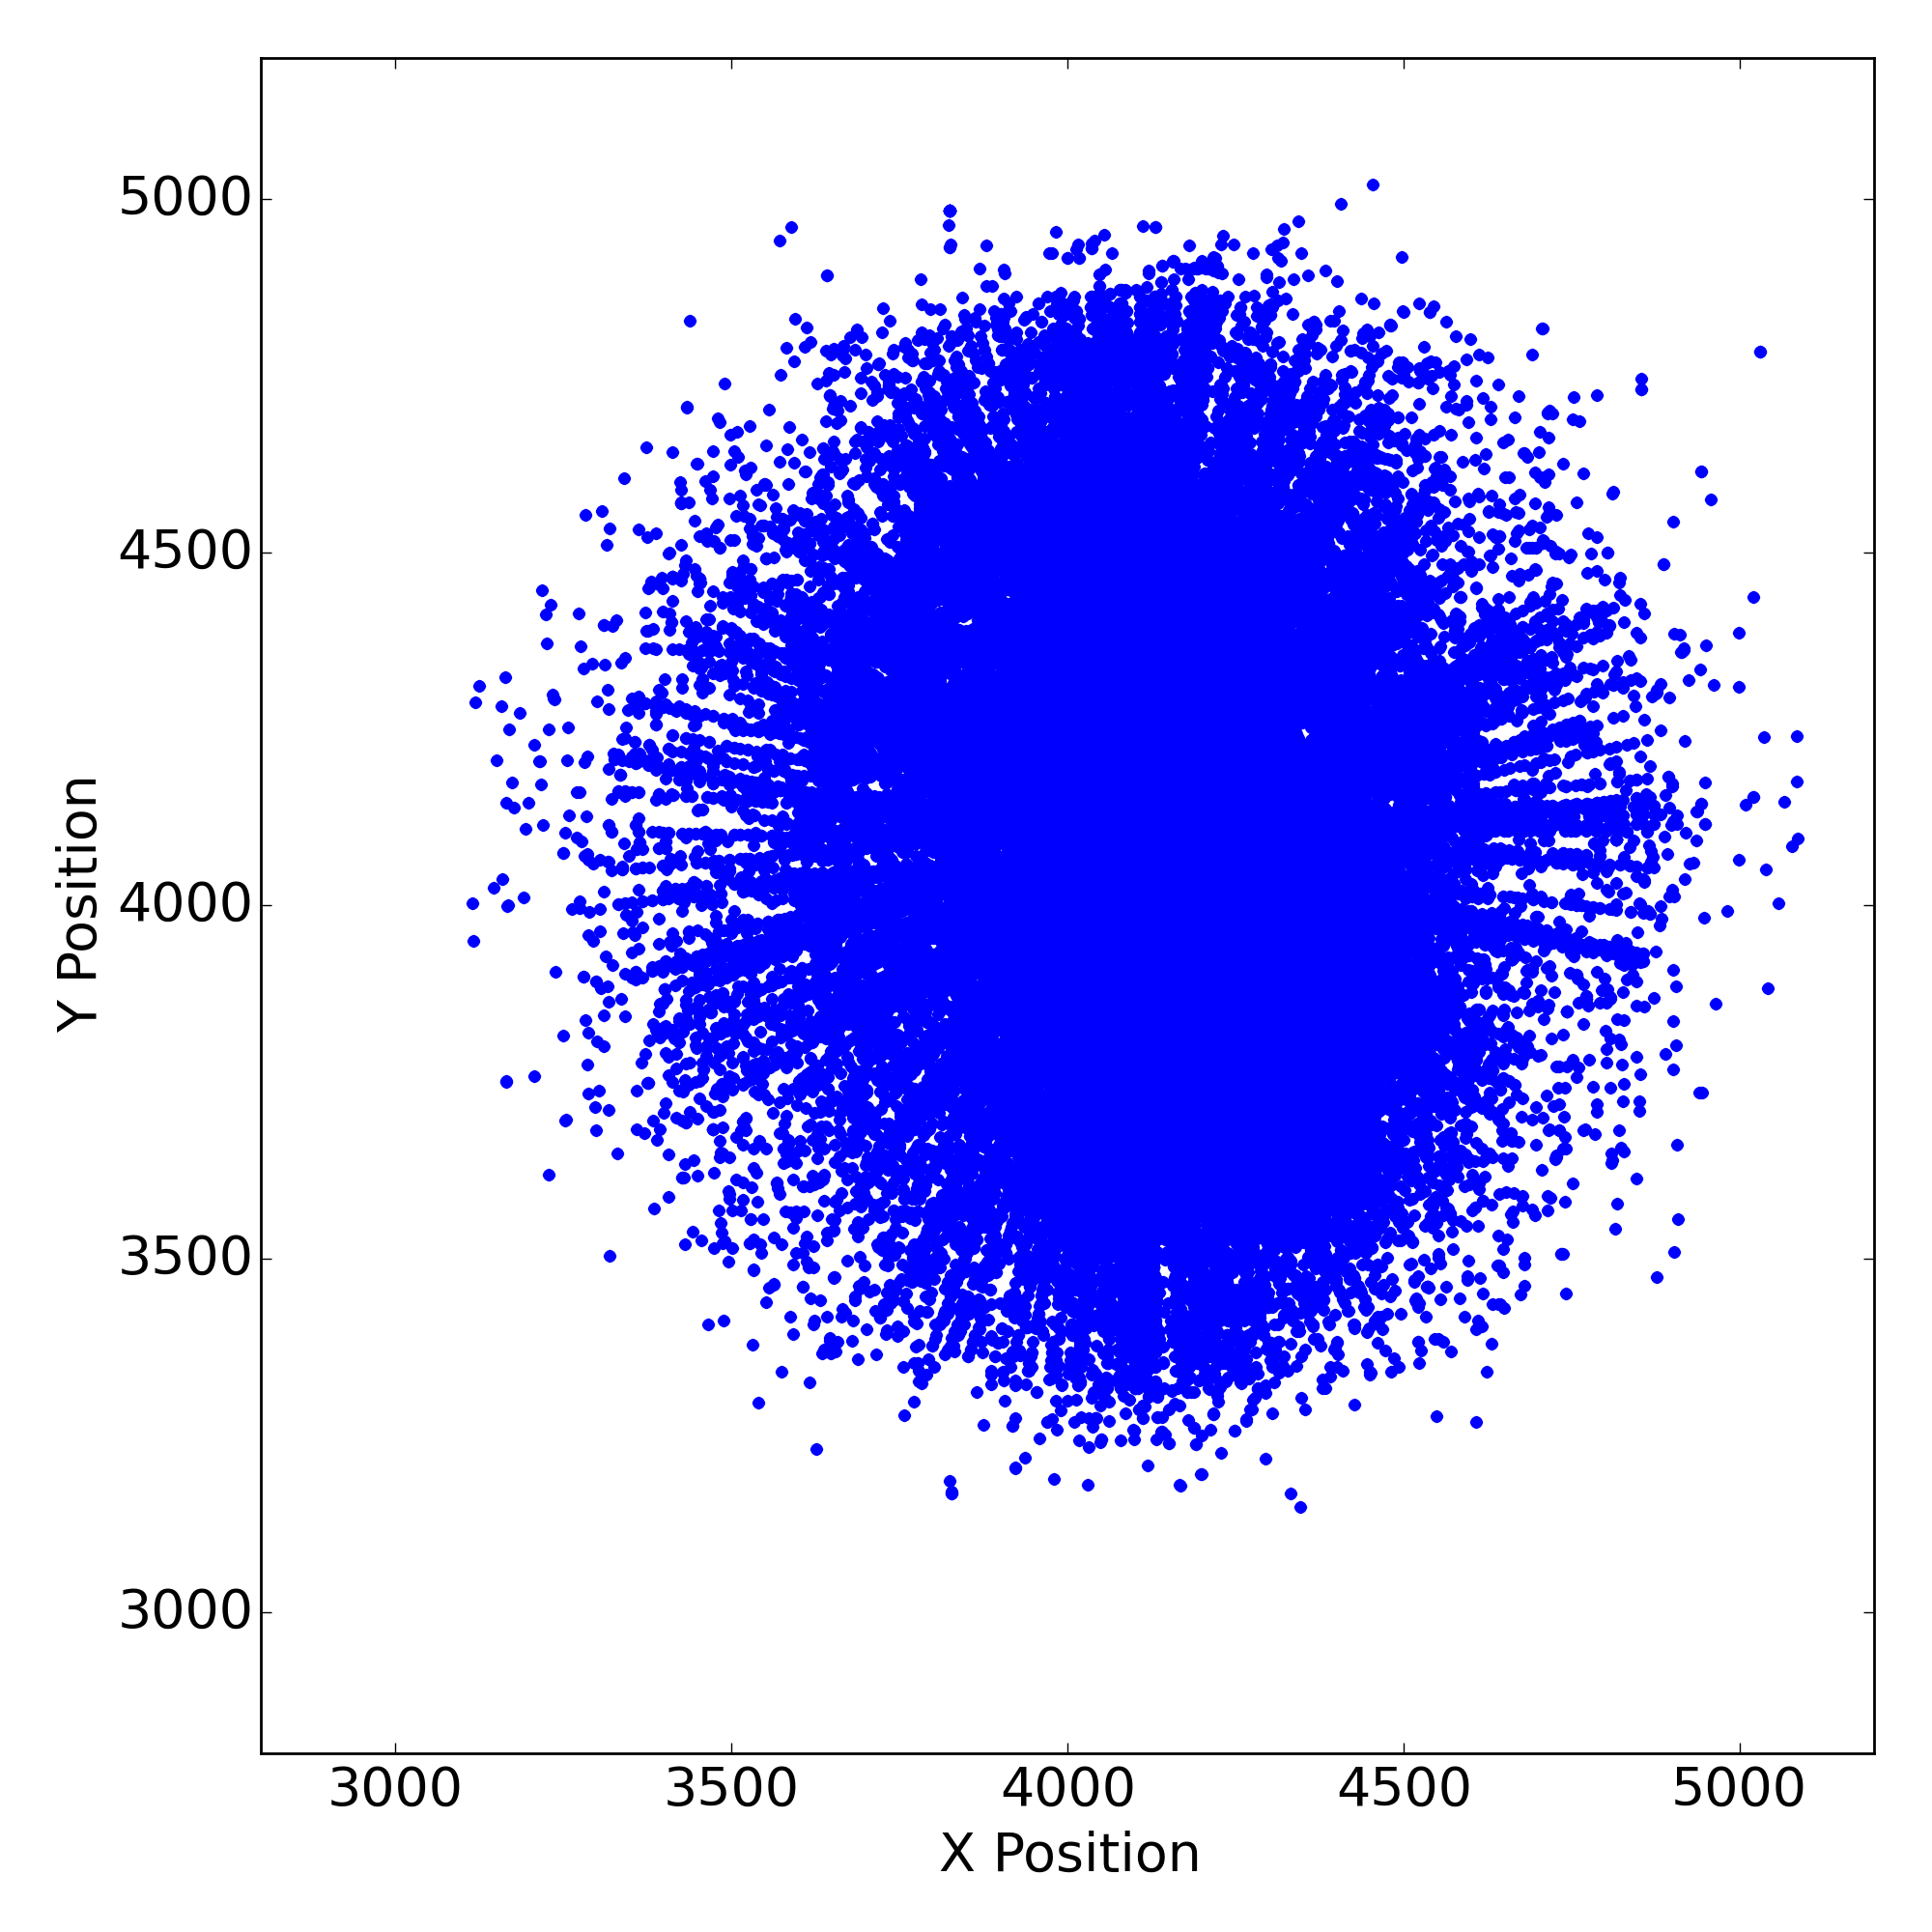 |
 |
 |
 |
 |
 |
 |
| HRC I | 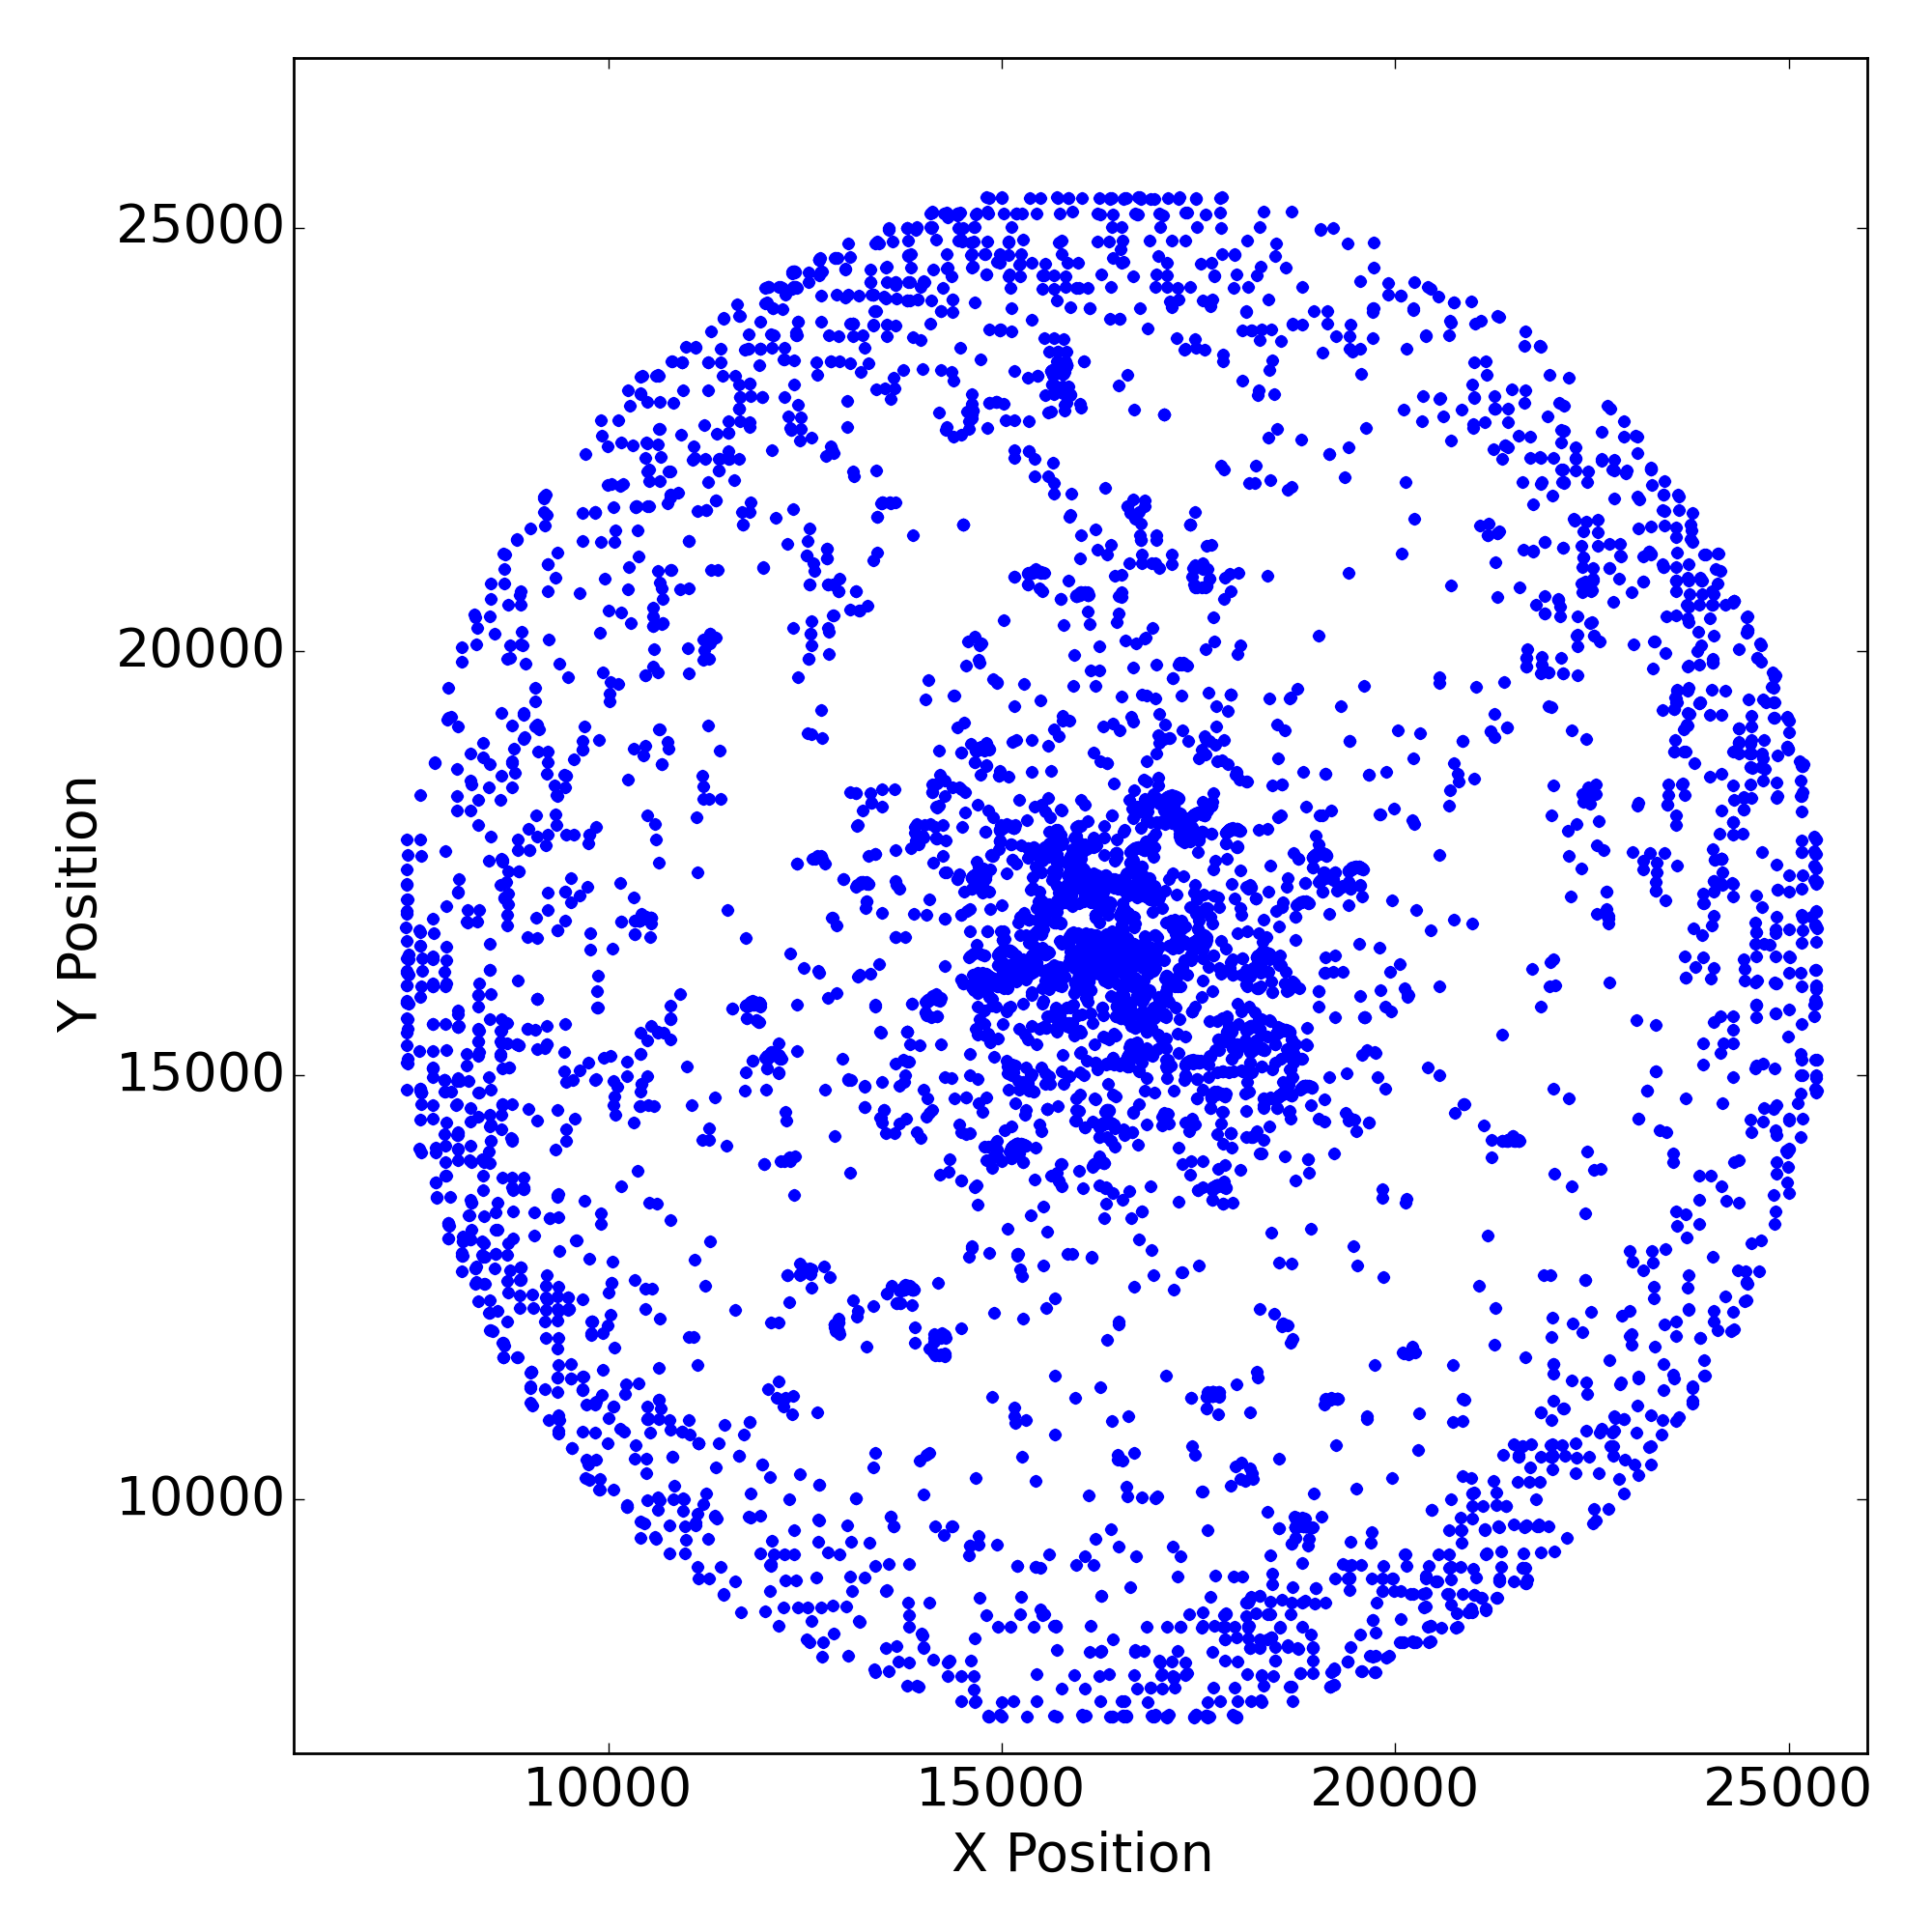 |
 |
 |
 |
 |
 |
 |
| HRC S | 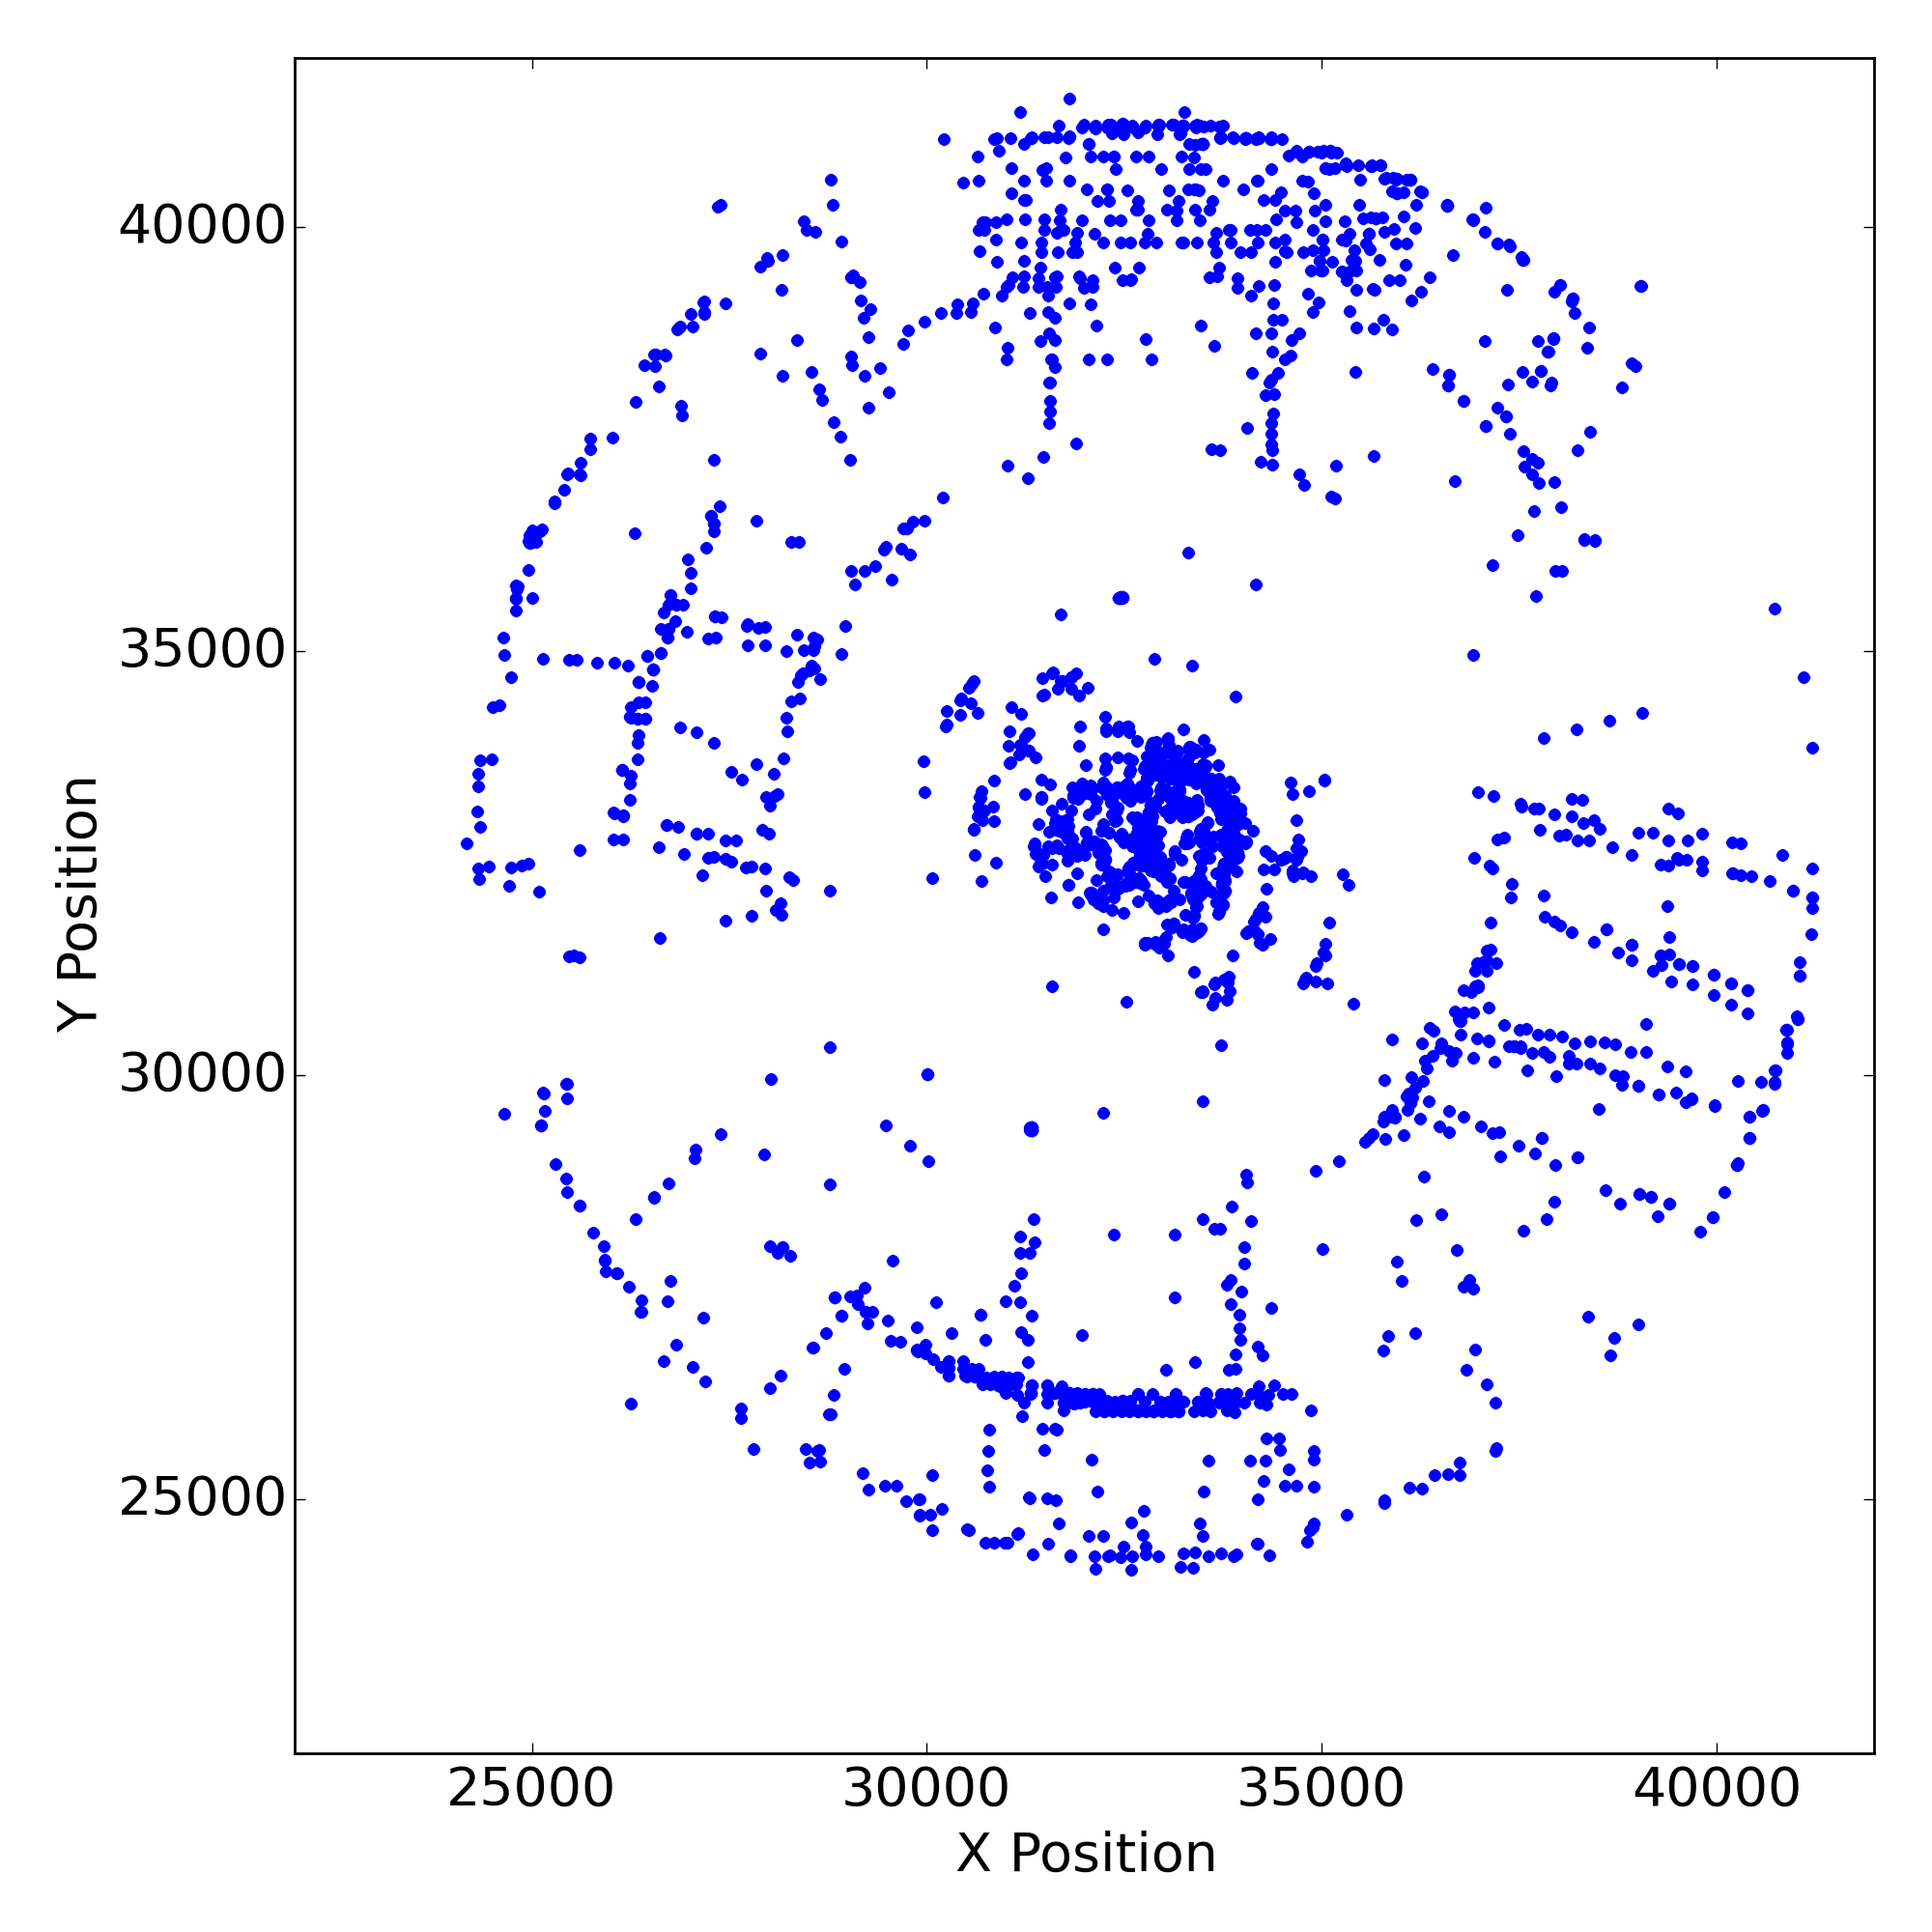 |
 |
 |
 |
 |
 |
 |
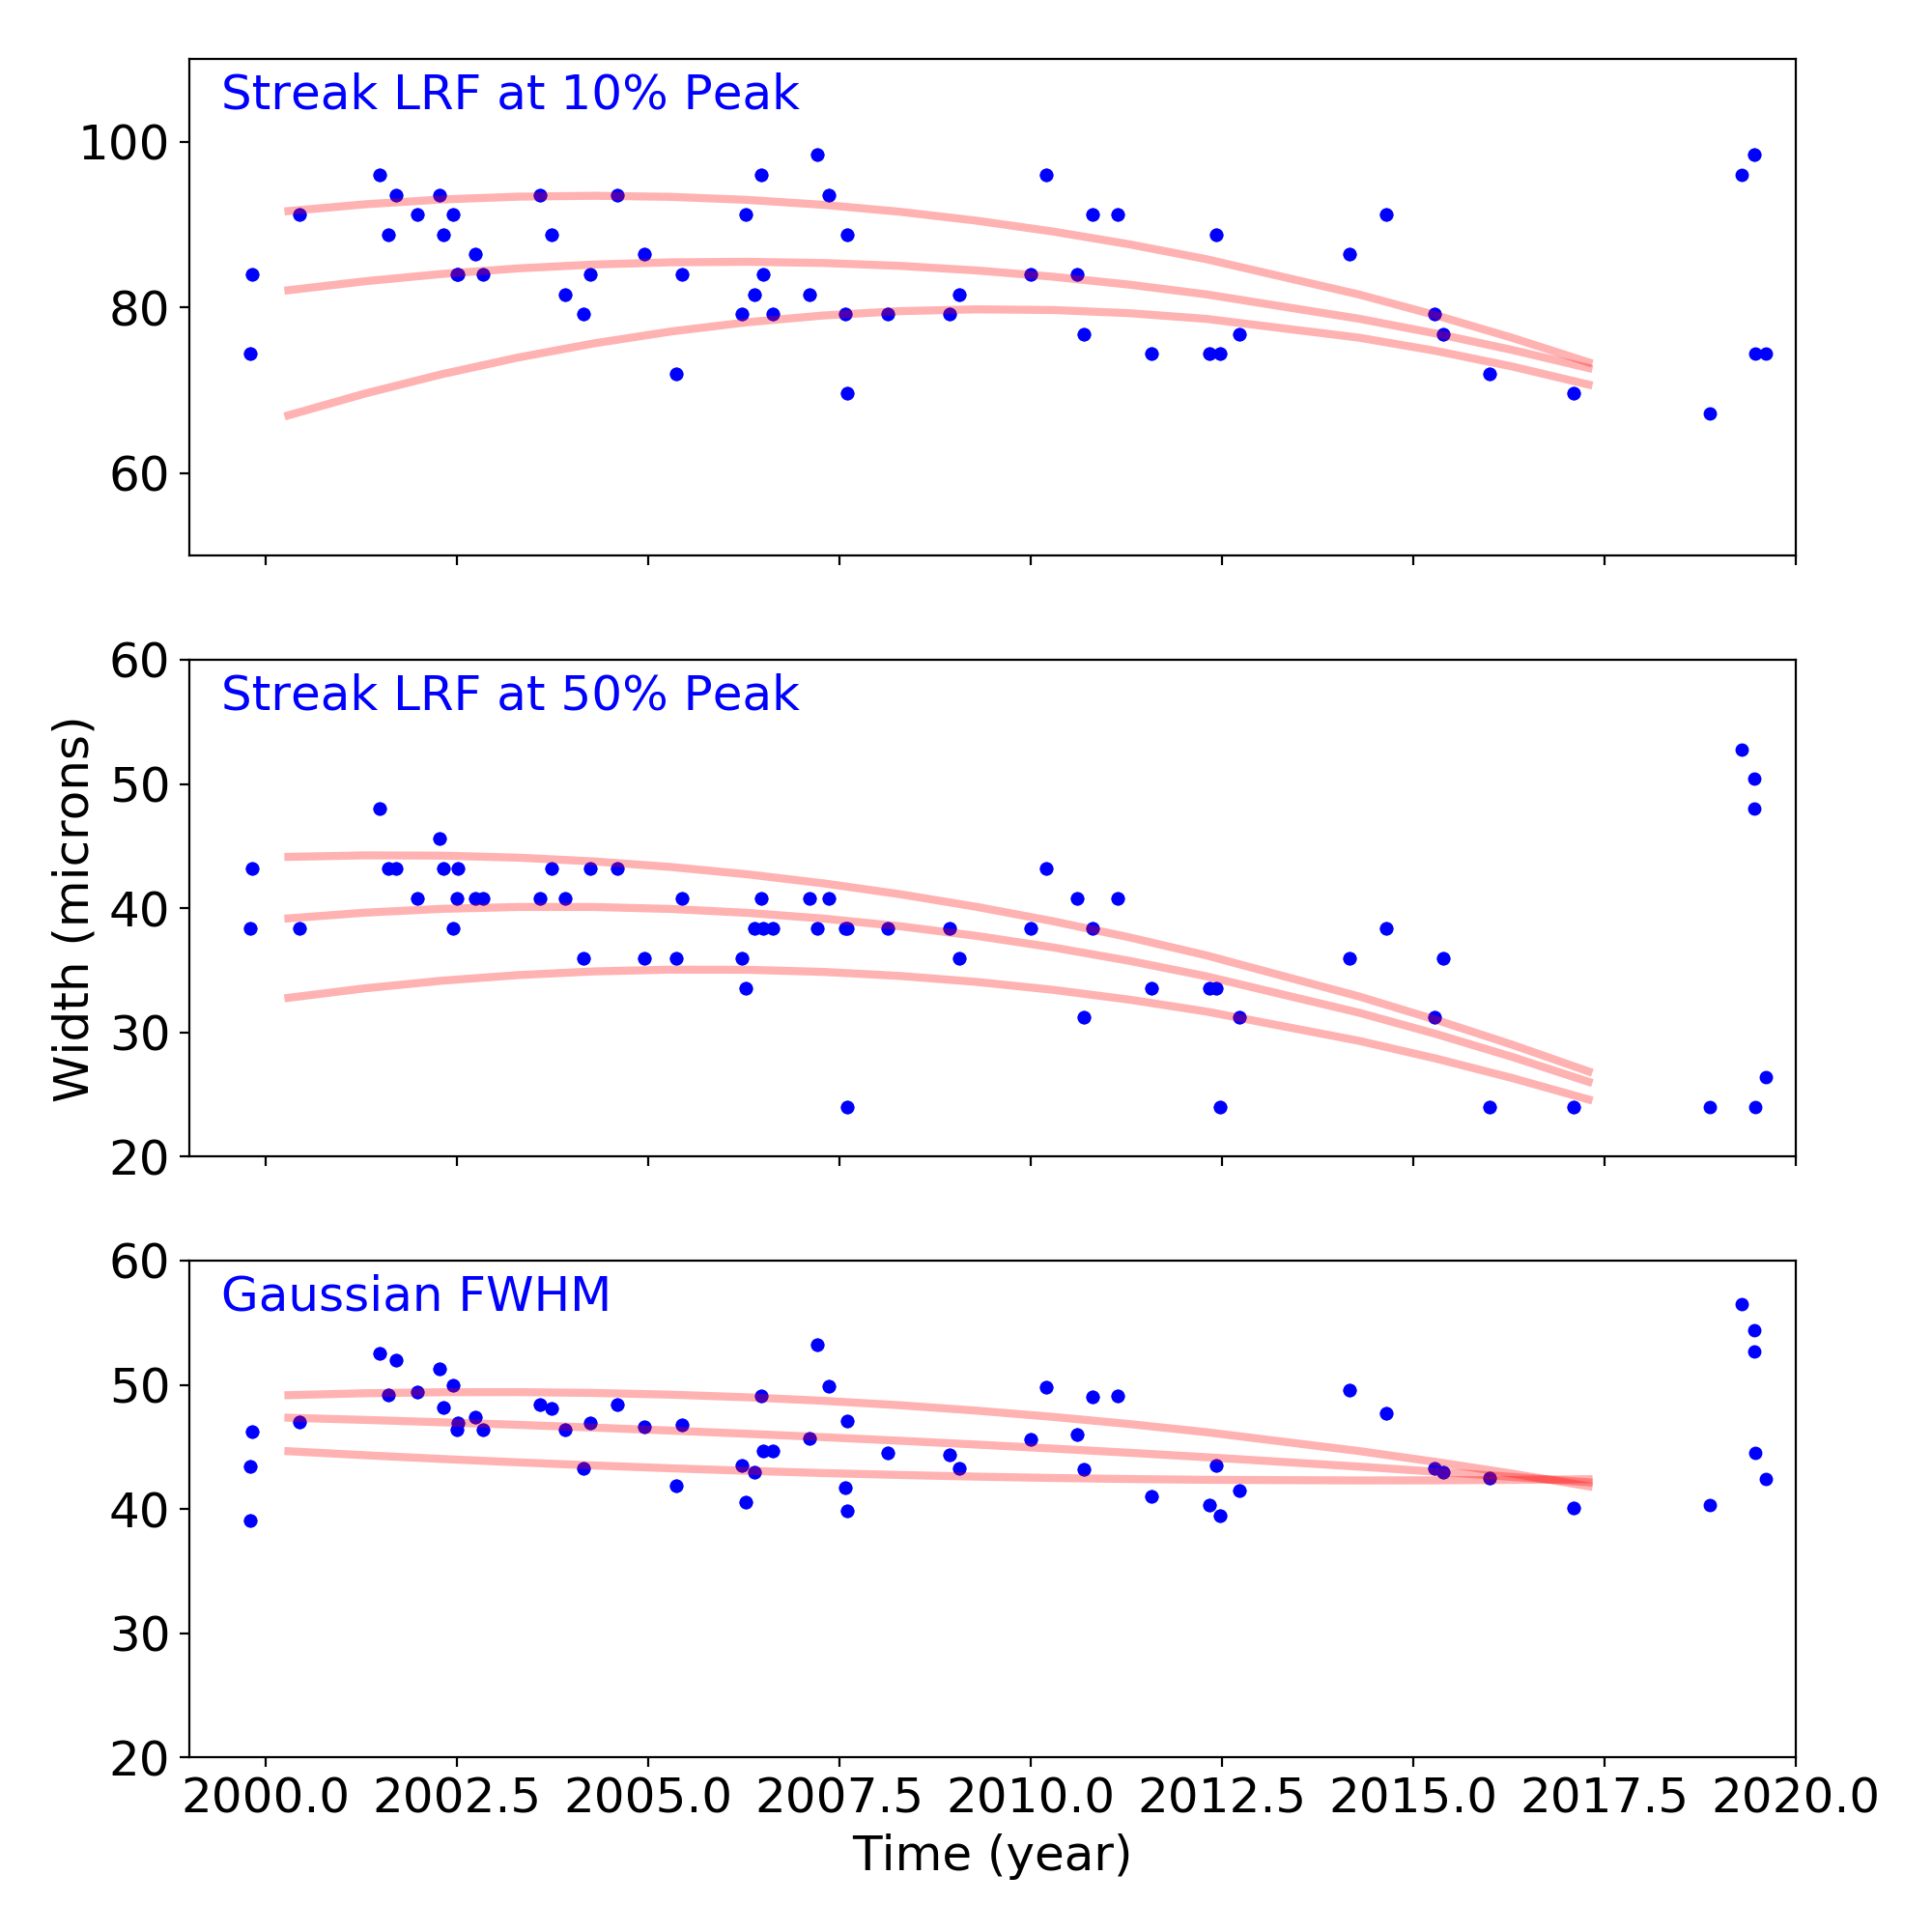
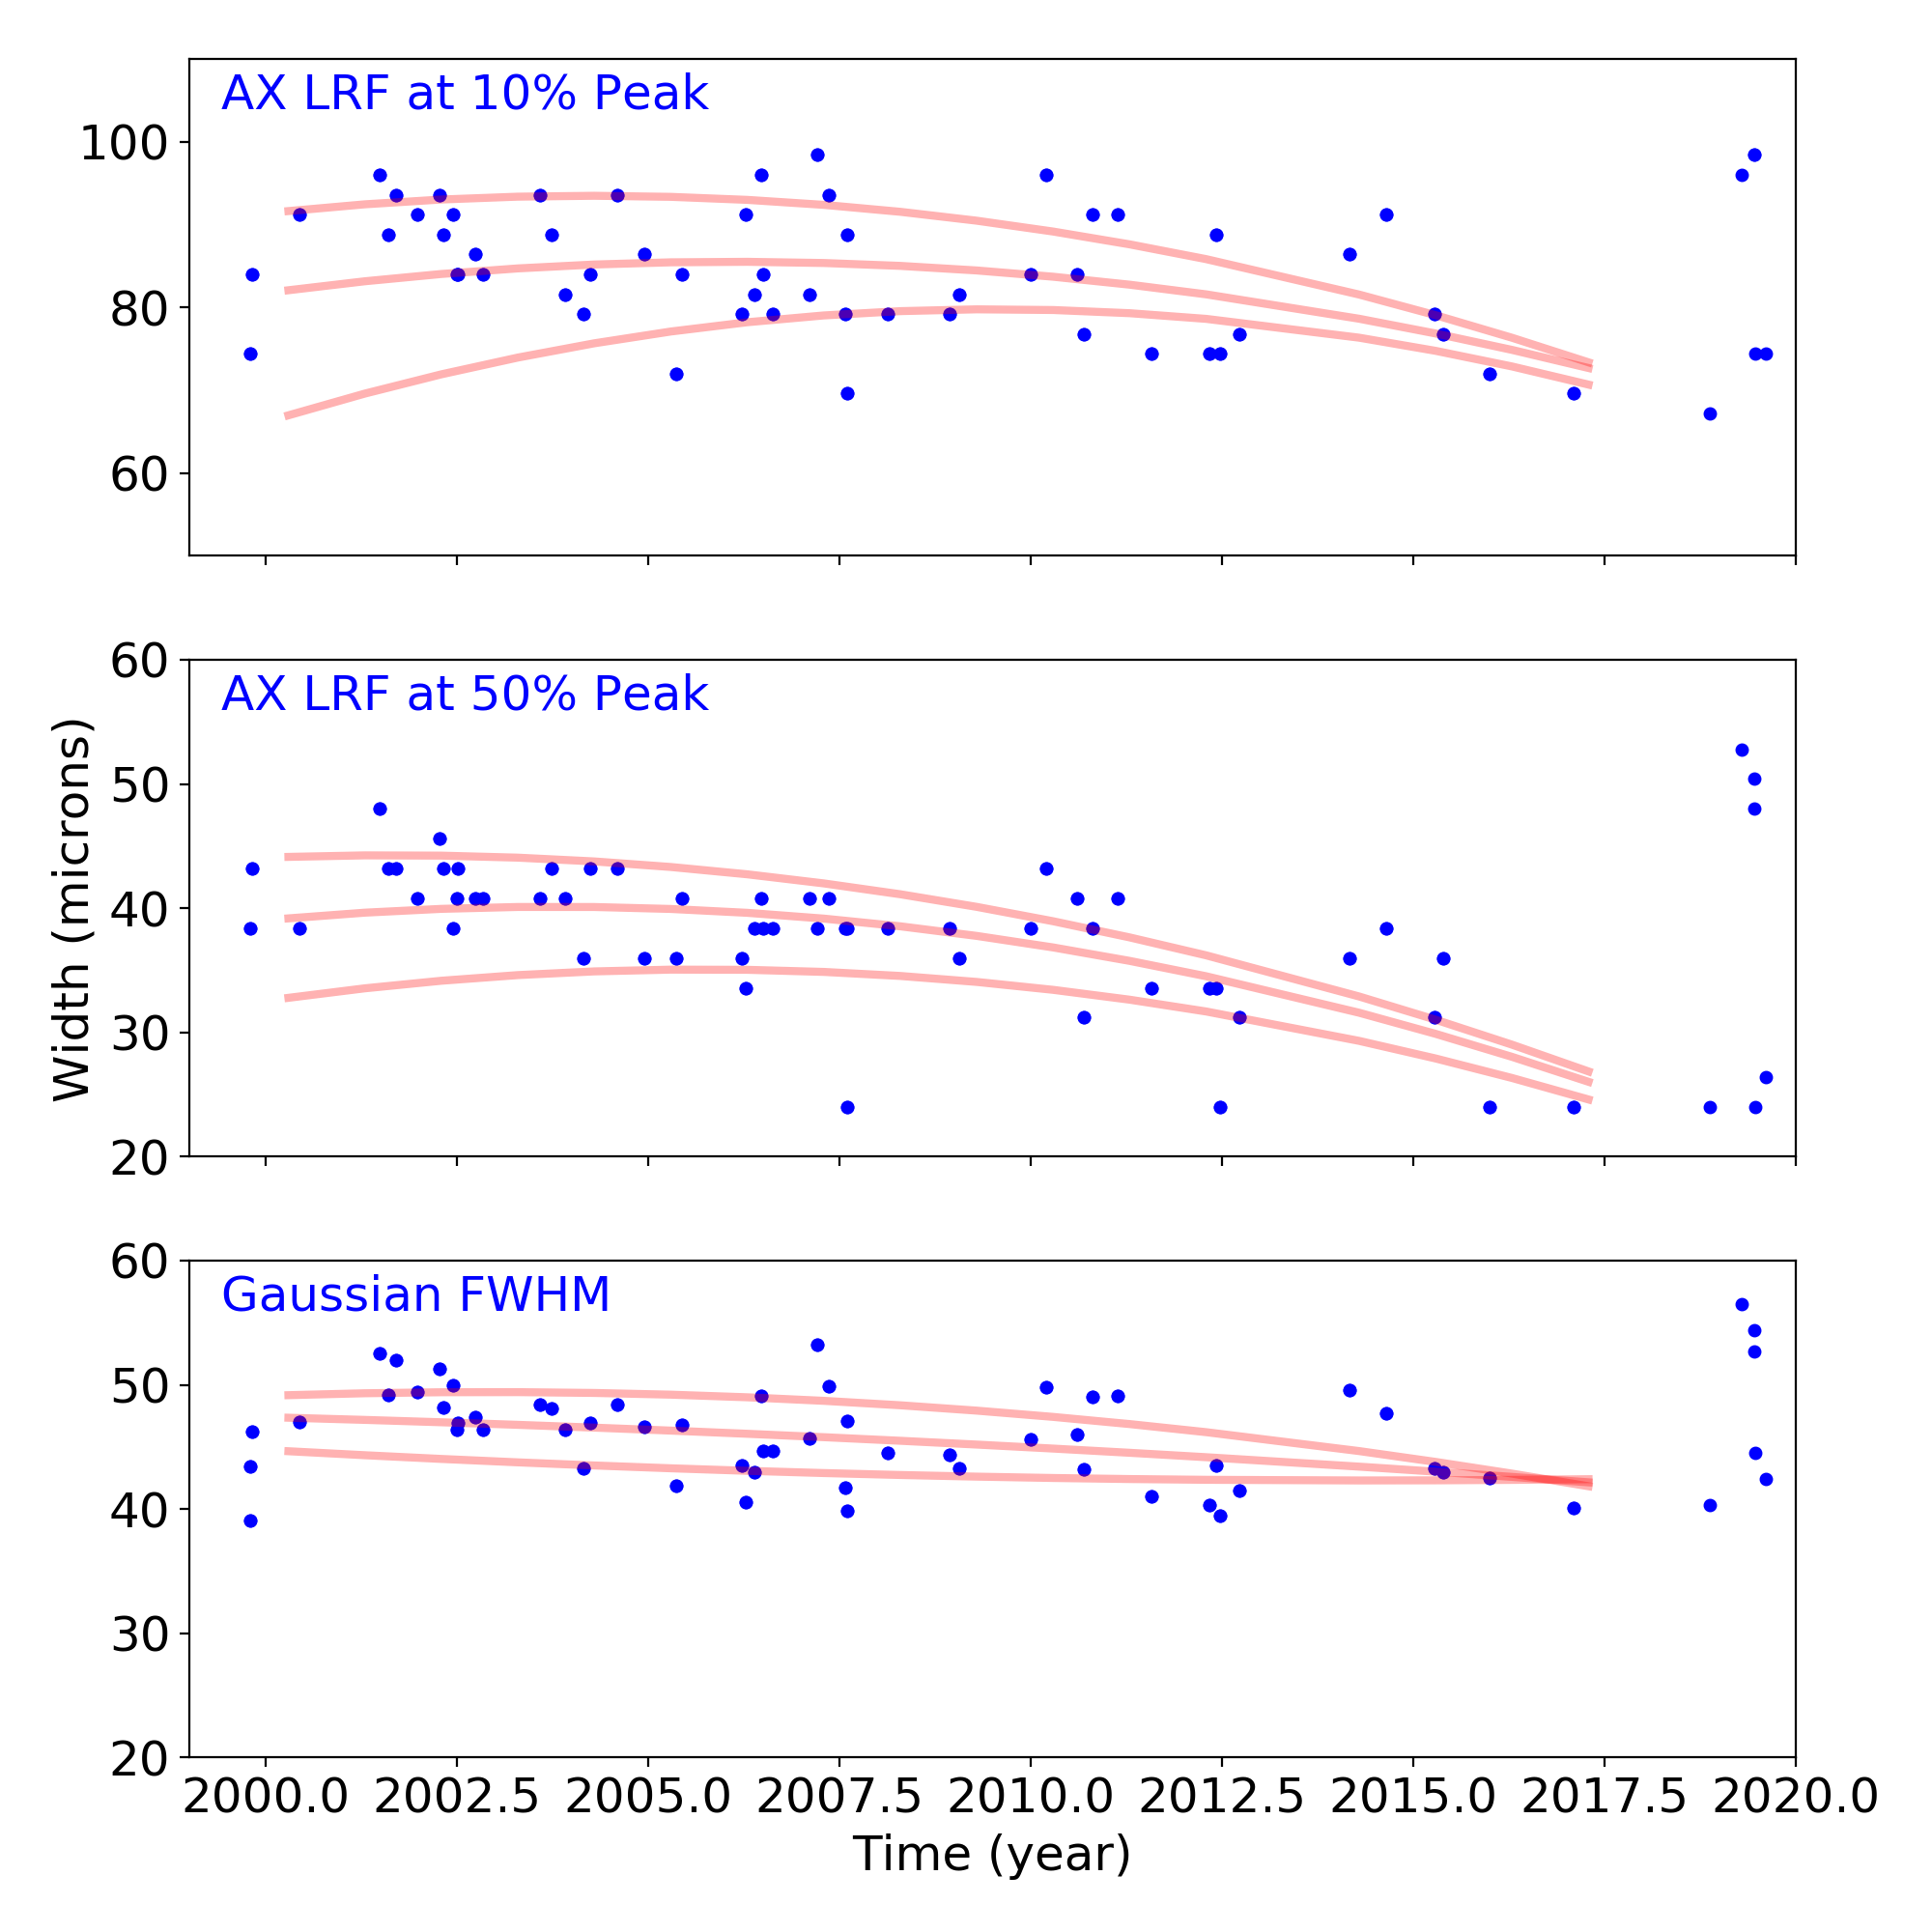
Gratings
Grating Trends/Focus
We plot the width of the zero order streak of ACIS/HETG observations and the width of the zero order image for HRC/LETG observations of point sources. No significant defocusing trend is seen at this time. See Gratings Trends pages.
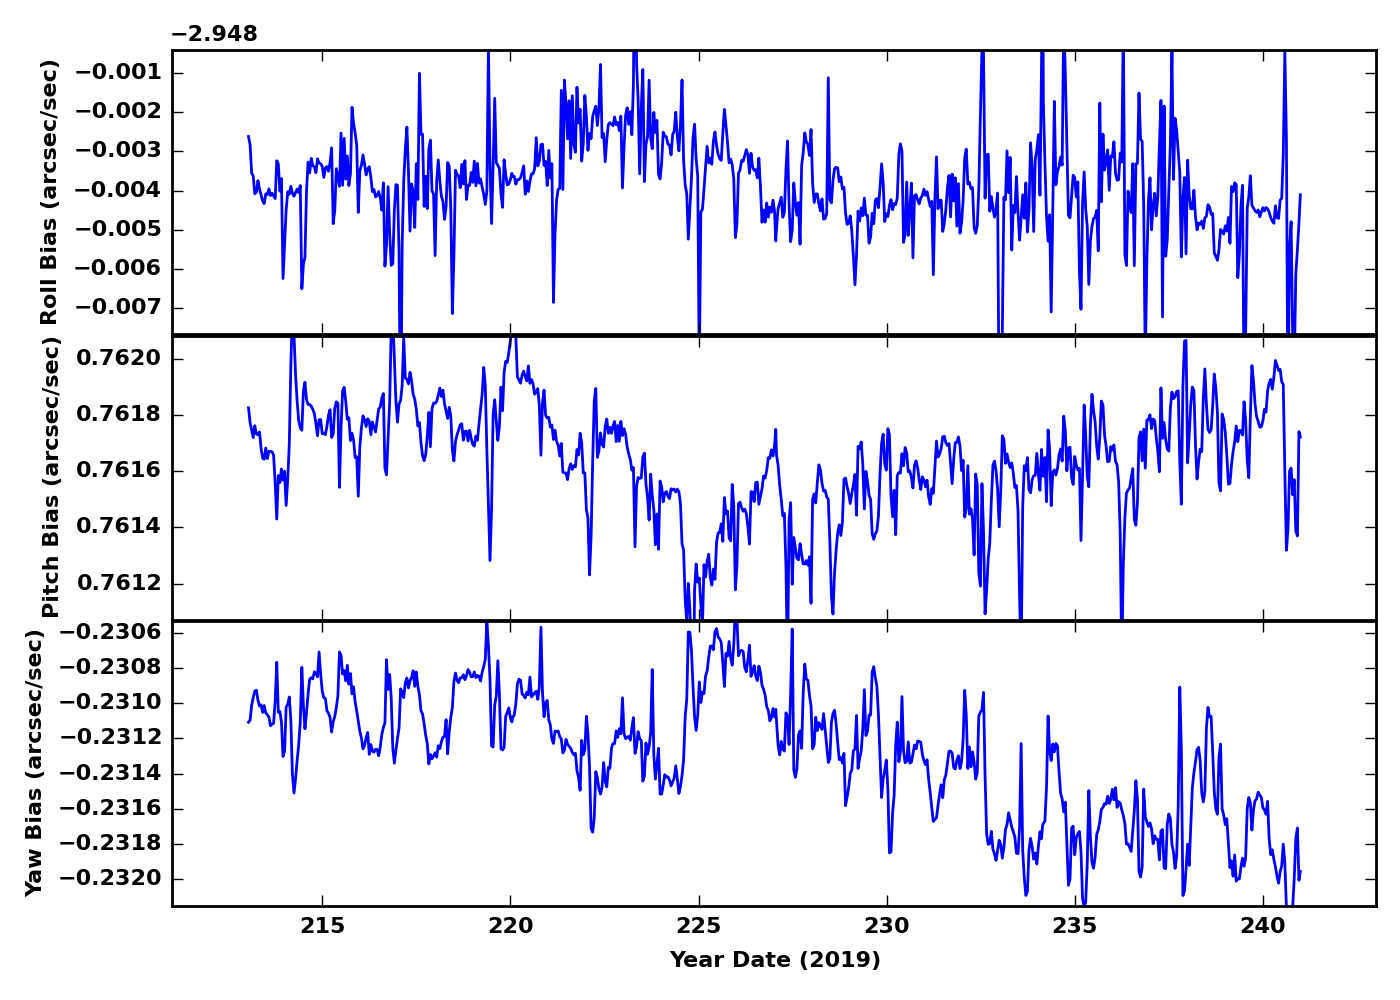
PCAD
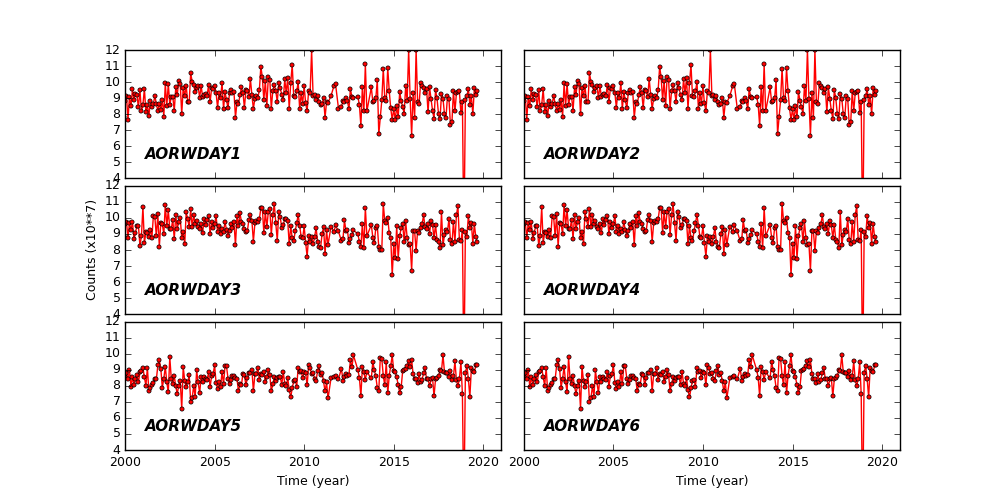
ACA Trending
Gyro Bias Drift
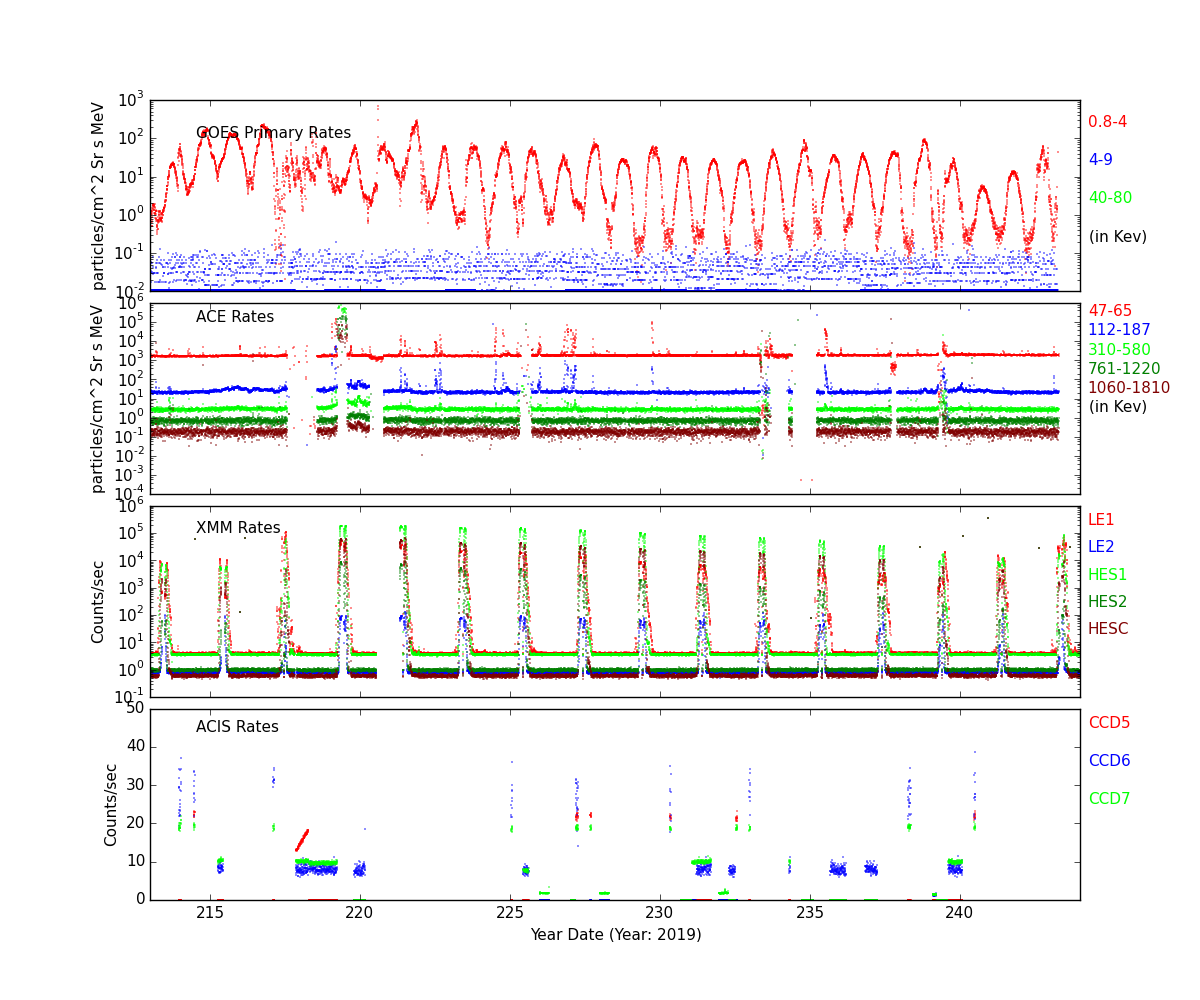
Radiation History
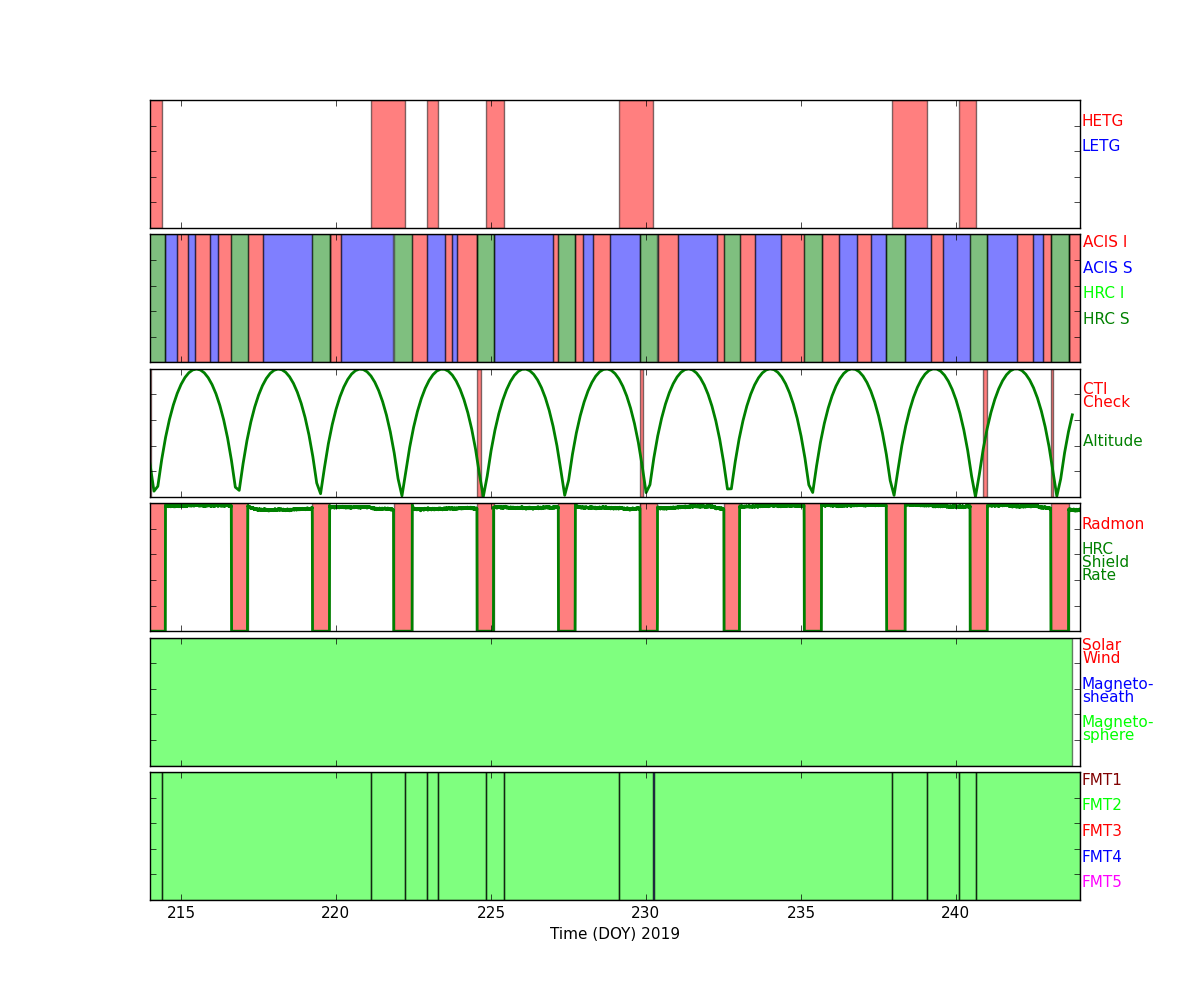
Radiation Count Rates of Aug 2019
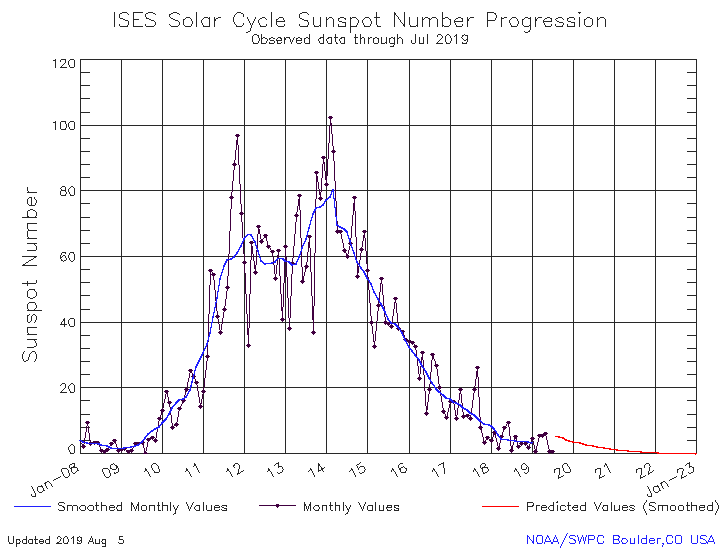
Sun Spot History
Trending
Quarterly Trends
- HRC Temperature
| Previous Quarter | ||||||
| MSID | MEAN | RMS | DELTA/YR | DELTA/YR/YR | UNITS | DESCRIPTION |
| 2ceahvpt | 300.051 | 2.195 | 0.001+/-0.001 | -0.298+/-0.344 | K | CEA RADIATOR TEMPERATURE AT CENTER |
|---|---|---|---|---|---|---|
| 2chtrpzt | 296.547 | 2.168 | (-3.63+/-12.02)e-4 | -0.177+/-0.340 | K | CENTRAL ELECTRONICS BOX TEMP |
| 2condmxt | 293.242 | 2.386 | (1.80+/-13.38)e-4 | 0.101+/-0.306 | K | CONDUIT -X FACE TEMPERATURE |
| 2dcentrt | 292.301 | 1.949 | (-5.12+/-109.30)e-5 | 0.053+/-0.341 | K | DETECTOR HOUSING TEMP 2 |
| 2dtstatt | 293.019 | 1.934 | (-1.15+/-10.86)e-4 | 0.239+/-0.339 | K | DETECTOR HOUSING TEMP 1 |
| 2fhtrmzt | 295.146 | 2.197 | (4.26+/-12.30)e-4 | 0.408+/-0.364 | K | FRONT END ELECTRONICS BOX TEMPERATURE |
| 2fradpyt | 290.902 | 2.316 | (3.95+/-12.83)e-4 | 0.432+/-0.367 | K | FRONT END ASSEMBLY +Y AT RADIATOR CENTER TEMP |
| 2pmt1t | 294.385 | 2.661 | (9.33+/-14.75)e-4 | -0.117+/-0.383 | K | PMT 1 TEMPERATURE |
| 2pmt2t | 296.872 | 2.930 | 0.002+/-0.002 | -0.121+/-0.394 | K | PMT 2 TEMPERATURE |
| 2uvlspxt | 288.266 | 2.404 | (-3.13+/-13.54)e-4 | -0.116+/-0.384 | K | UV LIGHT SHIELD |
- PCAD Temperature
| Previous Quarter | ||||||
| MSID | MEAN | RMS | DELTA/YR | DELTA/YR/YR | UNITS | DESCRIPTION |
| aacccdpt | 262.340 | 1.043 | -0.003+/-0.001 | -0.118+/-0.132 | K | AC CCD TEMP (PRI) |
|---|---|---|---|---|---|---|
| aacccdrt | 306.168 | 1.083 | -0.003+/-0.001 | -0.116+/-0.139 | K | AC CCD TEMP (RDNT) |
| aach1t | 303.494 | 1.075 | -0.003+/-0.001 | -0.122+/-0.136 | K | AC HOUSING TEMP (ACH1) |
| aach2t | 303.545 | 1.077 | -0.003+/-0.001 | -0.112+/-0.136 | K | AC HOUSING TEMP (ACH2) |
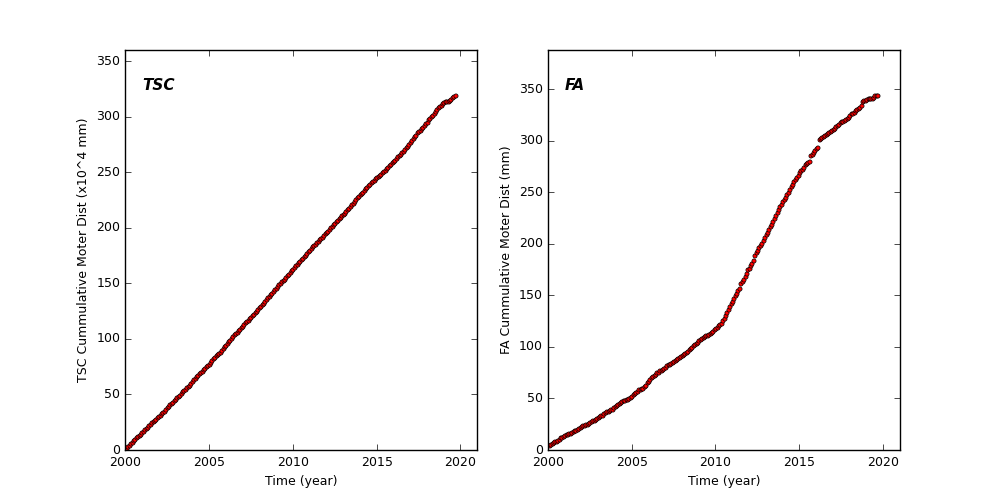
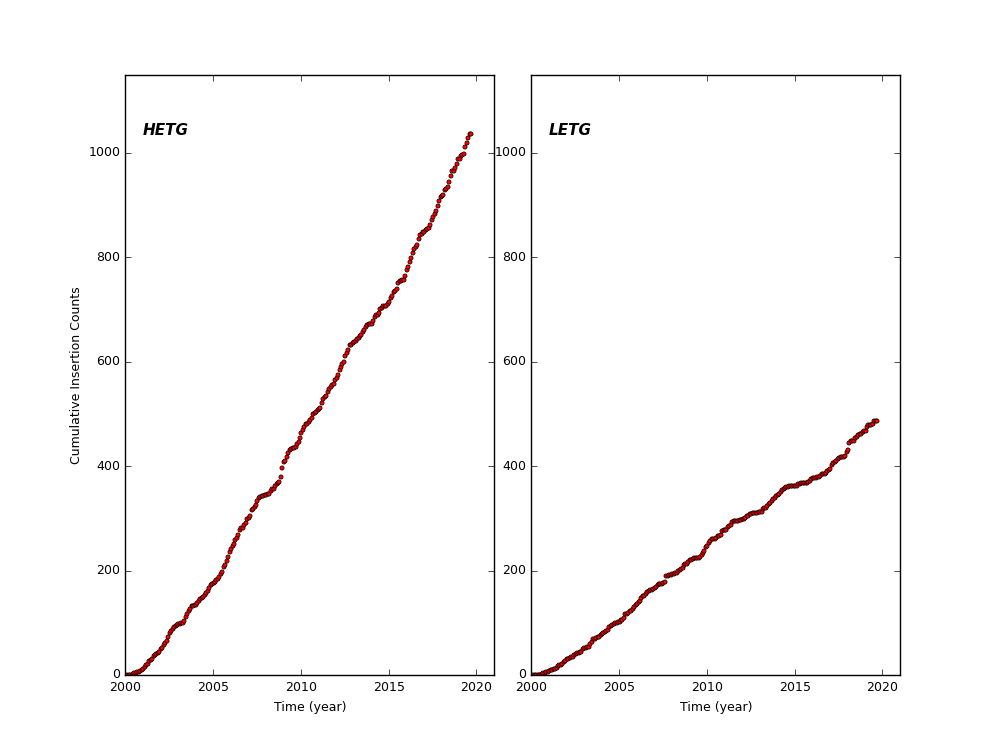
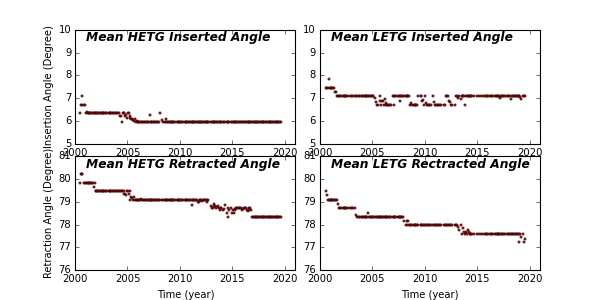
Spacecraft Motions
TSC and FA Cummulative Moter Distance
HETG and LETG Cummulative Insertion Counts
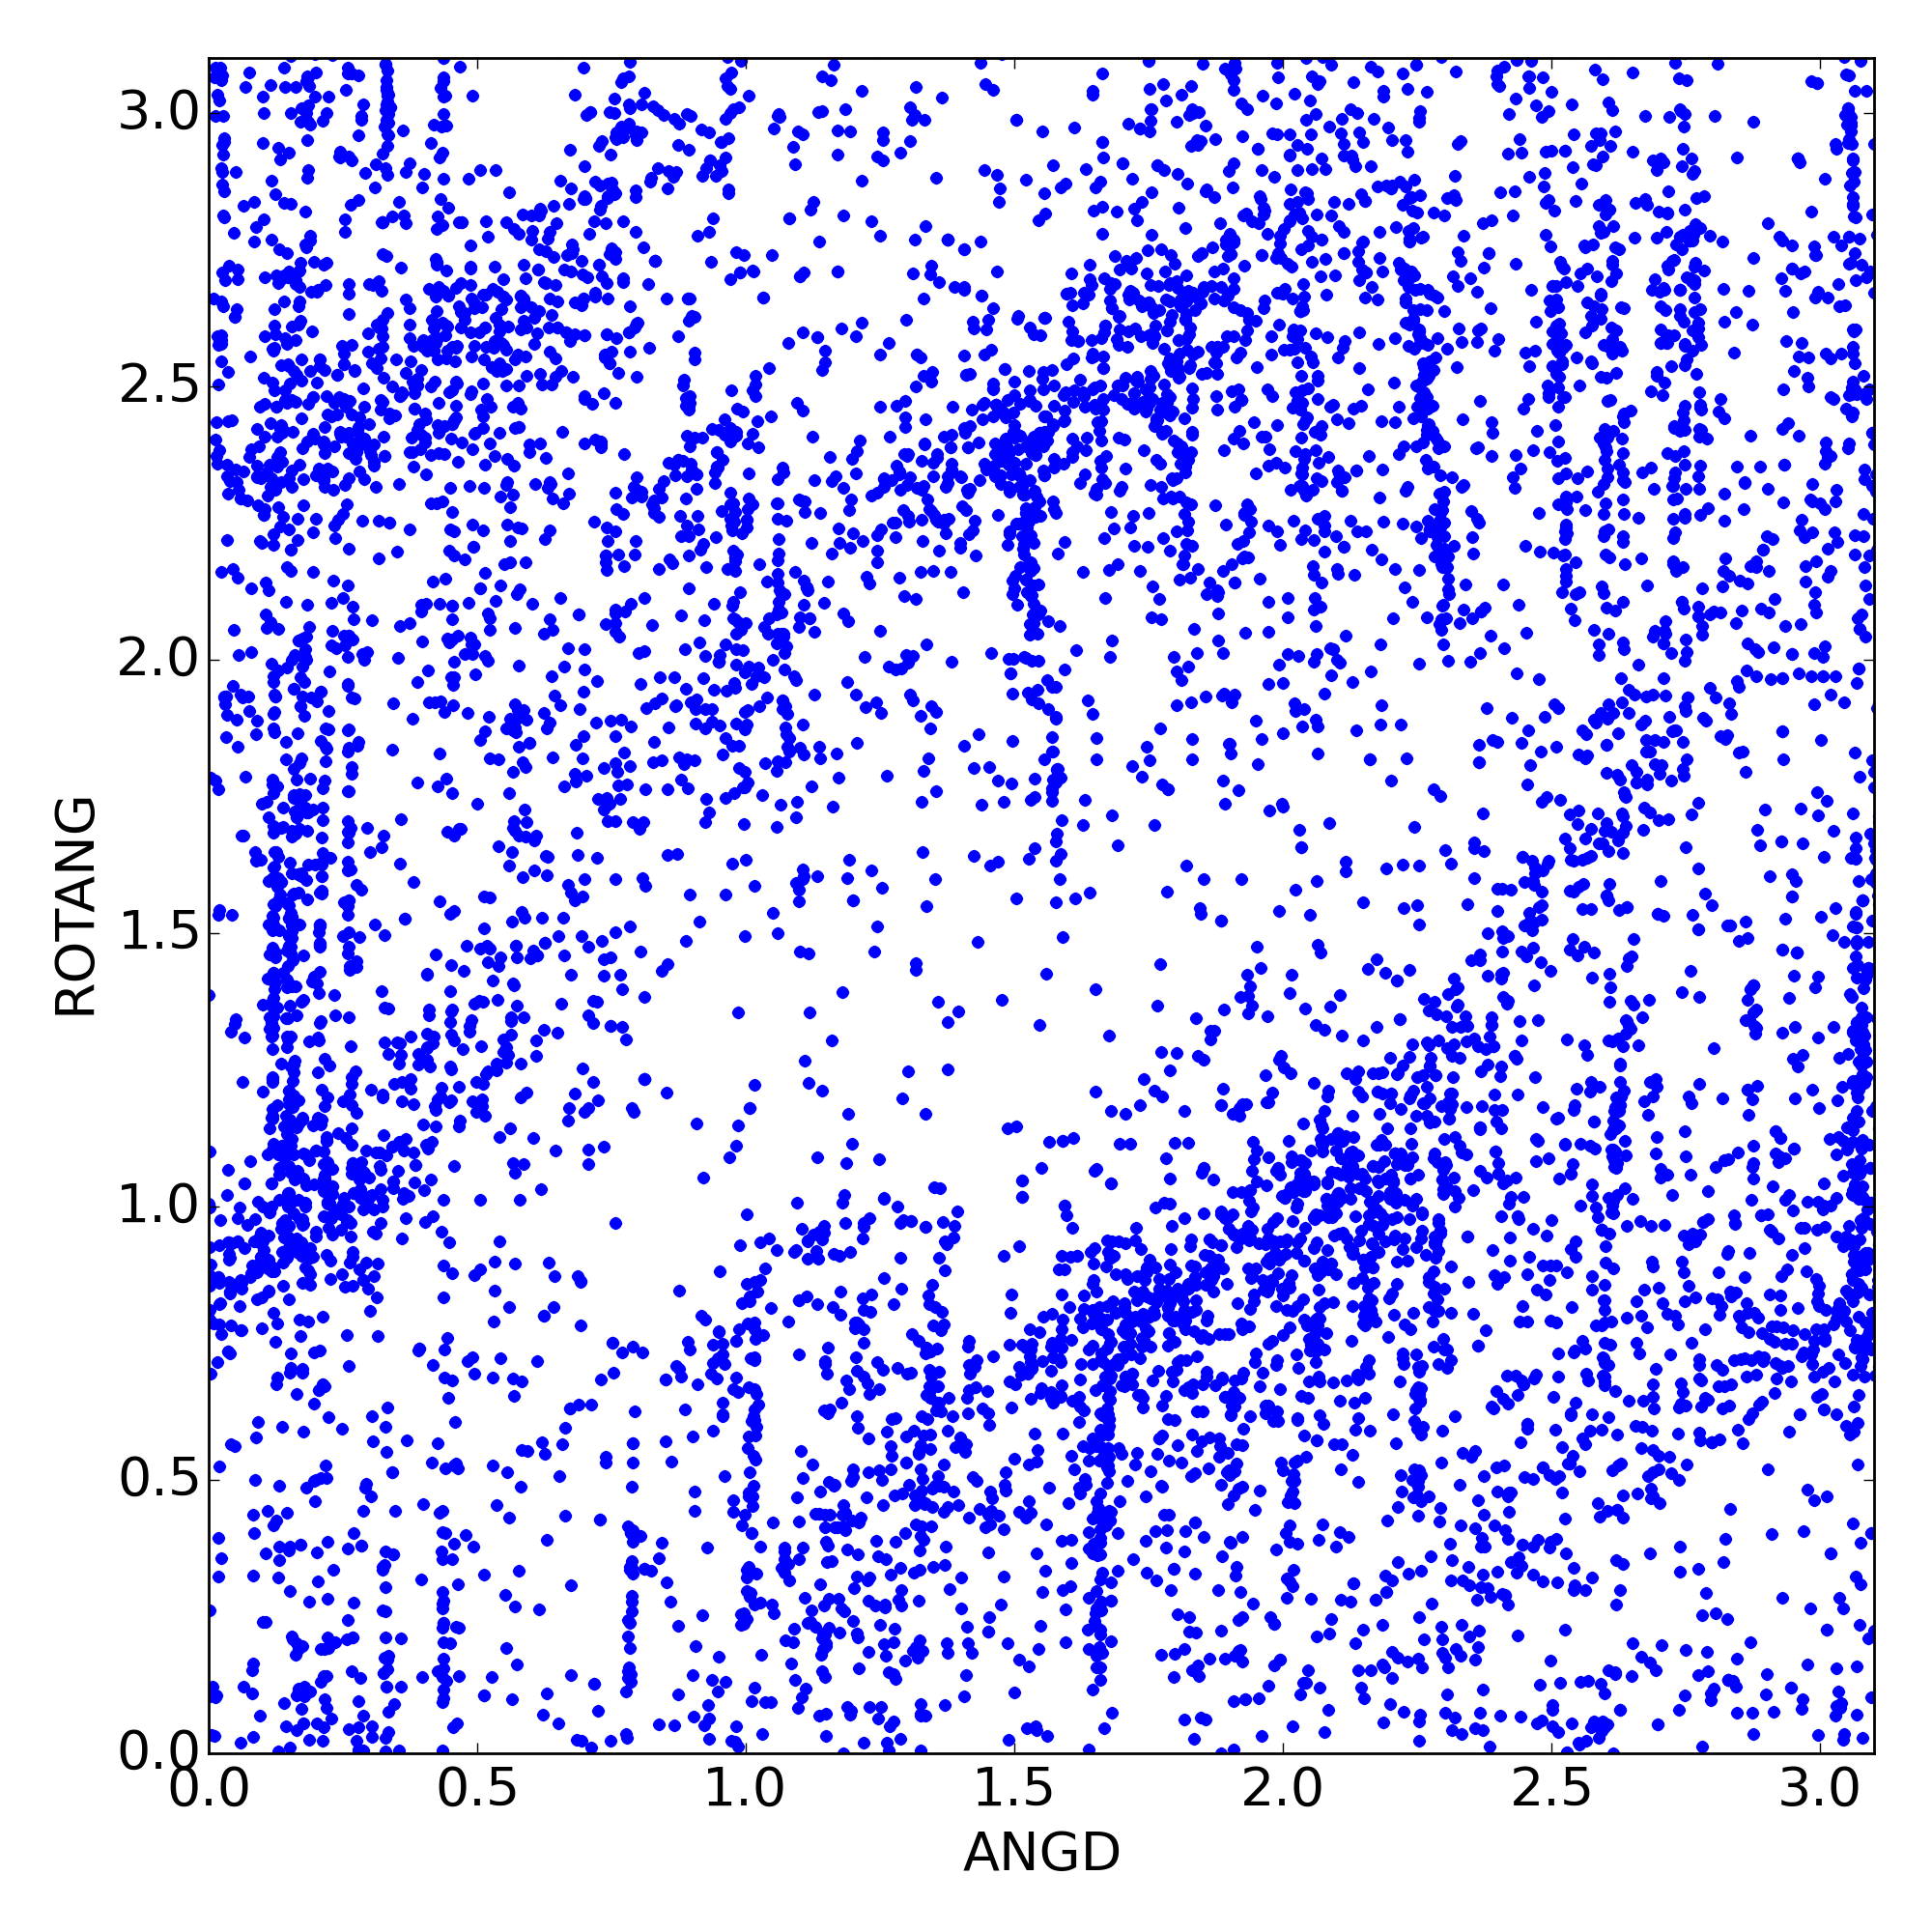
HETG/LETG Insertion/Retraction Angle
Reaction Wheel Rotations