ACIS
ACIS DOSE Registered-Photon-Map
The steps we took to compute the dose map are;
- Level 1 Event files for a specified month are obtained from archive.
- Image data including I2, I3, S2, S3 CCDs are extracted from all event files.
- All the extracted image data were merged to create a month long exposure map for the month.
- The exposure map is opened with ds9, and check a distribution of count rates against energy. From this, estimate the upper threshold value. Any events beyond this upper threshold are assumed erroneous events such as bad pixels.
- Using this upper threshold, the data is filtered, and create a cleaned exposure map for the month.
- The exposure map from each month from the Sep 1999 is added up to create a cumulative exposure map for each month.
- Using fimgstatistic, we compute count rate statistics for each CCDs.
- For observations with high data drop rates (e.g., Crab nebula, Cas A), we corrected the observations by adding events.
Please check more detail plots at Telemetered Photon Dose Trend page.
)
)
)
Statistics:
# IMAGE     NPIX     MEAN        RMS        MIN     MAX
ACIS_jun19 6004901       8.136         38.589           0.0     6333


I2 node 0  262654	7.586217	3.432581	0.0	 44.0
I2 node 1  262654	7.894721	4.233917	0.0	1069.0
I2 node 2  262654	7.849002	3.438874	0.0	 86.0
I2 node 3  262654	7.652572	3.571533	0.0	 47.0

I3 node 0  262654	8.506954	3.704120	0.0	 72.0
I3 node 1  262654	8.967401	6.141934	0.0	2125.0
I3 node 2  262654	8.120224	3.451318	0.0	 88.0
I3 node 3  262654	8.174600	3.544314	0.0	112.0

S2 node 0  262654	9.271174	14.078034	0.0	3271.0
S2 node 1  262654	10.197600	16.978718	0.0	895.0
S2 node 2  262654	11.961853	29.585687	0.0	6333.0
S2 node 3  262654	11.729619	26.685461	0.0	6203.0

S3 node 0  262654	22.930798	159.768865	0.0	6207.0
S3 node 1  262654	14.571148	26.859934	0.0	1262.0
S3 node 2  262654	14.461569	30.228616	0.0	479.0
S3 node 3  262654	13.165955	28.672267	0.0	623.0
)
)
)
Statistics:
 IMAGE     NPIX      MEAN        RMS           MIN      MAX
ACIS_total   6004901       2306.916         2981.939           0.0   129390


I2 node 0  262654	1997.622775	397.194734	426.0	11483.0
I2 node 1  262654	2102.039434	555.142626	438.0	92445.0
I2 node 2  262654	2131.500183	451.470572	443.0	11543.0
I2 node 3  262654	2136.687055	551.714245	428.0	28582.0

I3 node 0  262654	2272.714725	560.876805	420.0	8922.0
I3 node 1  262654	2354.821742	1699.460640	445.0	55354.0
I3 node 2  262654	2077.730656	386.314214	420.0	11863.0
I3 node 3  262654	2068.993690	415.197984	373.0	32252.0

S2 node 0  262654	2687.068133	422.576117	1506.0	21897.0
S2 node 1  262654	2848.079886	636.259732	1665.0	15652.0
S2 node 2  262654	3148.115430	642.218493	2099.0	27785.0
S2 node 3  262654	3098.863960	493.595916	1855.0	58917.0

S3 node 0  262654	4740.956633	2171.853015	2088.0	29067.0
S3 node 1  262654	5985.906532	2265.615575	0.0	29484.0
S3 node 2  262654	4742.600896	1260.035880	2042.0	25367.0
S3 node 3  262654	3659.580987	660.933868	2248.0	24888.0
)
|
)
|
)
|
)
|
| Mar 2019 | Dec 2018 | Sep 2018 | Jun 2018 |
|---|
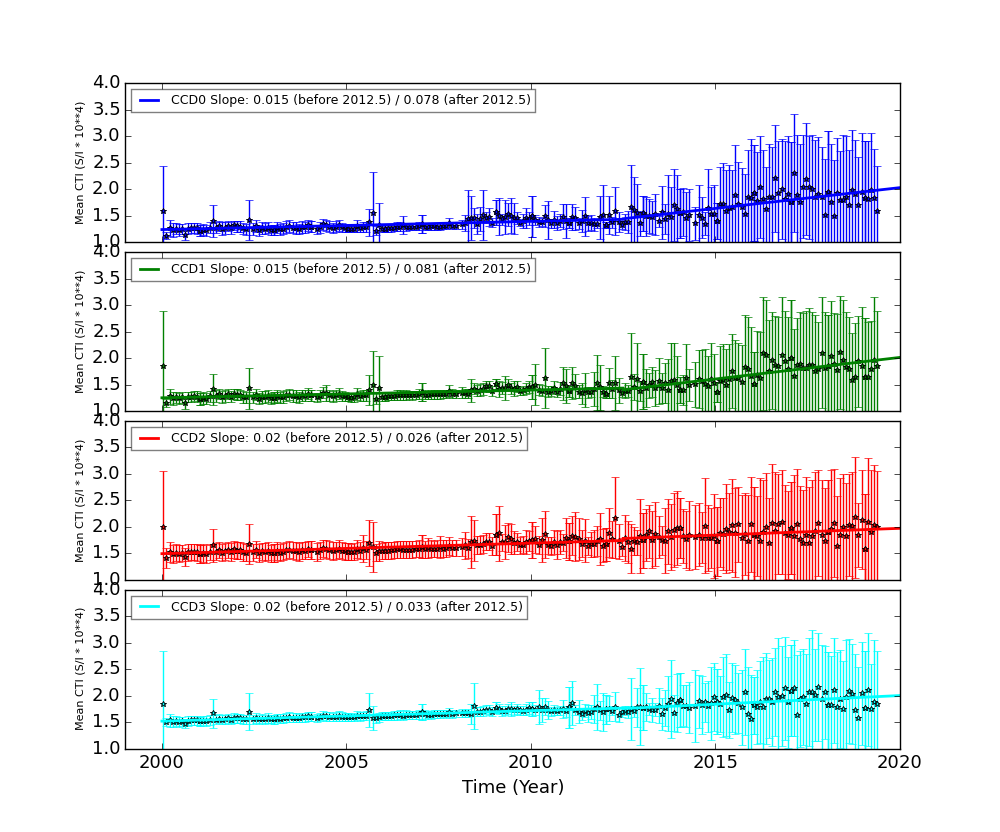
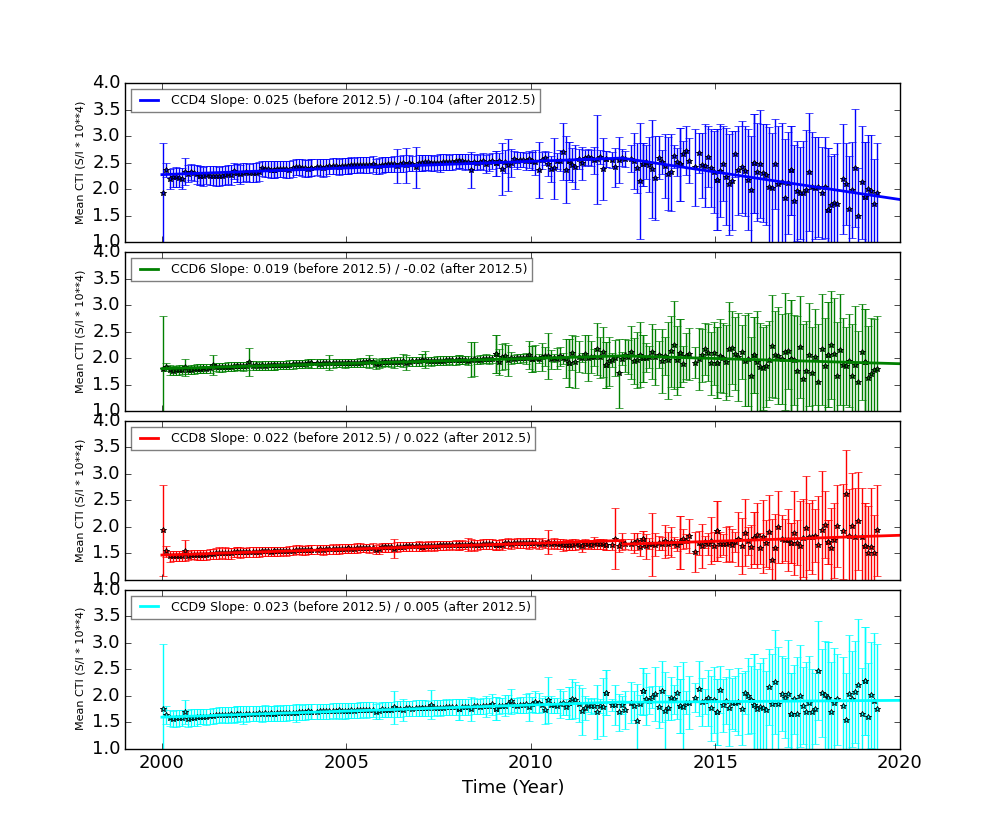
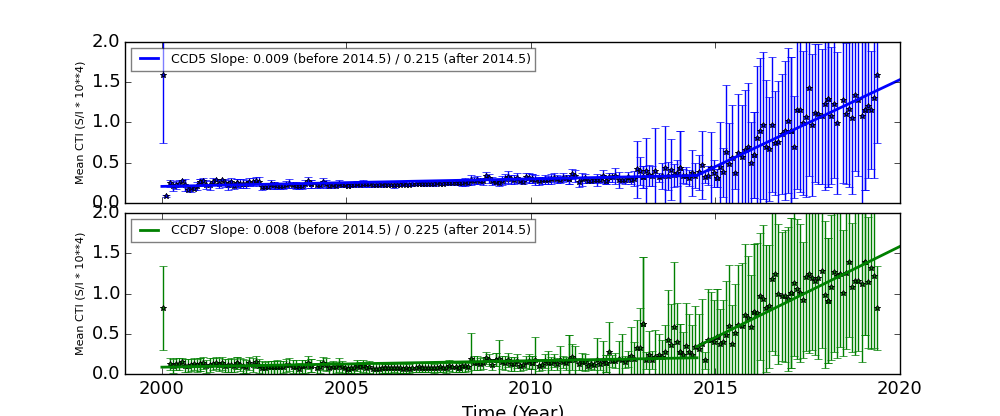
The Mean Detrended CTI
We report CTIs with a refined data definition. CTIs were computed for the temperature dependency corrected data. Please see CTI page for detailed explanation. CTI's are computed for Mn K alpha, and defined as slope/intercept x10^4 of row # vs ADU. Data file: here
Imaging CCDs
Spectral CCDs
Backside CCDs
Focal Plane Temperature
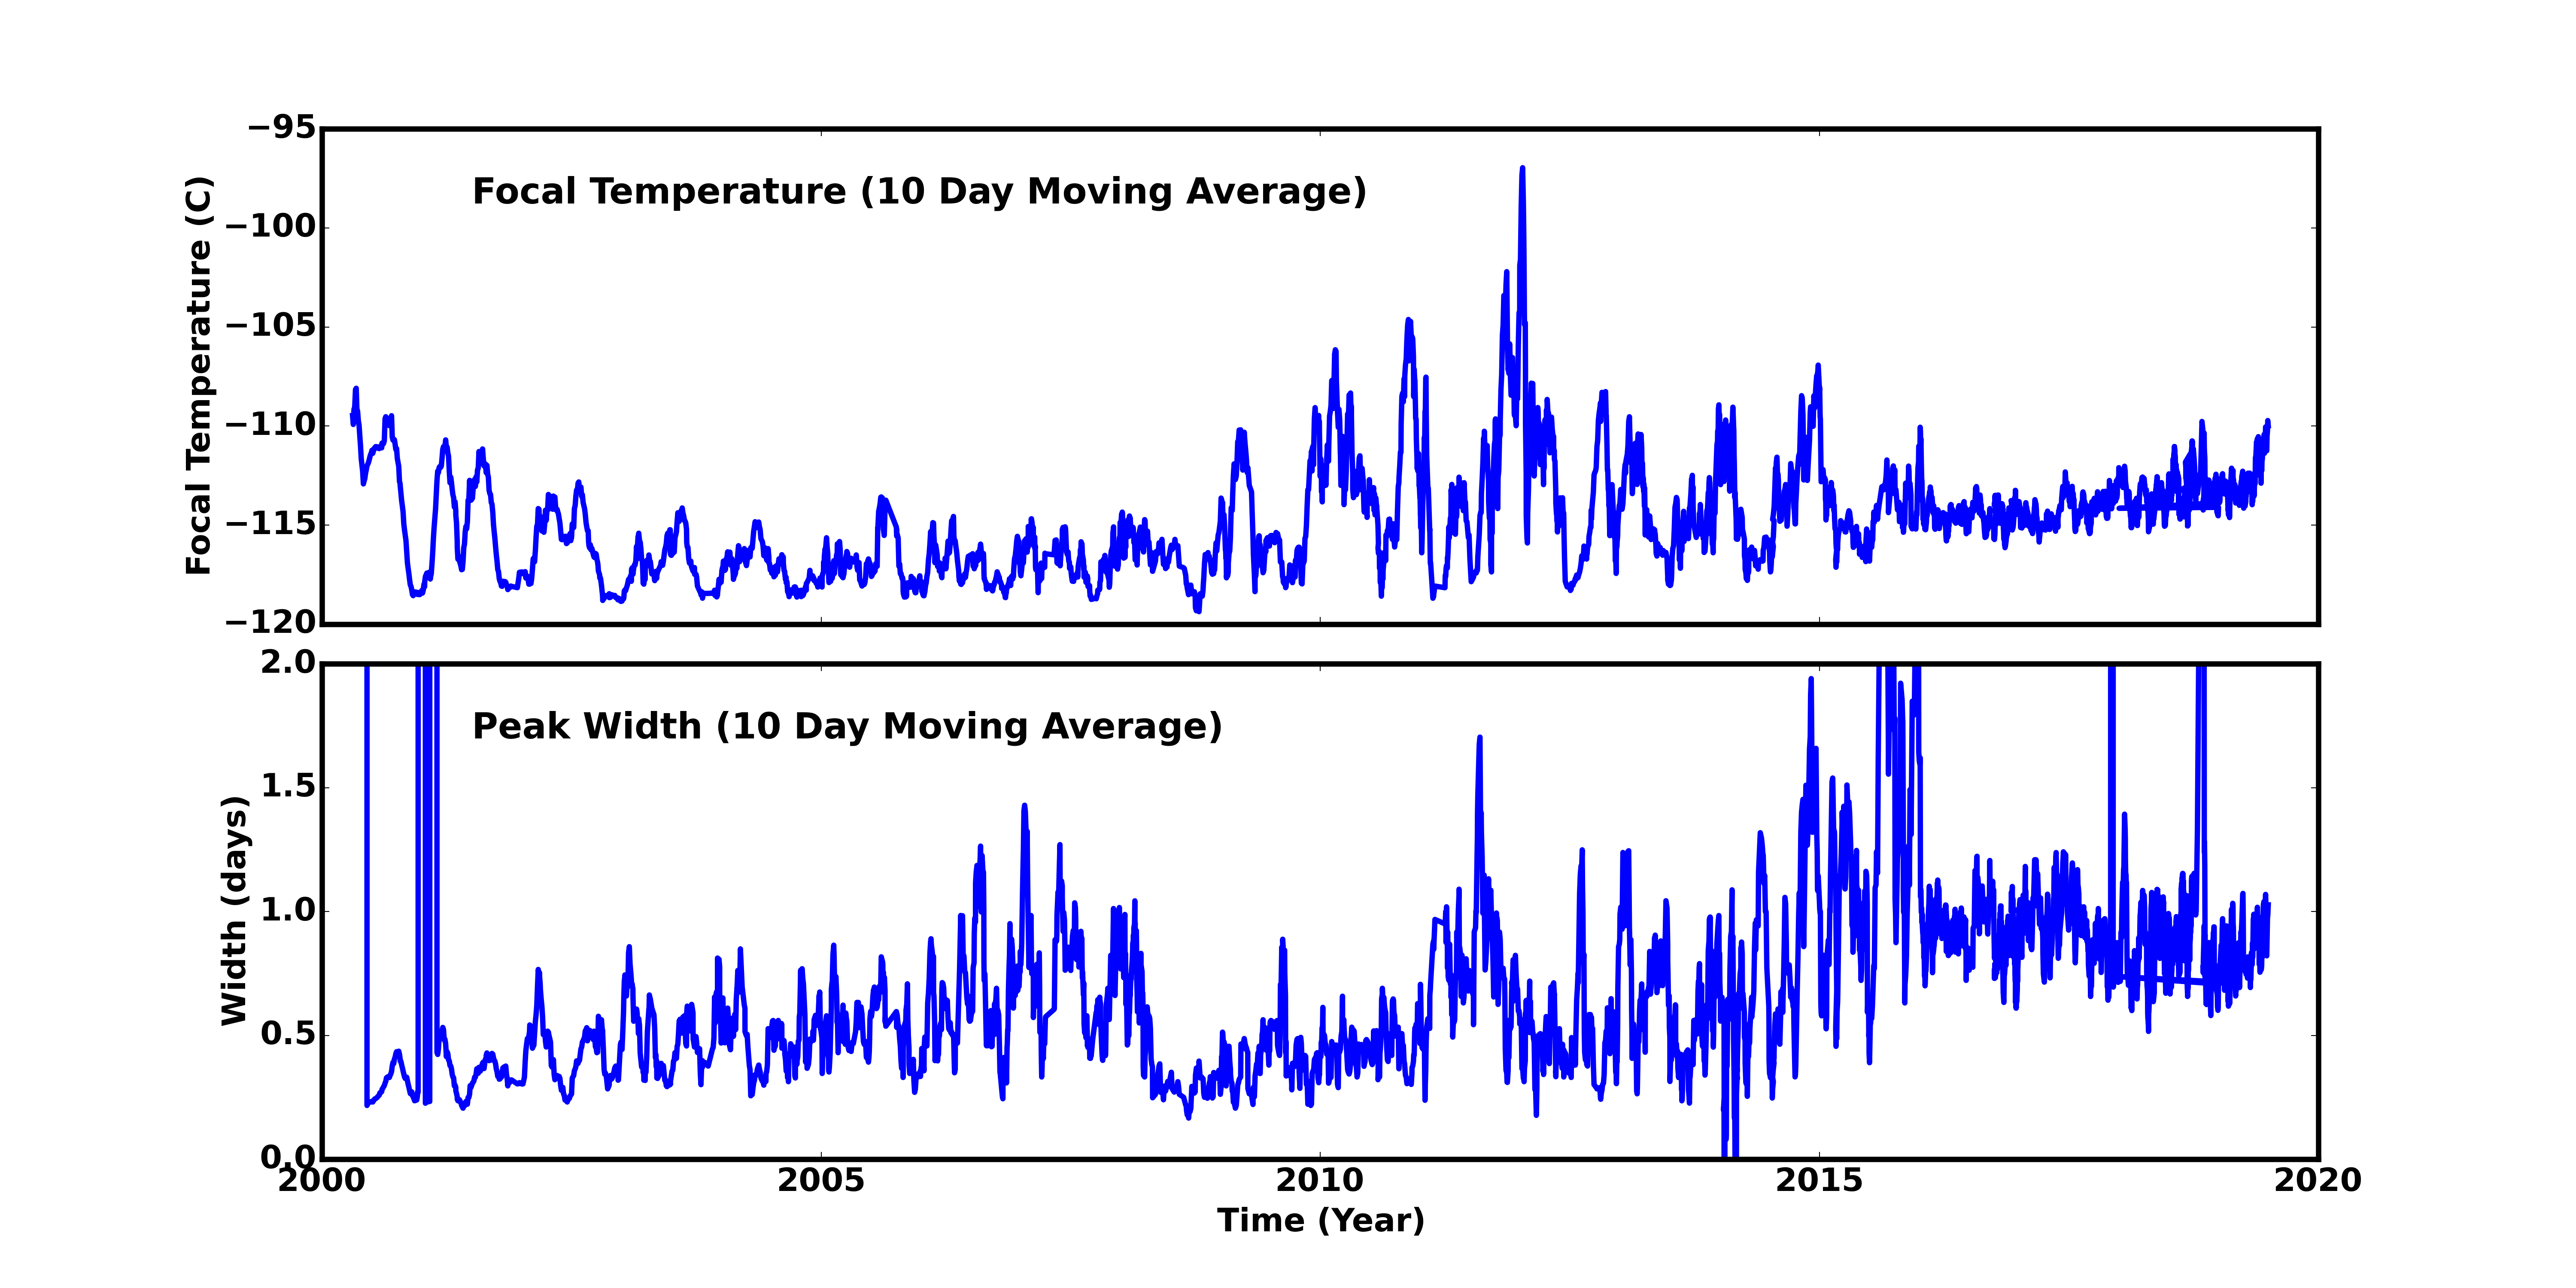
Jun 2019 Focal Temperature
| The Mean (max) FPT: | |
|---|---|
| -110.64 | +/- 3.65 C |
| Mean Width: | |
| 1.0 | +/- 0.38 days |
Averaged Focal Plane Temperature
We are using 10 period moving averages to show trends of peak temperatures and peak widths. Note, the gaps in the width plot are due to missing/corrupted data.
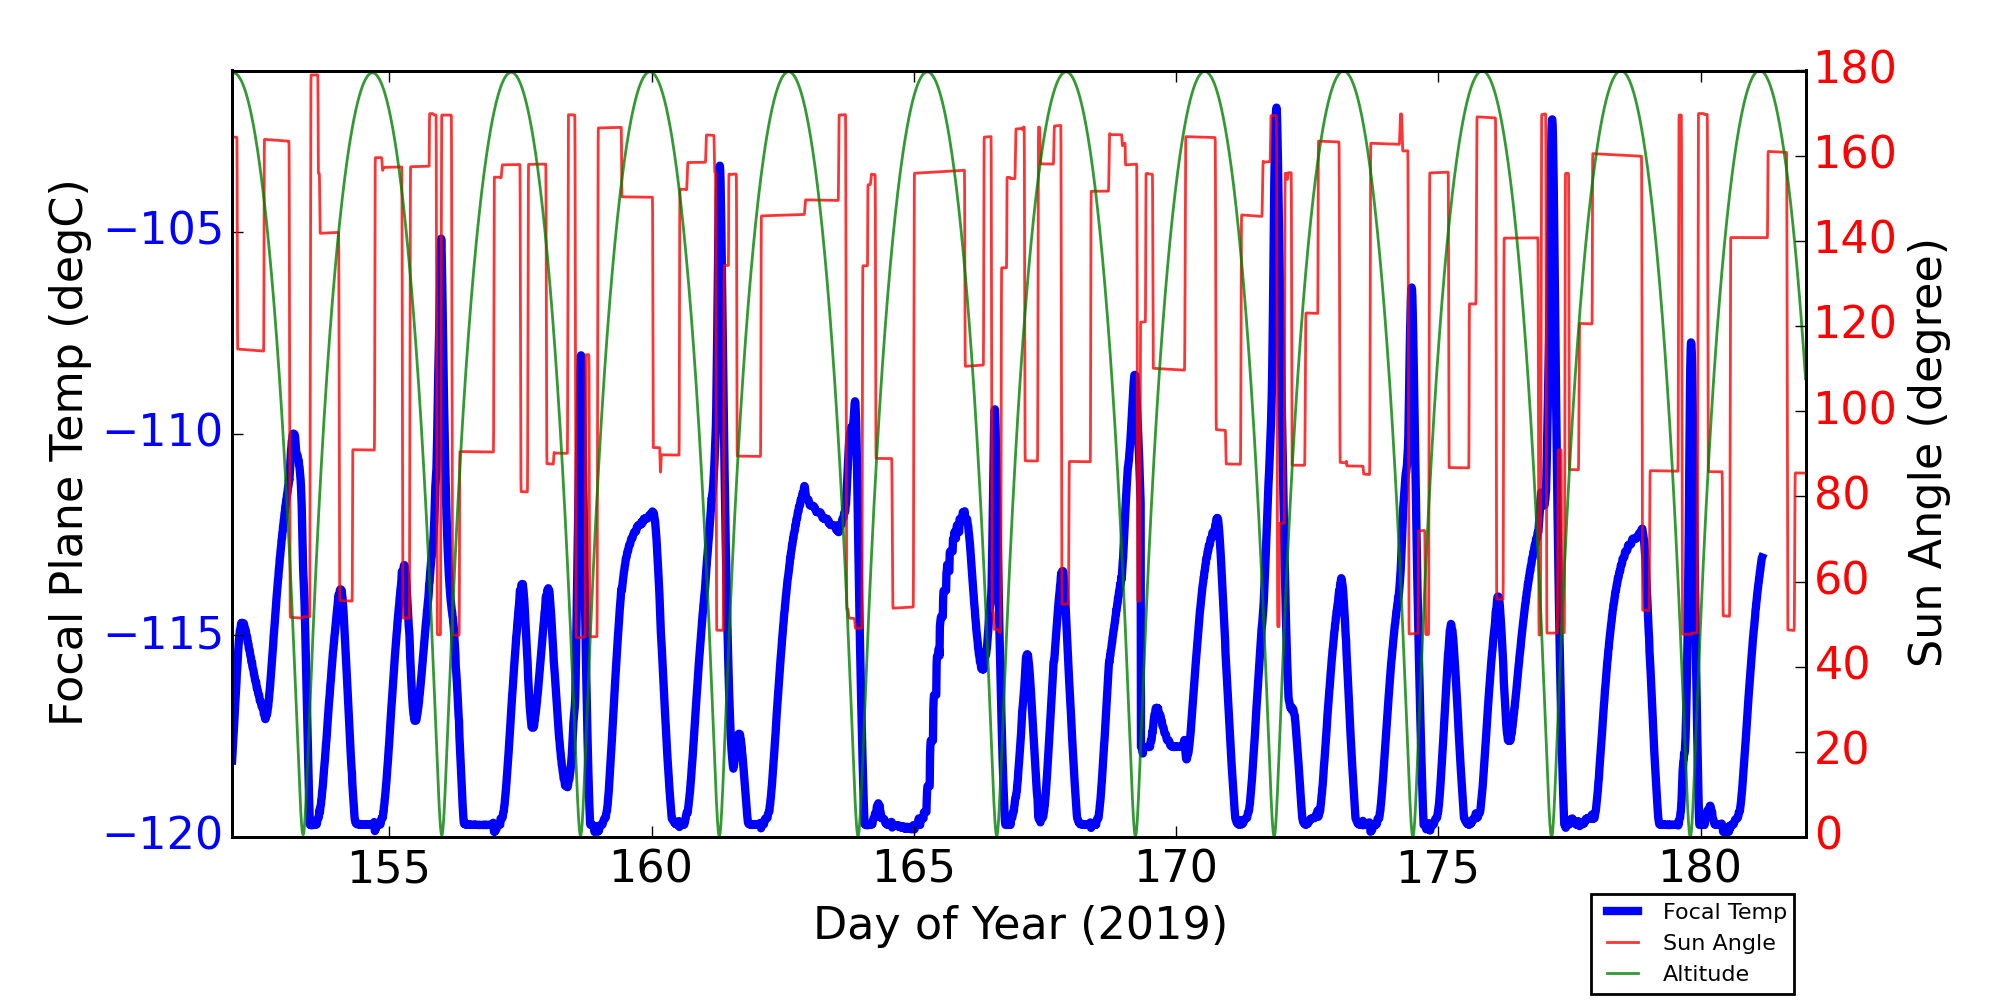
Focal Plane Temperature, Sun Angle and Altitude
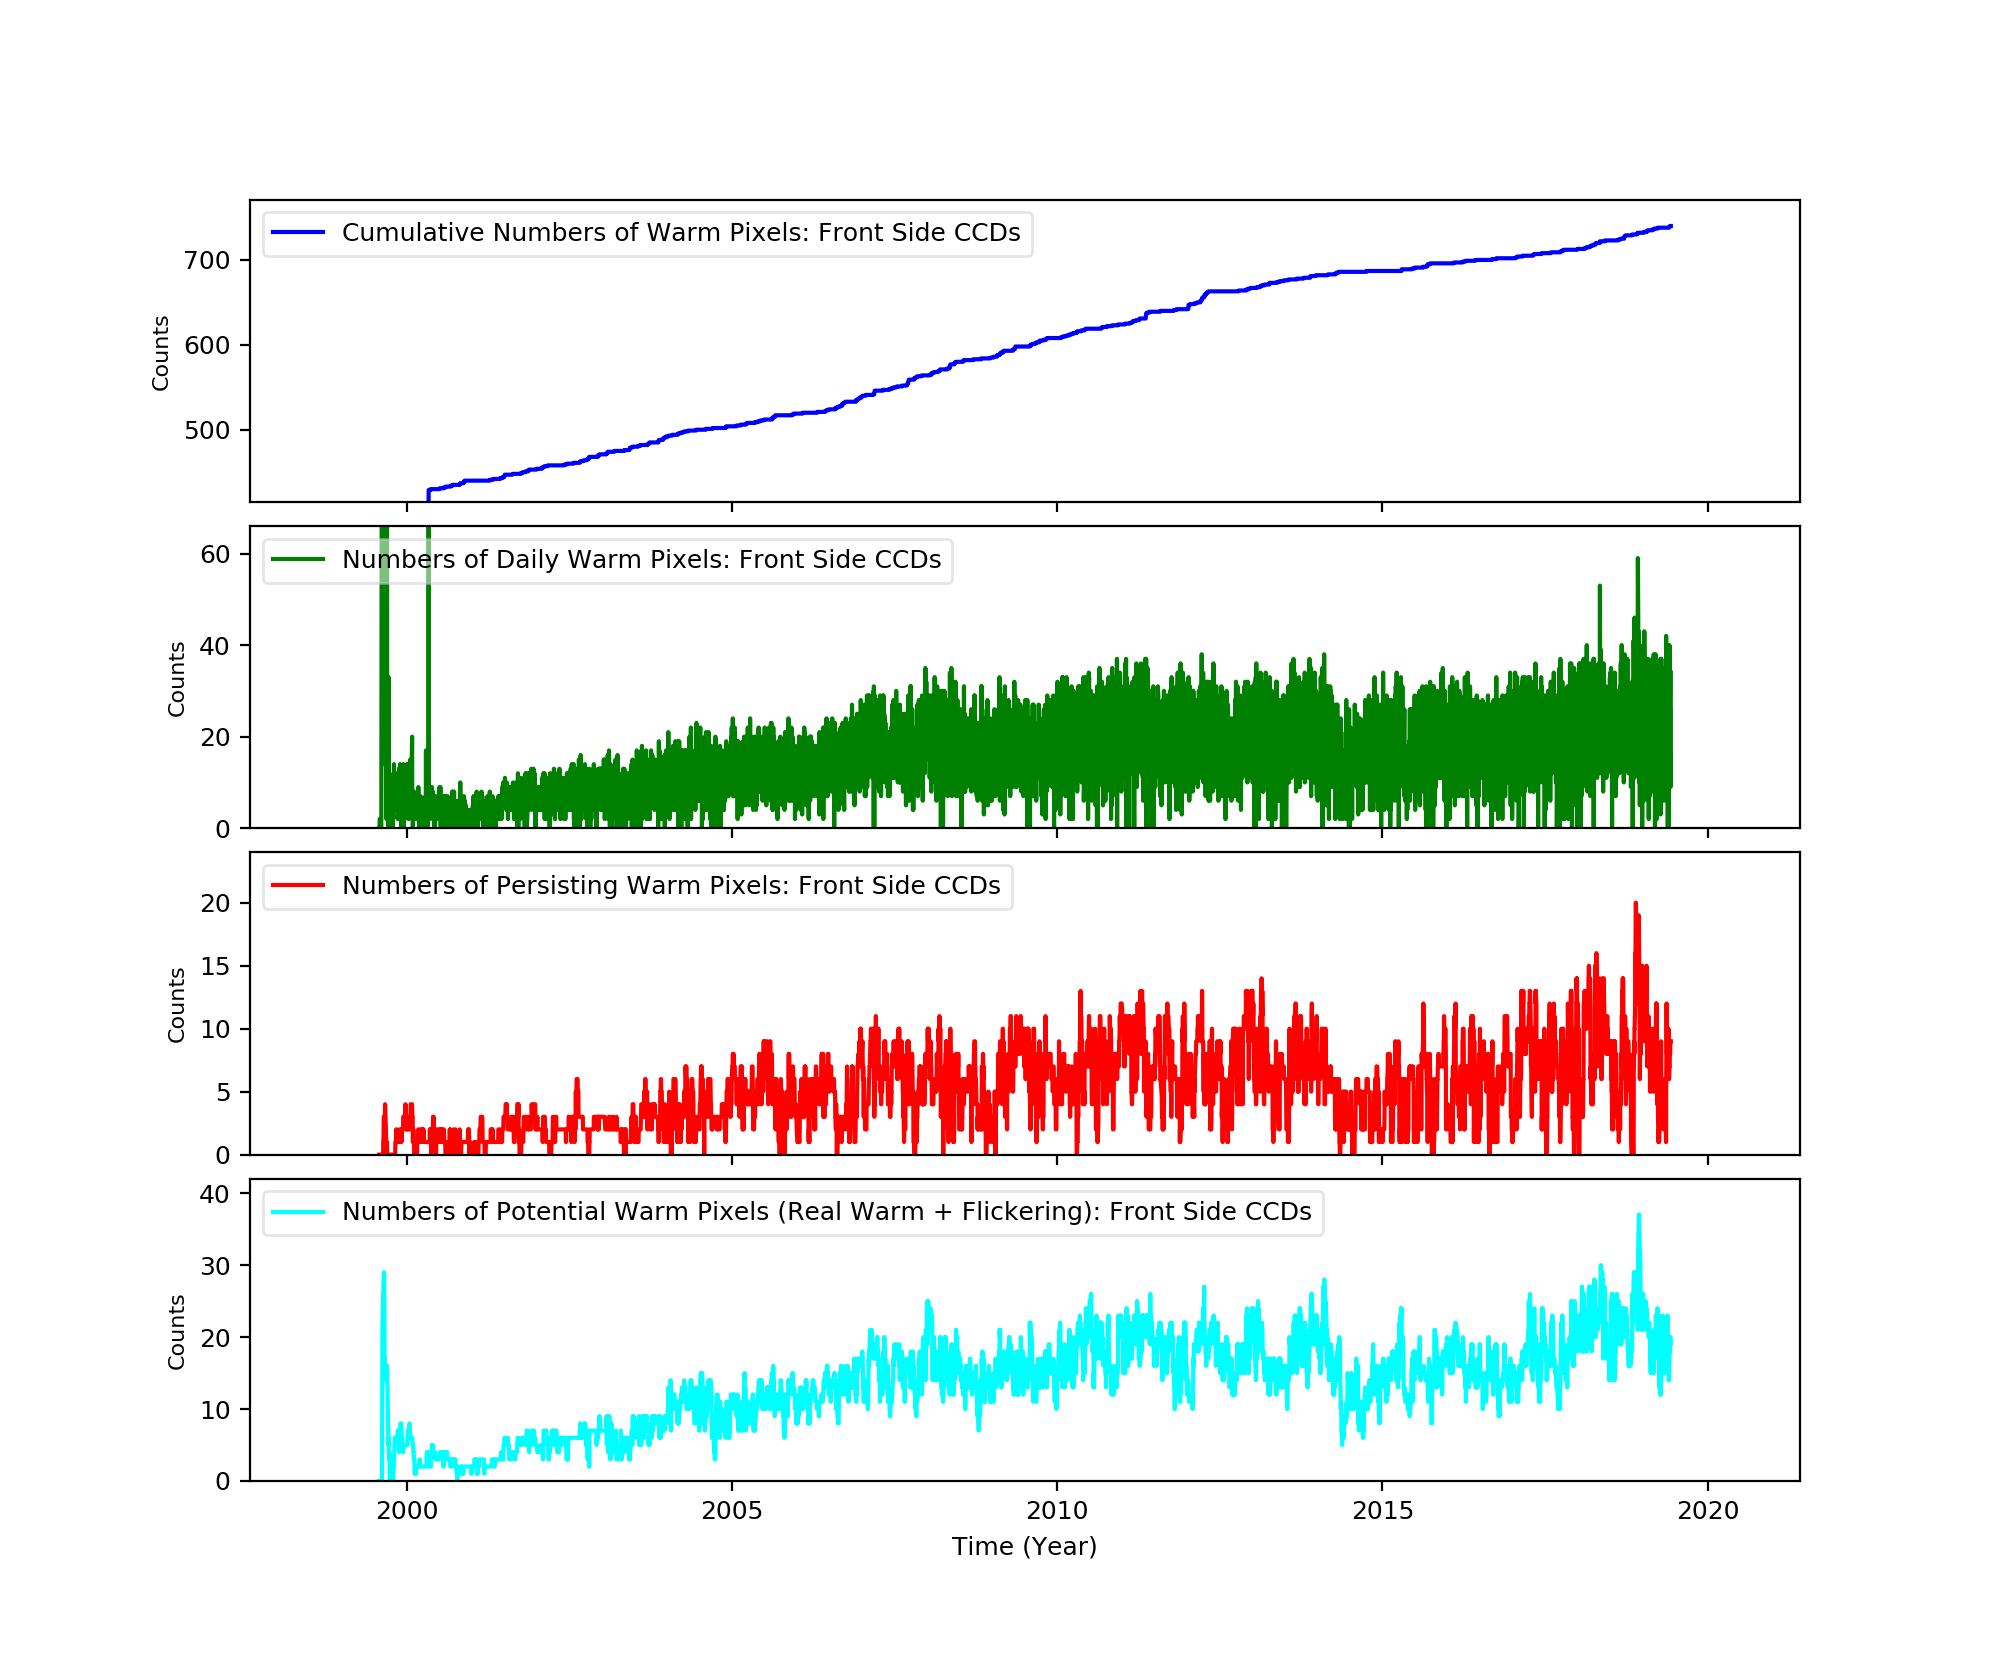
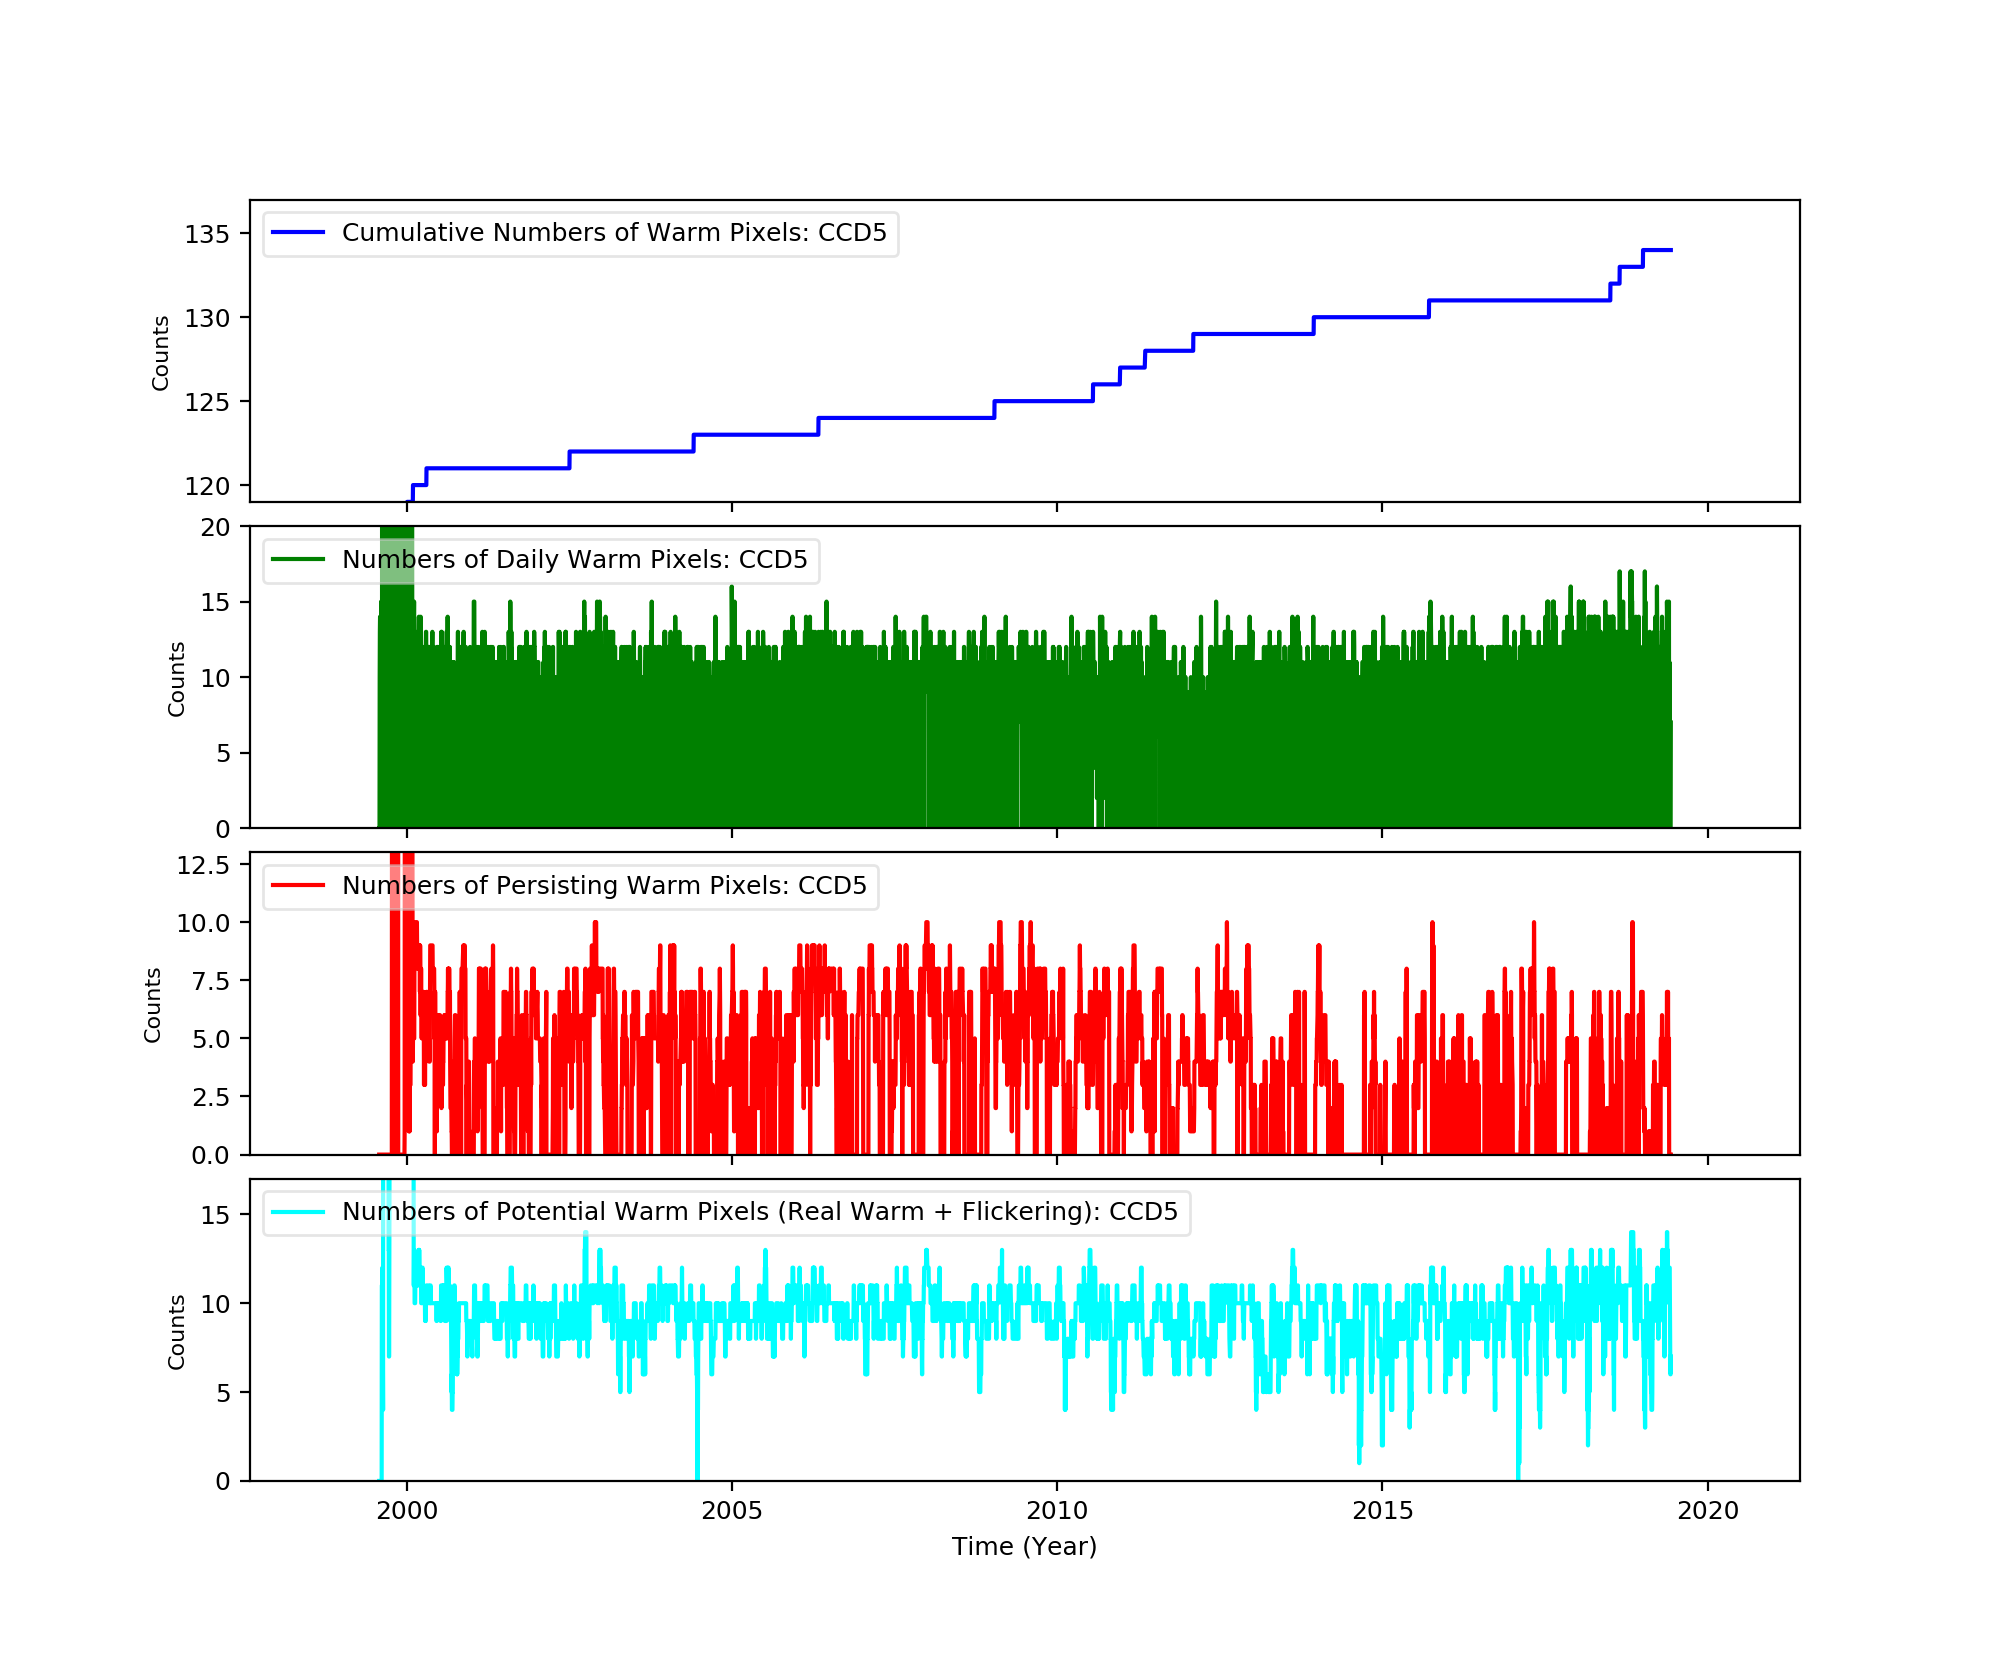
Bad Pixels
The plots below were generated with a new warm pixel finding script. Please see Acis Bad Pixel Page for details.
Front Side CCDs
Back Side CCD (CCD5)
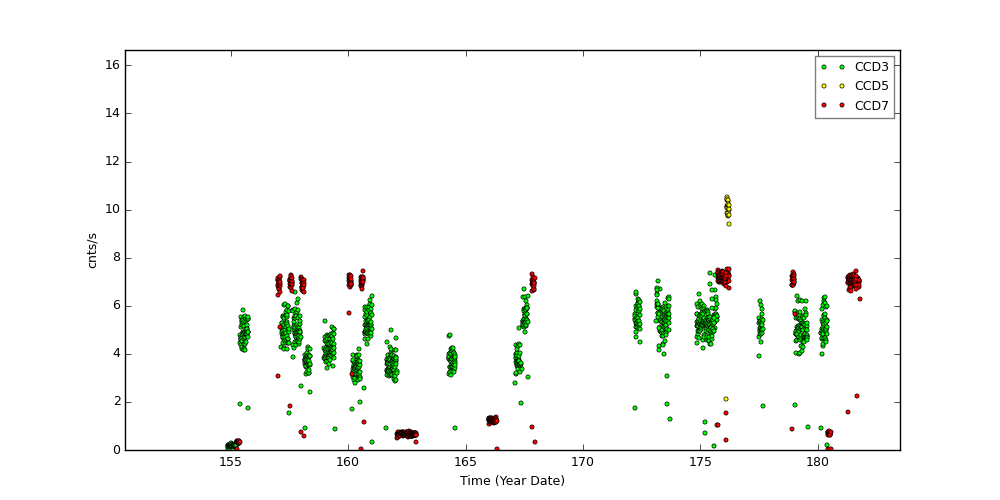
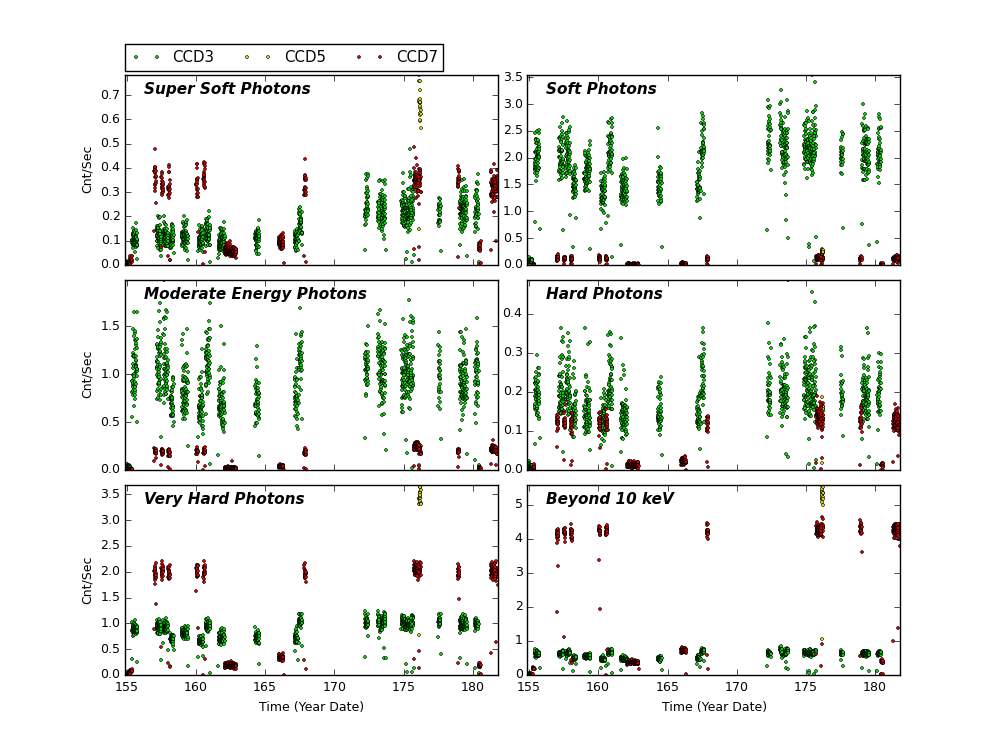
Science Instrument Background Rates
| Name | Low (keV) | High(KeV) | Description |
|---|---|---|---|
| SSoft | 0.00 | 0.50 | Super soft photons |
| Soft | 0.50 | 1.00 | Soft photons |
| Med | 1.00 | 3.00 | Moderate energy photons |
| Hard | 3.00 | 5.00 | Hard Photons |
| Harder | 5.00 | 10.00 | Very Hard photons |
| Hardest | 10.00 | Beyond 10 keV |
HRC
DOSE of Central 4K Pore-Pairs
Please refer to Maximum Dose Trends for more details.
No Data
)
IMAGE                       NPIX      MEAN    STDDEV      MIN       MAX
HRCI_08_1999_06_2019.fits  16777216	5.781 	5.793 	0.000 	303.000
)
|
|---|
IMAGE                NPIX      MEAN    STDDEV      MIN       MAX
HRCS_06_2019.fits  16777216	0.043 	0.217 	0.000 	5.000
)
IMAGE                       NPIX      MEAN    STDDEV      MIN       MAX
HRCS_08_1999_06_2019.fits  16777216	18.105 	32.935 	0.000 	1731.000
|
|
Max dose trend plots corrected for events that "pile-up"
in the center of the taps due to bad position information.
|
)
|
)
|
)
|
)
|
| Mar 2019 | Dec 2018 | Sep 2018 | Jun 2018 |
|---|
)
|
)
|
)
|
)
|
| Mar 2019 | Dec 2018 | Sep 2018 | Jun 2018 |
|---|
Gratings
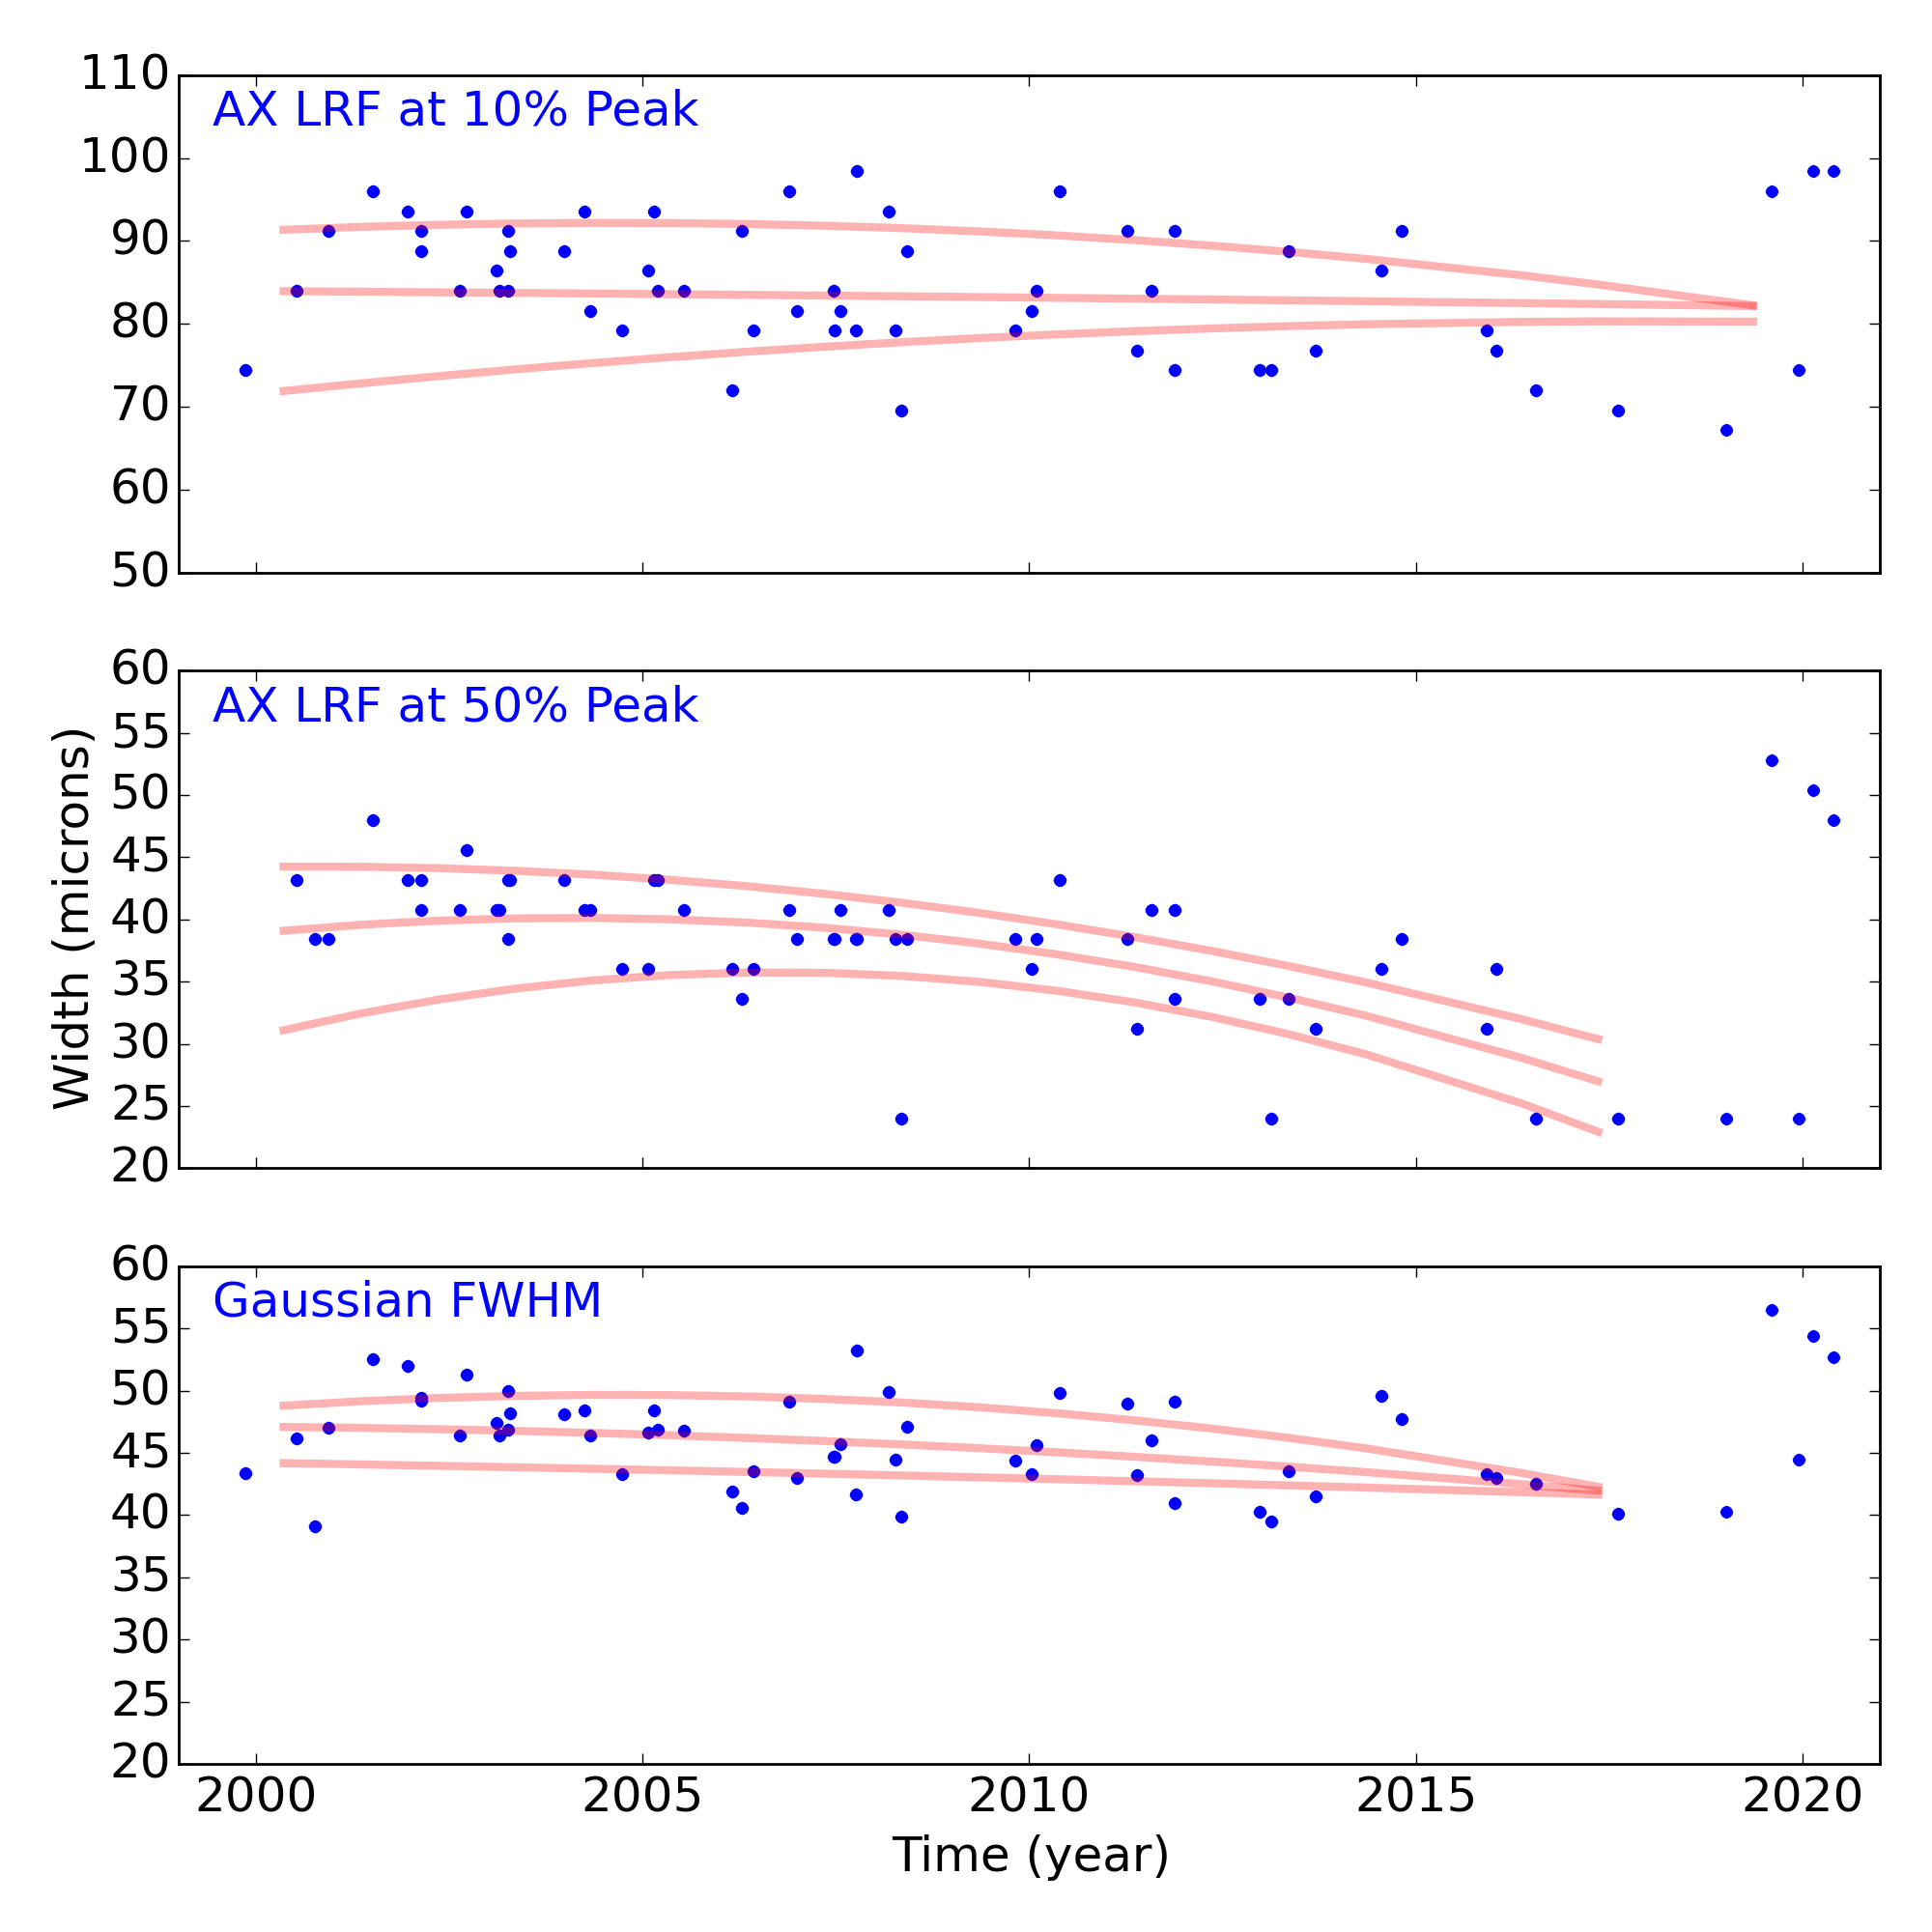
Grating Trends/Focus
We plot the width of the zero order streak of ACIS/HETG observations and the width of the zero order image for HRC/LETG observations of point sources. No significant defocusing trend is seen at this time. See Gratings Trends pages.

PCAD
ACA Trending
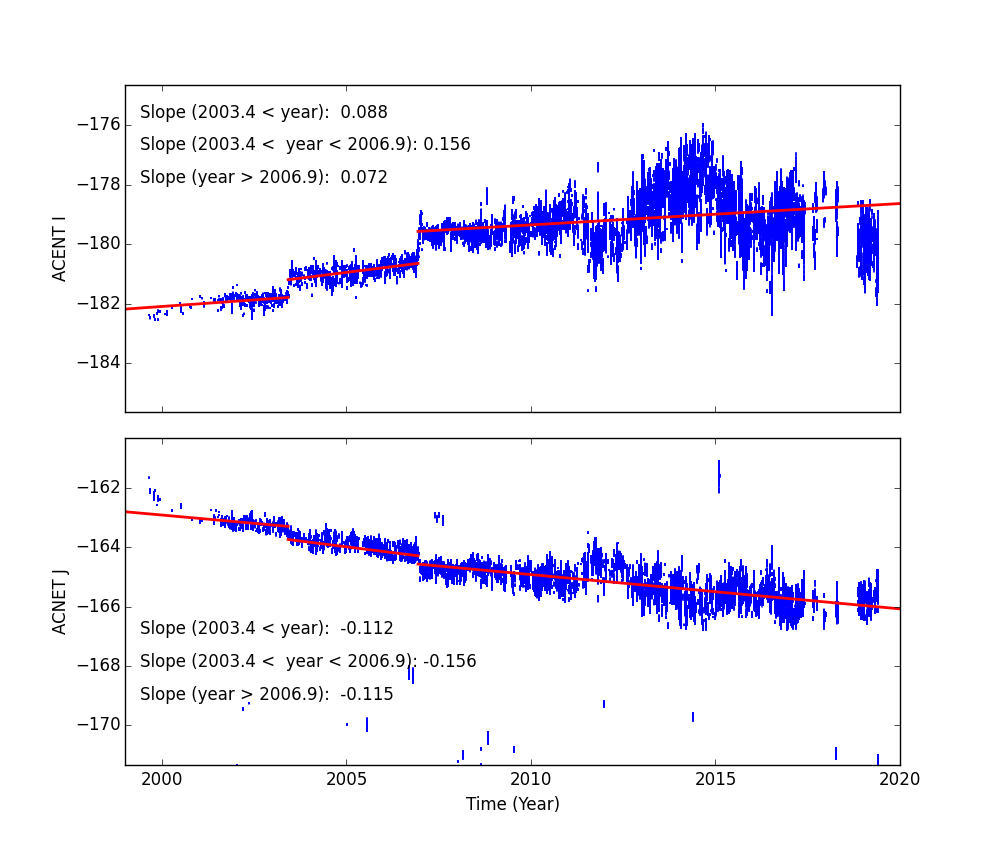
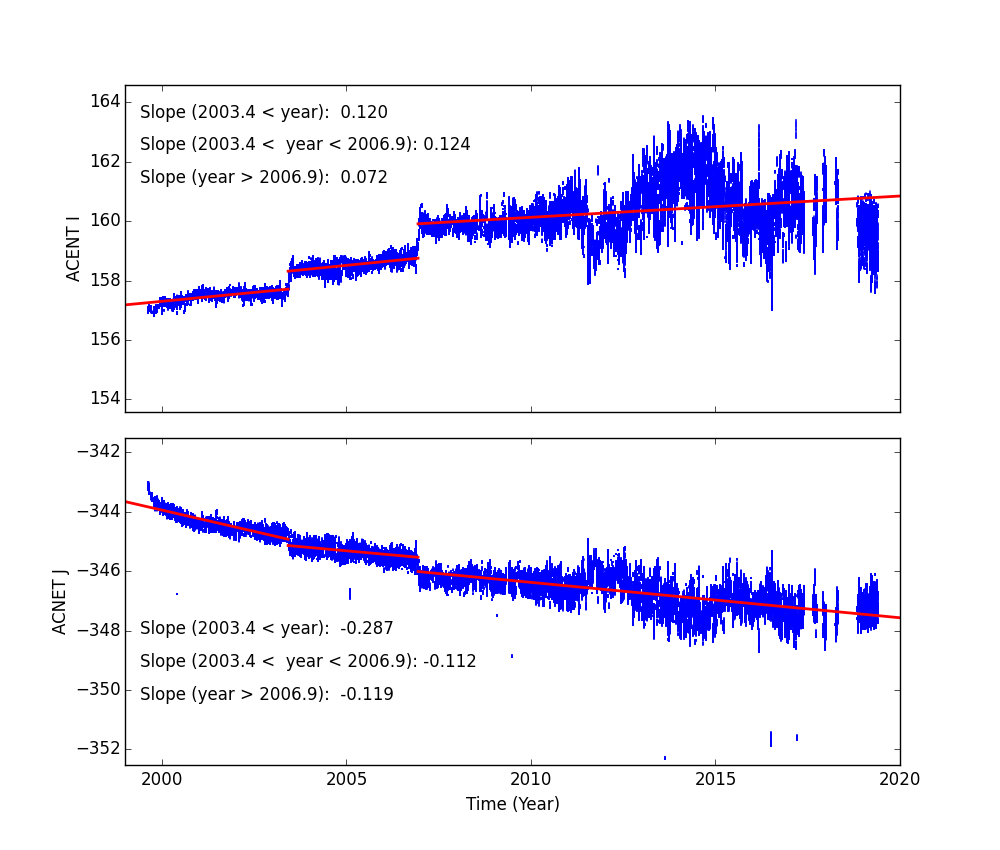
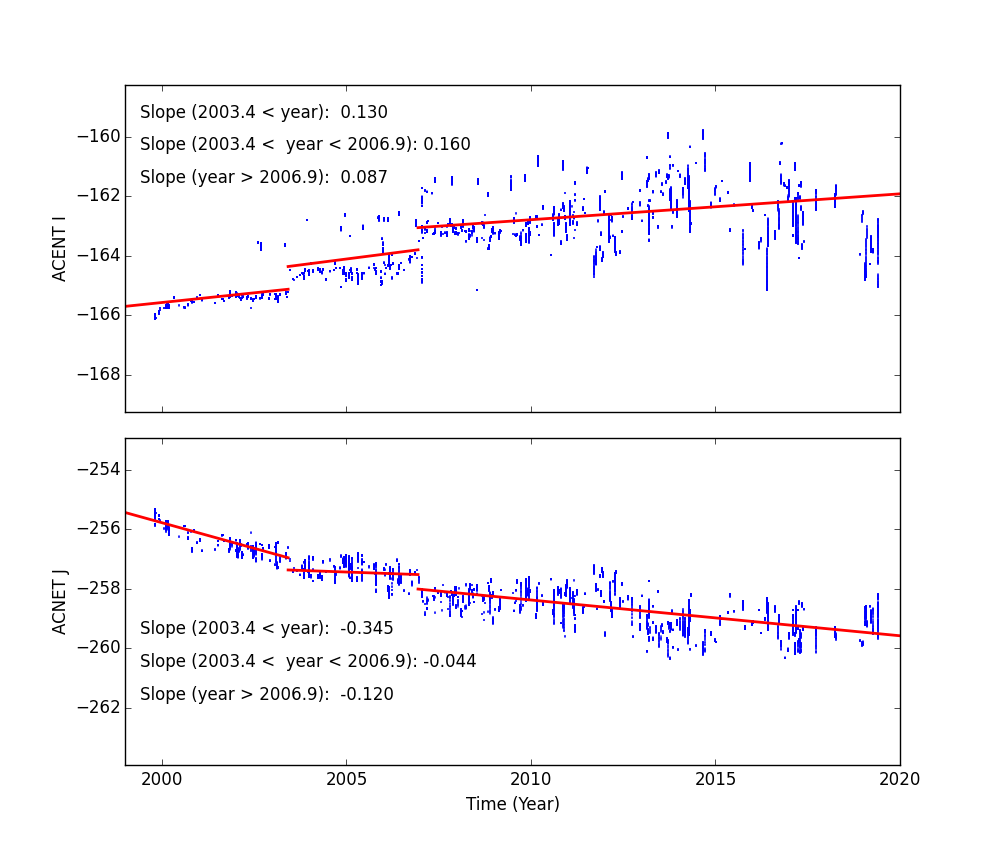
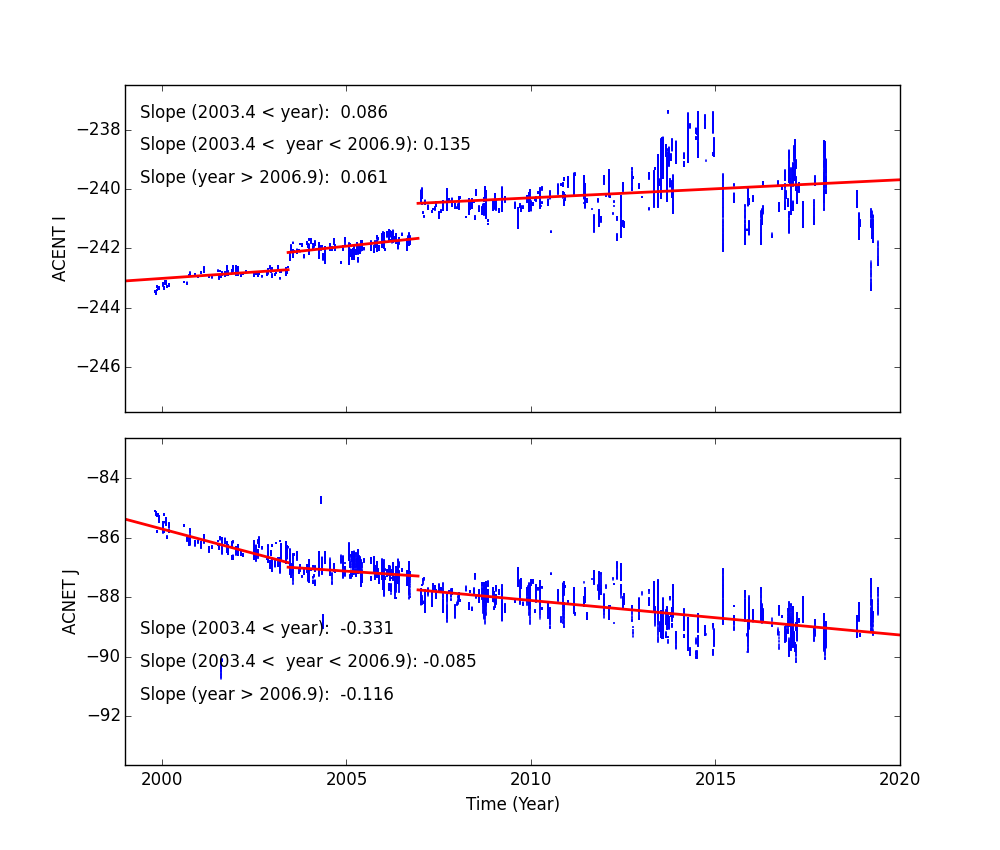
Fid Light Drift
Fid light positions on ACA drift with time. The drift trends of Fid light 2 with ACIS-I and ACIS-S configurations are shown below.
The top panel shows Fid light 2 drift in ACENT I (app. along with -Y axis), and the
bottom panel shows that in ACENT J (app. along with Z axis). The unit is a pixel, and
one pixel is approximately 0.5 arcsec. The slope listed at the top right corner is
the change in a position per year (arcsec/yr). The vertical line on DOM = 1411 (Jun 1, 2003)
indicates a transition date of use of IRU-1 to IRU-2.
See also Tom Aldcroft's updated page:
https://cxc.cfa.harvard.edu/mta/ASPECT/fid_drift
Fid 2 (ACIS-I)
Fid 2 (ACIS-S)
Fid 8 (HRC-I)
Fid 12 (HRC-S)
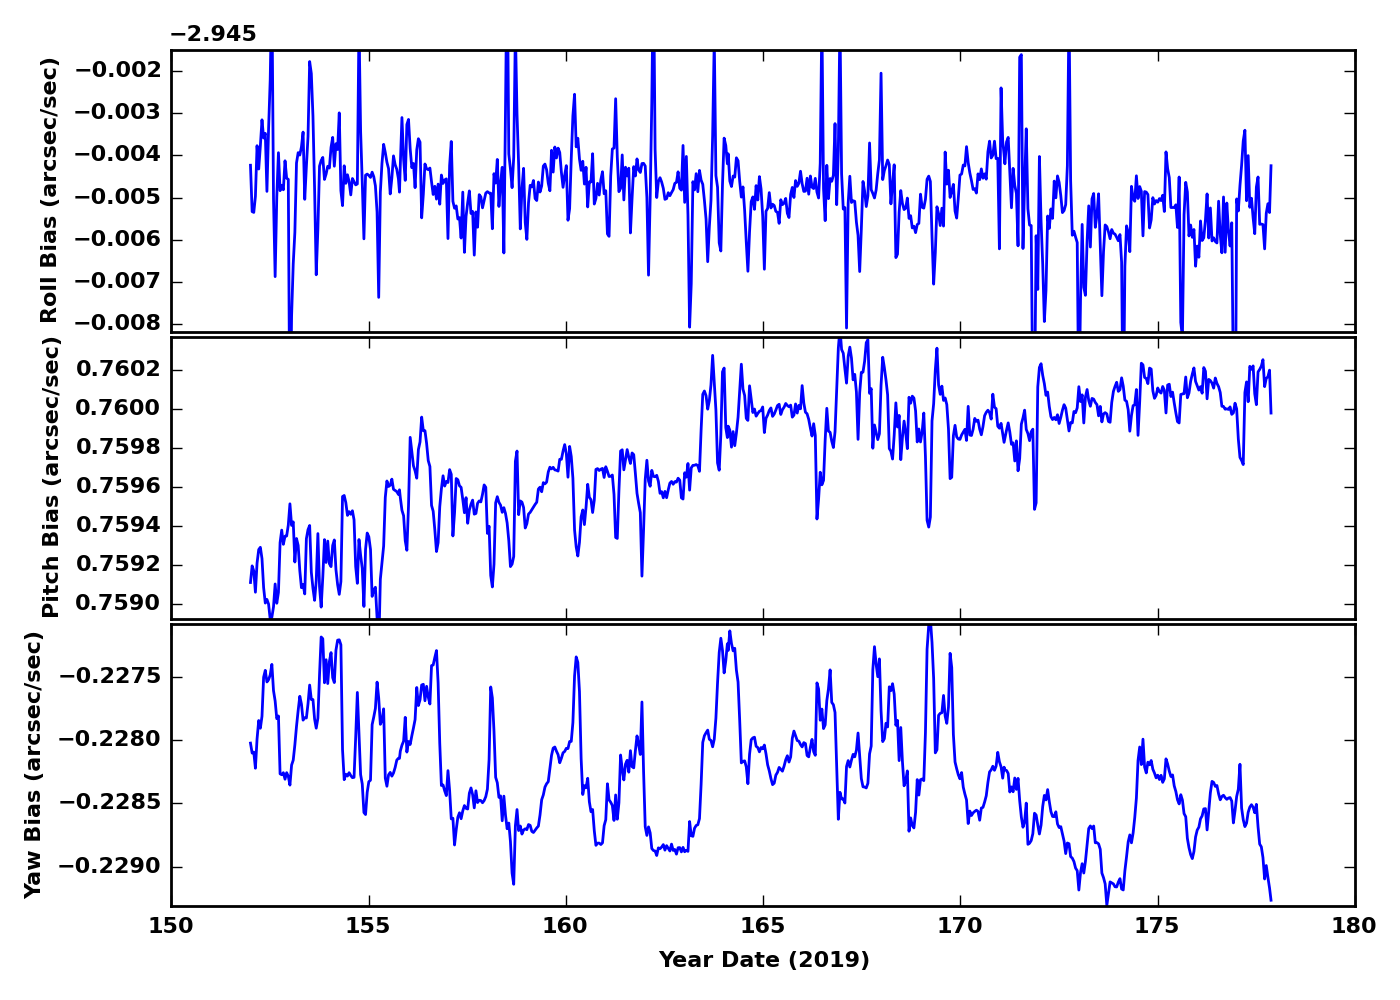
Gyro Bias Drift
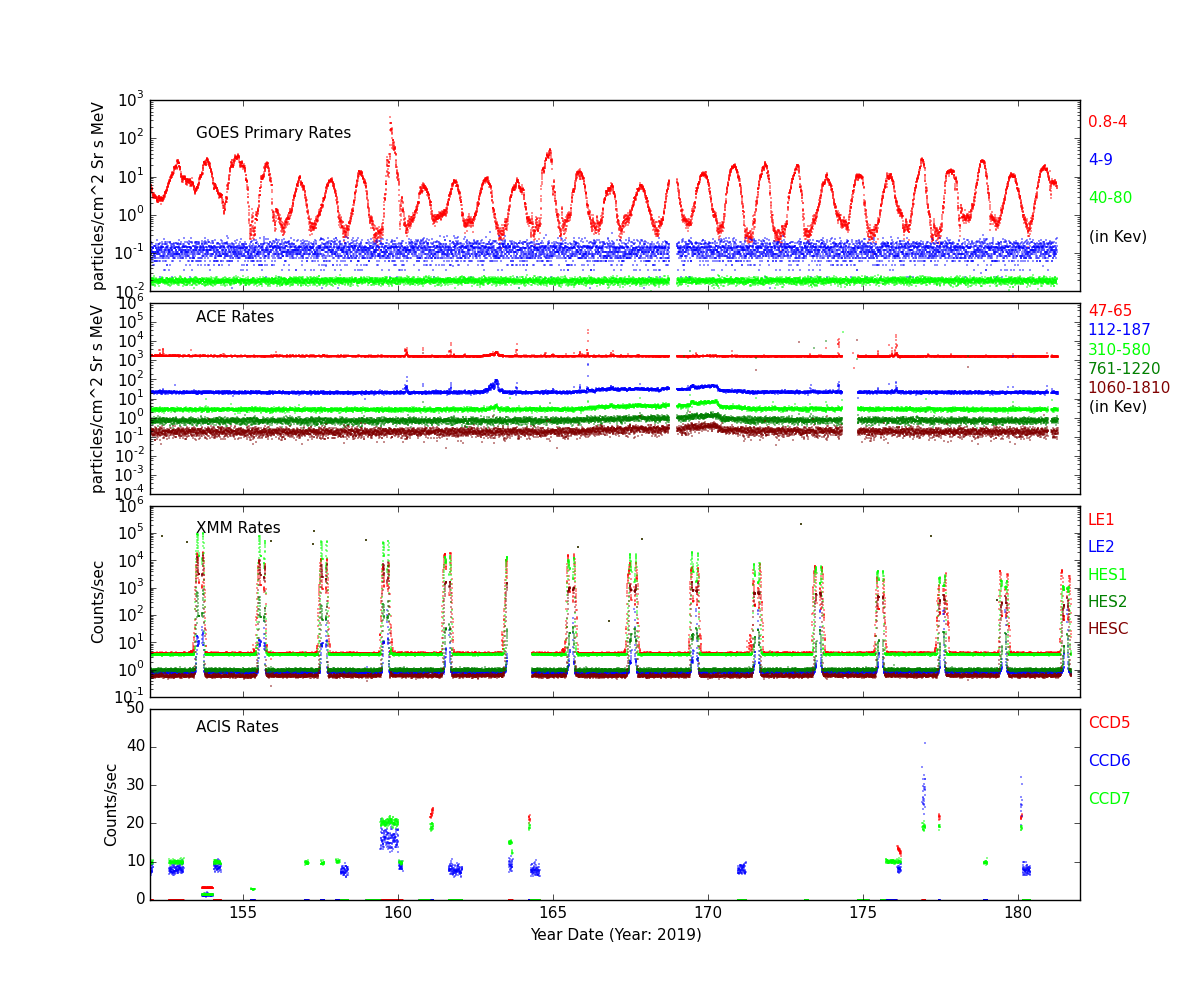
Radiation History
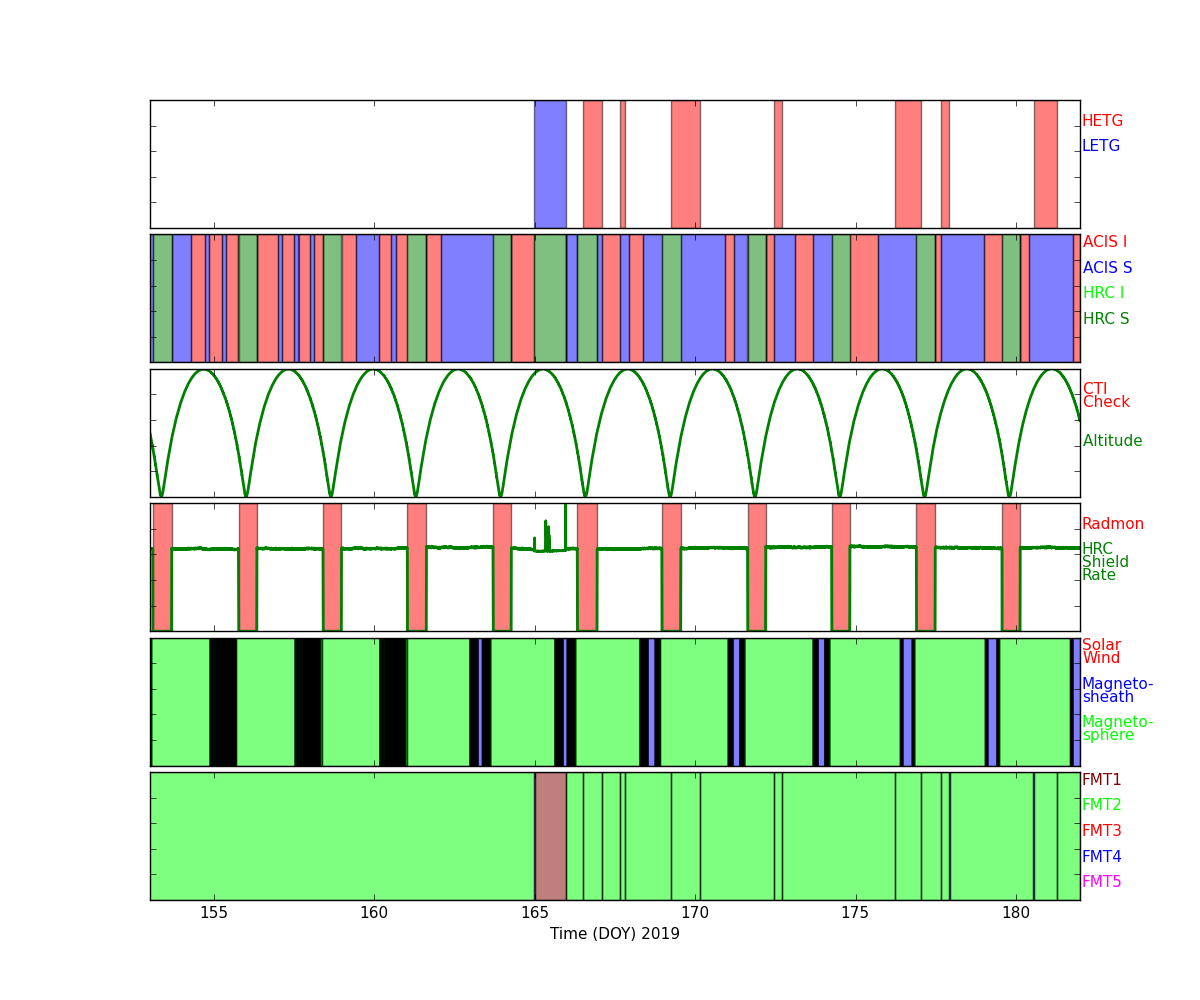
Radiation Count Rates of Jun 2019
Sun Spot History
Trending
Critical Trends
| ACIS Temperatures - Daily Maximums | ||||||
|---|---|---|---|---|---|---|
| MSID | MEAN | RMS | DELTA/YR | DELTA/YR/YR | UNITS | DESCRIPTION |
| 1pdeaat | 302.711 | 7.195 | -0.042+/-0.007 | -0.491+/-0.583 | K | PSMC DEA POWER SUPPLY TEMP A |
| 1pin1at | 341.721 | 9.988 | 0.084+/-0.048 | -0.823+/-0.629 | K | PSMC TEMP 1A |
| HRMA Computed Averages - Daily Maximums | ||||||
|---|---|---|---|---|---|---|
| MSID | MEAN | RMS | DELTA/YR | DELTA/YR/YR | UNITS | DESCRIPTION |
| obaavg | 297.080 | 1.614 | -0.005+/-0.003 | -0.126+/-0.095 | TEMP | OBA/TFTE |
| EPHIN Temperatures - Daily Maximums | ||||||
|---|---|---|---|---|---|---|
| MSID | MEAN | RMS | DELTA/YR | DELTA/YR/YR | UNITS | DESCRIPTION |
| teio | 314.354 | 26.479 | -0.056+/-0.027 | 0.901+/-1.052 | K | EPHIN ELECTRONICS HOUSING TEMP |
| tephin | 327.549 | 7.137 | -0.028+/-0.007 | -0.404+/-0.378 | K | EPHIN SENSOR HOUSING TEMP |
| S/C Main Temperatures - Daily Maximums | ||||||
|---|---|---|---|---|---|---|
| MSID | MEAN | RMS | DELTA/YR | DELTA/YR/YR | UNITS | DESCRIPTION |
| tcylfmzm | 307.614 | 19.967 | -0.109+/-0.020 | -1.925+/-1.329 | K | CNT CYL TEMP:-Z SIDE UNDER LAE-1 |
| tcylfmzp | 309.007 | 18.137 | -0.101+/-0.018 | -1.799+/-1.084 | K | CNT CYL TEMP:-Z SIDE UNDER LAE-2 |
| S/C Ancillary Temperatures - Daily Maximums | ||||||
|---|---|---|---|---|---|---|
| MSID | MEAN | RMS | DELTA/YR | DELTA/YR/YR | UNITS | DESCRIPTION |
| tfssbkt1 | 333.646 | 28.561 | -0.058+/-0.030 | -2.216+/-1.096 | K | FSS BRACKET-1 TEMP (+Y) |
| tfssbkt2 | 329.731 | 32.868 | -0.044+/-0.035 | -2.276+/-1.261 | K | FSS BRACKET-2 TEMP (-Y) |
| tsctsf1 | 312.016 | 3.745 | -0.010+/-0.004 | -0.064+/-0.252 | K | SC-TS FITTING -1 TEMP |
| tsctsf6 | 311.858 | 3.926 | -0.023+/-0.004 | -0.604+/-0.279 | K | SC-TS FITTING -6 TEMP |
| MUPS - Daily Maximums | ||||||
|---|---|---|---|---|---|---|
| MSID | MEAN | RMS | DELTA/YR | DELTA/YR/YR | UNITS | DESCRIPTION |
| pm1thv1t | 346.444 | 12.444 | -0.043+/-0.013 | -1.000+/-0.726 | K | MUPS 1 THRUSTER VALVE 01 TEMP |
| pline02t | 327.041 | 11.788 | -0.063+/-0.012 | -1.511+/-0.679 | K | PROP LINE TEMP 02 |
| pline03t | 322.288 | 14.866 | -0.081+/-0.015 | -1.944+/-0.809 | K | PROP LINE TEMP 03 |
| pline04t | 308.006 | 11.435 | -0.067+/-0.012 | -1.219+/-0.687 | K | PROP LINE TEMP 04 |
Quarterly Trends
- HRMA Struts
| Previous Quarter | ||||||
| MSID | MEAN | RMS | DELTA/YR | DELTA/YR/YR | UNITS | DESCRIPTION |
| 4rt584t | 299.183 | 0.748 | -0.007+/-0.001 | -0.192+/-0.088 | K | RT 584 - HRMA STRUT TEMP |
|---|---|---|---|---|---|---|
| 4rt585t | 299.542 | 0.698 | -0.006+/-0.001 | -0.083+/-0.081 | K | RT 585 - HRMA STRUT TEMP |
| 4rt586t | 296.576 | 0.600 | -0.006+/-0.001 | -0.105+/-0.071 | K | RT 586 - HRMA STRUT TEMP |
| 4rt587t | 291.957 | 0.440 | -0.005+/-0.000 | -0.106+/-0.049 | K | RT 587 - HRMA STRUT TEMP |
| 4rt597t | 304.976 | 2.181 | -0.009+/-0.002 | -0.041+/-0.137 | K | RT 597 - TFTE AFT CYLINDER TEMP |
| 4rt598t | 304.429 | 2.173 | -0.009+/-0.002 | 0.010+/-0.139 | K | RT 598 - TFTE AFT CYLINDER TEMP |
- OB Forward Bulkhead
| Previous Quarter | ||||||
| MSID | MEAN | RMS | DELTA/YR | DELTA/YR/YR | UNITS | DESCRIPTION |
| 4rt705t | 291.129 | 1.016 | -0.008+/-0.001 | -0.144+/-0.087 | K | RT 705 - OB FWD BULKHEAD TEMP |
|---|---|---|---|---|---|---|
| 4rt706t | 289.910 | 1.055 | -0.008+/-0.001 | -0.138+/-0.092 | K | RT 706 - OB FWD BULKHEAD TEMP |
| 4rt707t | 294.147 | 1.039 | -0.008+/-0.001 | -0.117+/-0.090 | K | RT 707 - OB FWD BULKHEAD TEMP |
| 4rt708t | 297.690 | 1.161 | -0.009+/-0.001 | -0.092+/-0.100 | K | RT 708 - OB FWD BULKHEAD TEMP |
| 4rt709t | 298.536 | 1.232 | -0.009+/-0.001 | -0.083+/-0.106 | K | RT 709 - OB FWD BULKHEAD TEMP |
| 4rt710t | 299.777 | 1.335 | -0.010+/-0.001 | -0.085+/-0.109 | K | RT 710 - OB FWD BULKHEAD TEMP |
- HRMA Thermal
- HRMA Thermal
| Previous Quarter | ||||||
| MSID | MEAN | RMS | DELTA/YR | DELTA/YR/YR | UNITS | DESCRIPTION |
| 4rt568t | 297.587 | 1.214 | -0.009+/-0.001 | -0.210+/-0.103 | K | RT 568 - HRMA AHS INNER CYLINDER |
|---|---|---|---|---|---|---|
| 4rt569t | 295.804 | 0.295 | -0.003+/-0.000 | -0.100+/-0.034 | K | RT 569 - PERISCOPE (FIRST FOLD END) |
| 4rt570t | 295.253 | 0.155 | (-3.18+/-0.67)e-4 | -0.053+/-0.017 | K | RT 570 - HRMA RRCA |
| 4rt575t | 301.670 | 1.527 | -0.010+/-0.002 | -0.153+/-0.116 | K | RT 575 - OB FWD CONE TEMP |
| 4rt576t | 293.540 | 1.122 | -0.008+/-0.001 | -0.209+/-0.096 | K | RT 576 - OB FWD CONE TEMP |
| 4rt578t | 299.611 | 2.792 | -0.017+/-0.003 | -0.314+/-0.176 | K | RT 578 - OB MID CONE TEMP |
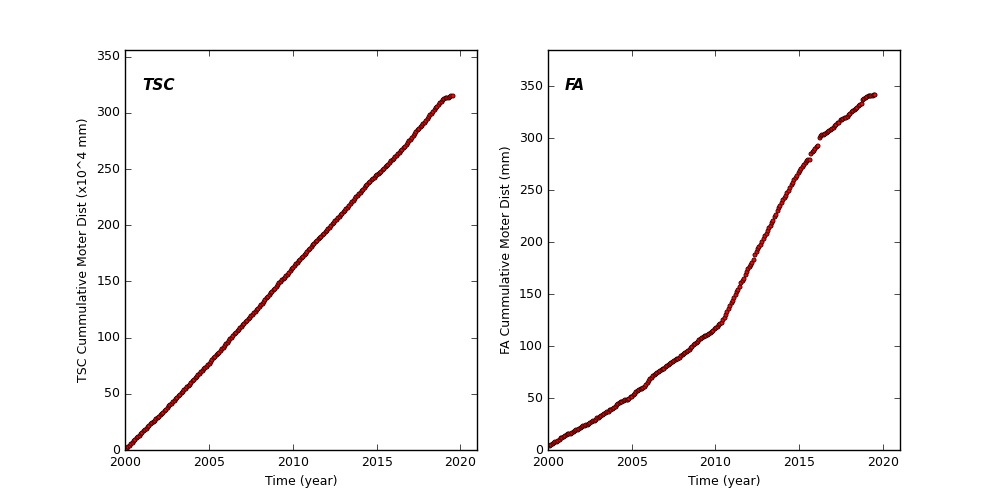
Spacecraft Motions
TSC and FA Cummulative Moter Distance
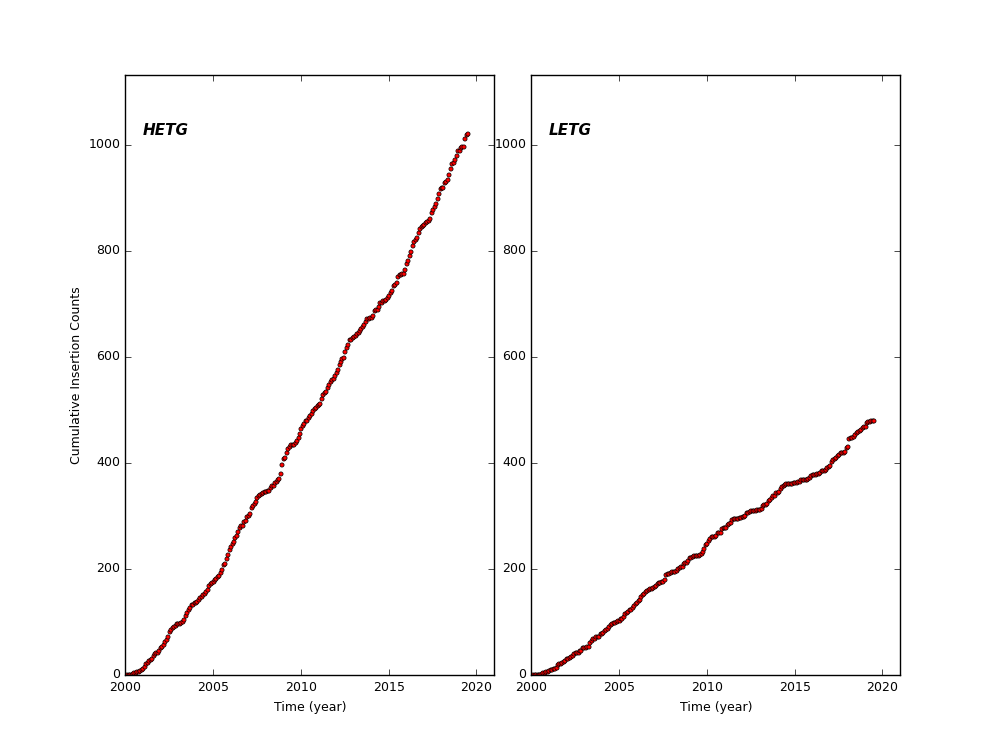
HETG and LETG Cummulative Insertion Counts
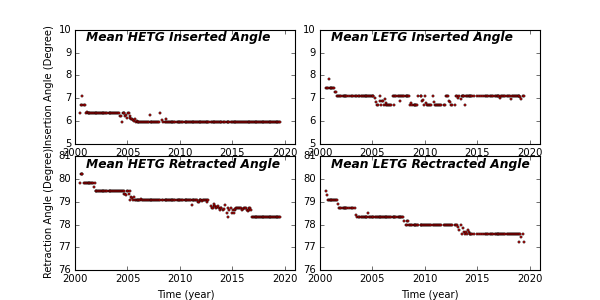
HETG/LETG Insertion/Retraction Angle
Reaction Wheel Rotations
