ACIS
ACIS DOSE Registered-Photon-Map
The steps we took to compute the dose map are;
- Level 1 Event files for a specified month are obtained from archive.
- Image data including I2, I3, S2, S3 CCDs are extracted from all event files.
- All the extracted image data were merged to create a month long exposure map for the month.
- The exposure map is opened with ds9, and check a distribution of count rates against energy. From this, estimate the upper threshold value. Any events beyond this upper threshold are assumed erroneous events such as bad pixels.
- Using this upper threshold, the data is filtered, and create a cleaned exposure map for the month.
- The exposure map from each month from the Sep 1999 is added up to create a cumulative exposure map for each month.
- Using fimgstatistic, we compute count rate statistics for each CCDs.
- For observations with high data drop rates (e.g., Crab nebula, Cas A), we corrected the observations by adding events.
Please check more detail plots at Telemetered Photon Dose Trend page.
)
)
)
Statistics:
# IMAGE     NPIX     MEAN        RMS        MIN     MAX
ACIS_nov19 6004901       6.989         9.558           0.0     1265


I2 node 0  262654	7.538619	3.422924	0.0	 66.0
I2 node 1  262654	7.822112	3.597142	0.0	142.0
I2 node 2  262654	7.701646	3.371138	0.0	 84.0
I2 node 3  262654	7.683945	3.502554	0.0	110.0

I3 node 0  262654	8.213381	3.698489	0.0	156.0
I3 node 1  262654	7.974640	3.455956	0.0	135.0
I3 node 2  262654	7.684291	3.316446	0.0	 89.0
I3 node 3  262654	7.719193	3.444690	0.0	195.0

S2 node 0  262654	8.236401	3.847756	0.0	135.0
S2 node 1  262654	8.738461	4.690671	0.0	321.0
S2 node 2  262654	9.811903	6.998788	0.0	315.0
S2 node 3  262654	10.010359	8.904427	0.0	567.0

S3 node 0  262654	10.909141	8.799147	0.0	149.0
S3 node 1  262654	11.767429	7.294664	0.0	140.0
S3 node 2  262654	12.294554	9.171547	0.0	110.0
S3 node 3  262654	10.527708	6.453678	0.0	 87.0
)
)
)
Statistics:
 IMAGE     NPIX      MEAN        RMS           MIN      MAX
ACIS_total   6004901       2347.804         3033.835           0.0   131226


I2 node 0  262654	2036.557409	405.753836	432.0	11791.0
I2 node 1  262654	2142.717769	570.113743	446.0	100885.0
I2 node 2  262654	2171.357059	459.631096	453.0	12004.0
I2 node 3  262654	2176.608393	561.555359	437.0	28635.0

I3 node 0  262654	2317.308635	571.281381	425.0	9920.0
I3 node 1  262654	2398.159250	1704.148575	453.0	55412.0
I3 node 2  262654	2119.565379	394.616428	434.0	12227.0
I3 node 3  262654	2111.736913	424.545117	389.0	32712.0

S2 node 0  262654	2733.853807	433.531436	1517.0	21958.0
S2 node 1  262654	2898.004727	649.199576	1690.0	15885.0
S2 node 2  262654	3205.709651	656.355112	2118.0	27833.0
S2 node 3  262654	3158.562265	517.412632	1872.0	60852.0

S3 node 0  262654	4838.567563	2320.999932	2120.0	33899.0
S3 node 1  262654	6062.548669	2292.202586	0.0	29969.0
S3 node 2  262654	4815.167482	1284.292714	2084.0	25726.0
S3 node 3  262654	3723.418939	679.015835	2283.0	25182.0
)
|
)
|
)
|
)
|
| Aug 2019 | May 2019 | Feb 2019 | Nov 2018 |
|---|
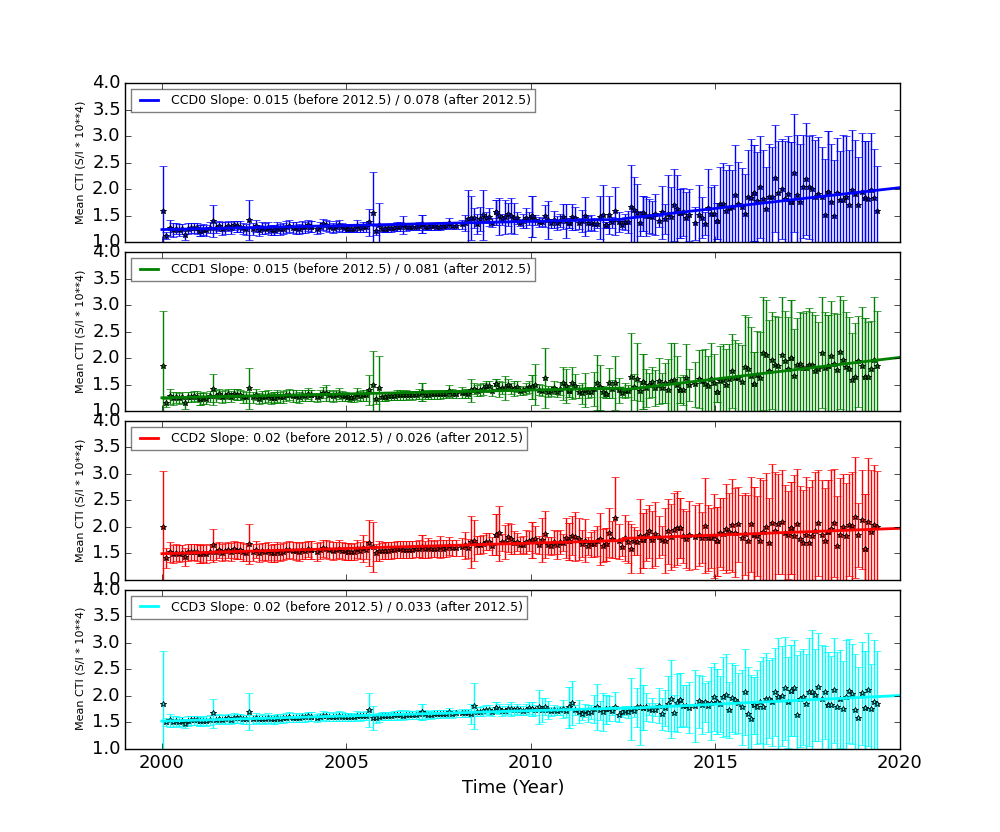
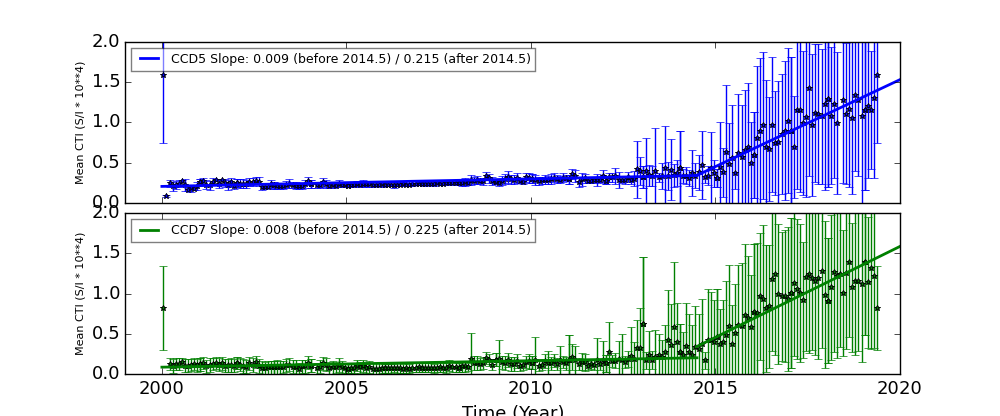
The Mean Detrended CTI
We report CTIs with a refined data definition. CTIs were computed for the temperature dependency corrected data. Please see CTI page for detailed explanation. CTI's are computed for Mn K alpha, and defined as slope/intercept x10^4 of row # vs ADU. Data file: here
Imaging CCDs
Spectral CCDs
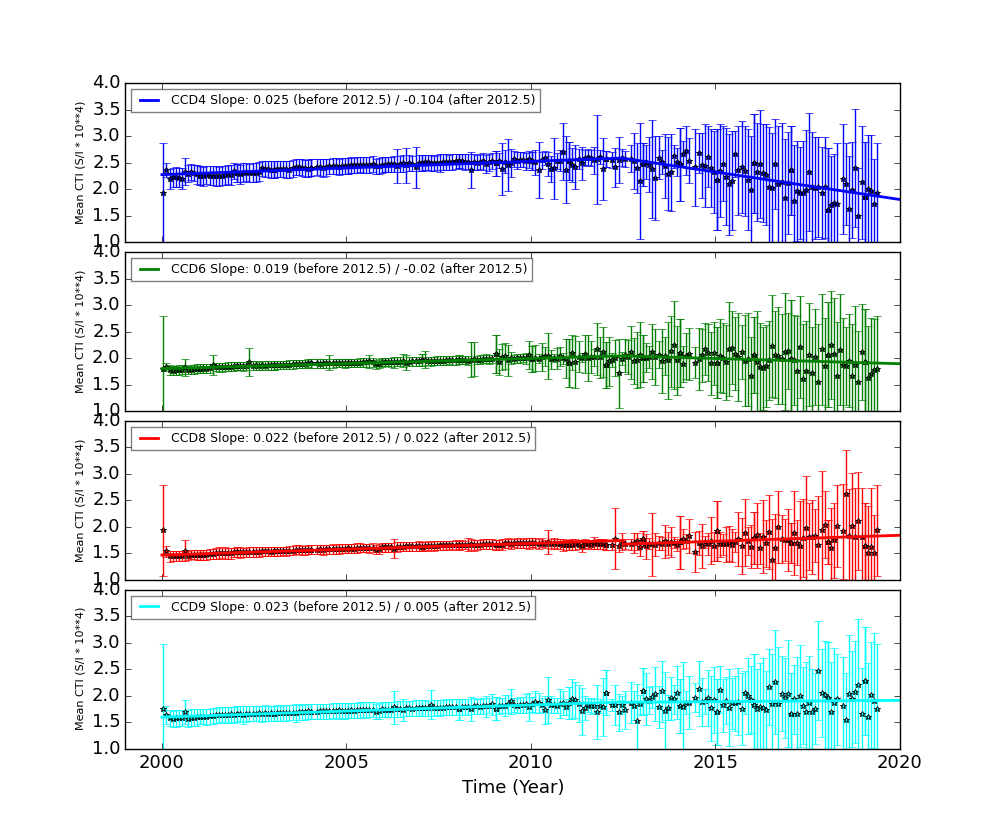
Backside CCDs
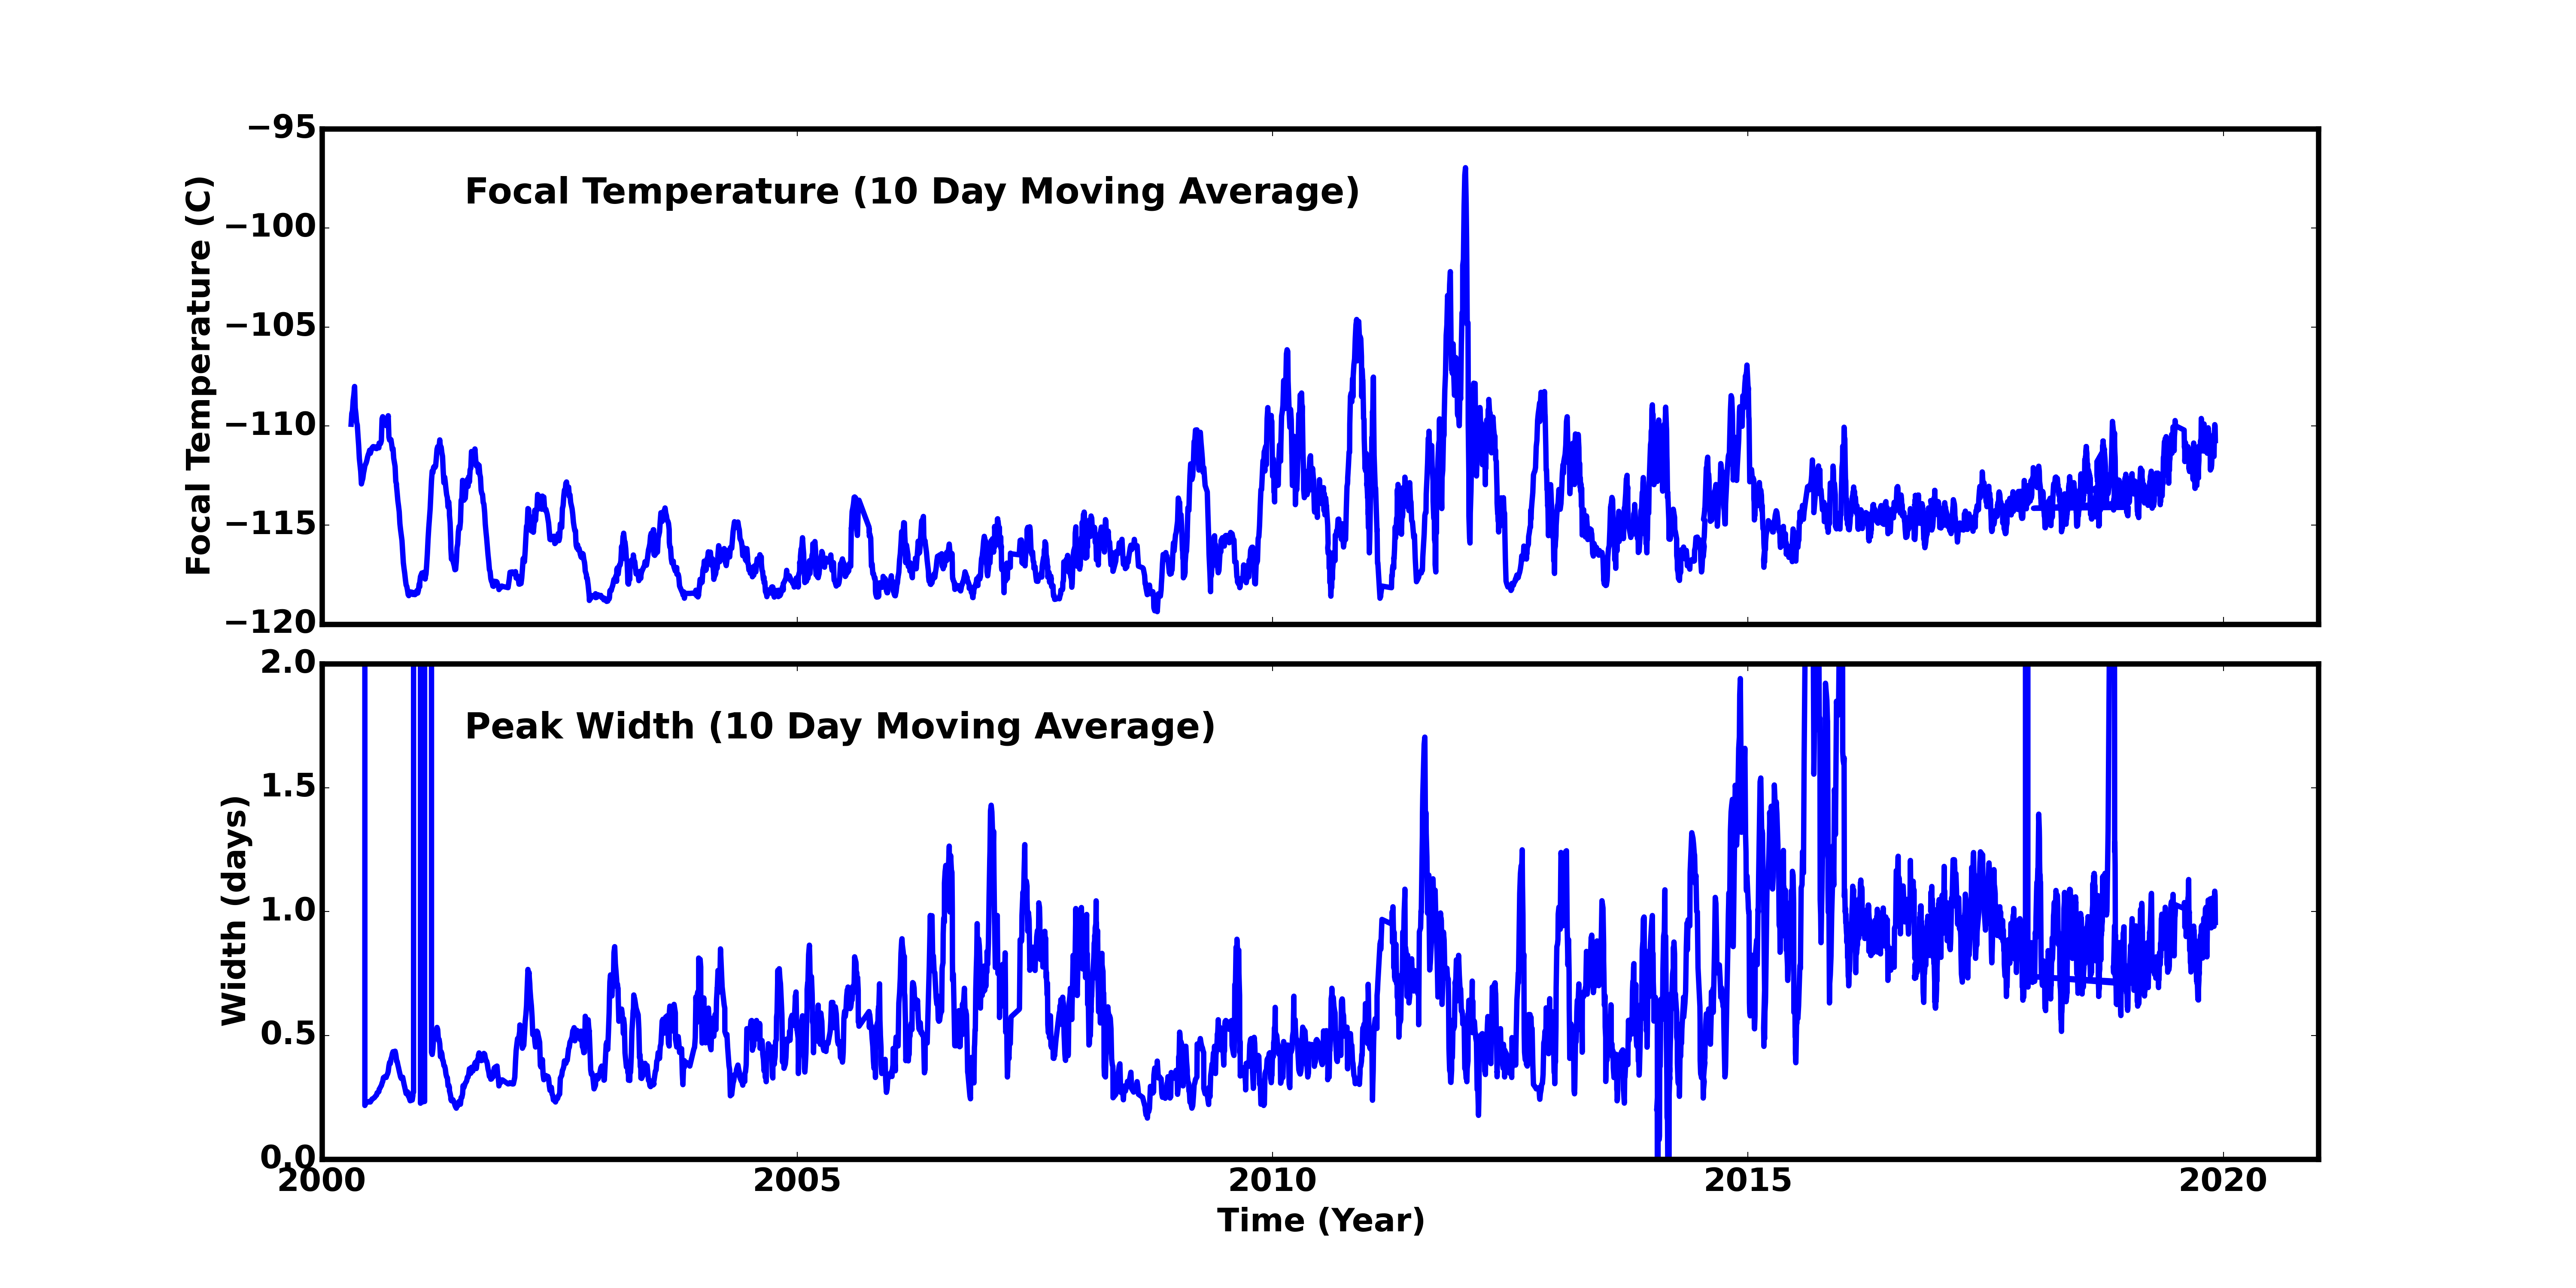
Focal Plane Temperature
Nov 2019 Focal Temperature
| The Mean (max) FPT: | |
|---|---|
| -111.15 | +/- 3.51 C |
| Mean Width: | |
| 1.0 | +/- 0.41 days |
Averaged Focal Plane Temperature
We are using 10 period moving averages to show trends of peak temperatures and peak widths. Note, the gaps in the width plot are due to missing/corrupted data.
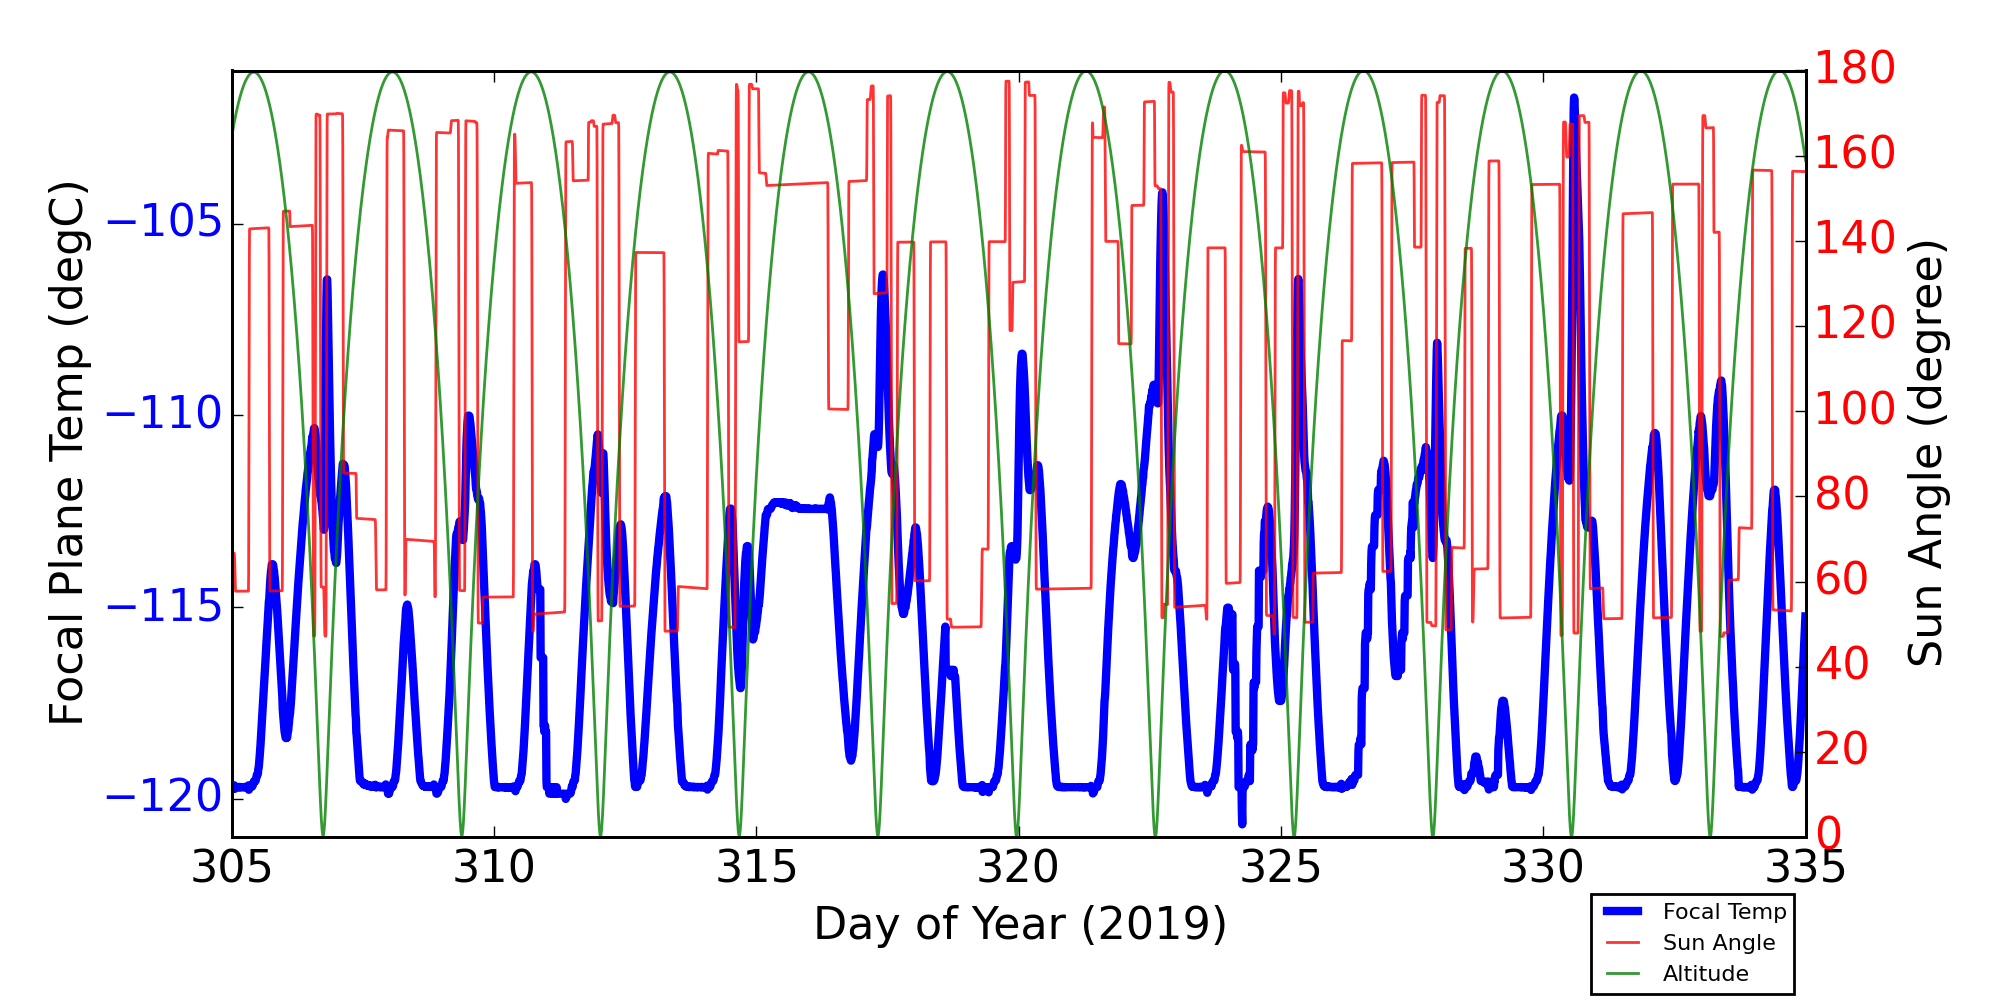
Focal Plane Temperature, Sun Angle and Altitude
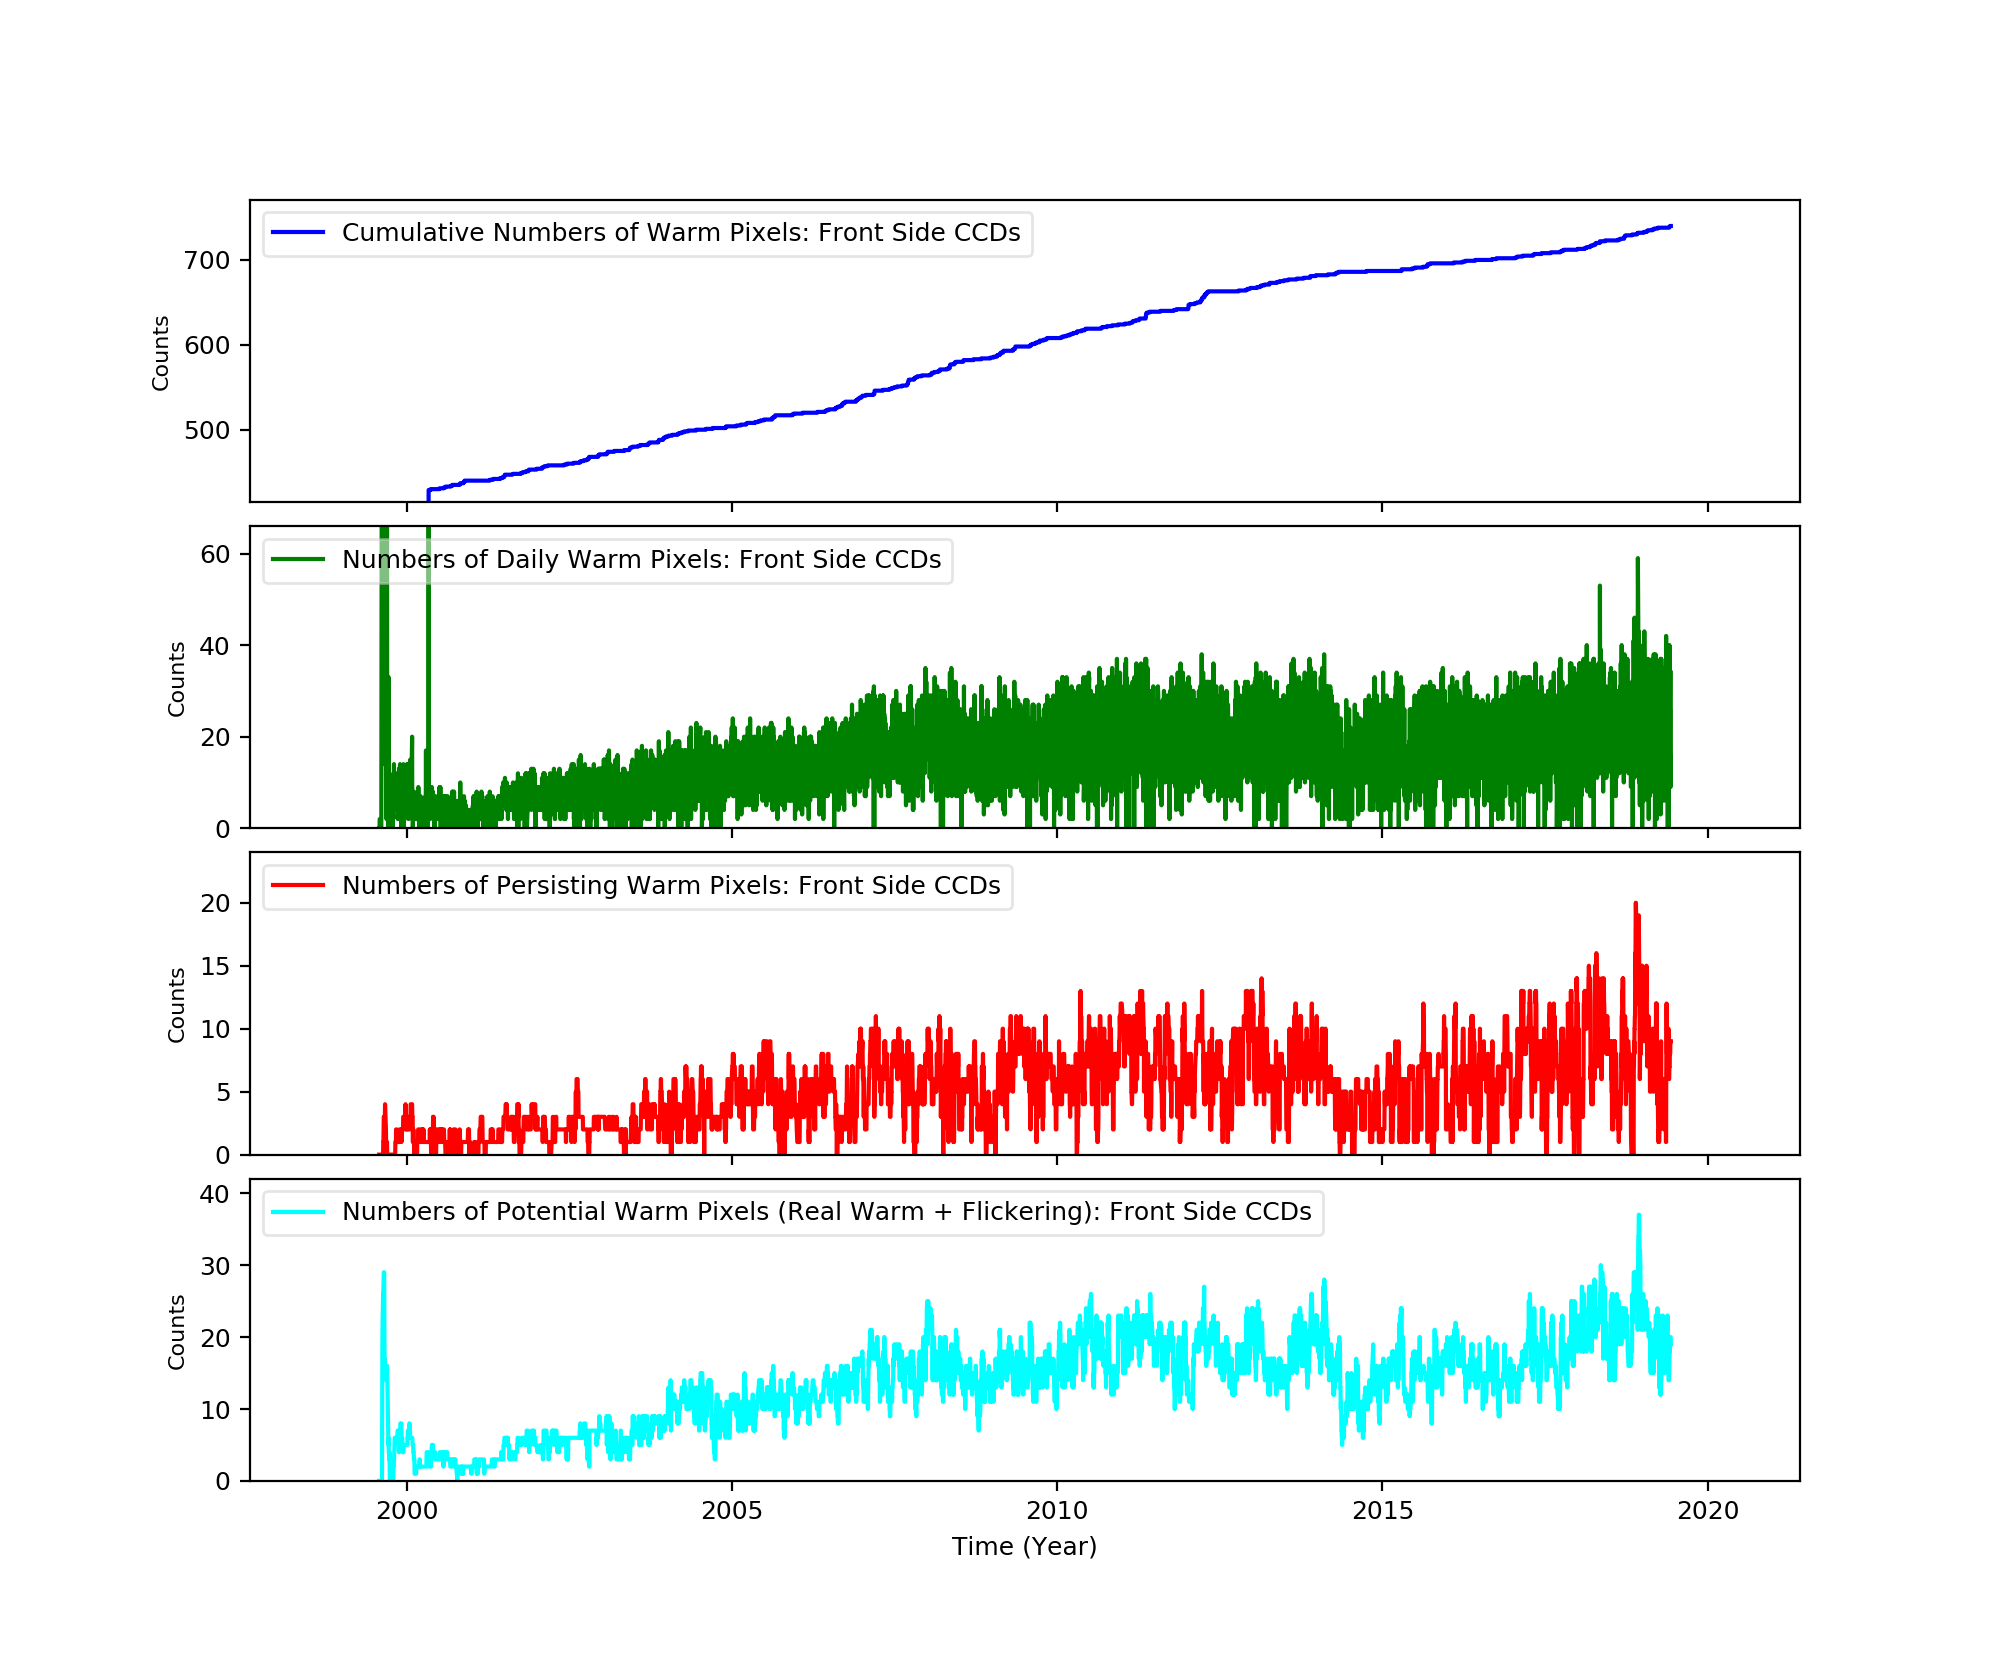
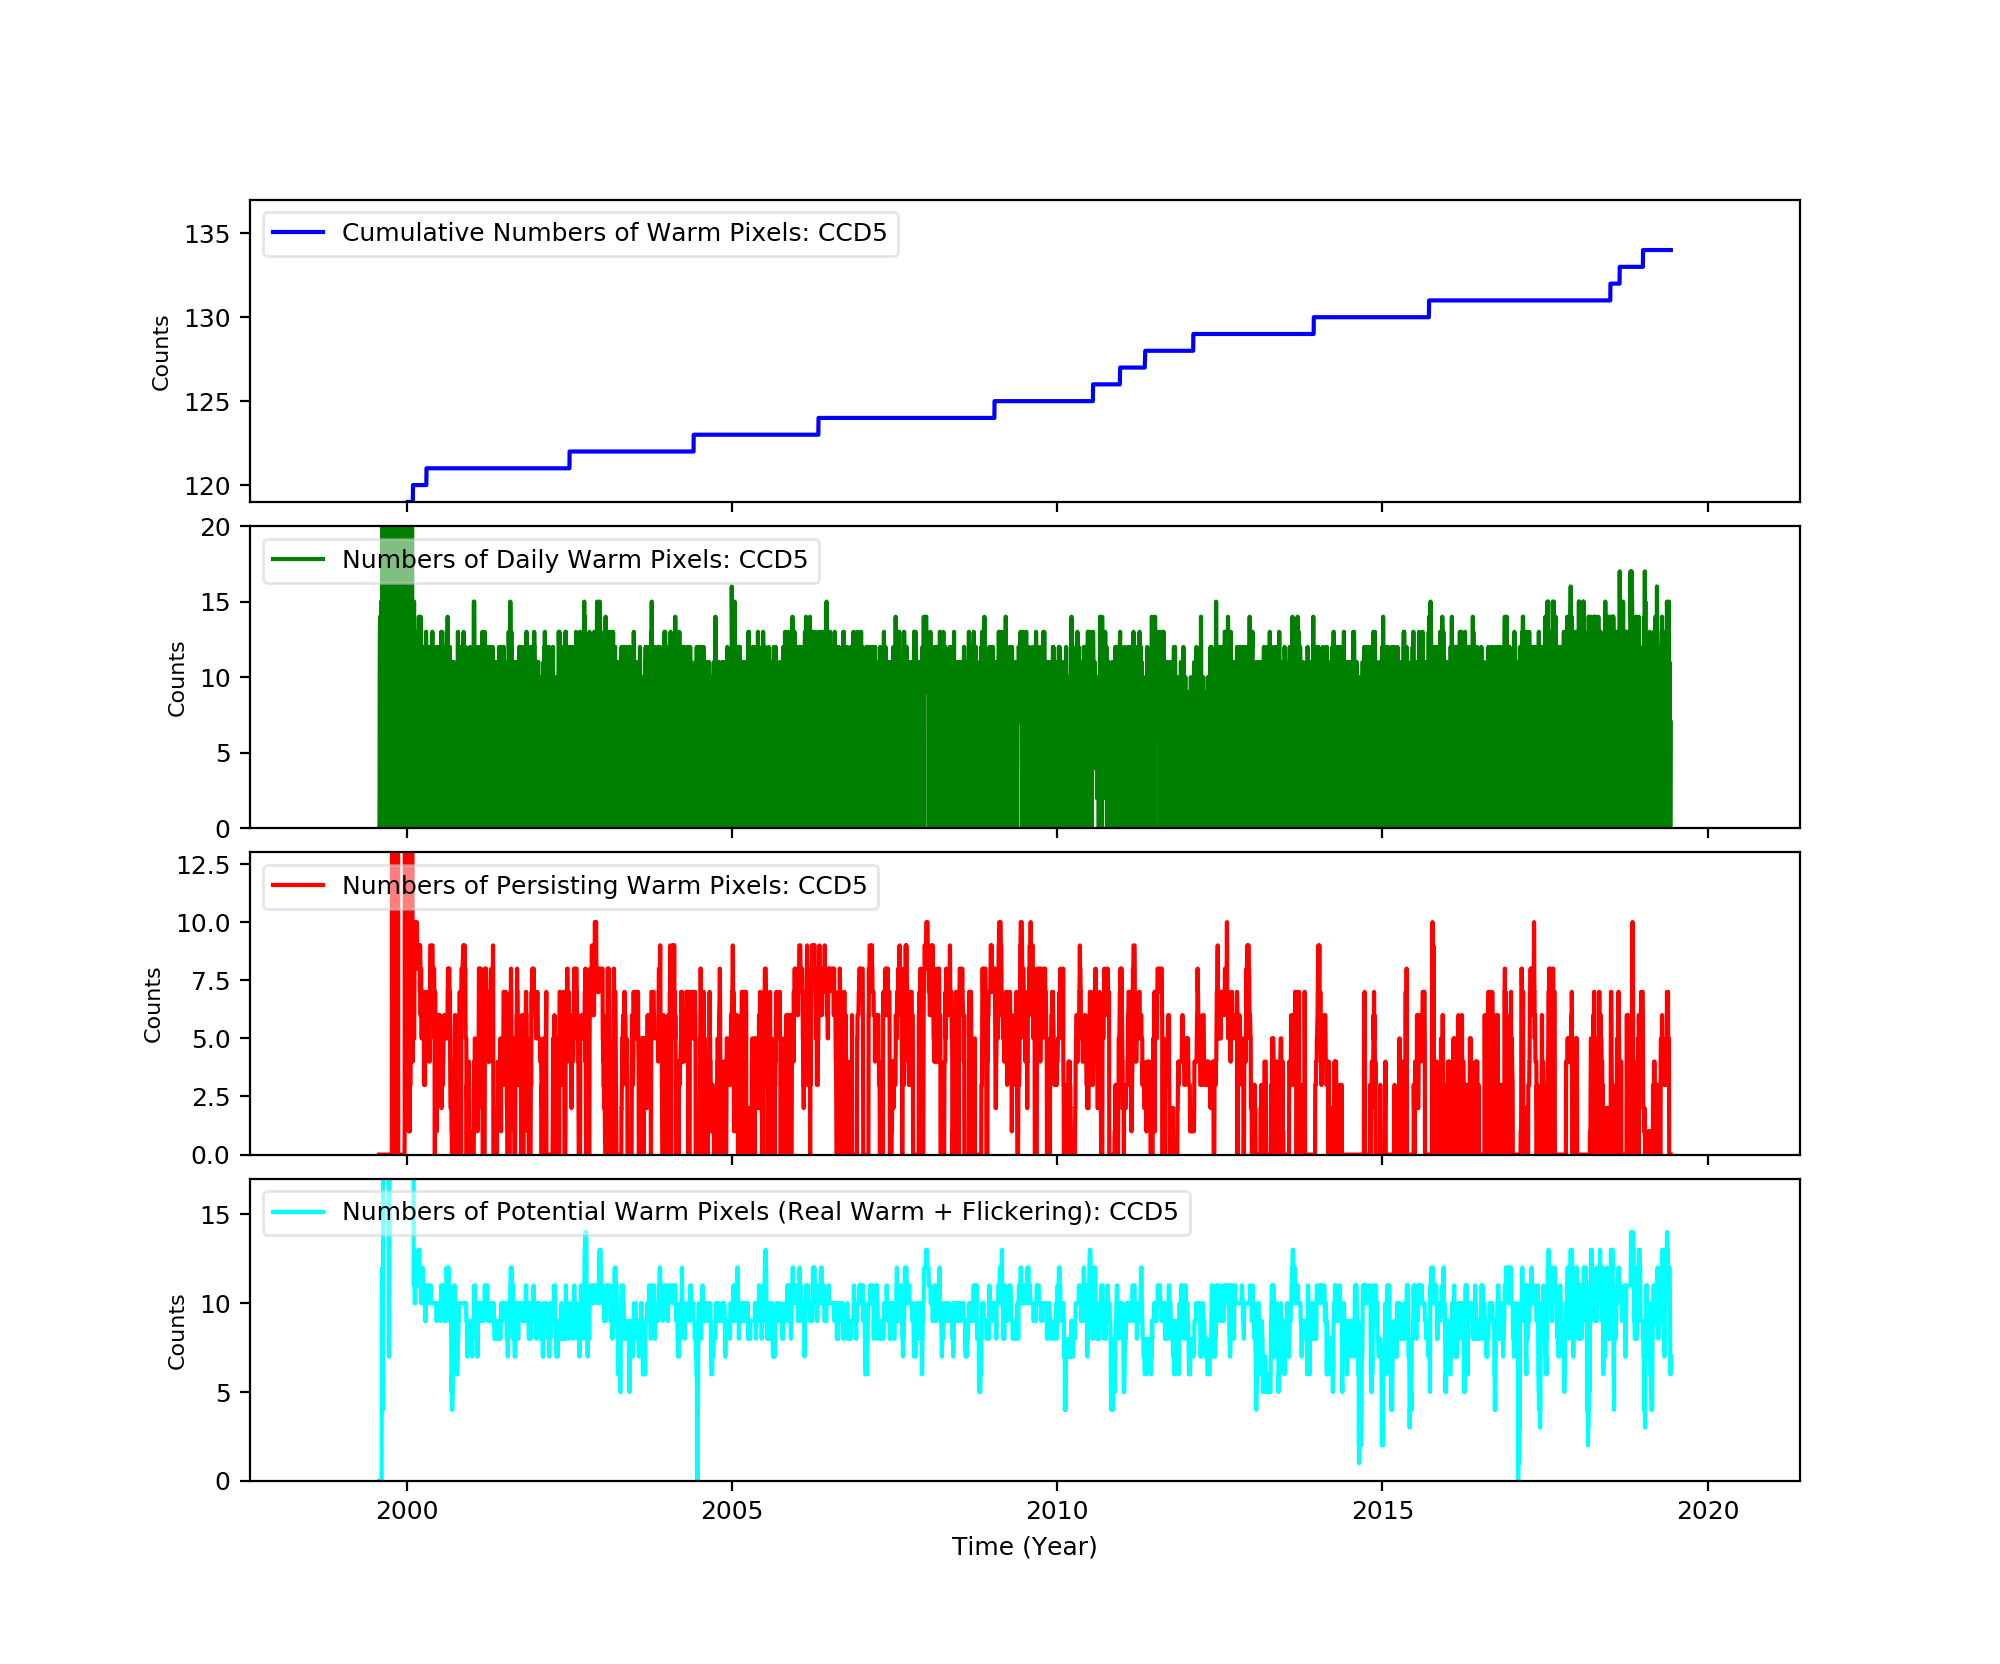
Bad Pixels
The plots below were generated with a new warm pixel finding script. Please see Acis Bad Pixel Page for details.
Front Side CCDs
Back Side CCD (CCD5)
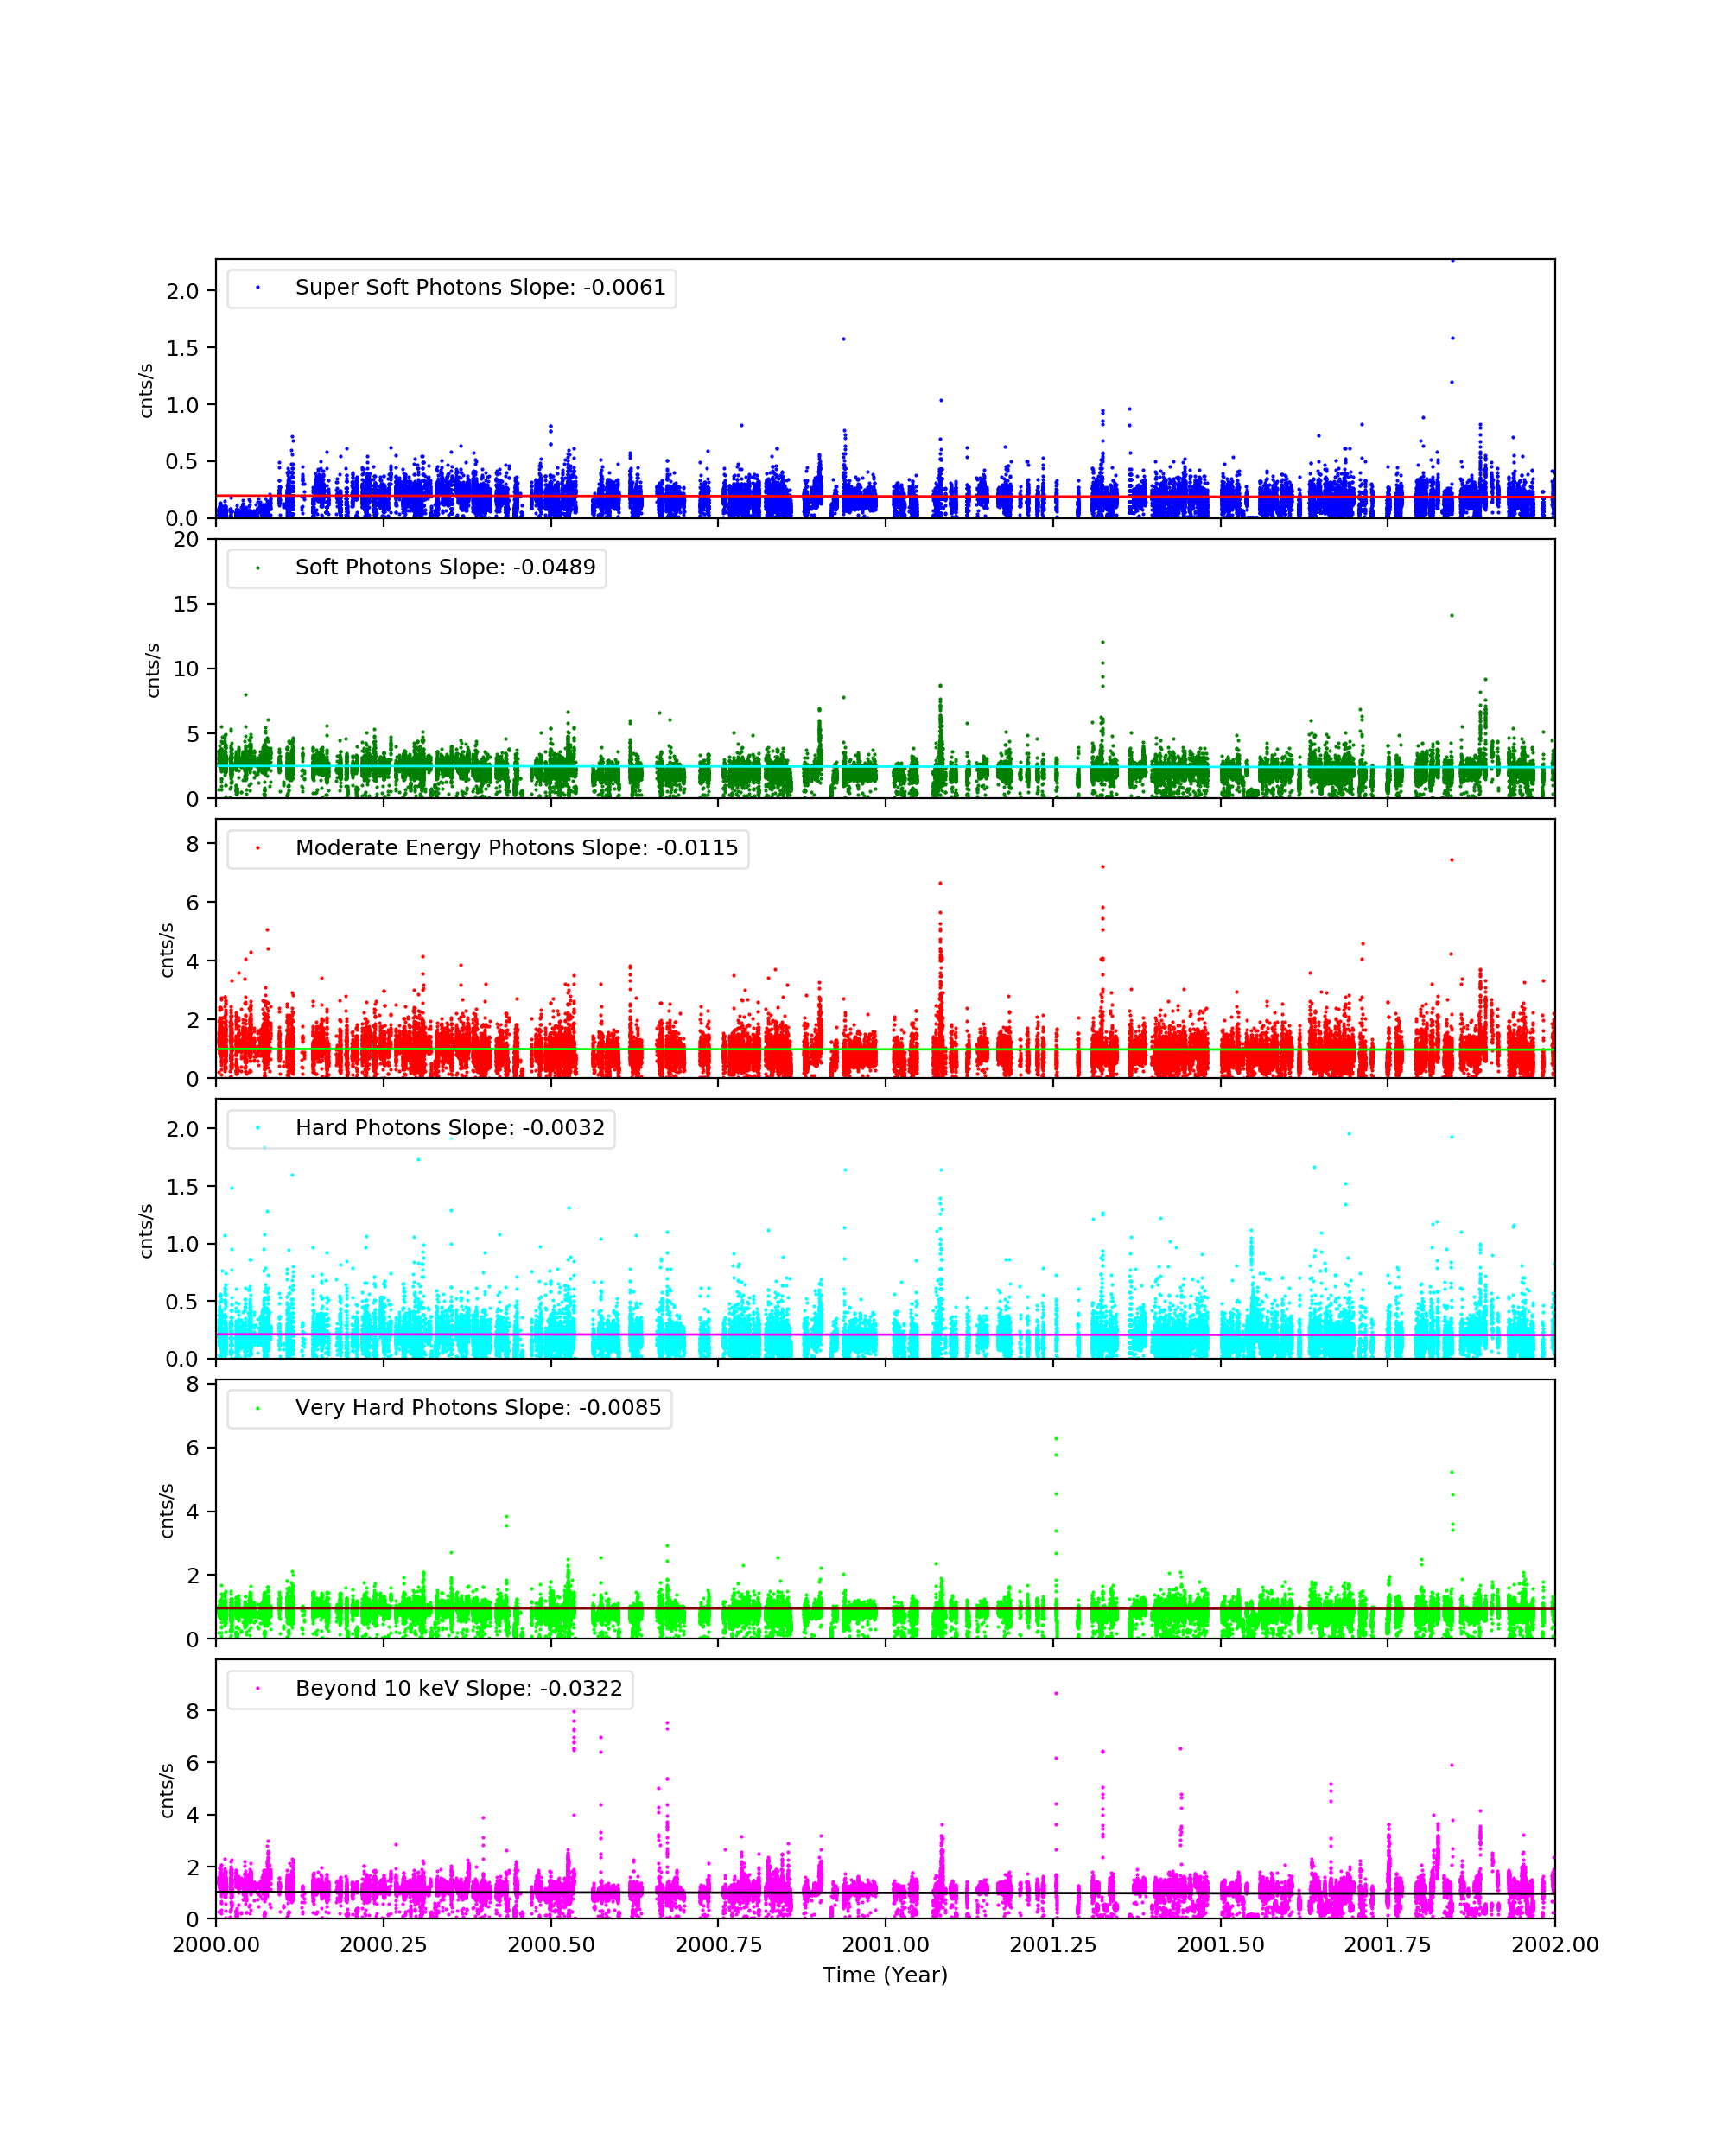
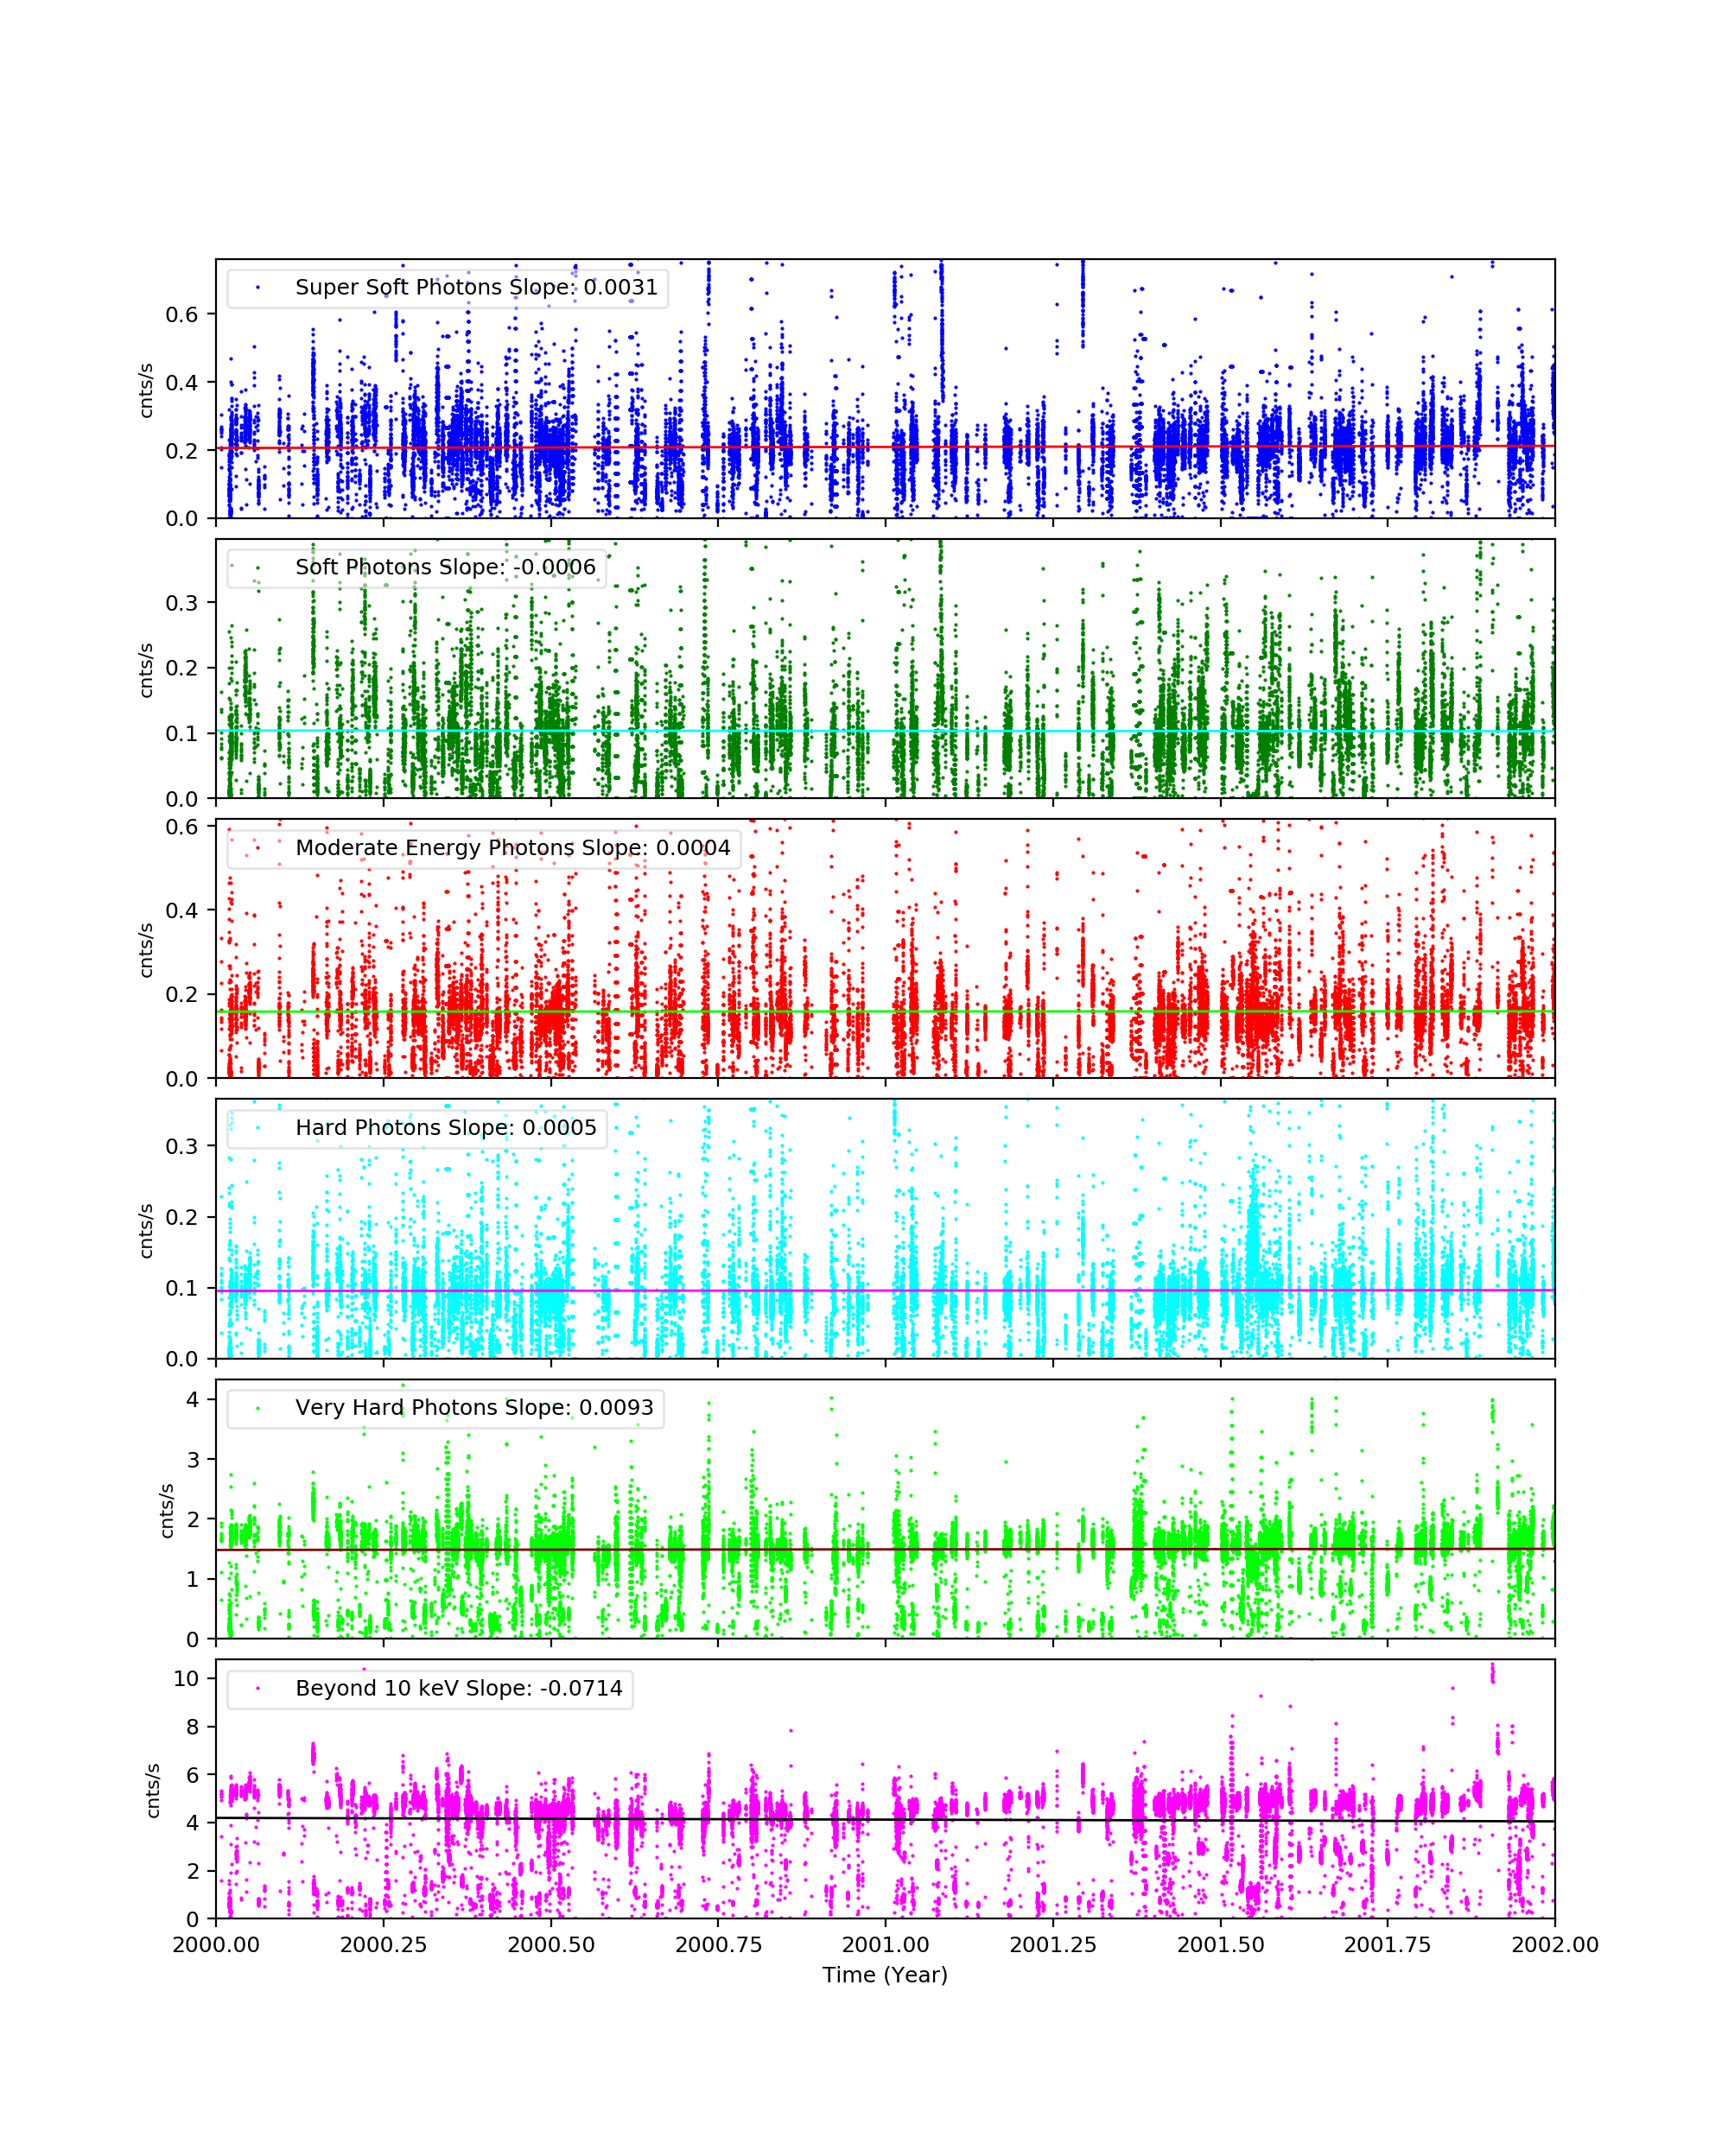
Science Instrument Background Rates
| Name | Low (keV) | High(KeV) | Description |
|---|---|---|---|
| SSoft | 0.00 | 0.50 | Super soft photons |
| Soft | 0.50 | 1.00 | Soft photons |
| Med | 1.00 | 3.00 | Moderate energy photons |
| Hard | 3.00 | 5.00 | Hard Photons |
| Harder | 5.00 | 10.00 | Very Hard photons |
| Hardest | 10.00 | Beyond 10 keV |
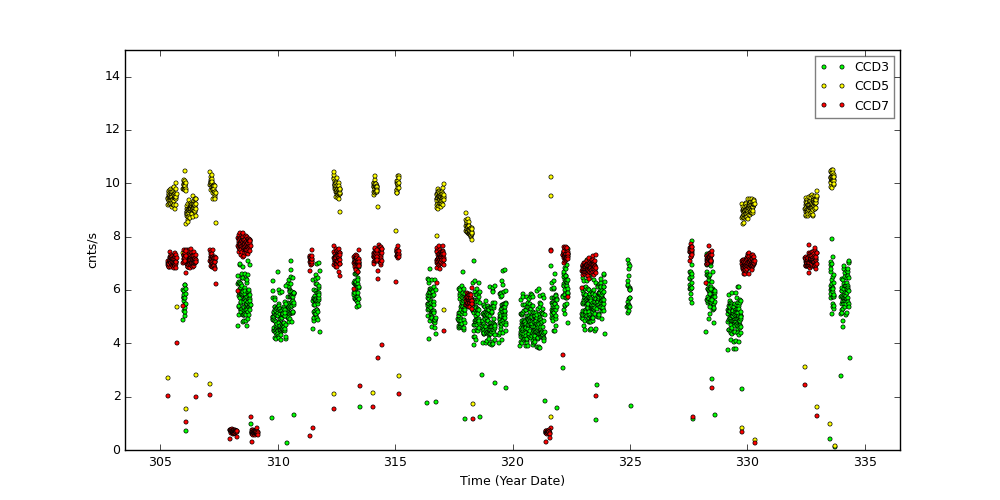
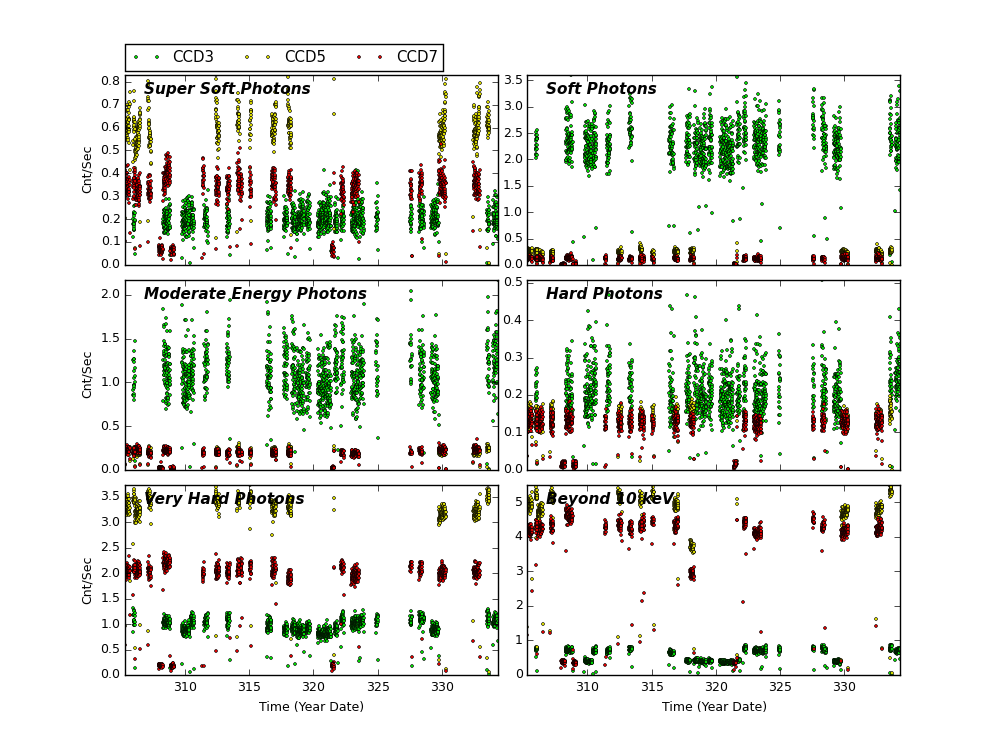
The following three plots show trends of SIB from year 2000. CCDs shown here are CCD3, CCD5, and CCD7. Fitted lines are linear fit after eliminating extreme outliers. For >10 keV plots, 2 lines are fit. One is with a 13 keV filter, and another without.
CCD 3
CCD 5
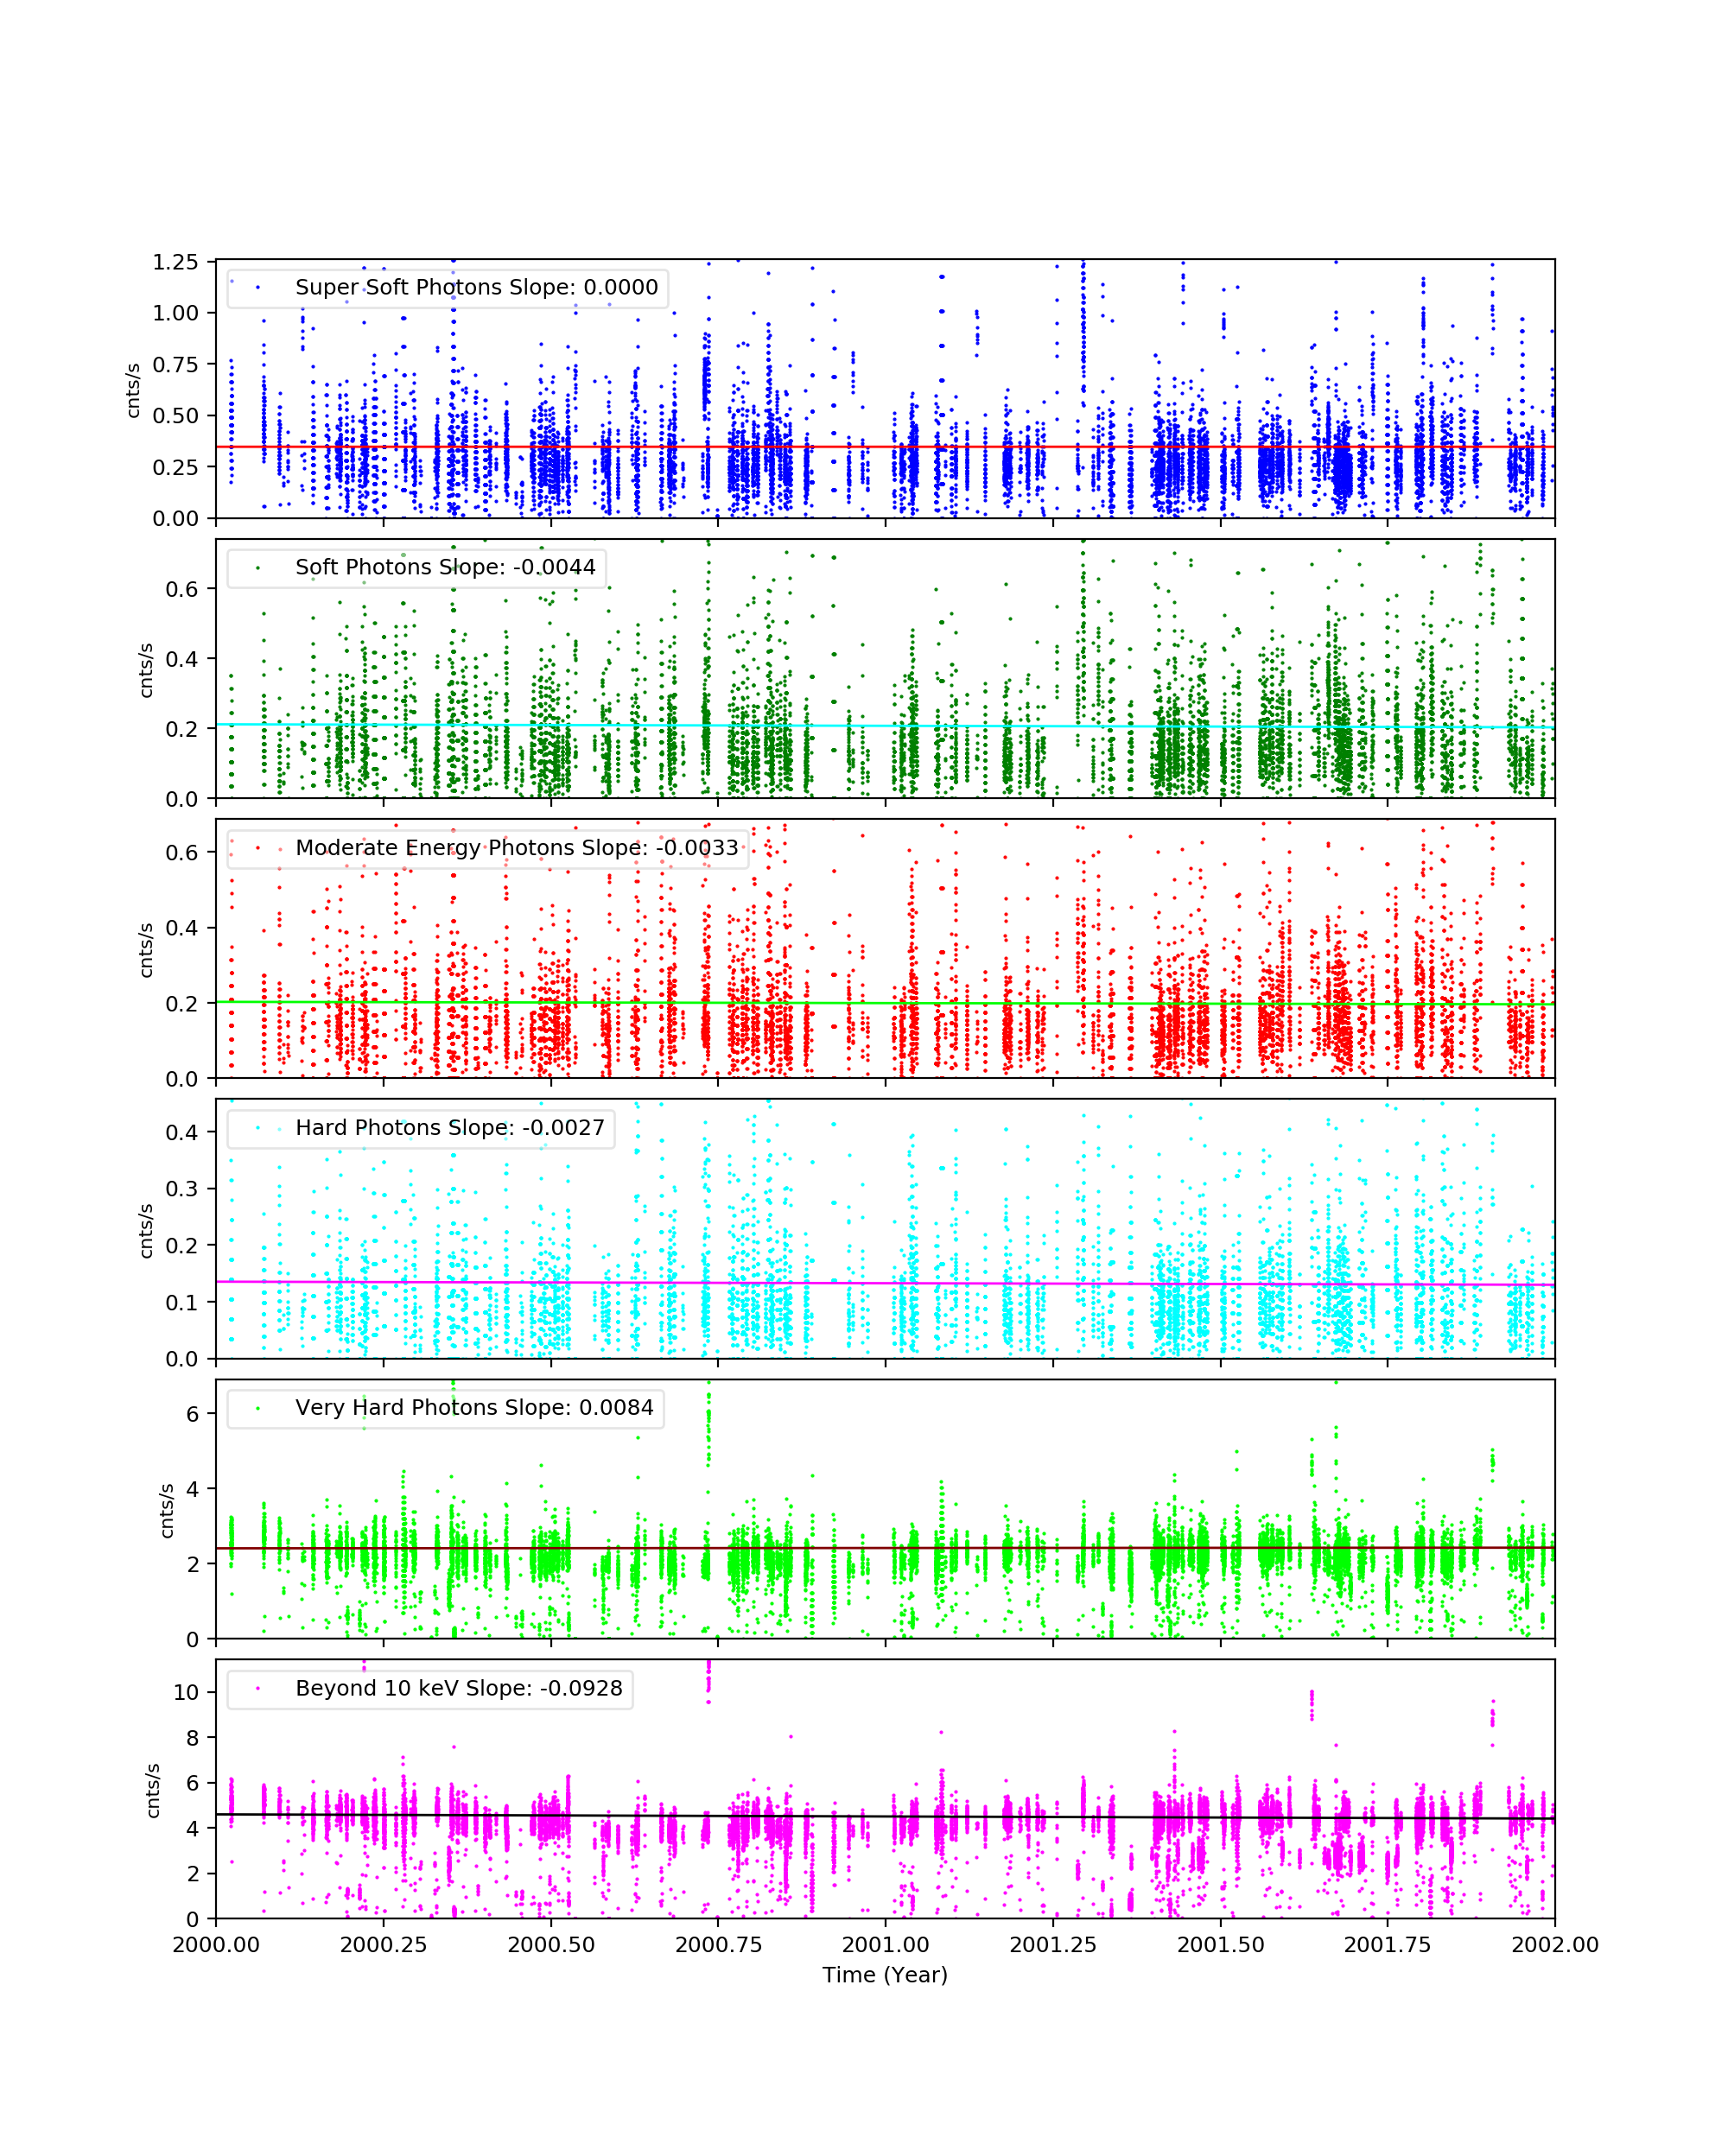
CCD 7
ACIS Histogram Mode Trends
We collected data from acis histogram mode data, and created trend plots of peak portions and peak widths against time (DOM). The peaks were estimated by fitting a simple Gaussian on three peaks (Al, Ti, and Mn), and the widths were estimated by a width at the half max from the peak.
All histogram data are taken under TIMED and GRADED_HIST mode, SIM position is at an external calibration source position, the focal temperature is around -119.7 C, and parameter settings in aciselec, acistemp are set to about same for all.
CCD 3, Peak Position
CCD 3, Peak Widths
CCD 3, Count Rates
HRC
DOSE of Central 4K Pore-Pairs
Please refer to Maximum Dose Trends for more details.
)
|
|---|
IMAGE                NPIX      MEAN    STDDEV      MIN       MAX
HRCI_11_2019.fits  16777216	0.042 	0.240 	0.000 	23.000
)
IMAGE                       NPIX      MEAN    STDDEV      MIN       MAX
HRCI_08_1999_11_2019.fits  16777216	6.052 	5.907 	0.000 	303.000
)
|
|---|
IMAGE                NPIX      MEAN    STDDEV      MIN       MAX
HRCS_11_2019.fits  16777216	0.166 	0.505 	0.000 	22.000
)
IMAGE                       NPIX      MEAN    STDDEV      MIN       MAX
HRCS_08_1999_11_2019.fits  16777216	18.580 	33.816 	0.000 	1748.000
|
|
Max dose trend plots corrected for events that "pile-up"
in the center of the taps due to bad position information.
|
)
|
)
|
)
|
)
|
| Aug 2019 | May 2019 | Feb 2019 | Nov 2018 |
|---|
)
|
)
|
)
|
)
|
| Aug 2019 | May 2019 | Feb 2019 | Nov 2018 |
|---|
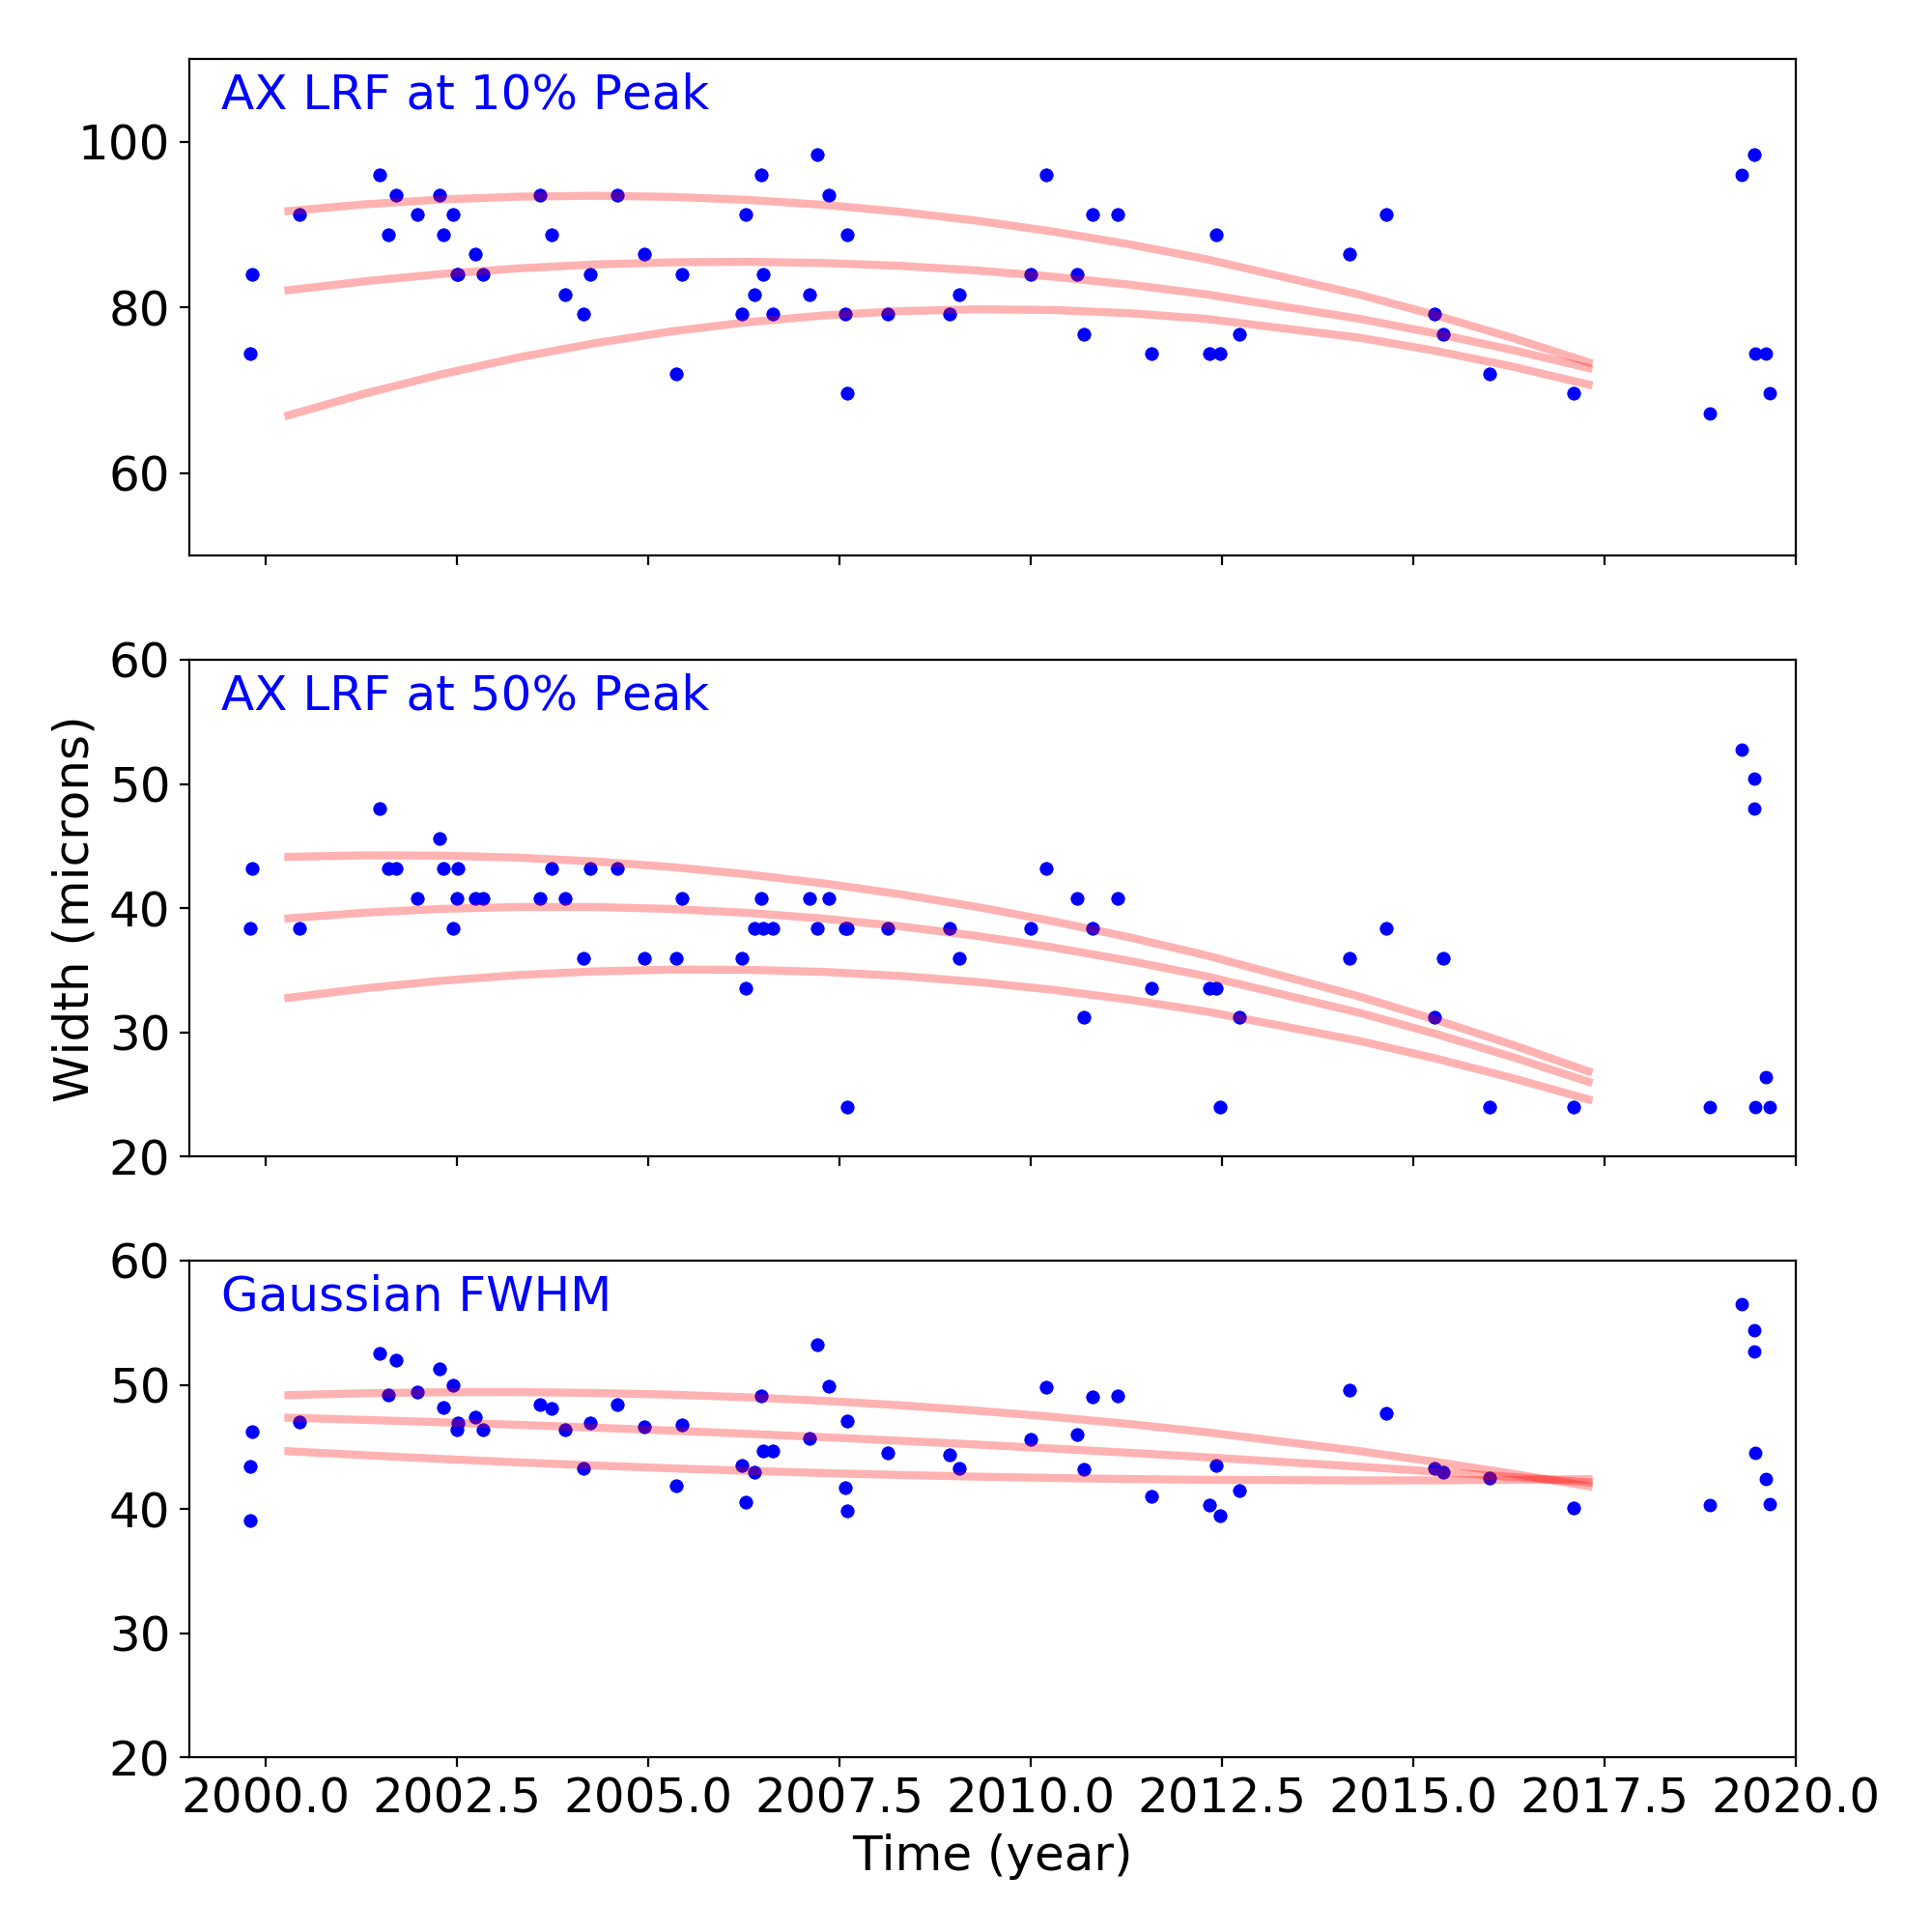
Gratings
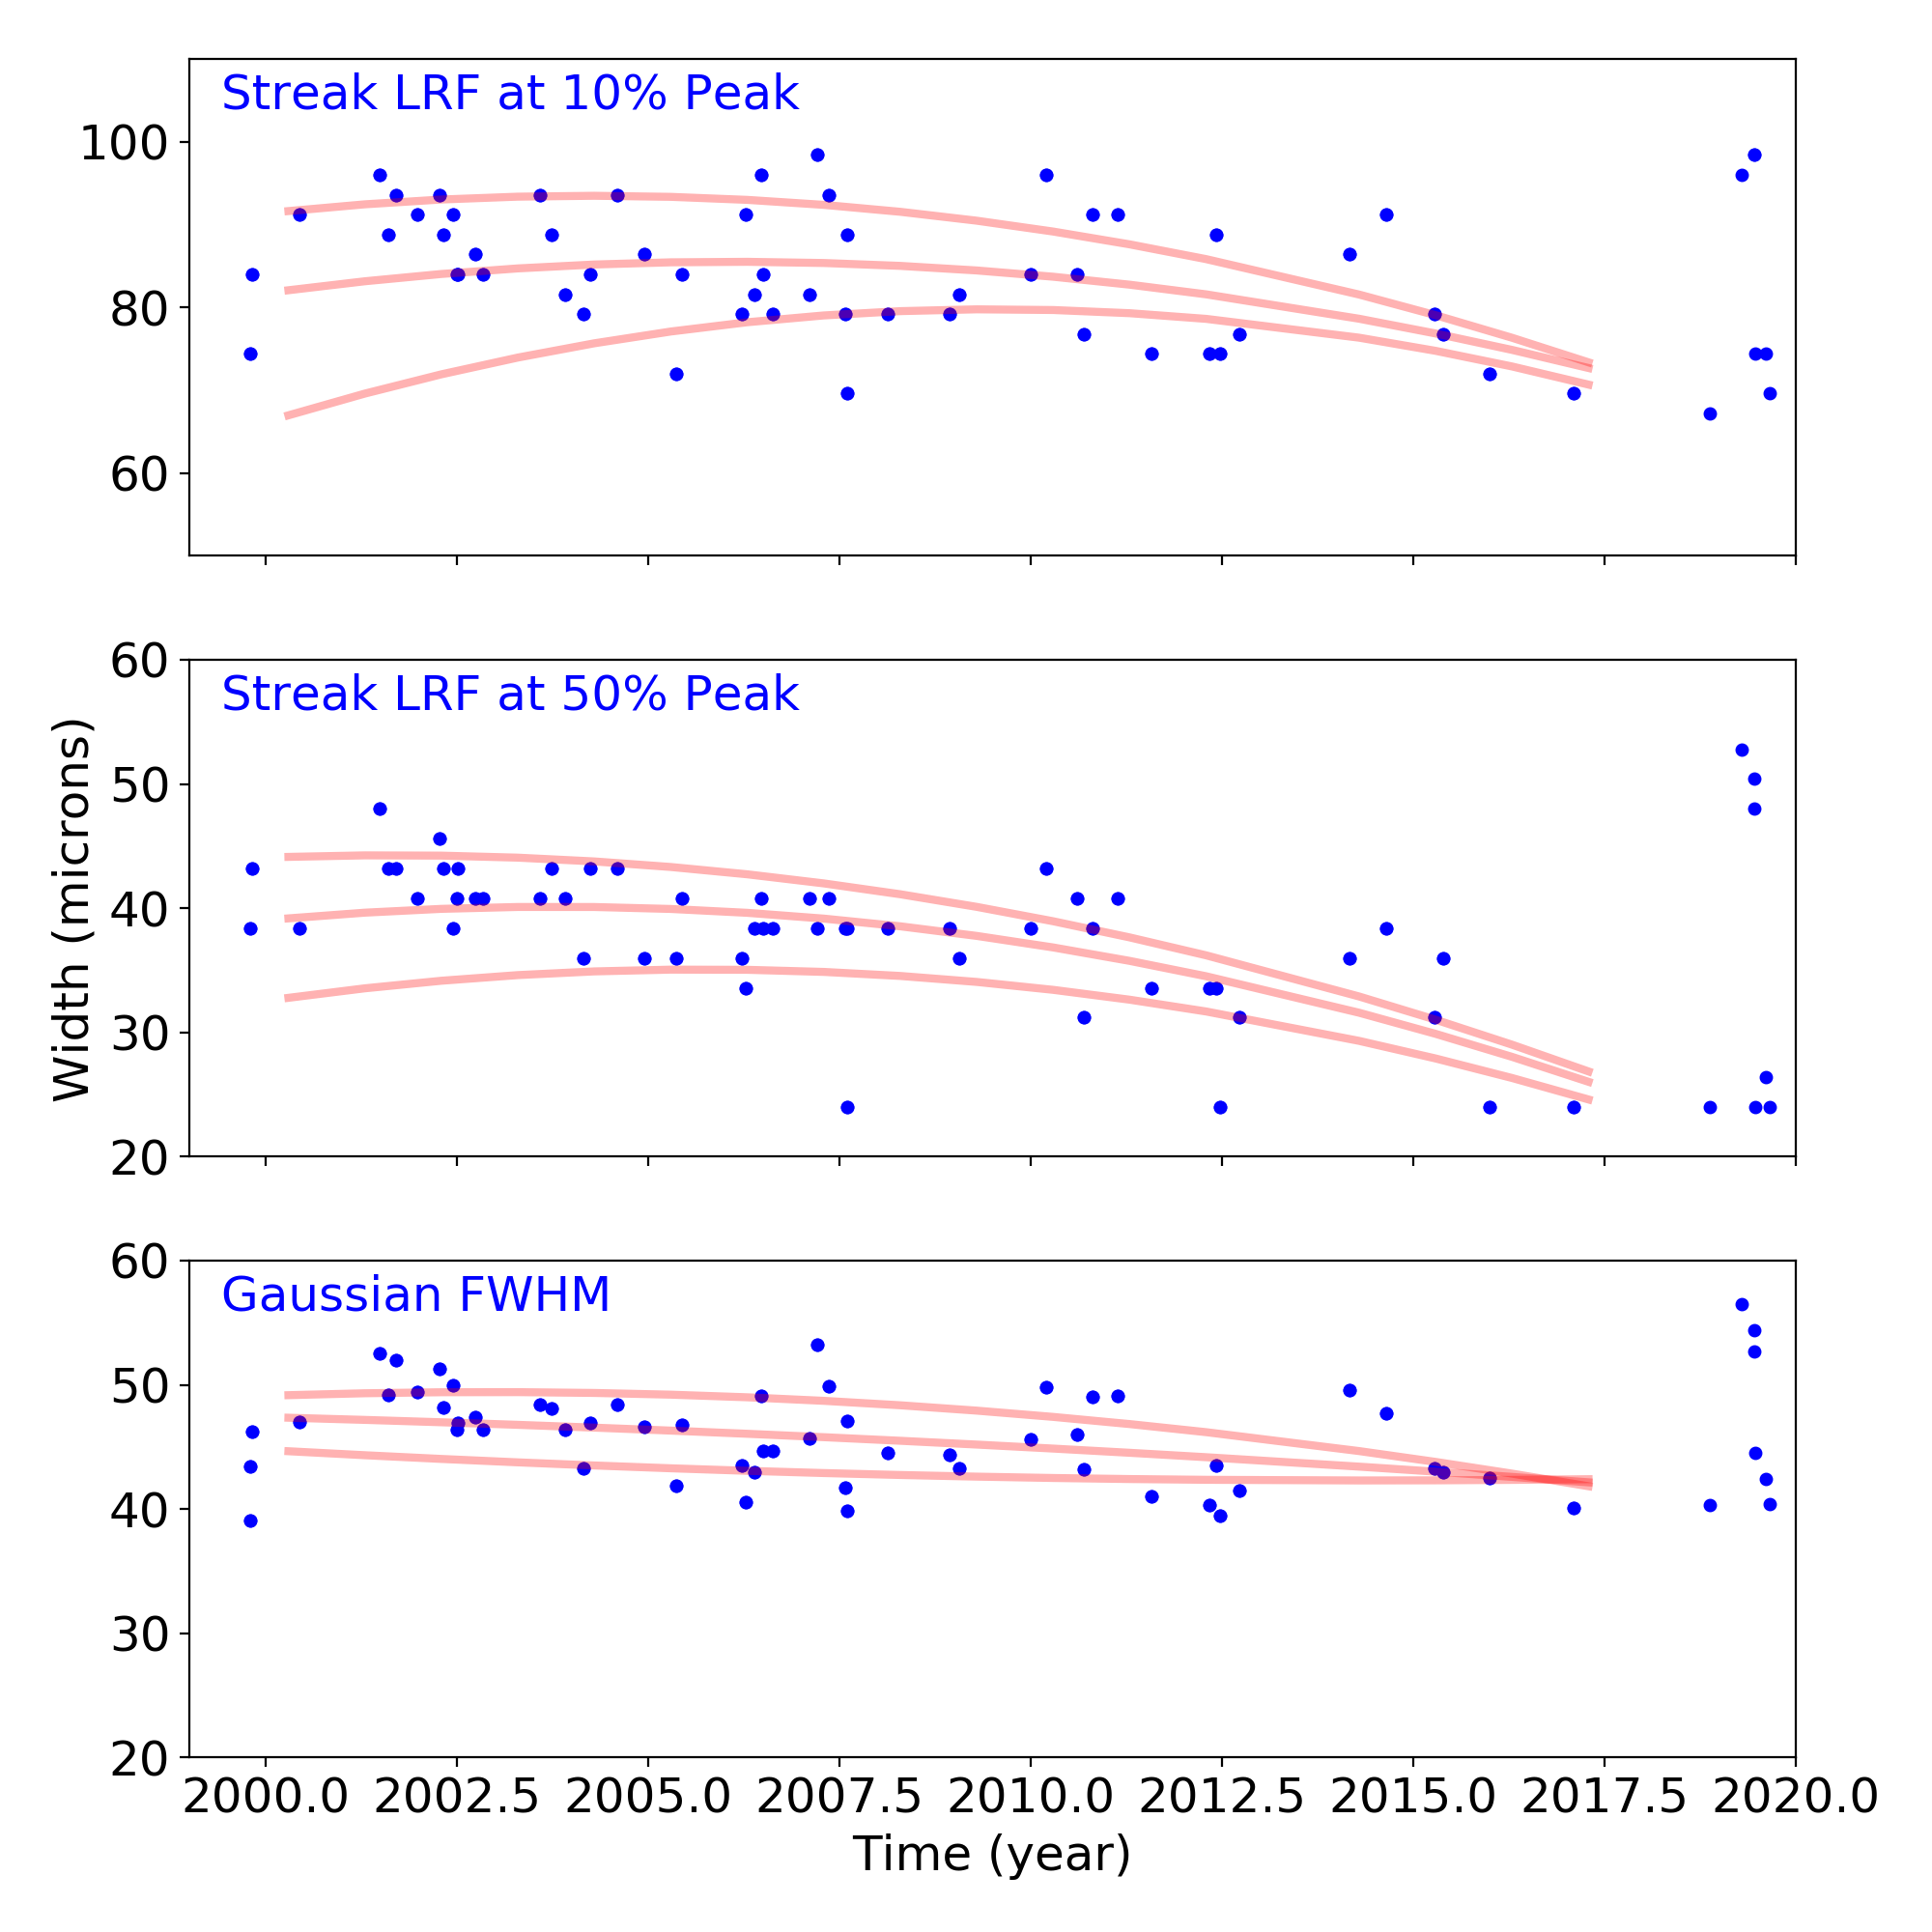
Grating Trends/Focus
We plot the width of the zero order streak of ACIS/HETG observations and the width of the zero order image for HRC/LETG observations of point sources. No significant defocusing trend is seen at this time. See Gratings Trends pages.
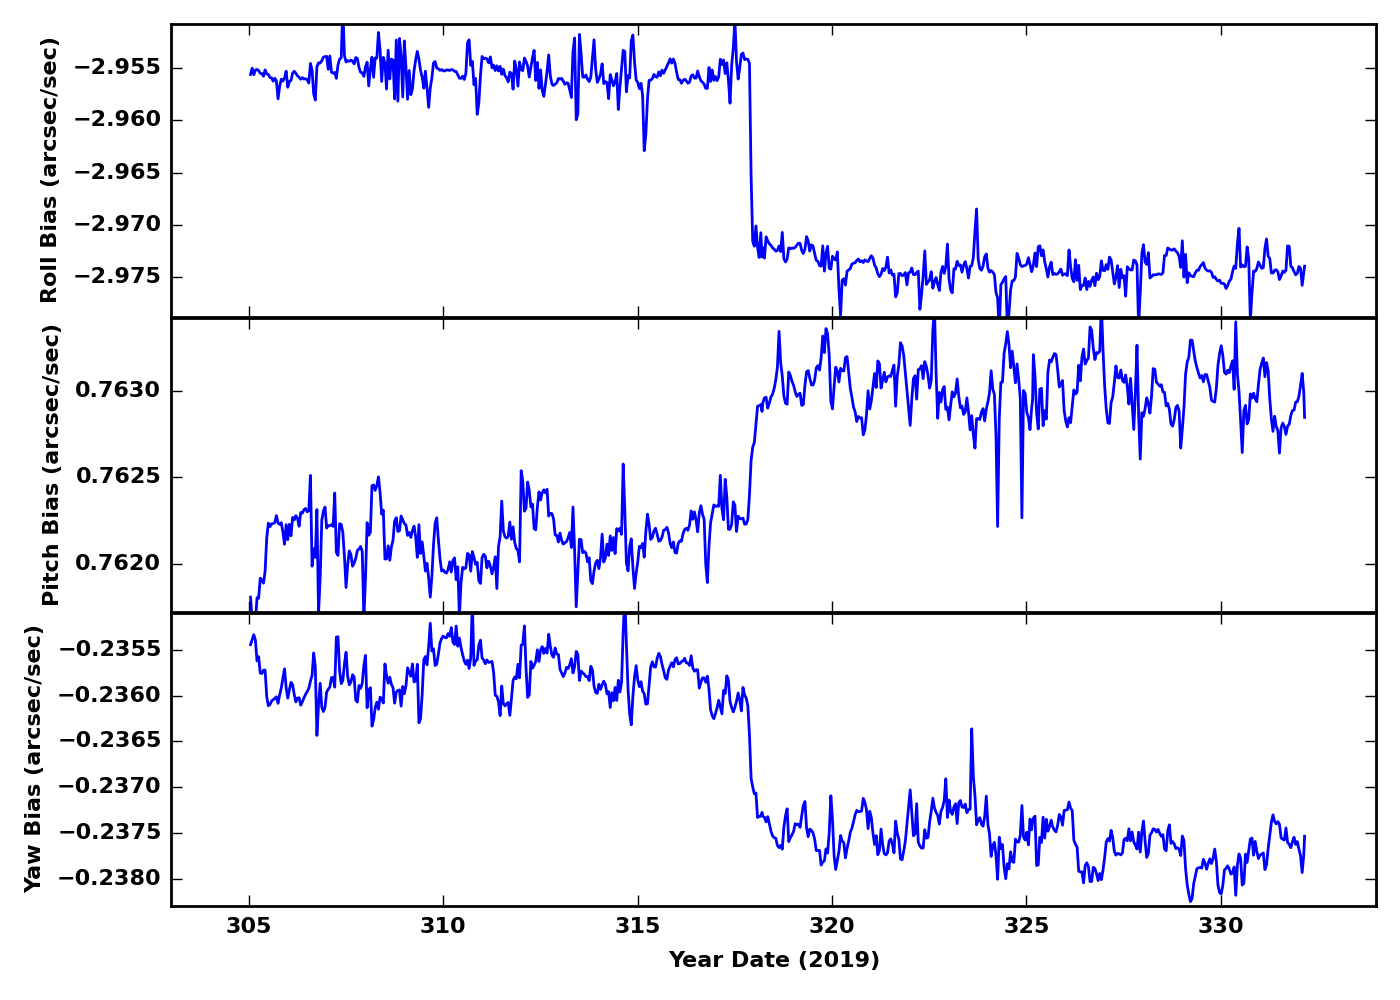
PCAD
ACA Trending
Gyro Bias Drift
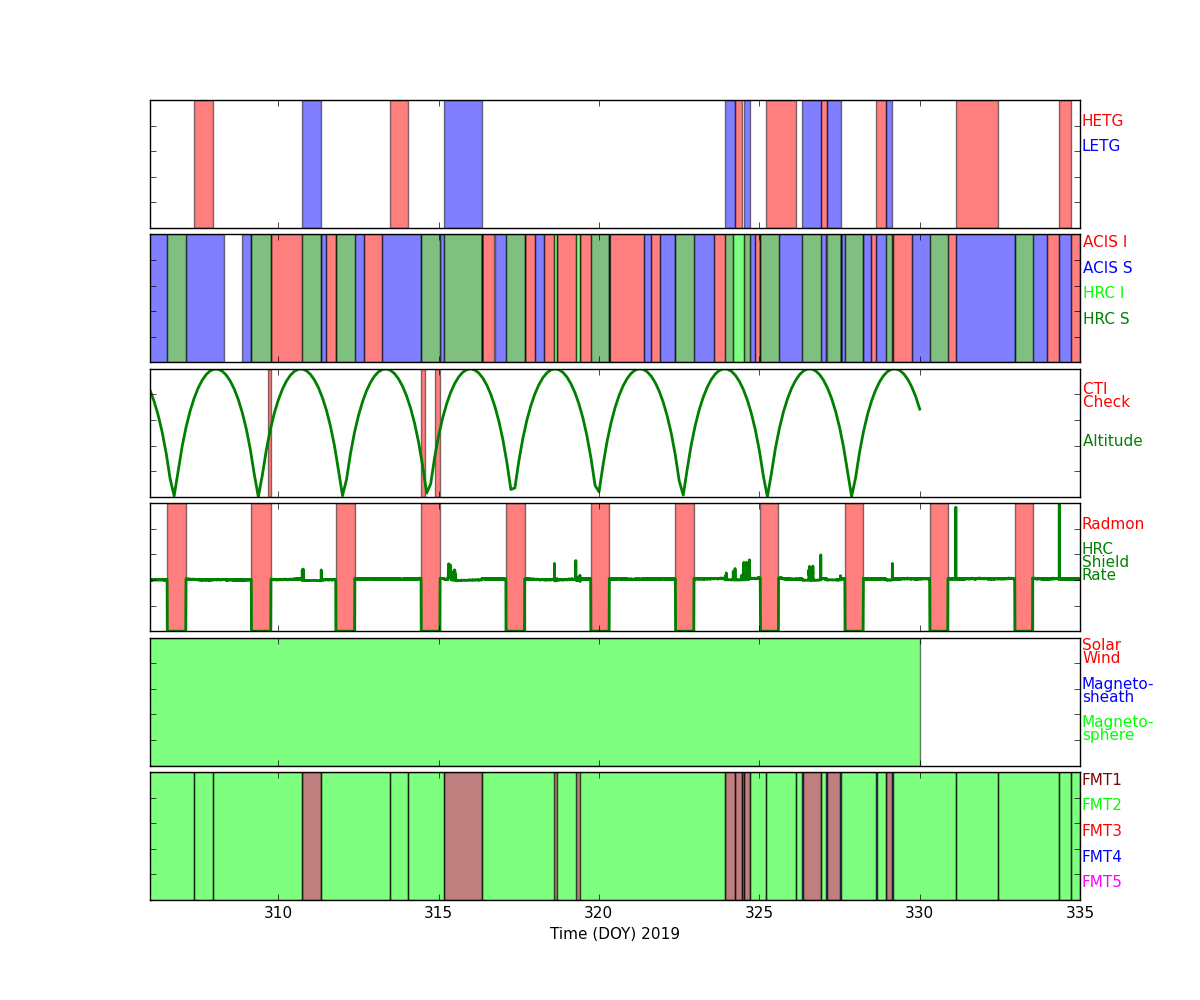
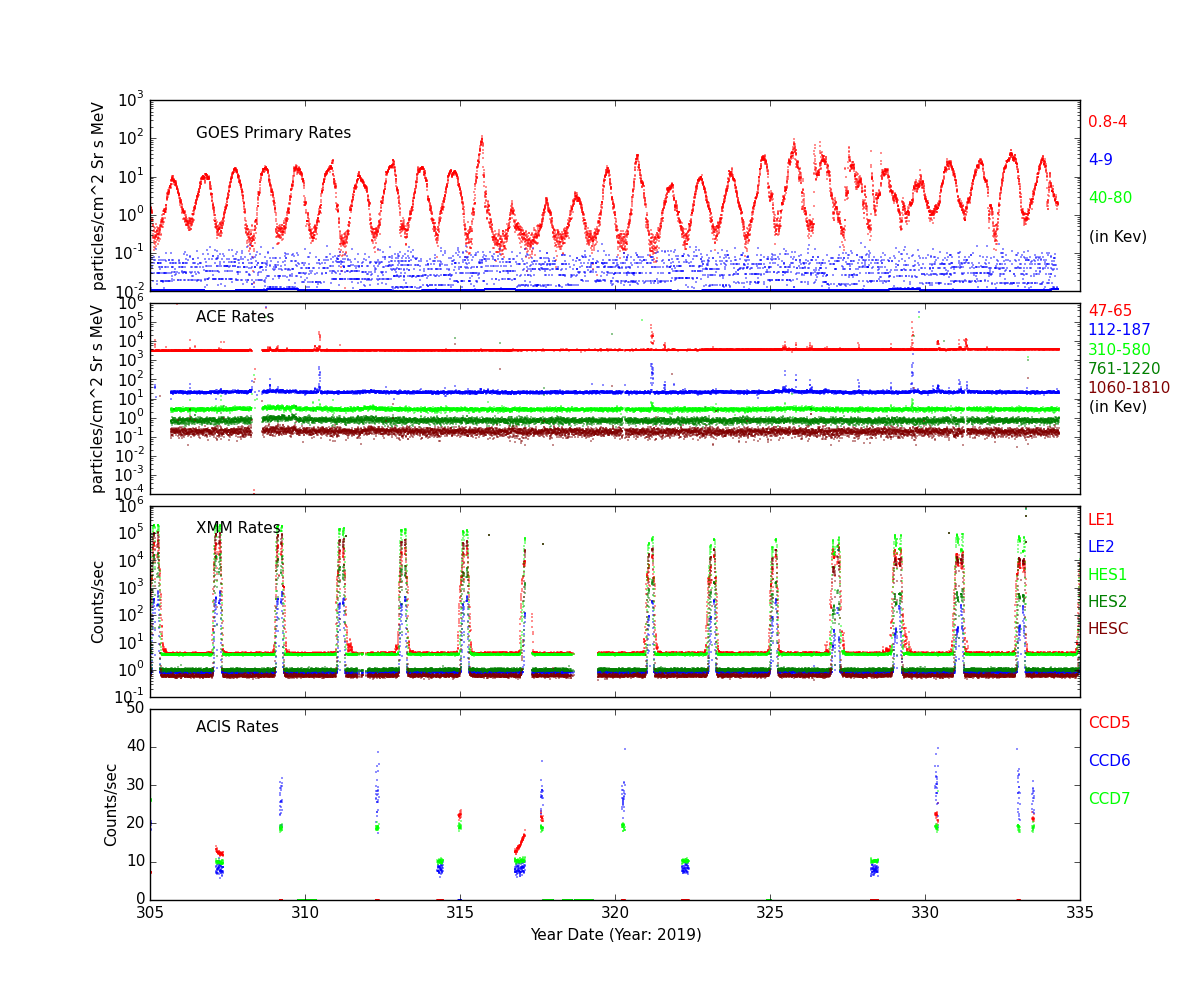
Radiation History
Radiation Count Rates of Nov 2019
Sun Spot History
Trending
Quarterly Trends
- HRMA Heater
| Previous Quarter | ||||||
| MSID | MEAN | RMS | DELTA/YR | DELTA/YR/YR | UNITS | DESCRIPTION |
| ohrthr03 | 295.229 | 0.007 | (-9.89+/-1.90)e-6 | 0.003+/-0.002 | K | RT 5: HRMA FORWARD APERTURE PLATE |
|---|---|---|---|---|---|---|
| ohrthr09 | 295.410 | 0.194 | (3.29+/-0.59)e-4 | 0.016+/-0.044 | K | RT 105: HRMA CAP |
| ohrthr17 | 295.340 | 0.208 | (4.30+/-0.63)e-4 | 0.018+/-0.046 | K | RT 125: HSA OUTER CYNLINDER |
| ohrthr24 | 296.058 | 0.419 | (9.82+/-1.28)e-4 | 0.036+/-0.084 | K | RT 12: HRMA AFT HEATER PLATE |
| ohrthr38 | 298.640 | 1.272 | 0.002+/-0.000 | 0.090+/-0.203 | K | RT 120: HRMA AFT COLLIMATOR OUTER CYLINDER |
| ohrthr52 | 295.303 | 0.202 | (3.63+/-0.61)e-4 | 0.017+/-0.045 | K | RT 100: HRMA CAP |
- HRMA Thermal
| Previous Quarter | ||||||
| MSID | MEAN | RMS | DELTA/YR | DELTA/YR/YR | UNITS | DESCRIPTION |
| 4rt568t | 297.779 | 1.438 | 0.002+/-0.000 | 0.052+/-0.238 | K | RT 568 - HRMA AHS INNER CYLINDER |
|---|---|---|---|---|---|---|
| 4rt569t | 295.884 | 0.373 | 0.001+/-0.000 | 0.008+/-0.077 | K | RT 569 - PERISCOPE (FIRST FOLD END) |
| 4rt570t | 295.299 | 0.195 | (4.65+/-0.48)e-4 | 0.002+/-0.041 | K | RT 570 - HRMA RRCA |
| 4rt575t | 301.868 | 1.765 | 0.002+/-0.001 | 0.058+/-0.280 | K | RT 575 - OB FWD CONE TEMP |
| 4rt576t | 293.775 | 1.368 | 0.002+/-0.000 | 0.067+/-0.235 | K | RT 576 - OB FWD CONE TEMP |
| 4rt578t | 299.964 | 3.131 | 0.005+/-0.001 | 0.114+/-0.380 | K | RT 578 - OB MID CONE TEMP |
- MUPS
| Previous Quarter | ||||||
| MSID | MEAN | RMS | DELTA/YR | DELTA/YR/YR | UNITS | DESCRIPTION |
| pm1thv1t | 346.991 | 13.278 | 0.009+/-0.004 | -0.357+/-0.798 | K | MUPS 1 THRUSTER VALVE 01 TEMP |
|---|---|---|---|---|---|---|
| pline02t | 327.736 | 12.713 | 0.009+/-0.004 | 0.067+/-0.981 | K | PROP LINE TEMP 02 |
| pline03t | 323.444 | 16.014 | 0.015+/-0.005 | 0.332+/-1.195 | K | PROP LINE TEMP 03 |
| pline04t | 308.861 | 12.491 | 0.011+/-0.004 | 0.524+/-1.130 | K | PROP LINE TEMP 04 |
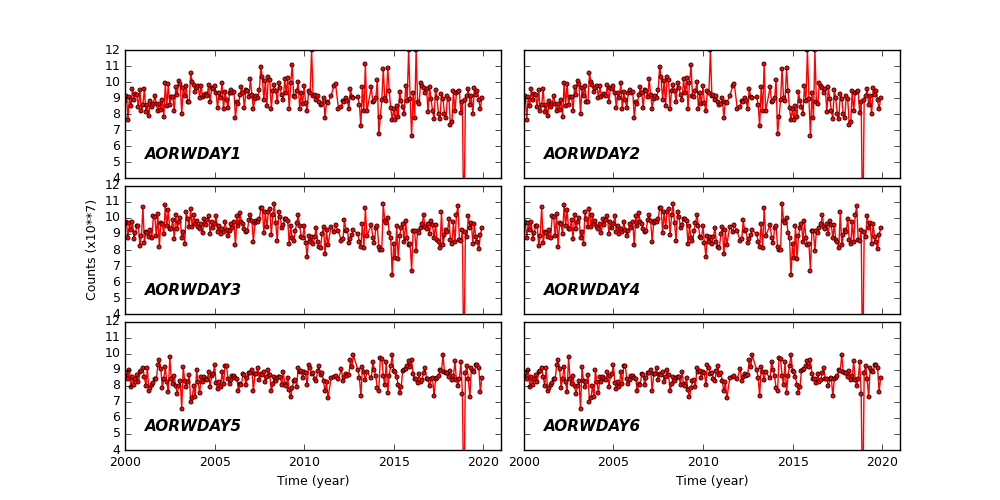
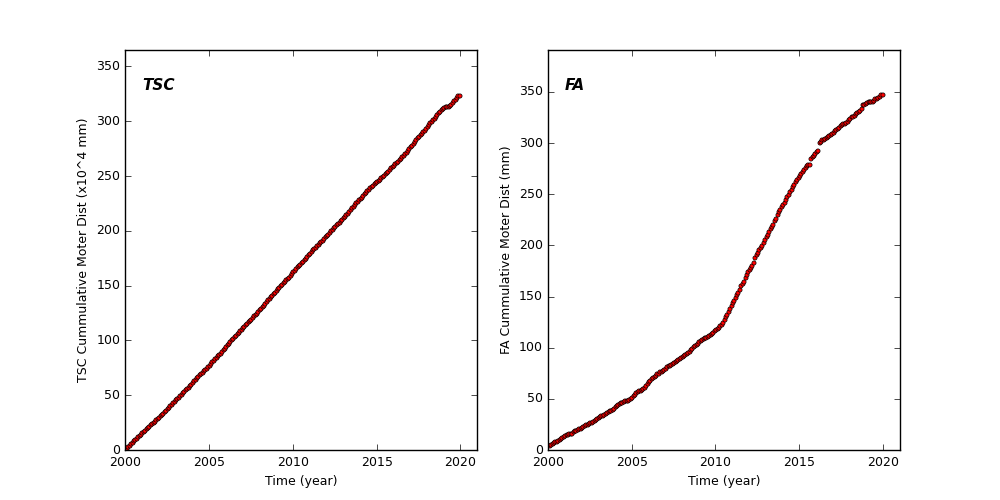
Spacecraft Motions
TSC and FA Cummulative Moter Distance
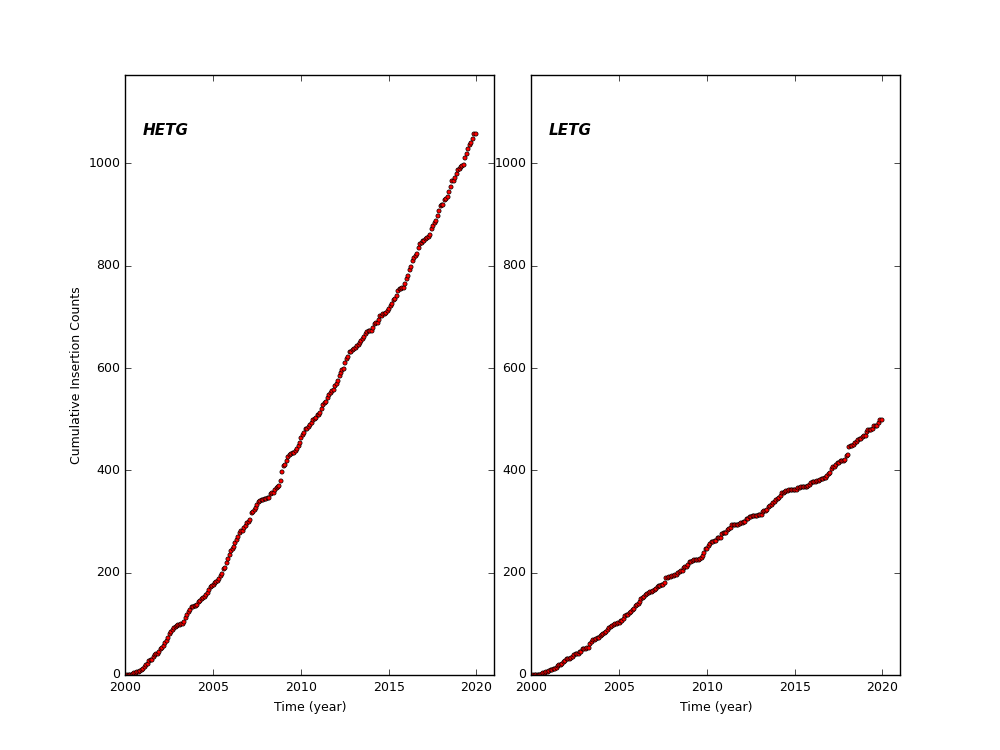
HETG and LETG Cummulative Insertion Counts
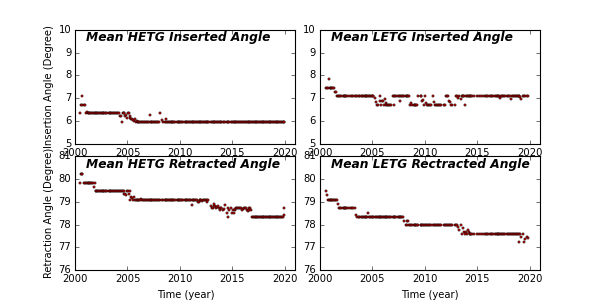
HETG/LETG Insertion/Retraction Angle
Reaction Wheel Rotations