ACIS
ACIS DOSE Registered-Photon-Map
The steps we took to compute the dose map are;
- Level 1 Event files for a specified month are obtained from archive.
- Image data including I2, I3, S2, S3 CCDs are extracted from all event files.
- All the extracted image data were merged to create a month long exposure map for the month.
- The exposure map is opened with ds9, and check a distribution of count rates against energy. From this, estimate the upper threshold value. Any events beyond this upper threshold are assumed erroneous events such as bad pixels.
- Using this upper threshold, the data is filtered, and create a cleaned exposure map for the month.
- The exposure map from each month from the Sep 1999 is added up to create a cumulative exposure map for each month.
- Using fimgstatistic, we compute count rate statistics for each CCDs.
- For observations with high data drop rates (e.g., Crab nebula, Cas A), we corrected the observations by adding events.
Please check more detail plots at Telemetered Photon Dose Trend page.
)
)
)
Statistics:
# IMAGE     NPIX     MEAN        RMS        MIN     MAX
ACIS_sep19 6004901       9.140         14.181           0.0     5915


I2 node 0  262654	10.640430	4.258921	0.0	 74.0
I2 node 1  262654	11.248765	13.175150	0.0	5915.0
I2 node 2  262654	11.111011	4.248832	0.0	135.0
I2 node 3  262654	10.996599	8.351019	0.0	3562.0

I3 node 0  262654	11.831042	10.978855	0.0	5064.0
I3 node 1  262654	11.370318	4.279319	0.0	160.0
I3 node 2  262654	11.162695	4.175299	0.0	118.0
I3 node 3  262654	11.458954	4.591011	0.0	675.0

S2 node 0  262654	8.471389	6.810225	0.0	1892.0
S2 node 1  262654	8.906271	4.803269	0.0	277.0
S2 node 2  262654	10.092352	10.154422	0.0	3740.0
S2 node 3  262654	10.362788	9.424019	0.0	608.0

S3 node 0  262654	18.949996	22.789403	0.0	208.0
S3 node 1  262654	18.017383	21.242482	0.0	2668.0
S3 node 2  262654	15.033892	9.139823	0.0	414.0
S3 node 3  262654	12.934905	6.506254	0.0	 75.0
)
)
)
Statistics:
 IMAGE     NPIX      MEAN        RMS           MIN      MAX
ACIS_total   6004901       2333.331         3017.041           0.0   130555


I2 node 0  262654	2022.179936	402.600304	429.0	11673.0
I2 node 1  262654	2127.838183	565.399922	445.0	98841.0
I2 node 2  262654	2156.745861	456.609693	448.0	11852.0
I2 node 3  262654	2161.888699	558.017761	431.0	28609.0

I3 node 0  262654	2301.217520	567.399119	423.0	9502.0
I3 node 1  262654	2382.692671	1702.961284	450.0	55398.0
I3 node 2  262654	2104.473131	391.607140	429.0	12108.0
I3 node 3  262654	2096.243017	421.160559	383.0	32548.0

S2 node 0  262654	2716.584038	430.569441	1514.0	21929.0
S2 node 1  262654	2879.689212	645.134210	1679.0	15800.0
S2 node 2  262654	3185.010907	652.922630	2111.0	27818.0
S2 node 3  262654	3137.532693	510.825962	1867.0	60131.0

S3 node 0  262654	4813.292842	2310.839459	2109.0	33654.0
S3 node 1  262654	6035.352292	2286.404280	0.0	29859.0
S3 node 2  262654	4787.928121	1278.838852	2060.0	25686.0
S3 node 3  262654	3699.979159	675.811126	2269.0	25161.0
)
|
)
|
)
|
)
|
| Jun 2019 | Mar 2019 | Dec 2018 | Sep 2018 |
|---|
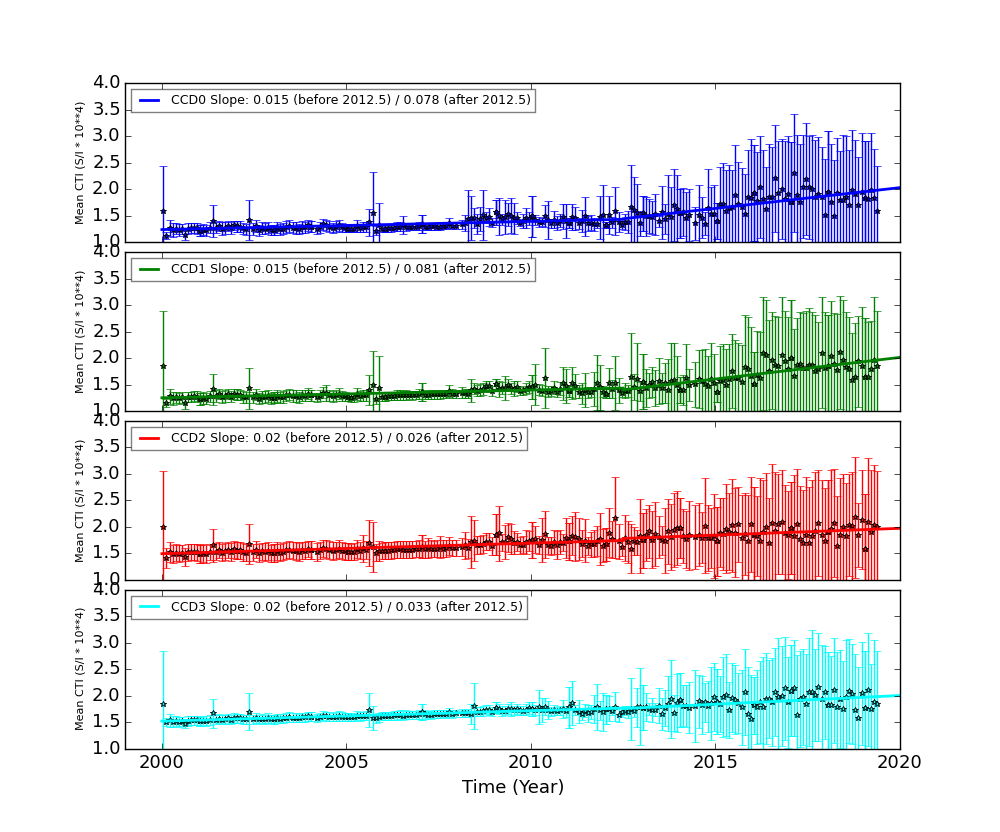
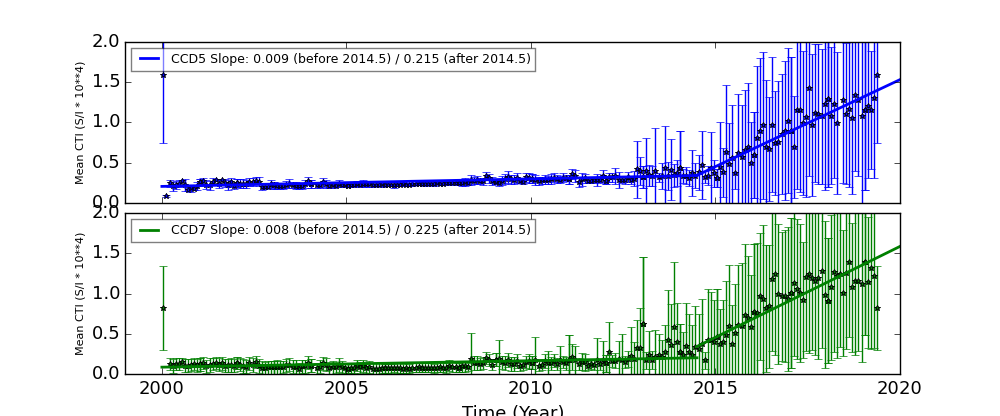
The Mean Detrended CTI
We report CTIs with a refined data definition. CTIs were computed for the temperature dependency corrected data. Please see CTI page for detailed explanation. CTI's are computed for Mn K alpha, and defined as slope/intercept x10^4 of row # vs ADU. Data file: here
Imaging CCDs
Spectral CCDs
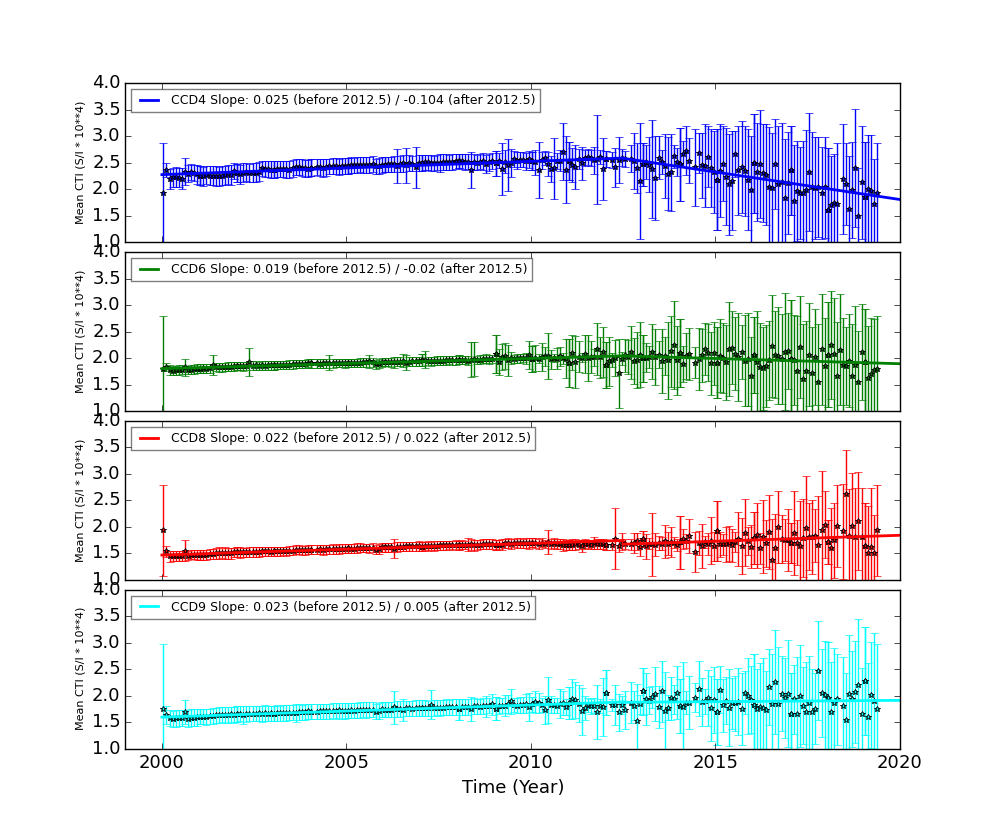
Backside CCDs
Focal Plane Temperature
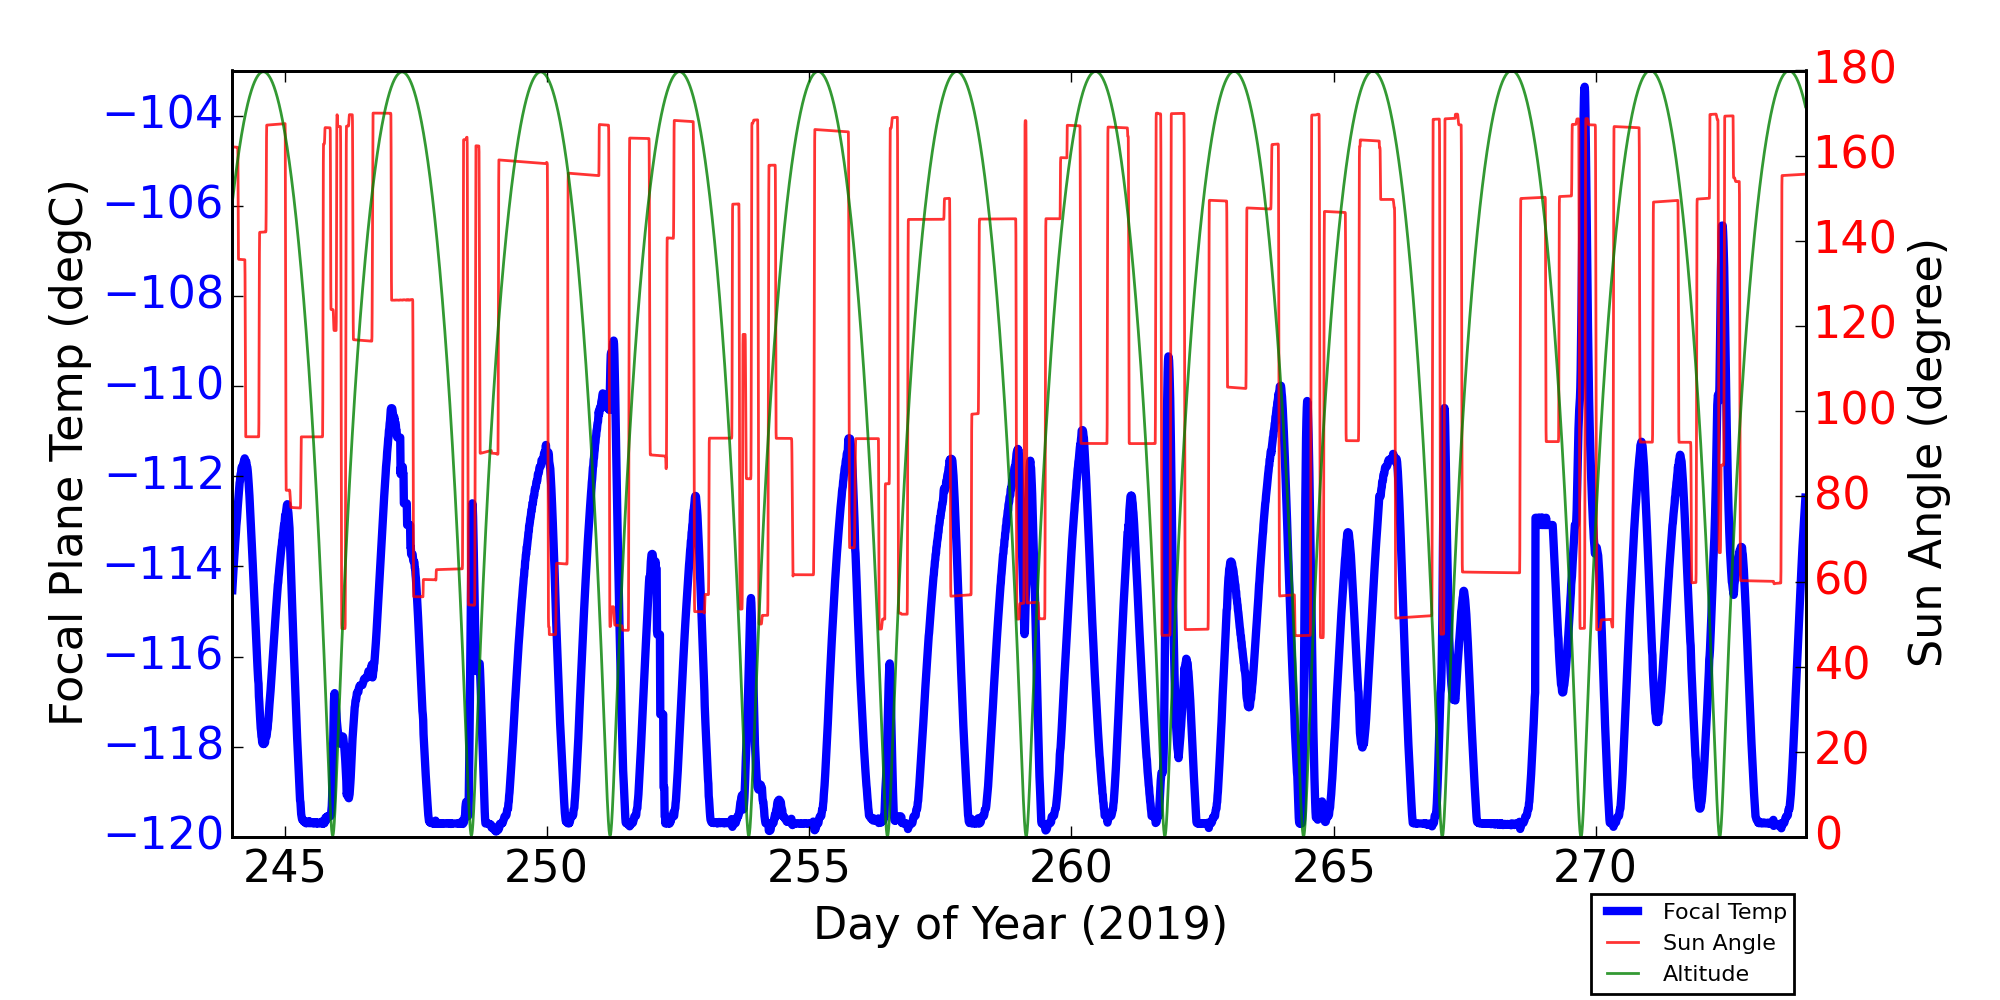
Sep 2019 Focal Temperature
| The Mean (max) FPT: | |
|---|---|
| -112.11 | +/- 2.68 C |
| Mean Width: | |
| 0.79 | +/- 0.32 days |
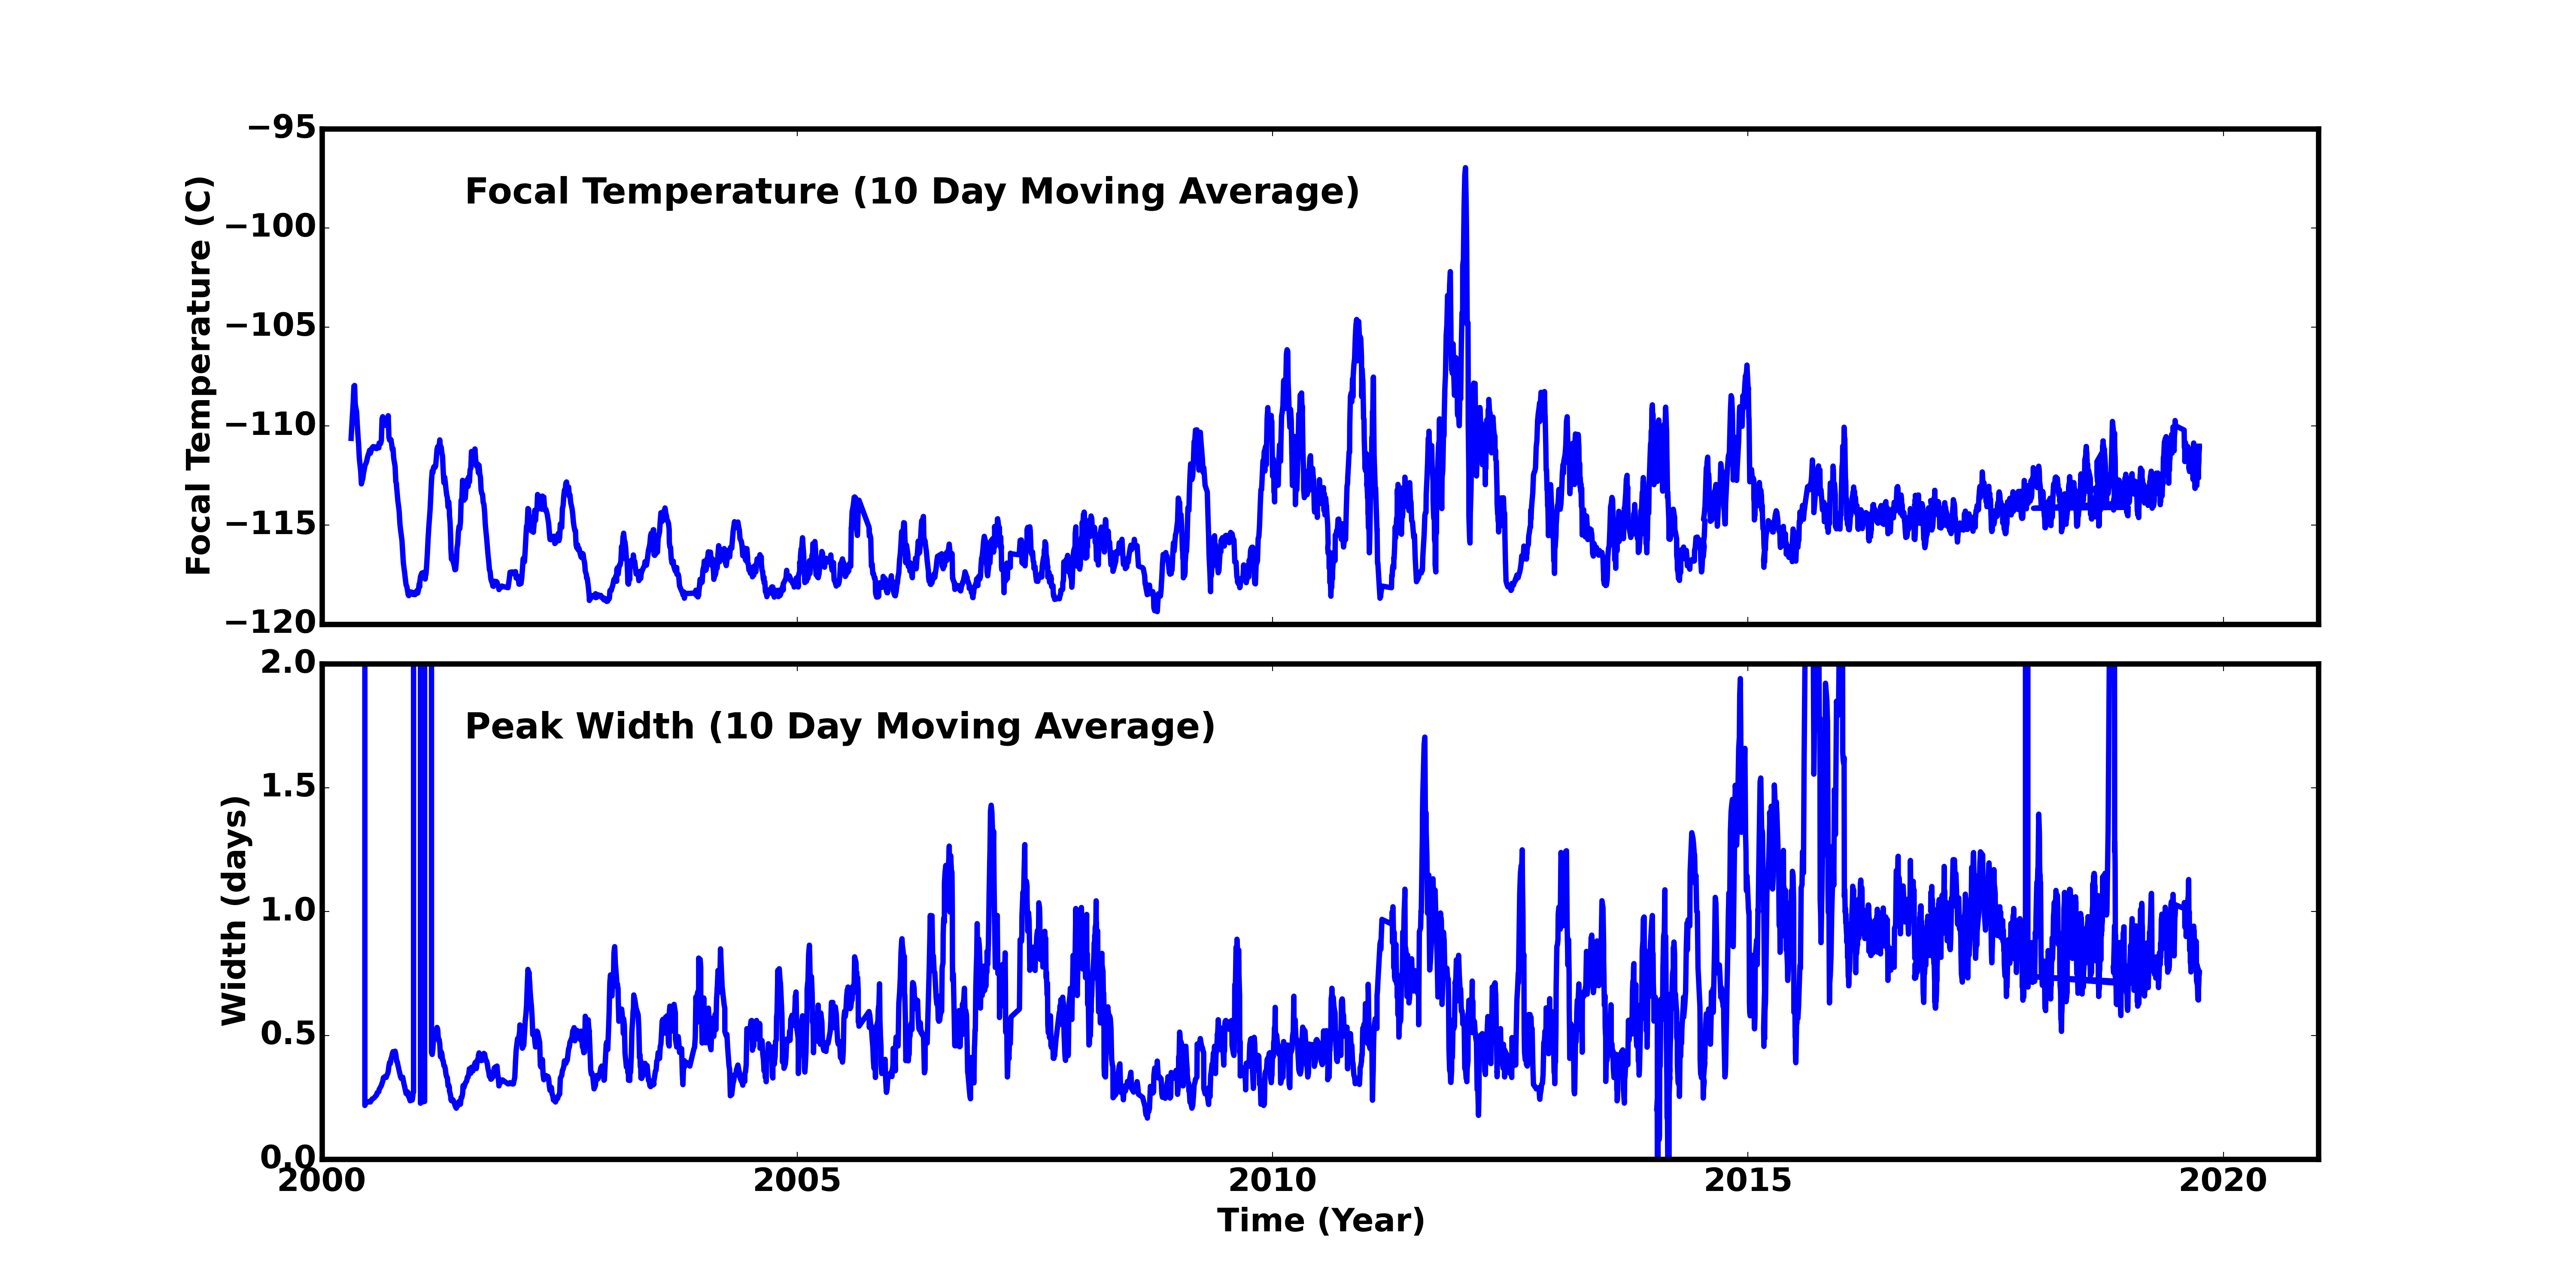
Averaged Focal Plane Temperature
We are using 10 period moving averages to show trends of peak temperatures and peak widths. Note, the gaps in the width plot are due to missing/corrupted data.
Focal Plane Temperature, Sun Angle and Altitude
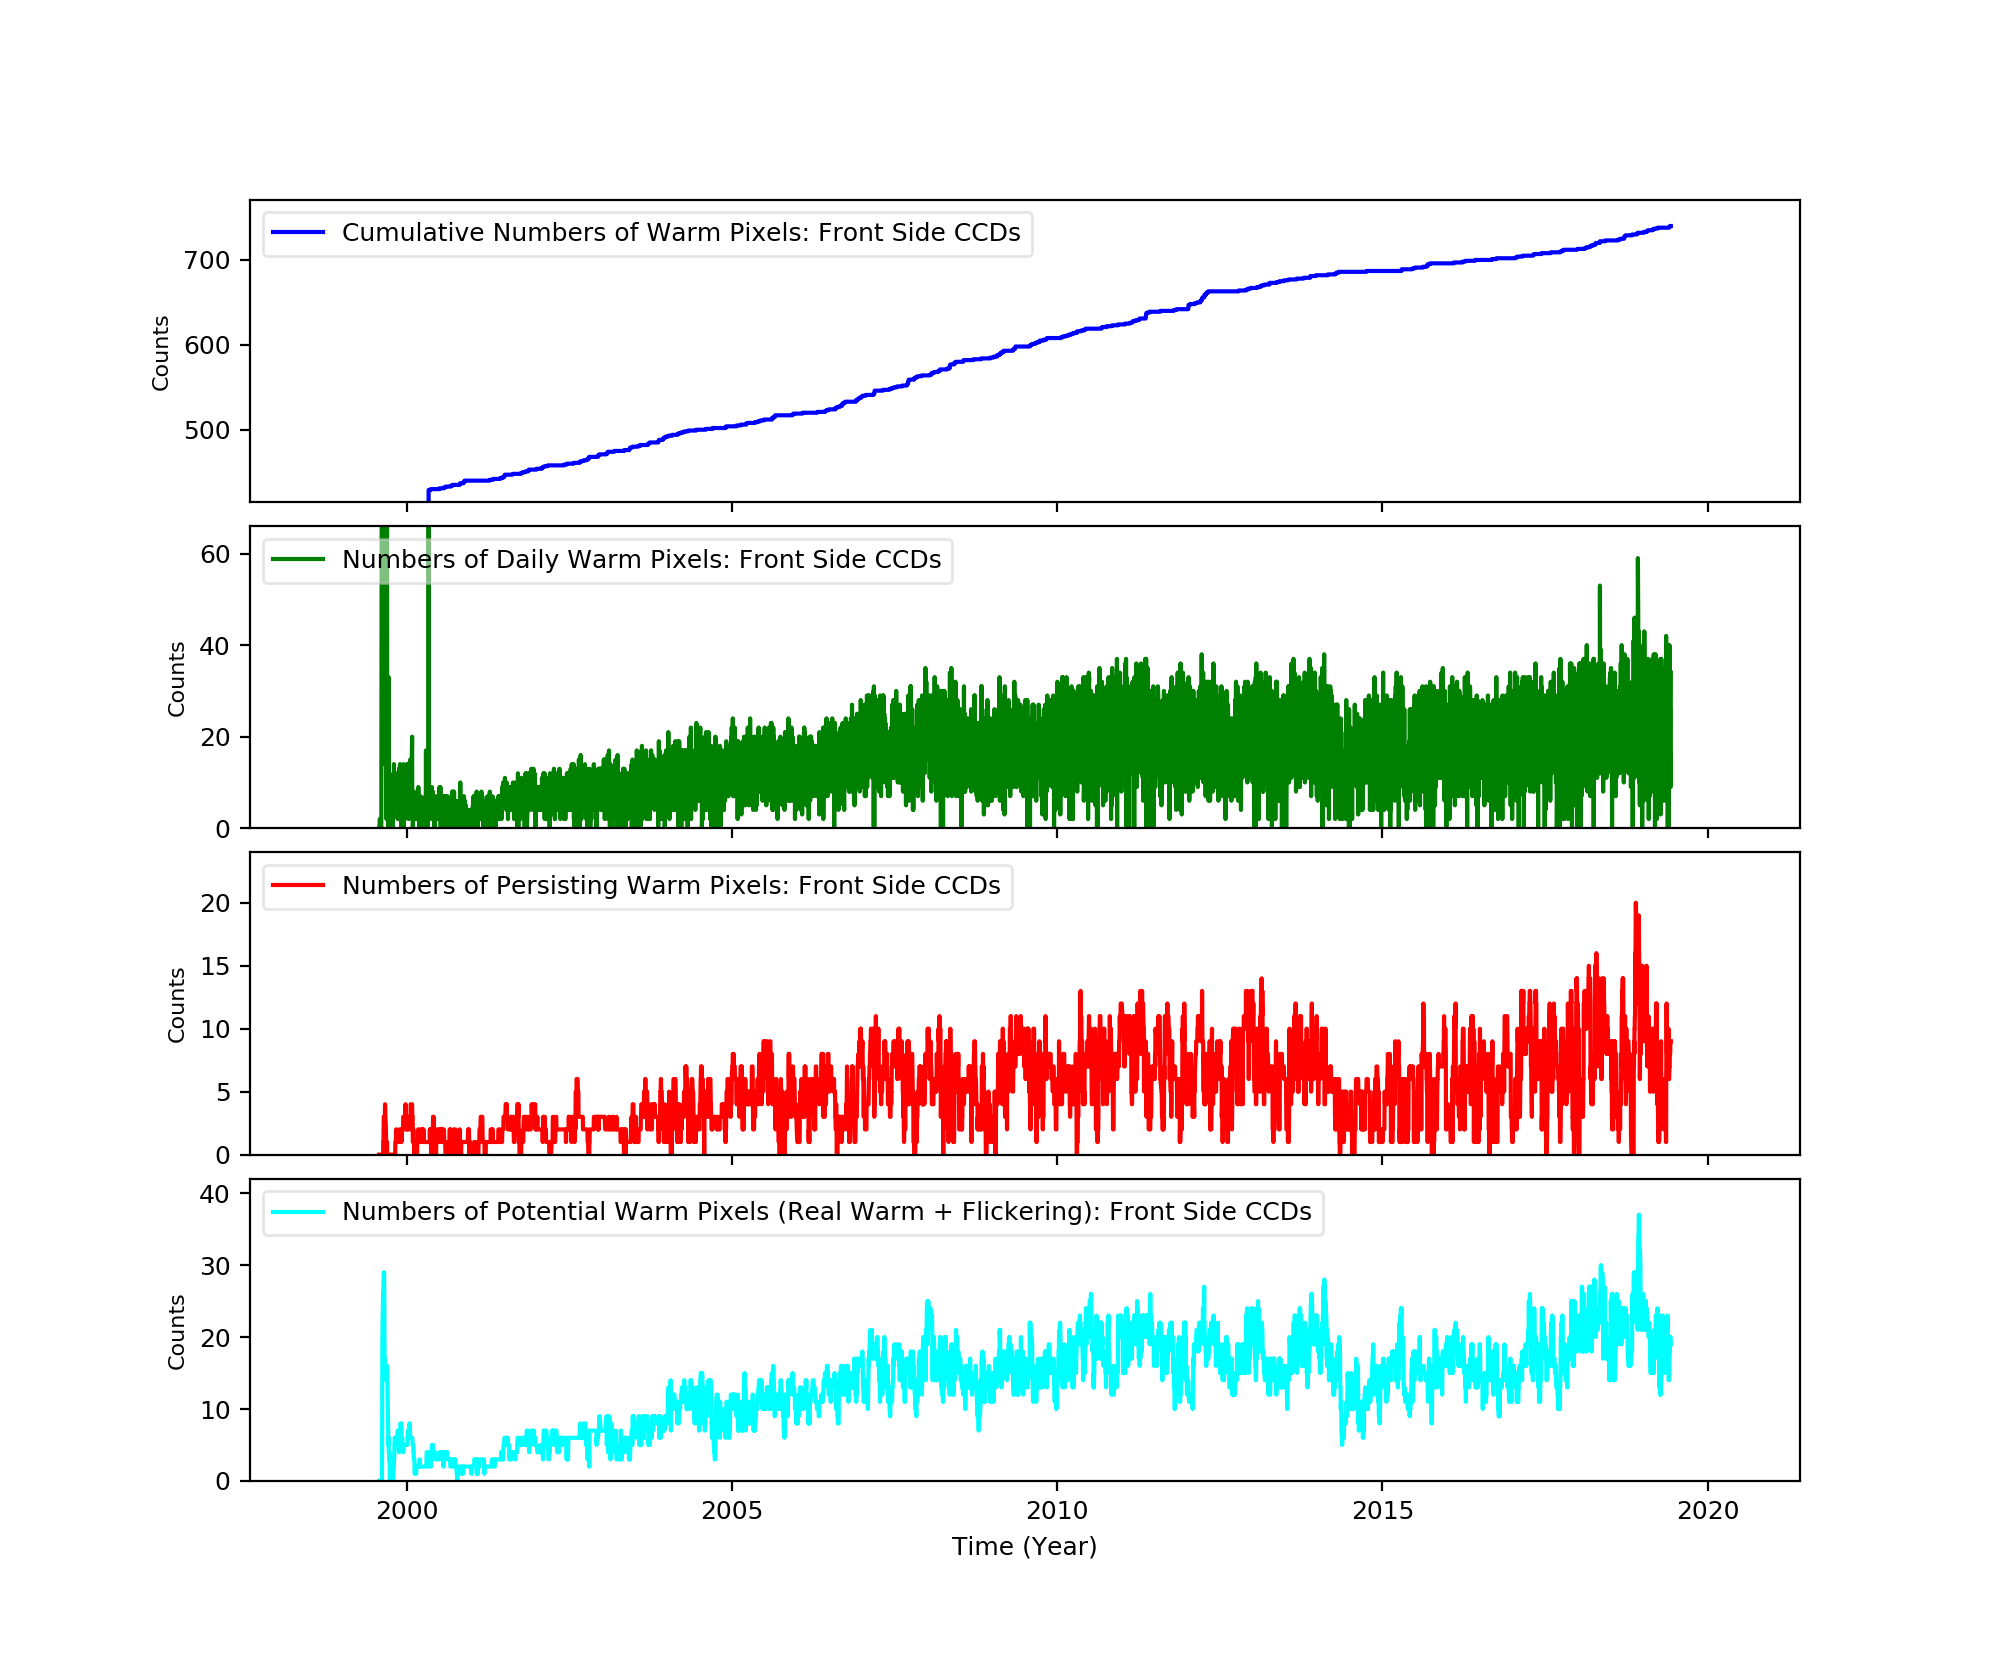
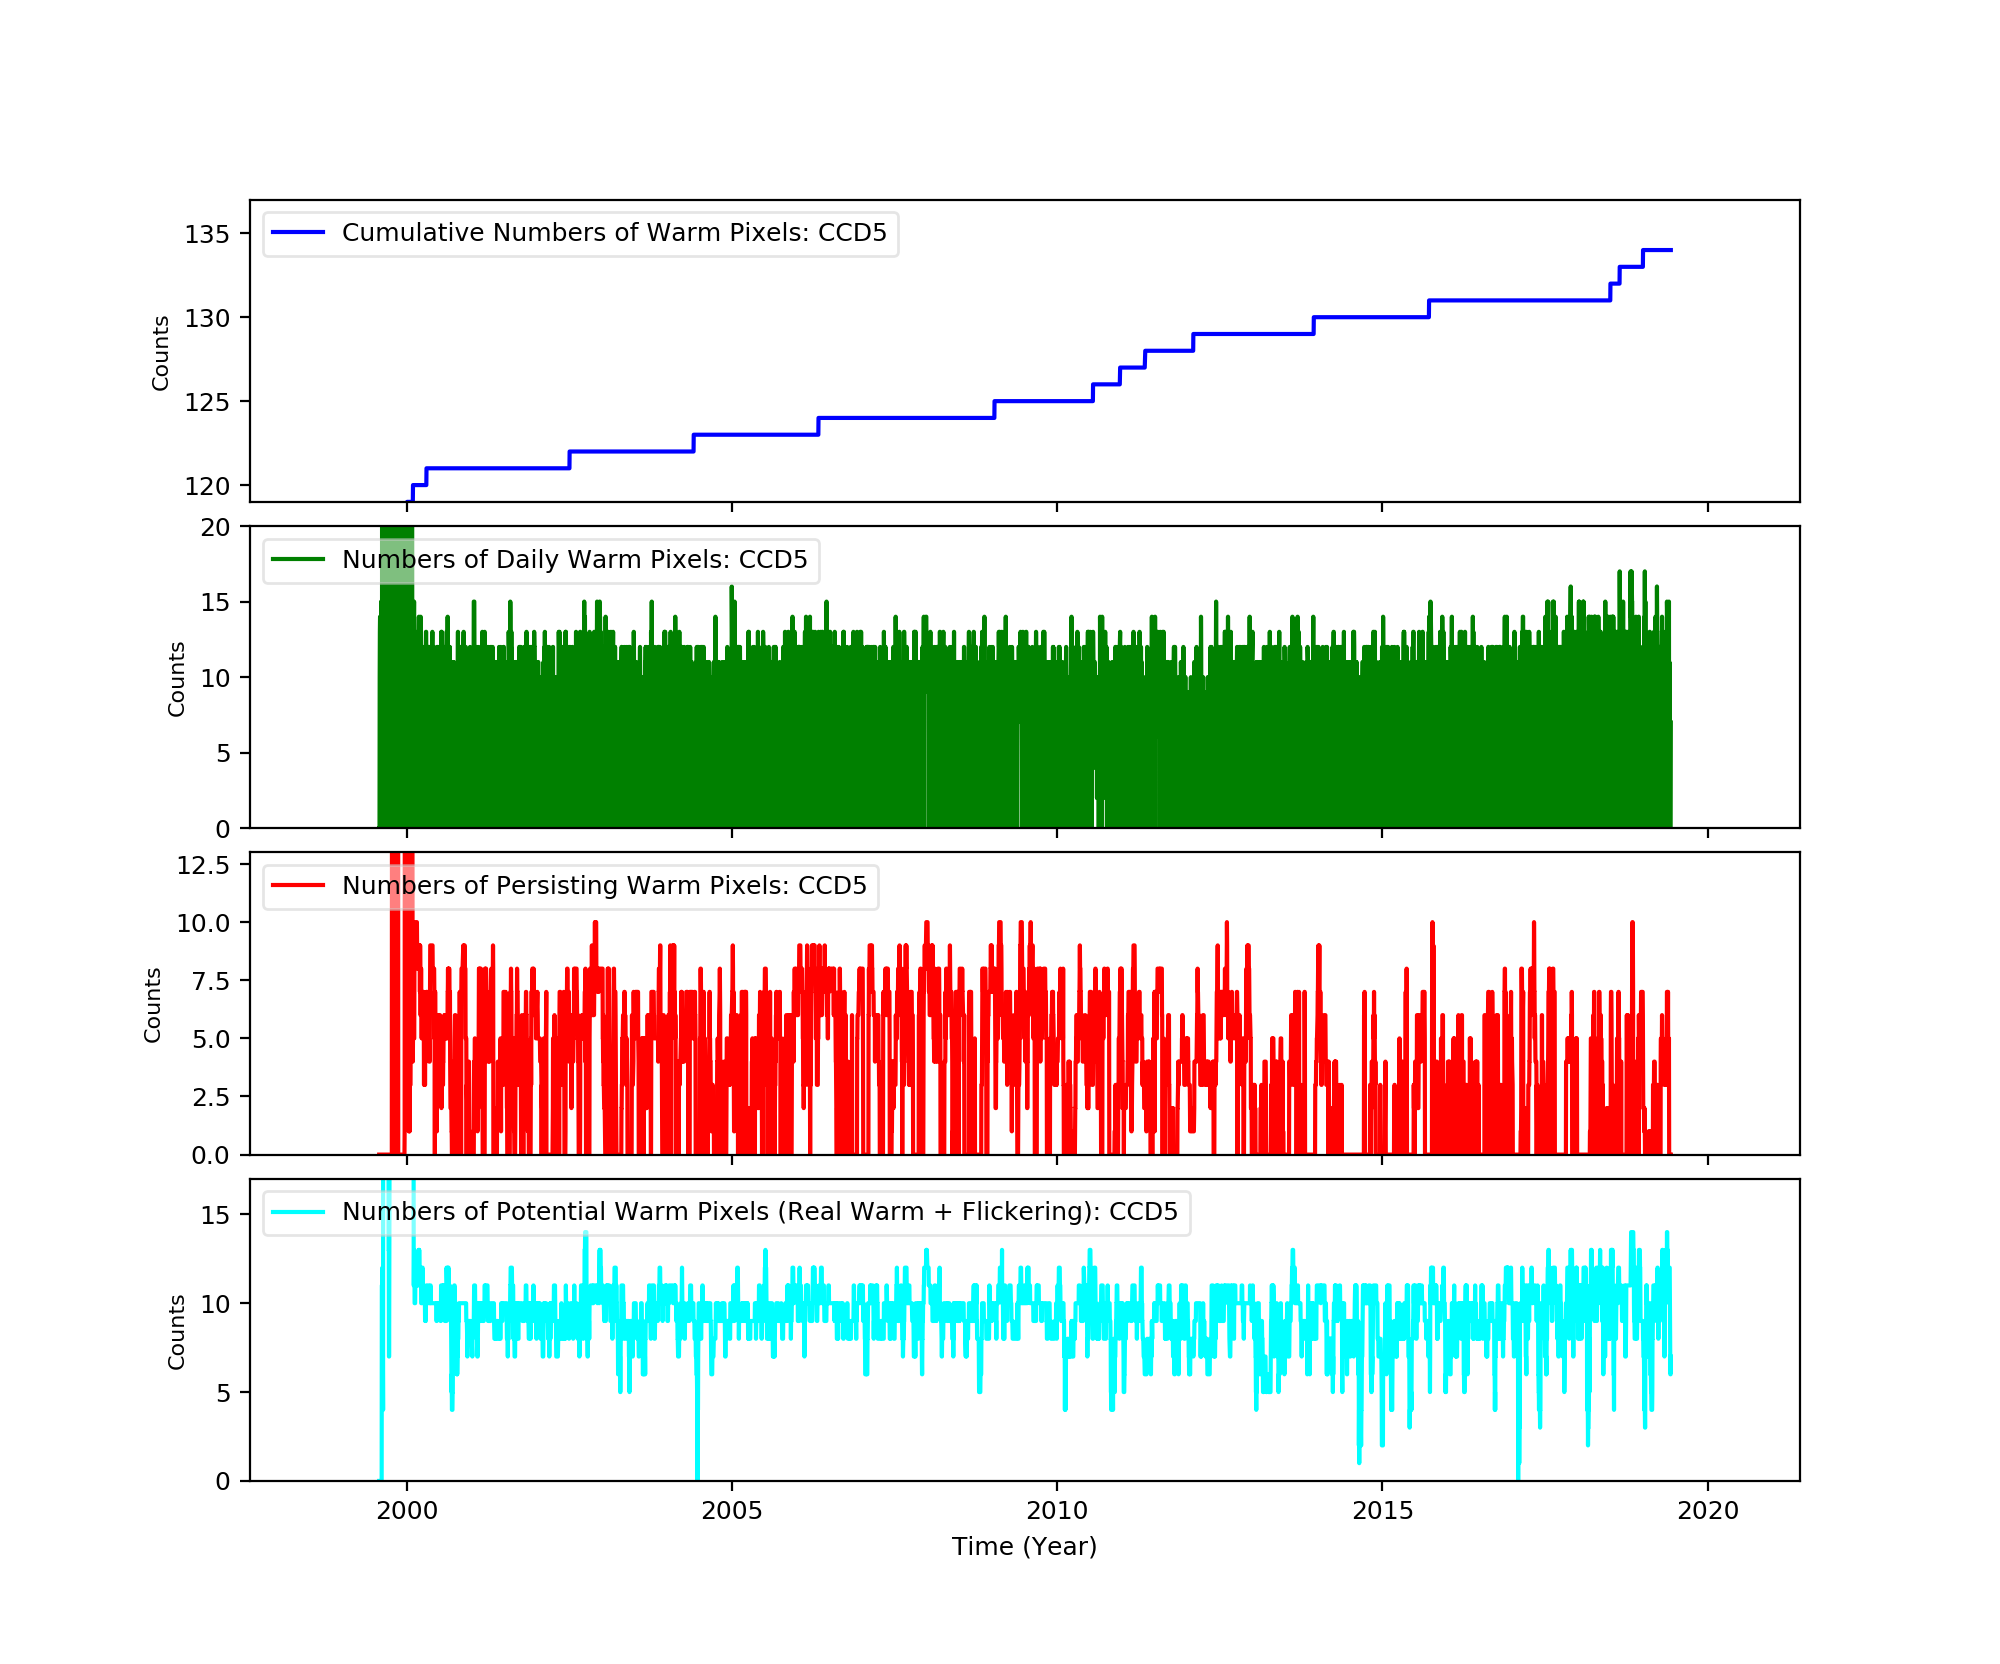
Bad Pixels
The plots below were generated with a new warm pixel finding script. Please see Acis Bad Pixel Page for details.
Front Side CCDs
Back Side CCD (CCD5)
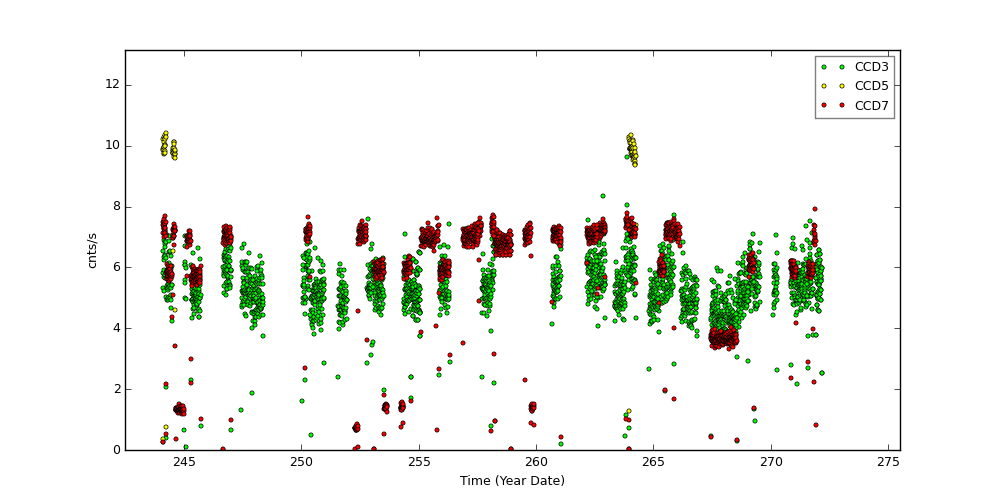
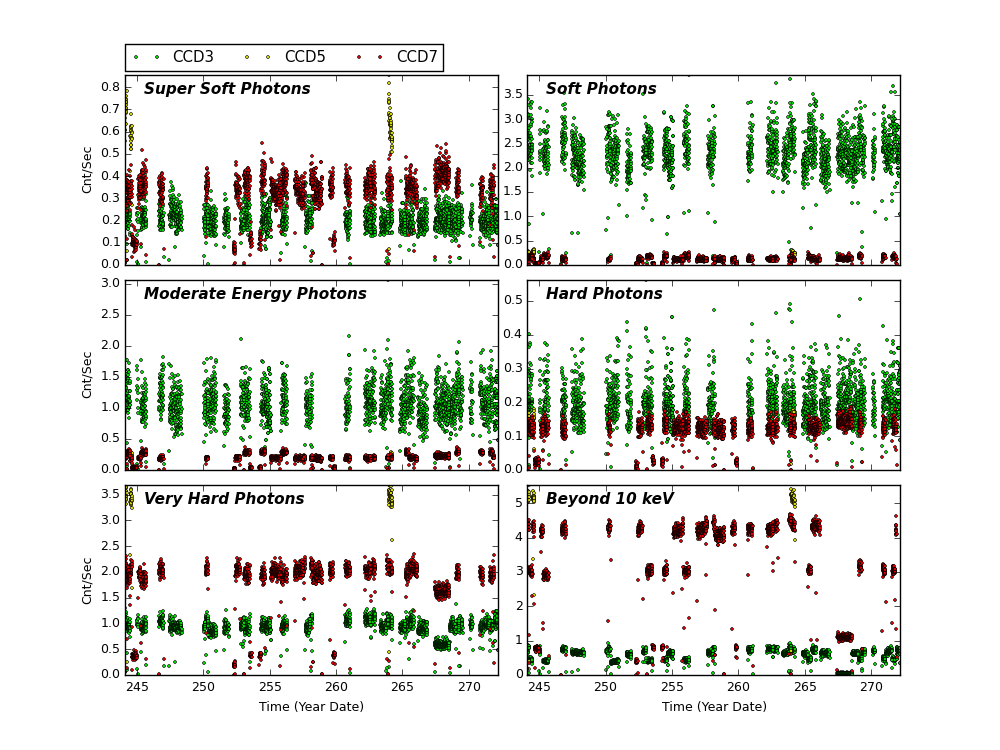
Science Instrument Background Rates
| Name | Low (keV) | High(KeV) | Description |
|---|---|---|---|
| SSoft | 0.00 | 0.50 | Super soft photons |
| Soft | 0.50 | 1.00 | Soft photons |
| Med | 1.00 | 3.00 | Moderate energy photons |
| Hard | 3.00 | 5.00 | Hard Photons |
| Harder | 5.00 | 10.00 | Very Hard photons |
| Hardest | 10.00 | Beyond 10 keV |
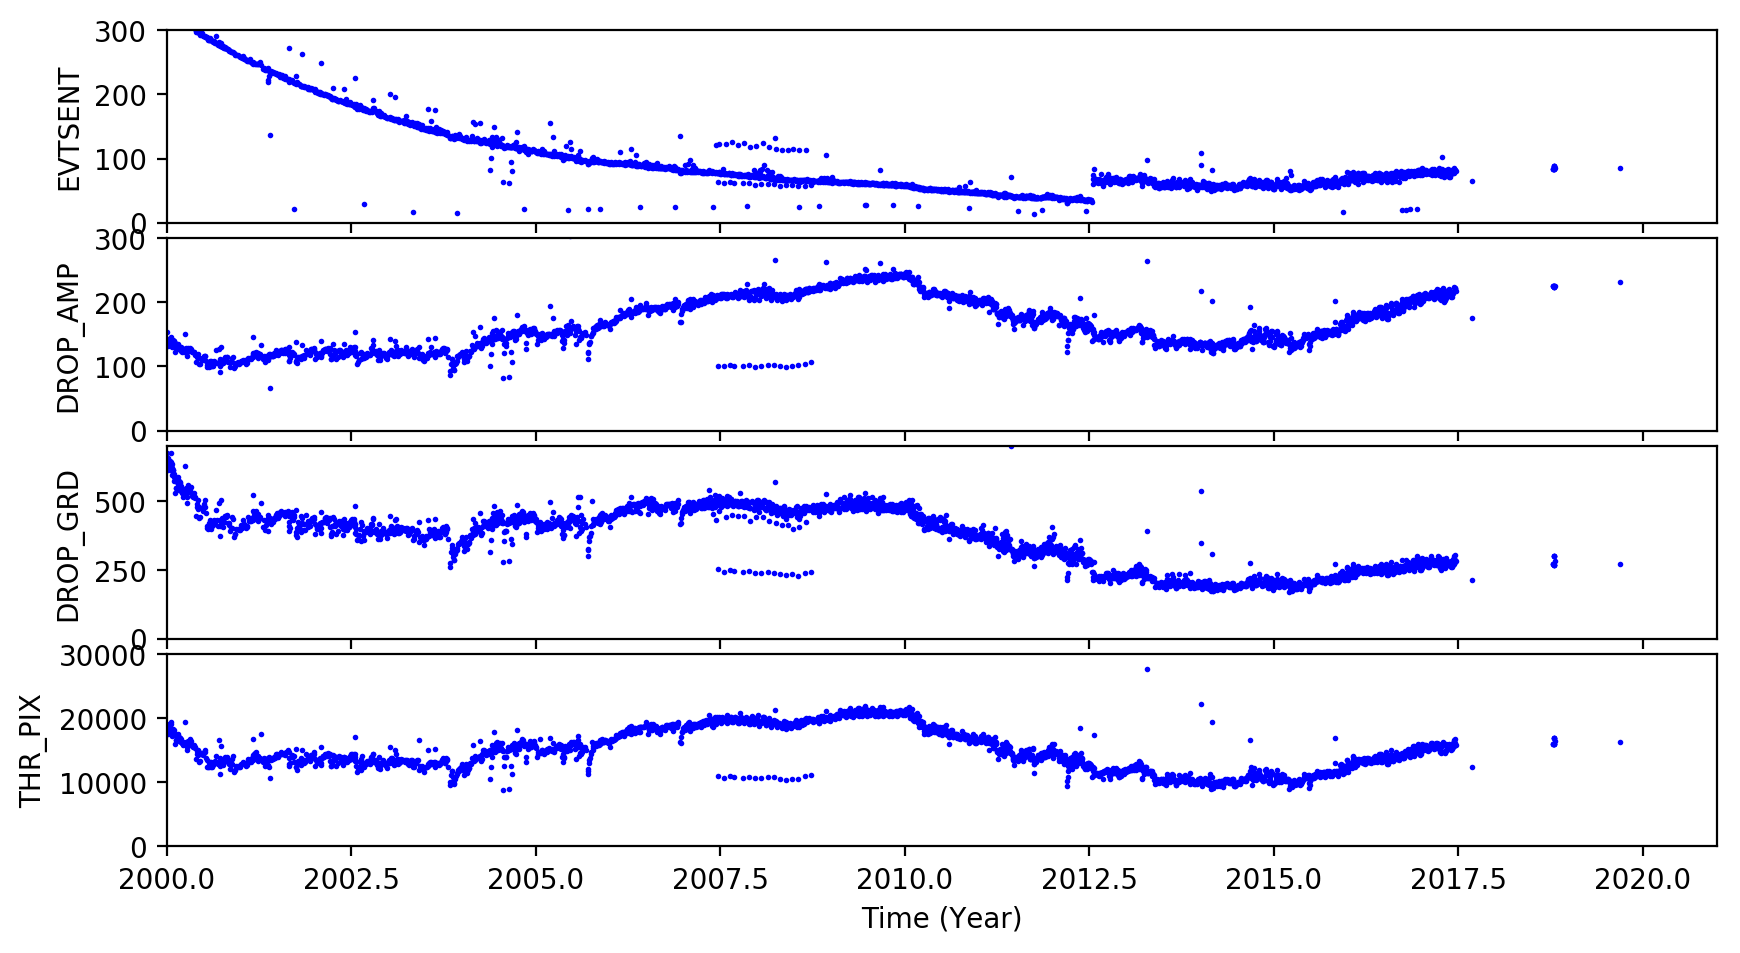
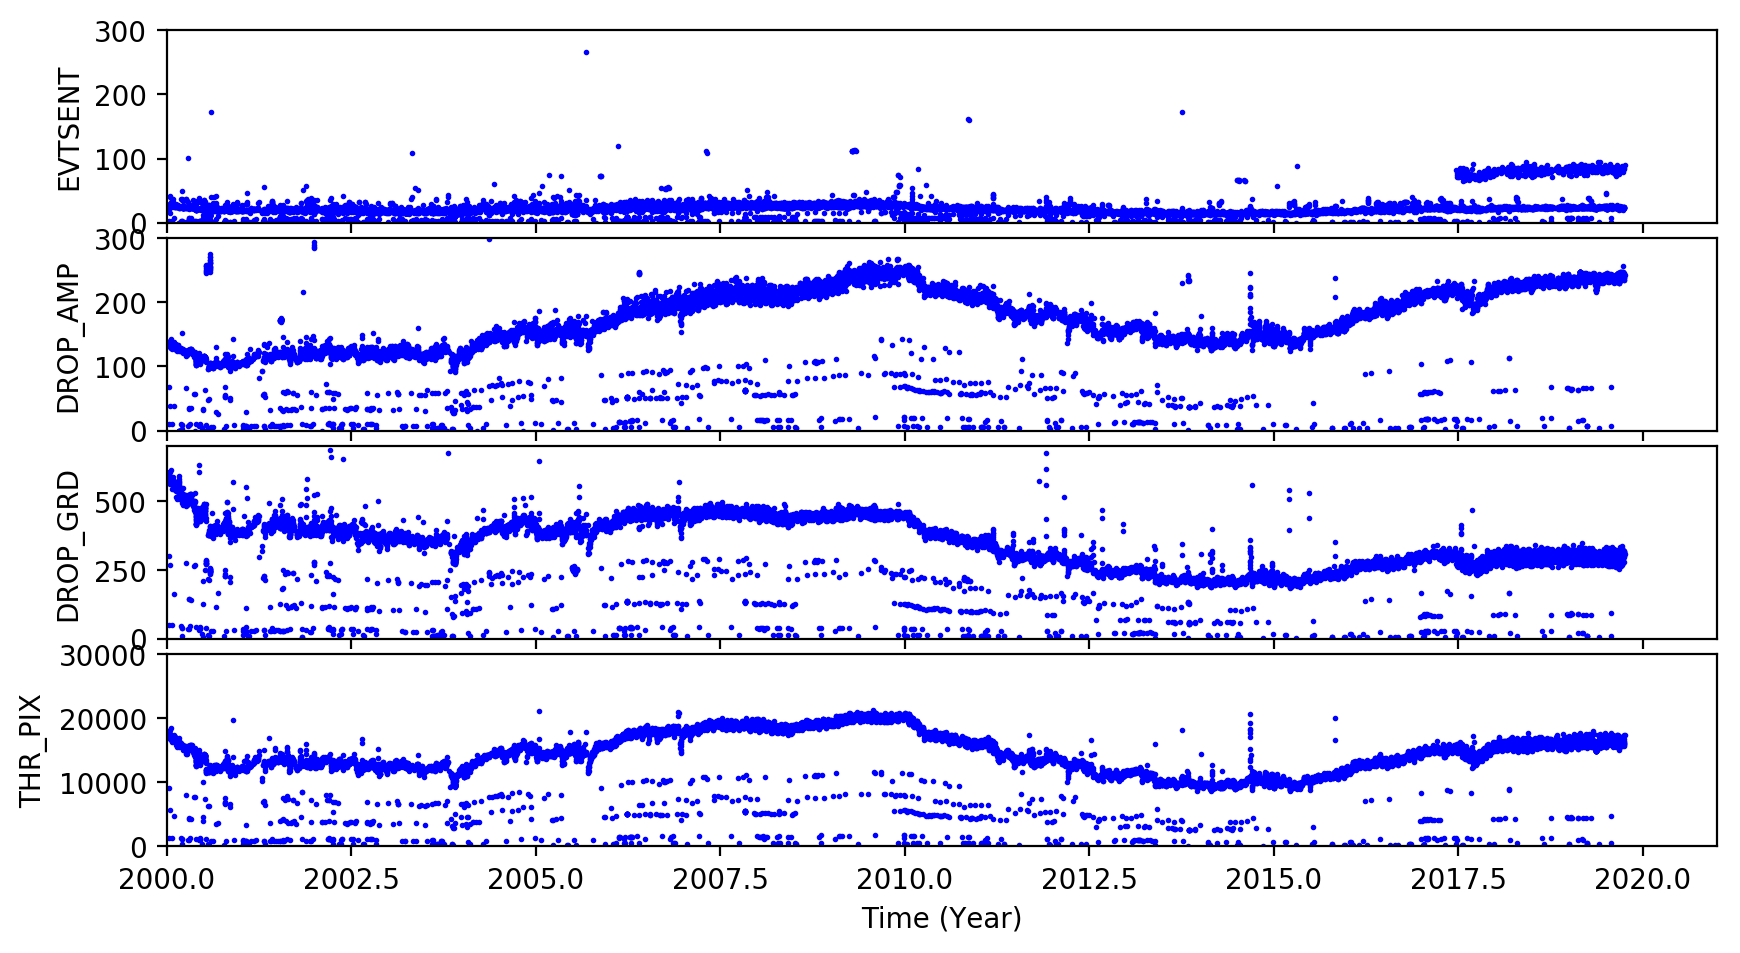
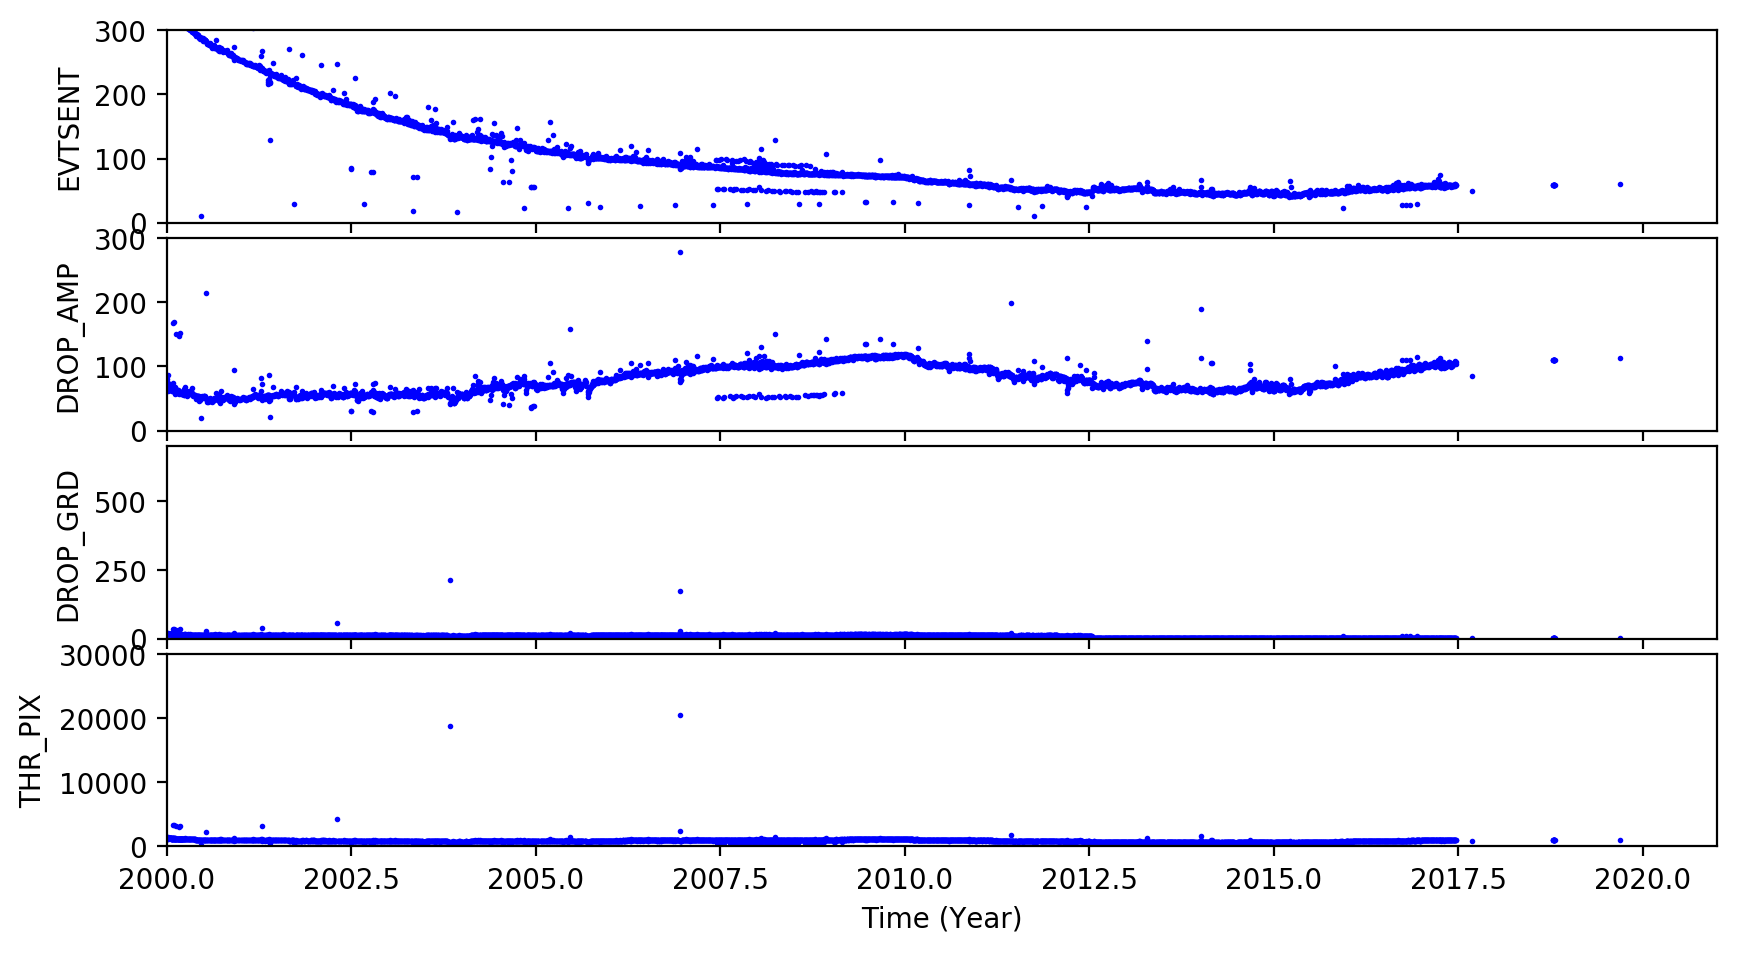
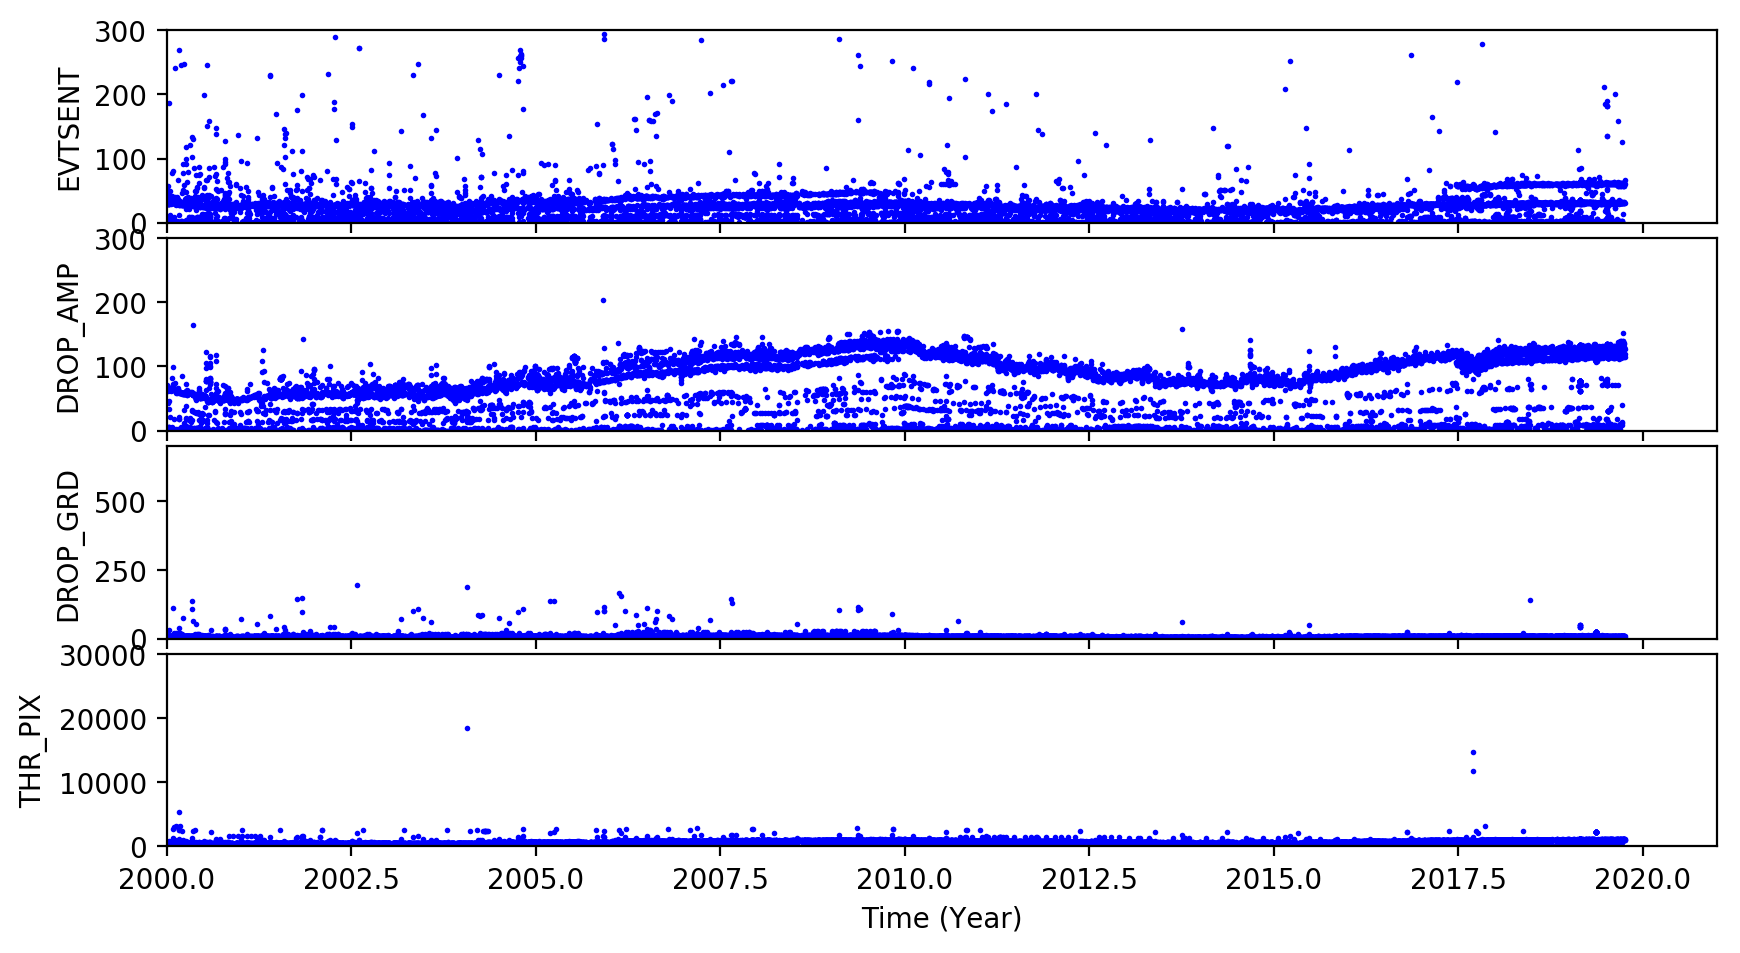
ACIS Rejected Events
The links below are plots of stat1 quantities, showing on-board rejected events. The average EVTSENT, DROP_AMP, DROP_POS, DROP_GRD, THR_PIX, and maximum BERR_SUM obtained from L1 acis*stat1.fits files are plotted for each observation. CTI observations are plotted separately from regular science observations.
Column definitions:
- EVTSENT - number of events sent in data record
- DROP_AMP - number of discarded events due to corrected amplitude
- DROP_POS - number of discarded events due to CCD position
- DROP_GRD - number of discarded events due to grade code
- THR_PIX - number of pixels above respective threshold level
- BERR_SUM - number of pixel bias errors so far in science run
Note the half-life decline of the CTI source is clearly evidenced in the steady janline of EVTSENT.
CCD3 Observations
| CTI | Science |
|
|
|---|
CCD7 Observations
| CTI | Science |
|
|
|---|
ACIS Gain Trends
We computed ACIS gain and offset from ACIS event1 files used in CTI computation, following the step described by C. Grant ACIS gain @ -120C page.
Instead computing gains and offsets from individual observations, we combined all data from each month and computed an monthly averaged gain and offset.
The following plots show CCD3 and CCD5 gains and offset trends.
| CCD 3 | |
)
|
)
|
| CCD 5 | |
)
|
)
|
[an error occurred while processing this directive]
HRC
DOSE of Central 4K Pore-Pairs
Please refer to Maximum Dose Trends for more details.
)
|
|---|
IMAGE                NPIX      MEAN    STDDEV      MIN       MAX
HRCI_09_2019.fits  16777216	0.058 	0.272 	0.000 	26.000
)
IMAGE                       NPIX      MEAN    STDDEV      MIN       MAX
HRCI_08_1999_09_2019.fits  16777216	5.965 	5.838 	0.000 	303.000
)
|
|---|
IMAGE                NPIX      MEAN    STDDEV      MIN       MAX
HRCS_09_2019.fits  16777216	0.009 	0.158 	0.000 	35.000
)
IMAGE                       NPIX      MEAN    STDDEV      MIN       MAX
HRCS_08_1999_09_2019.fits  16777216	18.247 	33.415 	0.000 	1745.000
|
|
Max dose trend plots corrected for events that "pile-up"
in the center of the taps due to bad position information.
|
)
|
)
|
)
|
)
|
| Jun 2019 | Mar 2019 | Dec 2018 | Sep 2018 |
|---|
)
|
)
|
)
|
)
|
| Jun 2019 | Mar 2019 | Dec 2018 | Sep 2018 |
|---|
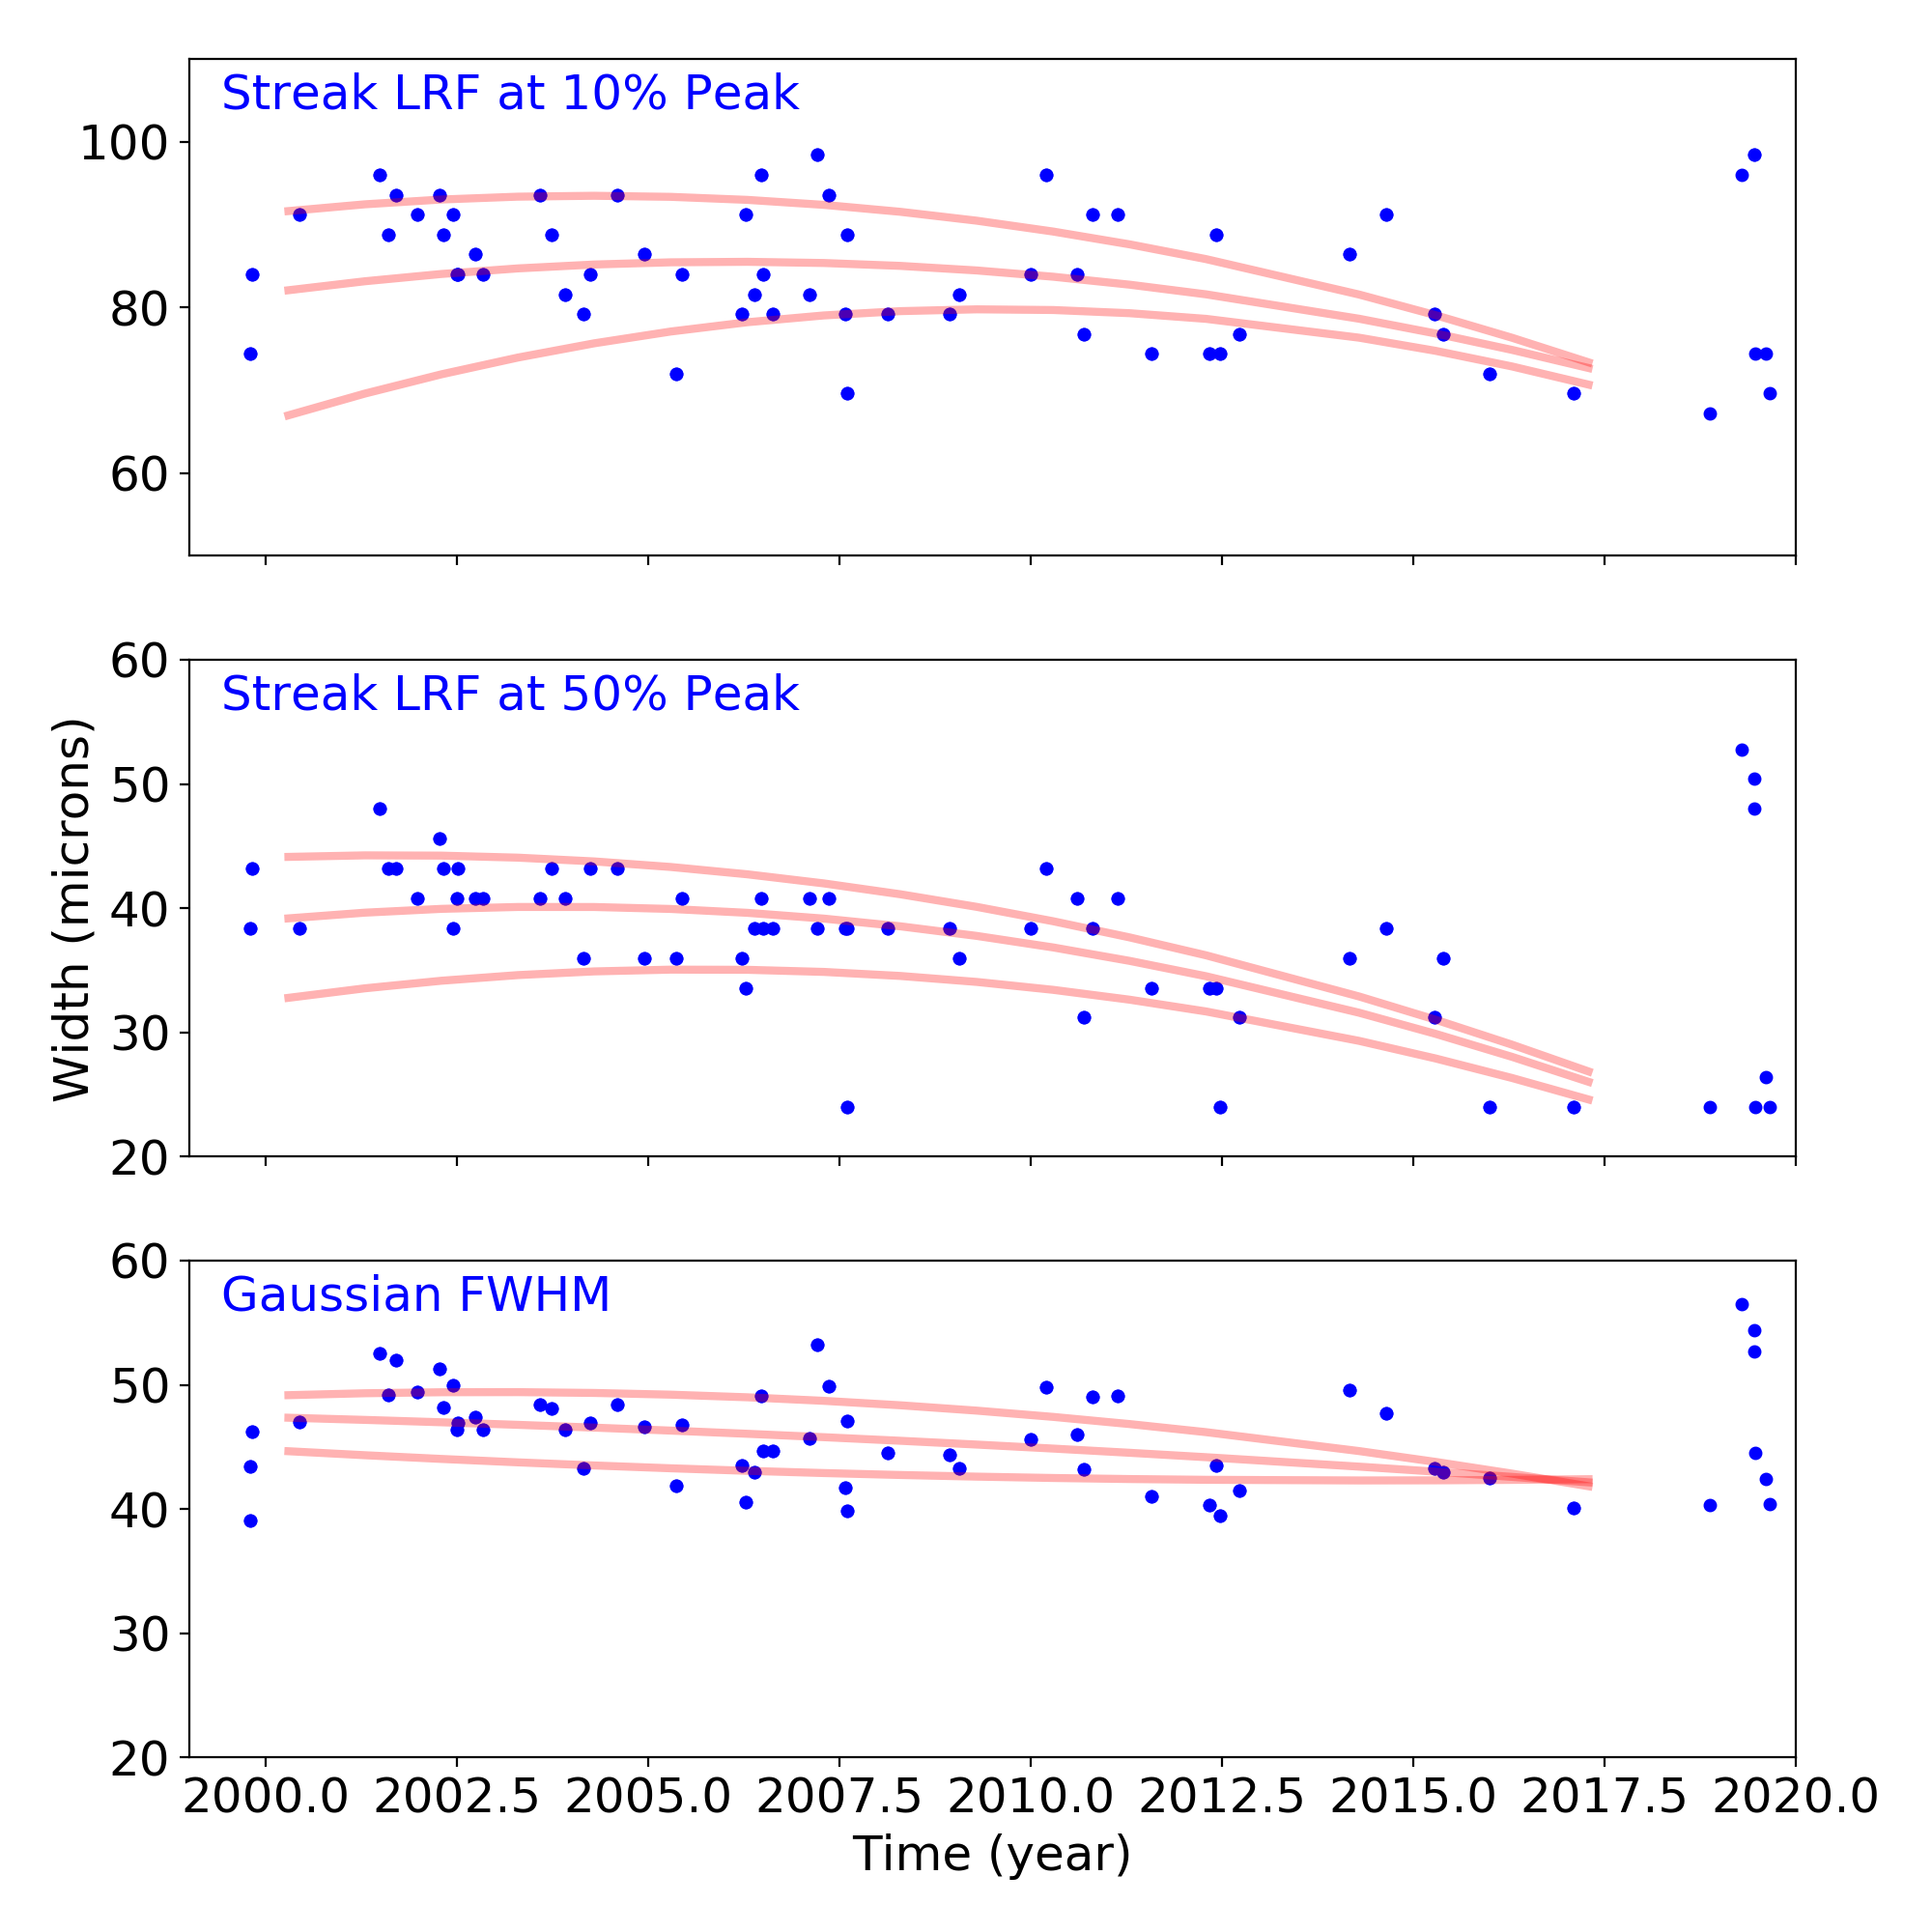
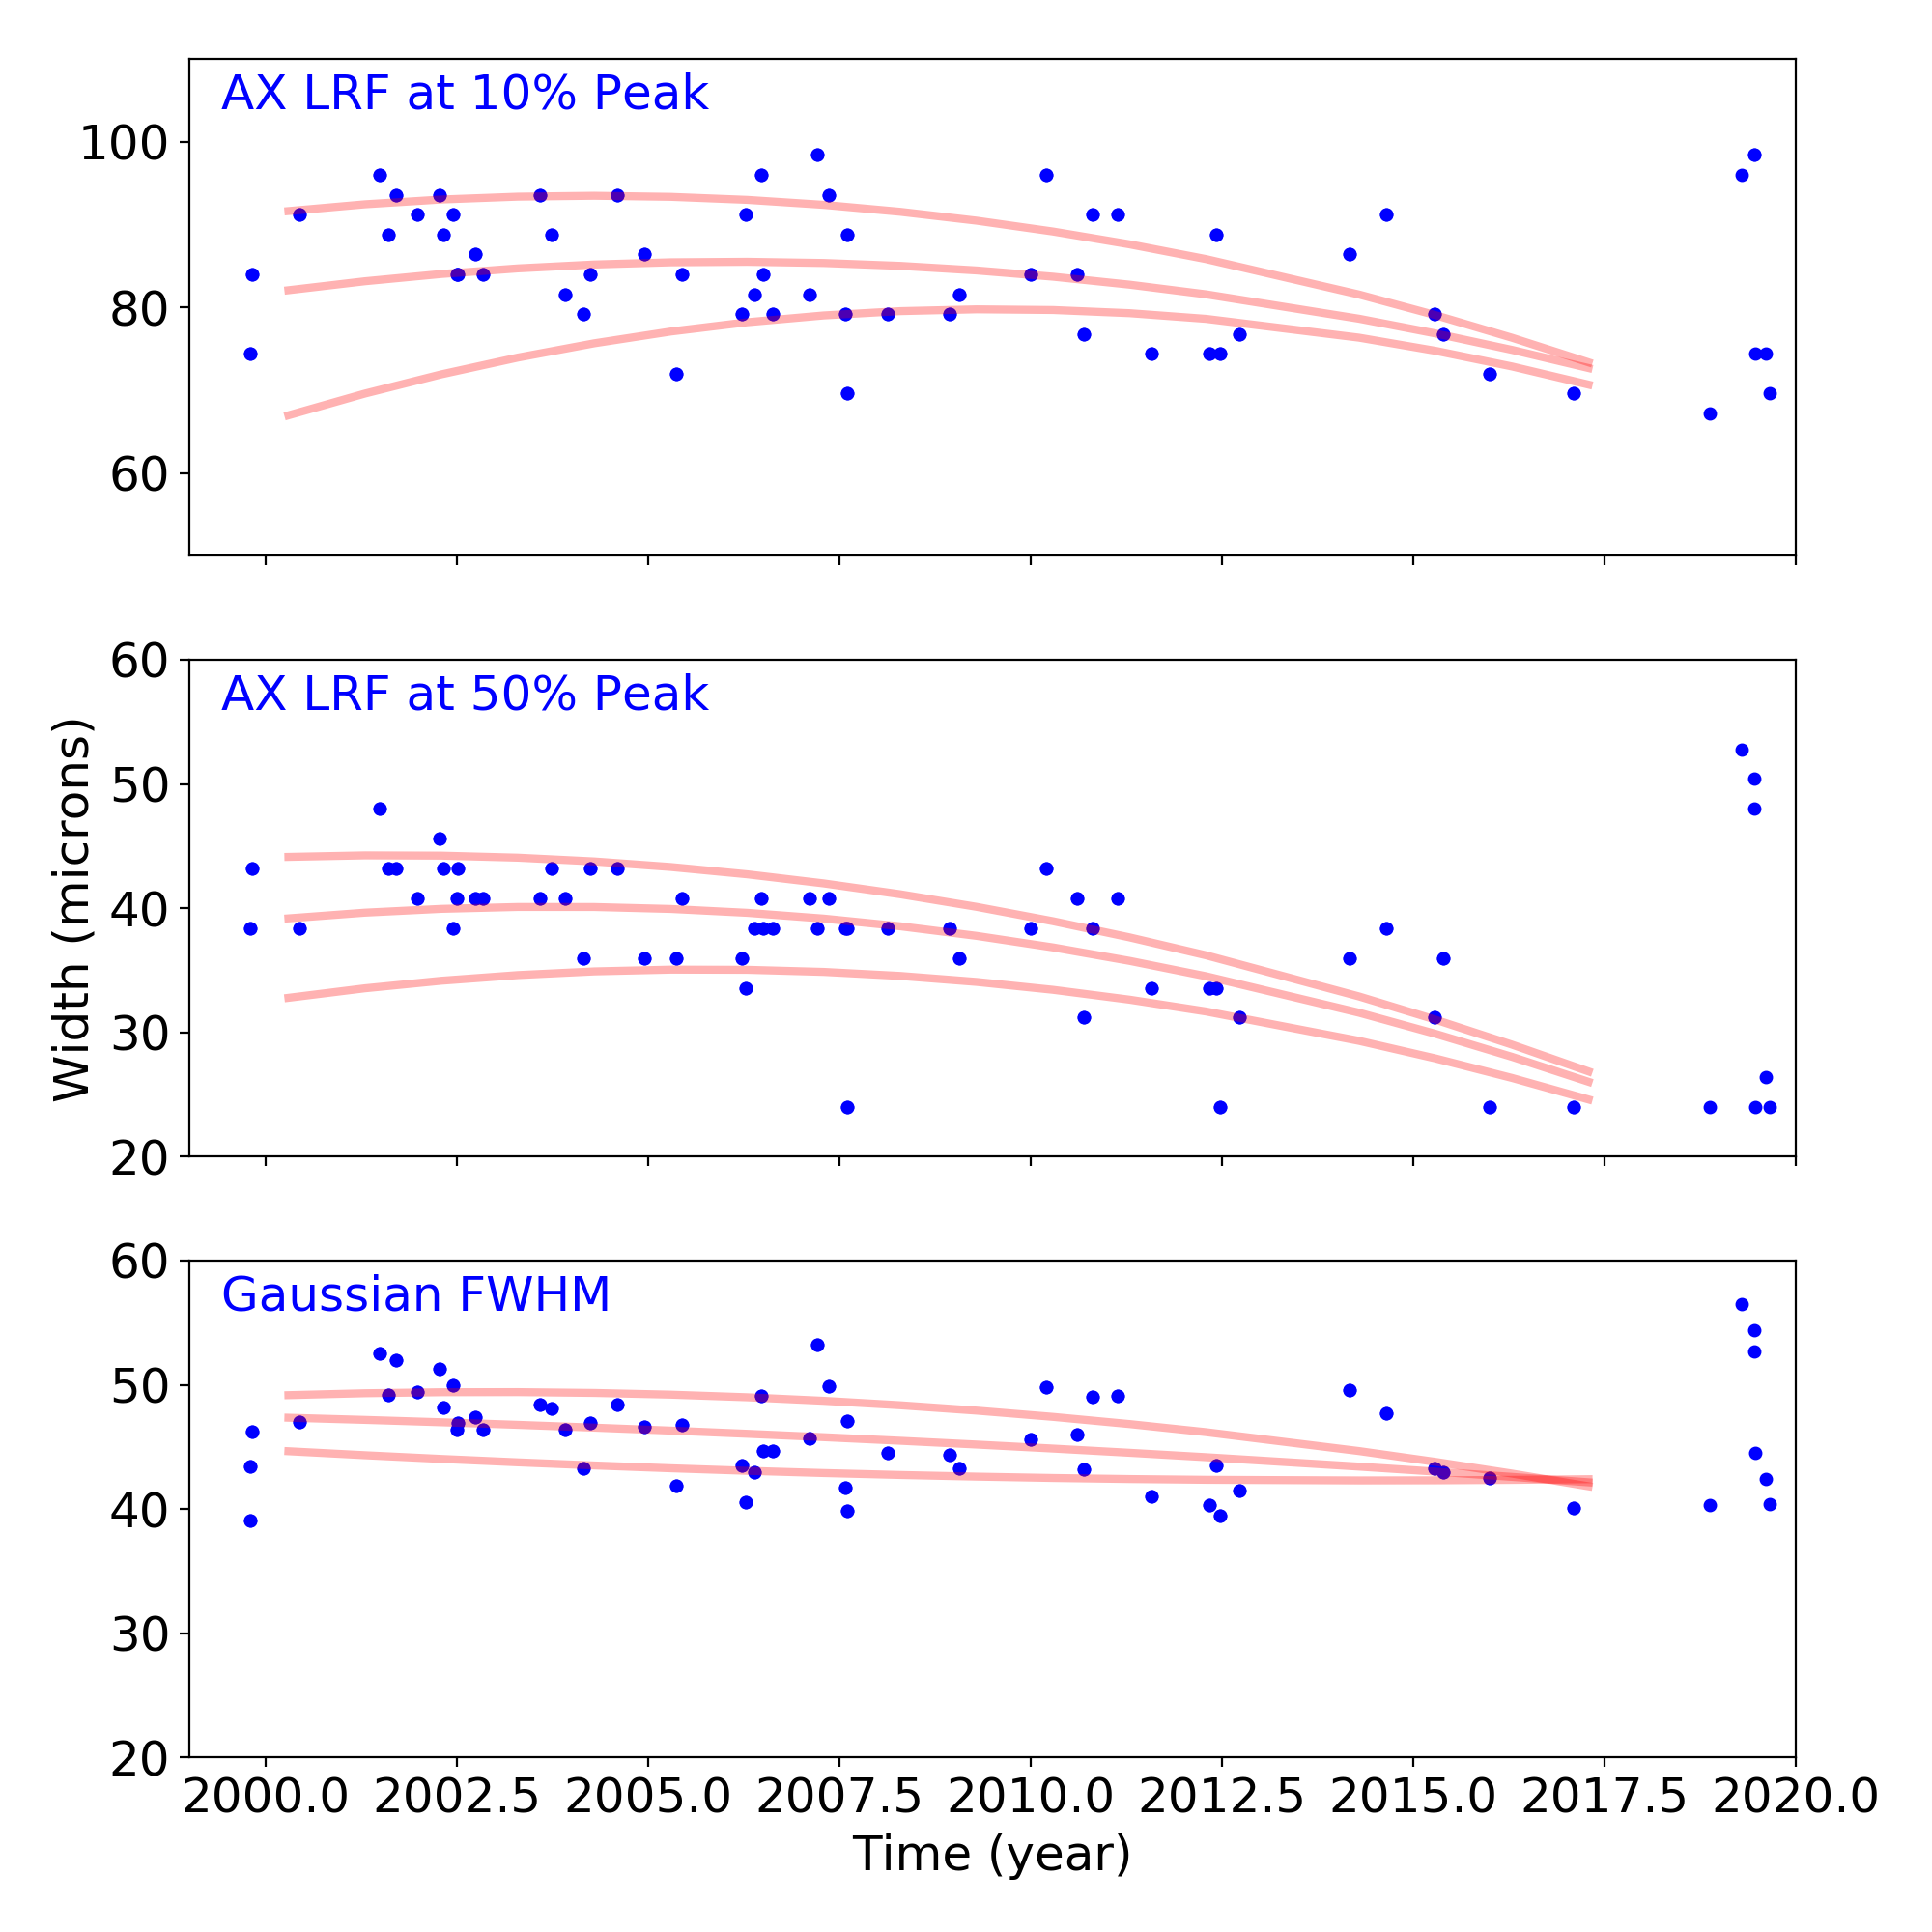
Gratings
Grating Trends/Focus
We plot the width of the zero order streak of ACIS/HETG observations and the width of the zero order image for HRC/LETG observations of point sources. No significant defocusing trend is seen at this time. See Gratings Trends pages.
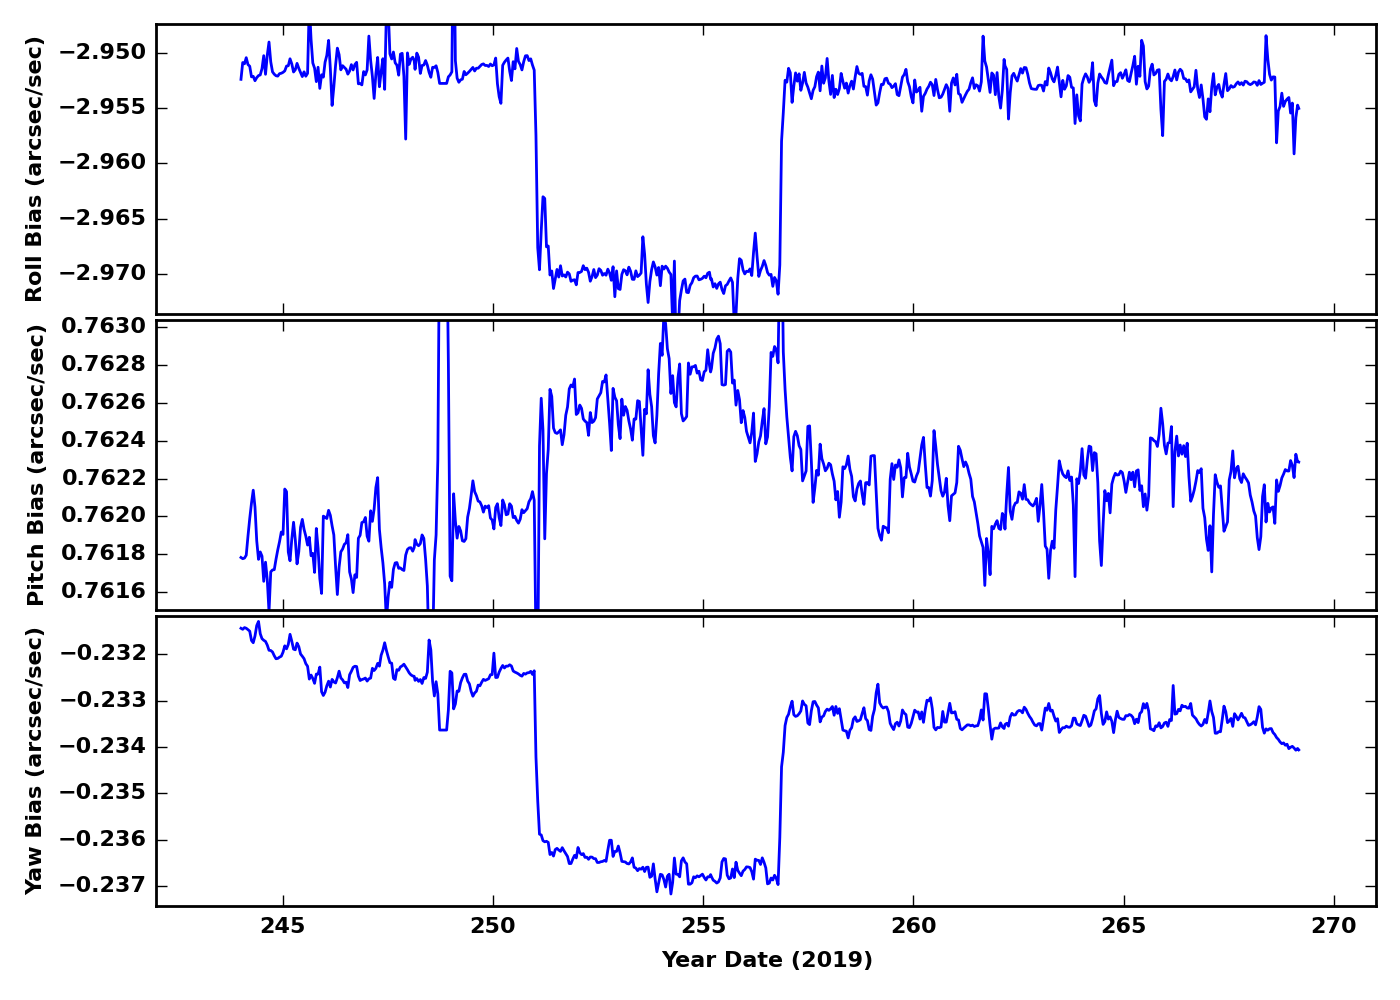
PCAD
ACA Trending
Gyro Bias Drift
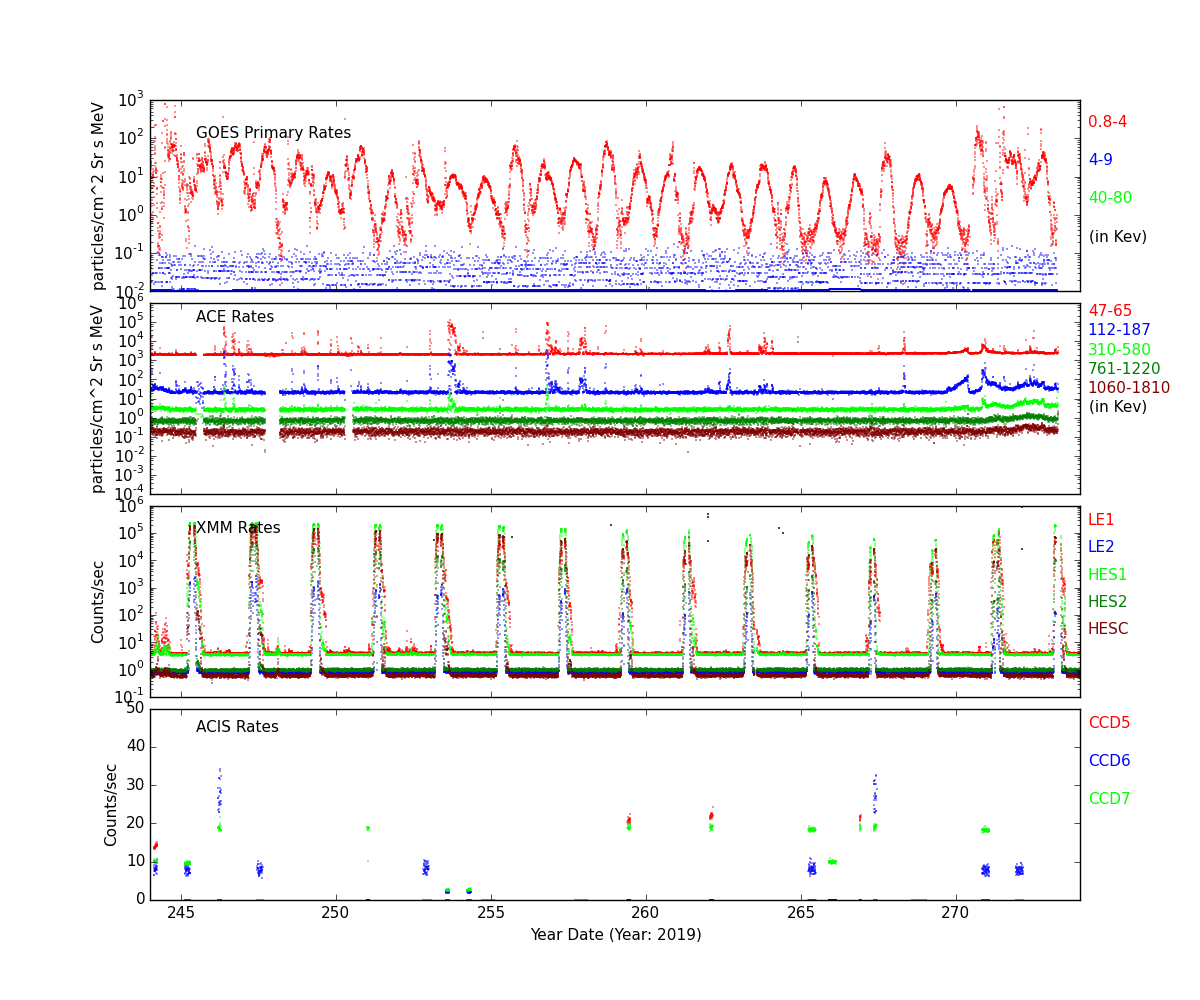
Radiation History
Radiation Count Rates of Sep 2019
Sun Spot History
-->
Trending
Critical Trends
| ACIS Temperatures - Daily Maximums | ||||||
|---|---|---|---|---|---|---|
| MSID | MEAN | RMS | DELTA/YR | DELTA/YR/YR | UNITS | DESCRIPTION |
| 1pdeaat | 303.378 | 7.398 | 0.002+/-0.003 | -0.053+/-0.833 | K | PSMC DEA POWER SUPPLY TEMP A |
| 1pin1at | 340.813 | 11.255 | 0.016+/-0.017 | 0.309+/-1.223 | K | PSMC TEMP 1A |
| HRMA Computed Averages - Daily Maximums | ||||||
|---|---|---|---|---|---|---|
| MSID | MEAN | RMS | DELTA/YR | DELTA/YR/YR | UNITS | DESCRIPTION |
| obaavg | 296.439 | 1.905 | -0.012+/-0.002 | -15.686+/-9.139 | TEMP | OBA/TFTE |
| EPHIN Temperatures - Daily Maximums | ||||||
|---|---|---|---|---|---|---|
| MSID | MEAN | RMS | DELTA/YR | DELTA/YR/YR | UNITS | DESCRIPTION |
| teio | 315.281 | 26.341 | -0.015+/-0.012 | -1.158+/-1.498 | K | EPHIN ELECTRONICS HOUSING TEMP |
| tephin | 327.455 | 7.184 | -0.010+/-0.003 | -0.532+/-0.584 | K | EPHIN SENSOR HOUSING TEMP |
| S/C Main Temperatures - Daily Maximums | ||||||
|---|---|---|---|---|---|---|
| MSID | MEAN | RMS | DELTA/YR | DELTA/YR/YR | UNITS | DESCRIPTION |
| tcylfmzm | 308.158 | 20.734 | -0.003+/-0.010 | -0.890+/-1.860 | K | CNT CYL TEMP:-Z SIDE UNDER LAE-1 |
| tcylfmzp | 310.196 | 18.896 | 0.004+/-0.009 | -0.993+/-1.747 | K | CNT CYL TEMP:-Z SIDE UNDER LAE-2 |
| S/C Ancillary Temperatures - Daily Maximums | ||||||
|---|---|---|---|---|---|---|
| MSID | MEAN | RMS | DELTA/YR | DELTA/YR/YR | UNITS | DESCRIPTION |
| tfssbkt1 | 334.284 | 28.477 | -0.004+/-0.014 | -0.971+/-1.532 | K | FSS BRACKET-1 TEMP (+Y) |
| tfssbkt2 | 330.738 | 32.806 | (2.75+/-158.30)e-4 | -1.096+/-1.713 | K | FSS BRACKET-2 TEMP (-Y) |
| tsctsf1 | 312.050 | 3.895 | -0.002+/-0.002 | 0.239+/-0.351 | K | SC-TS FITTING -1 TEMP |
| tsctsf6 | 311.989 | 4.006 | -0.002+/-0.002 | 0.542+/-0.408 | K | SC-TS FITTING -6 TEMP |
| MUPS - Daily Maximums | ||||||
|---|---|---|---|---|---|---|
| MSID | MEAN | RMS | DELTA/YR | DELTA/YR/YR | UNITS | DESCRIPTION |
| pm1thv1t | 346.666 | 12.614 | -0.008+/-0.006 | -0.949+/-0.786 | K | MUPS 1 THRUSTER VALVE 01 TEMP |
| pline02t | 327.214 | 12.201 | -0.007+/-0.005 | -0.776+/-0.885 | K | PROP LINE TEMP 02 |
| pline03t | 322.572 | 15.513 | -0.003+/-0.007 | -0.745+/-1.158 | K | PROP LINE TEMP 03 |
| pline04t | 308.055 | 11.944 | -0.008+/-0.005 | -0.299+/-1.005 | K | PROP LINE TEMP 04 |
Quarterly Trends
- PCAD FTS Temperature and Gradient
| Previous Quarter | ||||||
| MSID | MEAN | RMS | DELTA/YR | DELTA/YR/YR | UNITS | DESCRIPTION |
| ohrthr27 | 297.191 | 0.012 | (-1.97+/-0.51)e-5 | (-8.39+/-92.12)e-5 | K | RT 20 : PERISCOPE |
|---|---|---|---|---|---|---|
| ohrthr42 | 295.925 | 0.329 | (-5.33+/-1.41)e-4 | -0.137+/-0.048 | K | RT 133: PERISCOPE |
| ohrthr43 | 296.126 | 0.375 | (-5.67+/-1.61)e-4 | -0.150+/-0.052 | K | RT 134: PERISCOPE |
| oobagrd3 | -0.275 | 0.077 | (-1.62+/-3.37)e-5 | 0.013+/-0.008 | K | RT 505 TO RT 504: PERISCOPE GRADIENT MONITOR |
| oobagrd6 | 0.102 | 0.008 | (-1.04+/-0.33)e-5 | -0.003+/-0.001 | K | RT 507 TO RT 506: PERISCOPE GRADIENT MONITOR |
- SIM Temperature
| Previous Quarter | ||||||
| MSID | MEAN | RMS | DELTA/YR | DELTA/YR/YR | UNITS | DESCRIPTION |
| 3btu_bpt | 268.948 | 7.285 | 0.002+/-0.003 | -1.395+/-0.860 | K | BTU BASEPLATE (+X) |
|---|---|---|---|---|---|---|
| 3tsmxcet | 244.838 | 41.424 | -0.006+/-0.020 | 1.684+/-2.298 | K | -X TURTLE SHELL |
| 3tsmxspt | 469.759 | 199.927 | -0.012+/-0.096 | 5.124+/-11.832 | K | -X TURTLE SHELL |
- SIIM Electronics
| Previous Quarter | ||||||
| MSID | MEAN | RMS | DELTA/YR | DELTA/YR/YR | UNITS | DESCRIPTION |
| agrndadc | -6.233e-05 | 1.729e-04 | (-1.33+/-1.14)e-7 | (-4.97+/-106.50)e-7 | --- | agrndadc |
|---|---|---|---|---|---|---|
| fatabadc | 4.993 | 0.070 | (-1.81+/-1.78)e-6 | 0.003+/-0.003 | V | FA Tab Position Sensor A/D Converter |
| n15vadc | -15.016 | 0.000 | (5.09+/-3.37)e-7 | (2.43+/-3.87)e-5 | V | -15V Power Supply A/D Converter Reading |
| p15vadc | 14.963 | 0.001 | (-1.28+/-0.37)e-6 | (7.04+/-5.53)e-5 | V | +15V Power Supply A/D Converter Reading |
| p5vadc | 4.985 | 0.025 | (-2.40+/-1.79)e-5 | 0.005+/-0.002 | V | +5V Power Supply A/D Converter Reading |
| tsctabadc | 4.979 | 0.155 | (-1.78+/-6.18)e-5 | 0.001+/-0.006 | V | TSC Tab Position Sensor A/D converter |
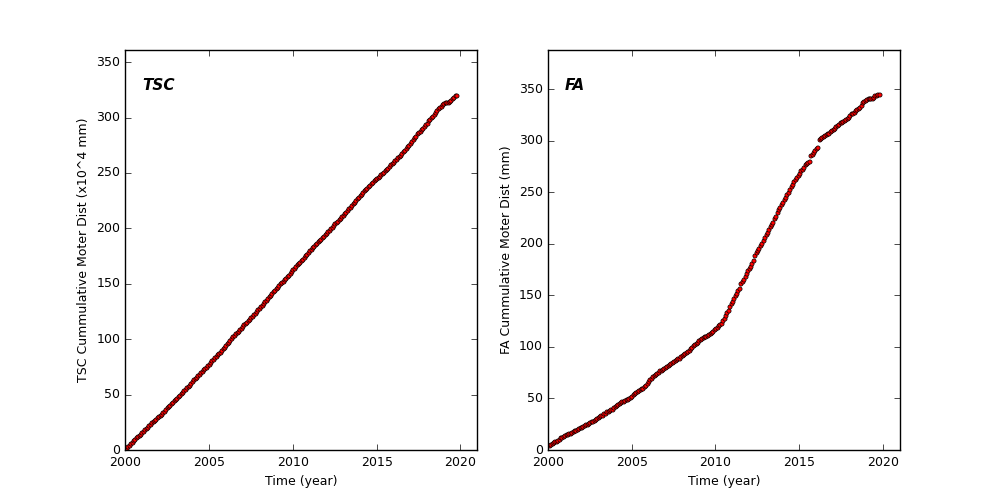
Spacecraft Motions
TSC and FA Cummulative Moter Distance
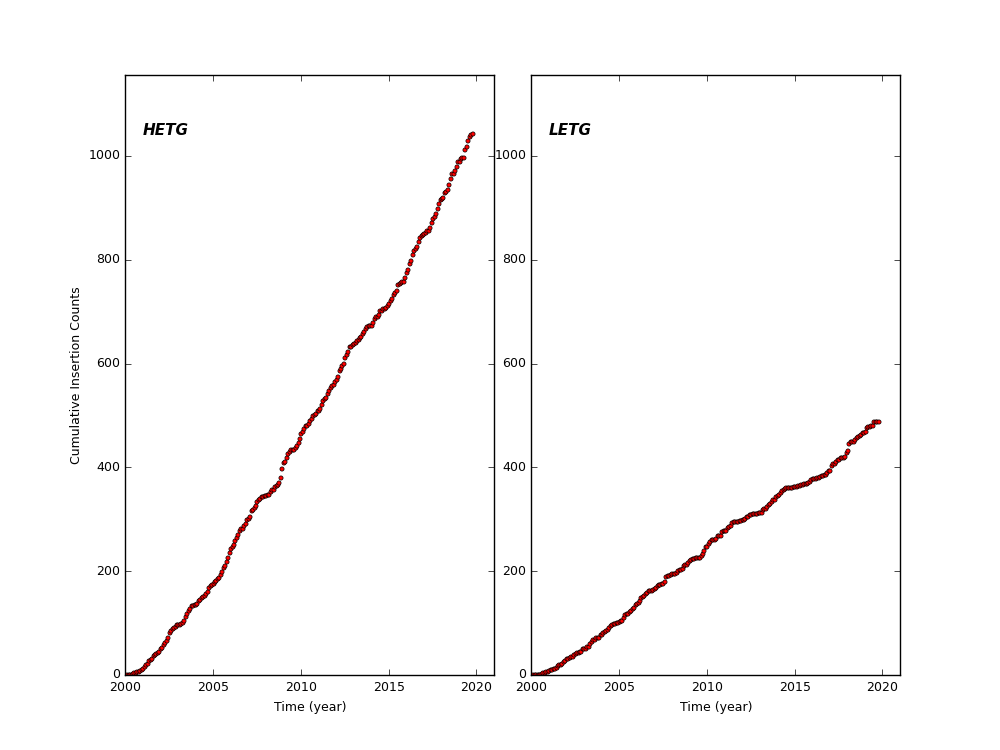
HETG and LETG Cummulative Insertion Counts
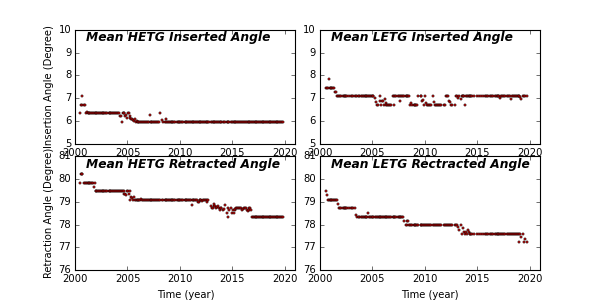
HETG/LETG Insertion/Retraction Angle
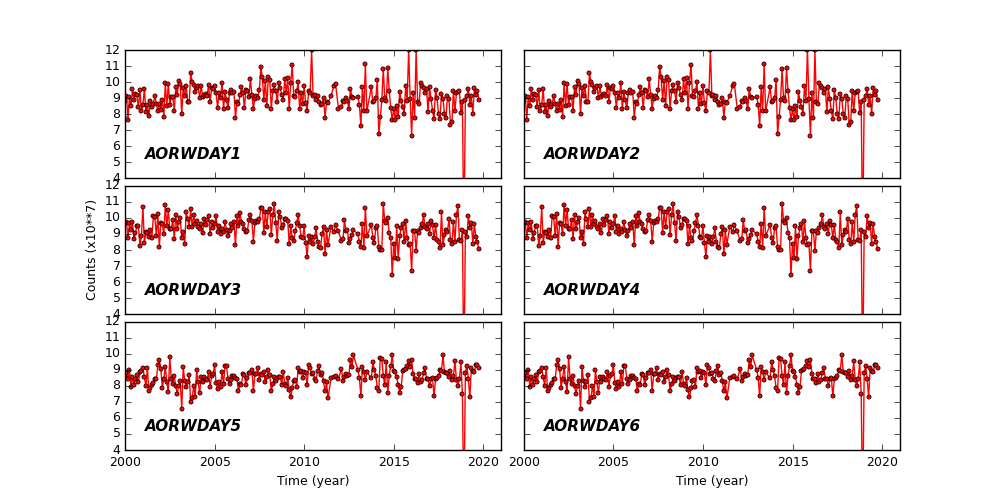
Reaction Wheel Rotations