ACIS
ACIS DOSE Registered-Photon-Map
The steps we took to compute the dose map are;
- Level 1 Event files for a specified month are obtained from archive.
- Image data including I2, I3, S2, S3 CCDs are extracted from all event files.
- All the extracted image data were merged to create a month long exposure map for the month.
- The exposure map is opened with ds9, and check a distribution of count rates against energy. From this, estimate the upper threshold value. Any events beyond this upper threshold are assumed erroneous events such as bad pixels.
- Using this upper threshold, the data is filtered, and create a cleaned exposure map for the month.
- The exposure map from each month from the Sep 1999 is added up to create a cumulative exposure map for each month.
- Using fimgstatistic, we compute count rate statistics for each CCDs.
- For observations with high data drop rates (e.g., Crab nebula, Cas A), we corrected the observations by adding events.
Please check more detail plots at Telemetered Photon Dose Trend page.
)
)
)
Statistics:
# IMAGE     NPIX     MEAN        RMS        MIN     MAX
ACIS_feb20 6004901       6.483         8.416           0.0      927


I2 node 0  262654	5.687007	2.868884	0.0	 56.0
I2 node 1  262654	5.882680	2.983210	0.0	154.0
I2 node 2  262654	5.814893	2.860670	0.0	 61.0
I2 node 3  262654	5.795802	2.953988	0.0	 57.0

I3 node 0  262654	8.379927	3.717030	0.0	199.0
I3 node 1  262654	7.857387	4.224303	0.0	927.0
I3 node 2  262654	7.719434	3.311631	0.0	 72.0
I3 node 3  262654	7.914728	3.414839	0.0	136.0

S2 node 0  262654	8.241732	3.682562	0.0	392.0
S2 node 1  262654	8.601194	4.096831	0.0	260.0
S2 node 2  262654	8.927436	4.332026	0.0	294.0
S2 node 3  262654	8.715210	4.114523	0.0	474.0

S3 node 0  262654	10.716161	5.608791	0.0	102.0
S3 node 1  262654	12.095114	5.150472	0.0	847.0
S3 node 2  262654	12.164717	4.547997	0.0	 58.0
S3 node 3  262654	10.942651	4.482172	0.0	 55.0
)
)
)
Statistics:
 IMAGE     NPIX      MEAN        RMS           MIN      MAX
ACIS_total   6004901       2370.067         3058.977           0.0   132492


I2 node 0  262654	2053.903158	409.576284	436.0	11946.0
I2 node 1  262654	2160.850418	575.803421	449.0	103164.0
I2 node 2  262654	2189.086698	463.257294	457.0	12195.0
I2 node 3  262654	2194.324213	565.897659	438.0	28655.0

I3 node 0  262654	2338.993302	576.080177	435.0	10412.0
I3 node 1  262654	2418.929844	1705.623380	458.0	55433.0
I3 node 2  262654	2140.143463	398.672765	435.0	12395.0
I3 node 3  262654	2132.576990	428.875157	396.0	32915.0

S2 node 0  262654	2764.209747	438.855595	1534.0	22006.0
S2 node 1  262654	2929.753844	656.765296	1700.0	16028.0
S2 node 2  262654	3239.192241	661.110668	2133.0	27854.0
S2 node 3  262654	3193.124490	520.953421	1887.0	62337.0

S3 node 0  262654	4882.129952	2332.341882	2137.0	34167.0
S3 node 1  262654	6109.681692	2296.551188	0.0	30131.0
S3 node 2  262654	4859.044244	1286.612547	2112.0	25786.0
S3 node 3  262654	3762.977630	680.076189	2309.0	25217.0
)
|
)
|
)
|
)
|
| Nov 2019 | Aug 2019 | May 2019 | Feb 2019 |
|---|
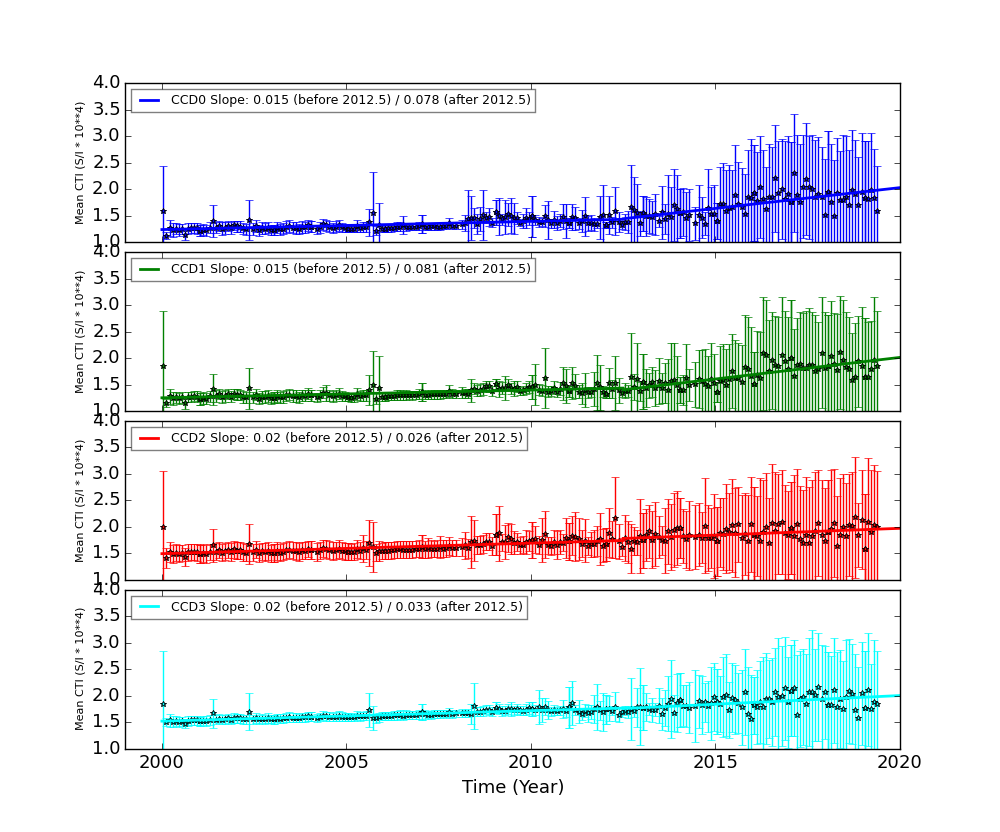
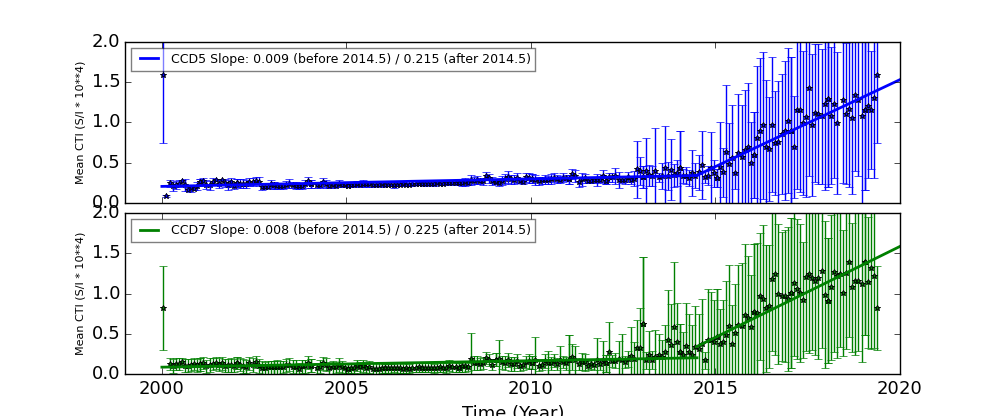
The Mean Detrended CTI
We report CTIs with a refined data definition. CTIs were computed for the temperature dependency corrected data. Please see CTI page for detailed explanation. CTI's are computed for Mn K alpha, and defined as slope/intercept x10^4 of row # vs ADU. Data file: here
Imaging CCDs
Spectral CCDs
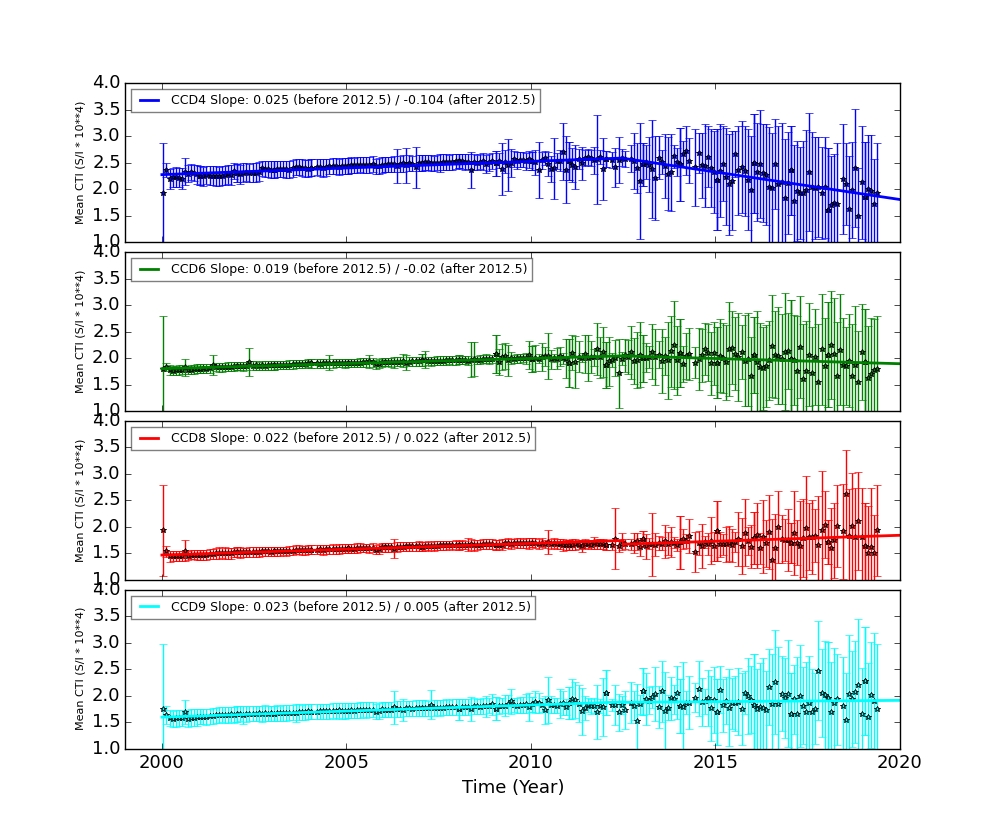
Backside CCDs
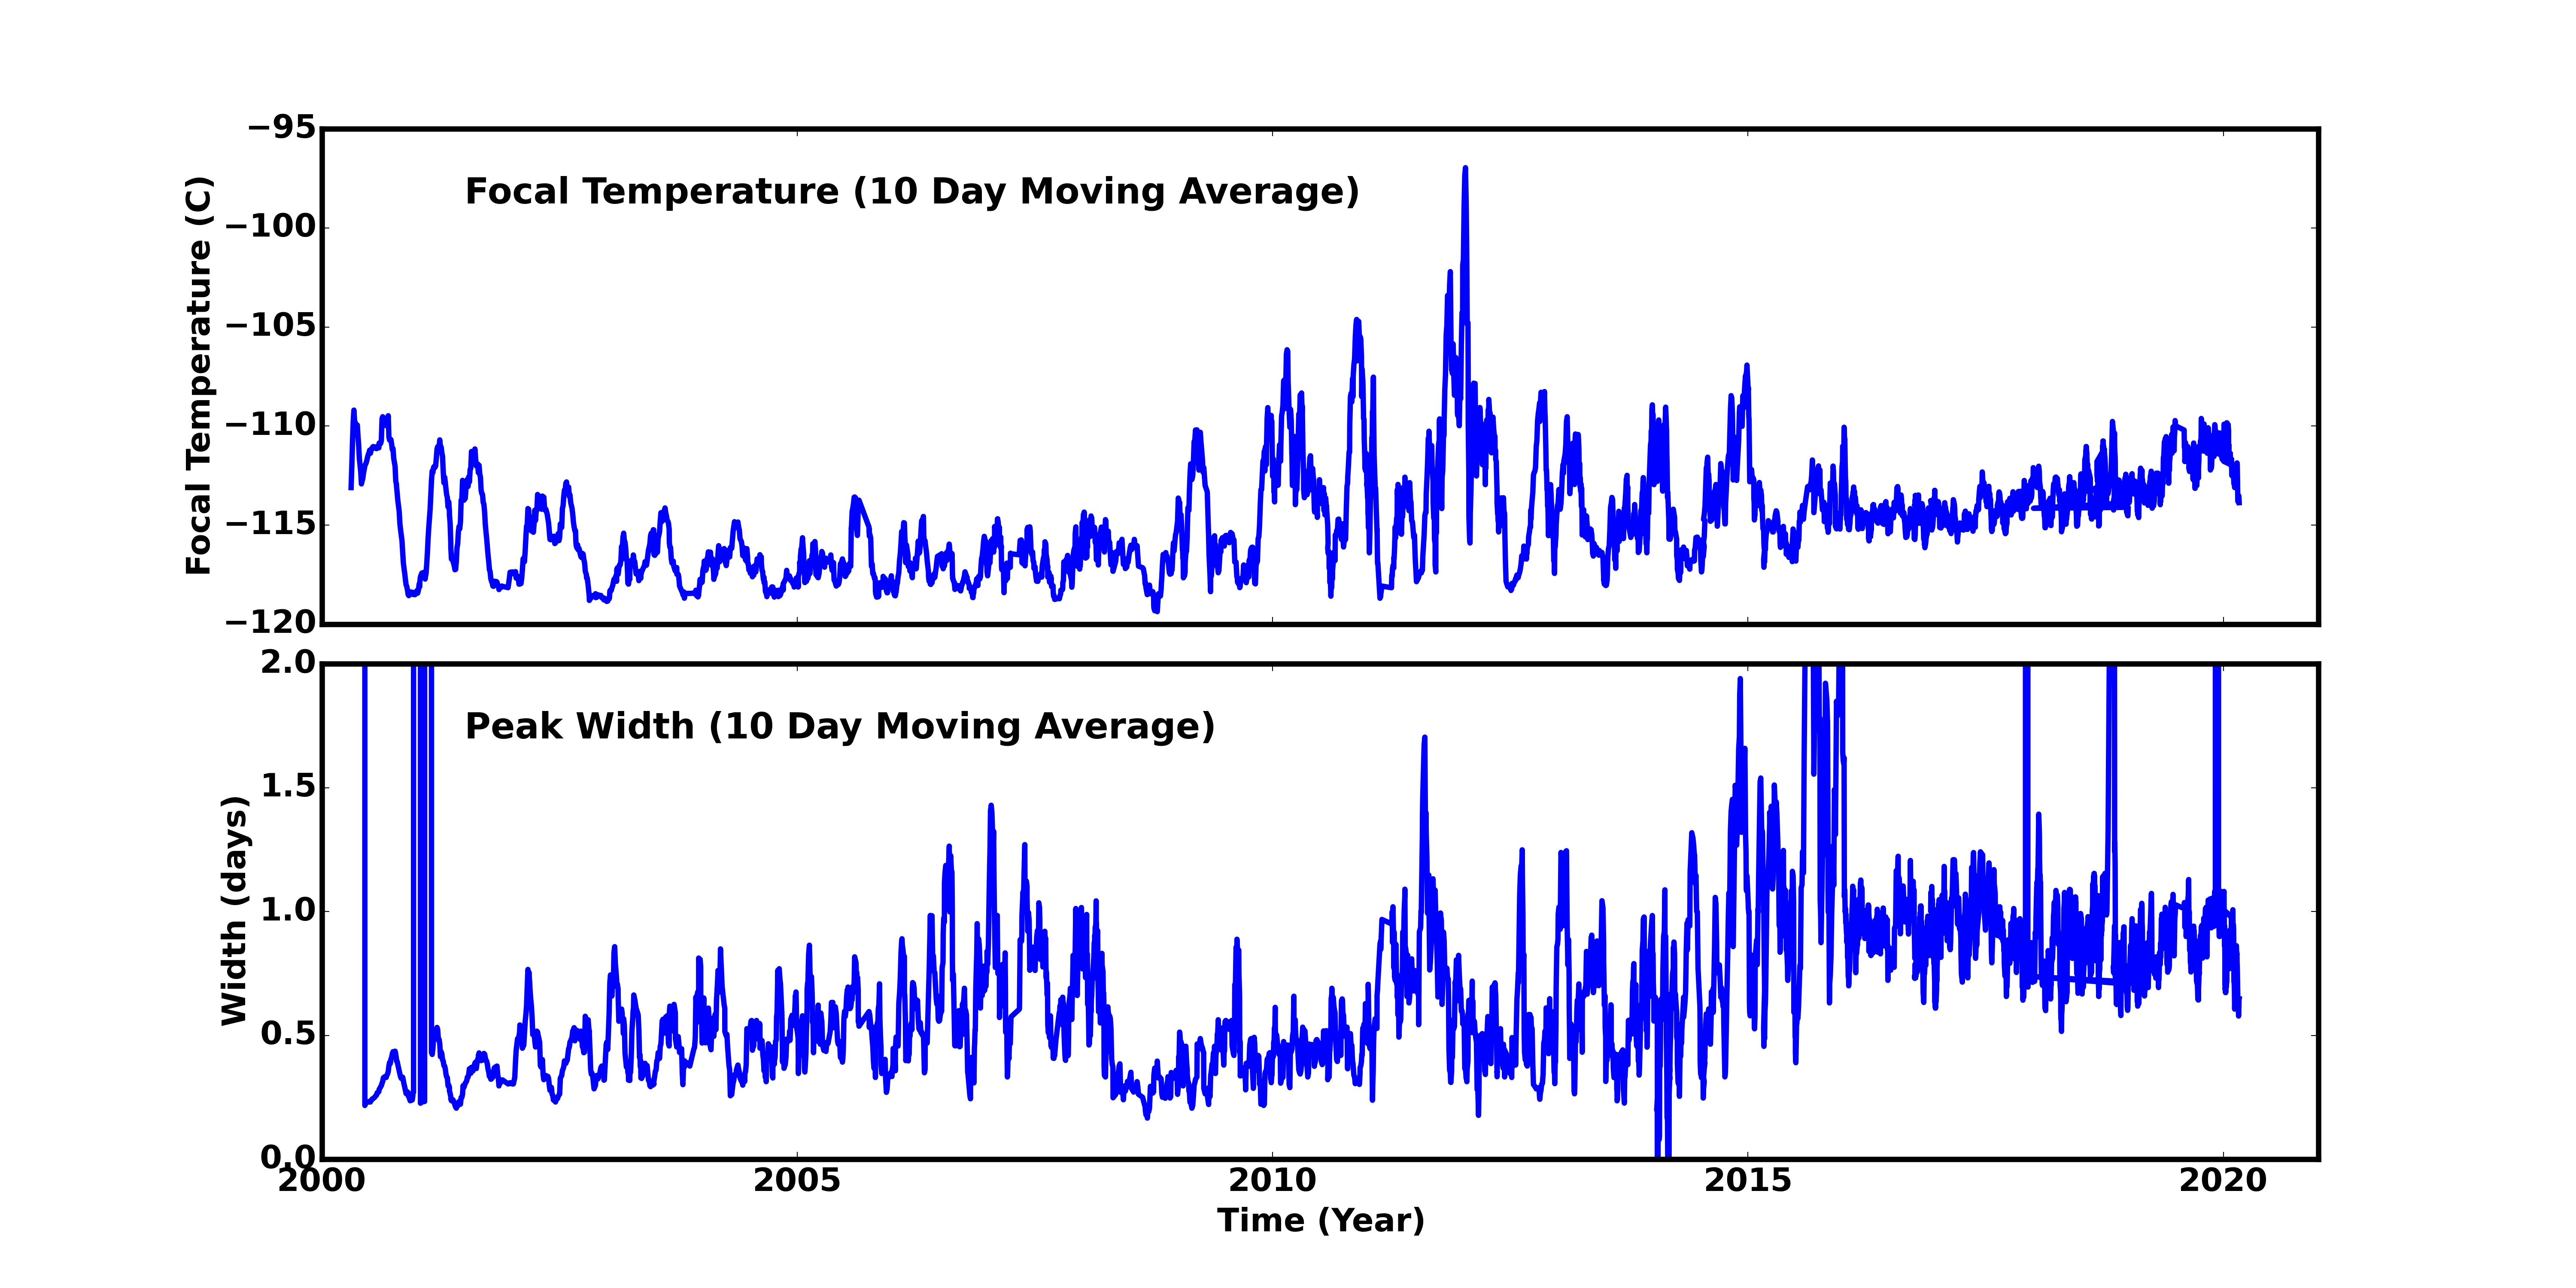
Focal Plane Temperature
Feb 2020 Focal Temperature
| The Mean (max) FPT: | |
|---|---|
| -112.81 | +/- 2.52 C |
| Mean Width: | |
| 0.71 | +/- 0.29 days |
Averaged Focal Plane Temperature
We are using 10 period moving averages to show trends of peak temperatures and peak widths. Note, the gaps in the width plot are due to missing/corrupted data.
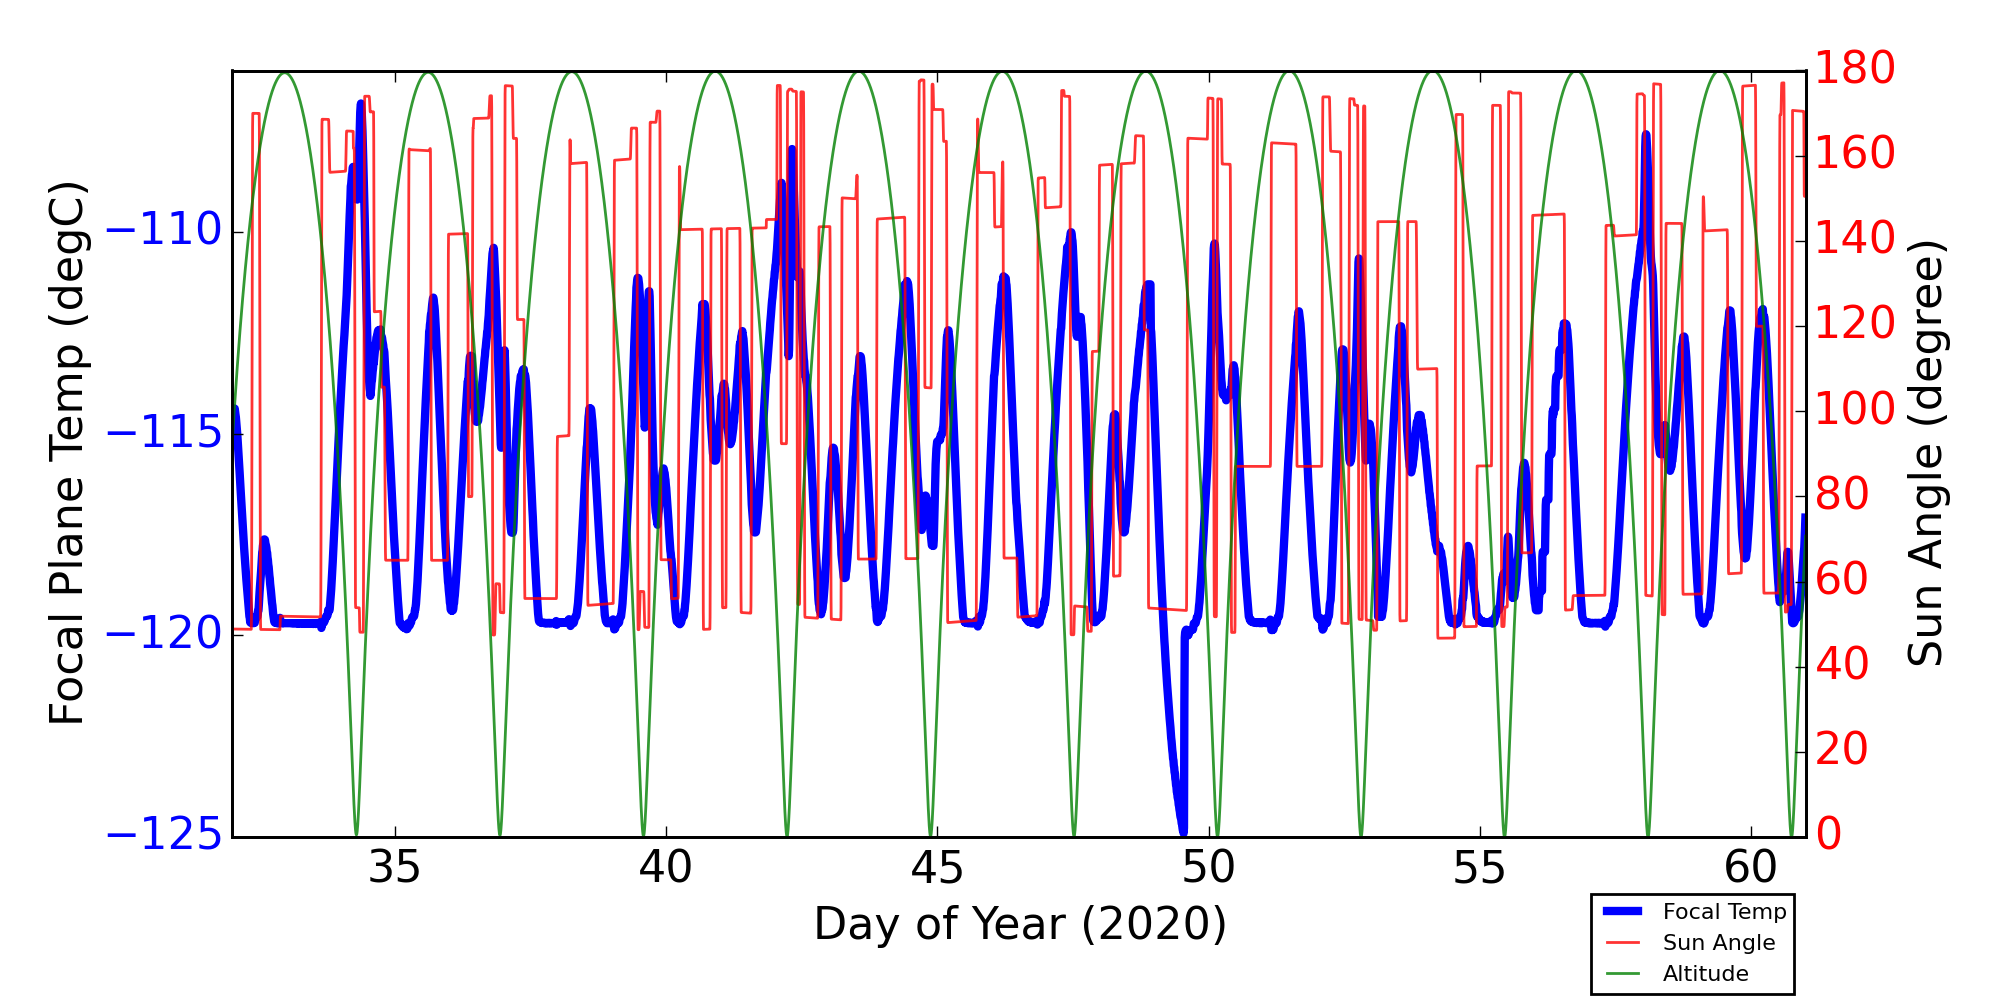
Focal Plane Temperature, Sun Angle and Altitude
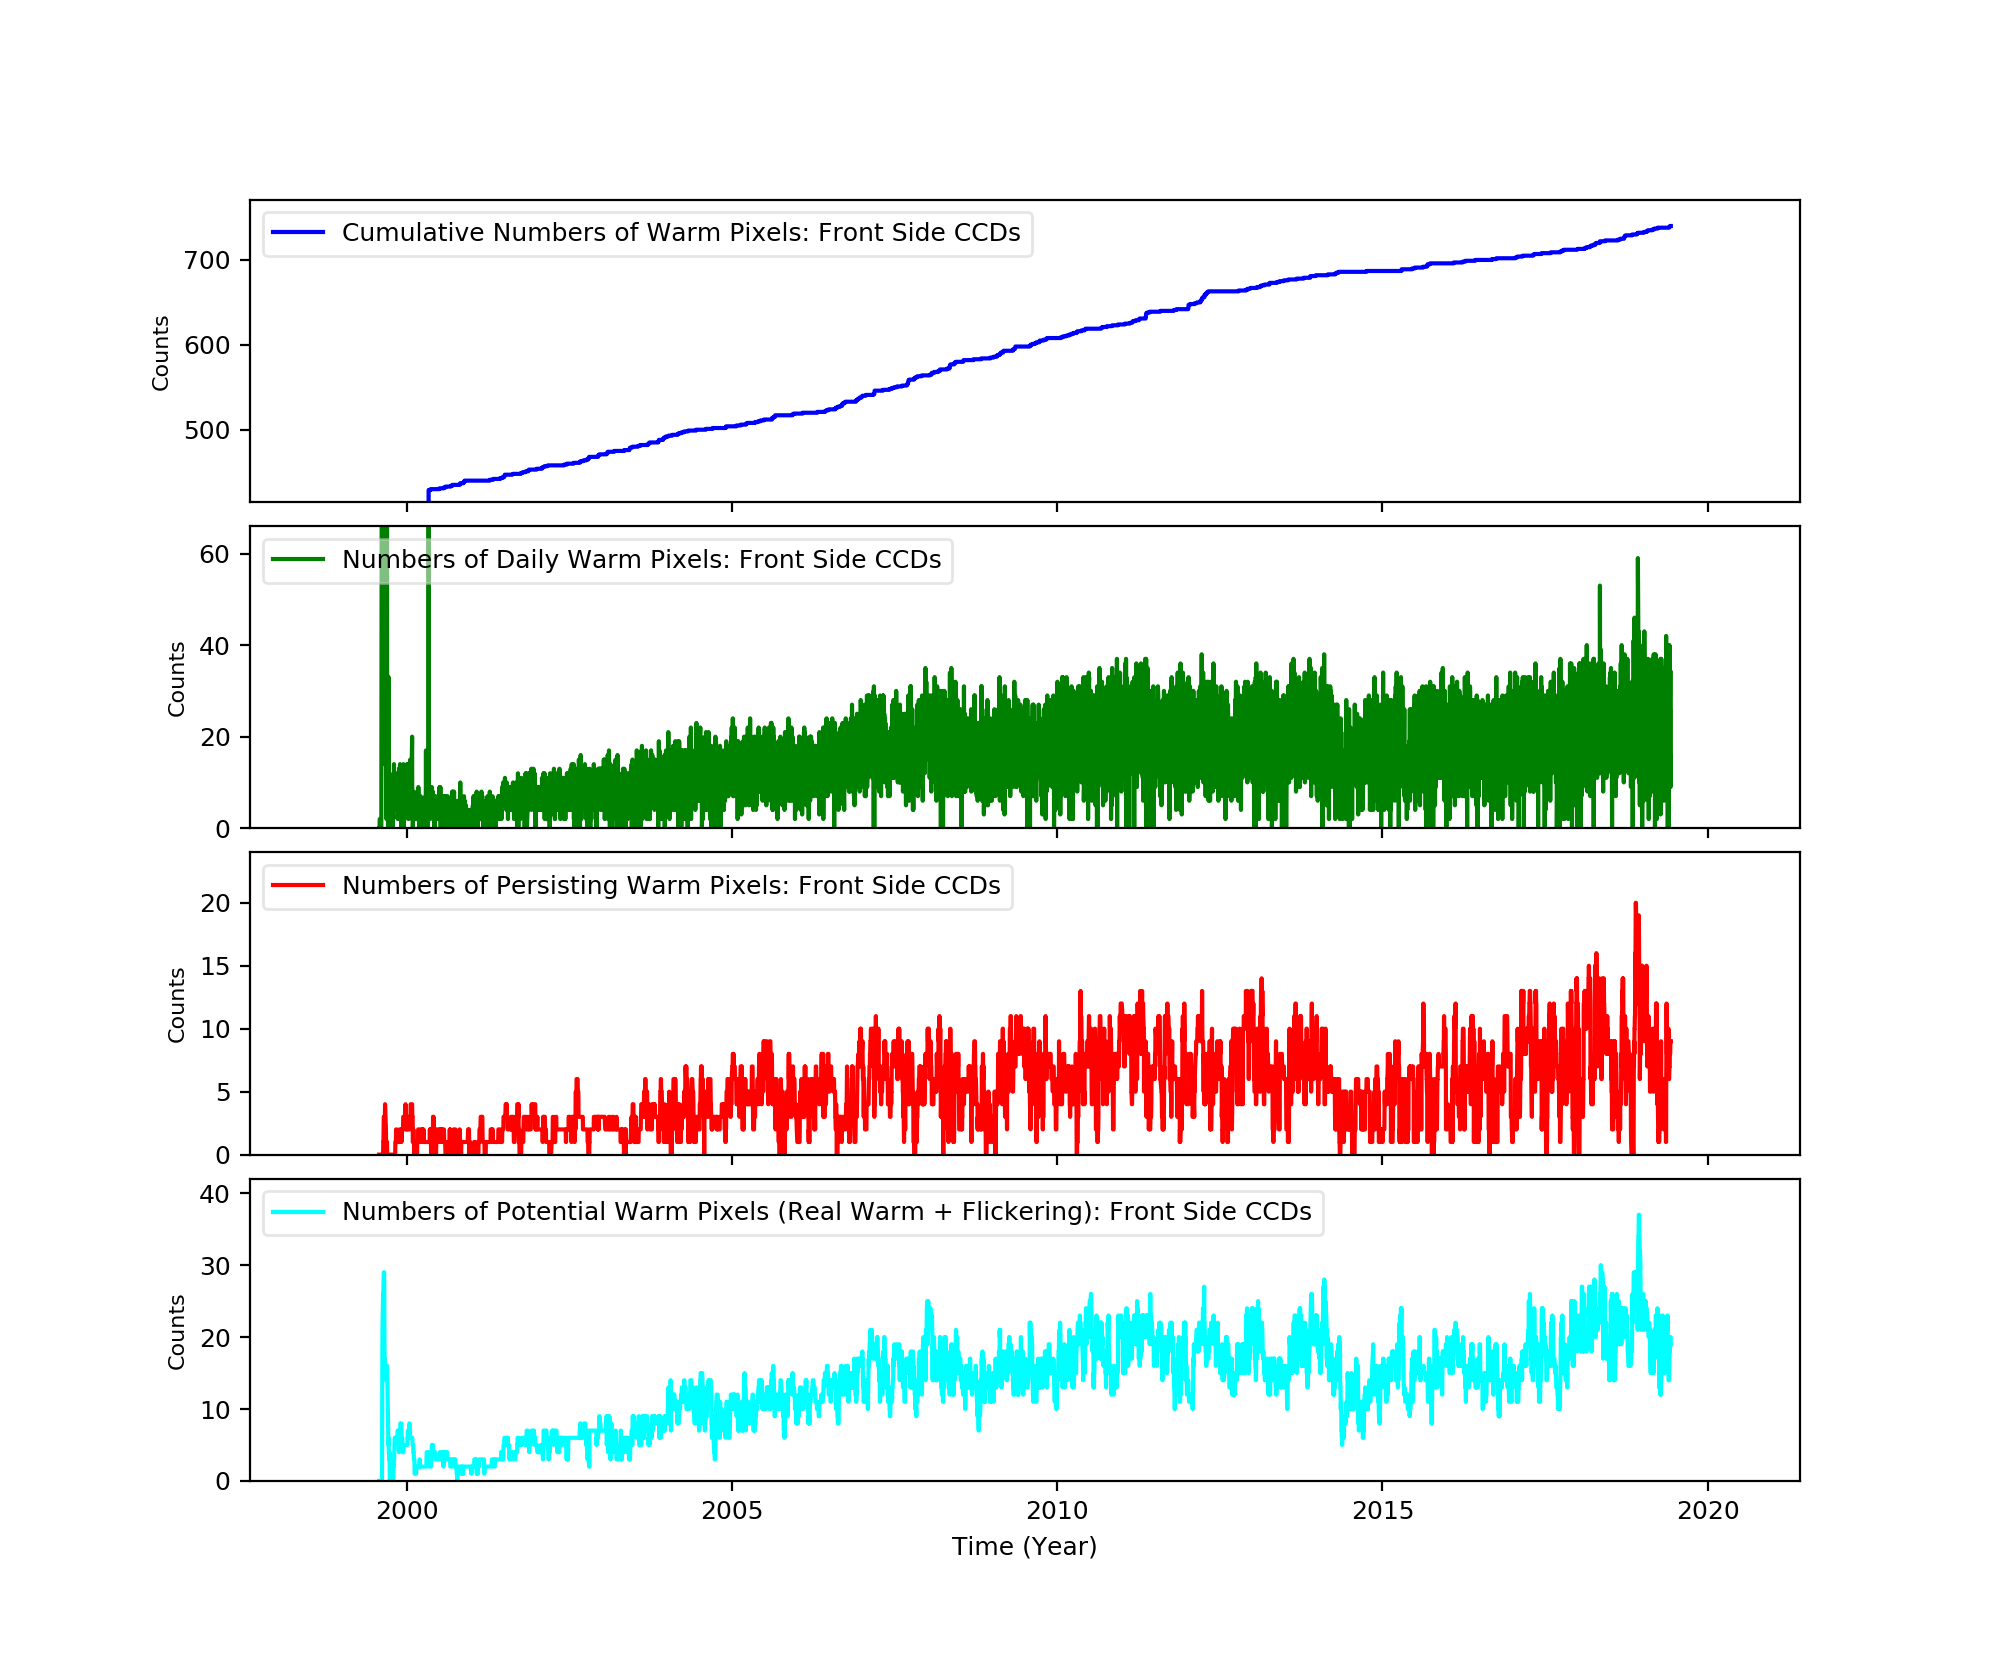
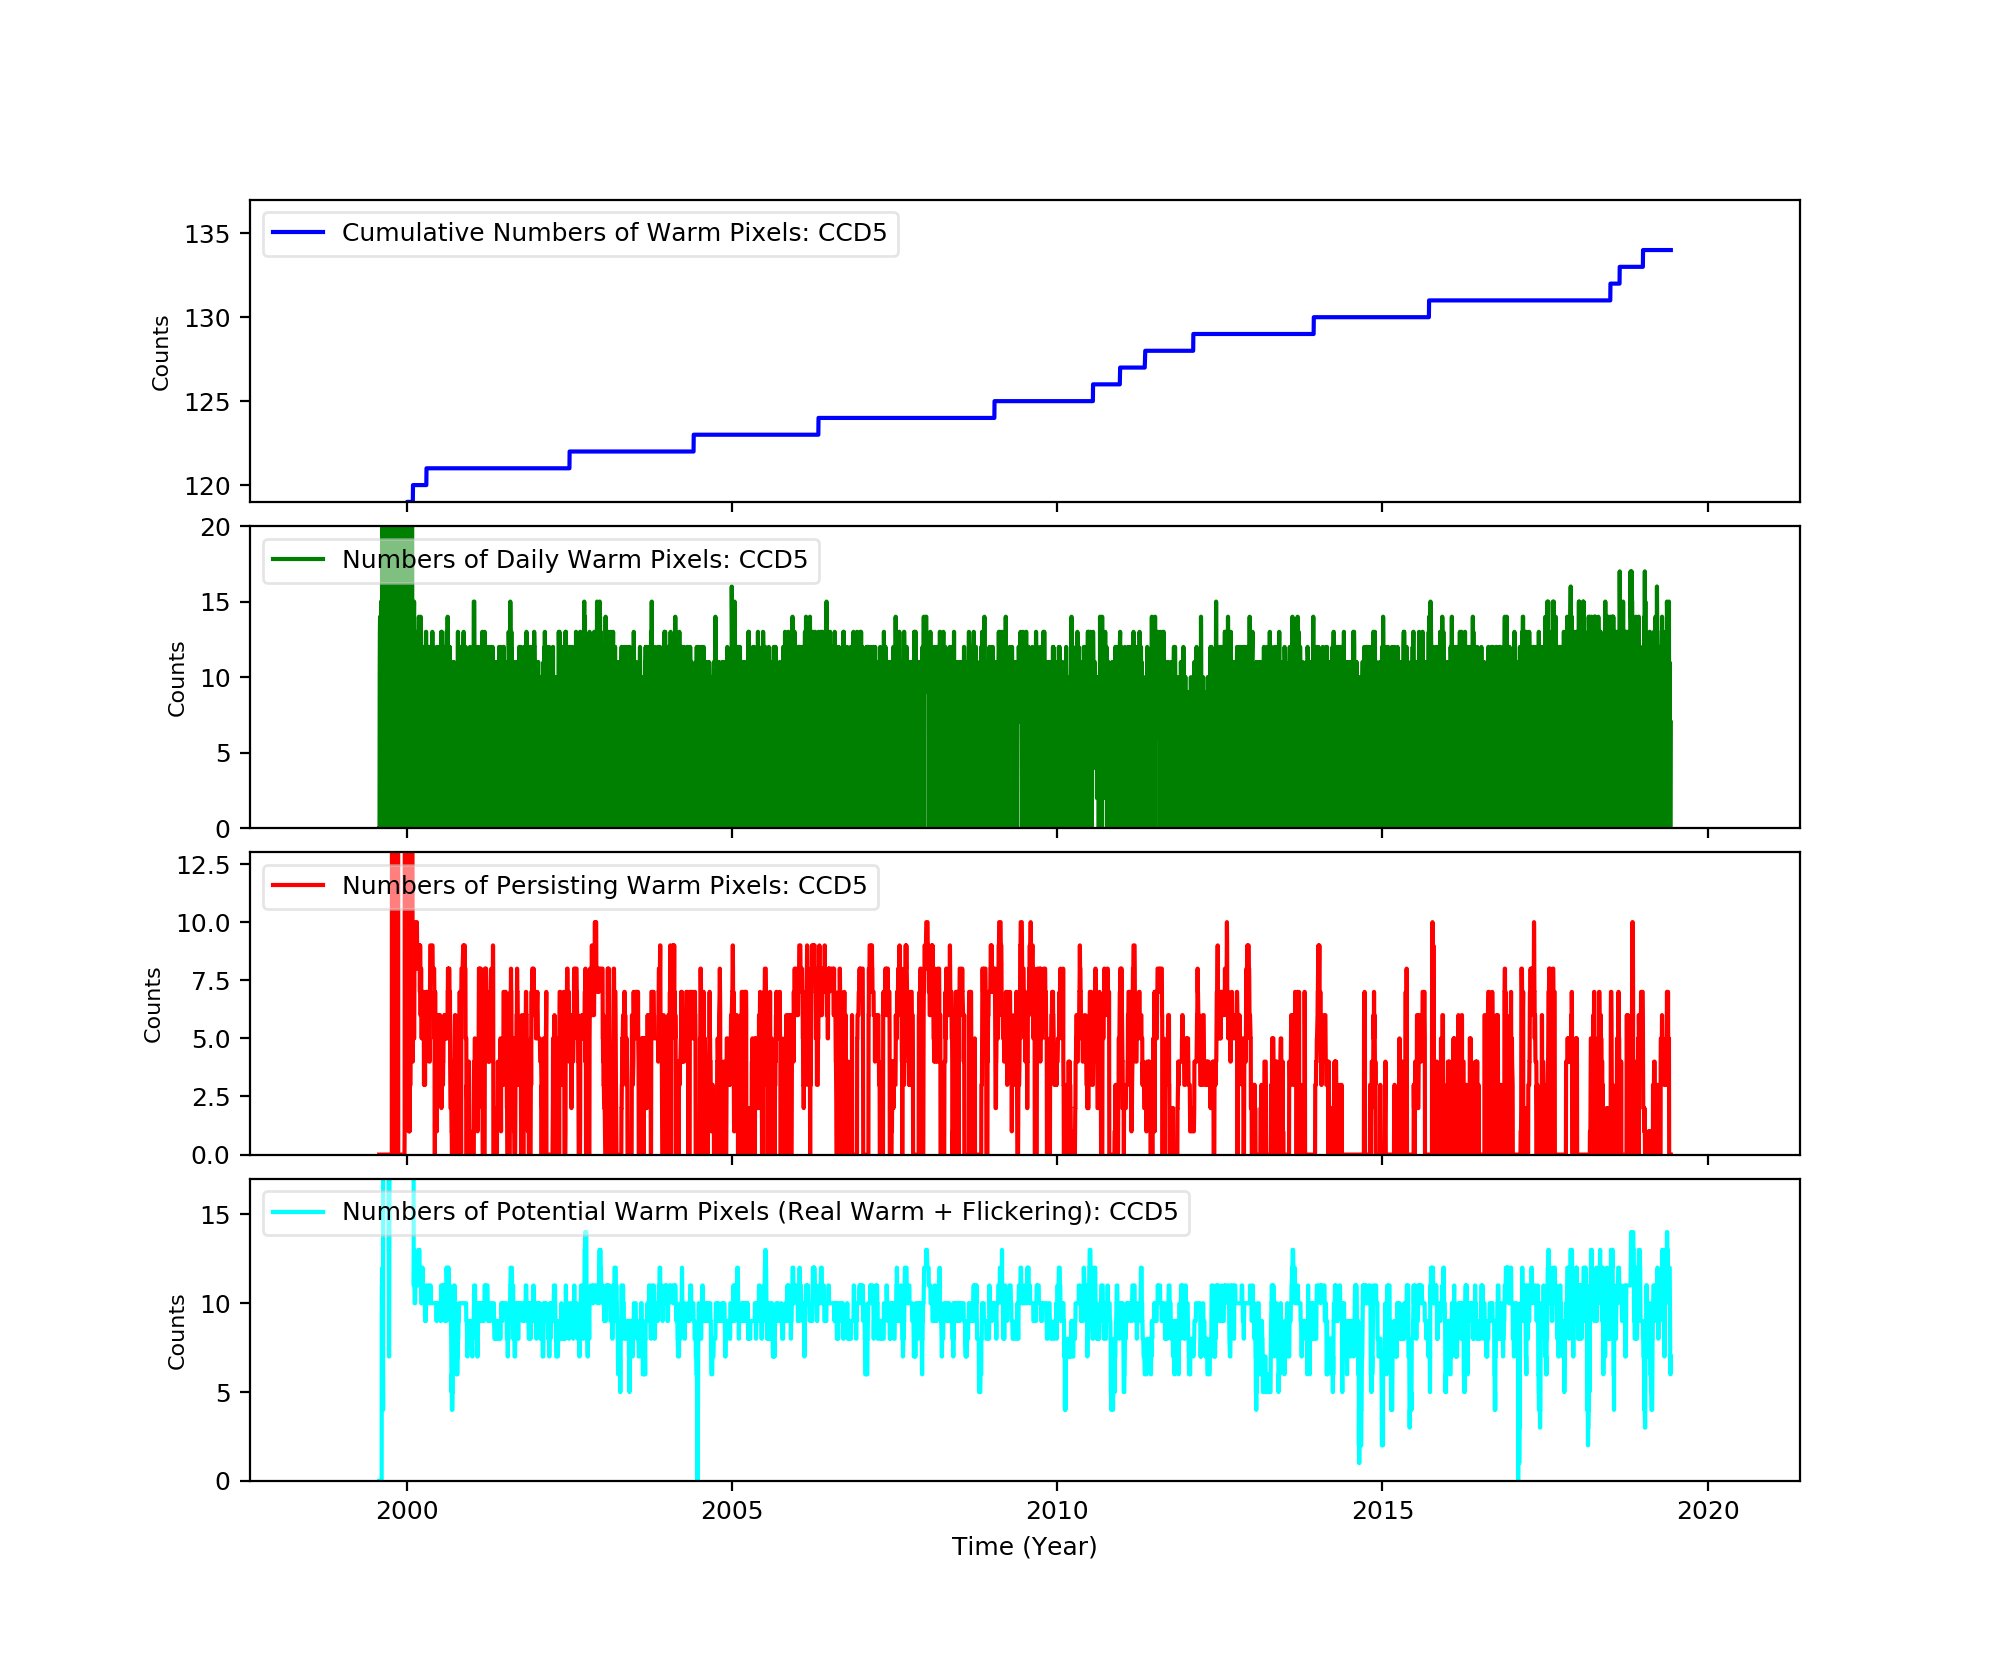
Bad Pixels
The plots below were generated with a new warm pixel finding script. Please see Acis Bad Pixel Page for details.
Front Side CCDs
Back Side CCD (CCD5)
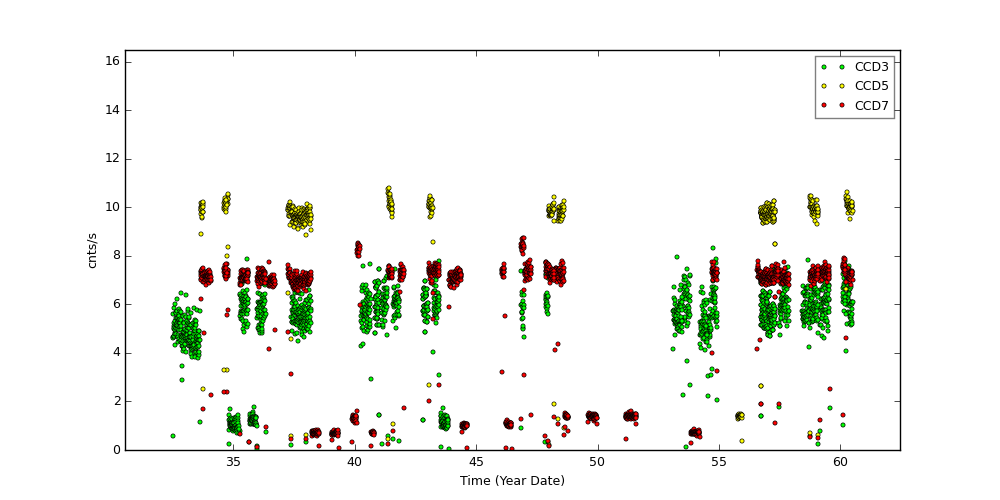
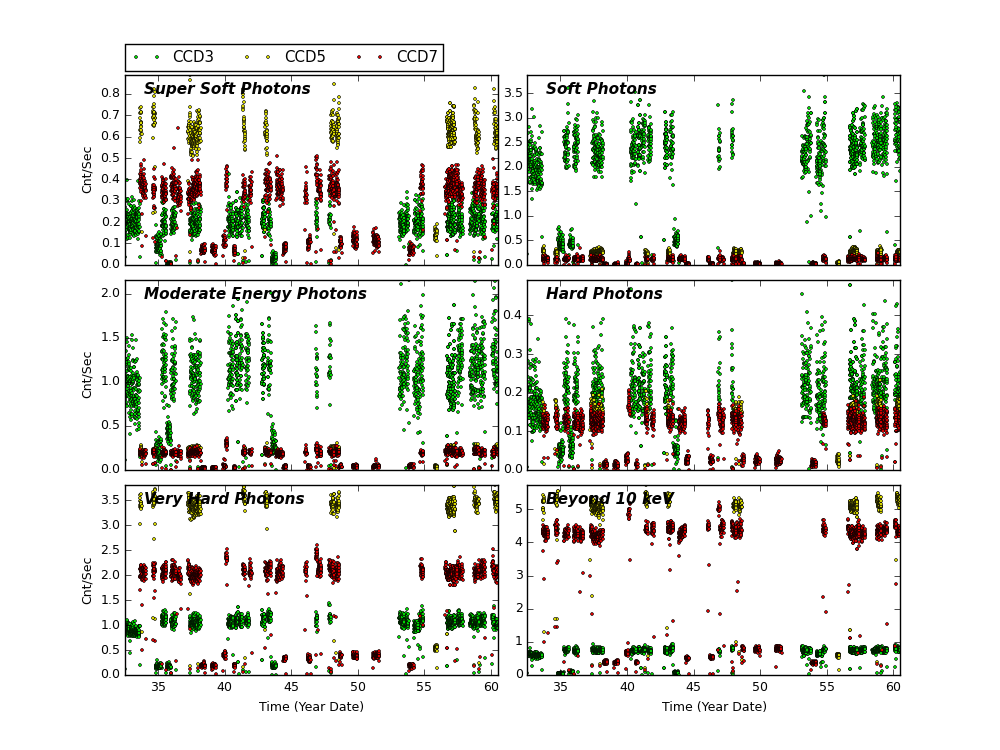
Science Instrument Background Rates
| Name | Low (keV) | High(KeV) | Description |
|---|---|---|---|
| SSoft | 0.00 | 0.50 | Super soft photons |
| Soft | 0.50 | 1.00 | Soft photons |
| Med | 1.00 | 3.00 | Moderate energy photons |
| Hard | 3.00 | 5.00 | Hard Photons |
| Harder | 5.00 | 10.00 | Very Hard photons |
| Hardest | 10.00 | Beyond 10 keV |
HRC
DOSE of Central 4K Pore-Pairs
Please refer to Maximum Dose Trends for more details.
)
|
|---|
IMAGE                NPIX      MEAN    STDDEV      MIN       MAX
HRCI_02_2020.fits  16777216	0.016 	0.130 	0.000 	8.000
)
IMAGE                       NPIX      MEAN    STDDEV      MIN       MAX
HRCI_08_1999_02_2020.fits  16777216	6.160 	5.939 	0.000 	303.000
)
|
|---|
IMAGE                NPIX      MEAN    STDDEV      MIN       MAX
HRCS_02_2020.fits  16777216	0.096 	0.322 	0.000 	7.000
)
IMAGE                       NPIX      MEAN    STDDEV      MIN       MAX
HRCS_08_1999_02_2020.fits  16777216	18.801 	33.944 	0.000 	1749.000
|
|
Max dose trend plots corrected for events that "pile-up"
in the center of the taps due to bad position information.
|
)
|
)
|
)
|
)
|
| Nov 2019 | Aug 2019 | May 2019 | Feb 2019 |
|---|
)
|
)
|
)
|
)
|
| Nov 2019 | Aug 2019 | May 2019 | Feb 2019 |
|---|
HRMA Focus
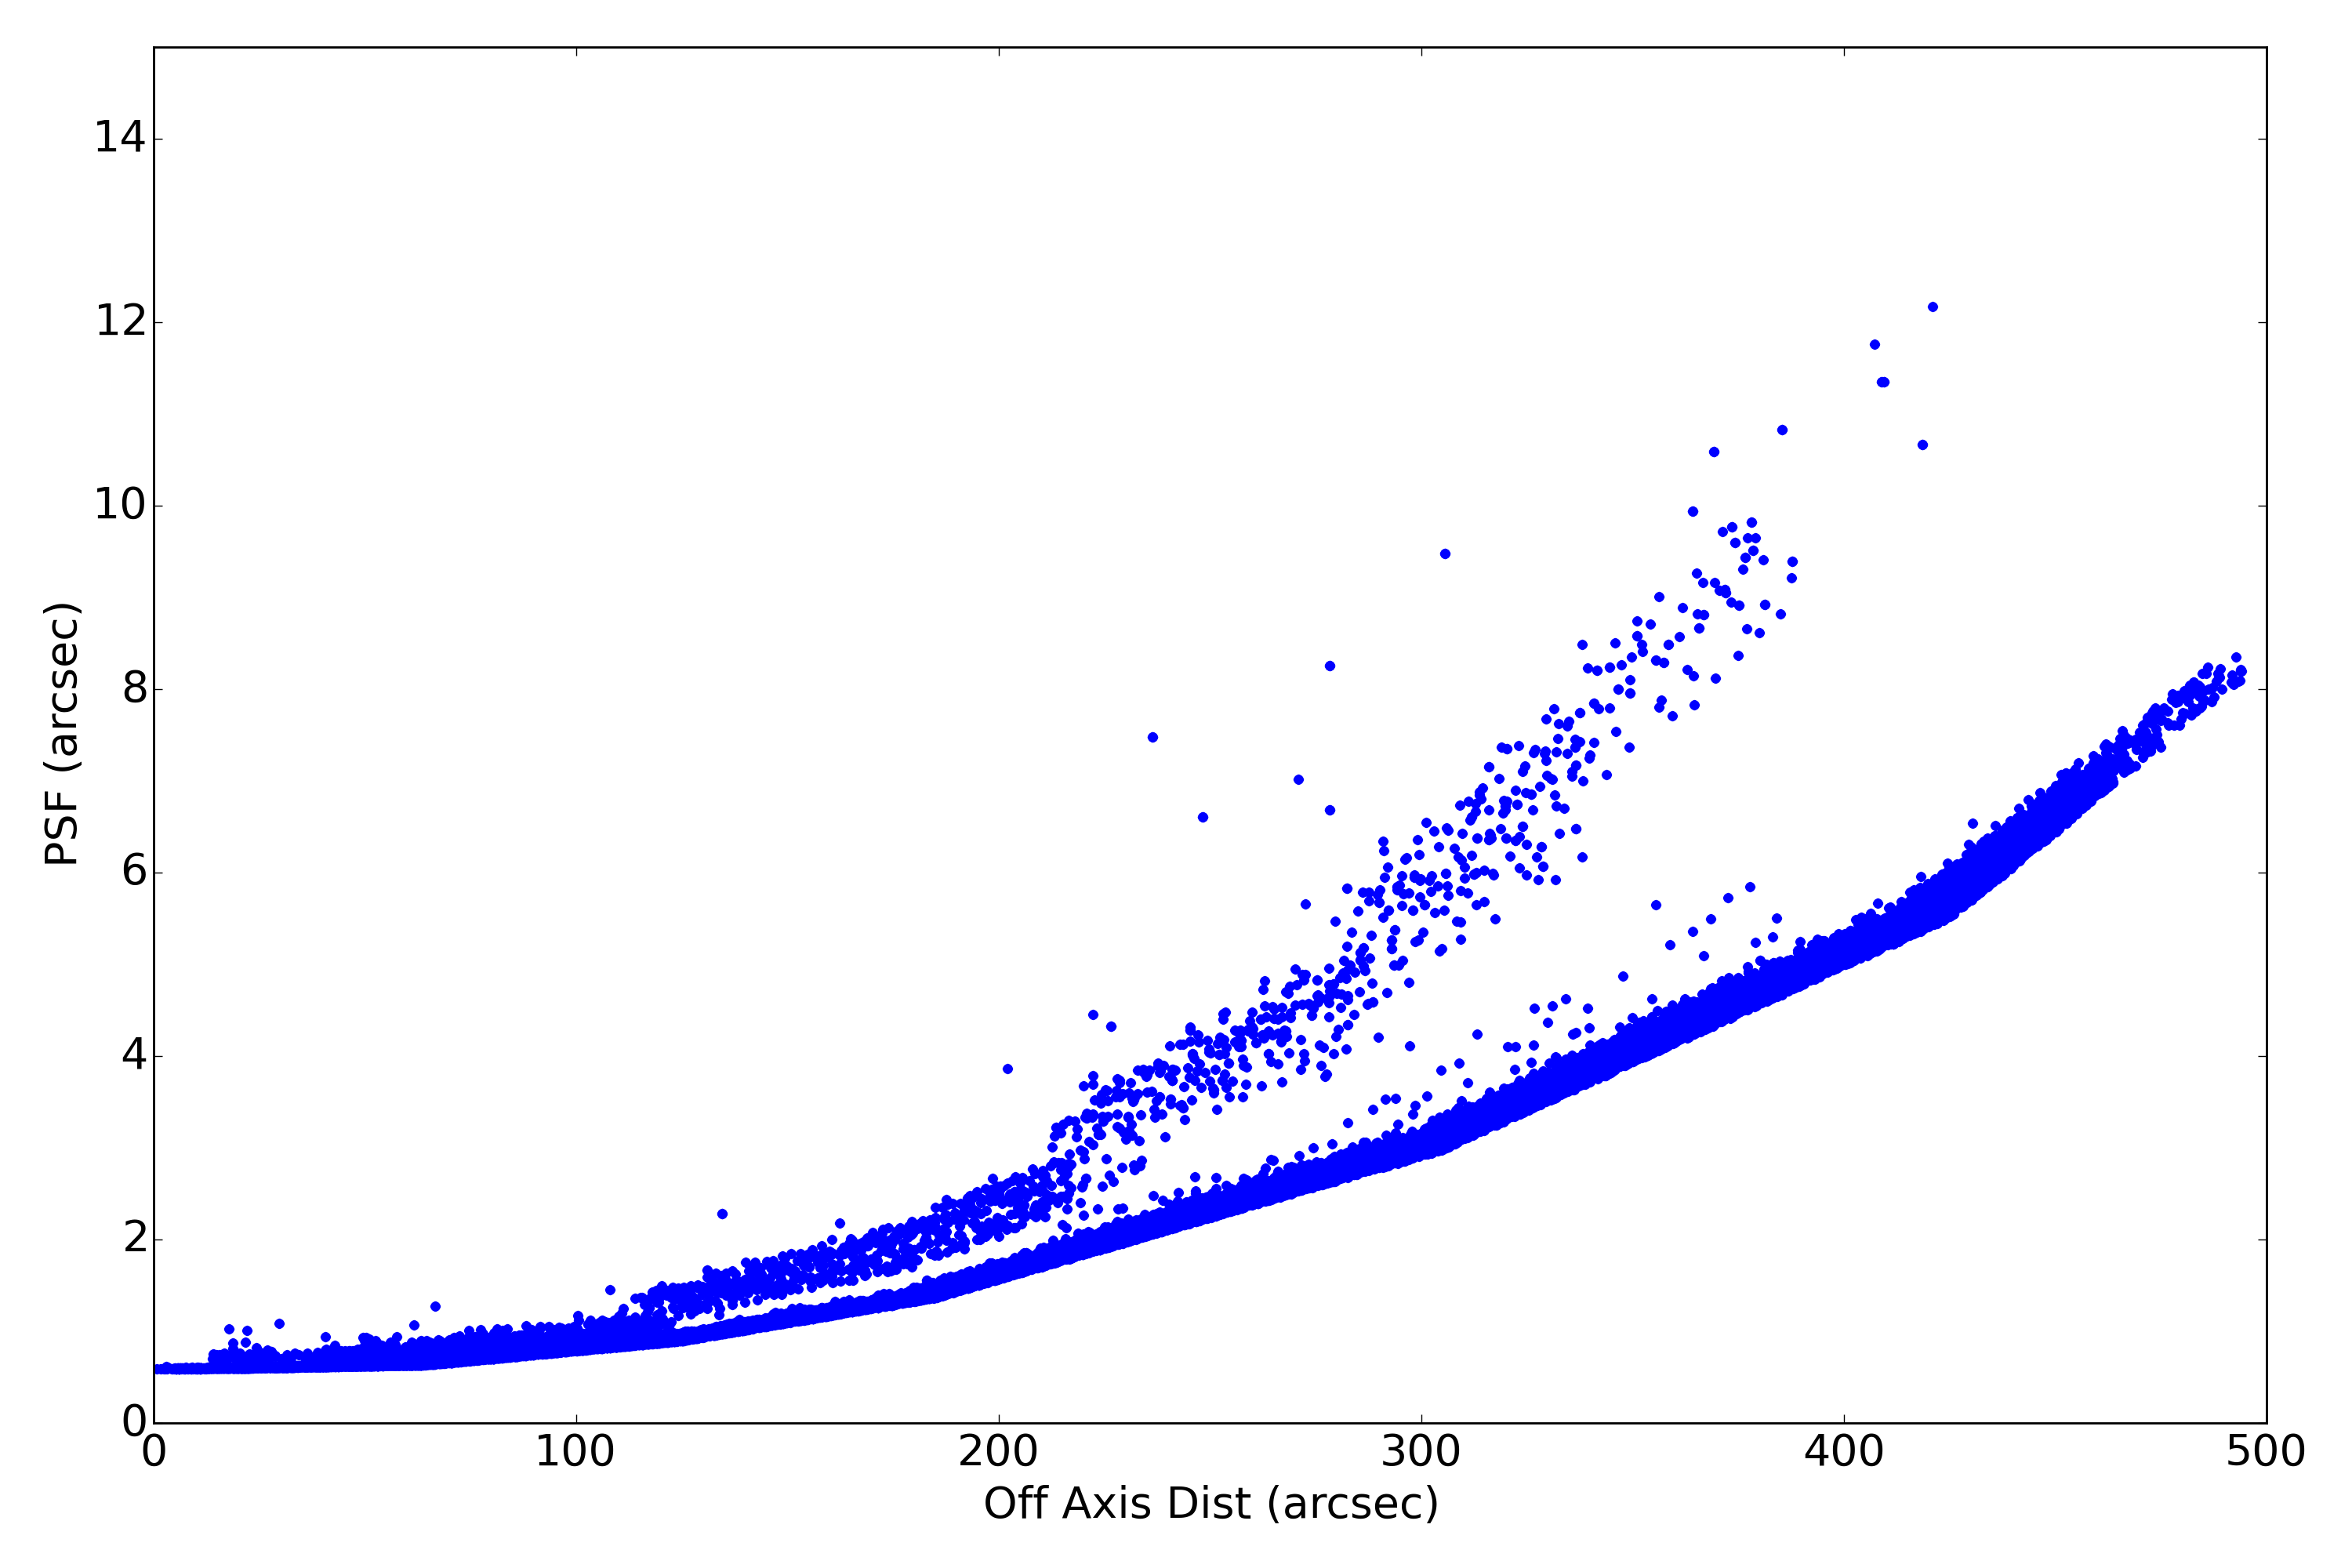
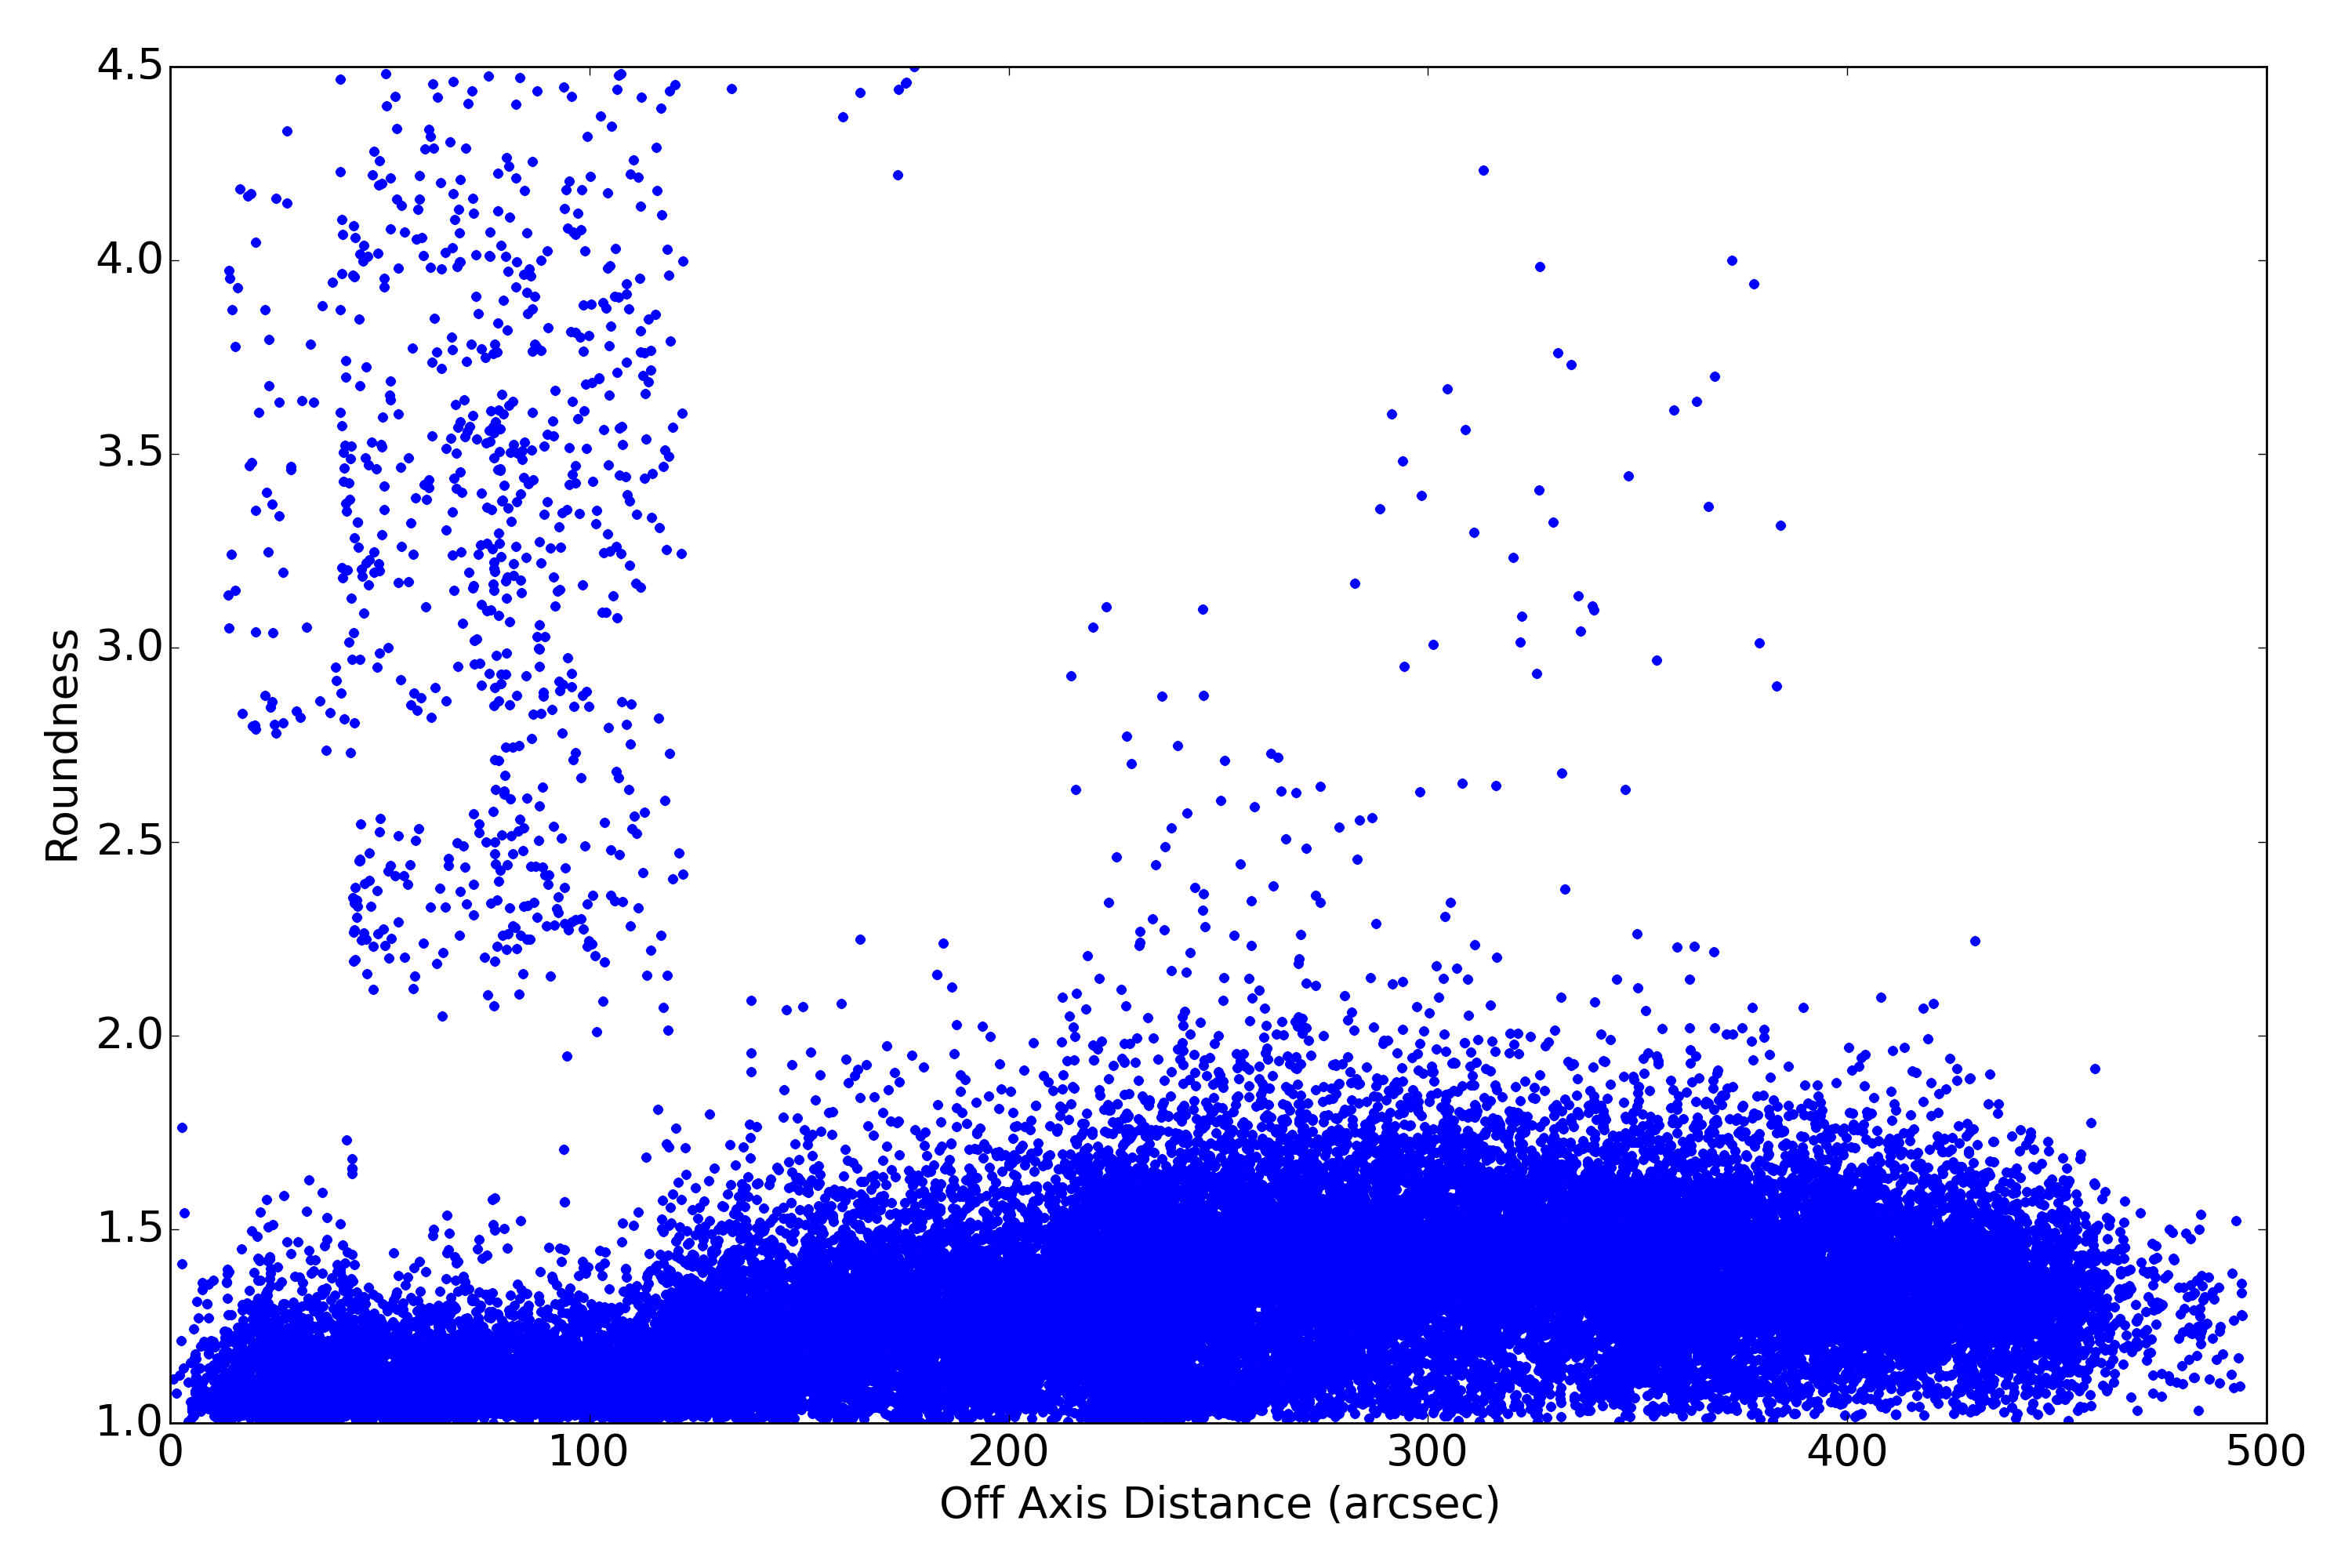
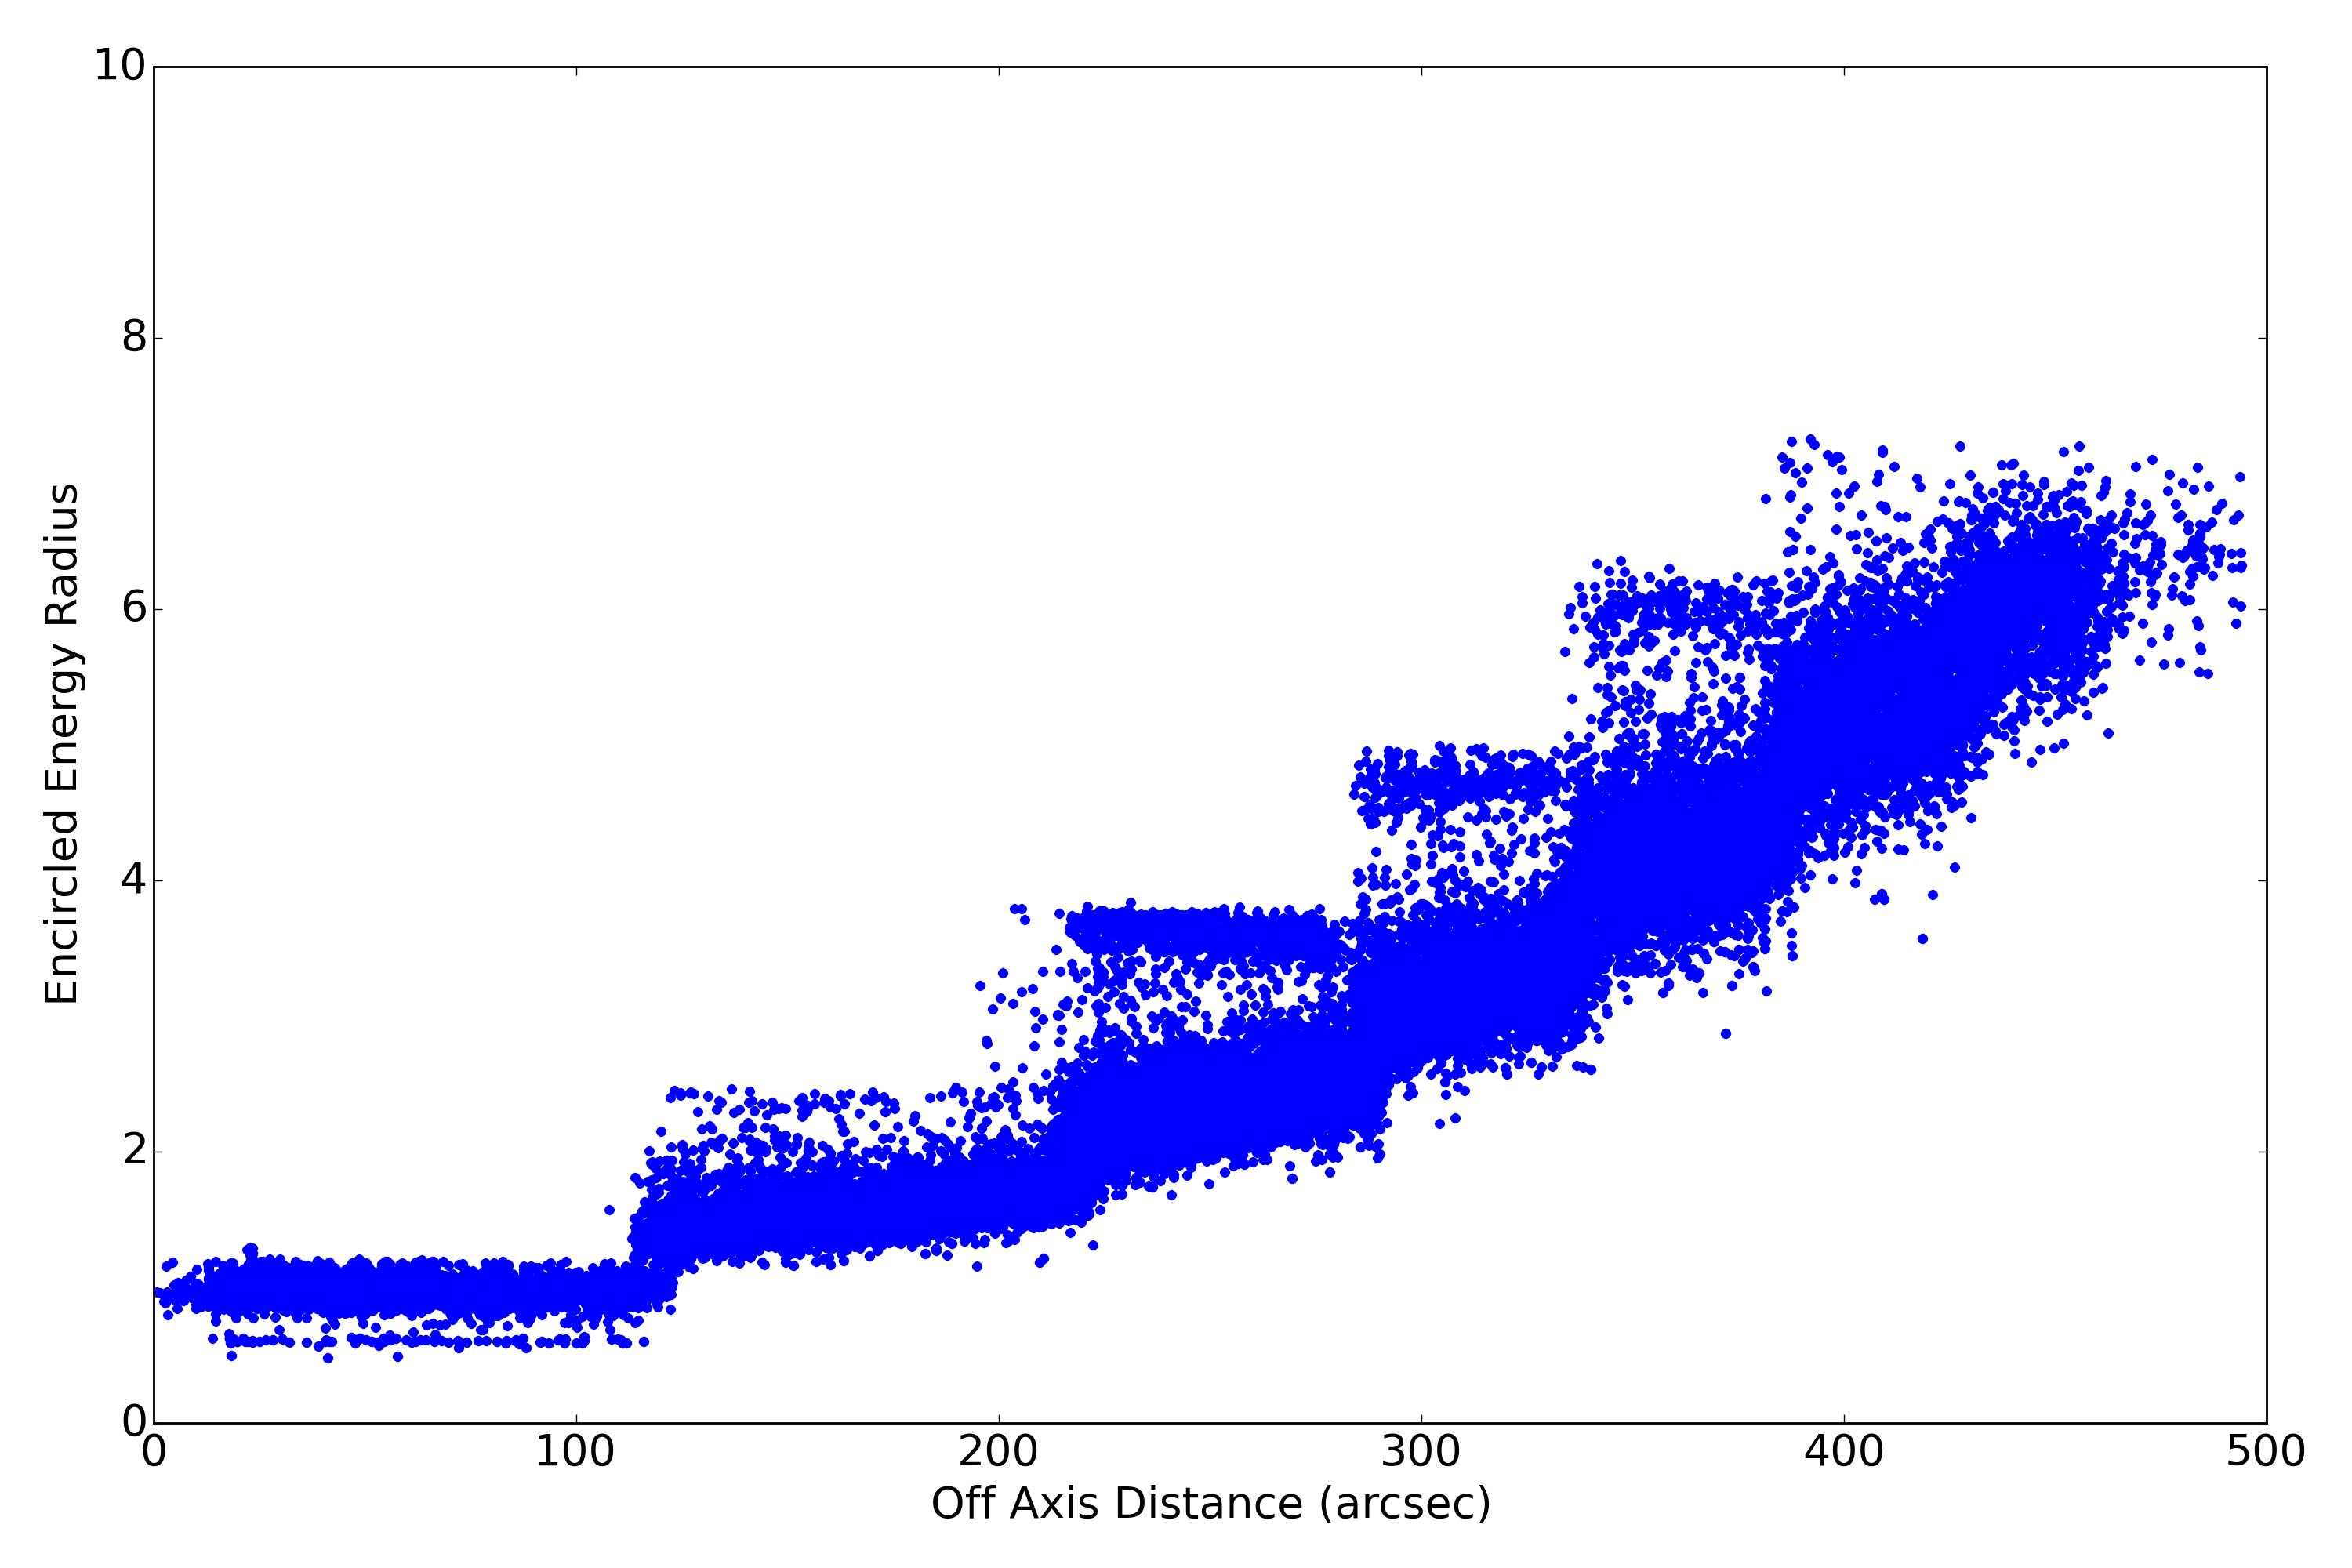
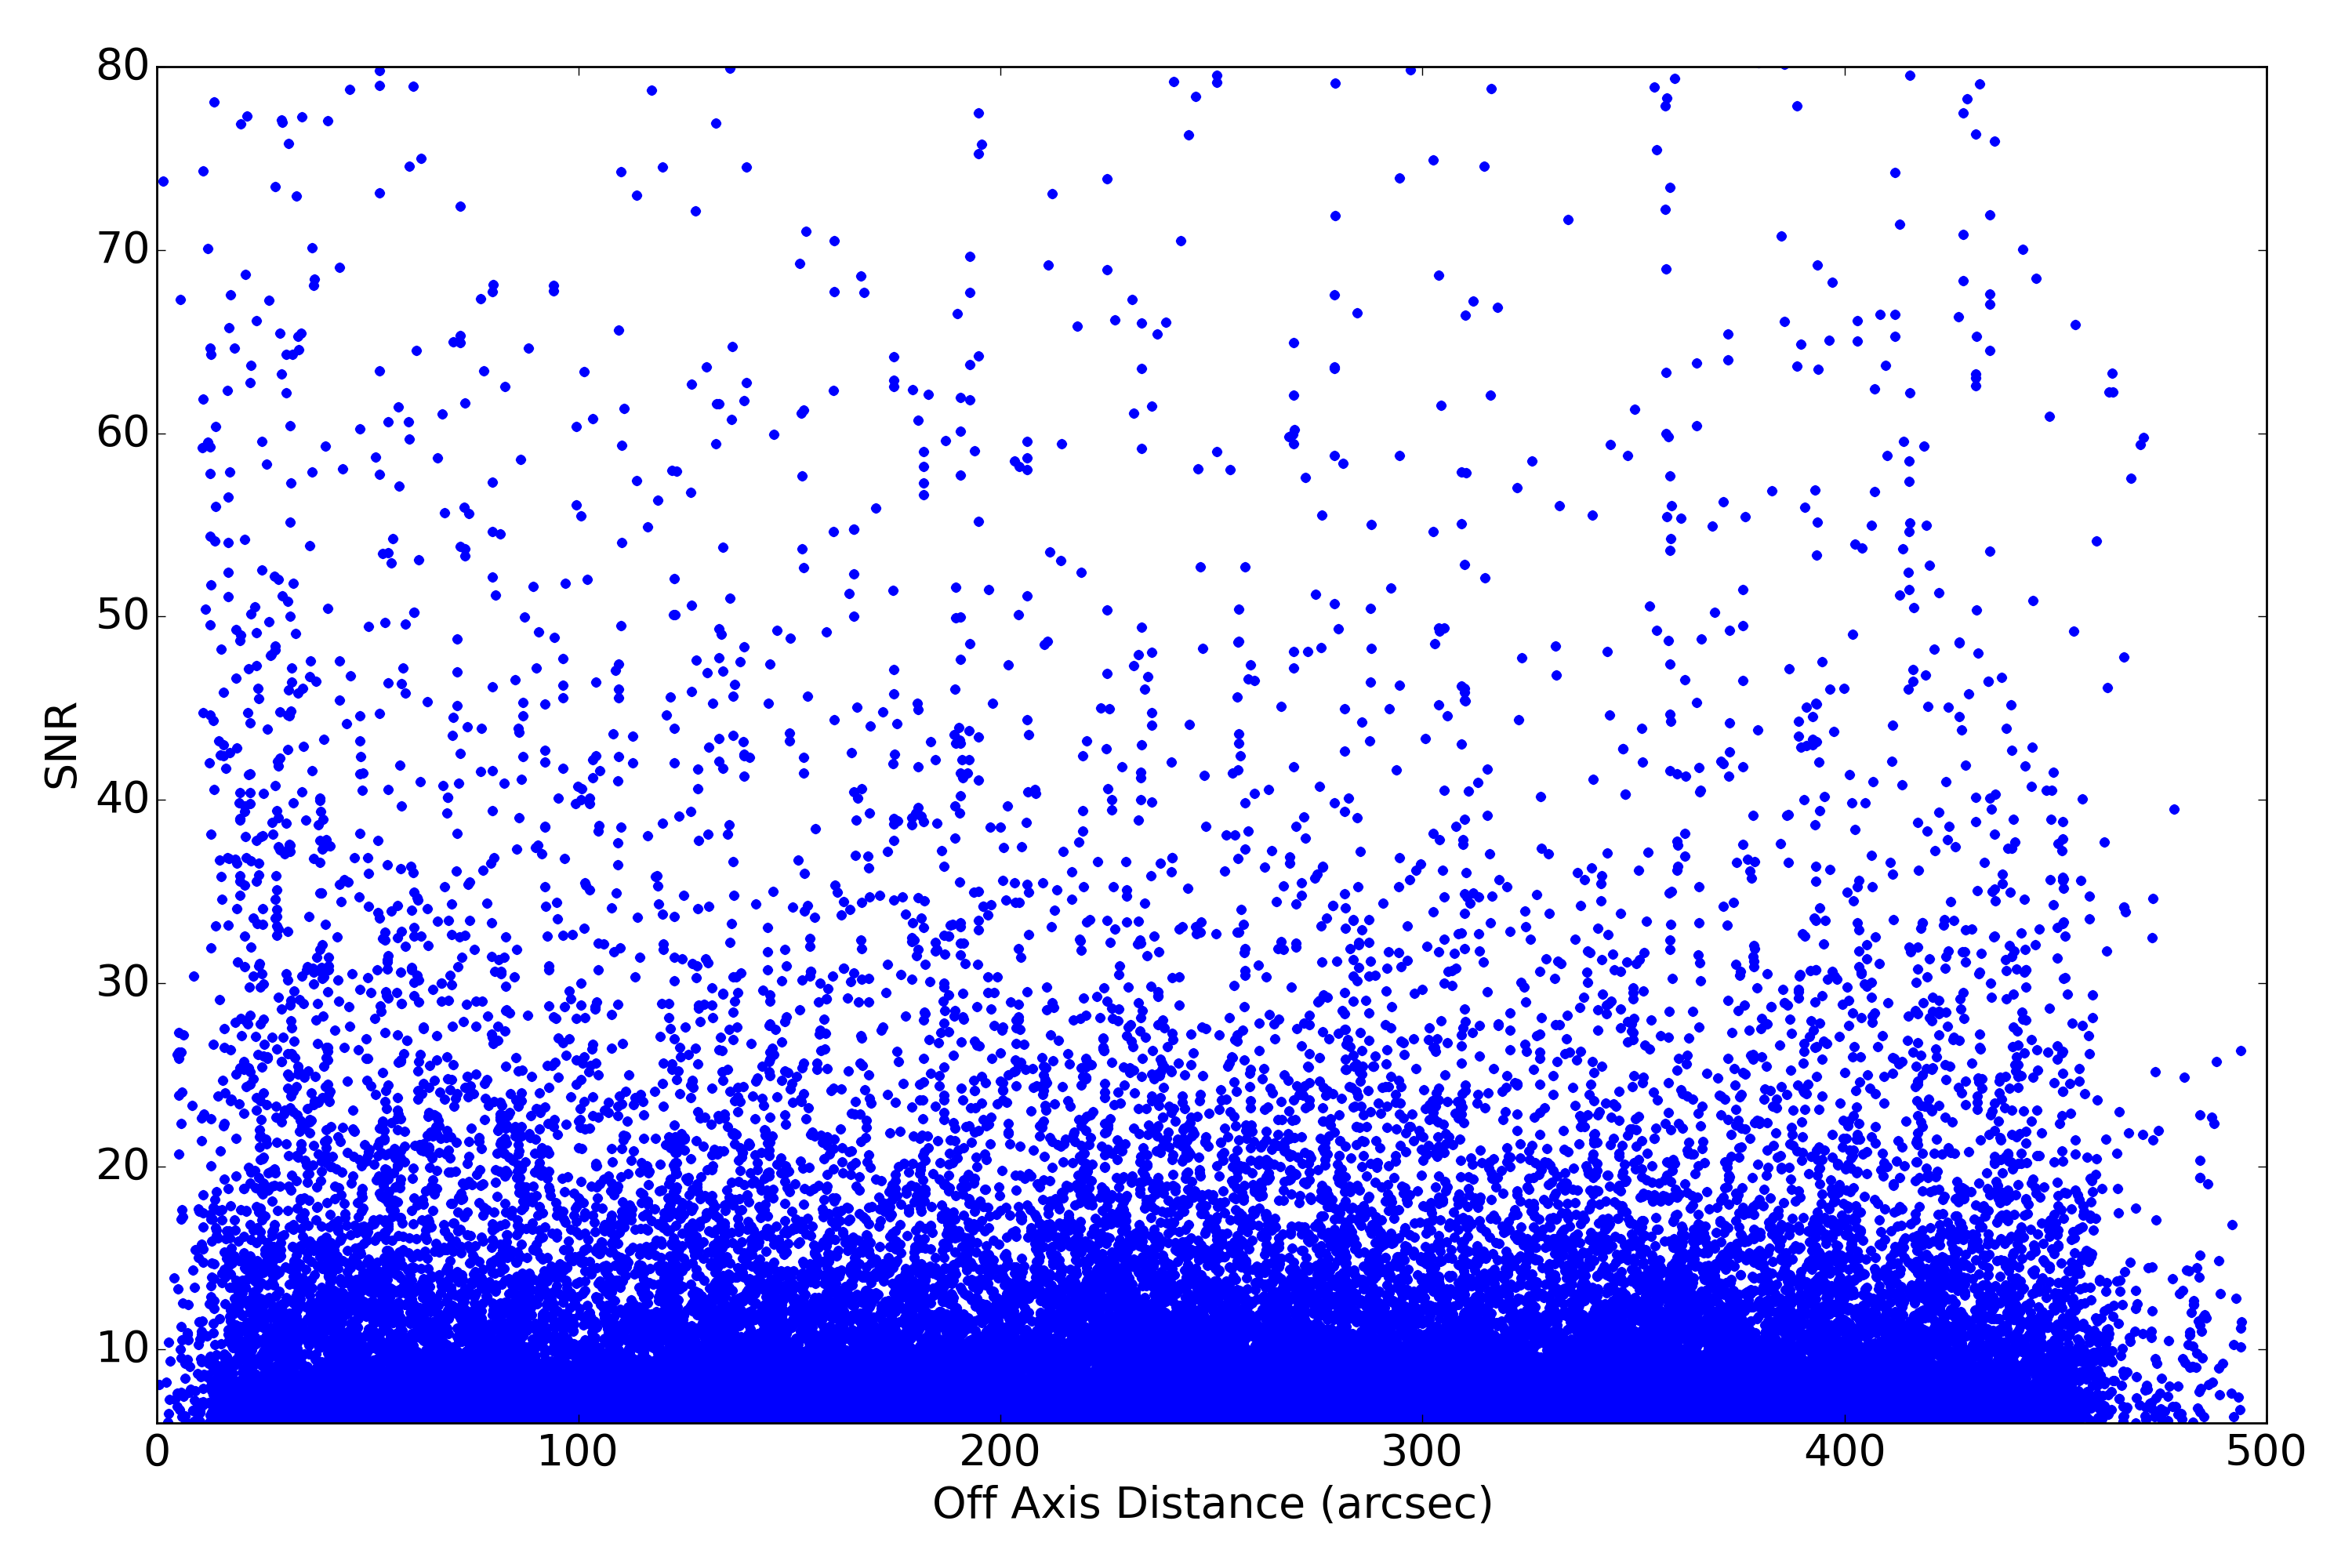
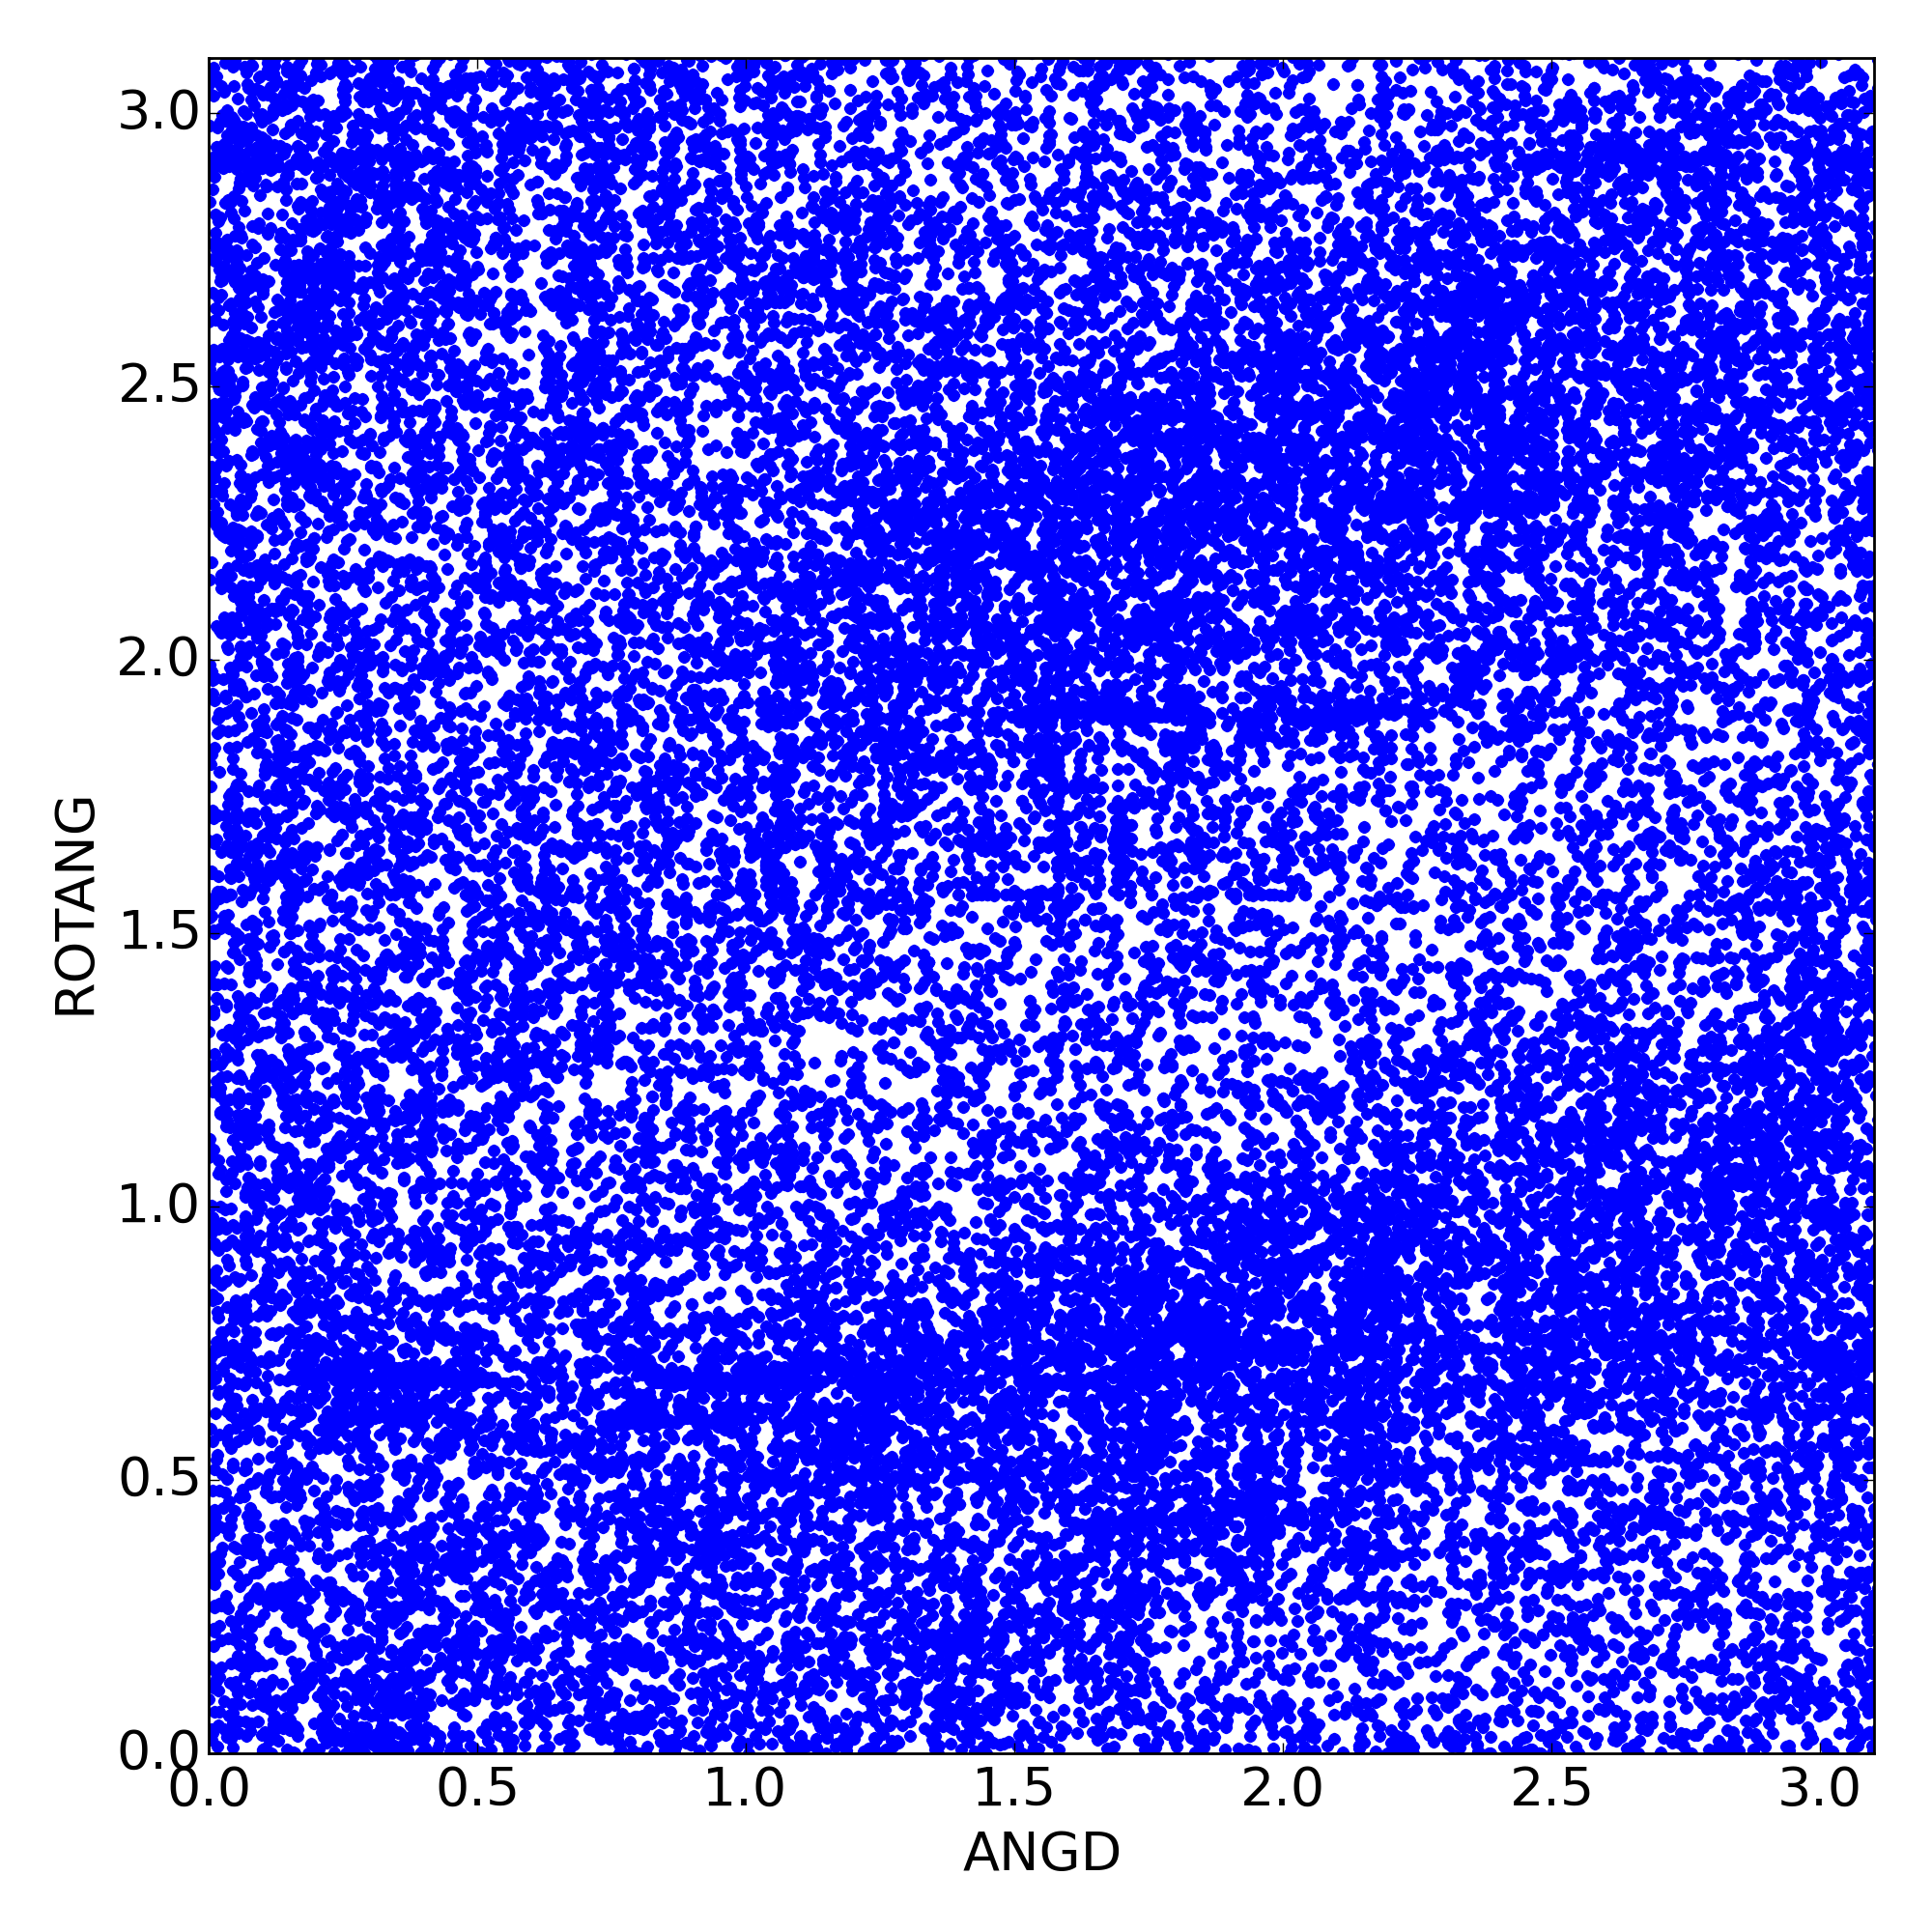
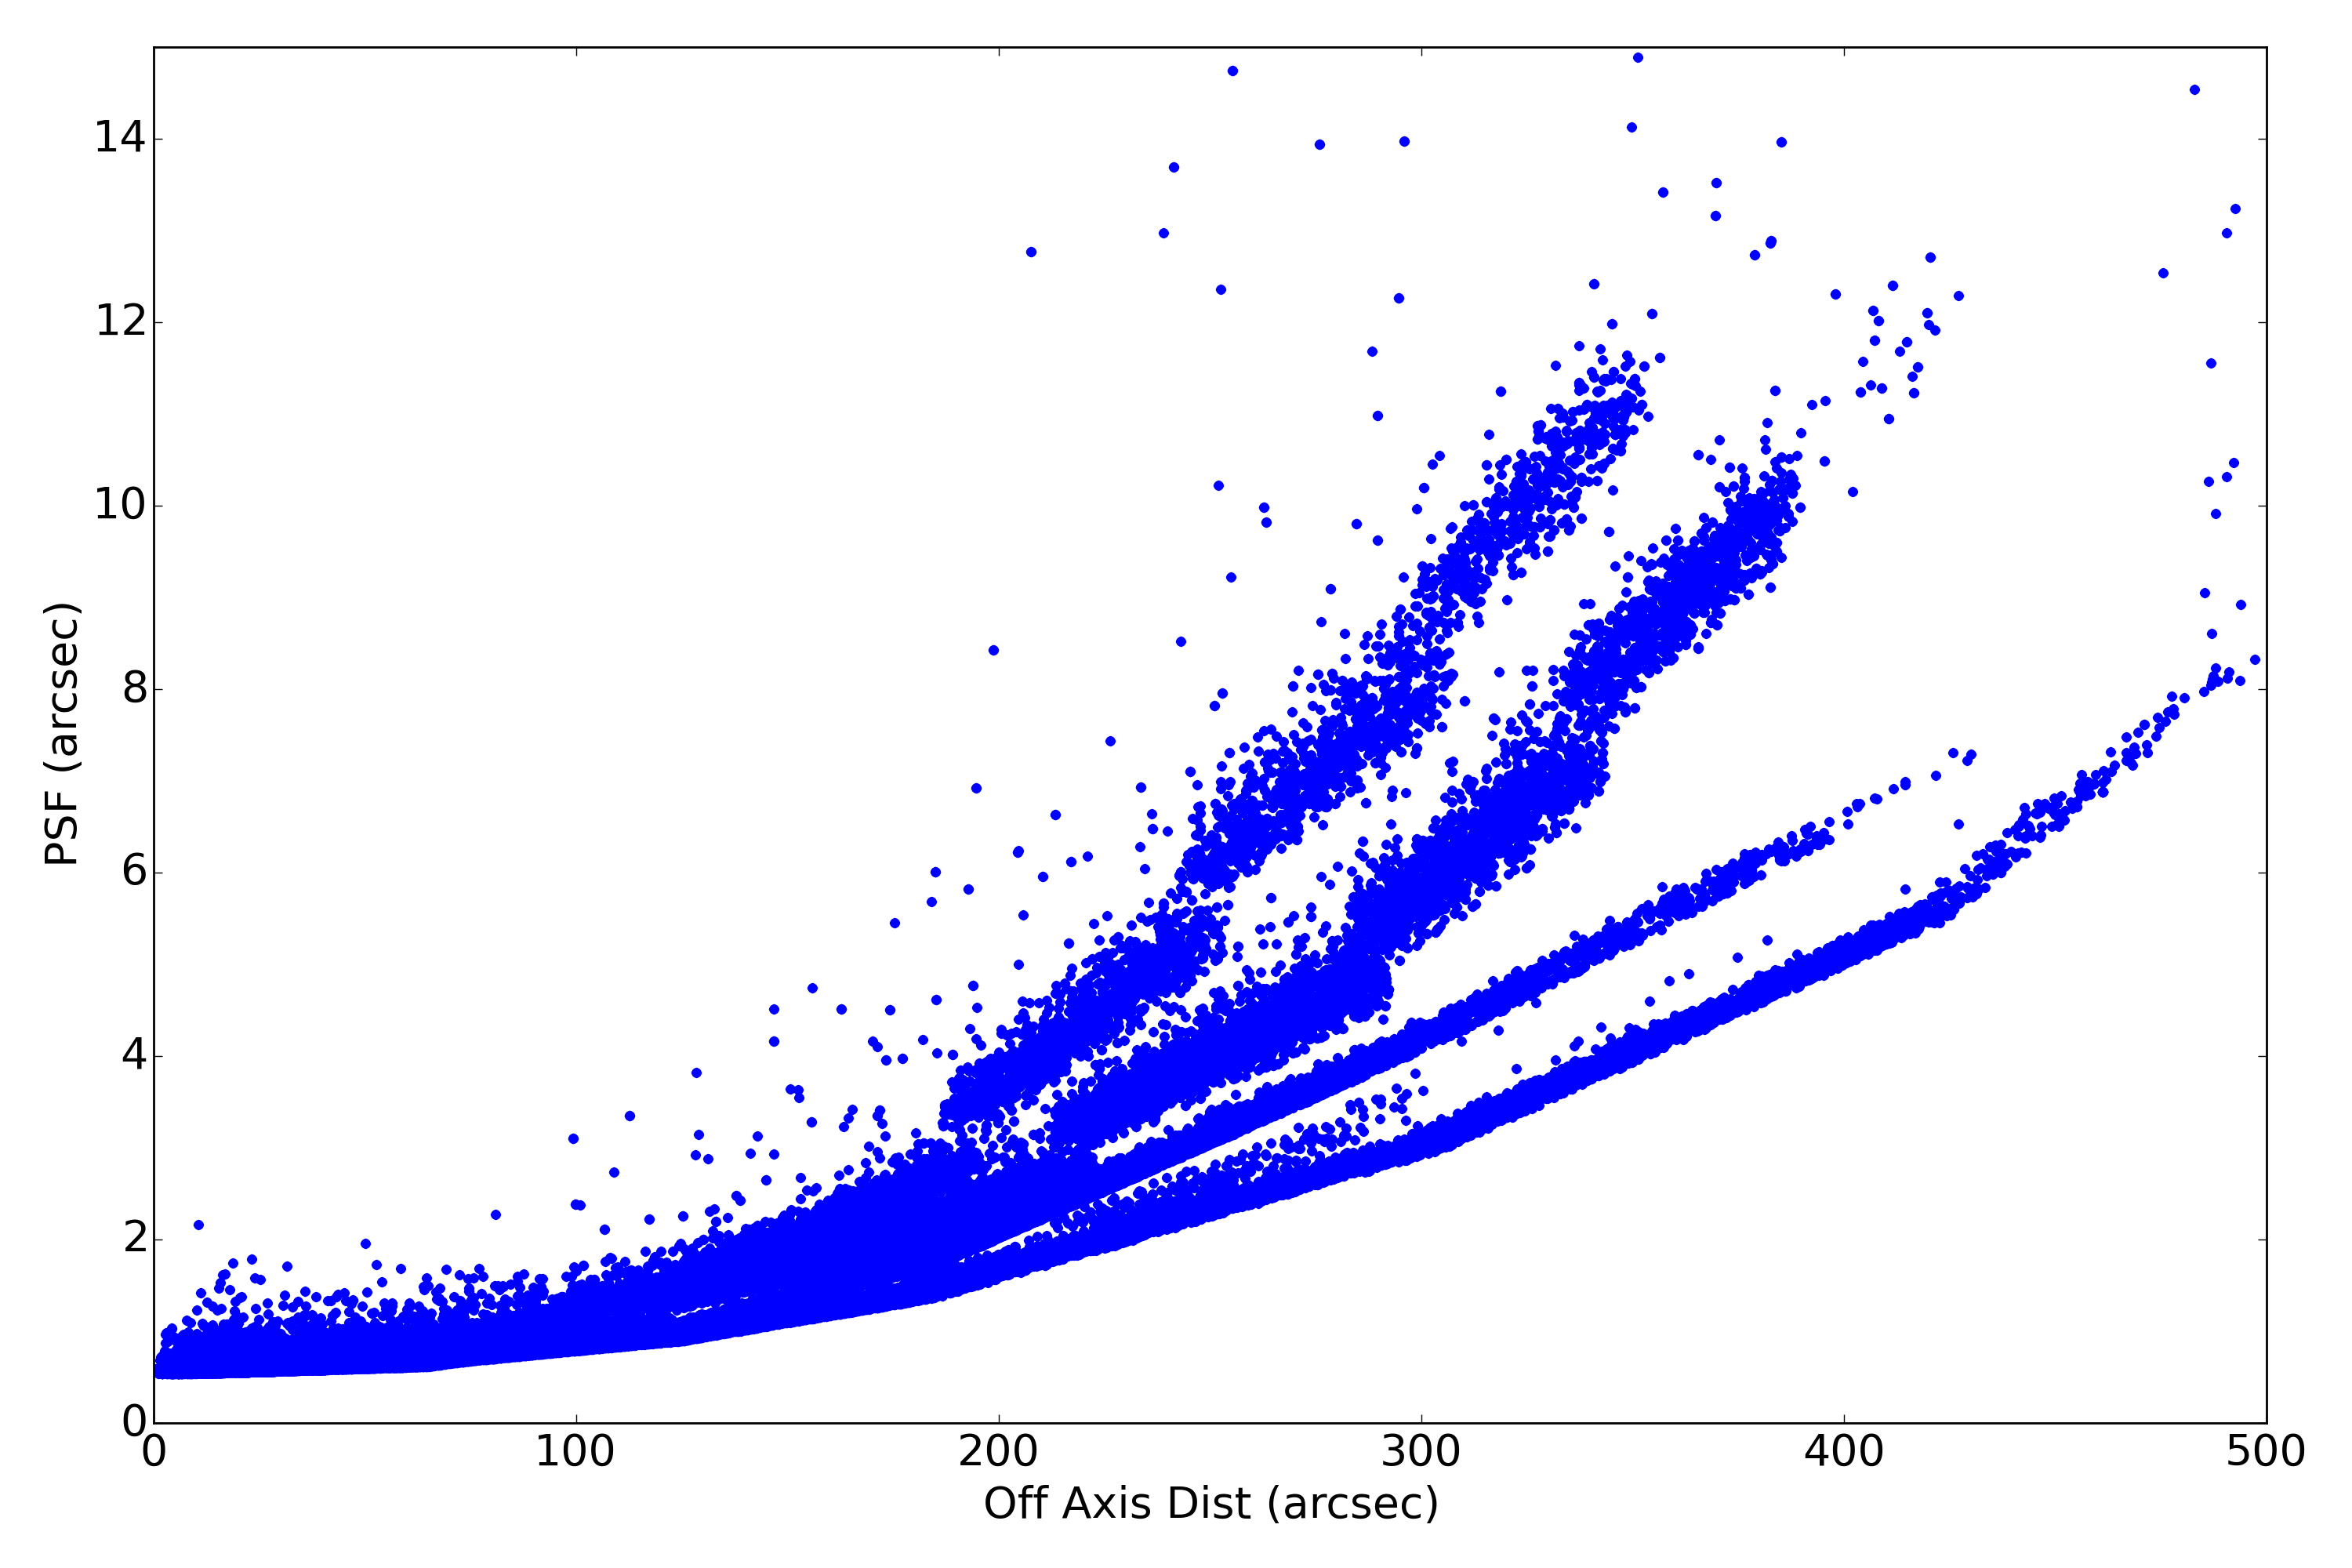
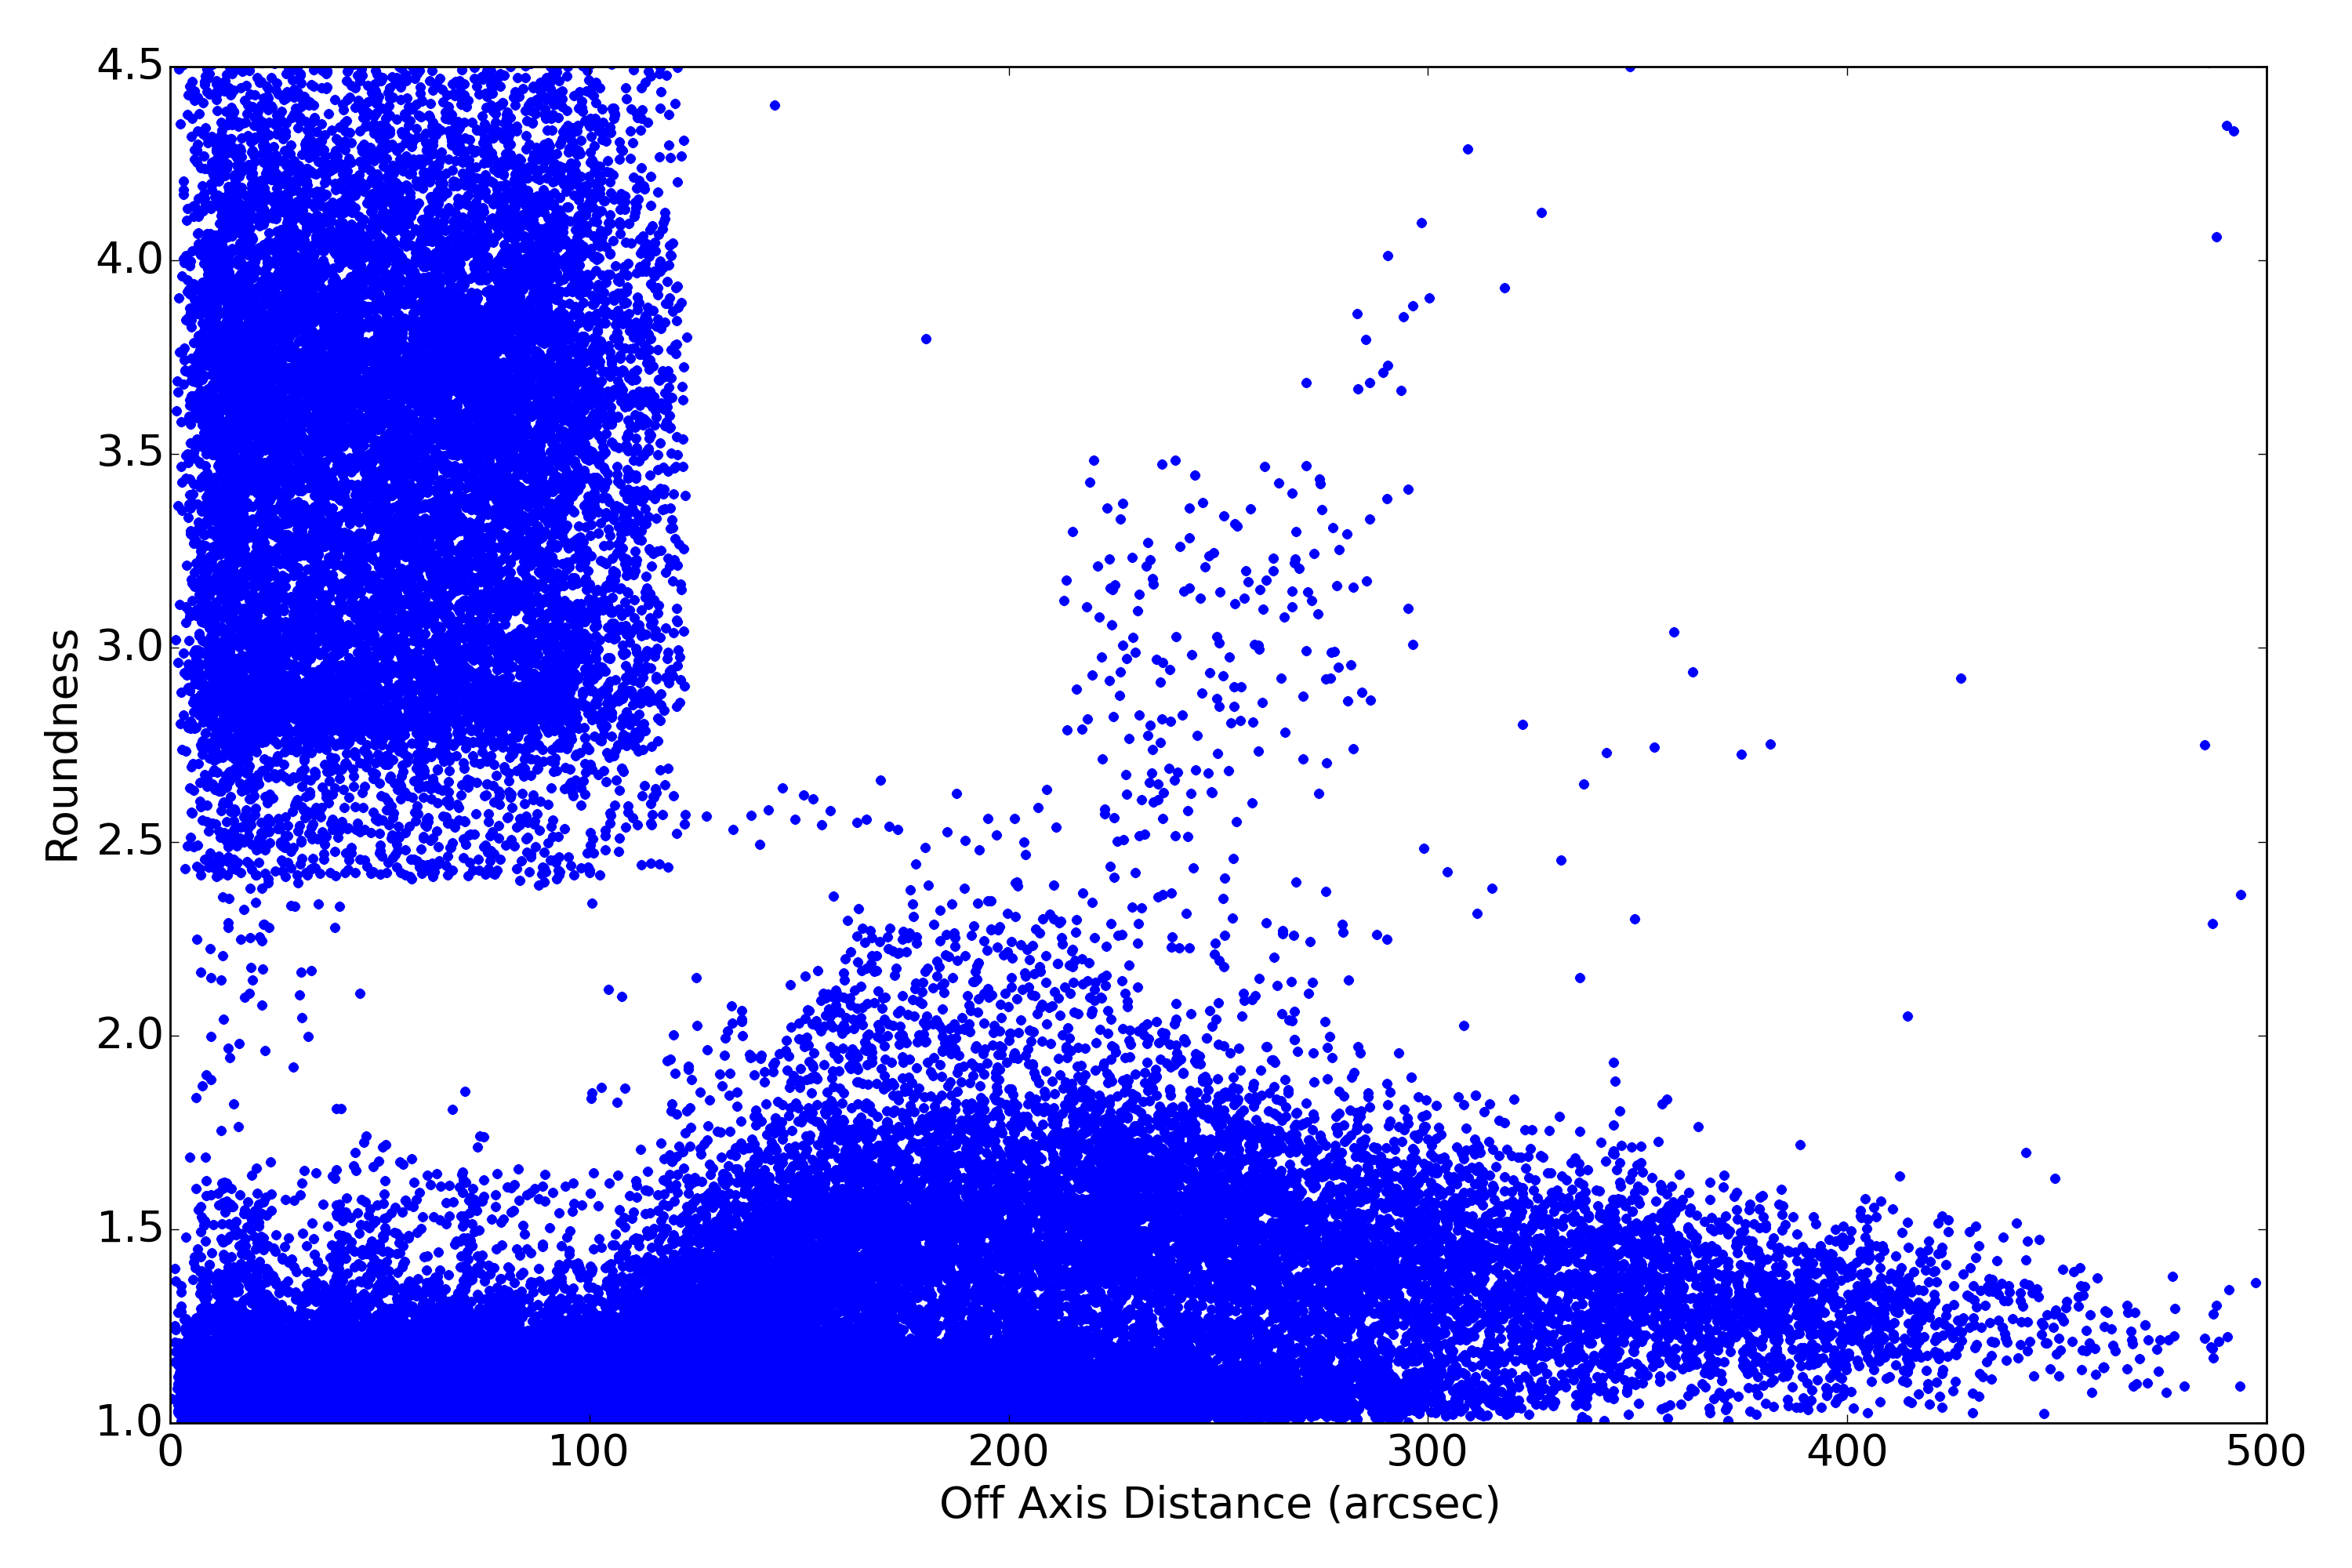
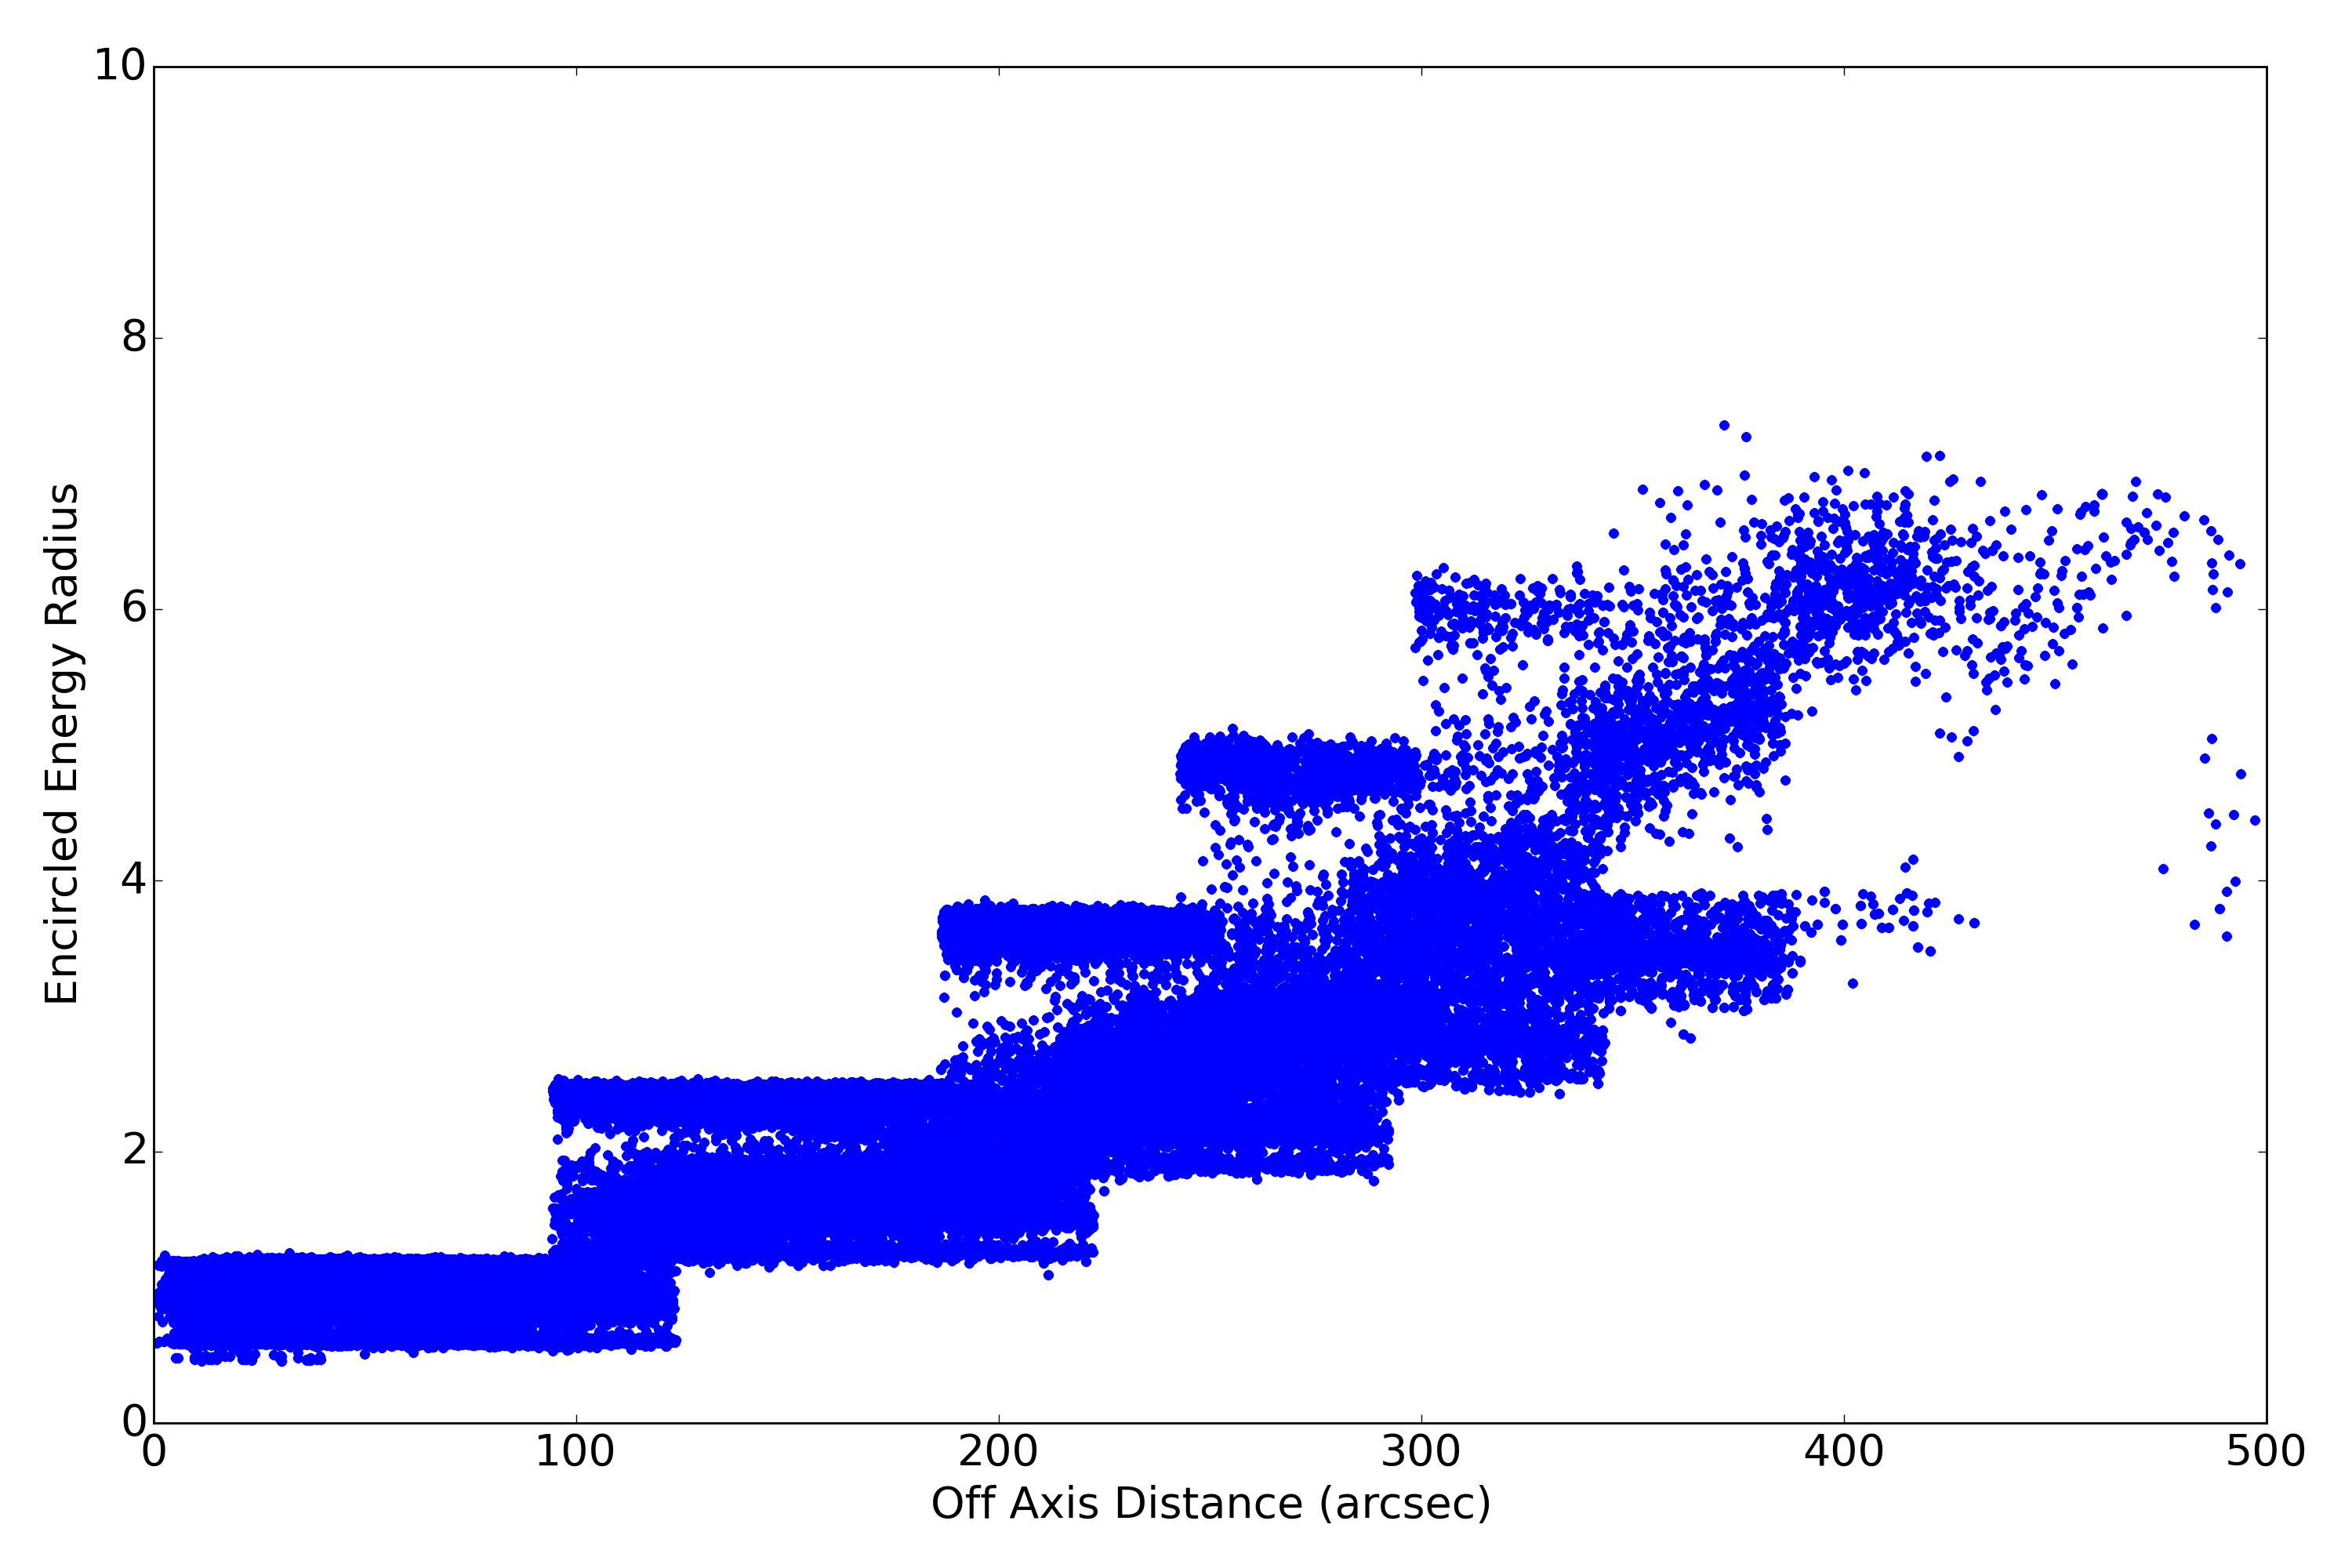
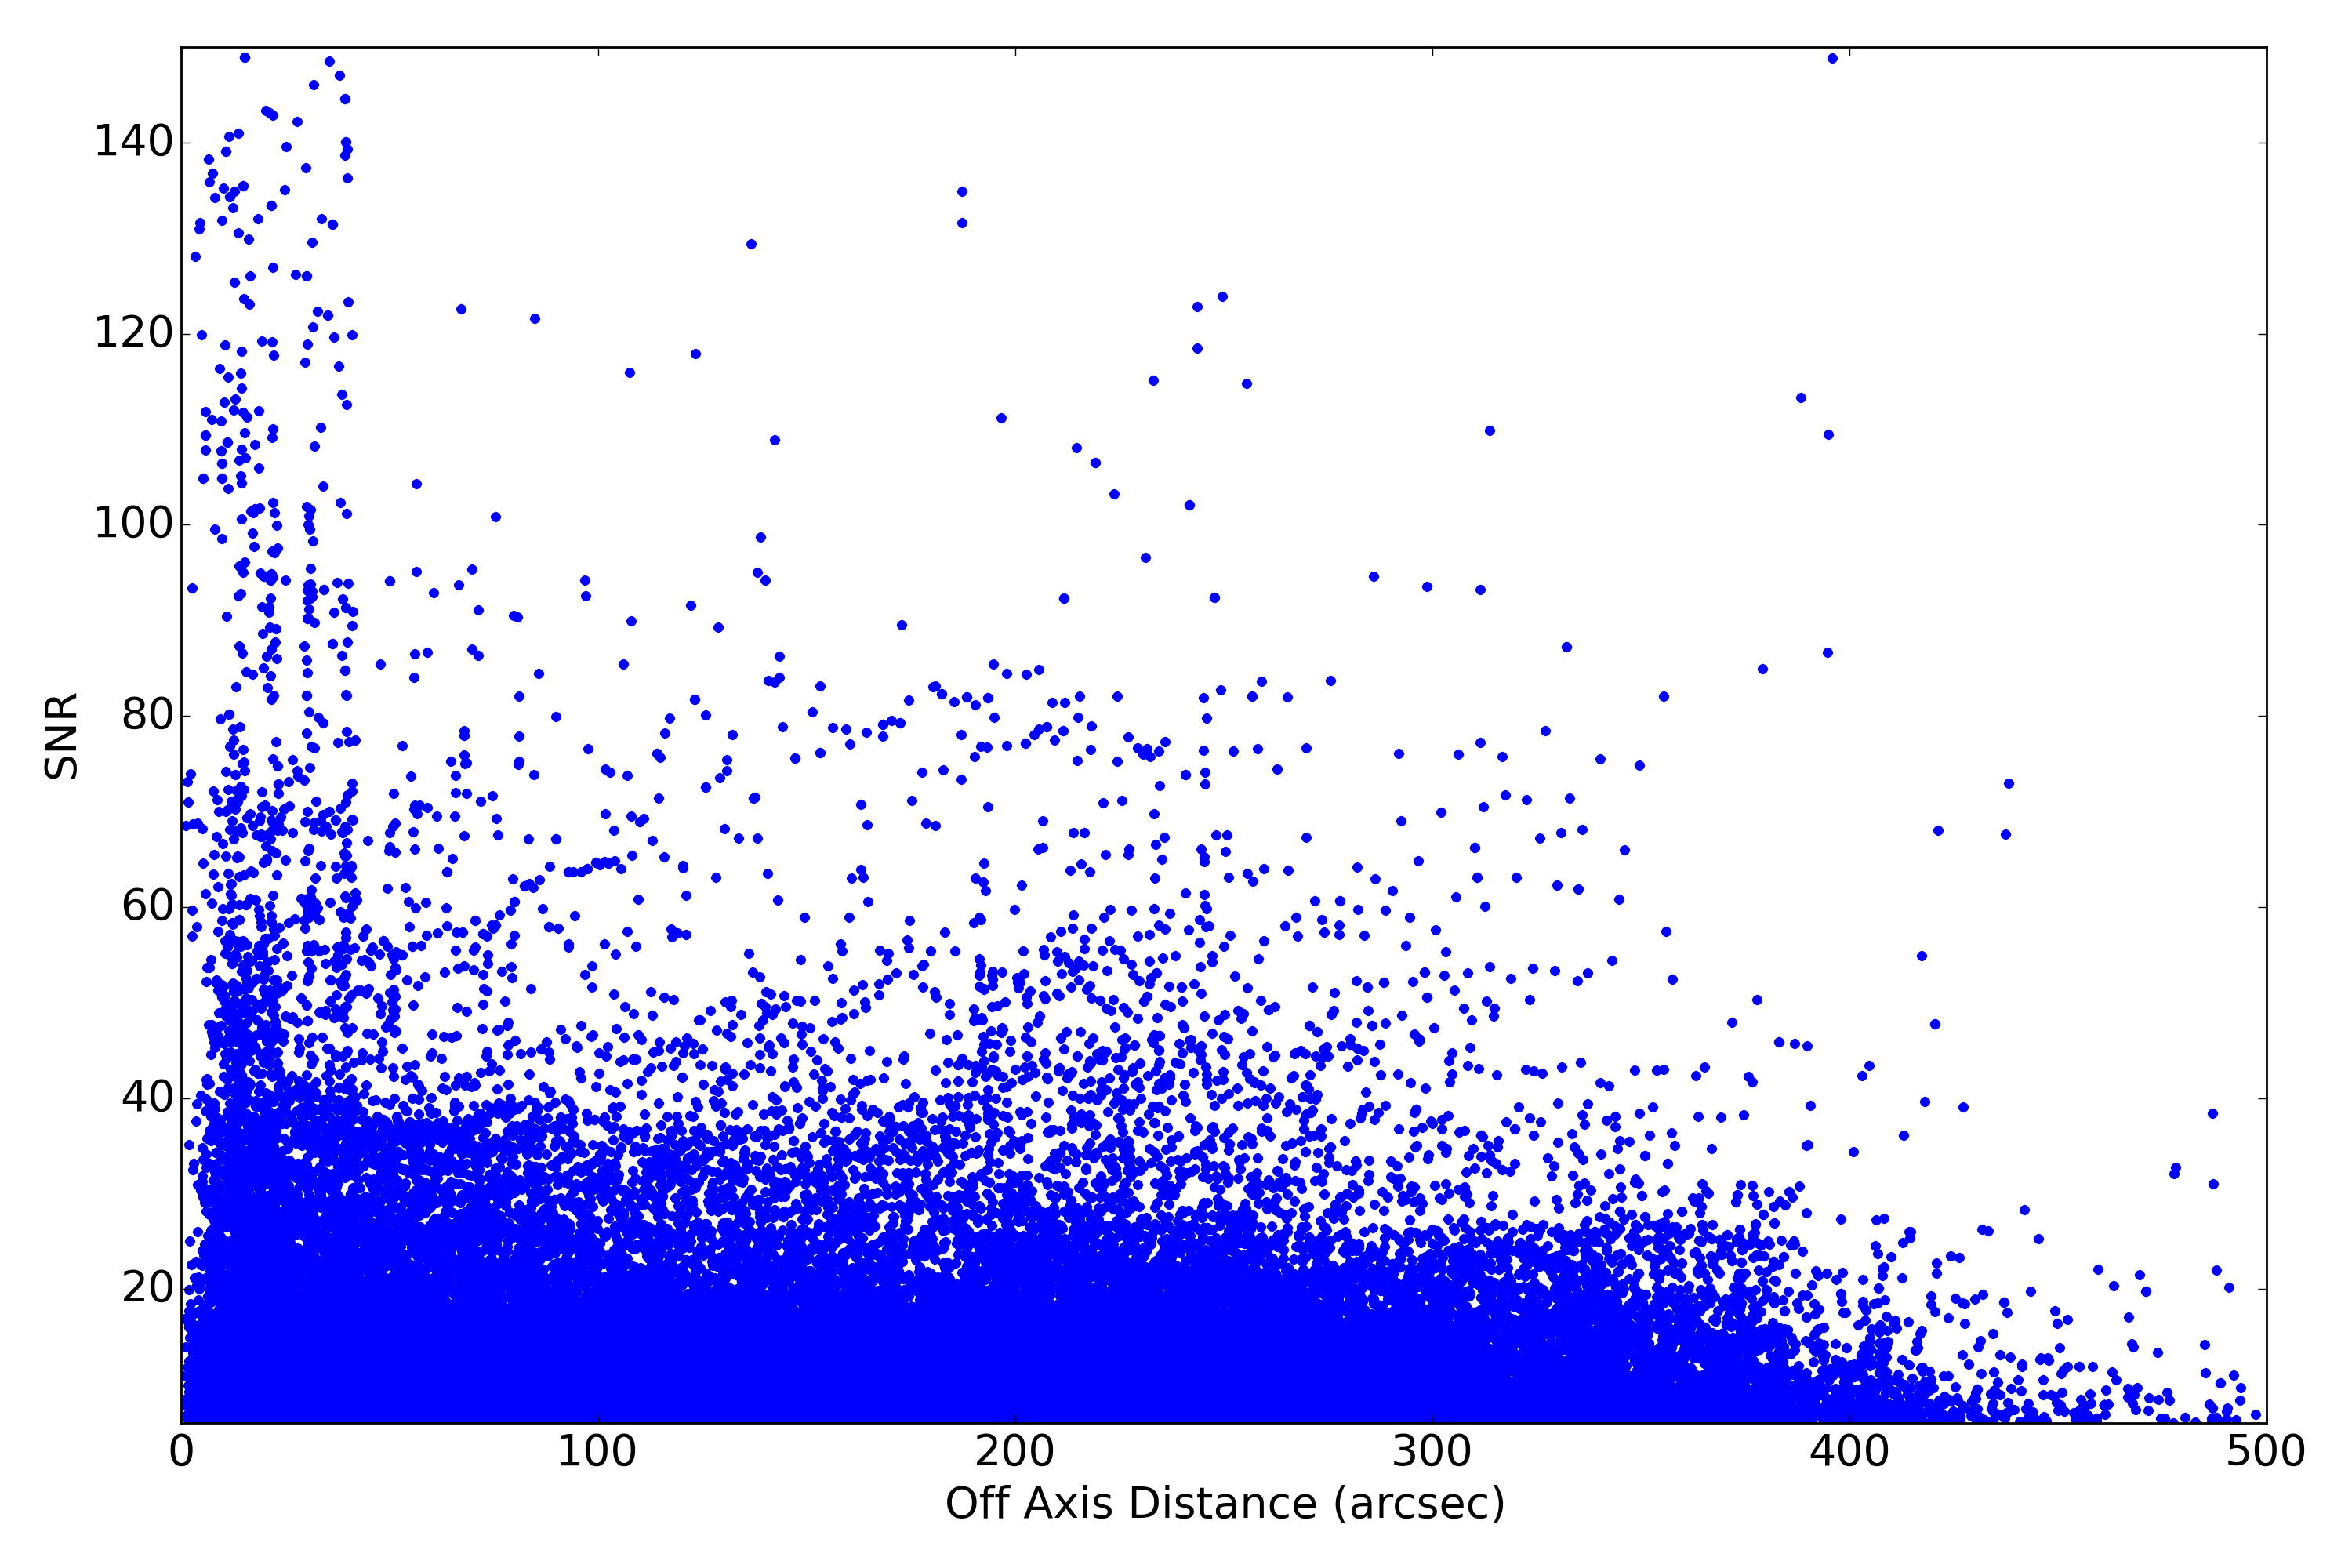
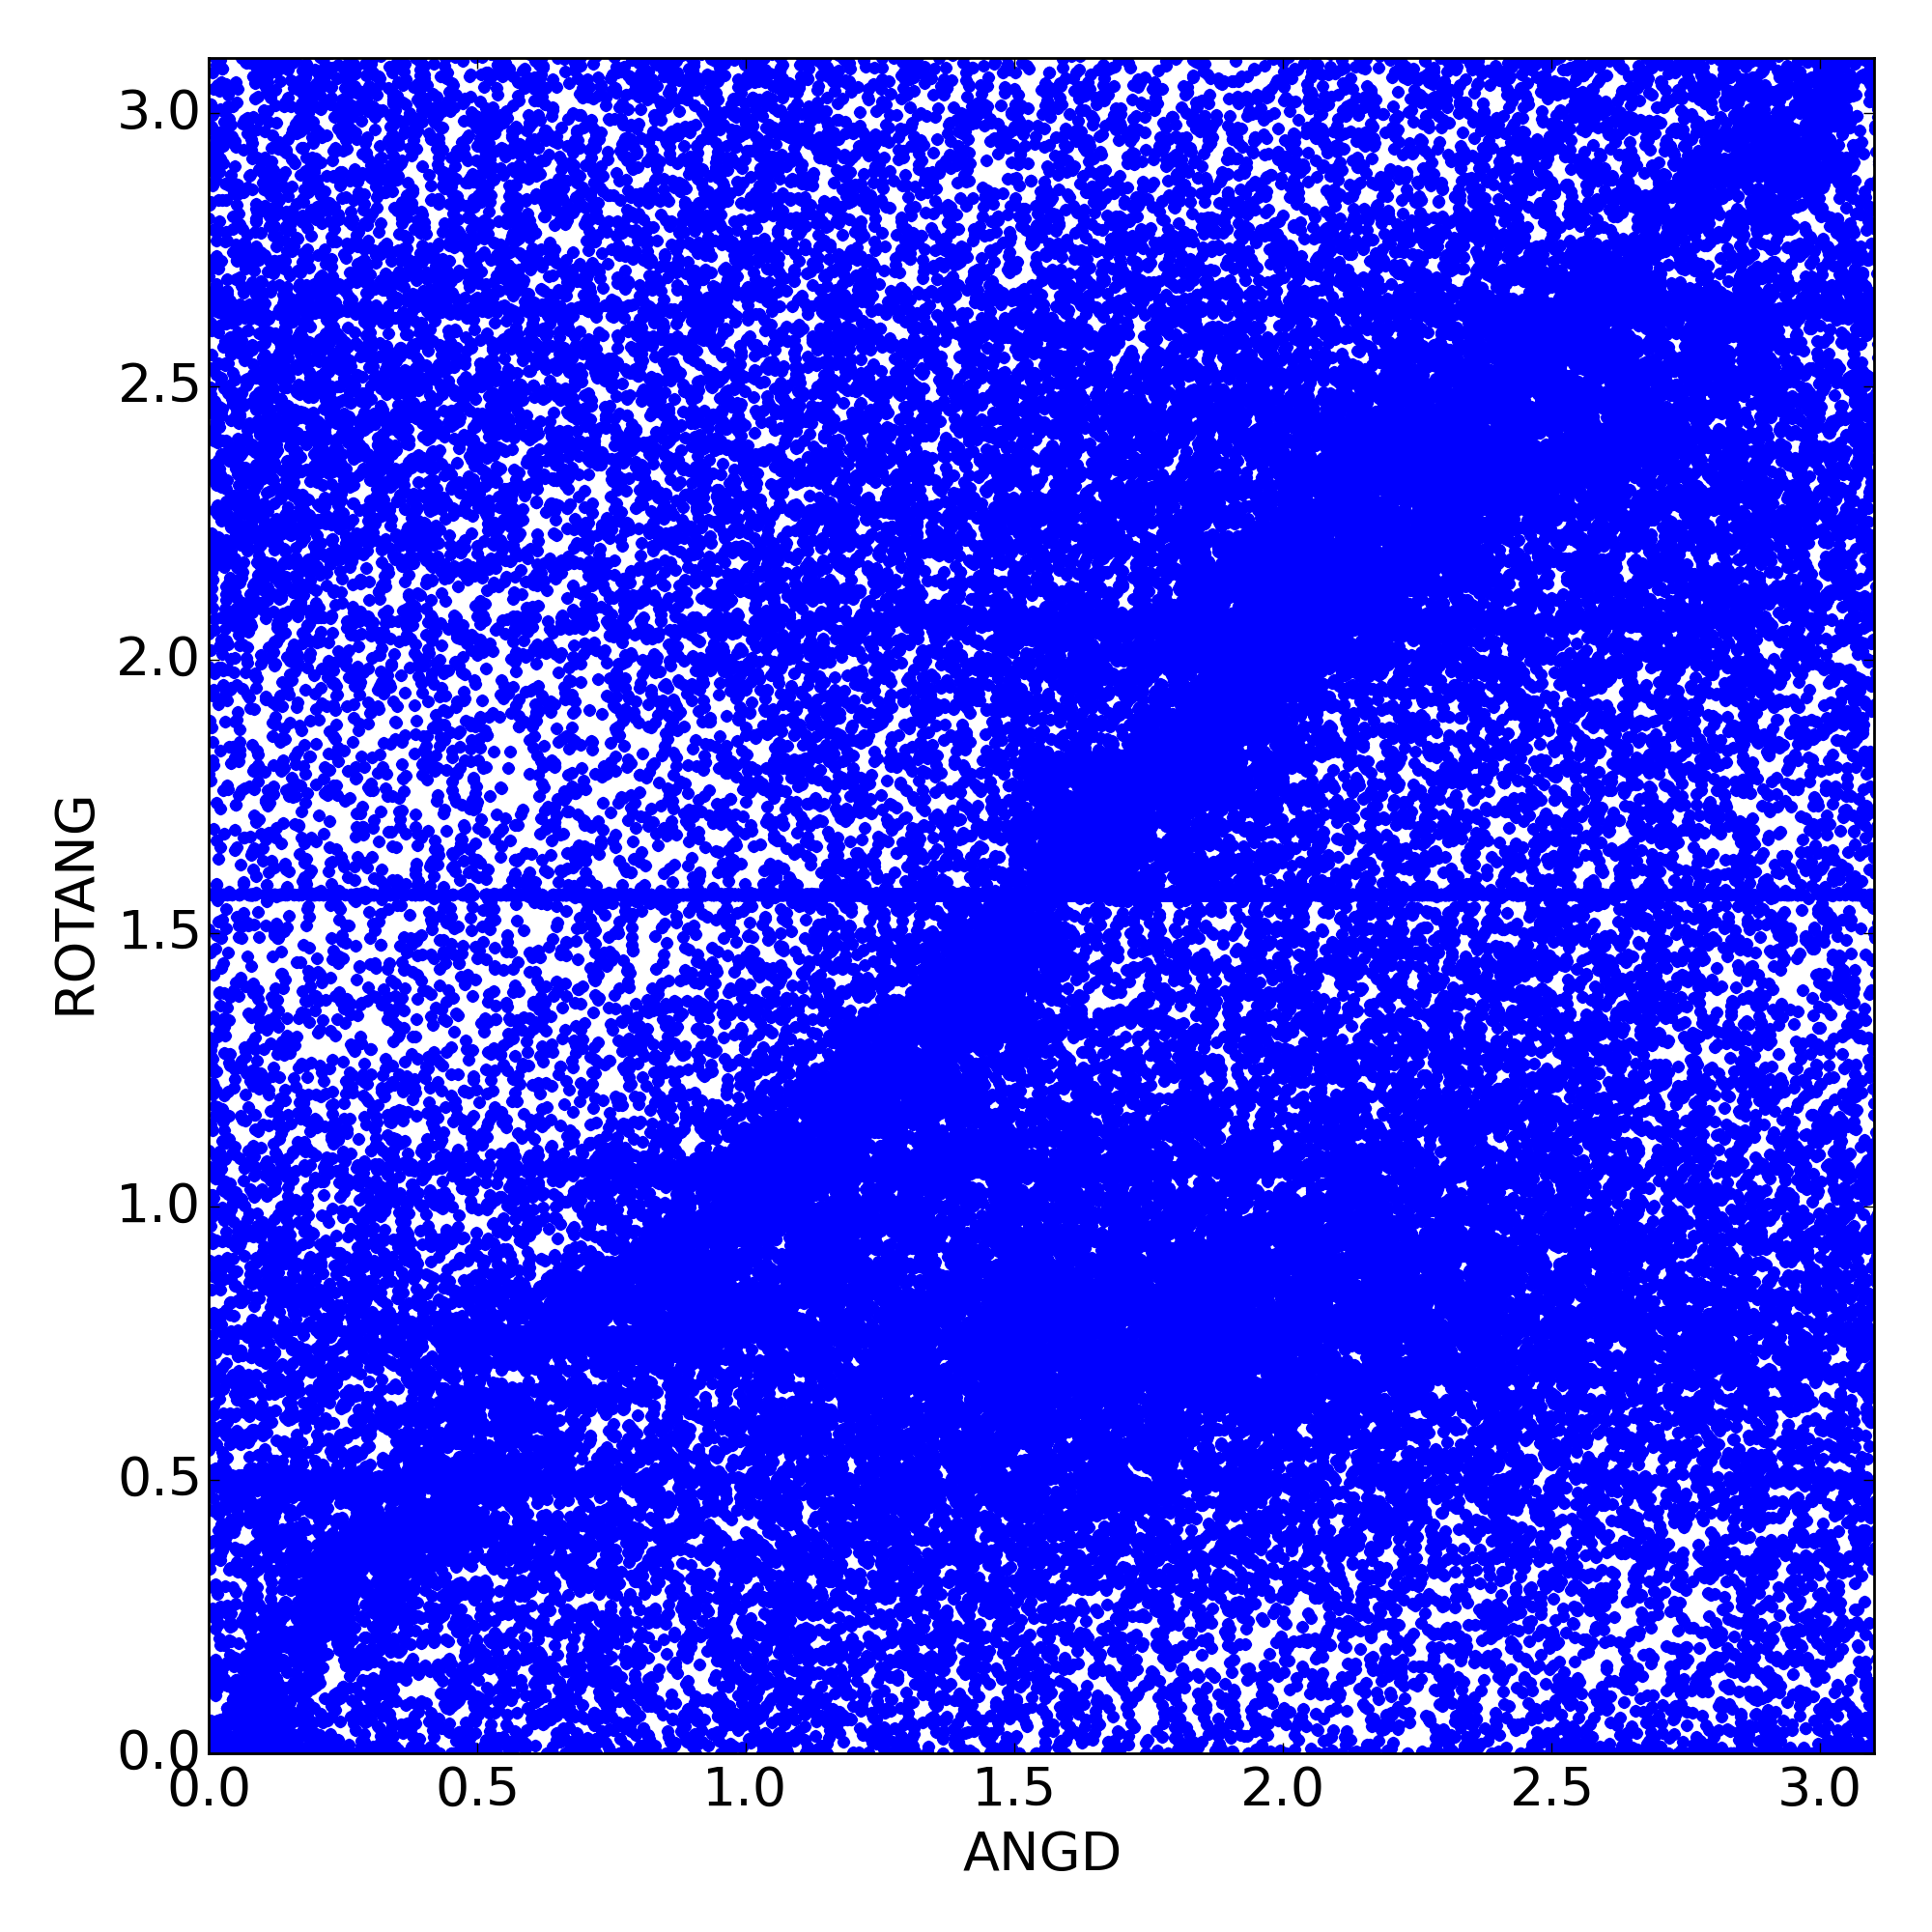
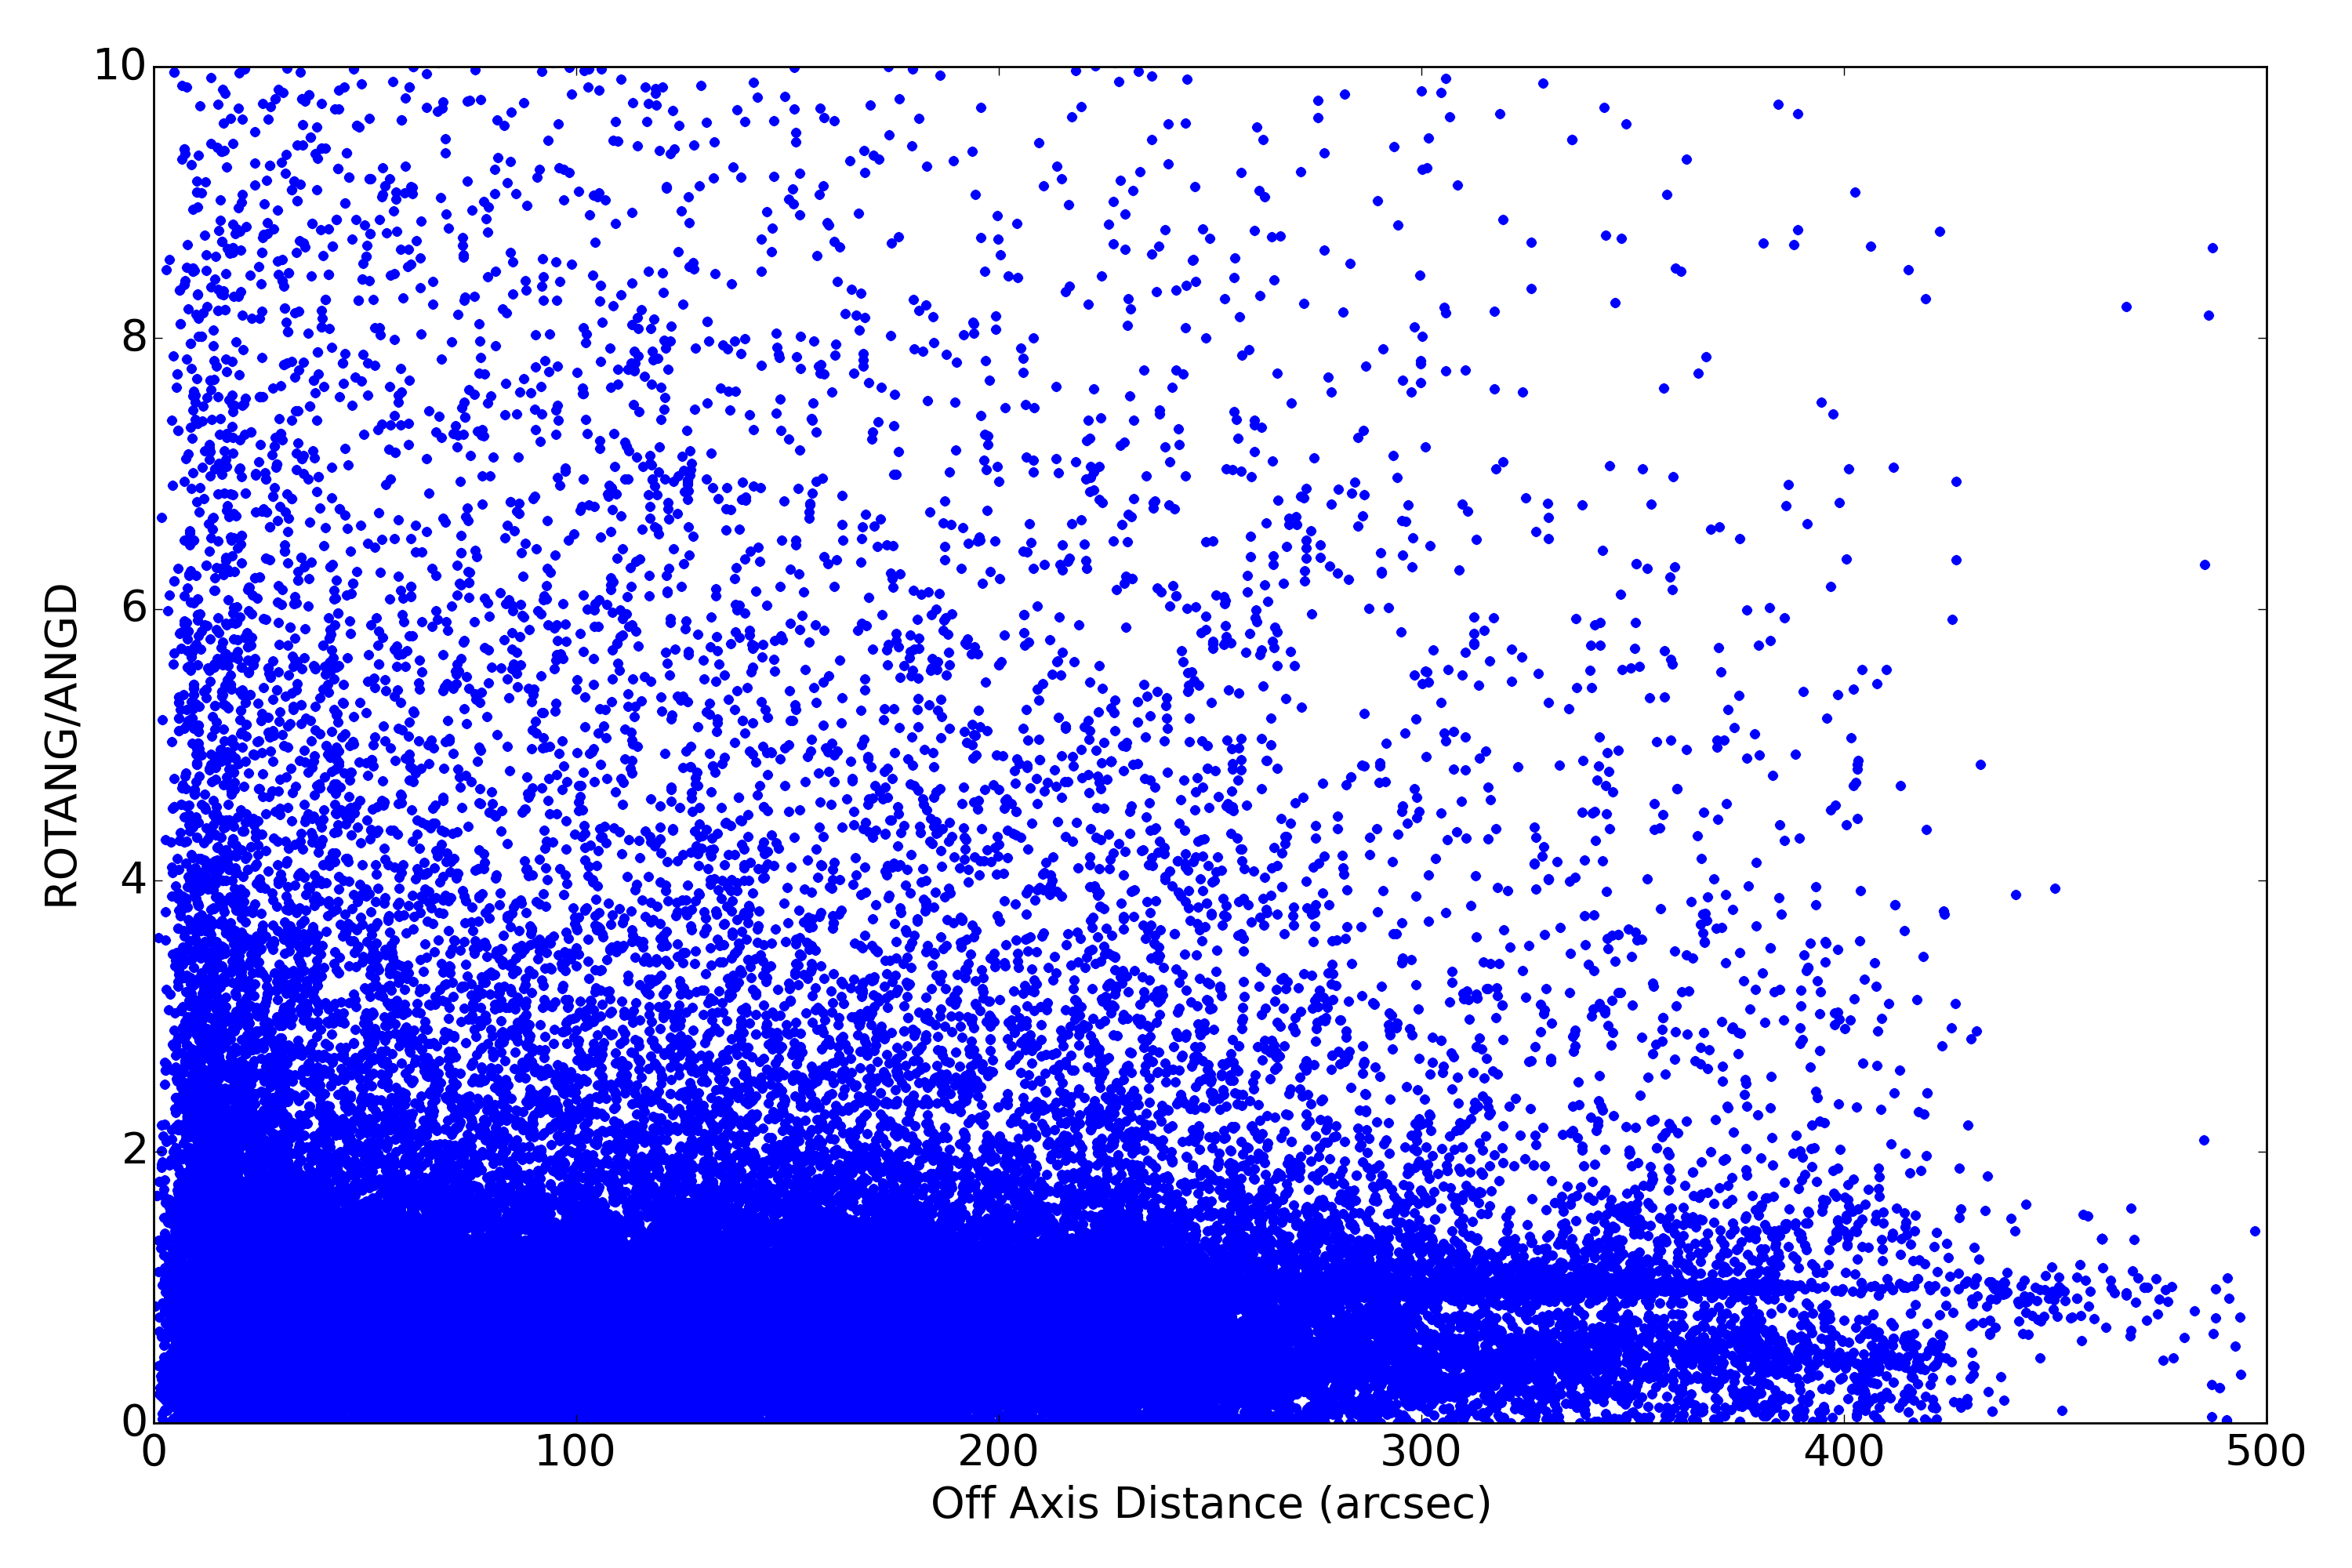
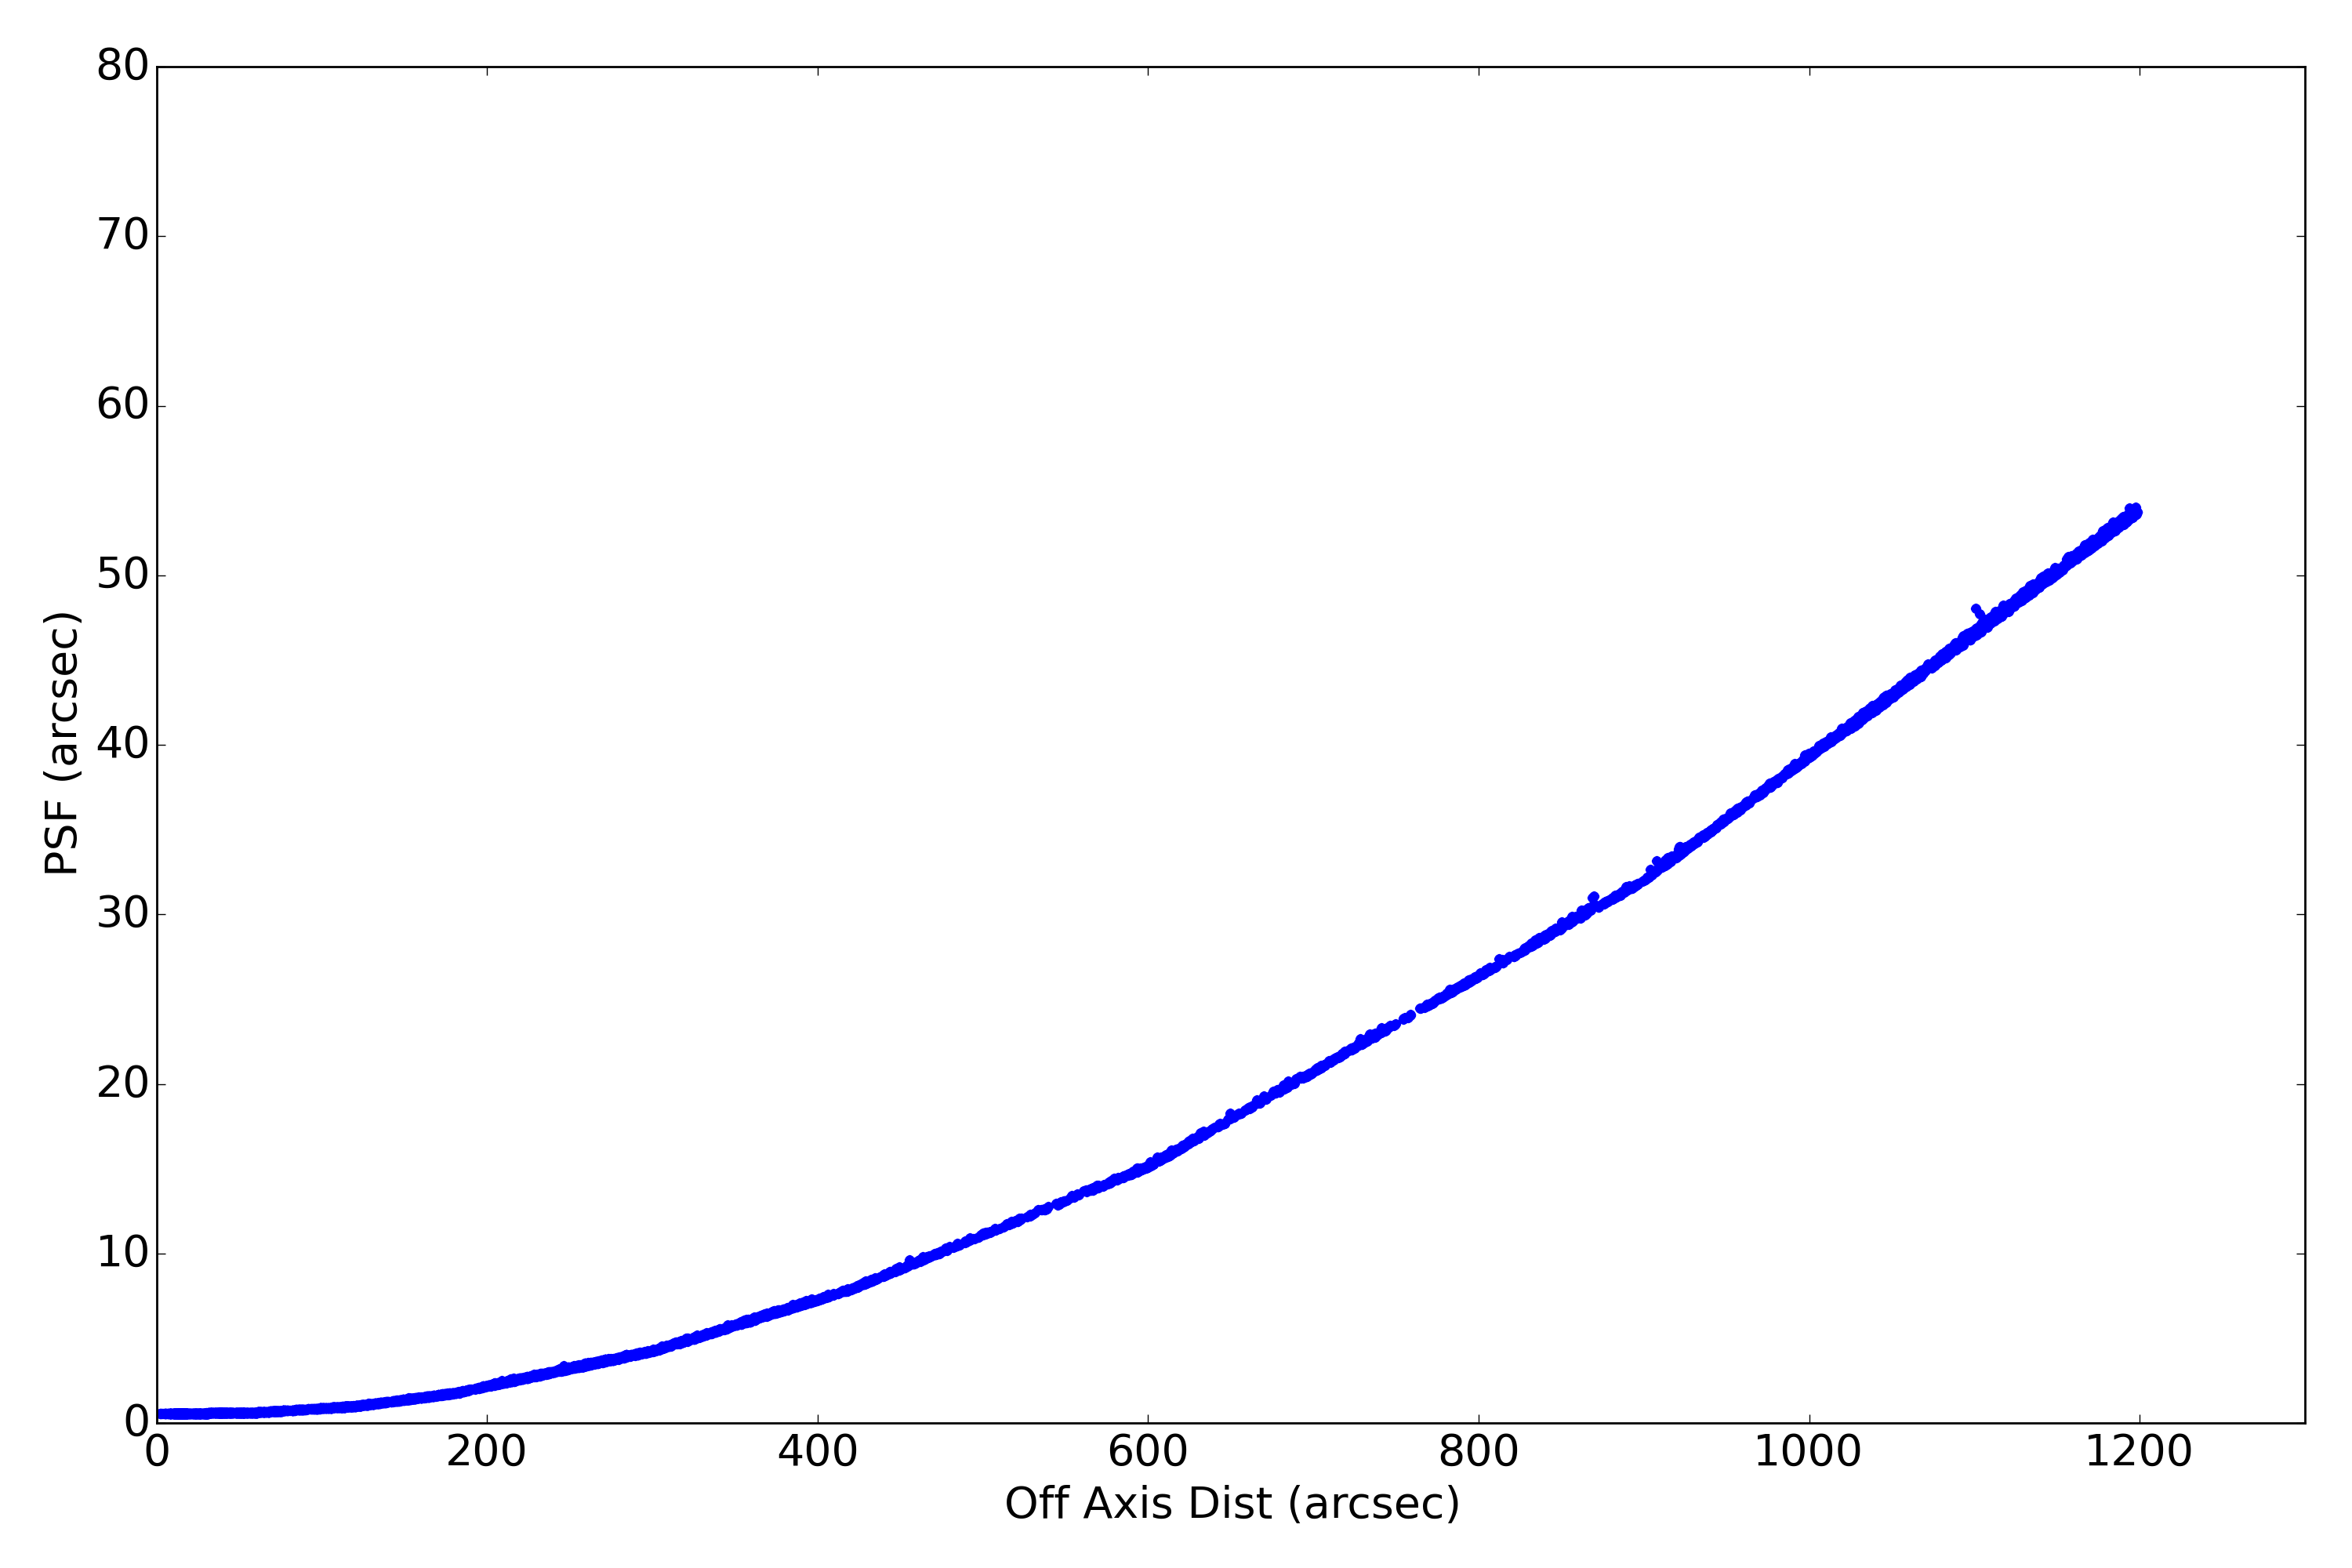
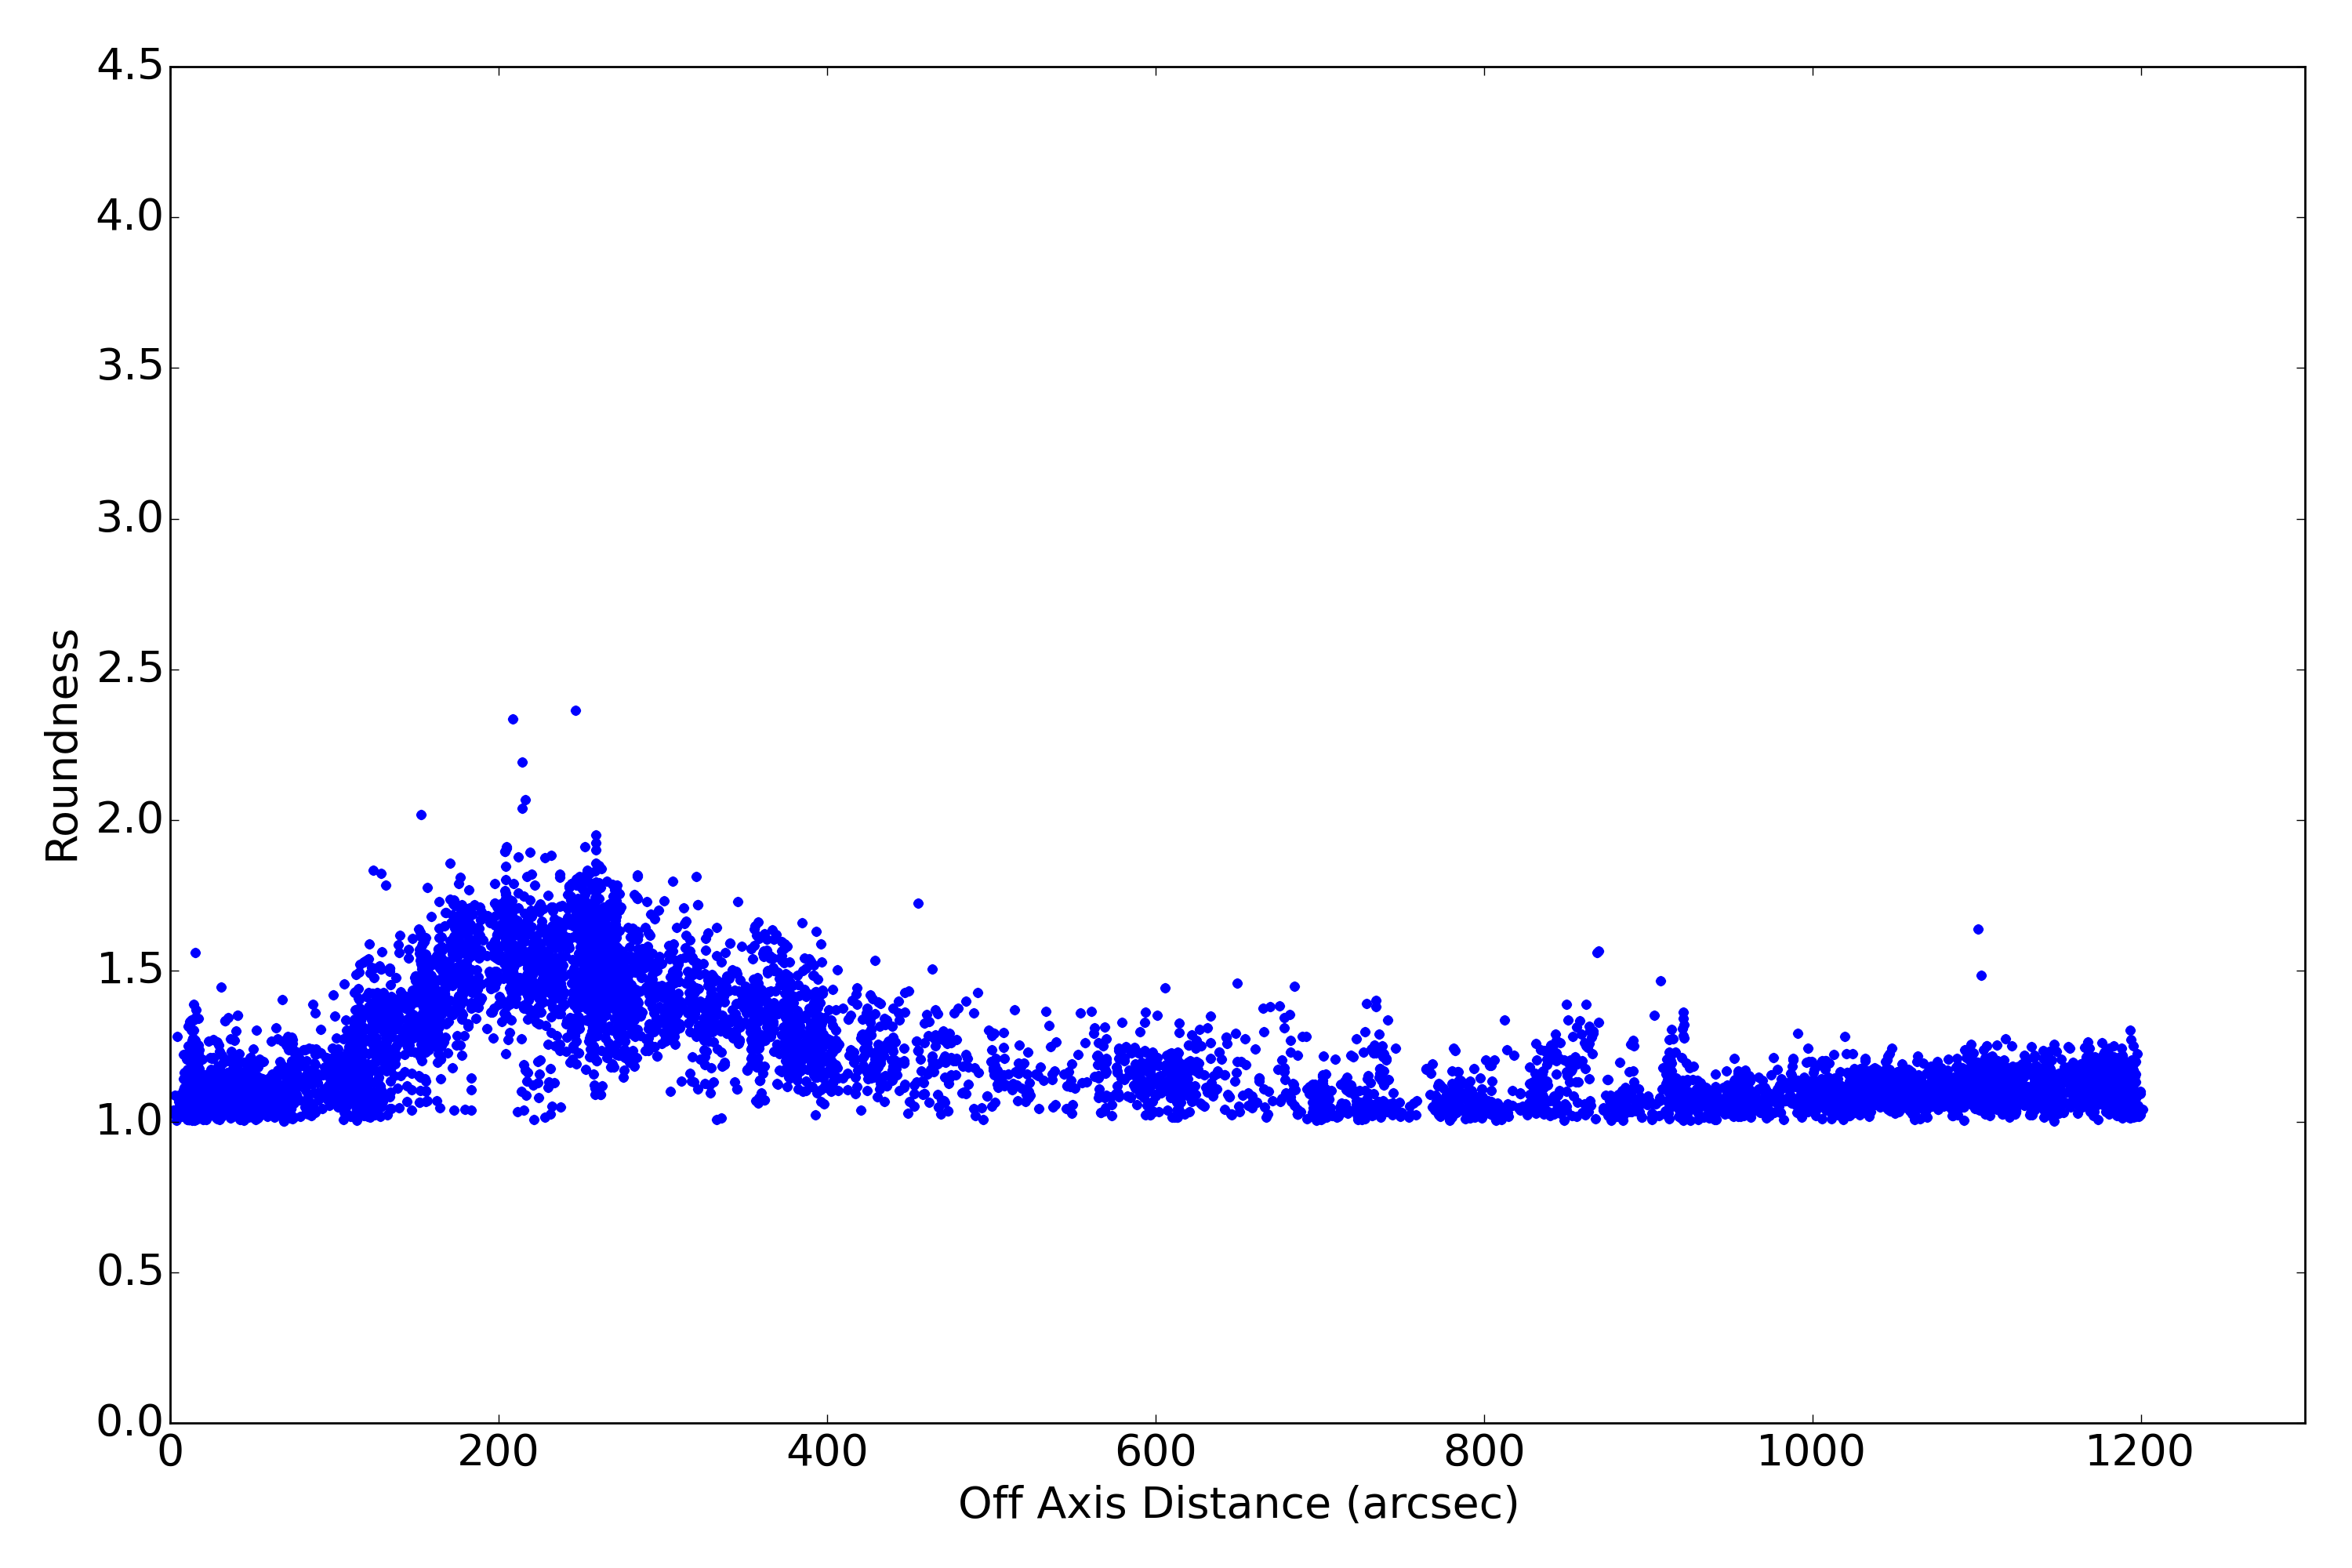
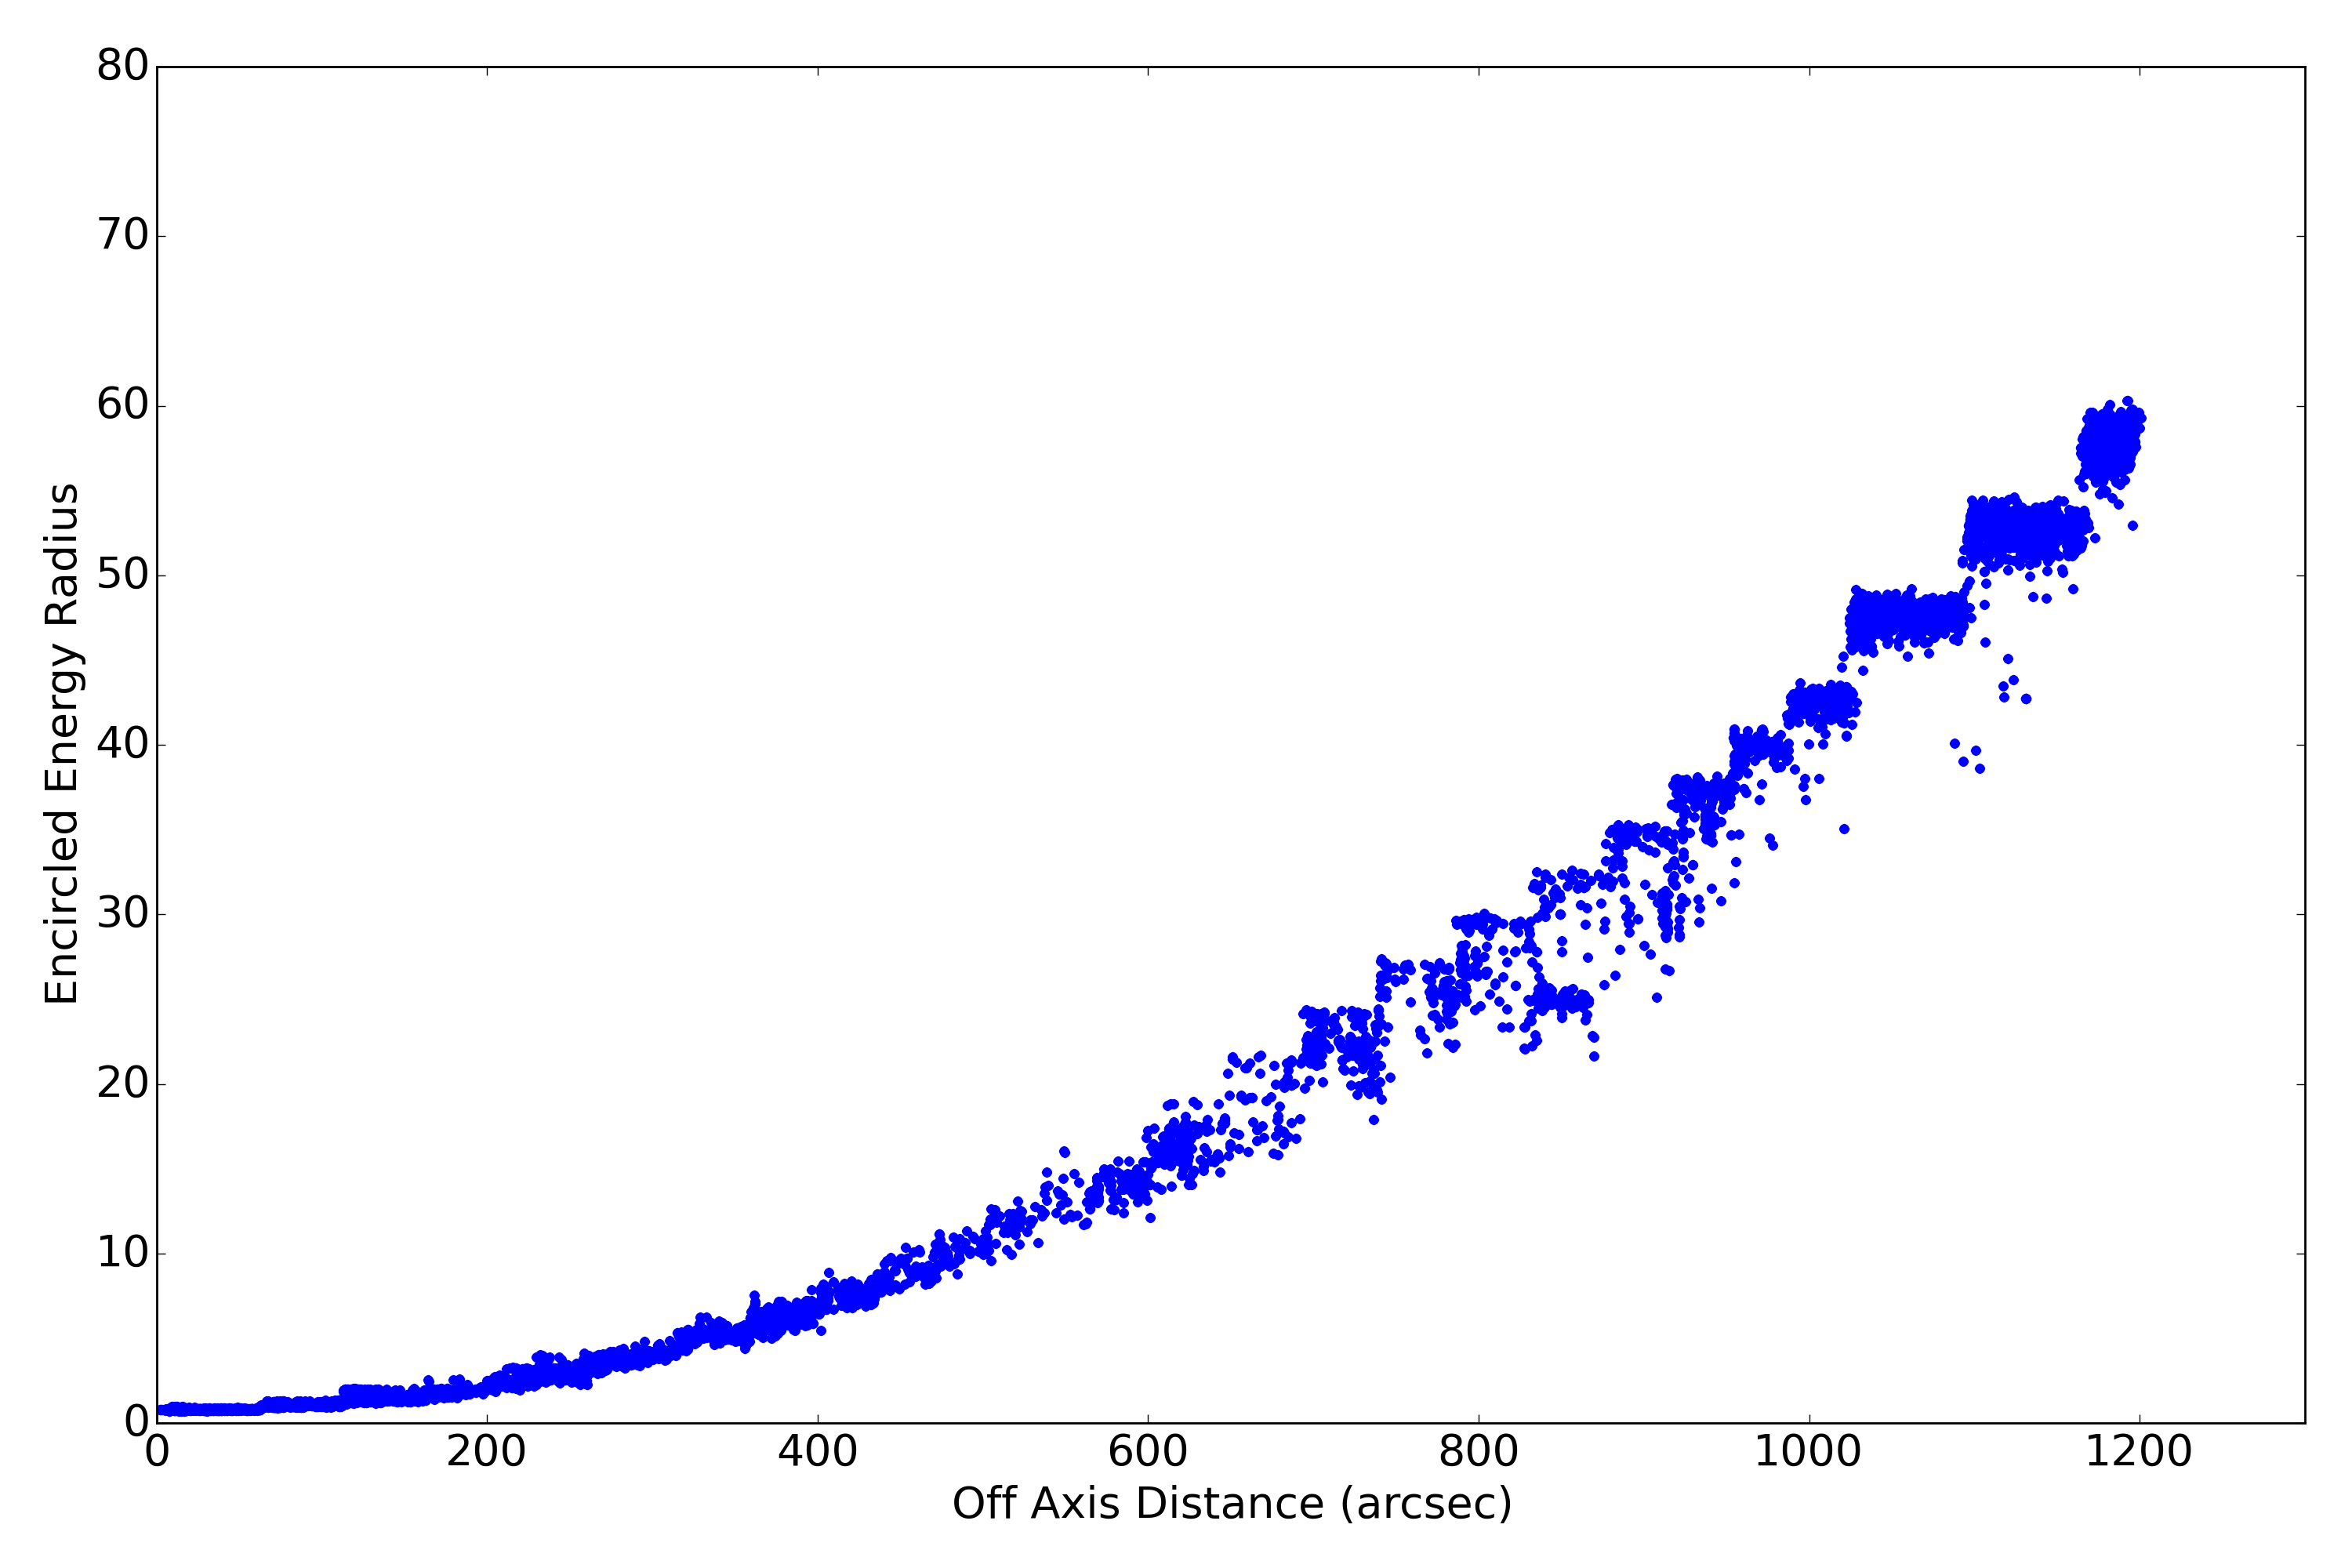
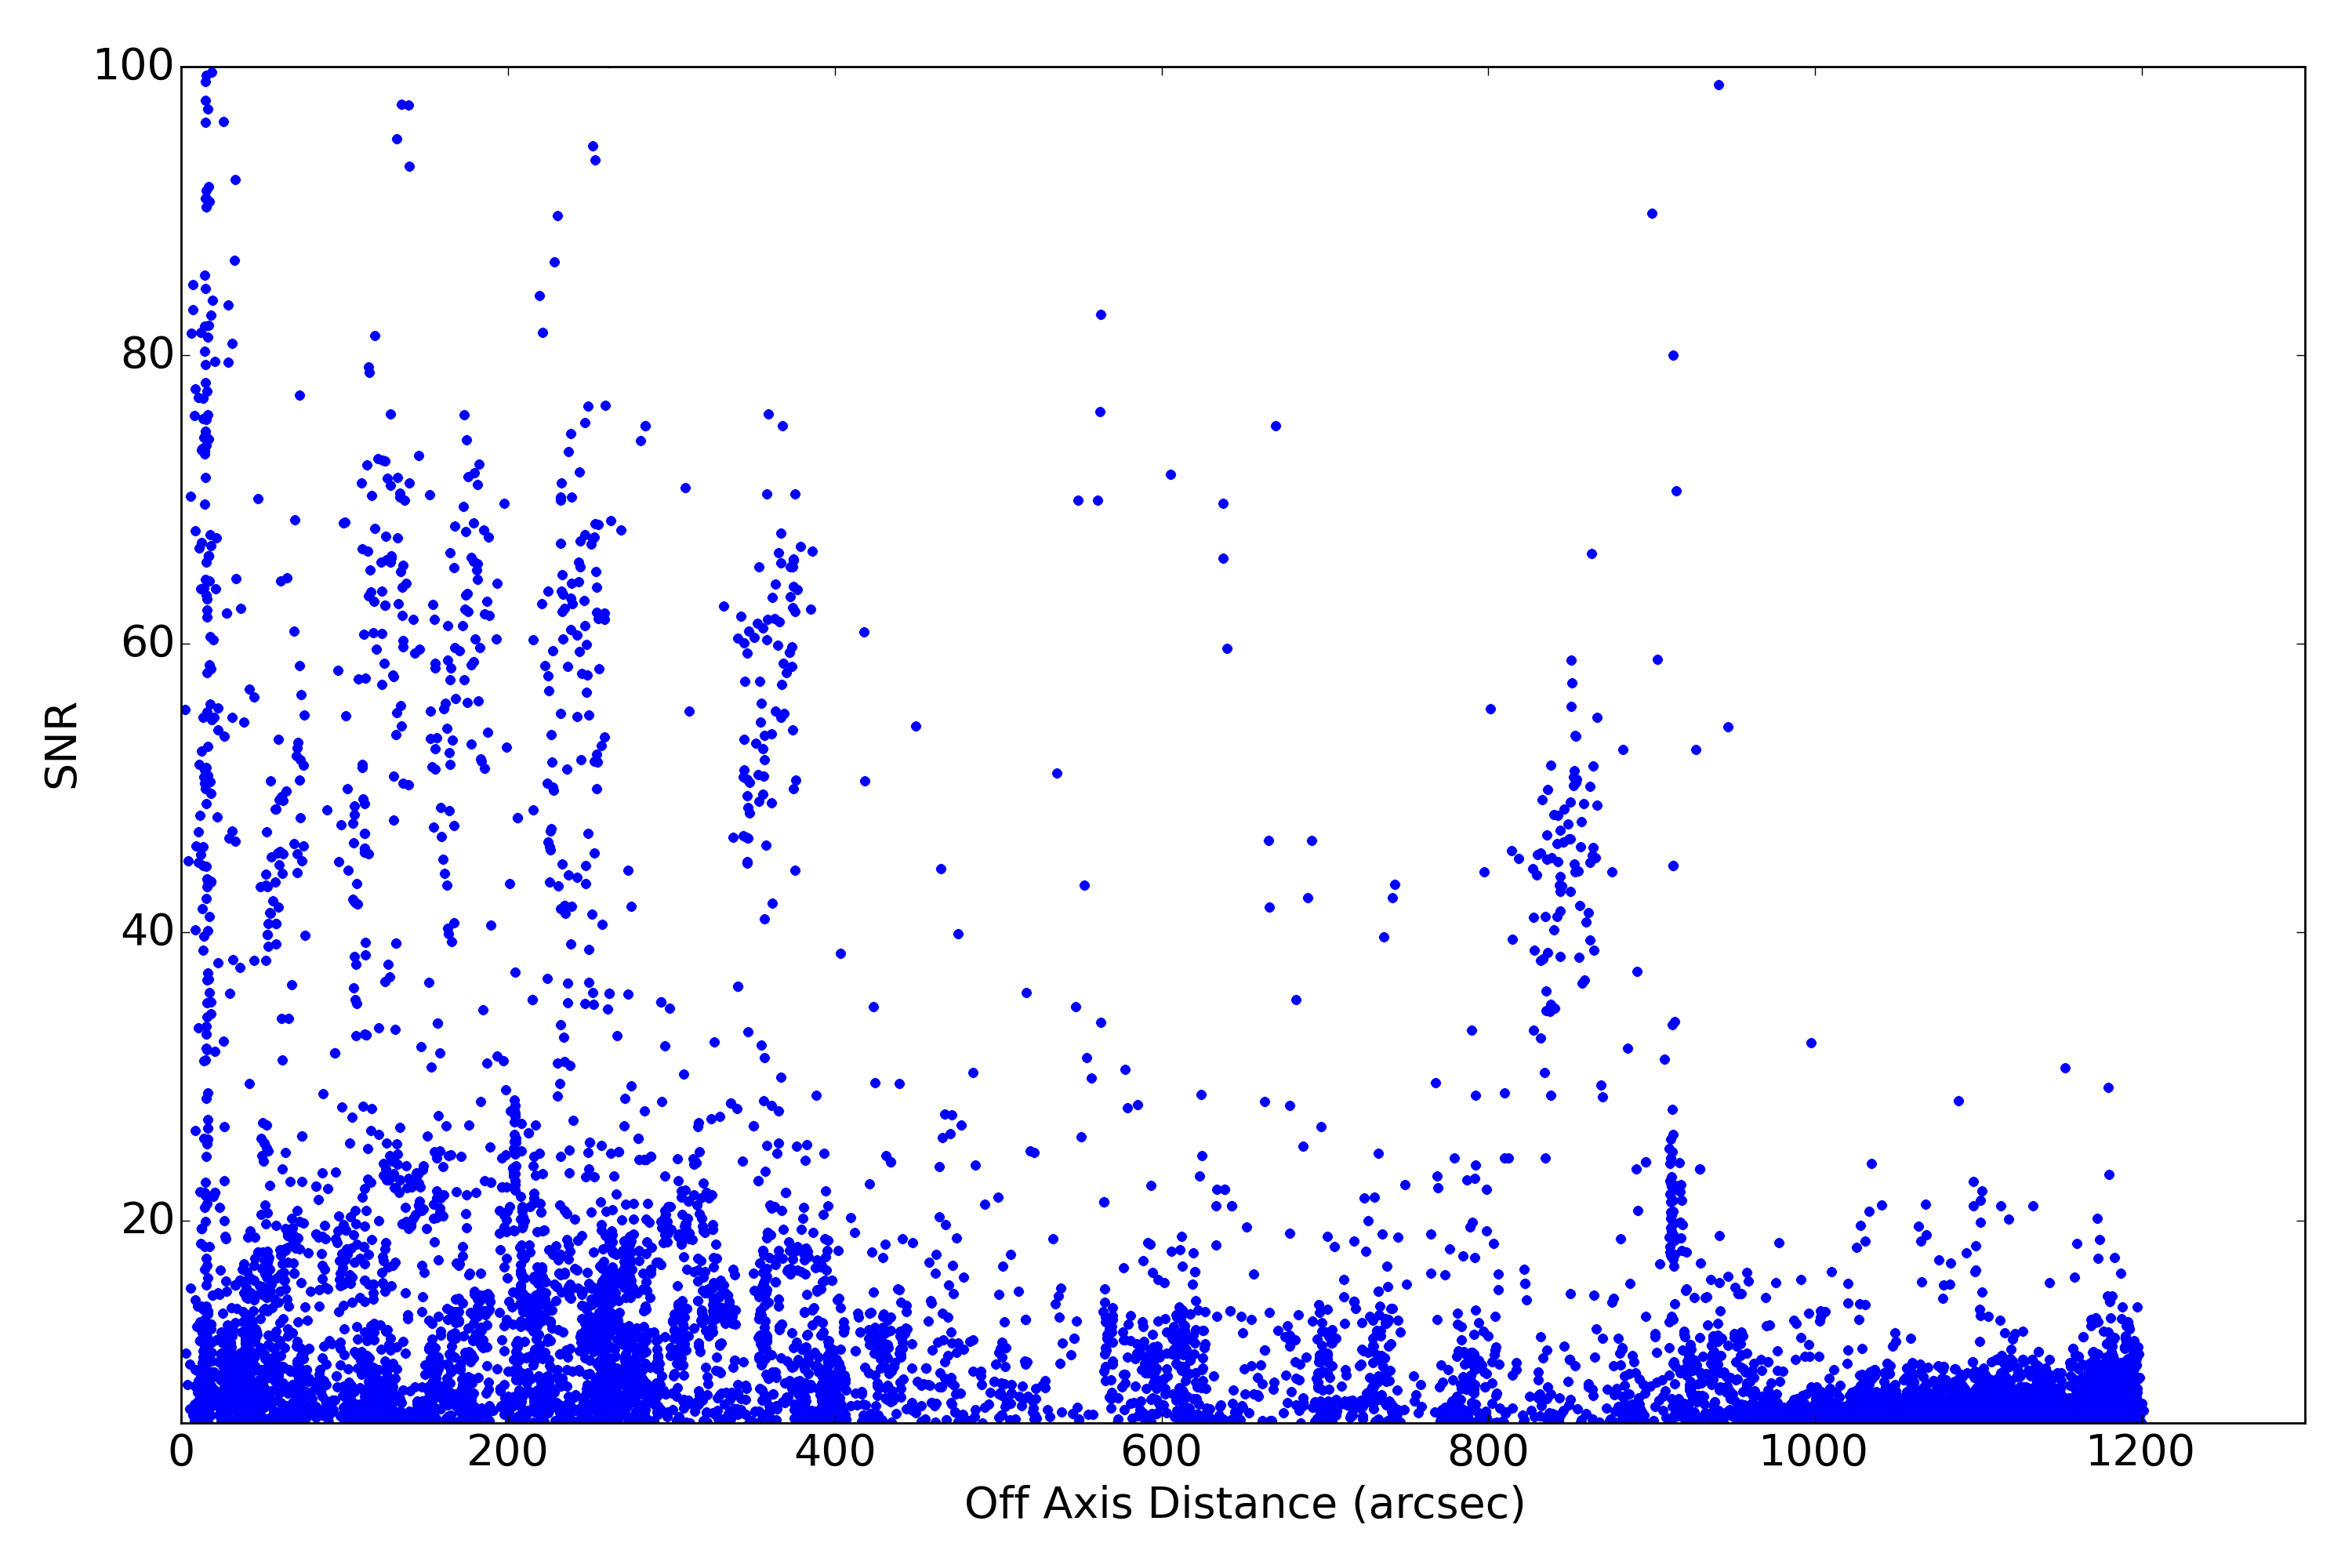
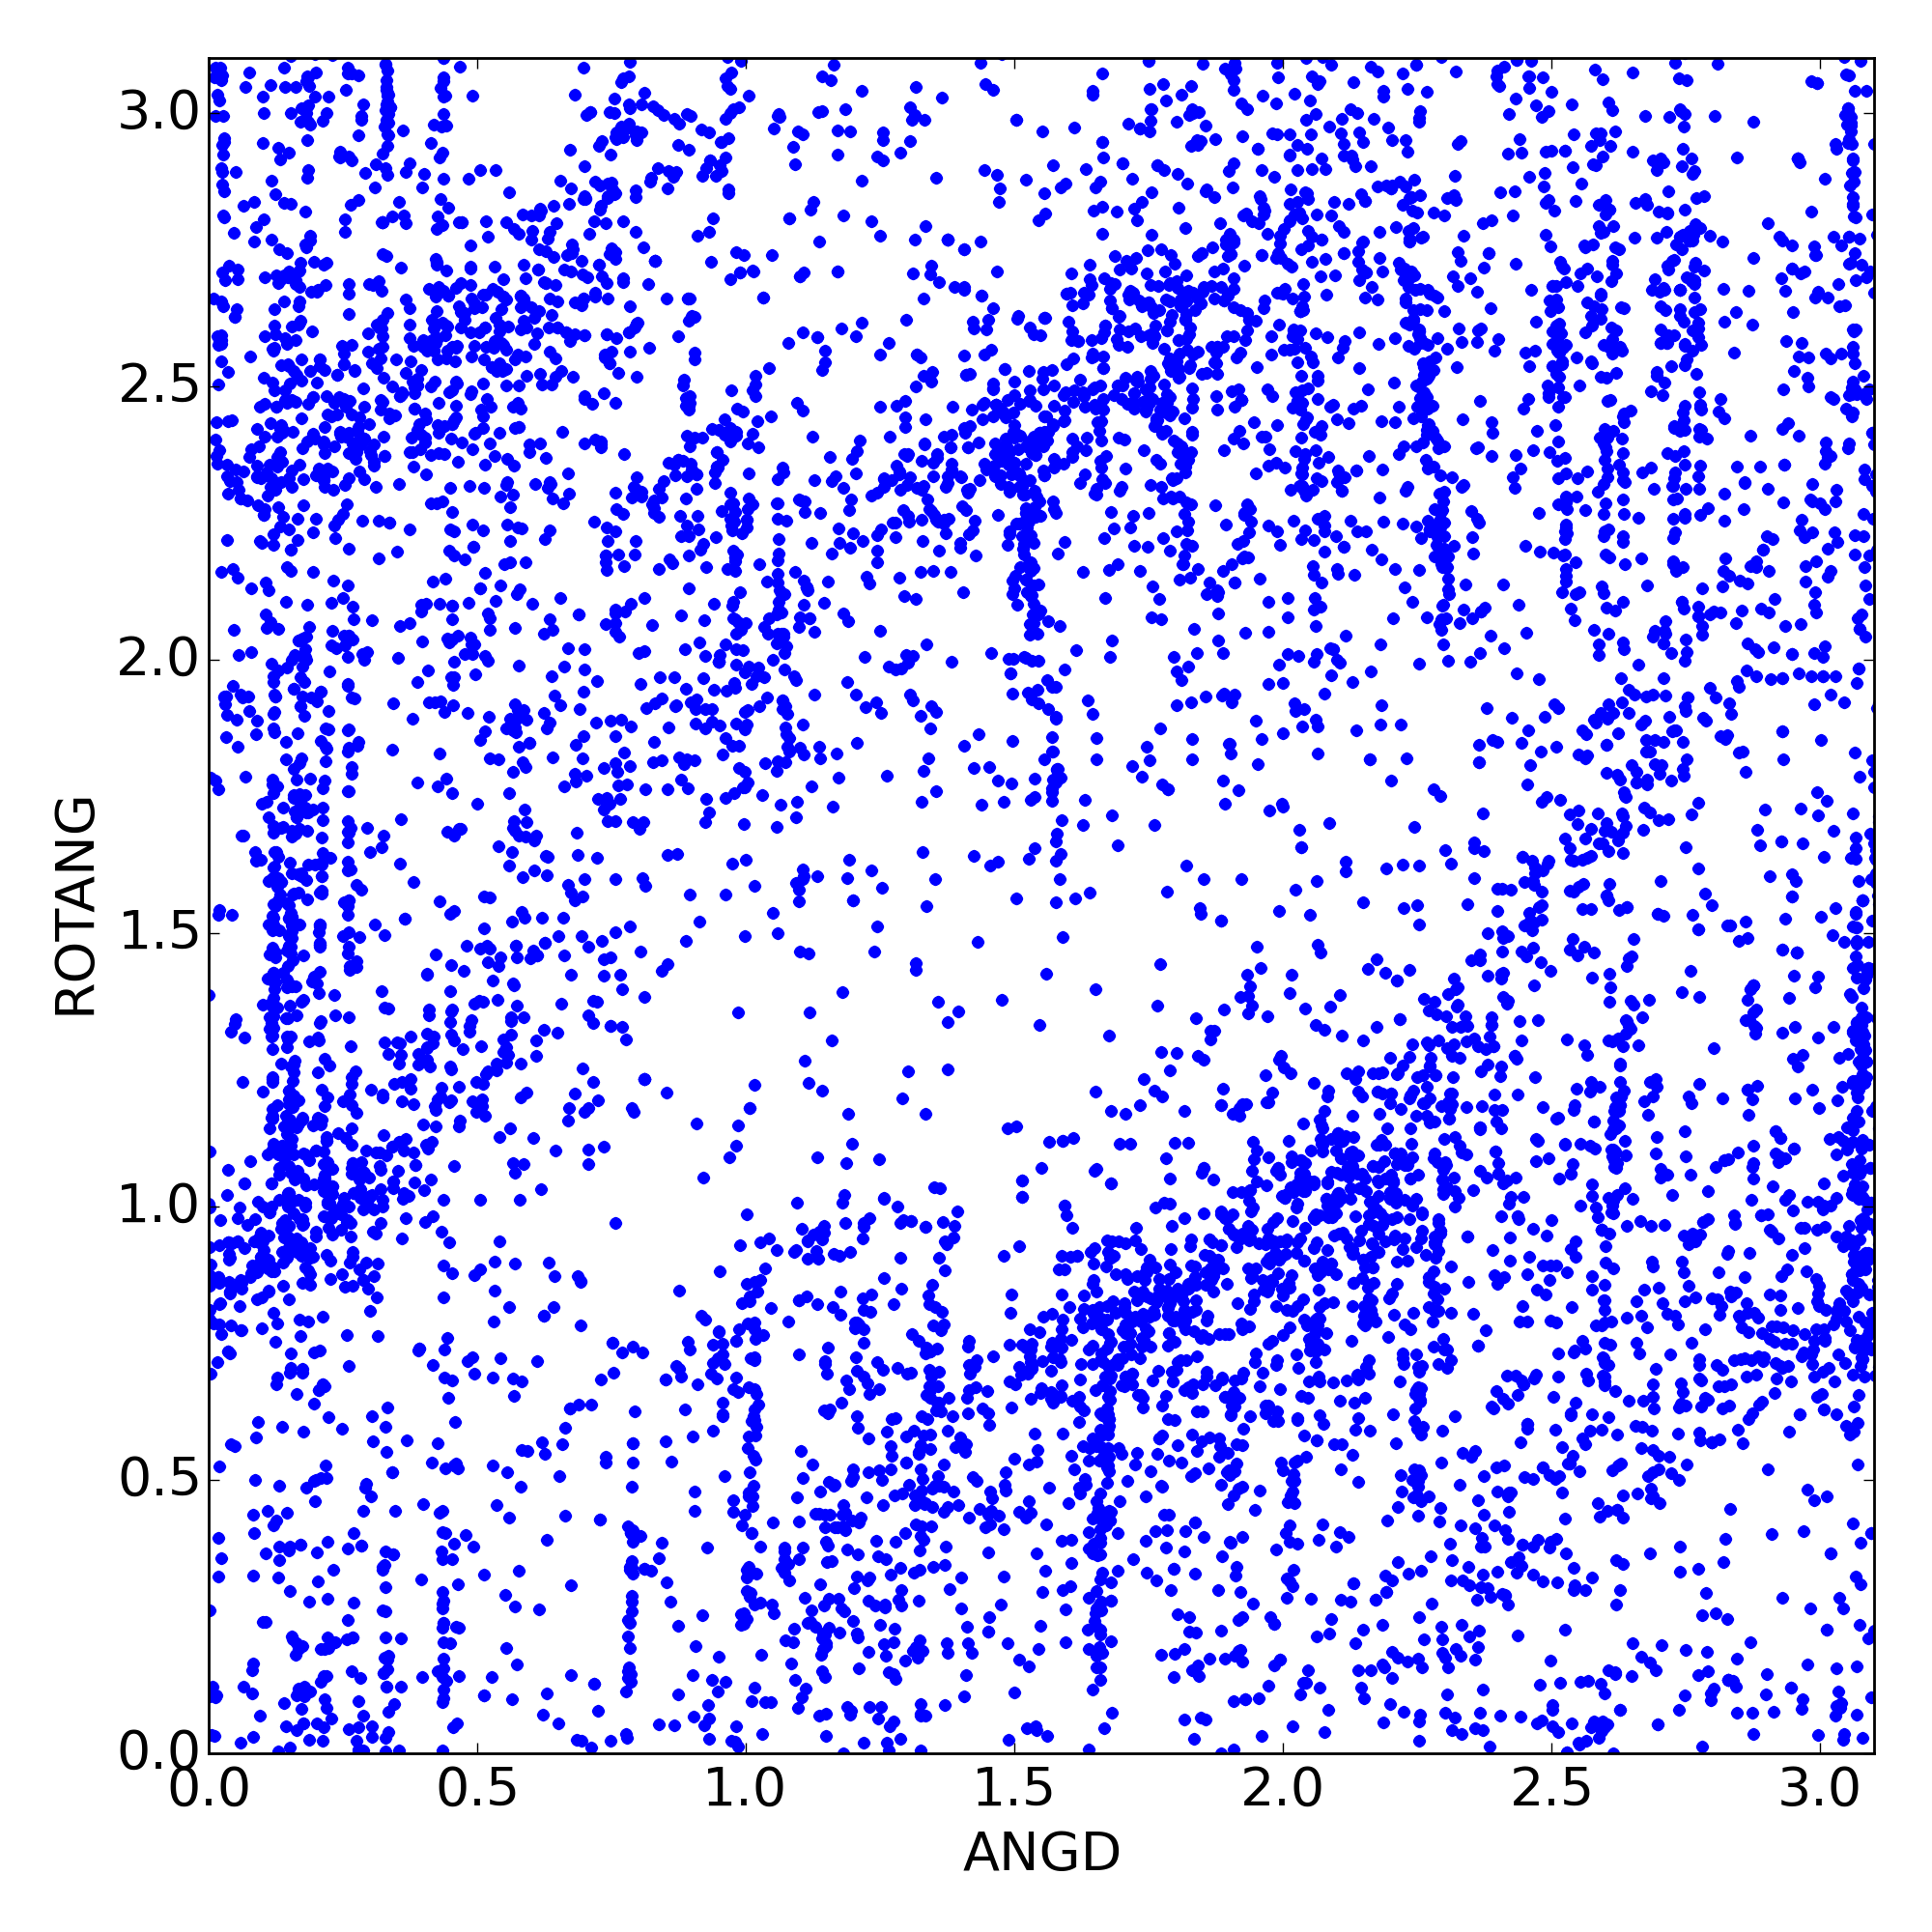
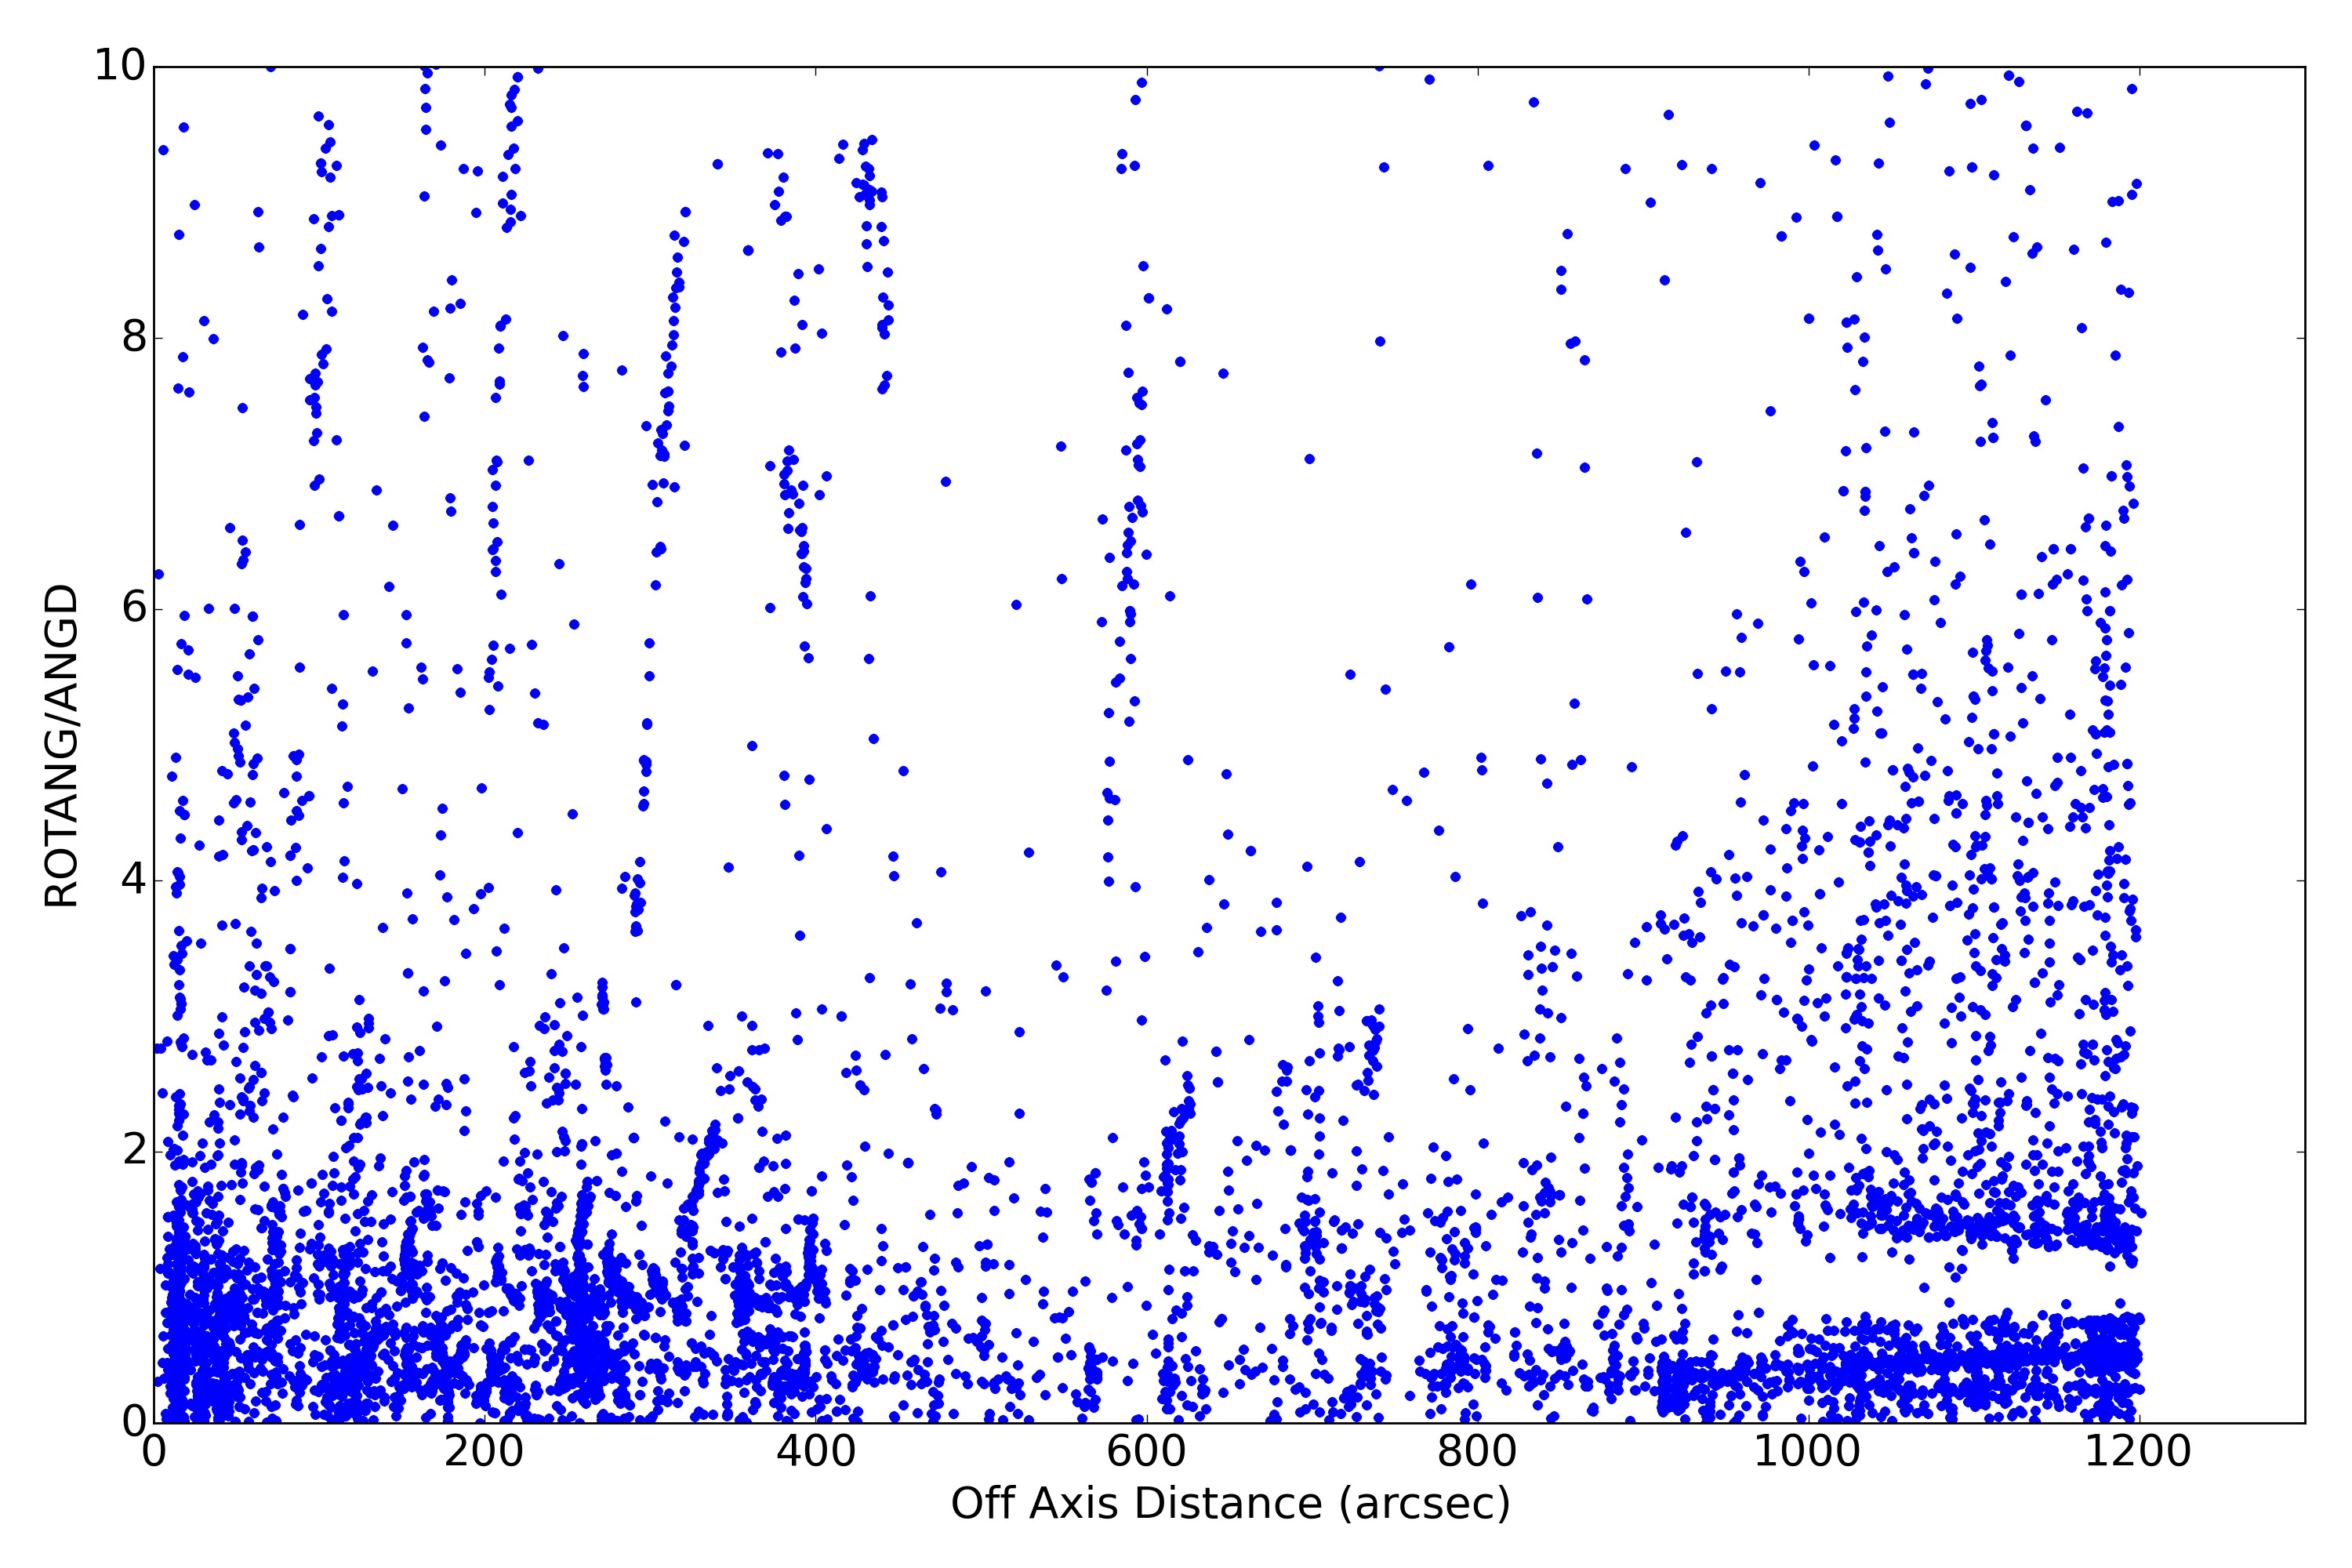
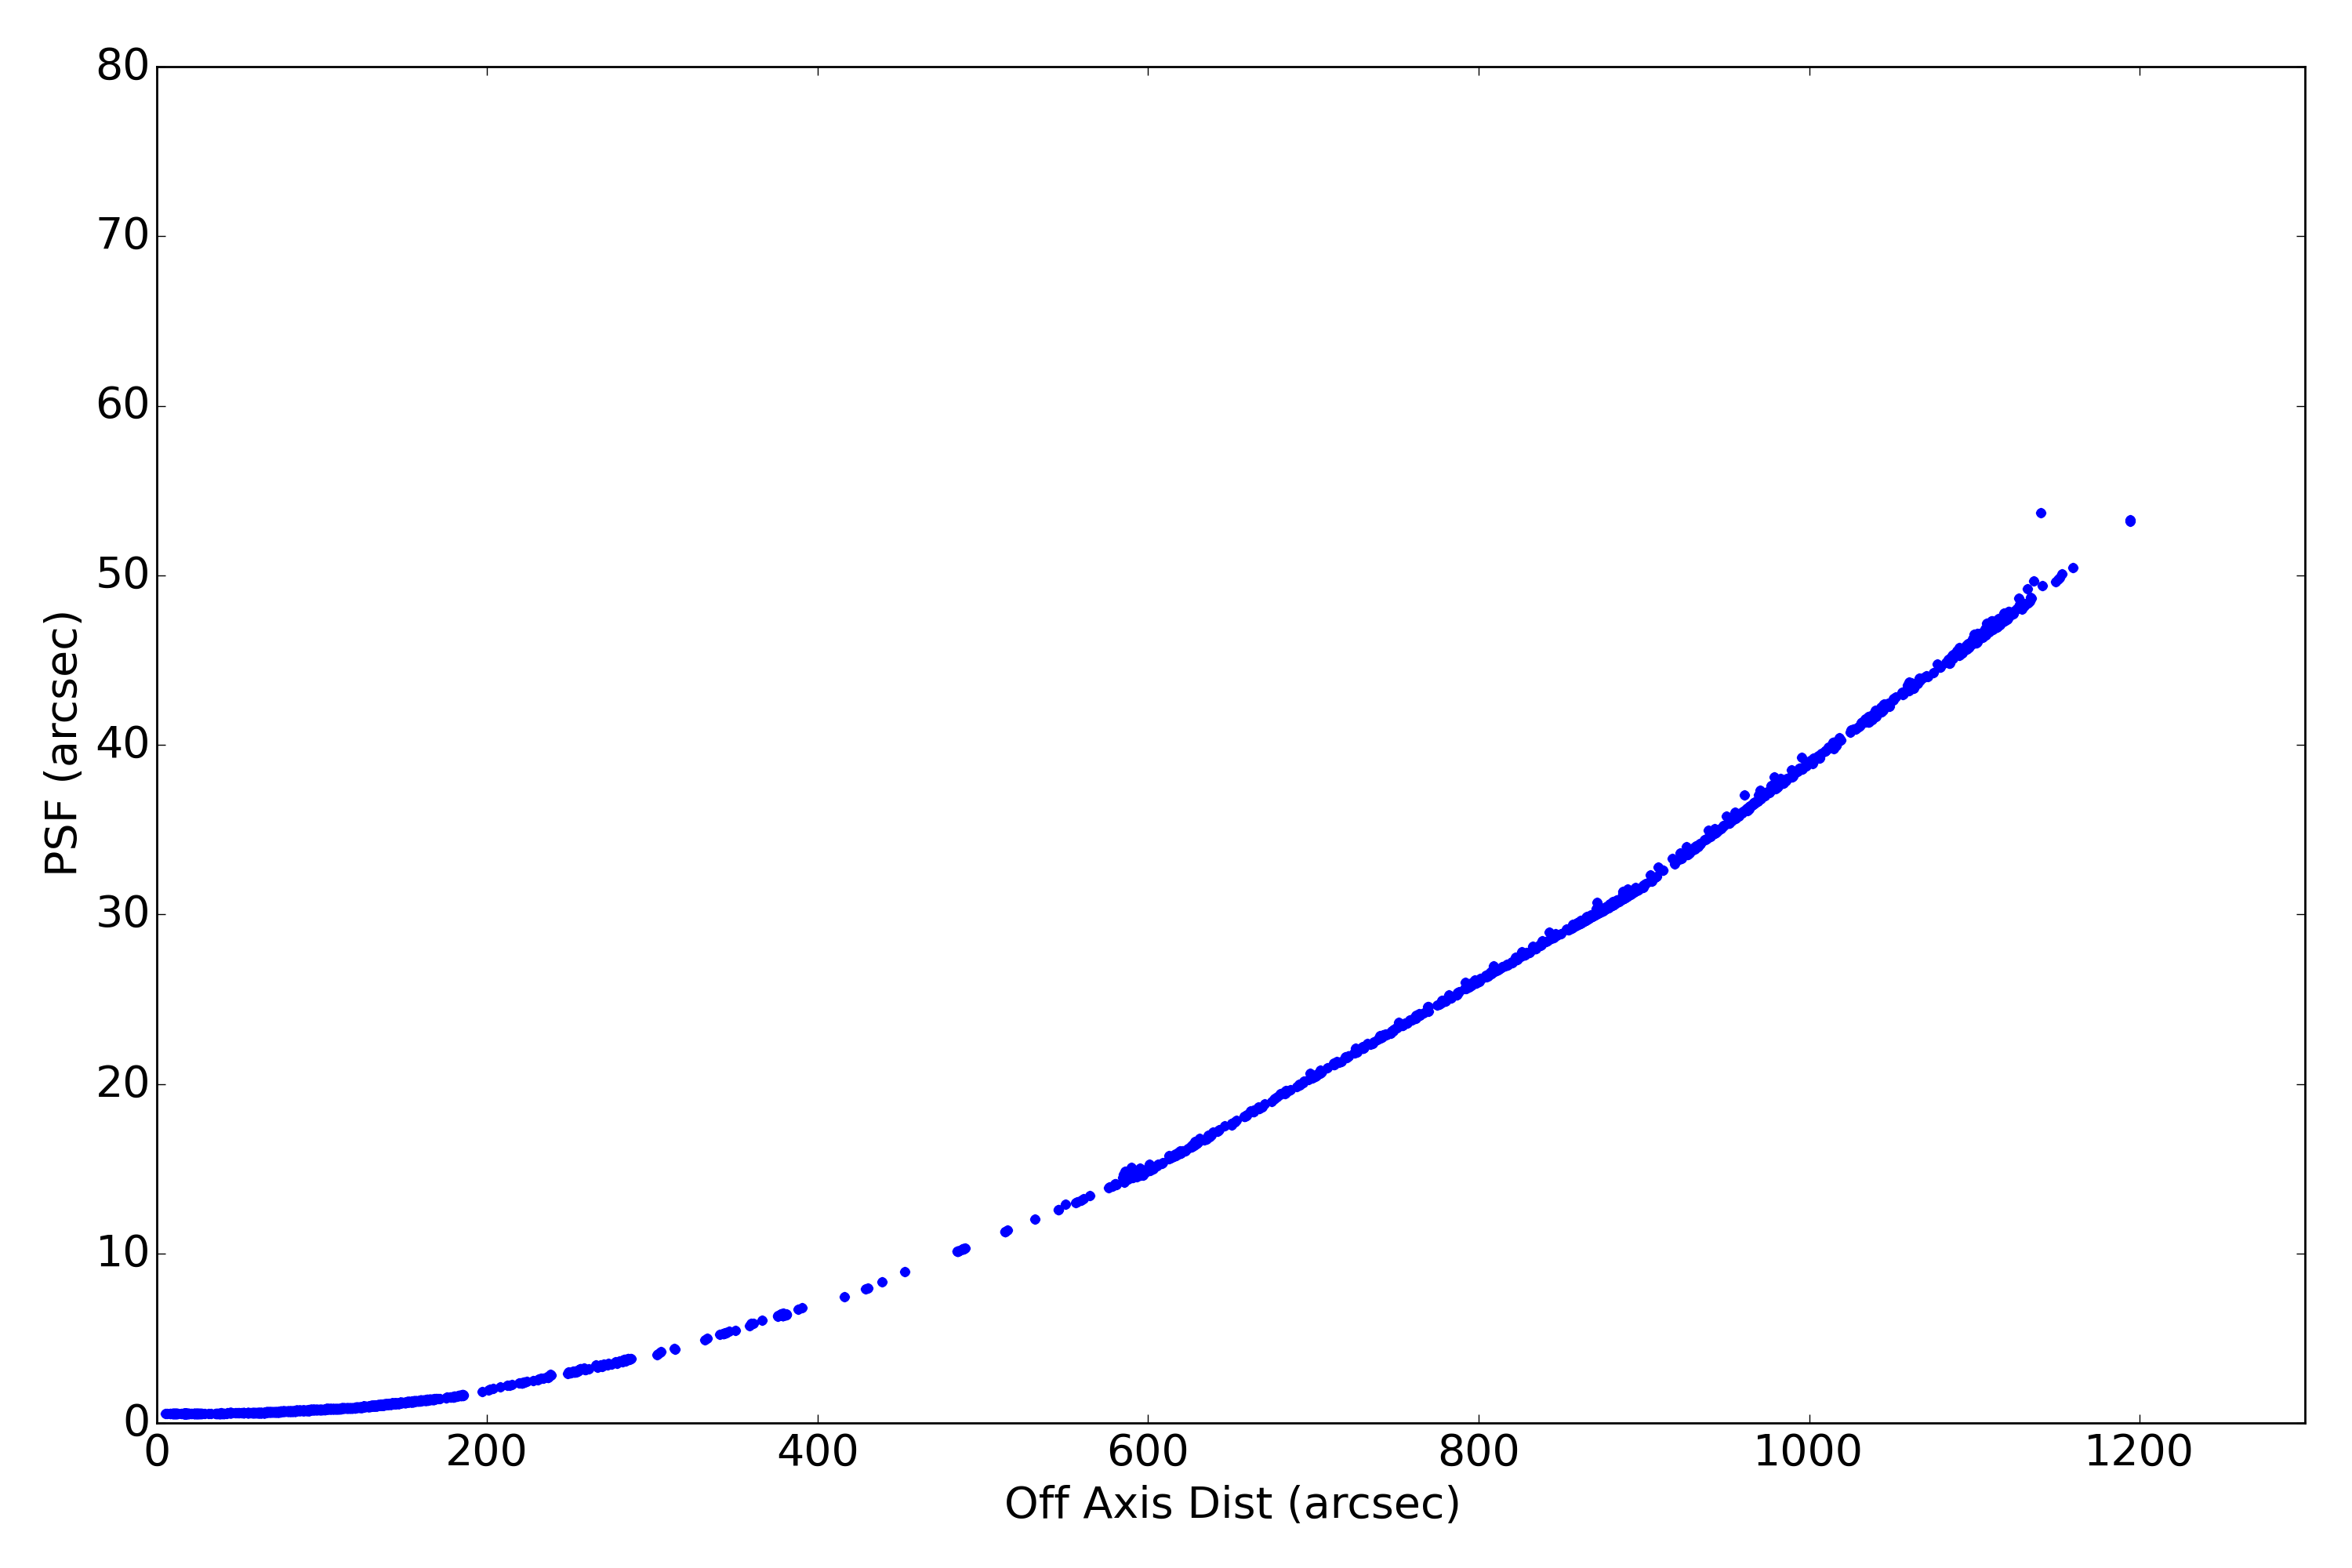
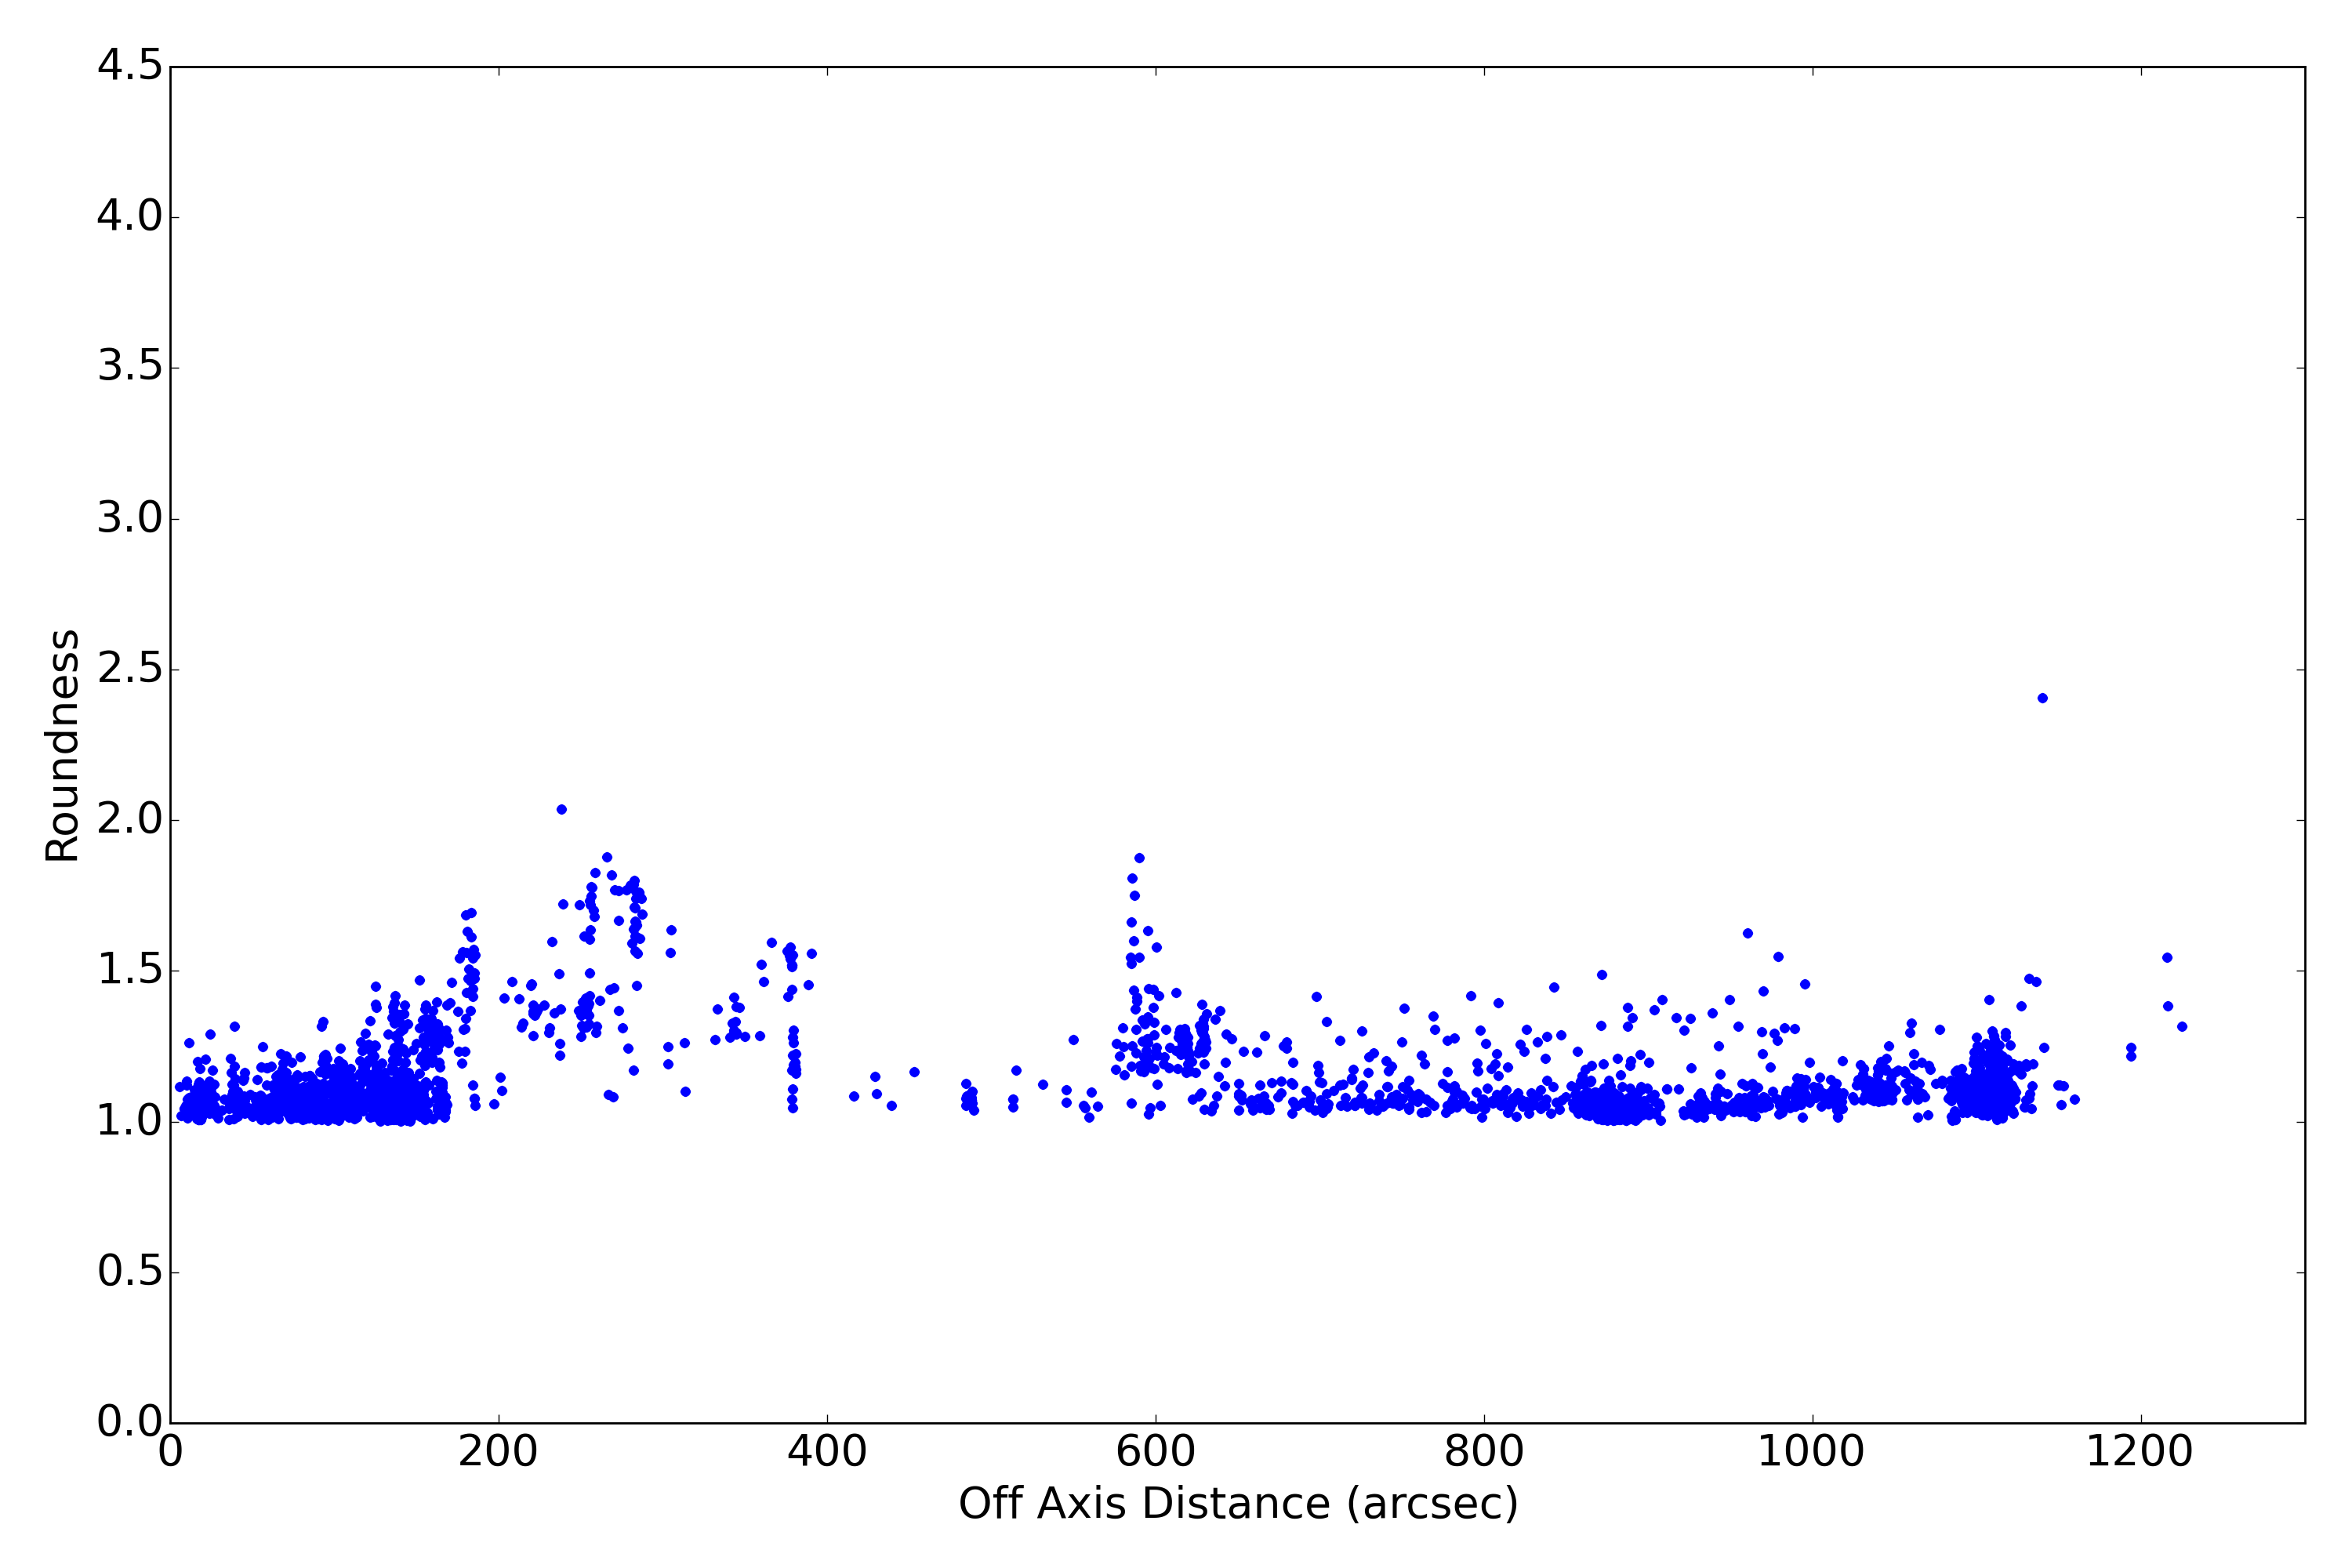
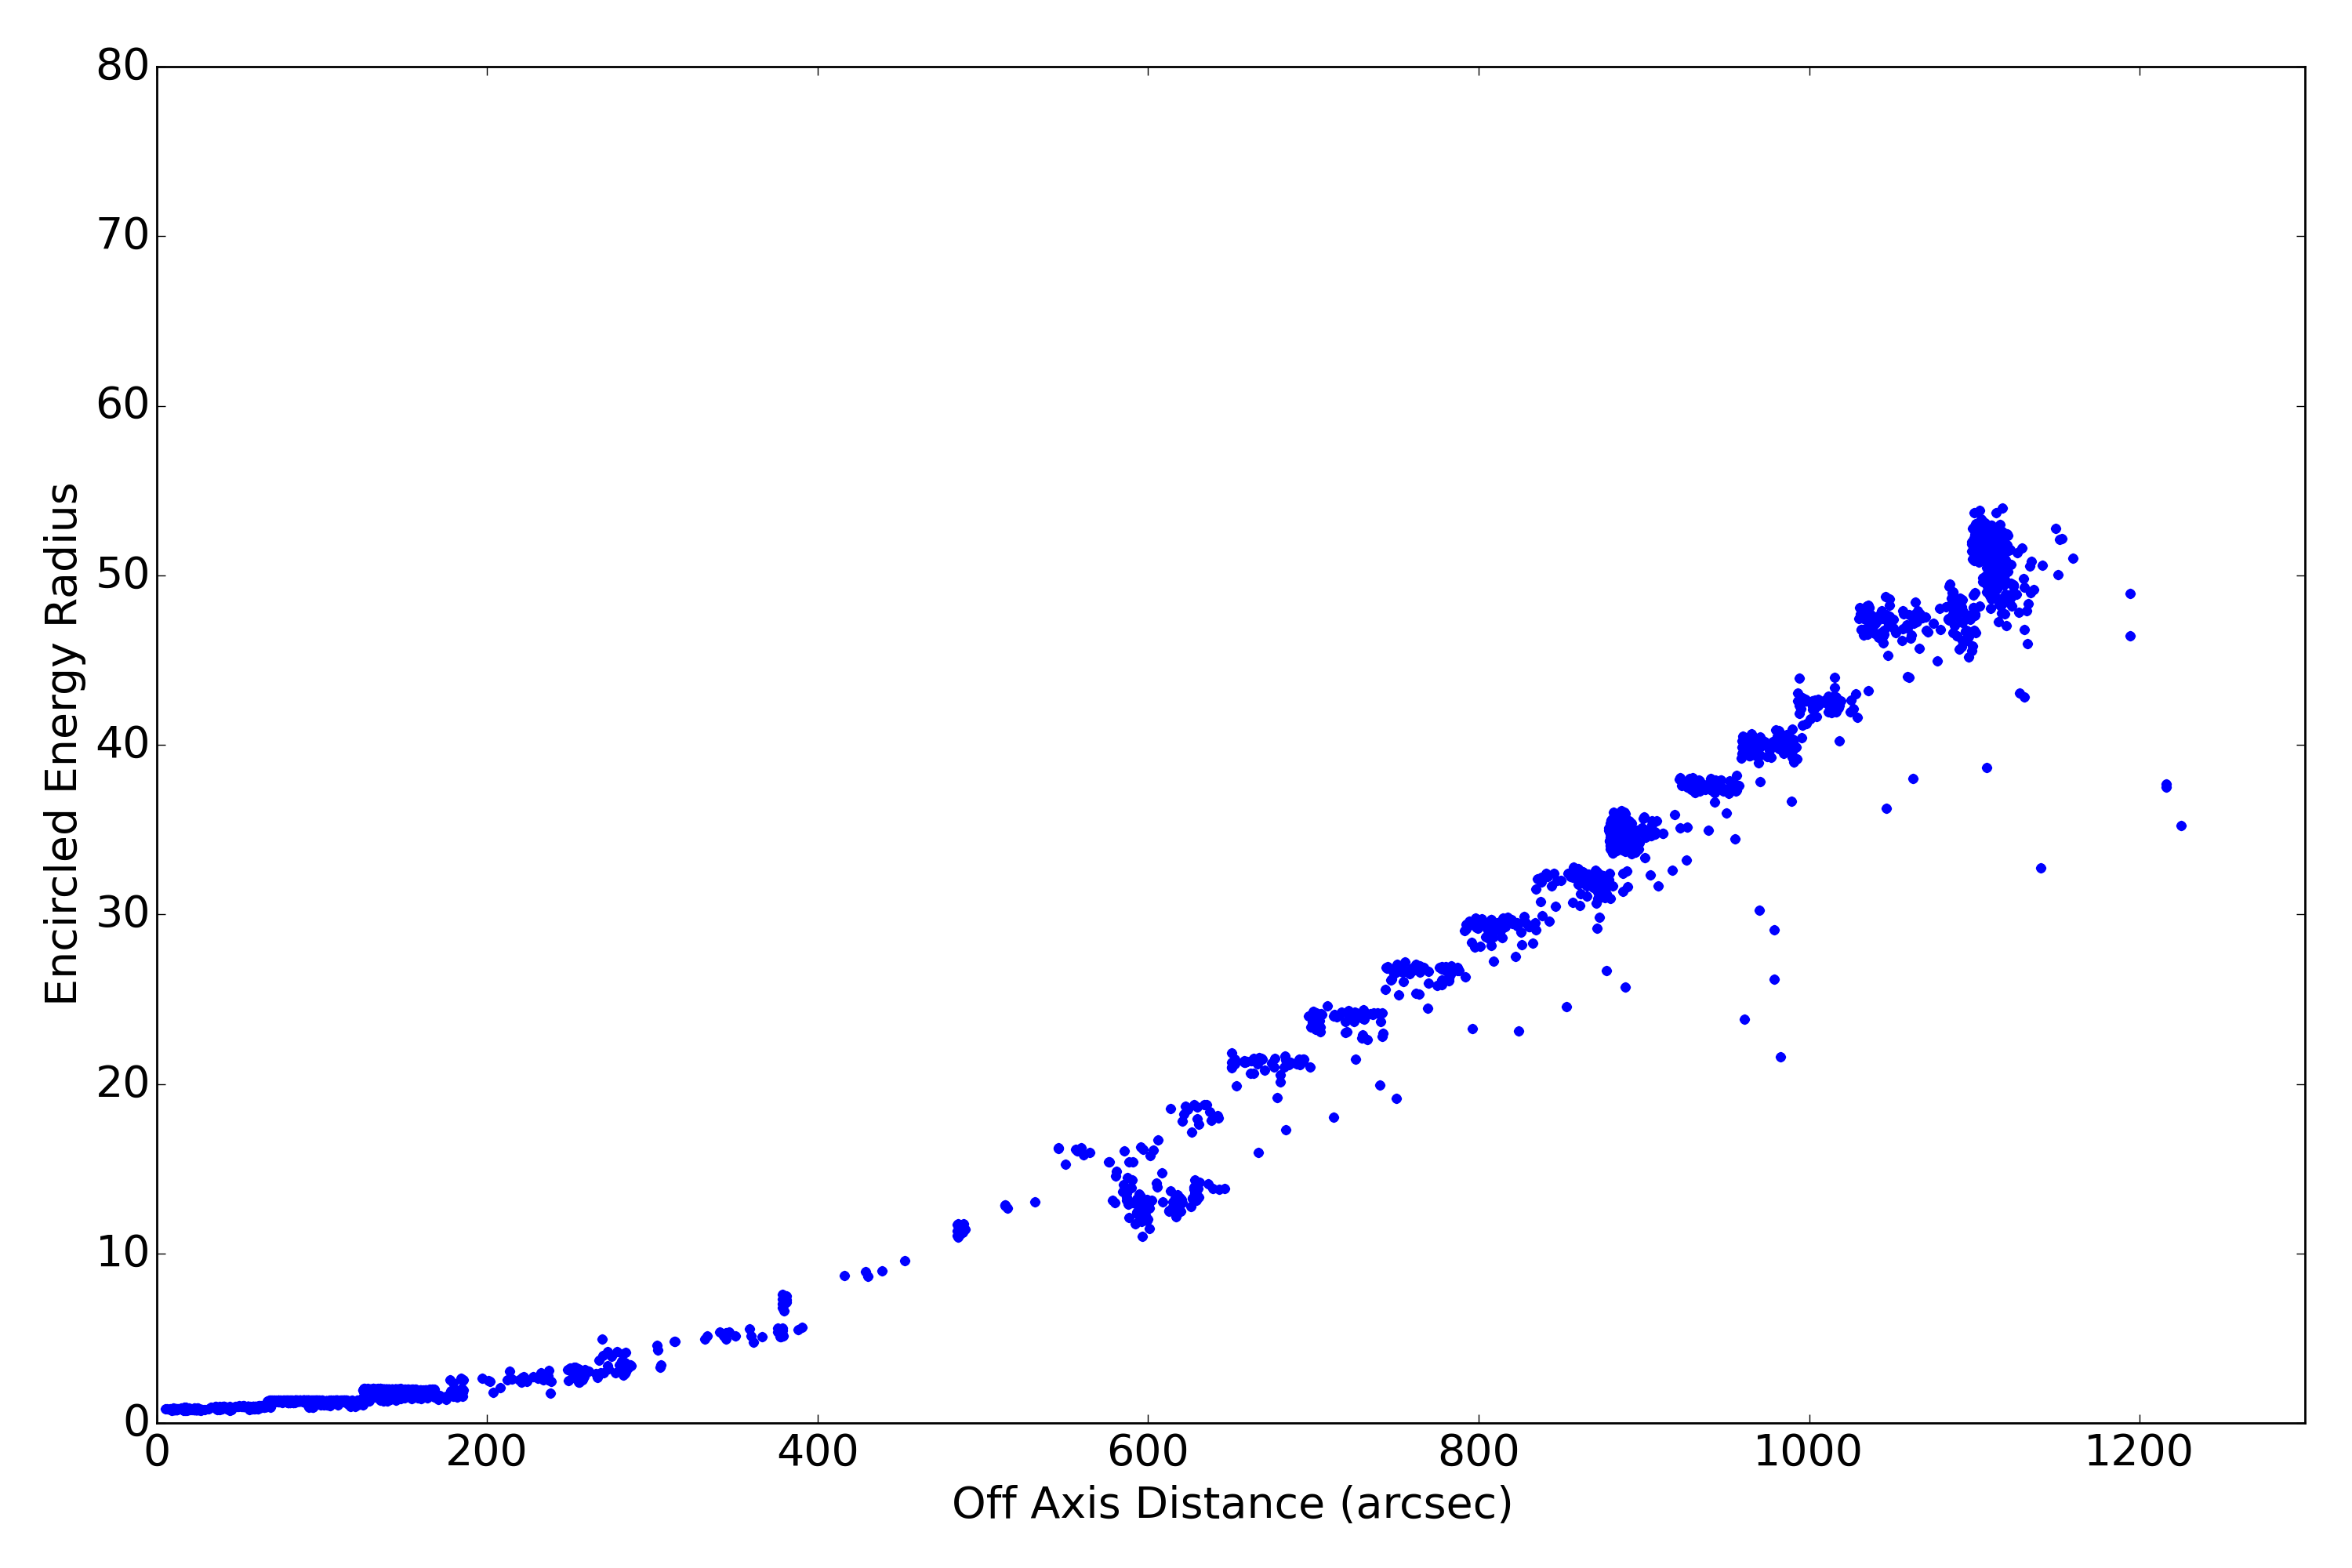
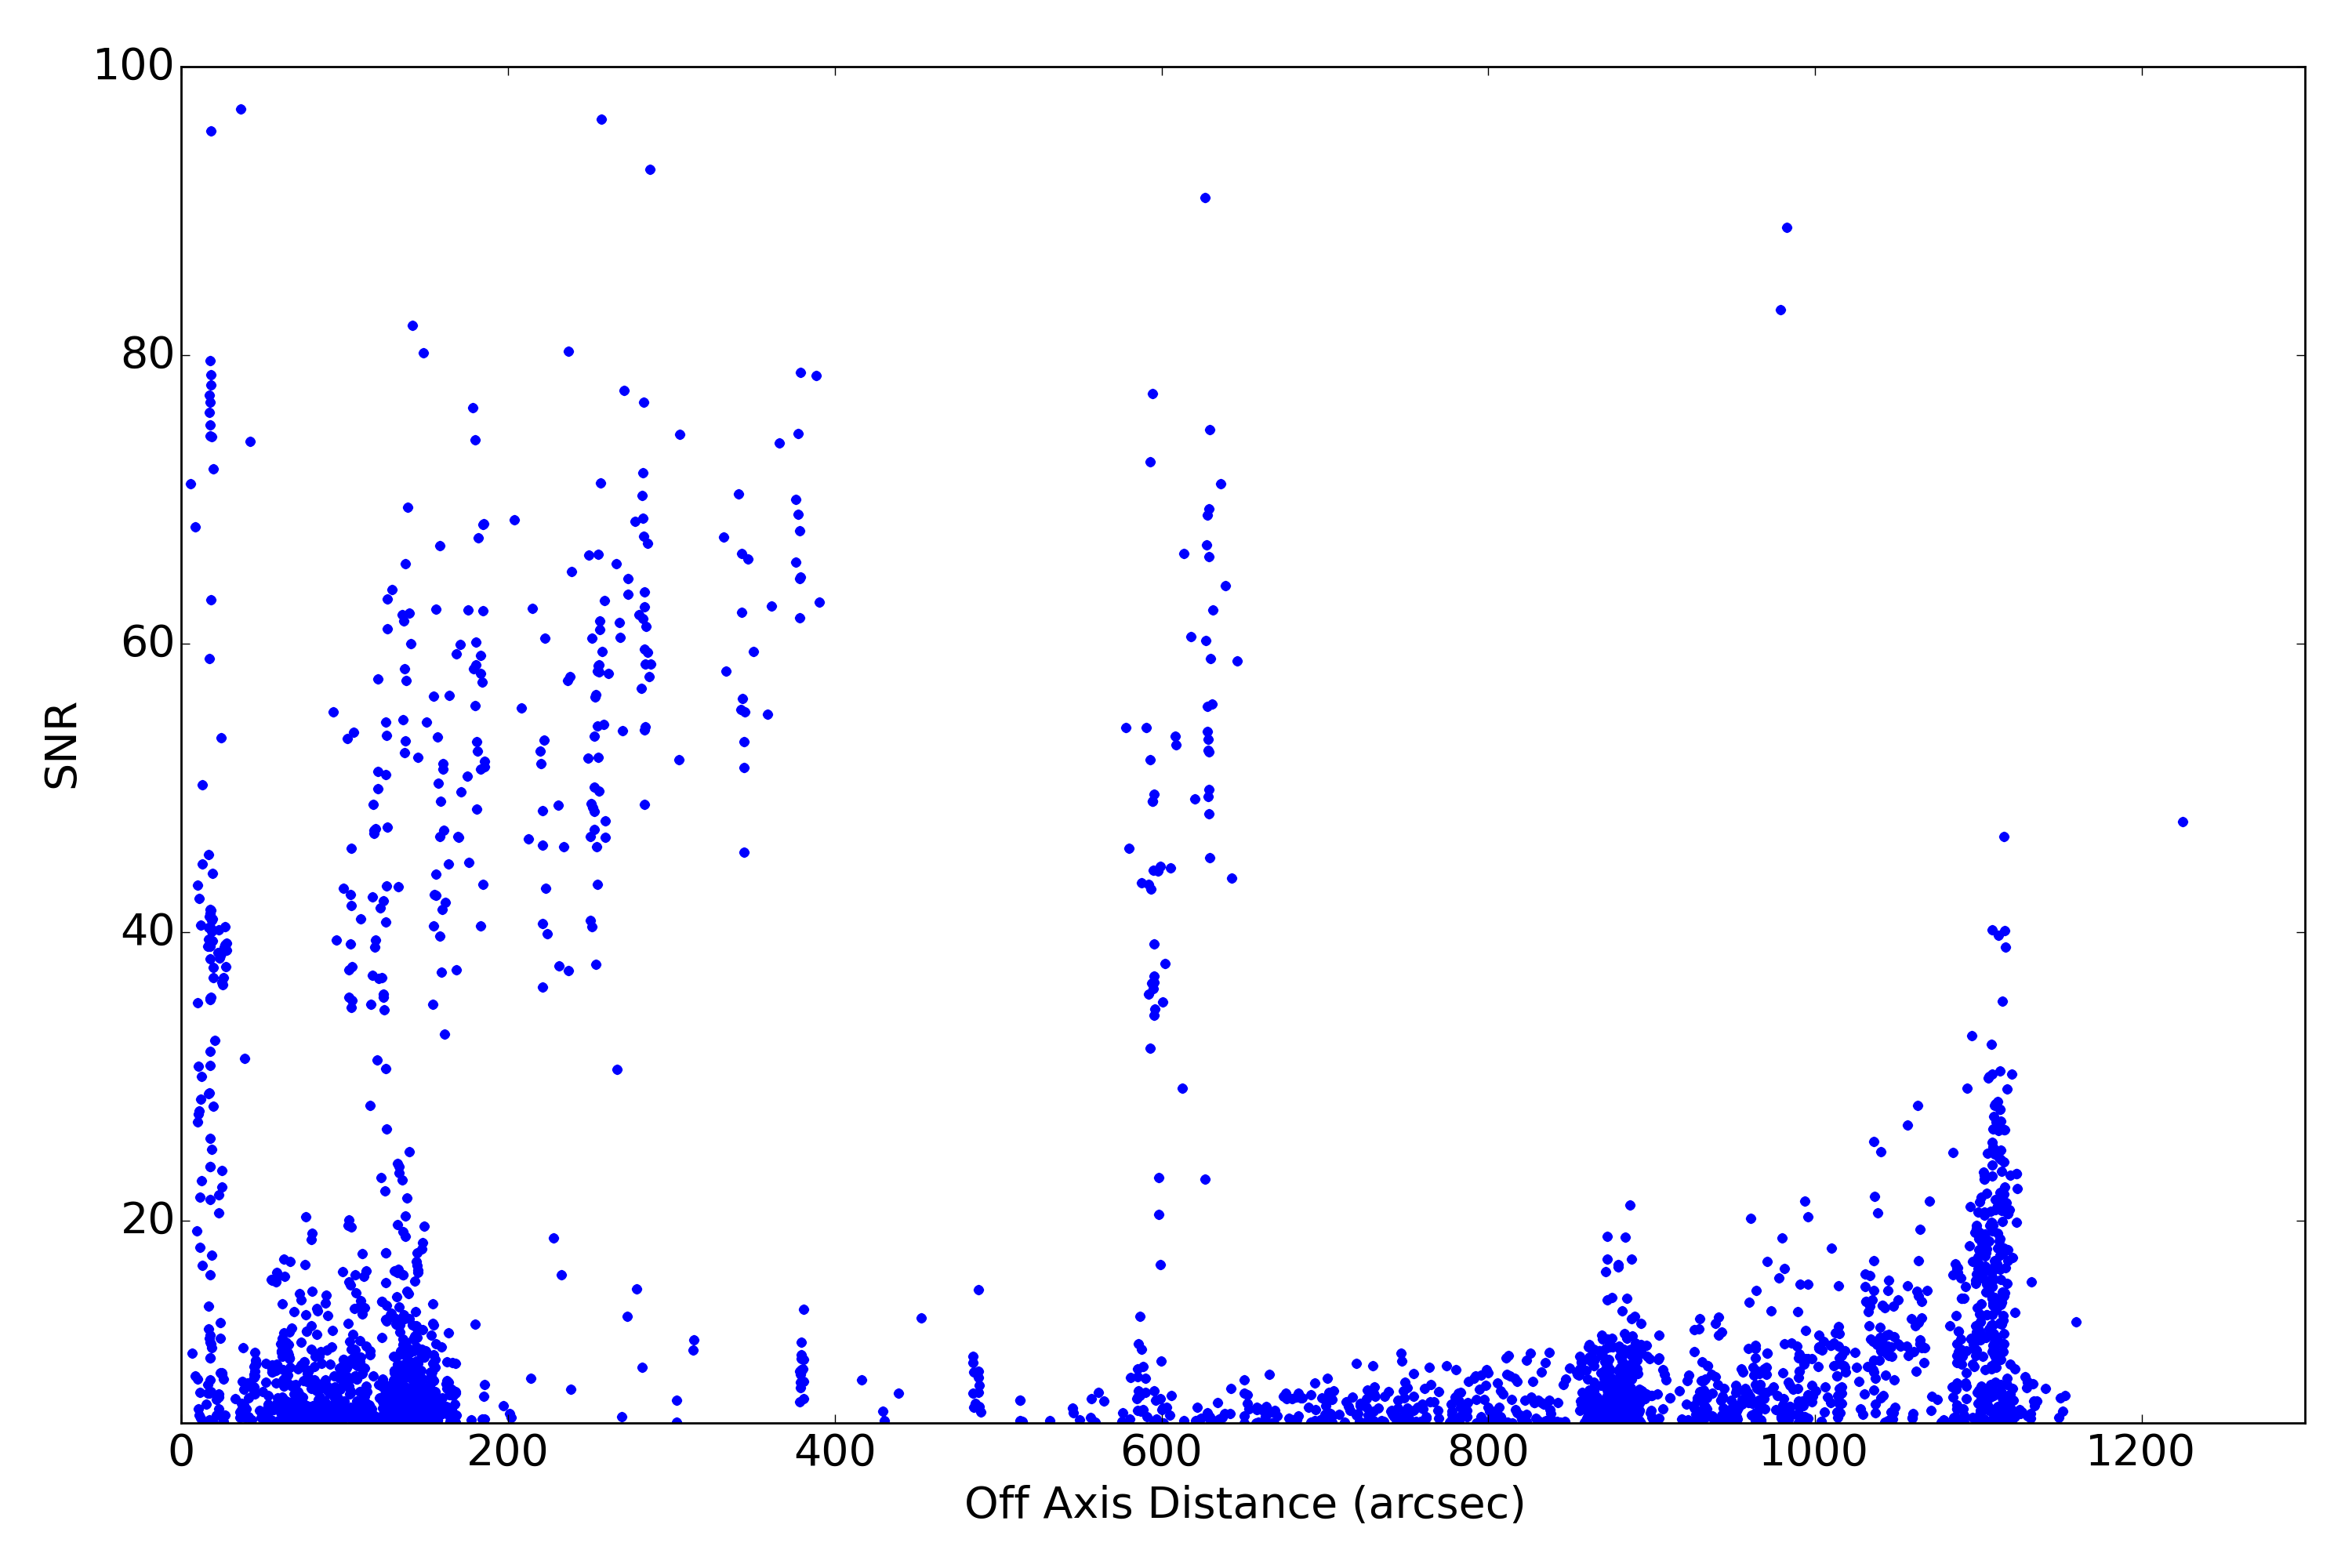
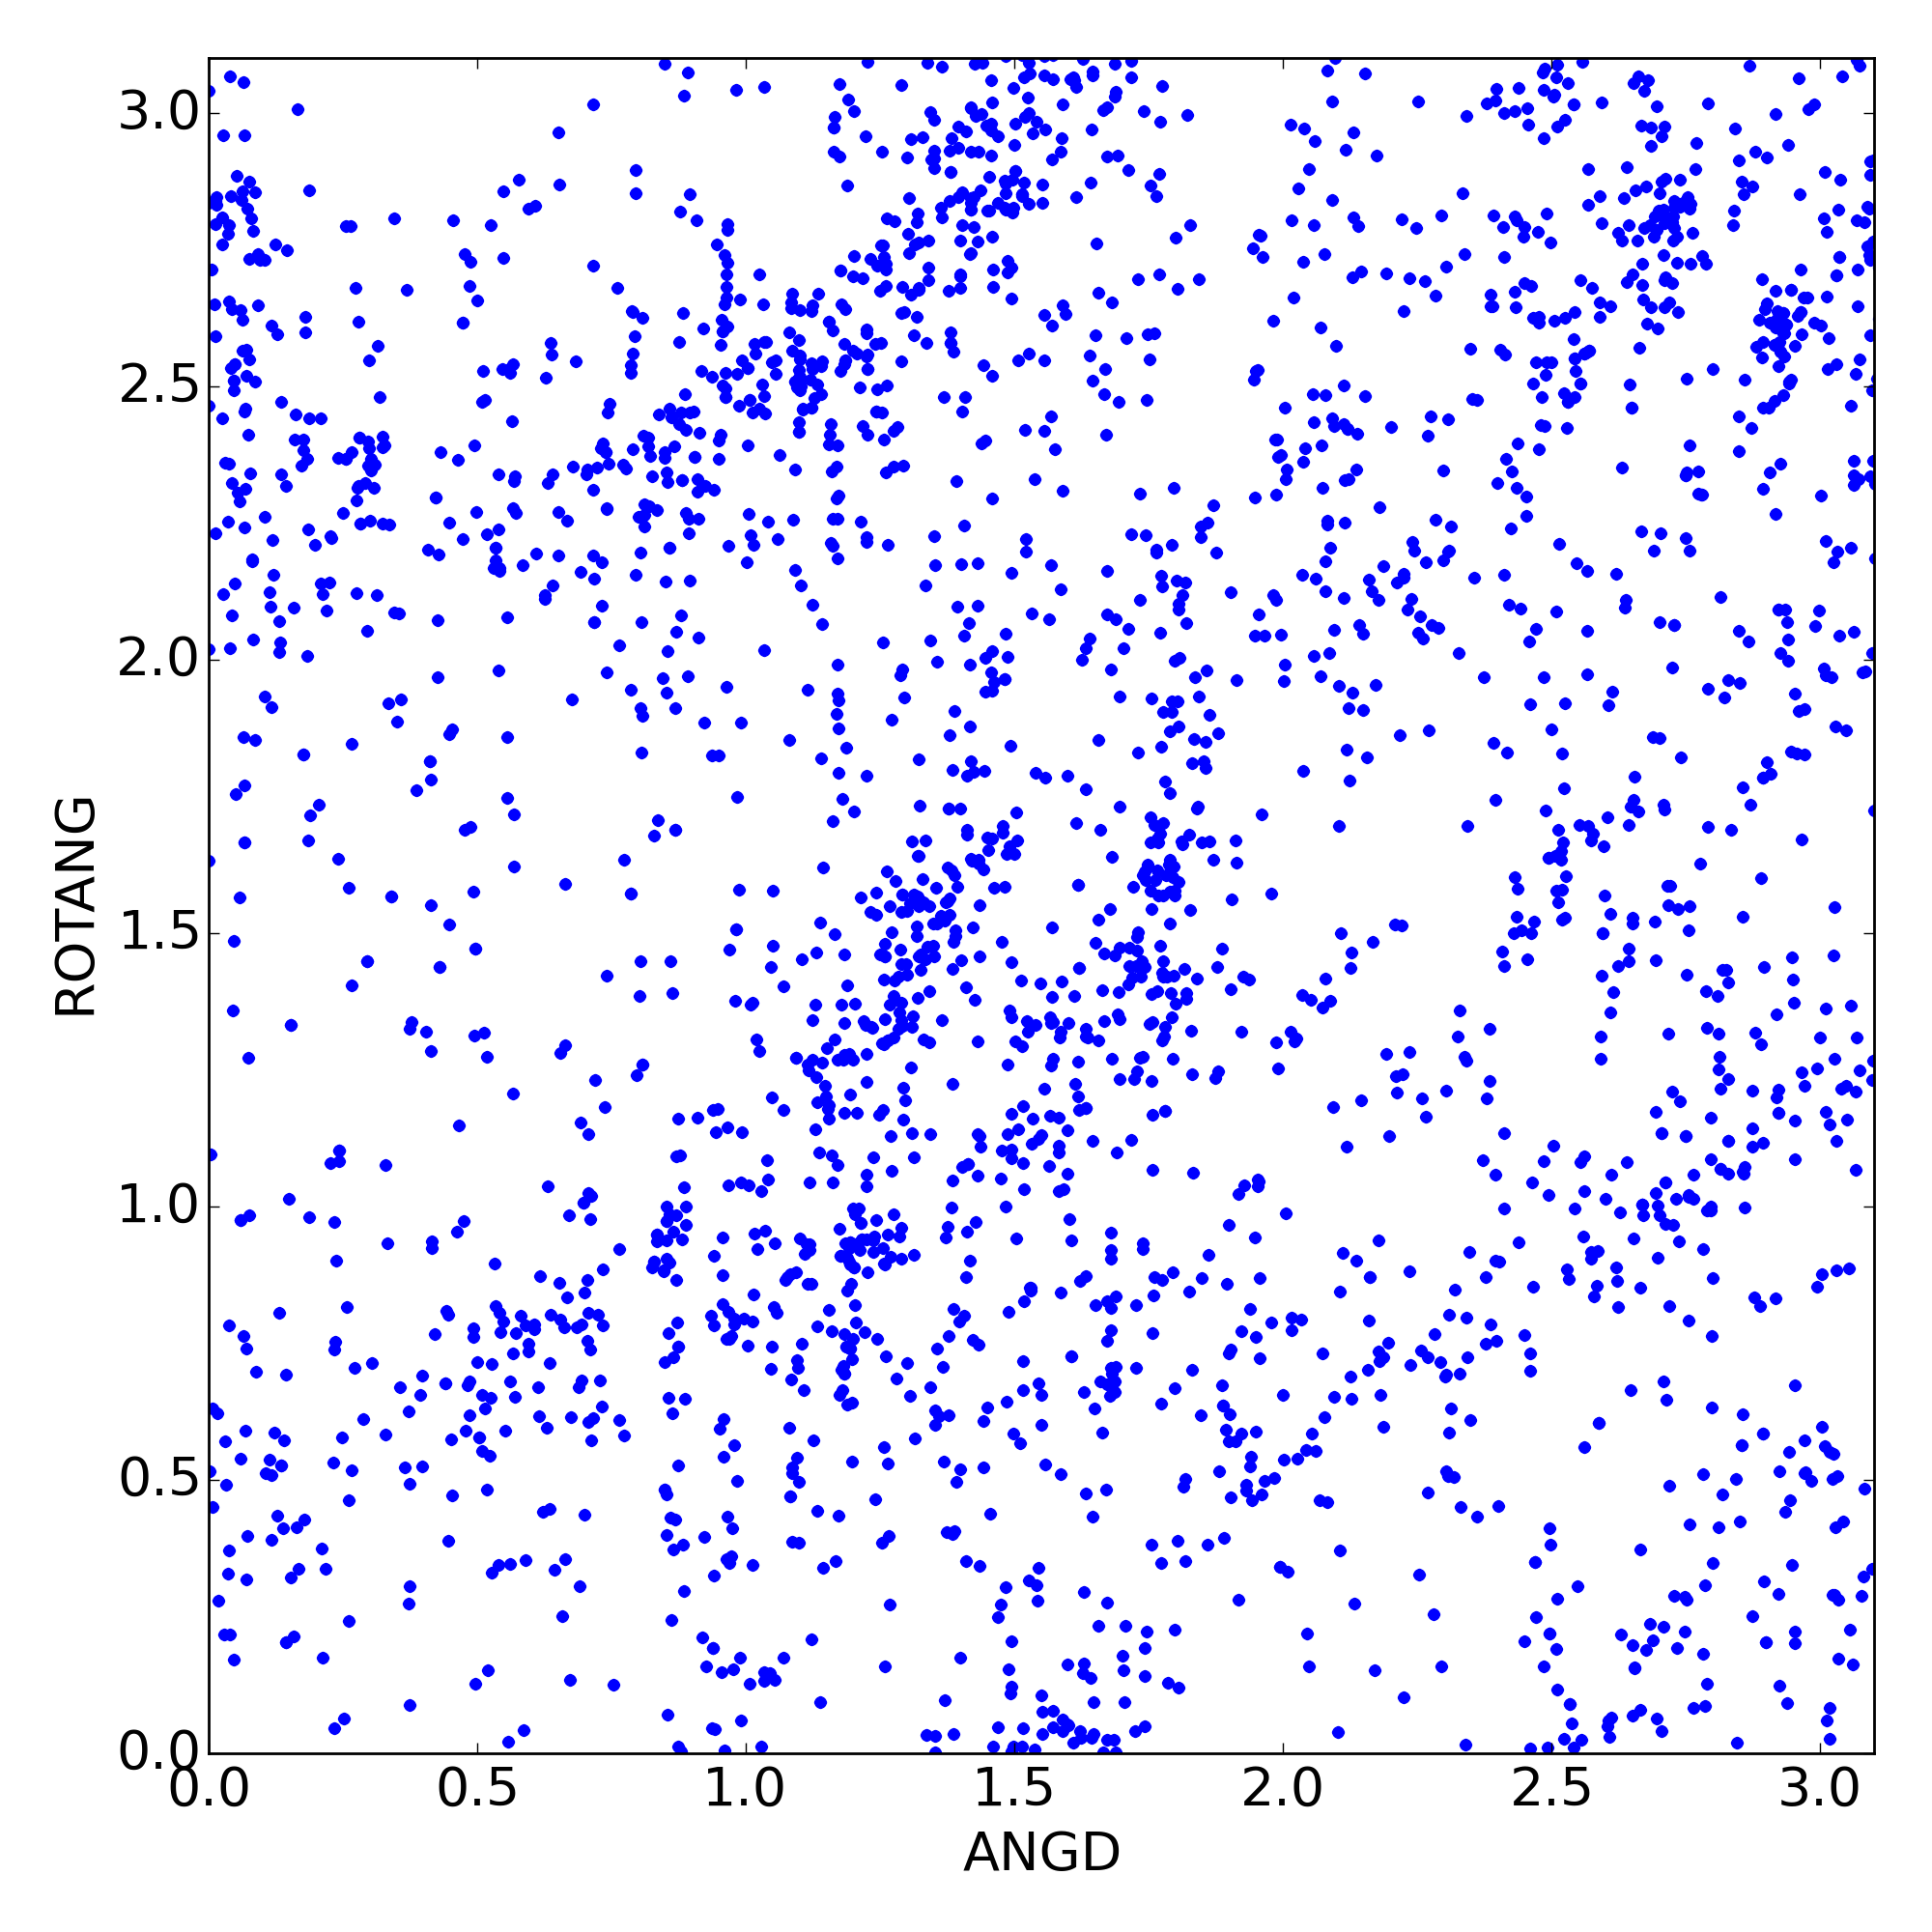
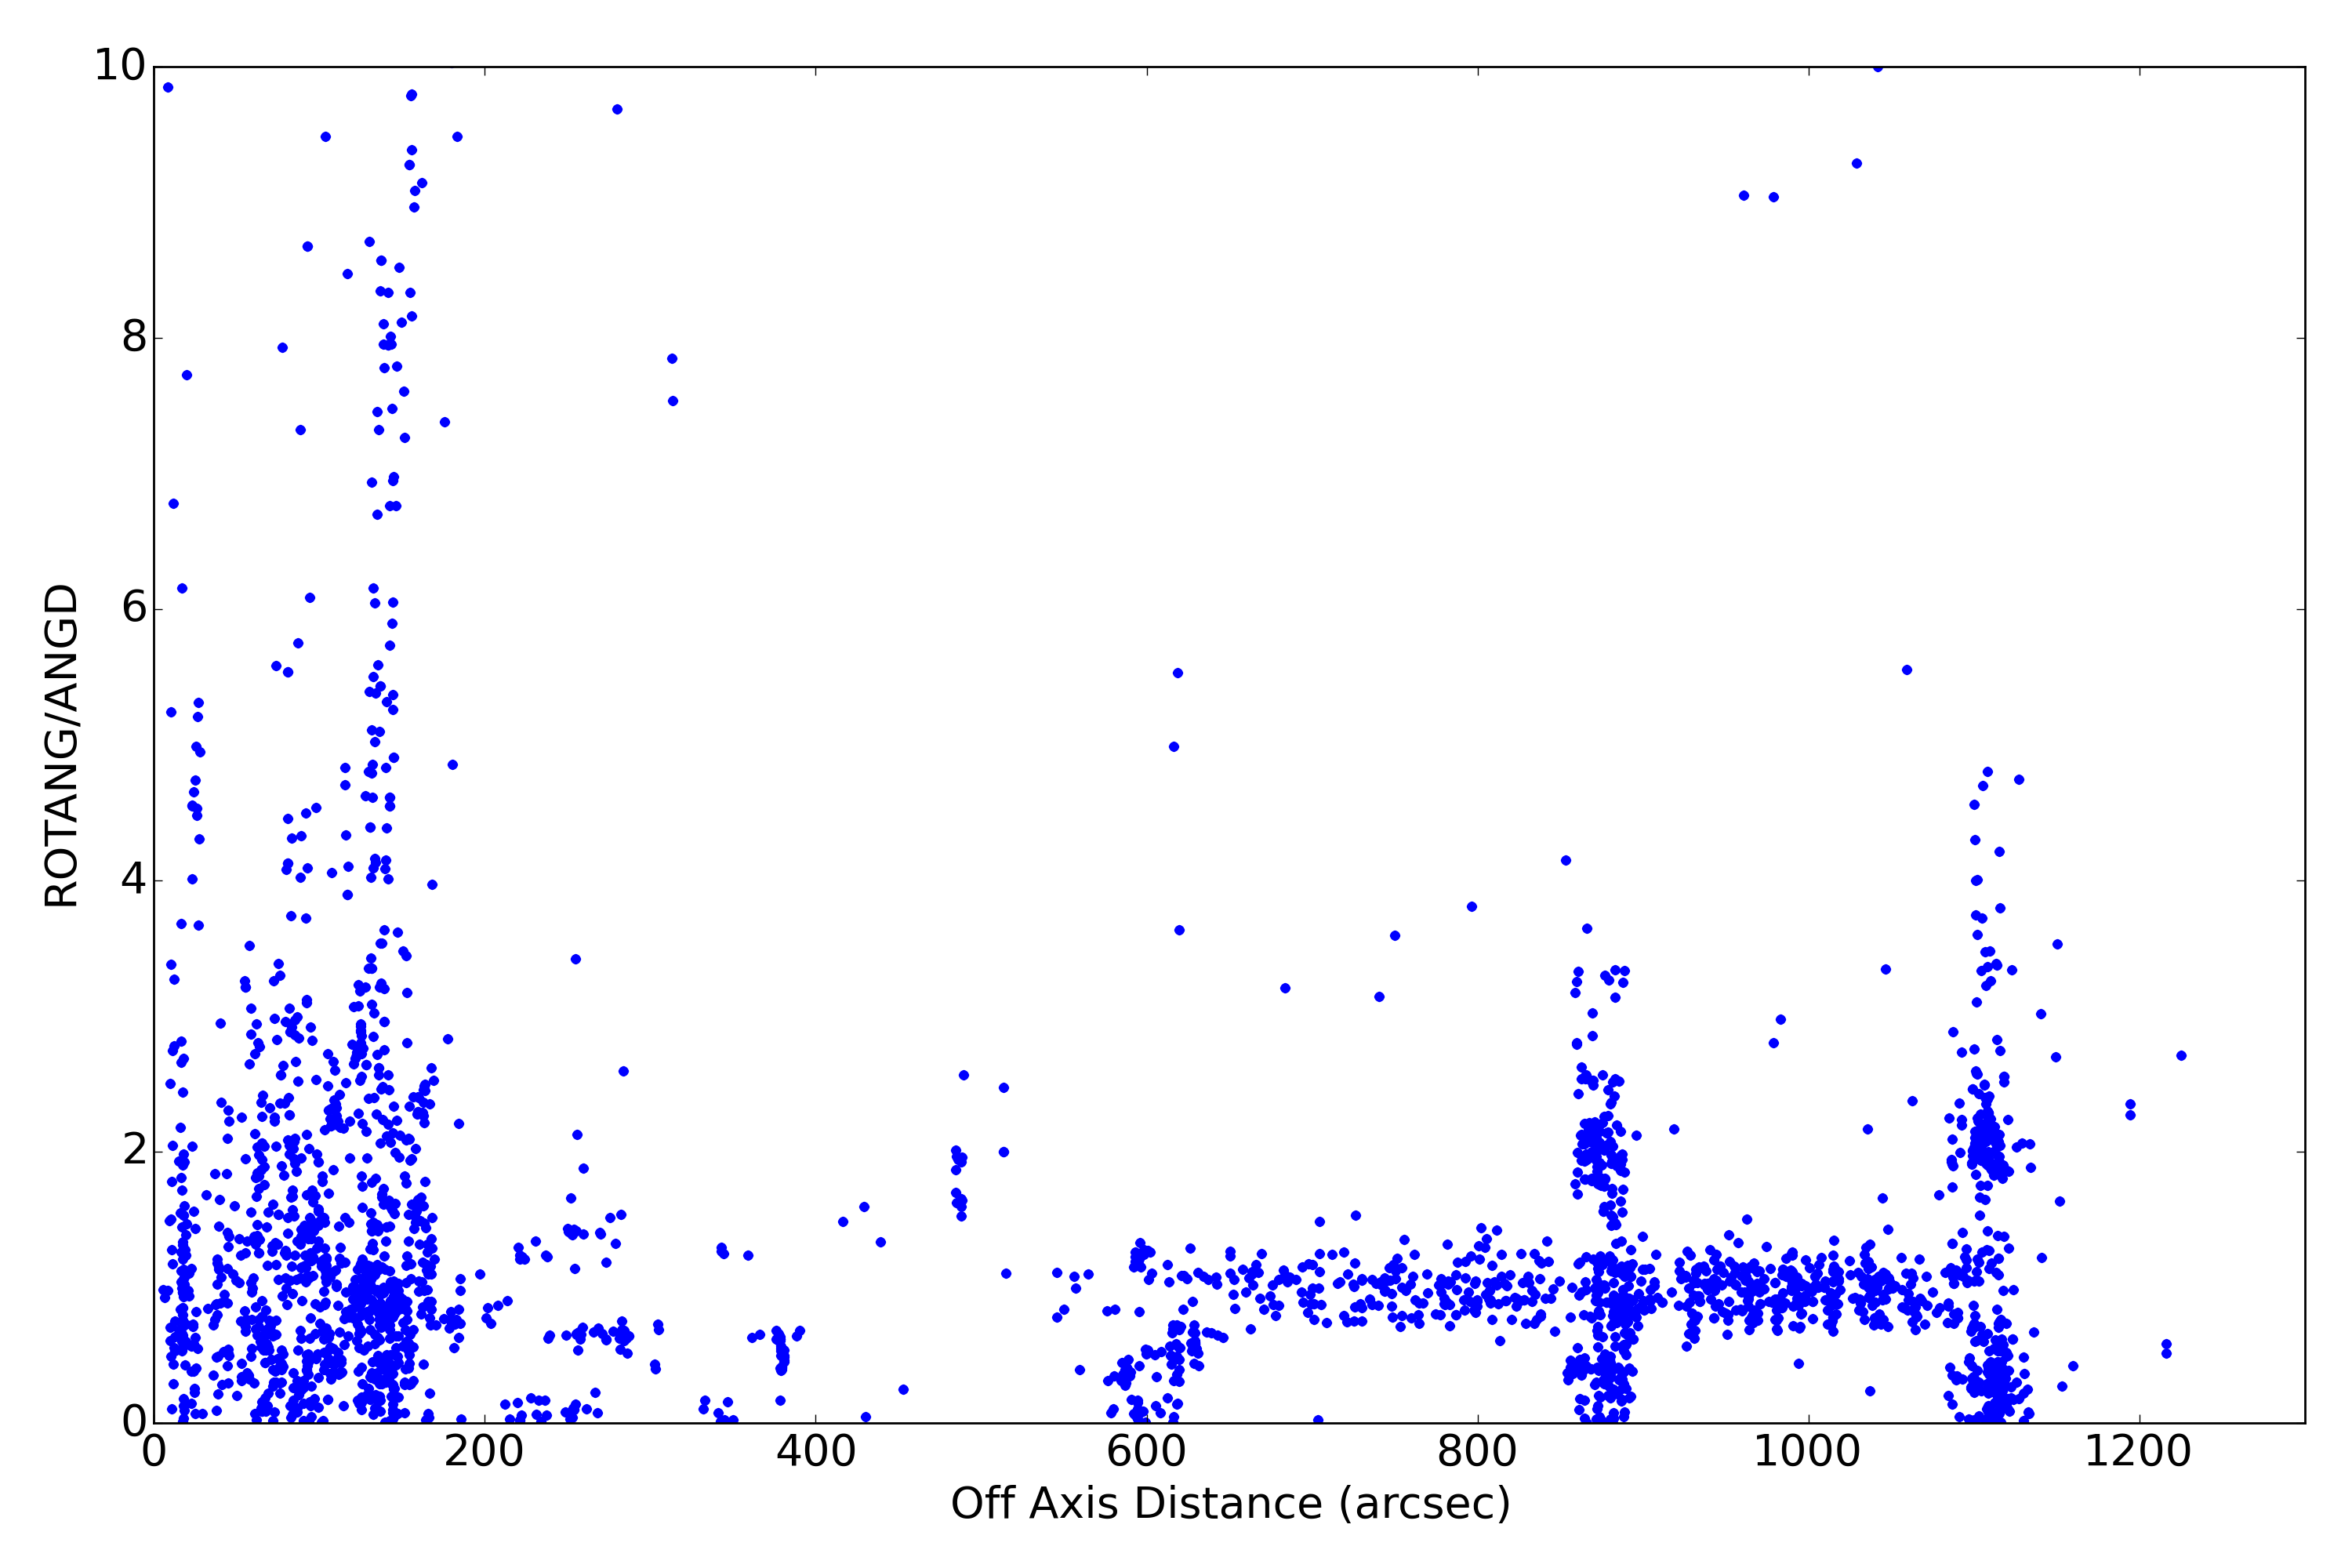
Plots below show various characteristics of detected imaging sources. Standard level 2 data products (*src2.fits) are used. Only observations with focus (sim_x) within 0.01 mm of nominal value for given SI configuration are used. Sources are also filtered for strength (SNR > 15).
| XY | PSF | Roundness | EE Radius | SNR | Rotation | Rotation2 | |
|---|---|---|---|---|---|---|---|
| ACIS I | 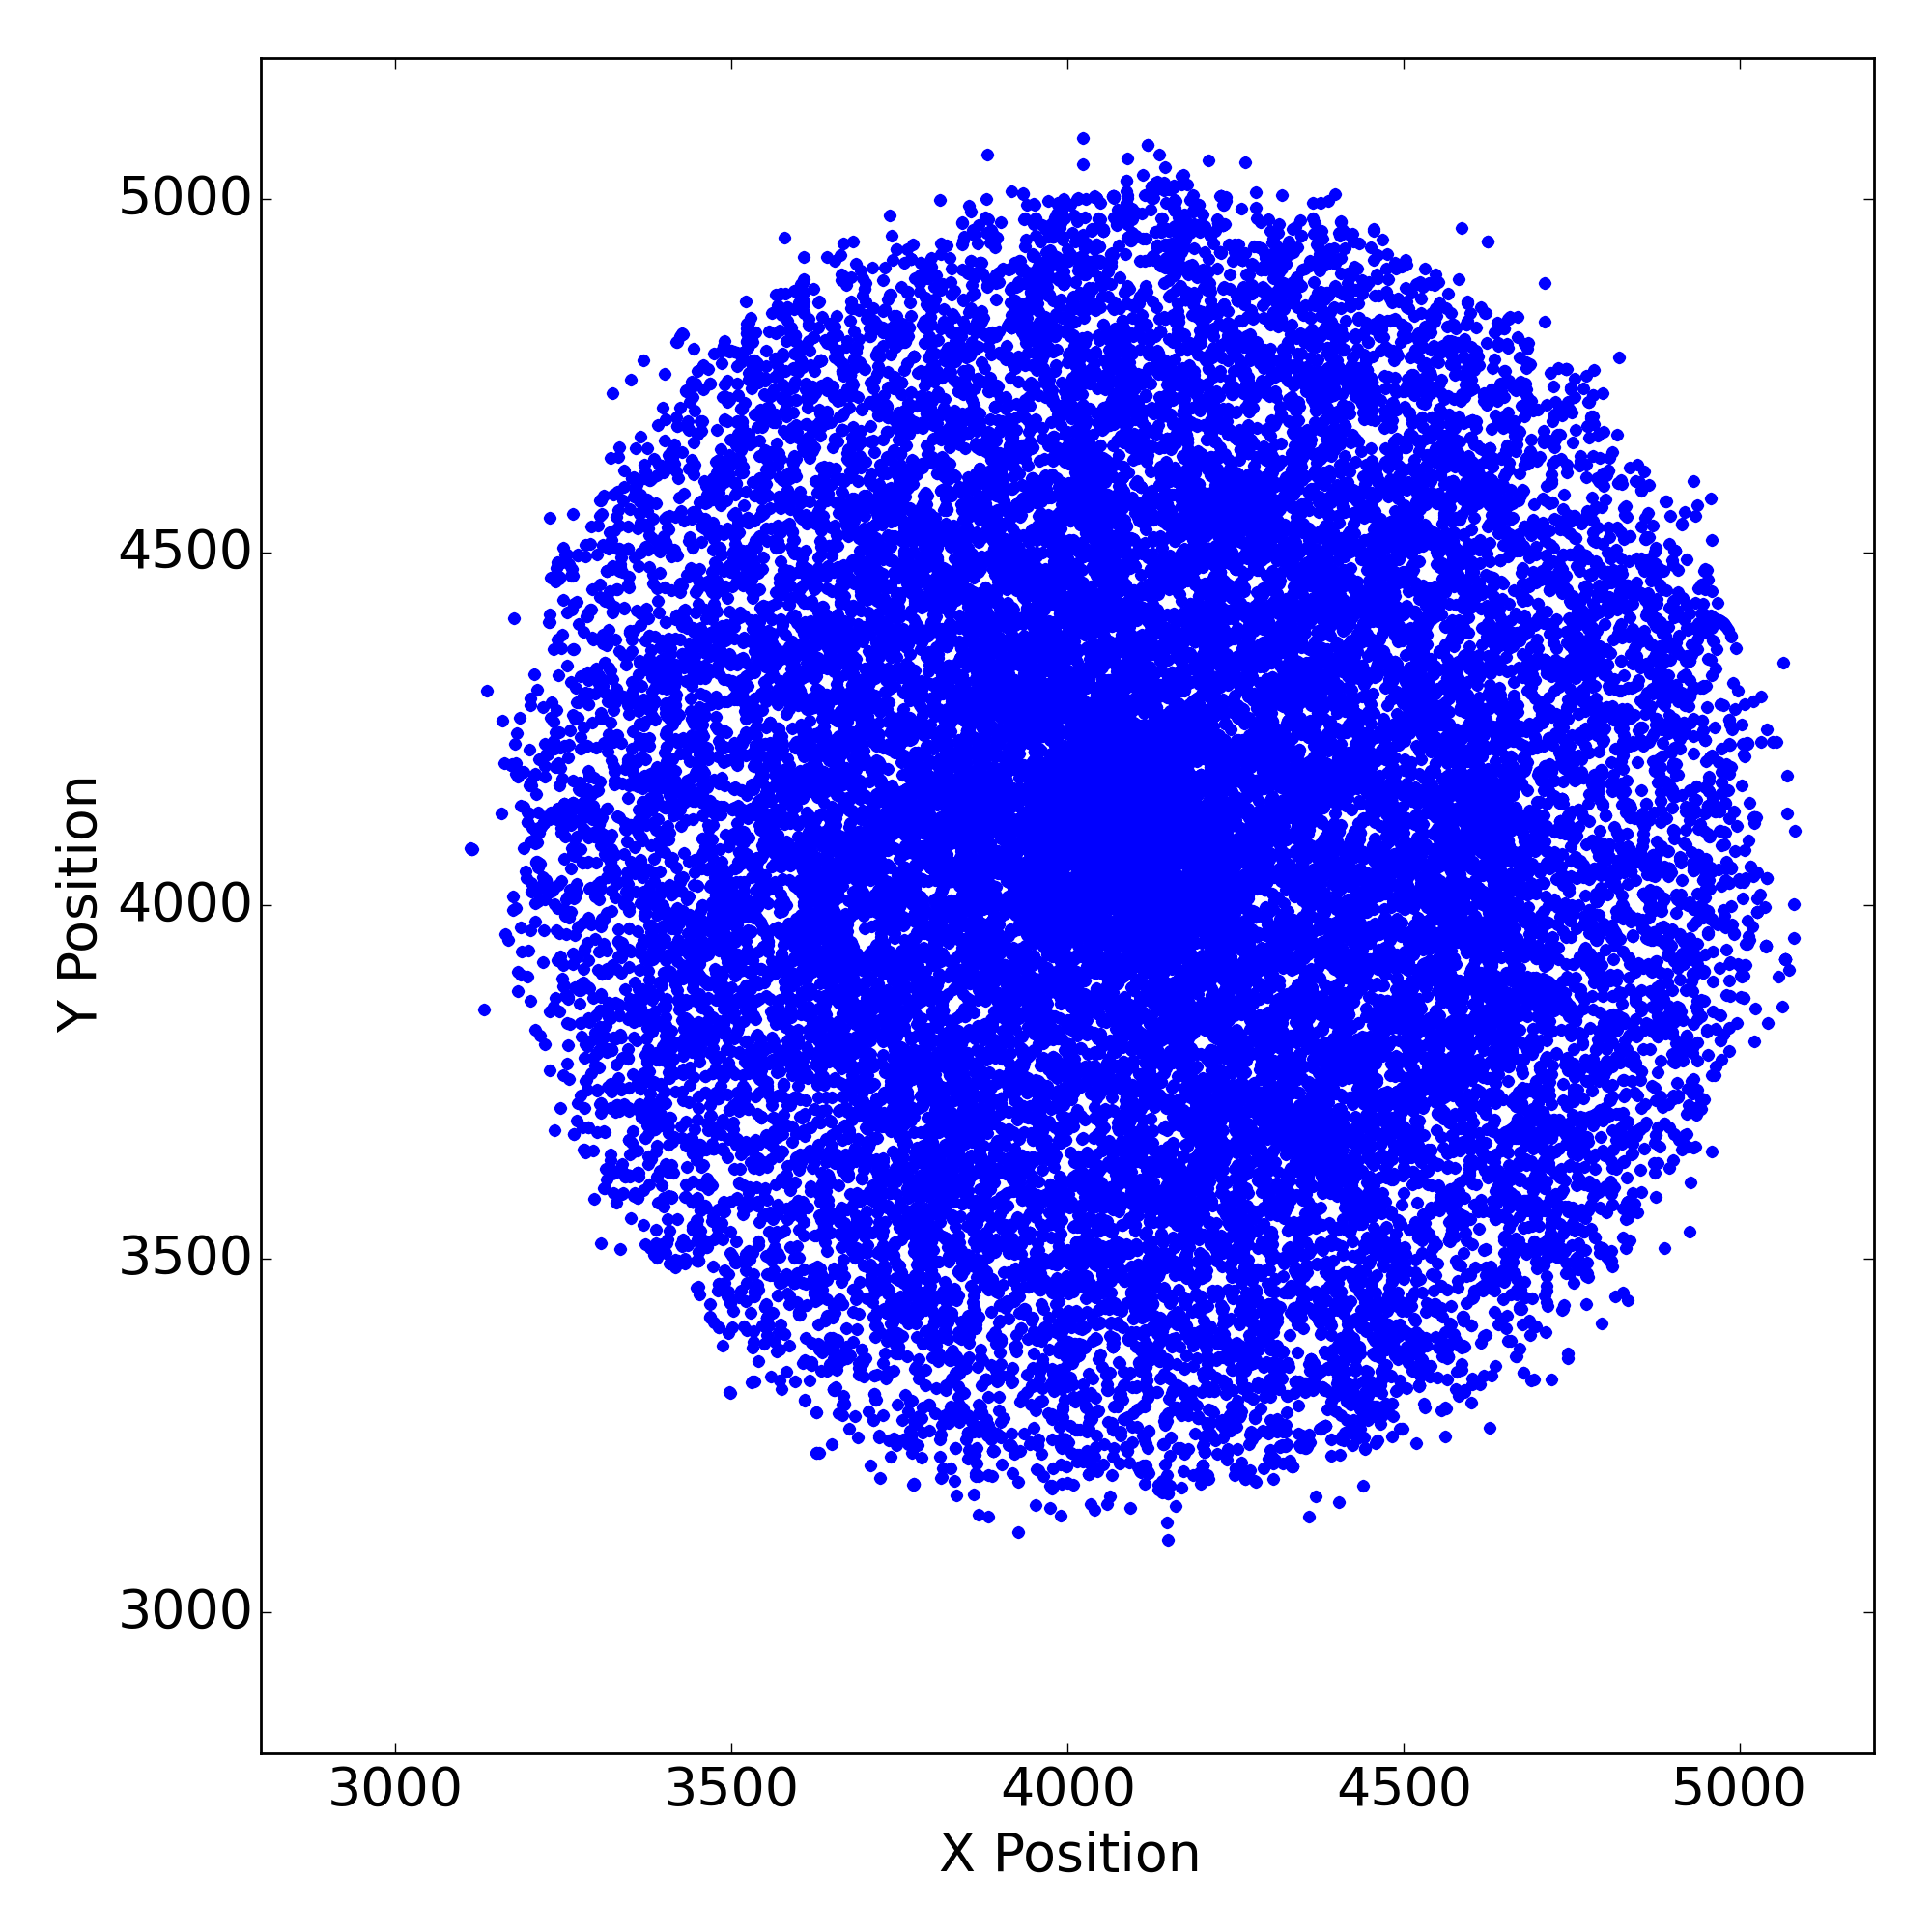 |
 |
 |
 |
 |
 |
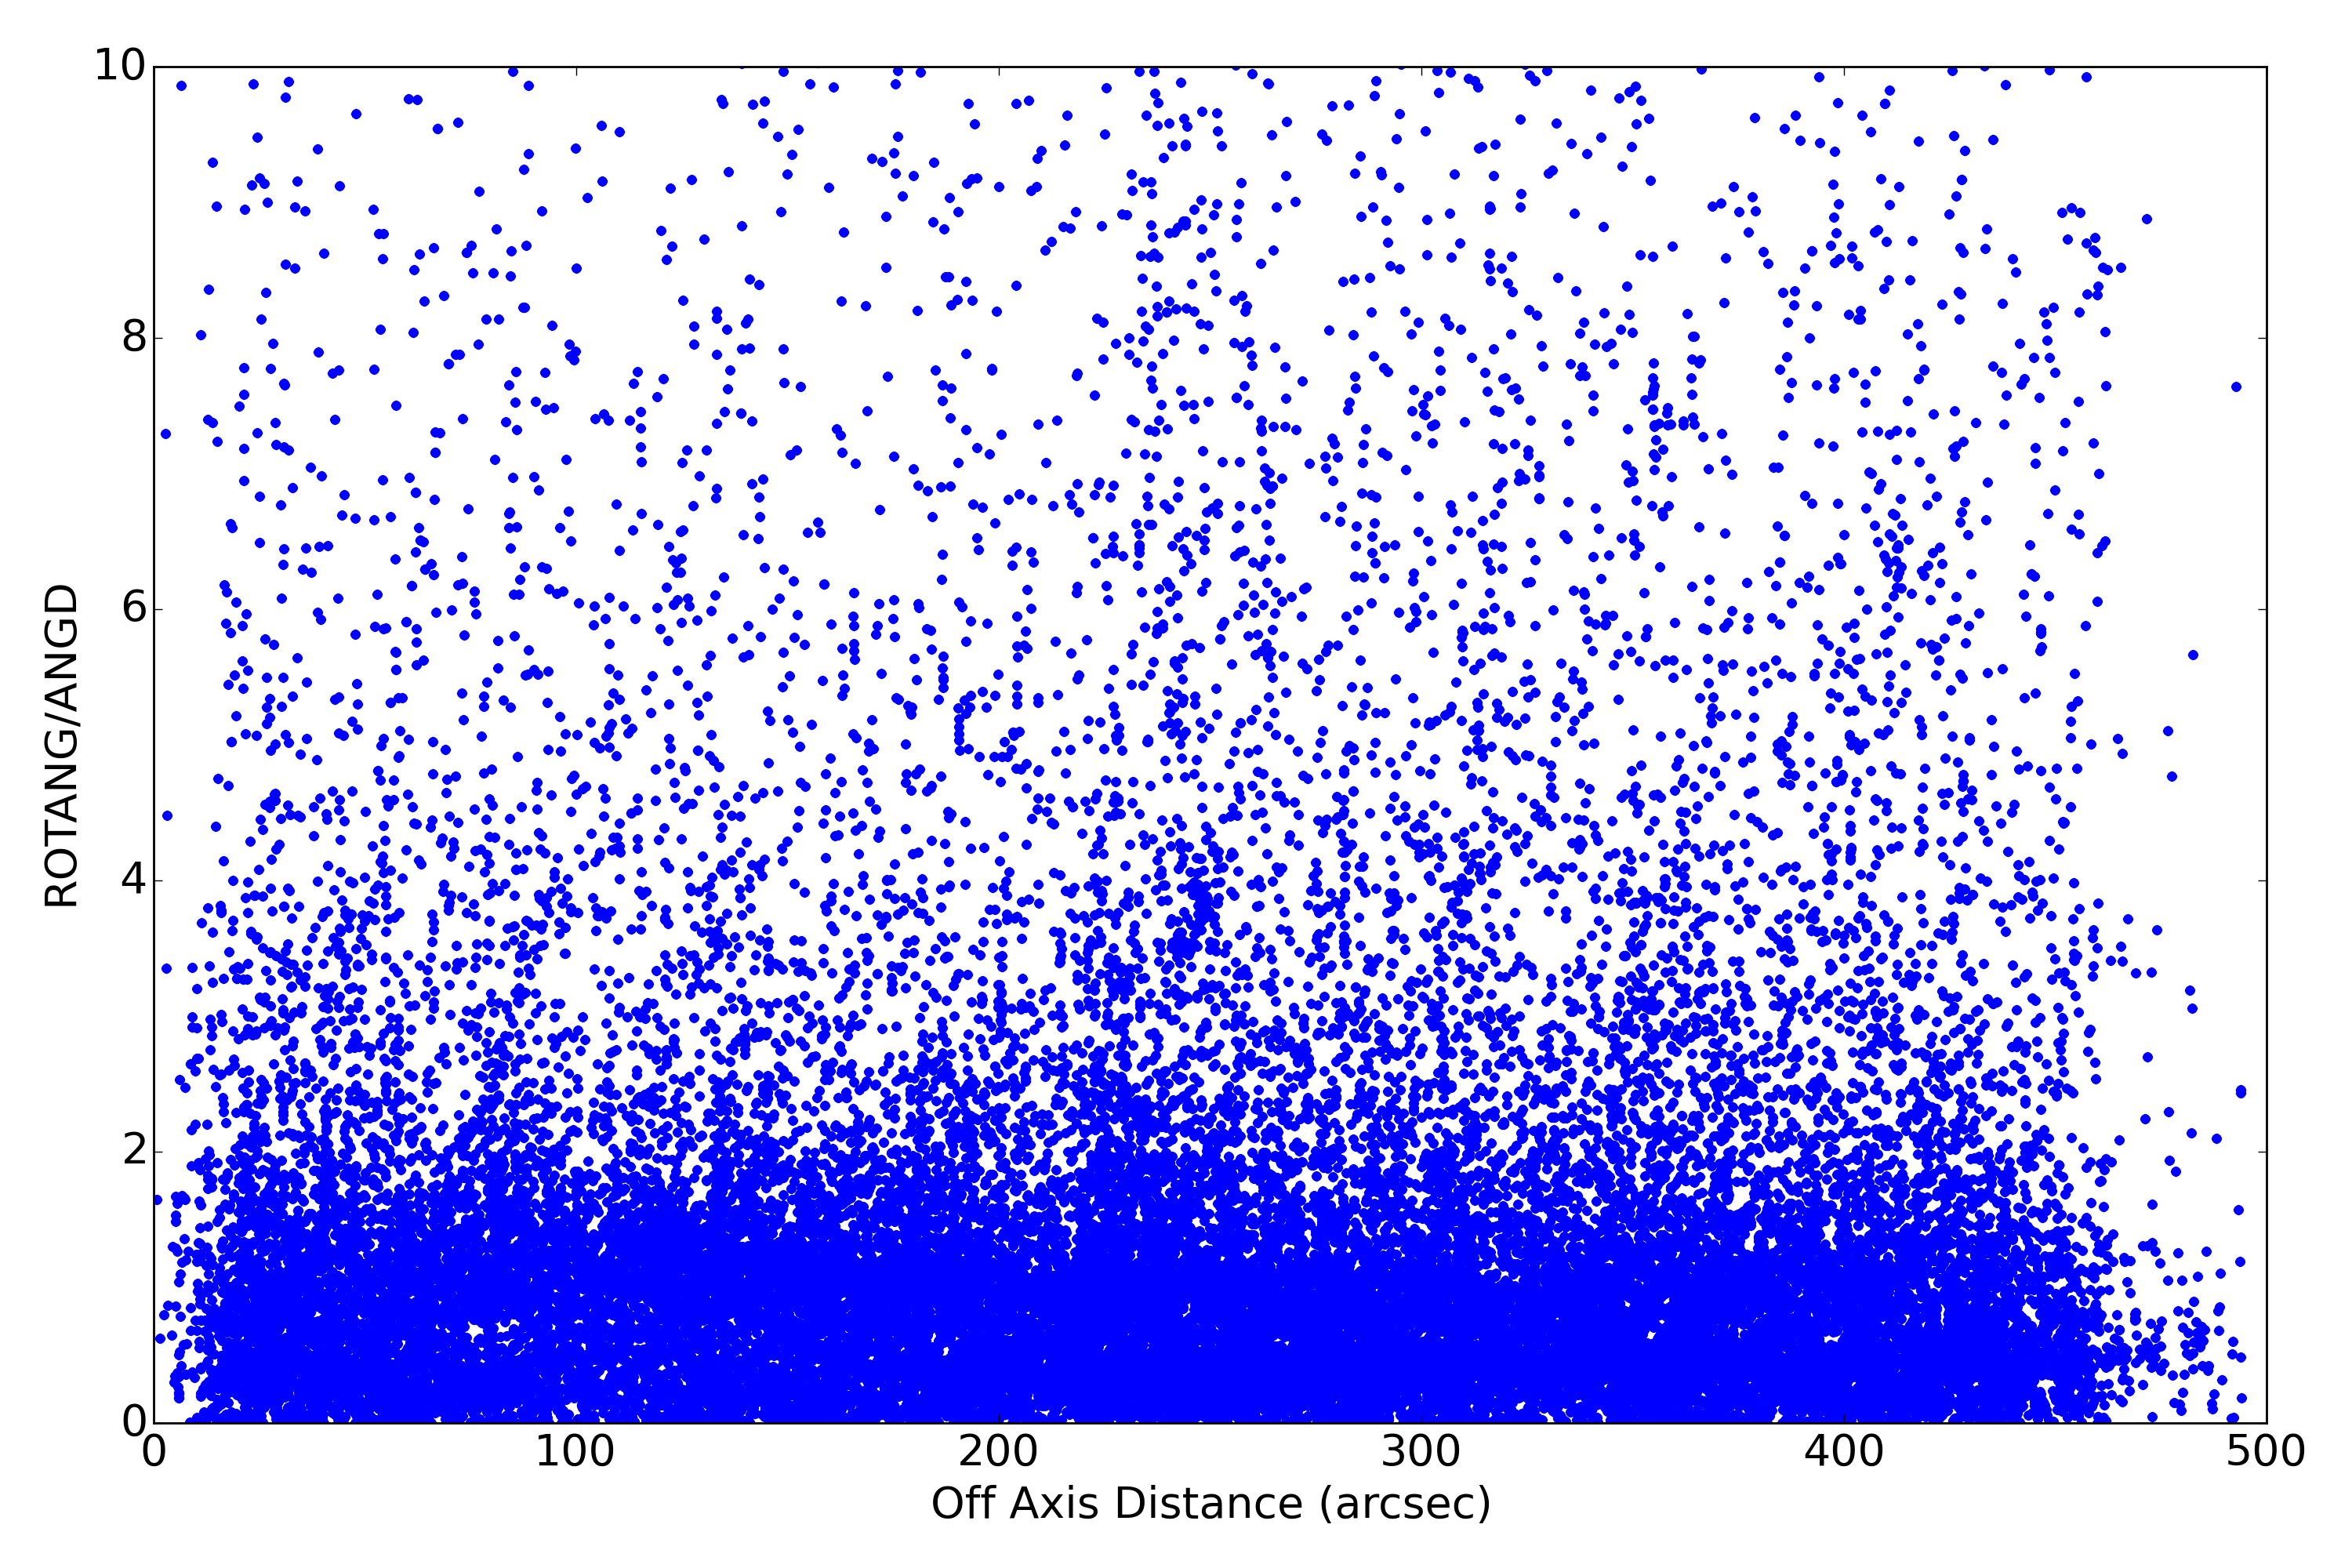 |
| ACIS S | 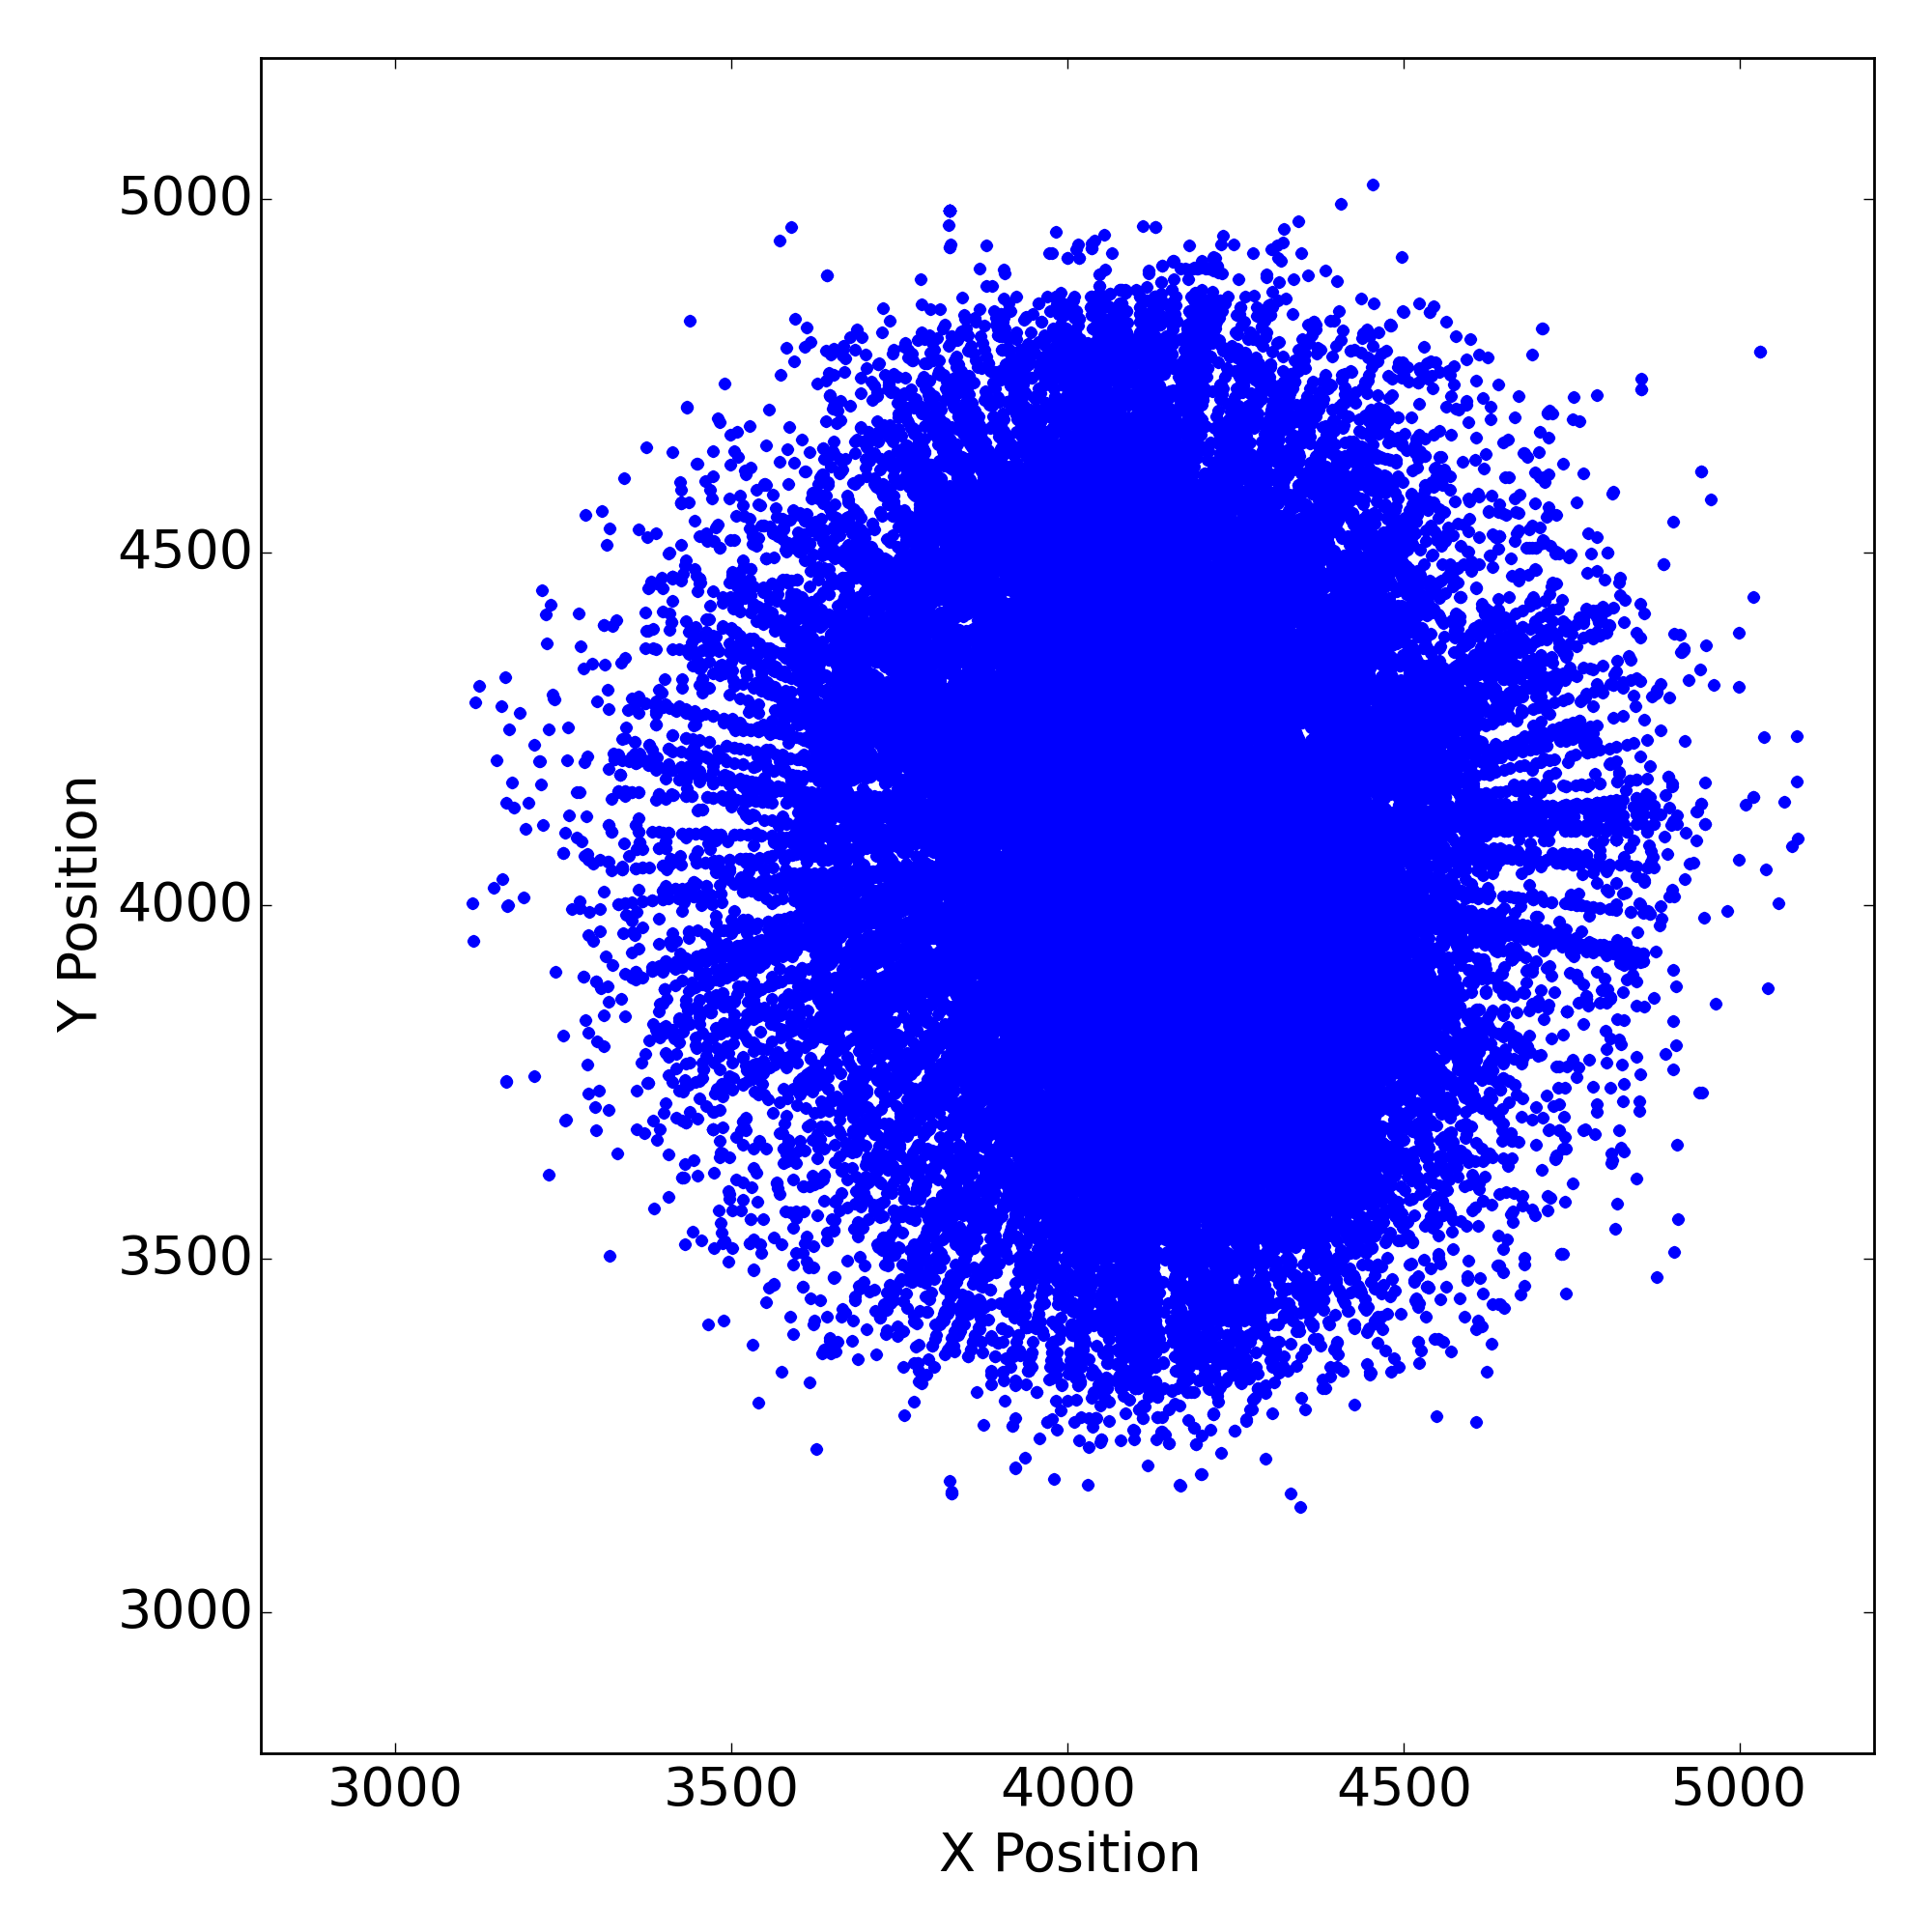 |
 |
 |
 |
 |
 |
 |
| HRC I | 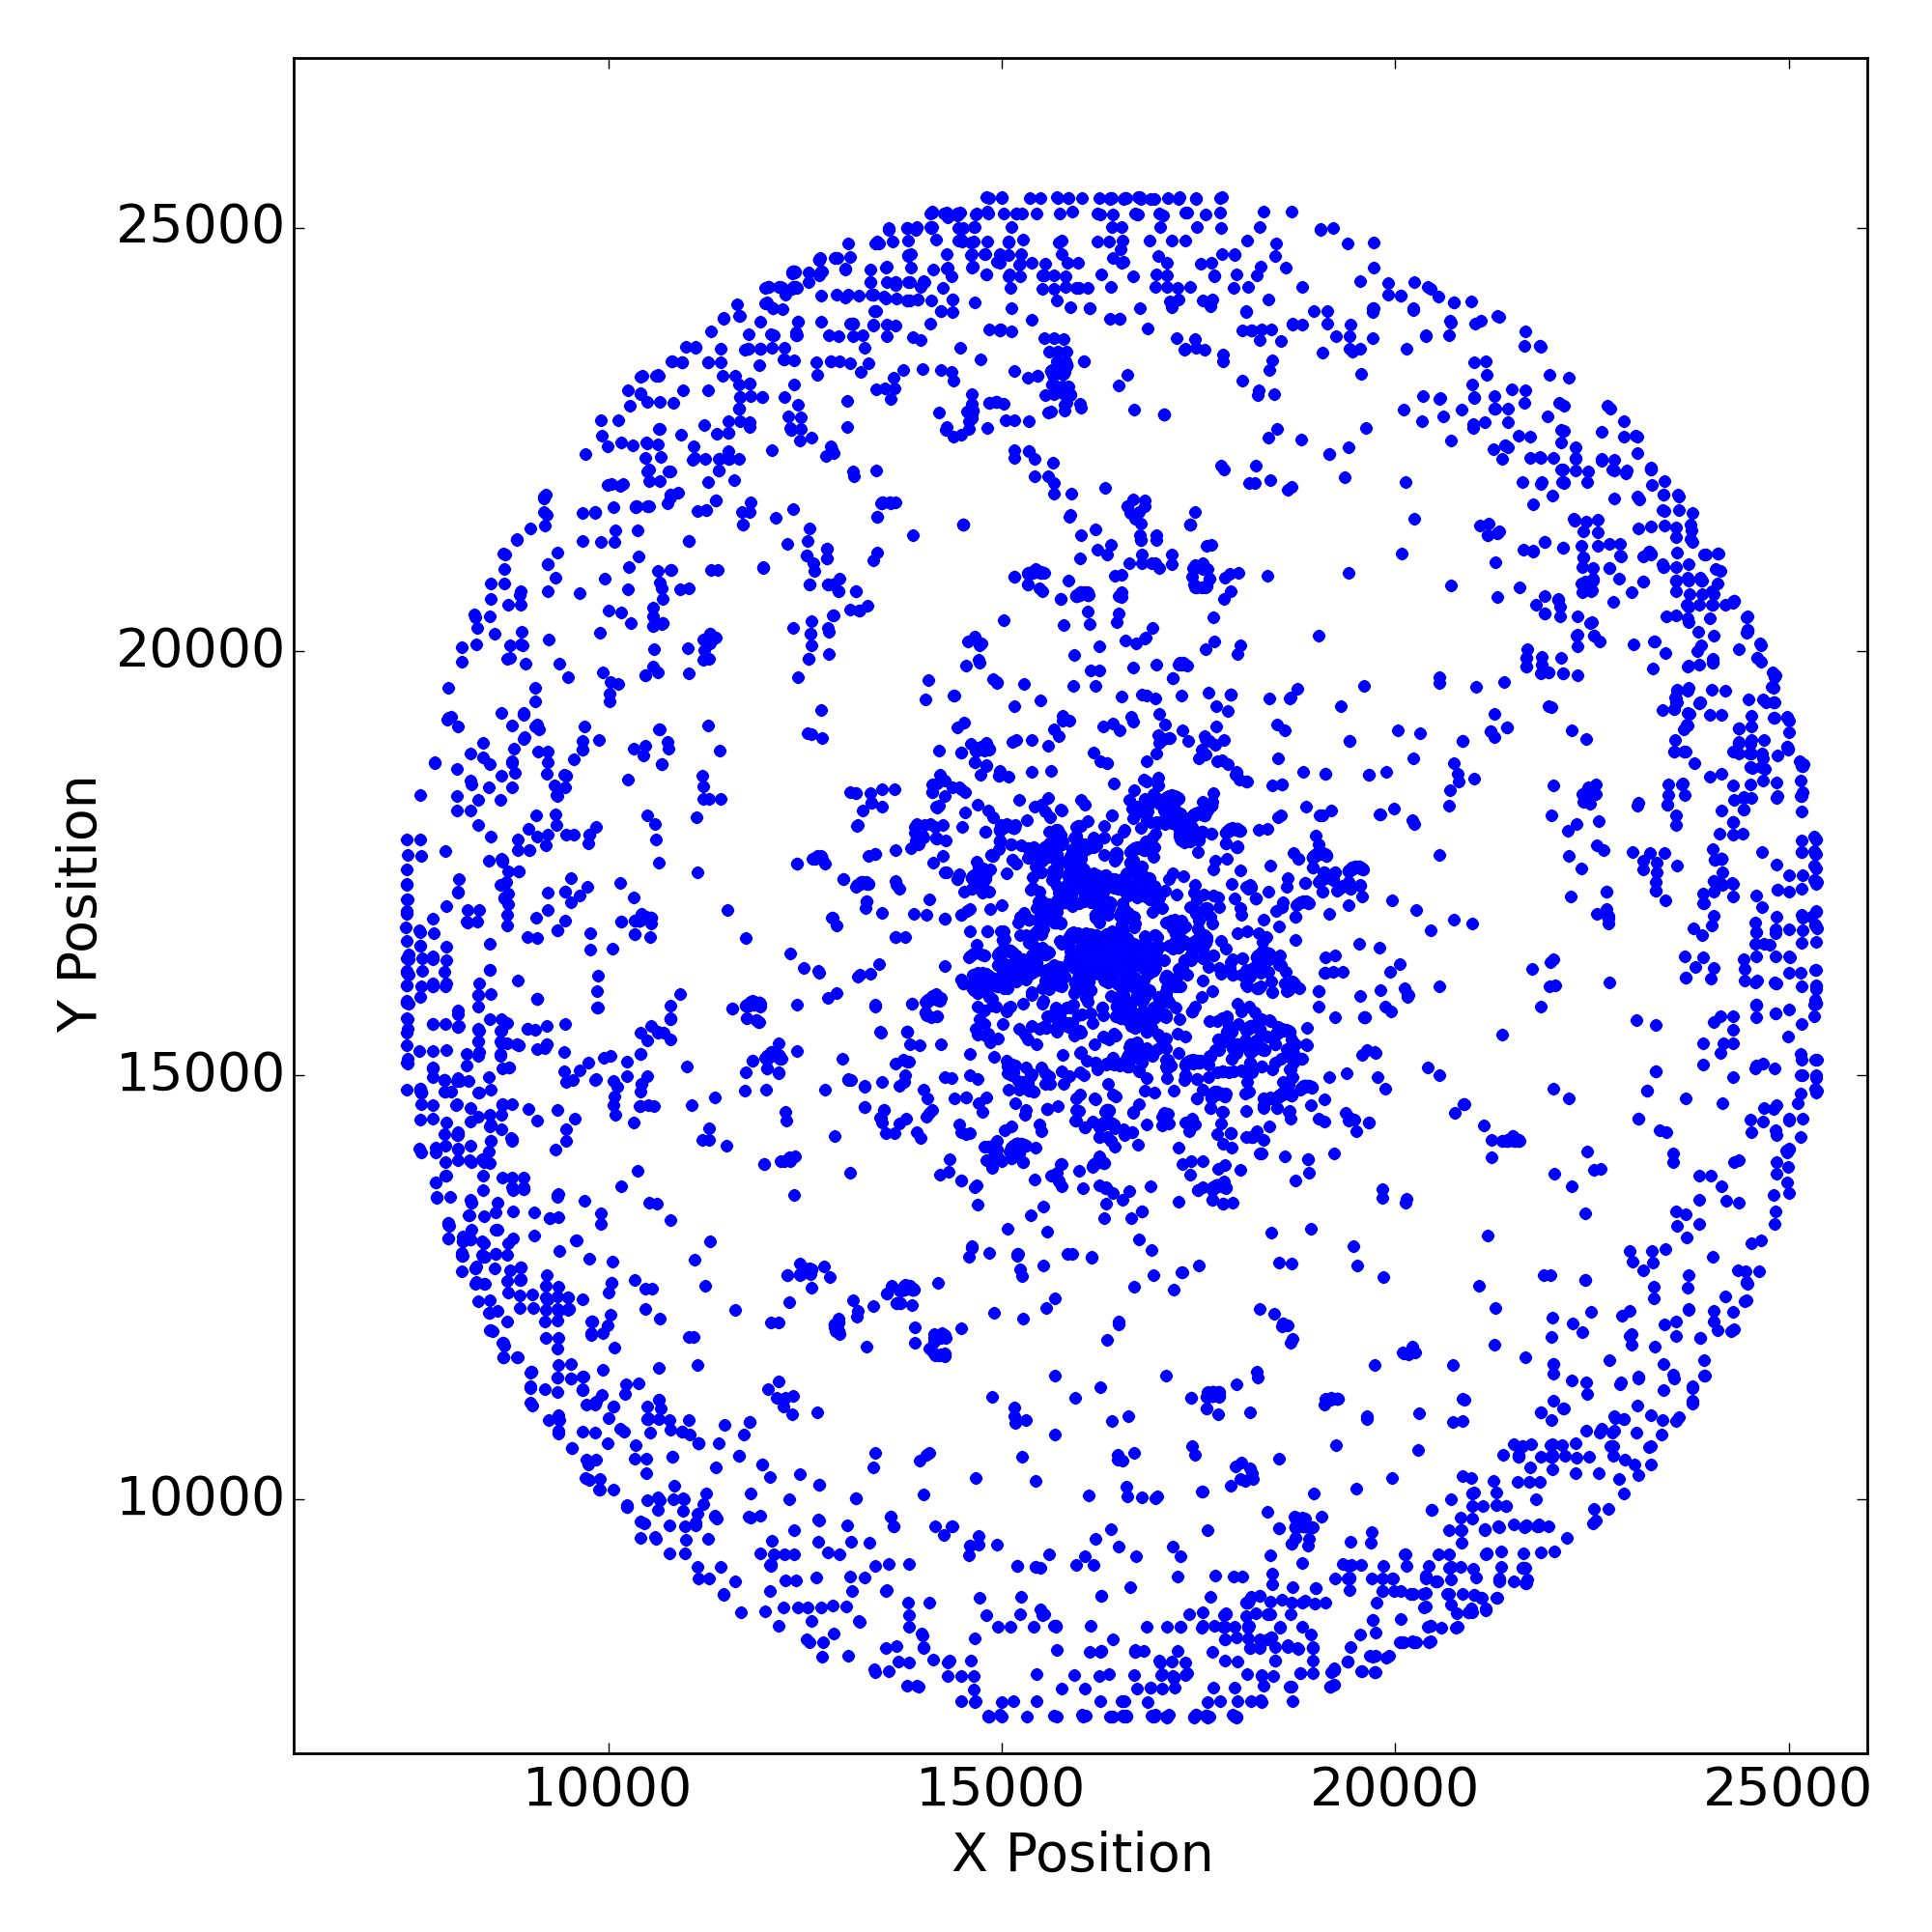 |
 |
 |
 |
 |
 |
 |
| HRC S | 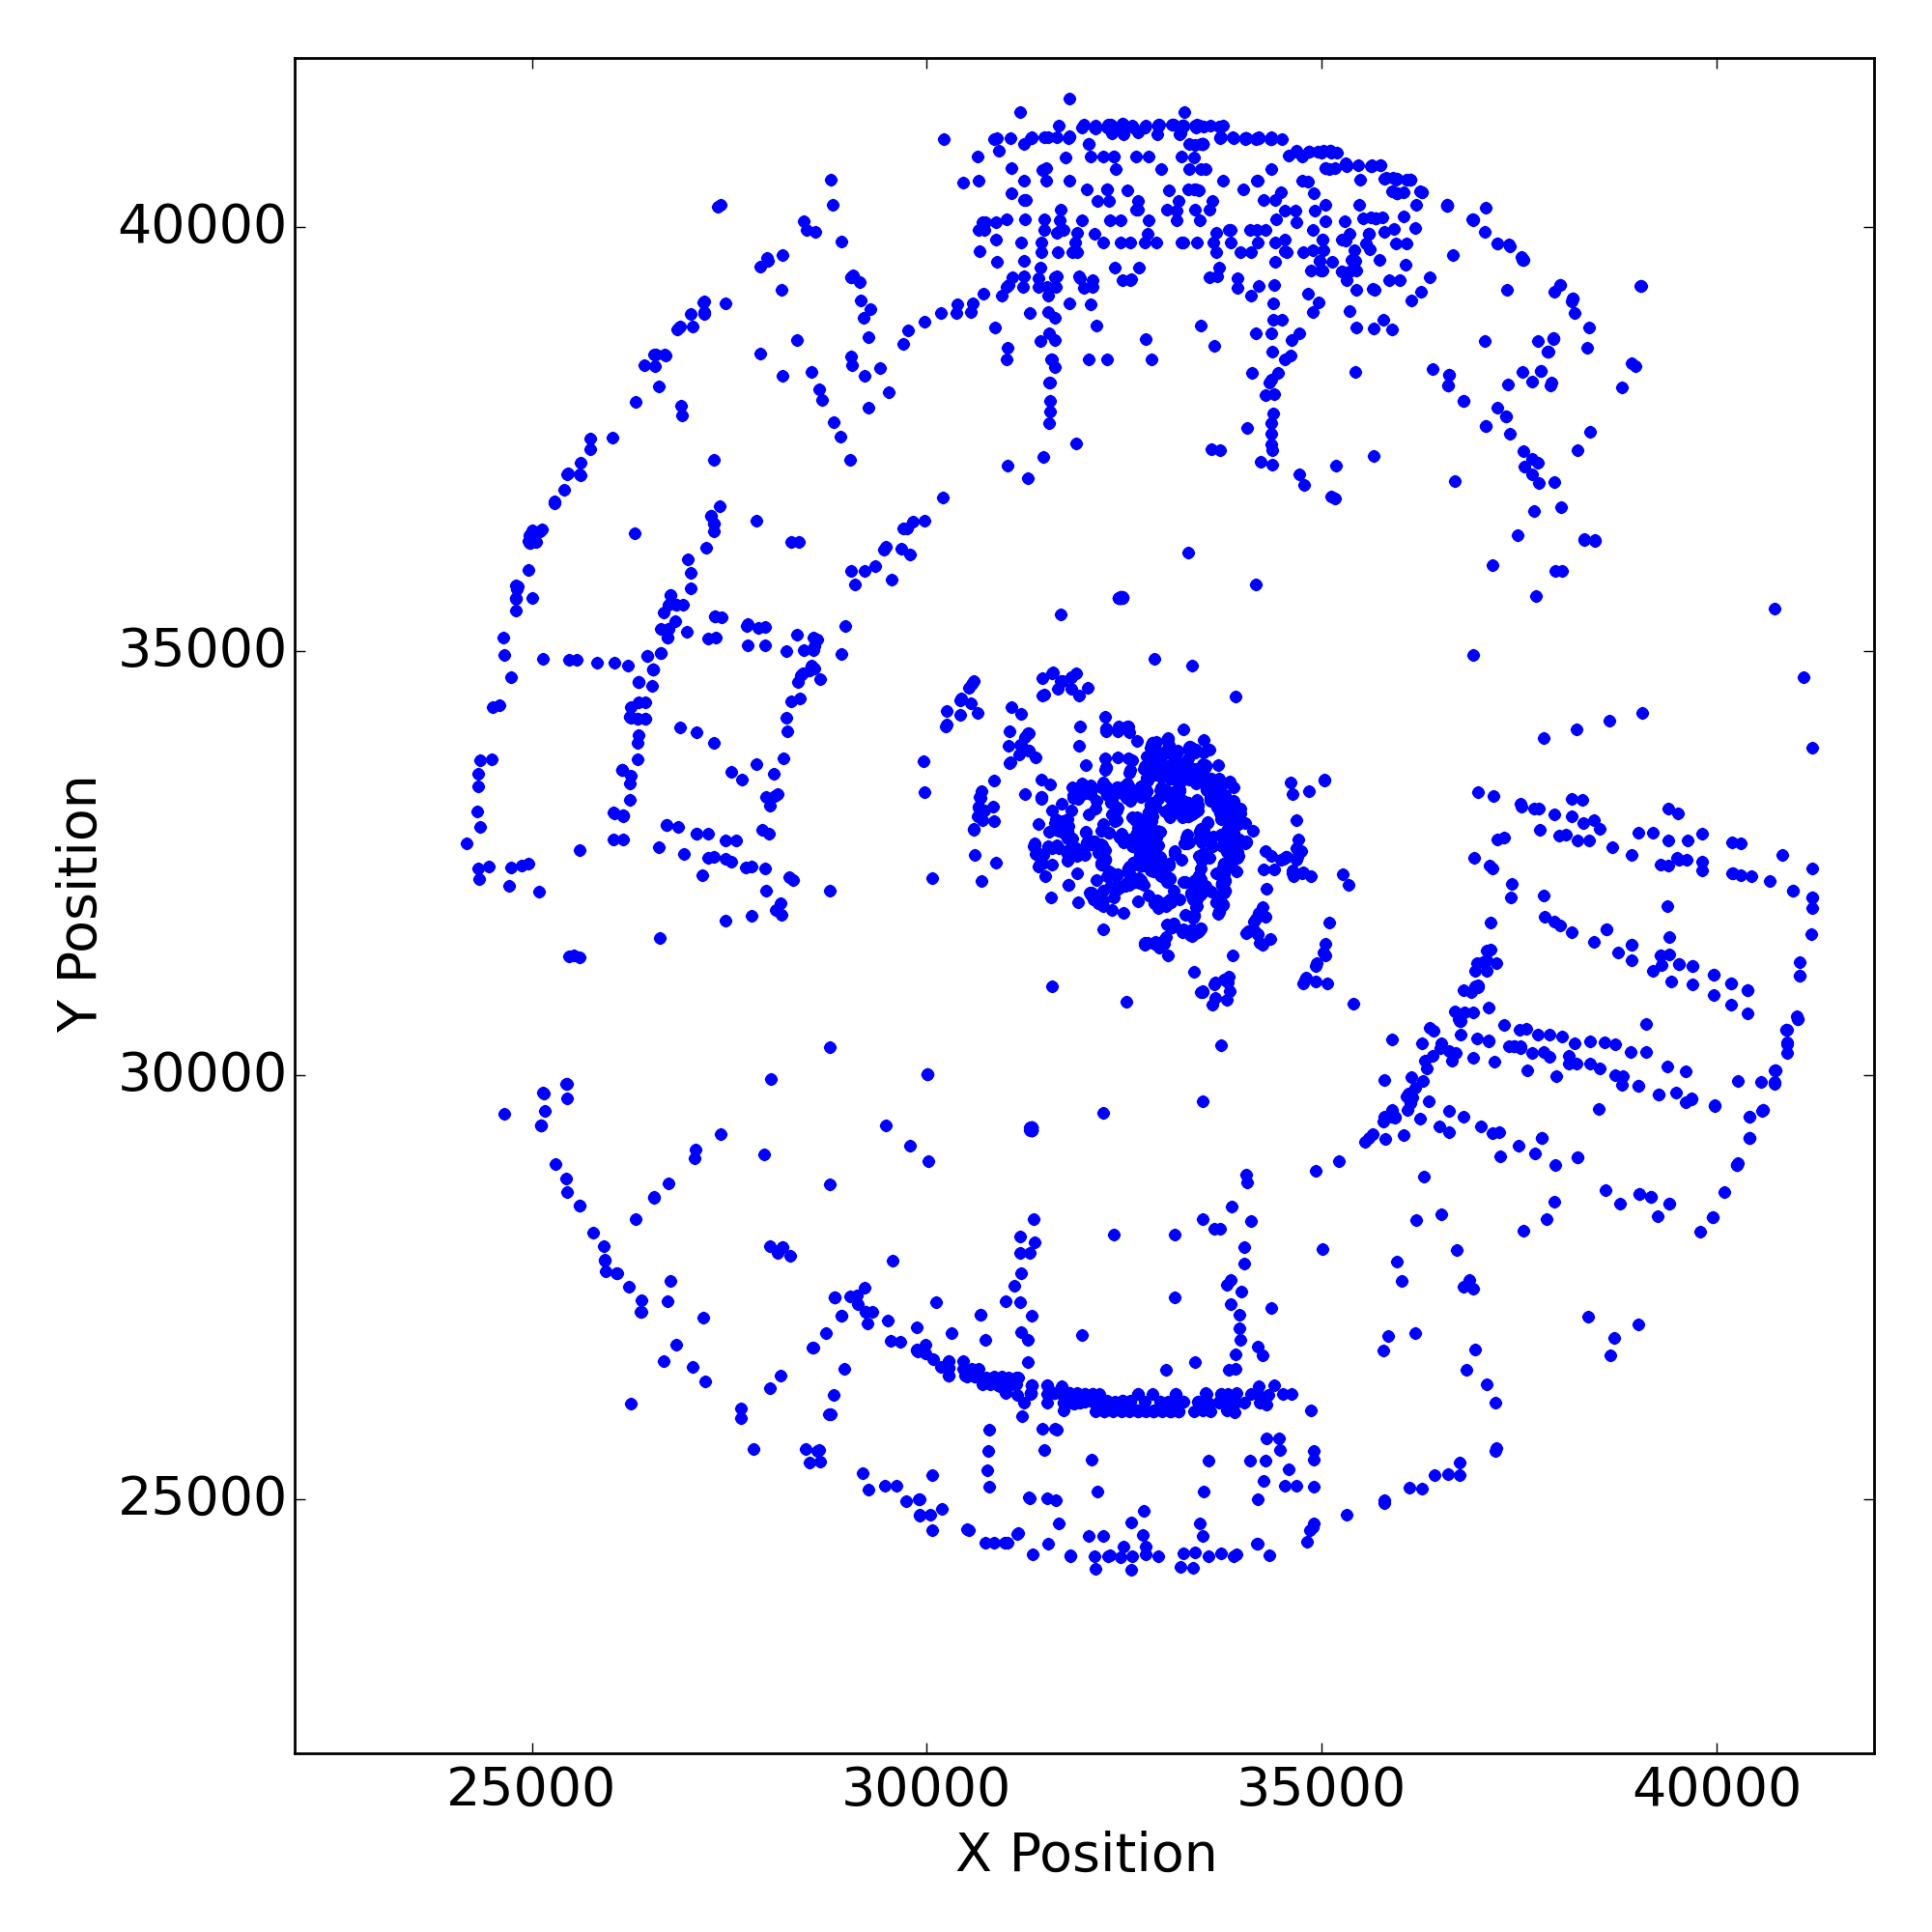 |
 |
 |
 |
 |
 |
 |
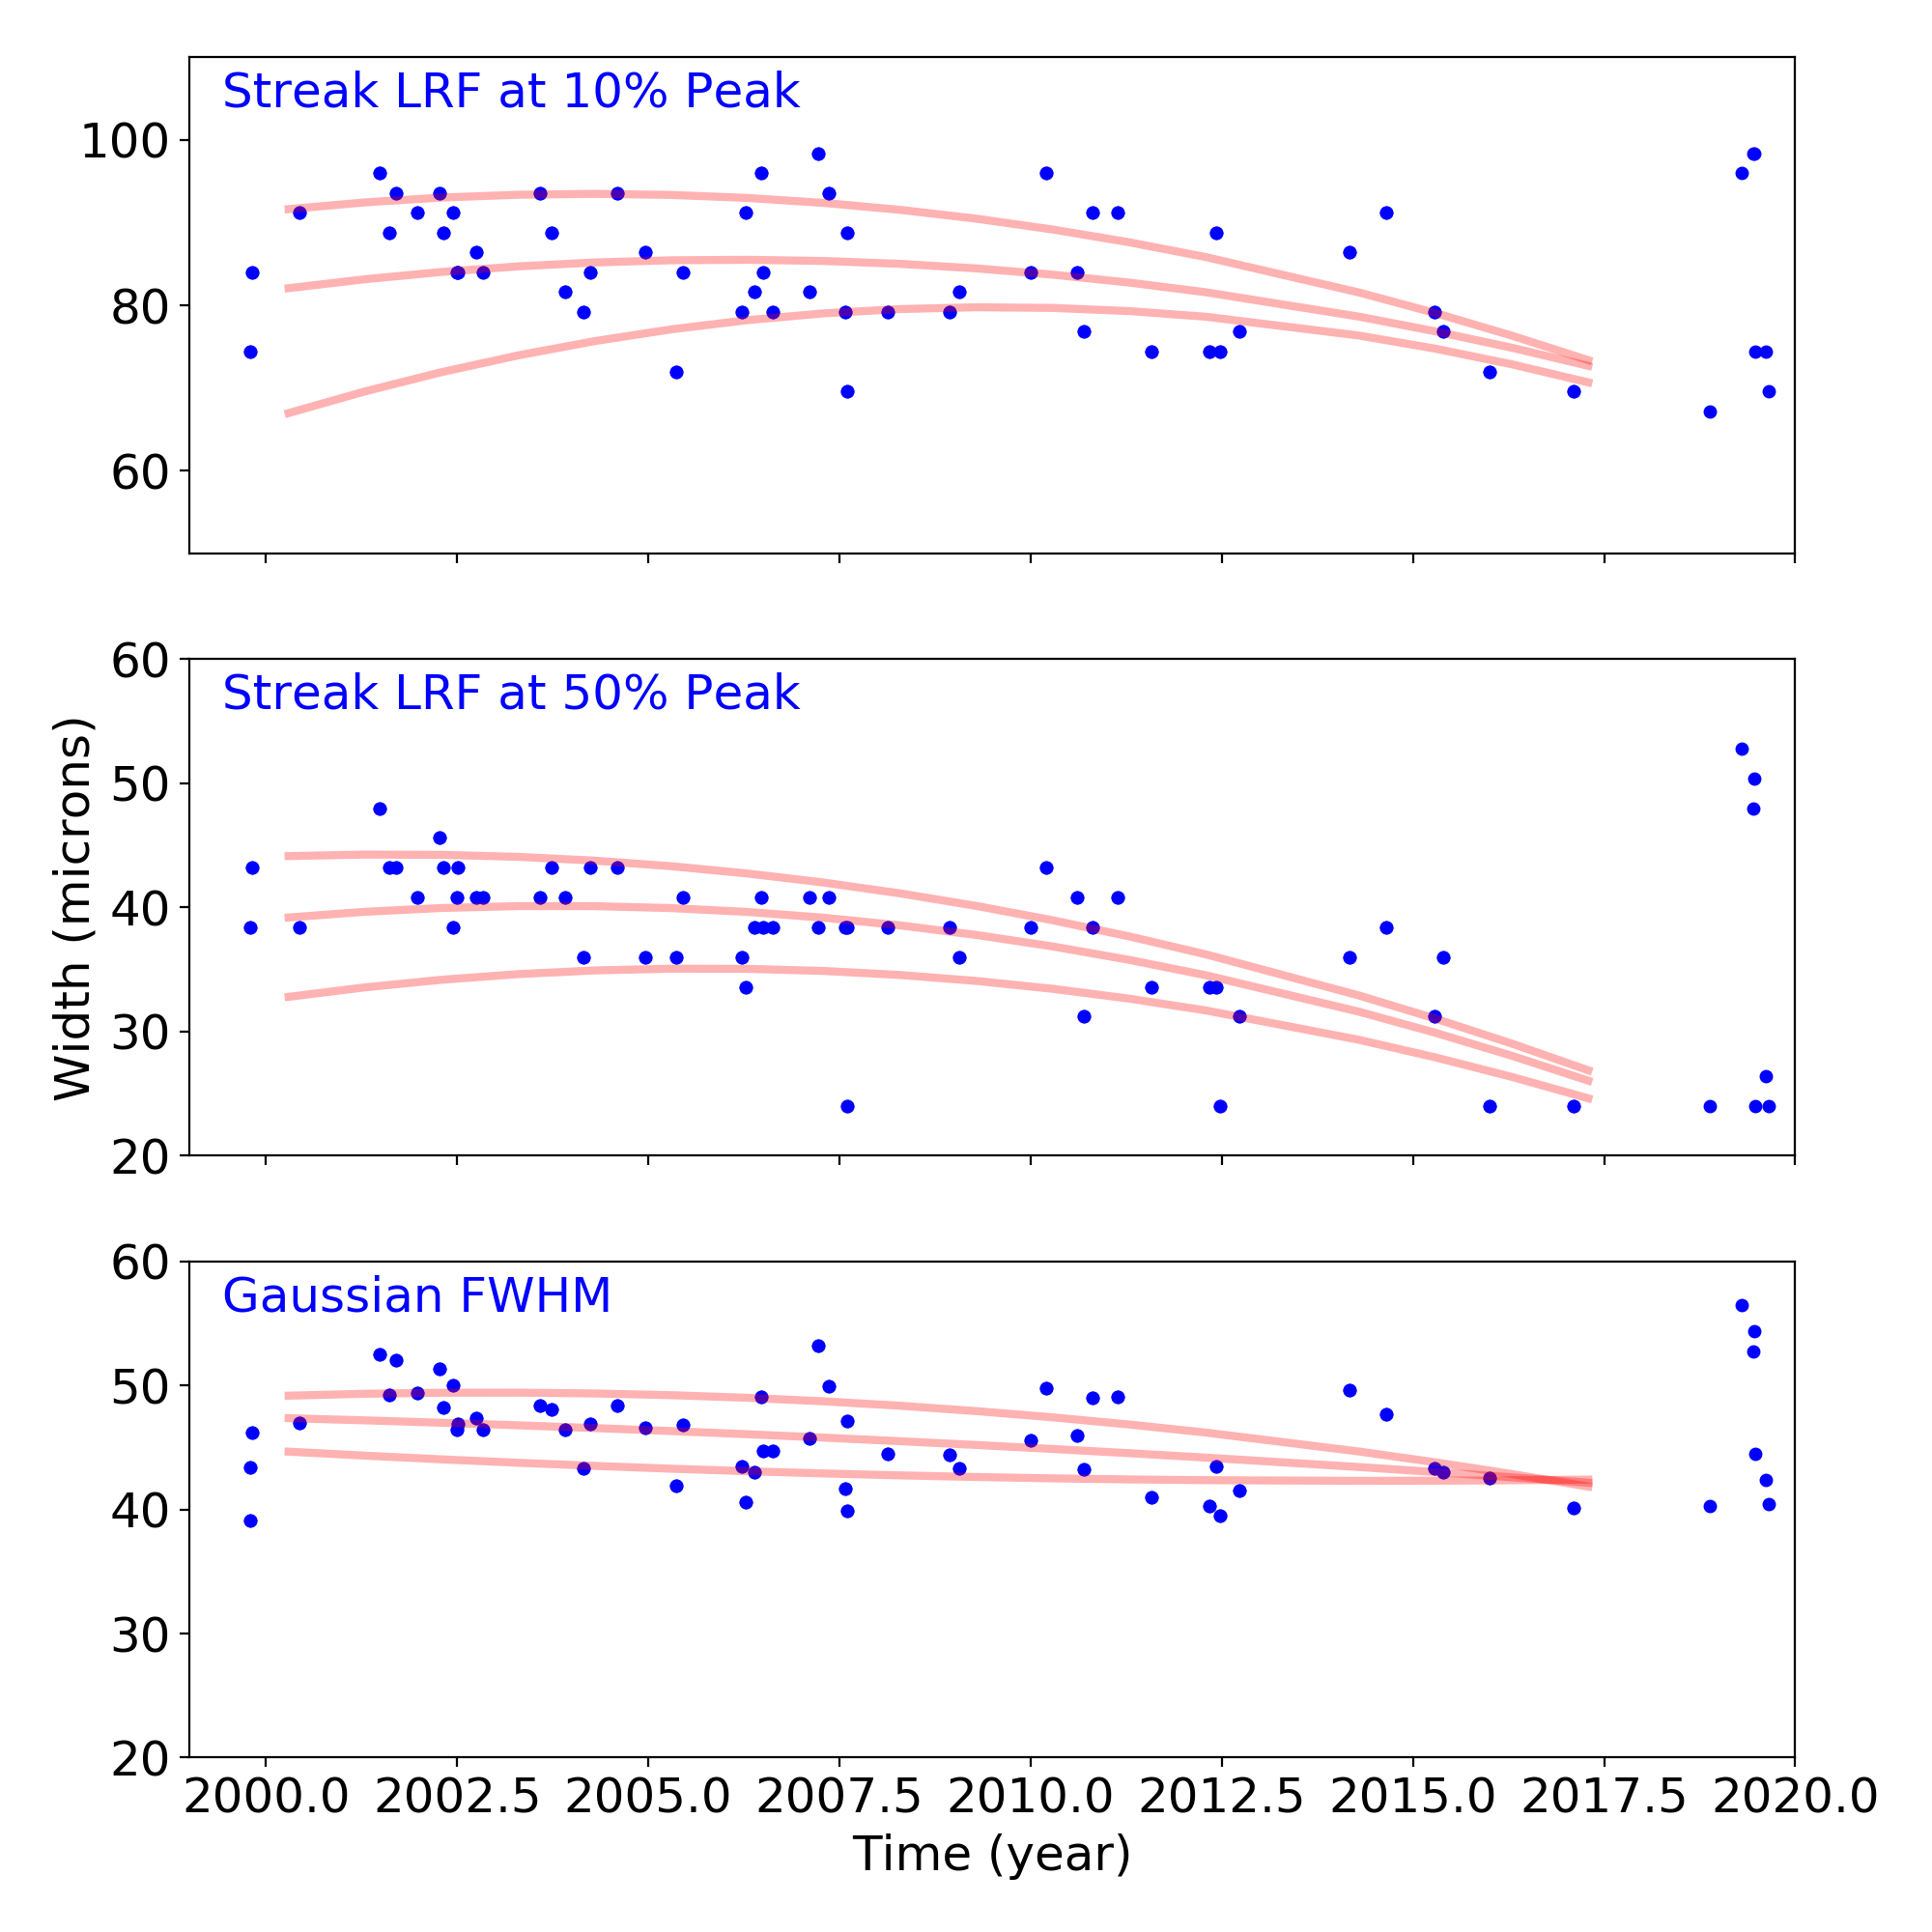
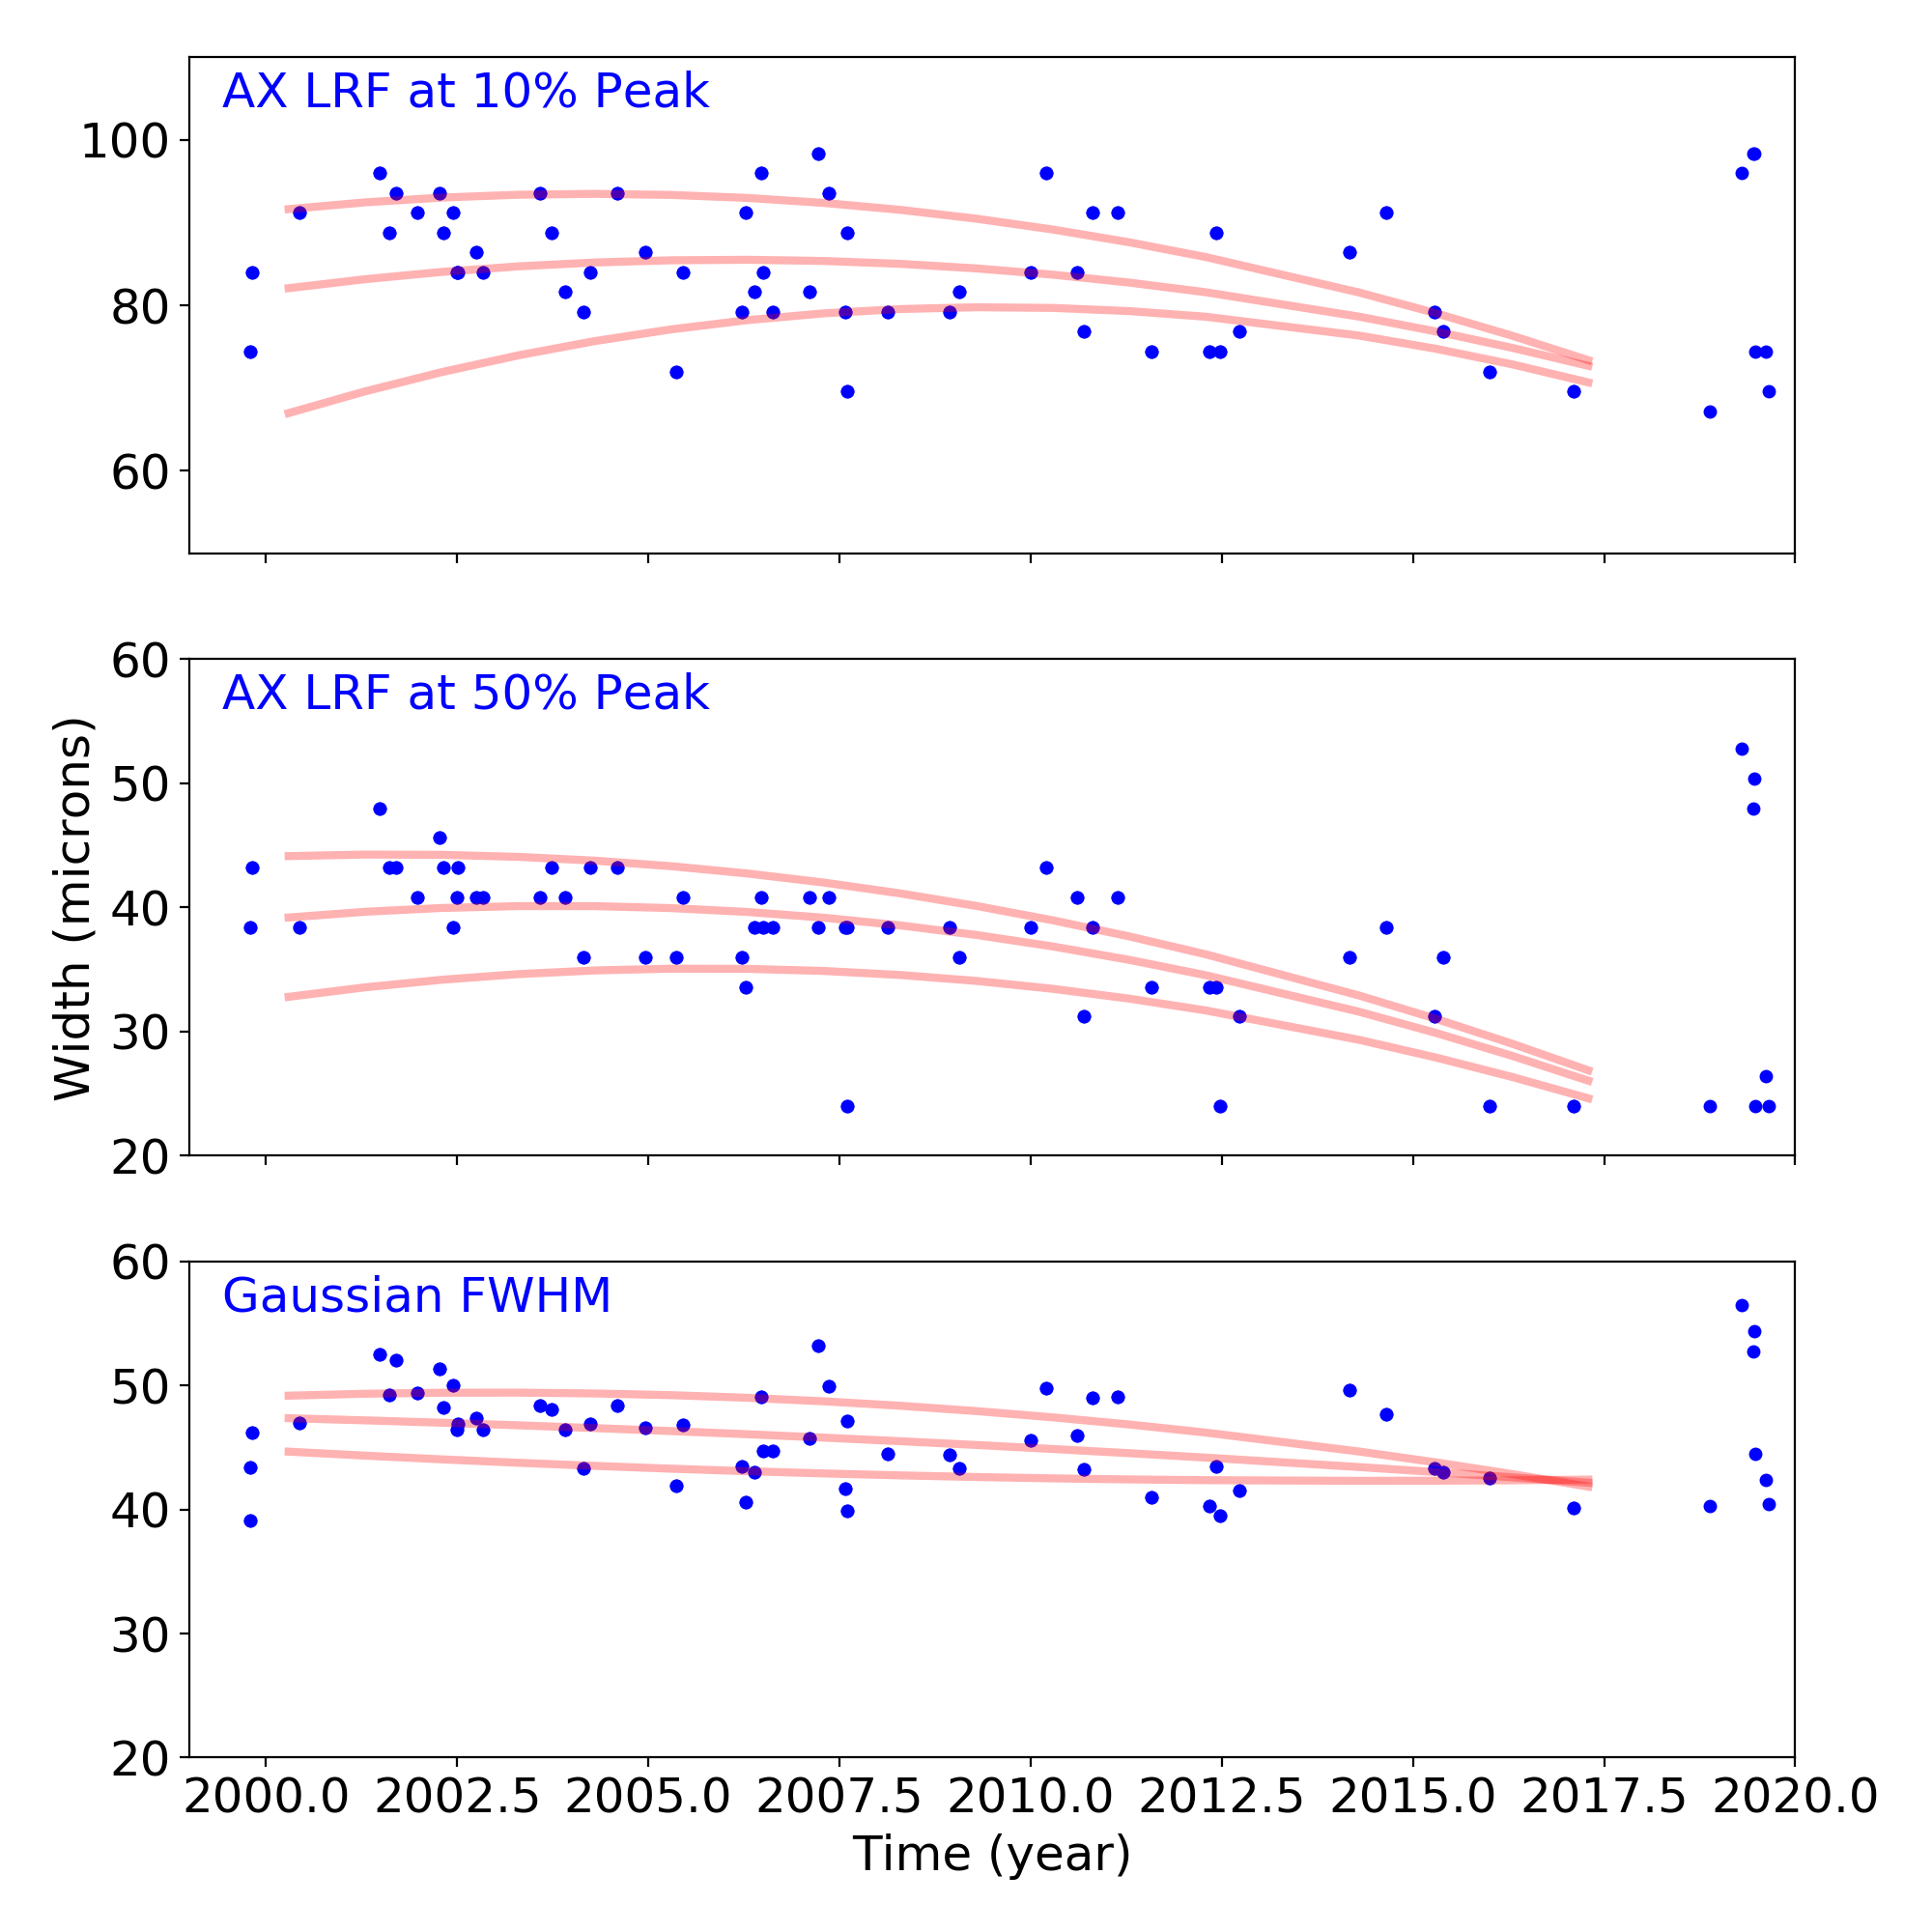
Gratings
Grating Trends/Focus
We plot the width of the zero order streak of ACIS/HETG observations and the width of the zero order image for HRC/LETG observations of point sources. No significant defocusing trend is seen at this time. See Gratings Trends pages.
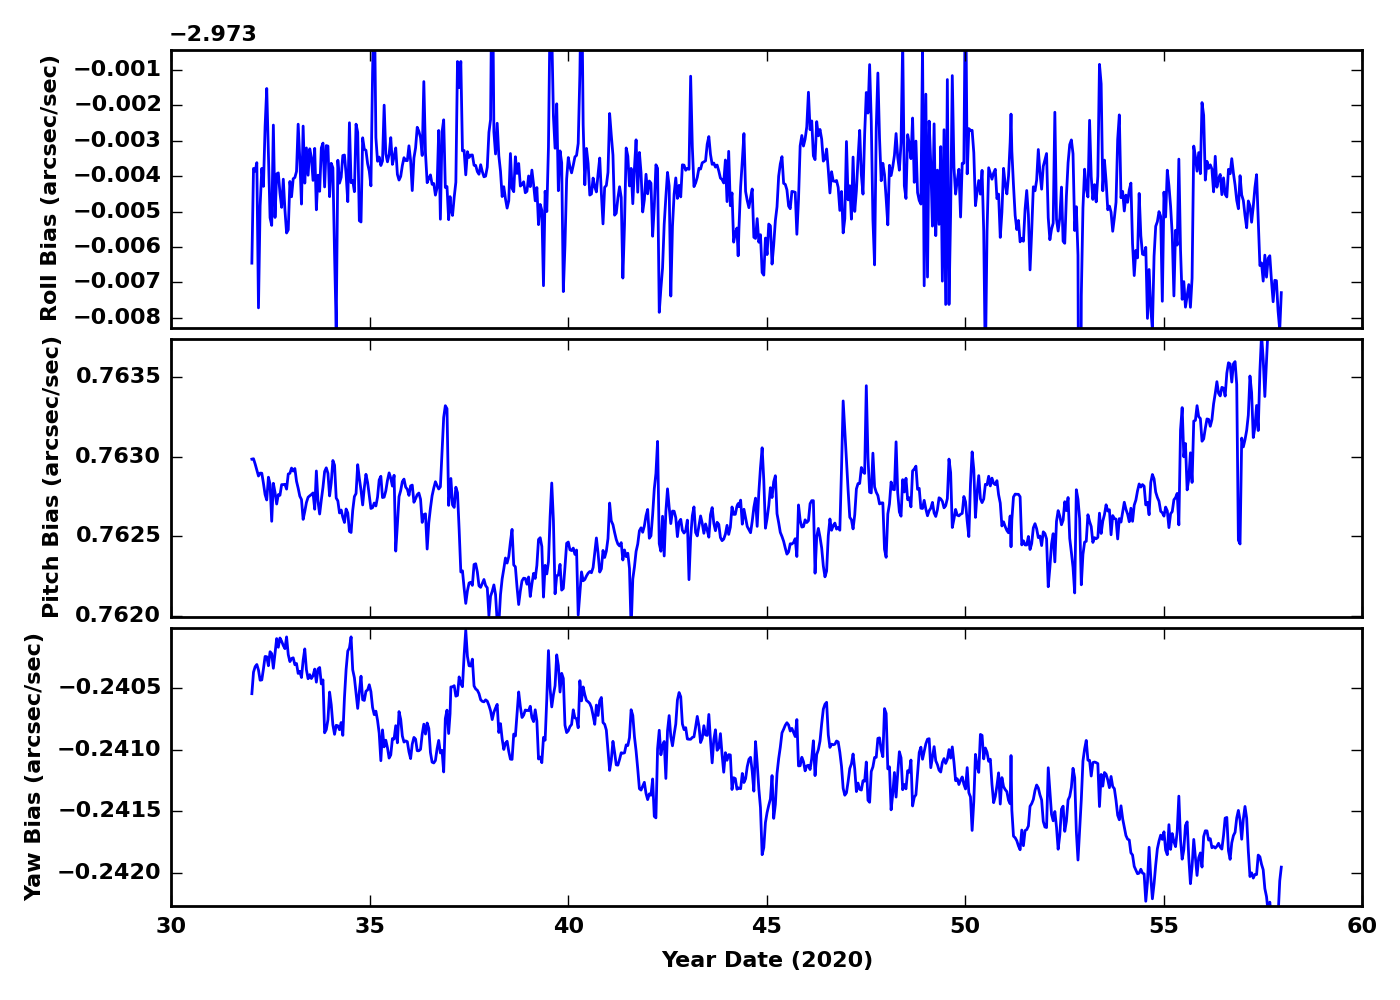
PCAD
ACA Trending
Gyro Bias Drift
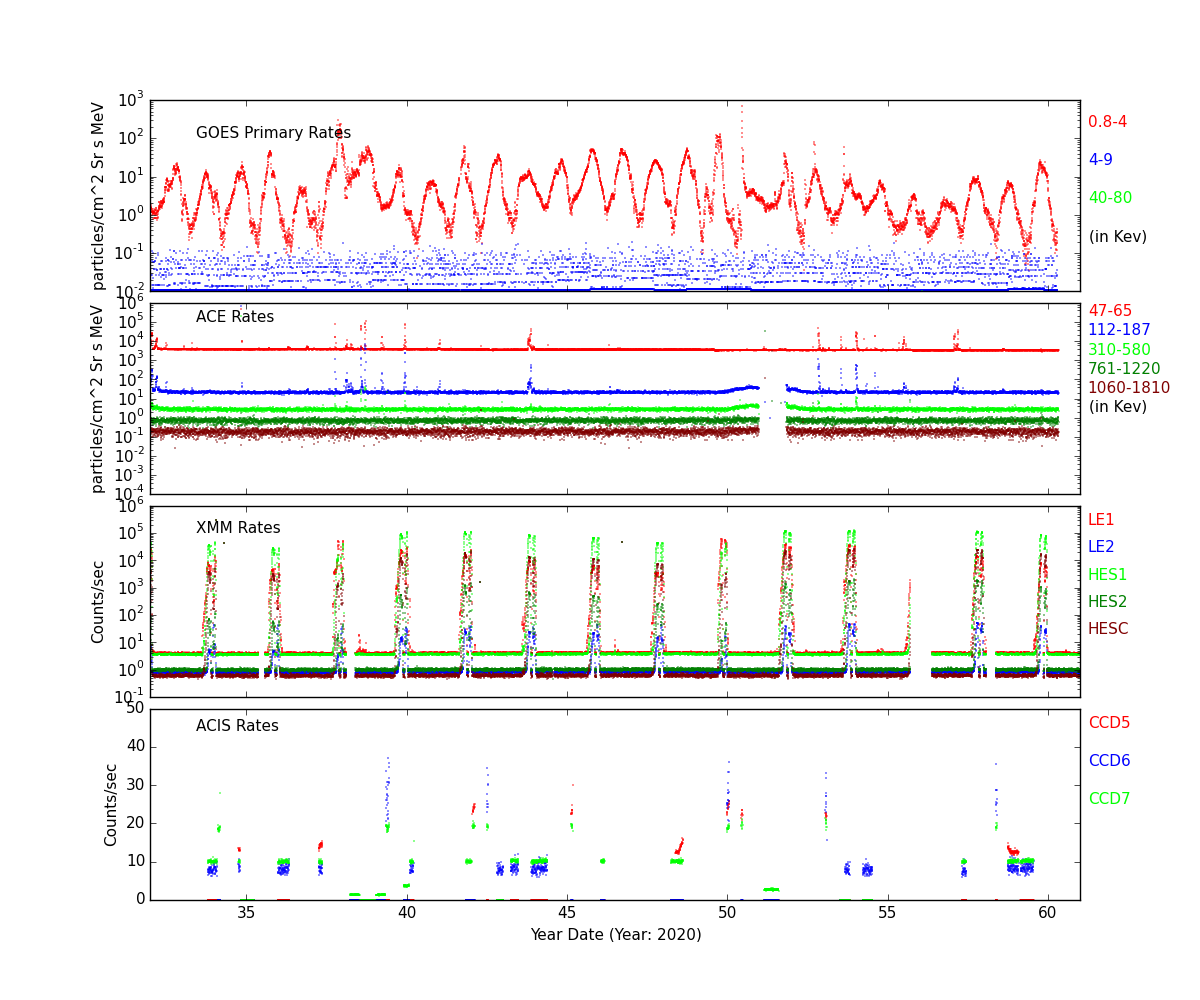
Radiation History
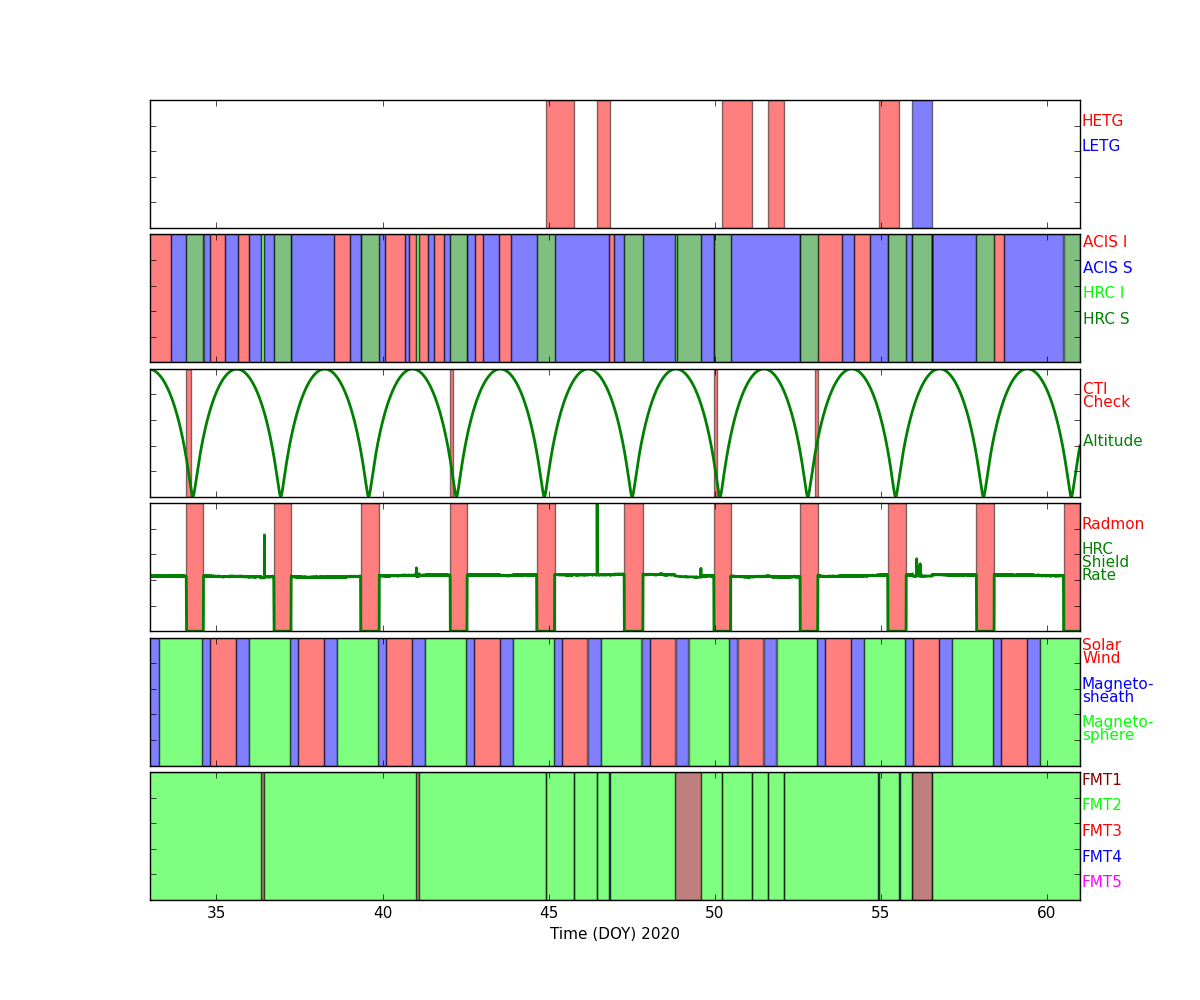
Radiation Count Rates of Feb 2020
Sun Spot History
Trending
Quarterly Trends
- HRC Temperature
| Previous Quarter | |||||||
| MSID | MEAN | RMS | DELTA/YR | DELTA/YR/YR | UNITS | DESCRIPTION | |
| 2ceahvpt | -0.011 | 8.702e-04 | (3.02+/-0.02)e2 | 0.36 +/- 0.58 | K | CEA RADIATOR TEMPERATURE AT CENTER | |
|---|---|---|---|---|---|---|---|
| 2chtrpzt | -0.009 | 8.662e-04 | (2.98+/-0.02)e2 | 0.32 +/- 0.59 | K | CENTRAL ELECTRONICS BOX TEMP | |
| 2condmxt | -0.010 | 0.001 | (2.95+/-0.02)e2 | 0.65 +/- 0.70 | K | CONDUIT -X FACE TEMPERATURE | |
| 2dcentrt | -0.010 | 7.827e-04 | (2.94+/-0.02)e2 | 0.80 +/- 0.55 | K | DETECTOR HOUSING TEMP 2 | |
| 2dtstatt | -0.009 | 7.765e-04 | (2.95+/-0.02)e2 | 0.85 +/- 0.54 | K | DETECTOR HOUSING TEMP 1 | |
| 2fhtrmzt | -0.009 | 8.718e-04 | (2.97+/-0.02)e2 | 1.20 +/- 0.58 | K | FRONT END ELECTRONICS BOX TEMPERATURE | |
| 2fradpyt | -0.009 | 9.115e-04 | (2.92+/-0.02)e2 | 1.32 +/- 0.60 | K | FRONT END ASSEMBLY +Y AT RADIATOR CENTER TEMP | |
| 2pmt1t | -0.011 | 0.001 | (2.97+/-0.03)e2 | 0.70 +/- 0.74 | K | PMT 1 TEMPERATURE | |
| 2pmt2t | -0.011 | 0.001 | (2.99+/-0.03)e2 | 0.28 +/- 0.81 | K | PMT 2 TEMPERATURE | |
| 2uvlspxt | -0.009 | 9.437e-04 | (2.91+/-0.02)e2 | 0.70 +/- 0.69 | K | UV LIGHT SHIELD NEXT TO SNOUT TEMP | |
- HRC HK
| Previous Quarter | |||||||
| MSID | MEAN | RMS | DELTA/YR | DELTA/YR/YR | UNITS | DESCRIPTION | |
| 2fe00atm | -0.007 | 6.671e-04 | 22.93 +/- 1.55 | 0.63 +/- 0.45 | C | Front end temperature | |
|---|---|---|---|---|---|---|---|
| 2fepratm | -0.008 | 7.322e-04 | 25.69 +/- 1.67 | 0.64 +/- 0.51 | C | FE temp card temperature | |
| 2imhvatm | -0.003 | 6.825e-04 | 32.81 +/- 1.56 | 0.34 +/- 0.45 | C | Imaging det HVPS temperature | |
| 2iminatm | -0.007 | 7.138e-04 | 20.68 +/- 1.64 | 0.81 +/- 0.52 | C | Imaging det temperature | |
| 2lvplatm | -0.006 | 6.569e-04 | 29.30 +/- 1.53 | 0.80 +/- 0.45 | C | LVPS plate temperature | |
| 2prbscr | 1.107e-04 | 1.474e-05 | 1.55 +/- 0.03 | -0.02 +/- 0.01 | AMP | Primary bus current | |
| 2prbsvl | -0.002 | 4.805e-05 | 27.05 +/- 0.13 | 0.03 +/- 0.02 | V | Primary bus voltage | |
| 2smtratm | -1.961e-04 | 1.414e-05 | 5.77 +/- 0.03 | 0.01 +/- 0.01 | C | Selected motor temperature | |
| 2sphvatm | -0.014 | 7.681e-04 | 33.22 +/- 1.86 | 0.75 +/- 0.46 | C | Spect det HVPS temperature | |
| 2spinatm | -0.008 | 7.237e-04 | 21.98 +/- 1.67 | 1.02 +/- 0.53 | C | Spect det temperature | |
- PCAD Temperature
| Previous Quarter | |||||||
| MSID | MEAN | RMS | DELTA/YR | DELTA/YR/YR | UNITS | DESCRIPTION | |
| aacccdpt | 0.006 | 4.610e-04 | (2.64+/-0.01)e2 | -0.79 +/- 0.36 | K | AC CCD TEMP (PRI) | |
|---|---|---|---|---|---|---|---|
| aacccdrt | 0.007 | 4.983e-04 | (3.08+/-0.01)e2 | -0.88 +/- 0.40 | K | AC CCD TEMP (RDNT) | |
| aach1t | 0.006 | 4.793e-04 | (3.05+/-0.01)e2 | -0.91 +/- 0.39 | K | AC HOUSING TEMP (ACH1) | |
| aach2t | 0.006 | 4.775e-04 | (3.05+/-0.01)e2 | -0.86 +/- 0.39 | K | AC HOUSING TEMP (ACH2) | |
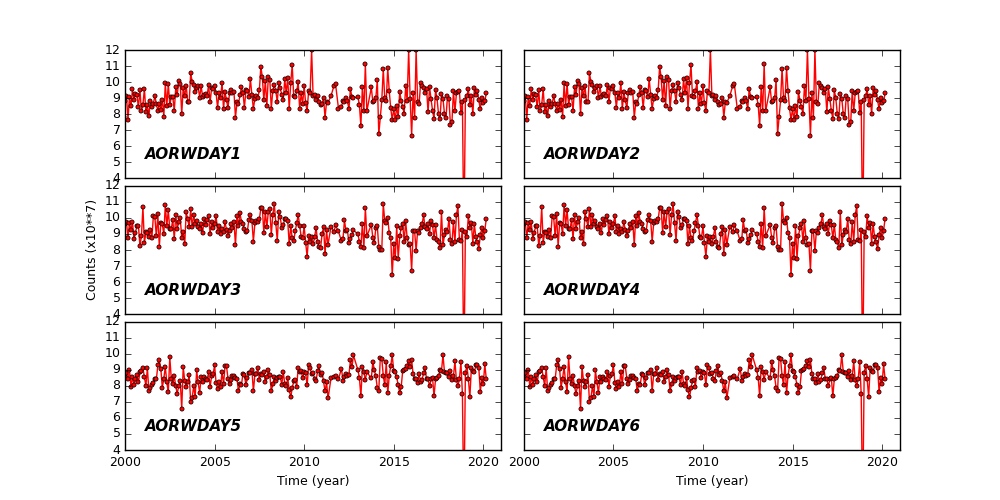
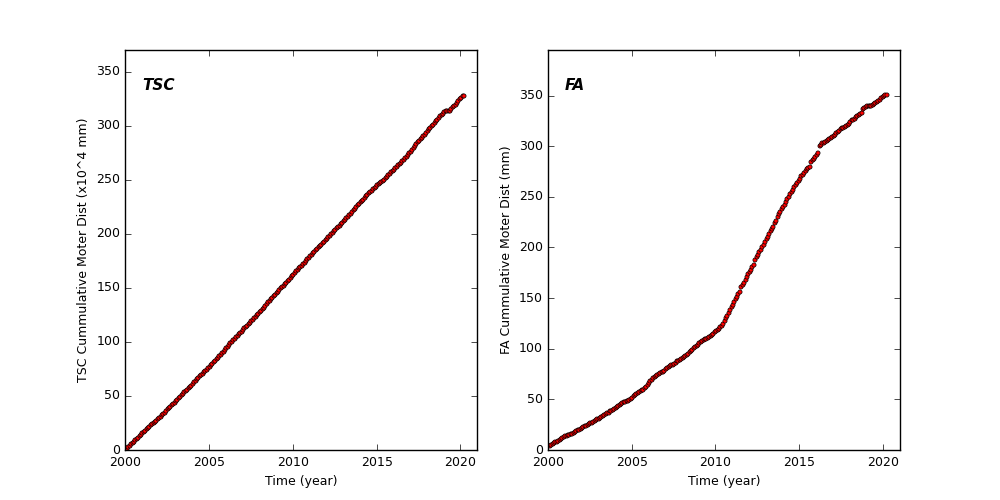
Spacecraft Motions
TSC and FA Cummulative Moter Distance
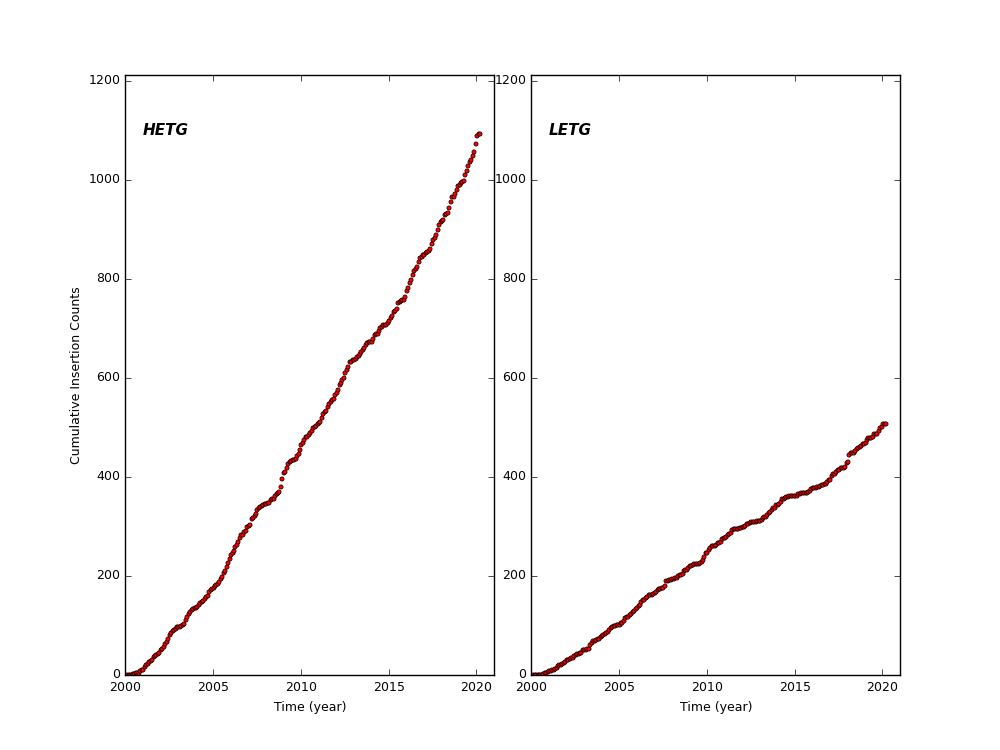
HETG and LETG Cummulative Insertion Counts
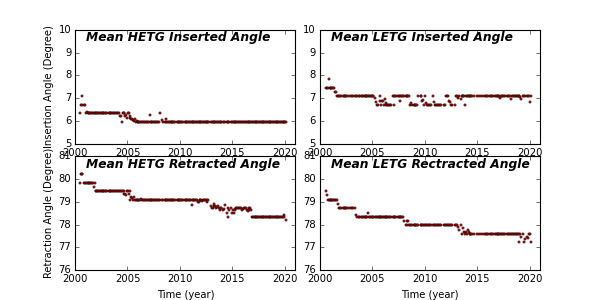
HETG/LETG Insertion/Retraction Angle
Reaction Wheel Rotations