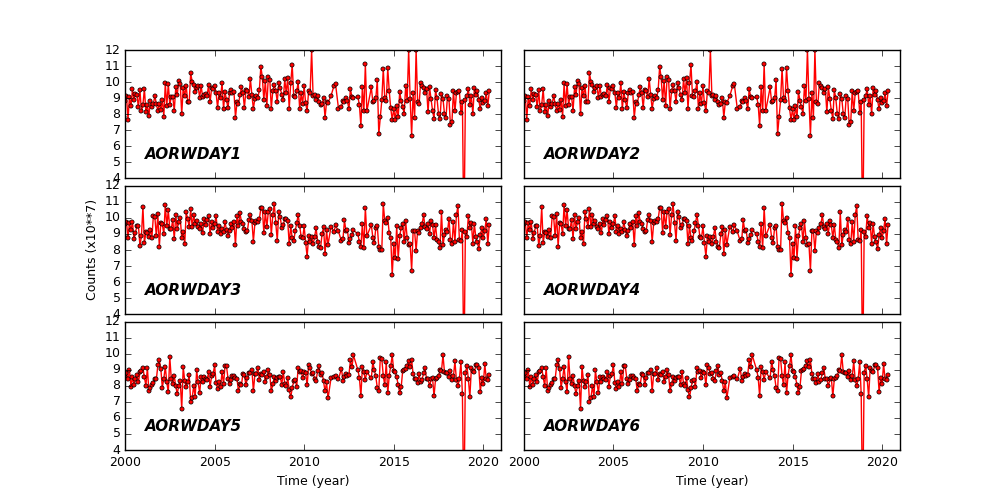
ACIS
ACIS DOSE Registered-Photon-Map
The steps we took to compute the dose map are;
- Level 1 Event files for a specified month are obtained from archive.
- Image data including I2, I3, S2, S3 CCDs are extracted from all event files.
- All the extracted image data were merged to create a month long exposure map for the month.
- The exposure map is opened with ds9, and check a distribution of count rates against energy. From this, estimate the upper threshold value. Any events beyond this upper threshold are assumed erroneous events such as bad pixels.
- Using this upper threshold, the data is filtered, and create a cleaned exposure map for the month.
- The exposure map from each month from the Sep 1999 is added up to create a cumulative exposure map for each month.
- Using fimgstatistic, we compute count rate statistics for each CCDs.
- For observations with high data drop rates (e.g., Crab nebula, Cas A), we corrected the observations by adding events.
Please check more detail plots at Telemetered Photon Dose Trend page.
)
)
)
Statistics:
# IMAGE     NPIX     MEAN        RMS        MIN     MAX
ACIS_apr20 6004901       8.758         11.375           0.0     2558


I2 node 0  262654	8.553625	3.678449	0.0	 84.0
I2 node 1  262654	8.983525	3.980809	0.0	149.0
I2 node 2  262654	8.867126	3.675471	0.0	102.0
I2 node 3  262654	8.800888	6.308542	0.0	2558.0

I3 node 0  262654	11.543464	4.525497	0.0	378.0
I3 node 1  262654	11.341533	4.353429	0.0	383.0
I3 node 2  262654	11.152409	4.103492	0.0	 98.0
I3 node 3  262654	11.006609	4.212686	0.0	274.0

S2 node 0  262654	11.454749	4.418617	0.0	109.0
S2 node 1  262654	11.807046	5.008265	0.0	441.0
S2 node 2  262654	11.916192	6.956971	0.0	2419.0
S2 node 3  262654	11.703953	4.972622	0.0	813.0

S3 node 0  262654	13.022802	5.789670	0.0	126.0
S3 node 1  262654	15.746250	9.810098	0.0	2033.0
S3 node 2  262654	14.134597	4.365510	0.0	 71.0
S3 node 3  262654	12.771997	4.155713	0.0	 47.0
)
)
)
Statistics:
 IMAGE     NPIX      MEAN        RMS           MIN      MAX
ACIS_total   6004901       2385.967         3077.165           0.0   133449


I2 node 0  262654	2069.753394	413.112814	438.0	12078.0
I2 node 1  262654	2177.366167	580.931618	451.0	104877.0
I2 node 2  262654	2205.276977	466.556900	464.0	12380.0
I2 node 3  262654	2210.589317	569.781388	443.0	28674.0

I3 node 0  262654	2360.445586	580.915049	441.0	11051.0
I3 node 1  262654	2440.053166	1707.176300	467.0	55462.0
I3 node 2  262654	2160.855365	402.698117	436.0	12567.0
I3 node 3  262654	2153.218249	433.113107	400.0	33112.0

S2 node 0  262654	2784.551689	442.310814	1539.0	22058.0
S2 node 1  262654	2950.654346	661.415261	1712.0	16142.0
S2 node 2  262654	3260.417532	663.756052	2144.0	27874.0
S2 node 3  262654	3213.929275	522.326708	1896.0	63441.0

S3 node 0  262654	4905.586144	2334.599404	2152.0	34248.0
S3 node 1  262654	6137.526941	2298.676144	0.0	32713.0
S3 node 2  262654	4884.951945	1286.365455	2136.0	25823.0
S3 node 3  262654	3786.419853	679.511360	2320.0	25242.0
)
|
)
|
)
|
)
|
| Jan 2020 | Oct 2019 | Jul 2019 | Apr 2019 |
|---|
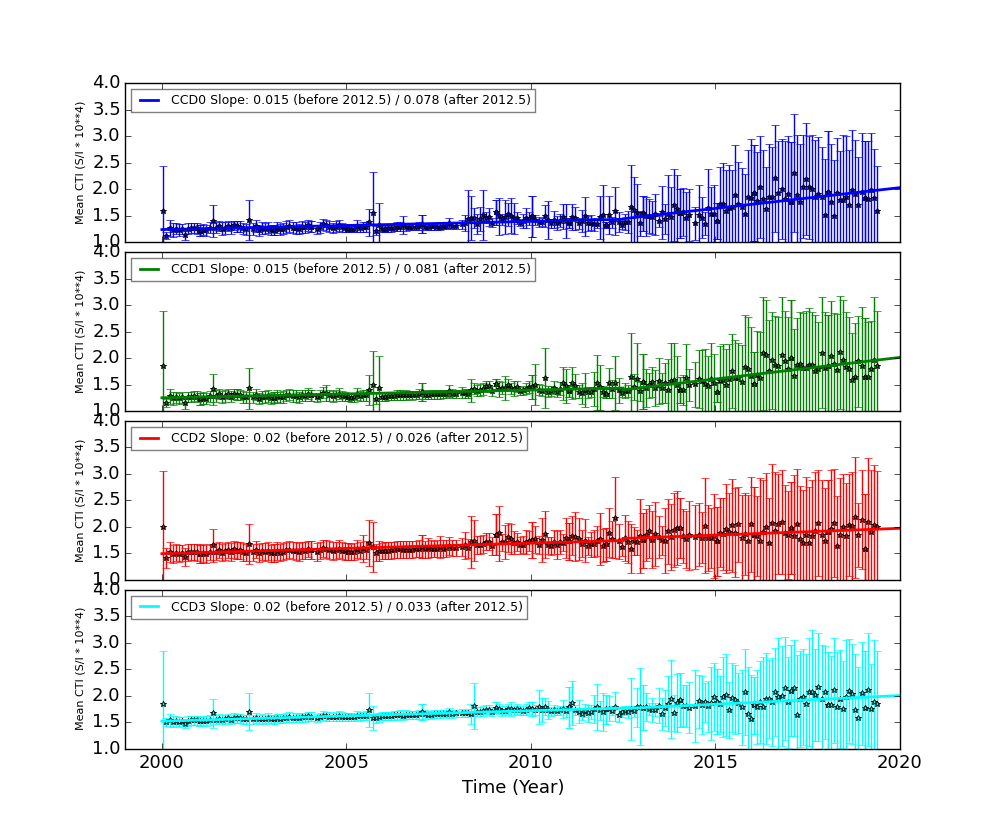
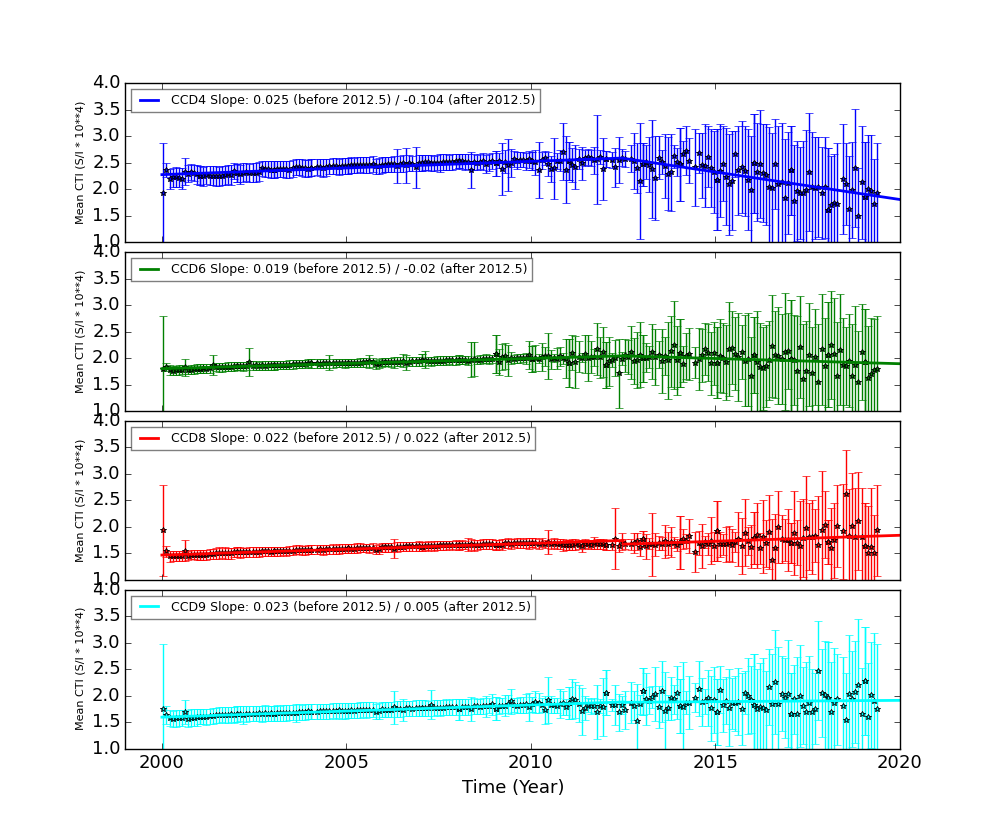
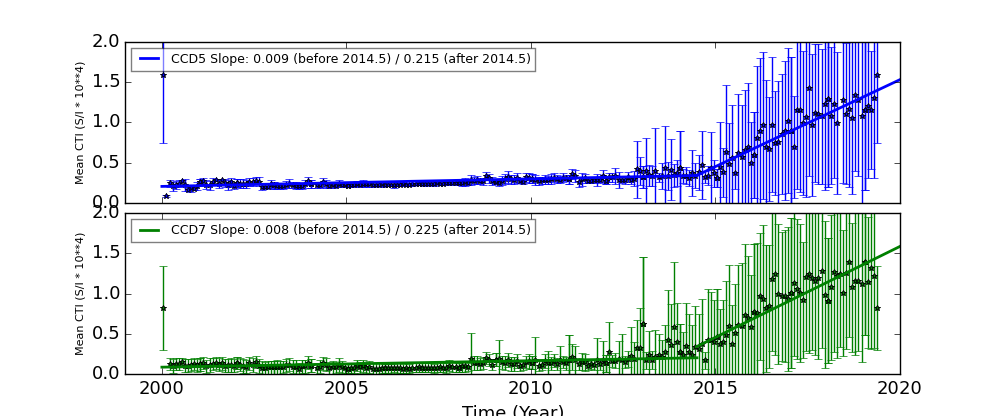
The Mean Detrended CTI
We report CTIs with a refined data definition. CTIs were computed for the temperature dependency corrected data. Please see CTI page for detailed explanation. CTI's are computed for Mn K alpha, and defined as slope/intercept x10^4 of row # vs ADU. Data file: here
Imaging CCDs
Spectral CCDs
Backside CCDs
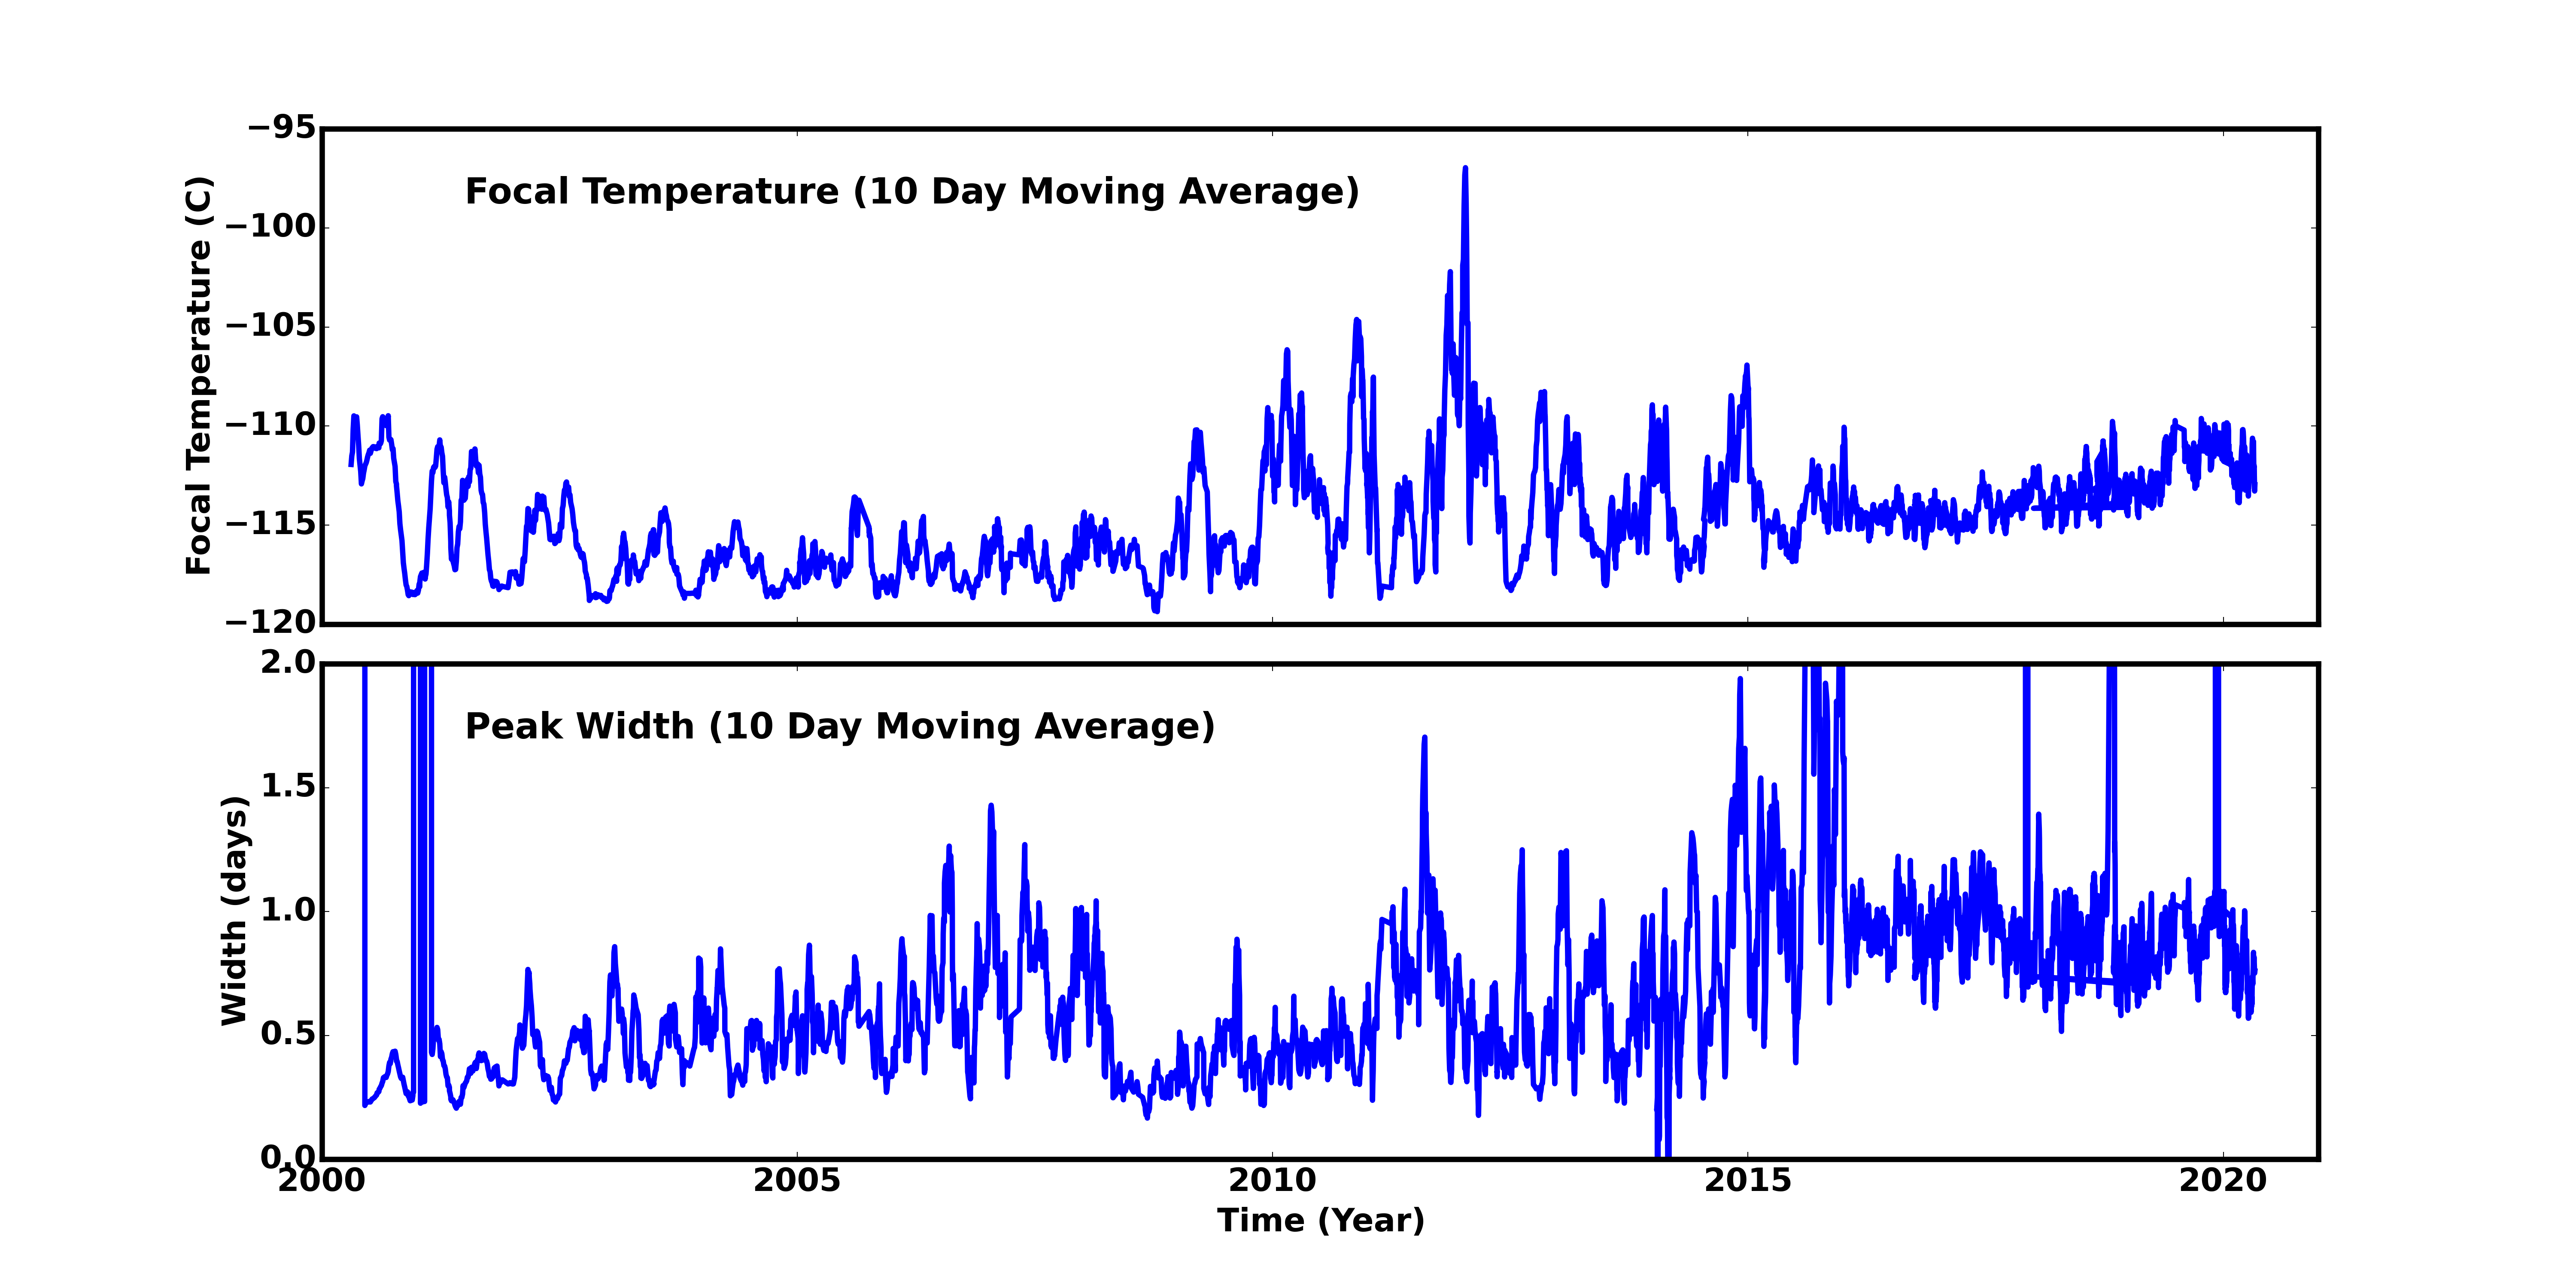
Focal Plane Temperature
Apr 2020 Focal Temperature
| The Mean (max) FPT: | |
|---|---|
| -112.26 | +/- 2.89 C |
| Mean Width: | |
| 0.68 | +/- 0.27 days |
Averaged Focal Plane Temperature
We are using 10 period moving averages to show trends of peak temperatures and peak widths. Note, the gaps in the width plot are due to missing/corrupted data.
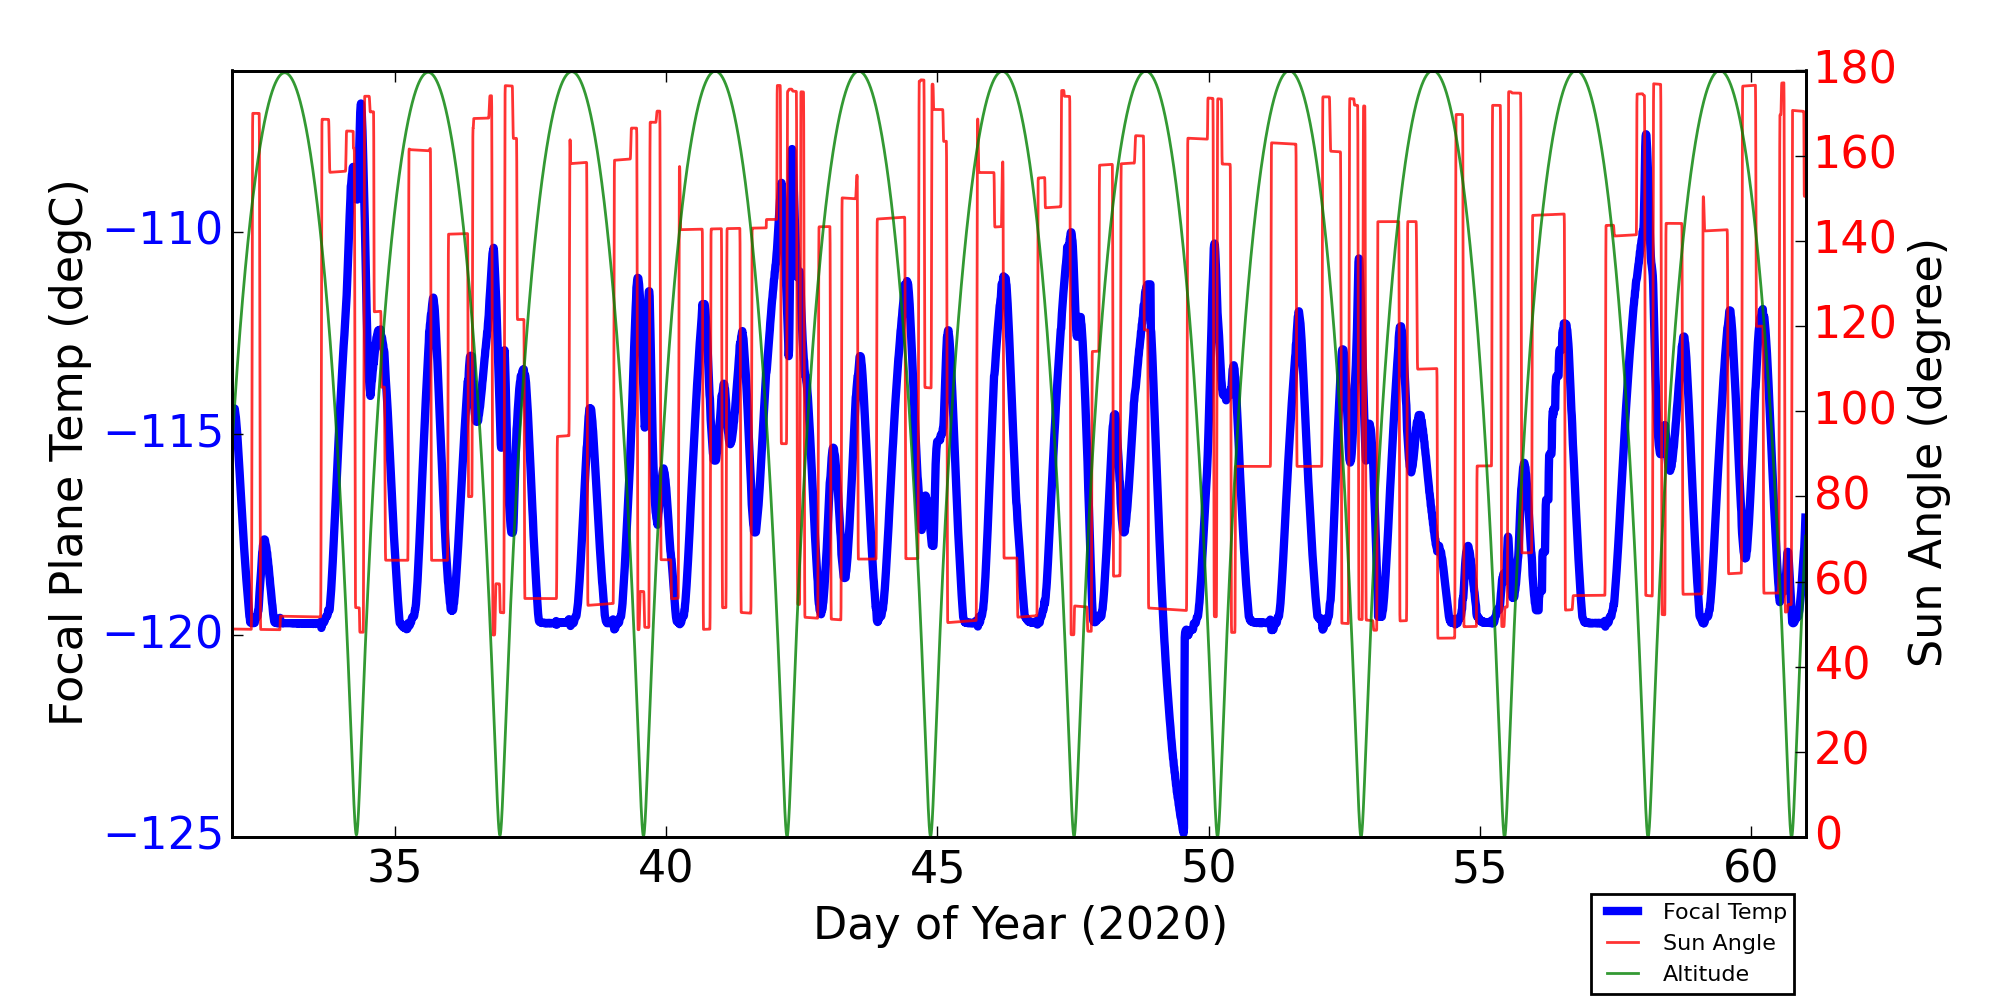
Focal Plane Temperature, Sun Angle and Altitude
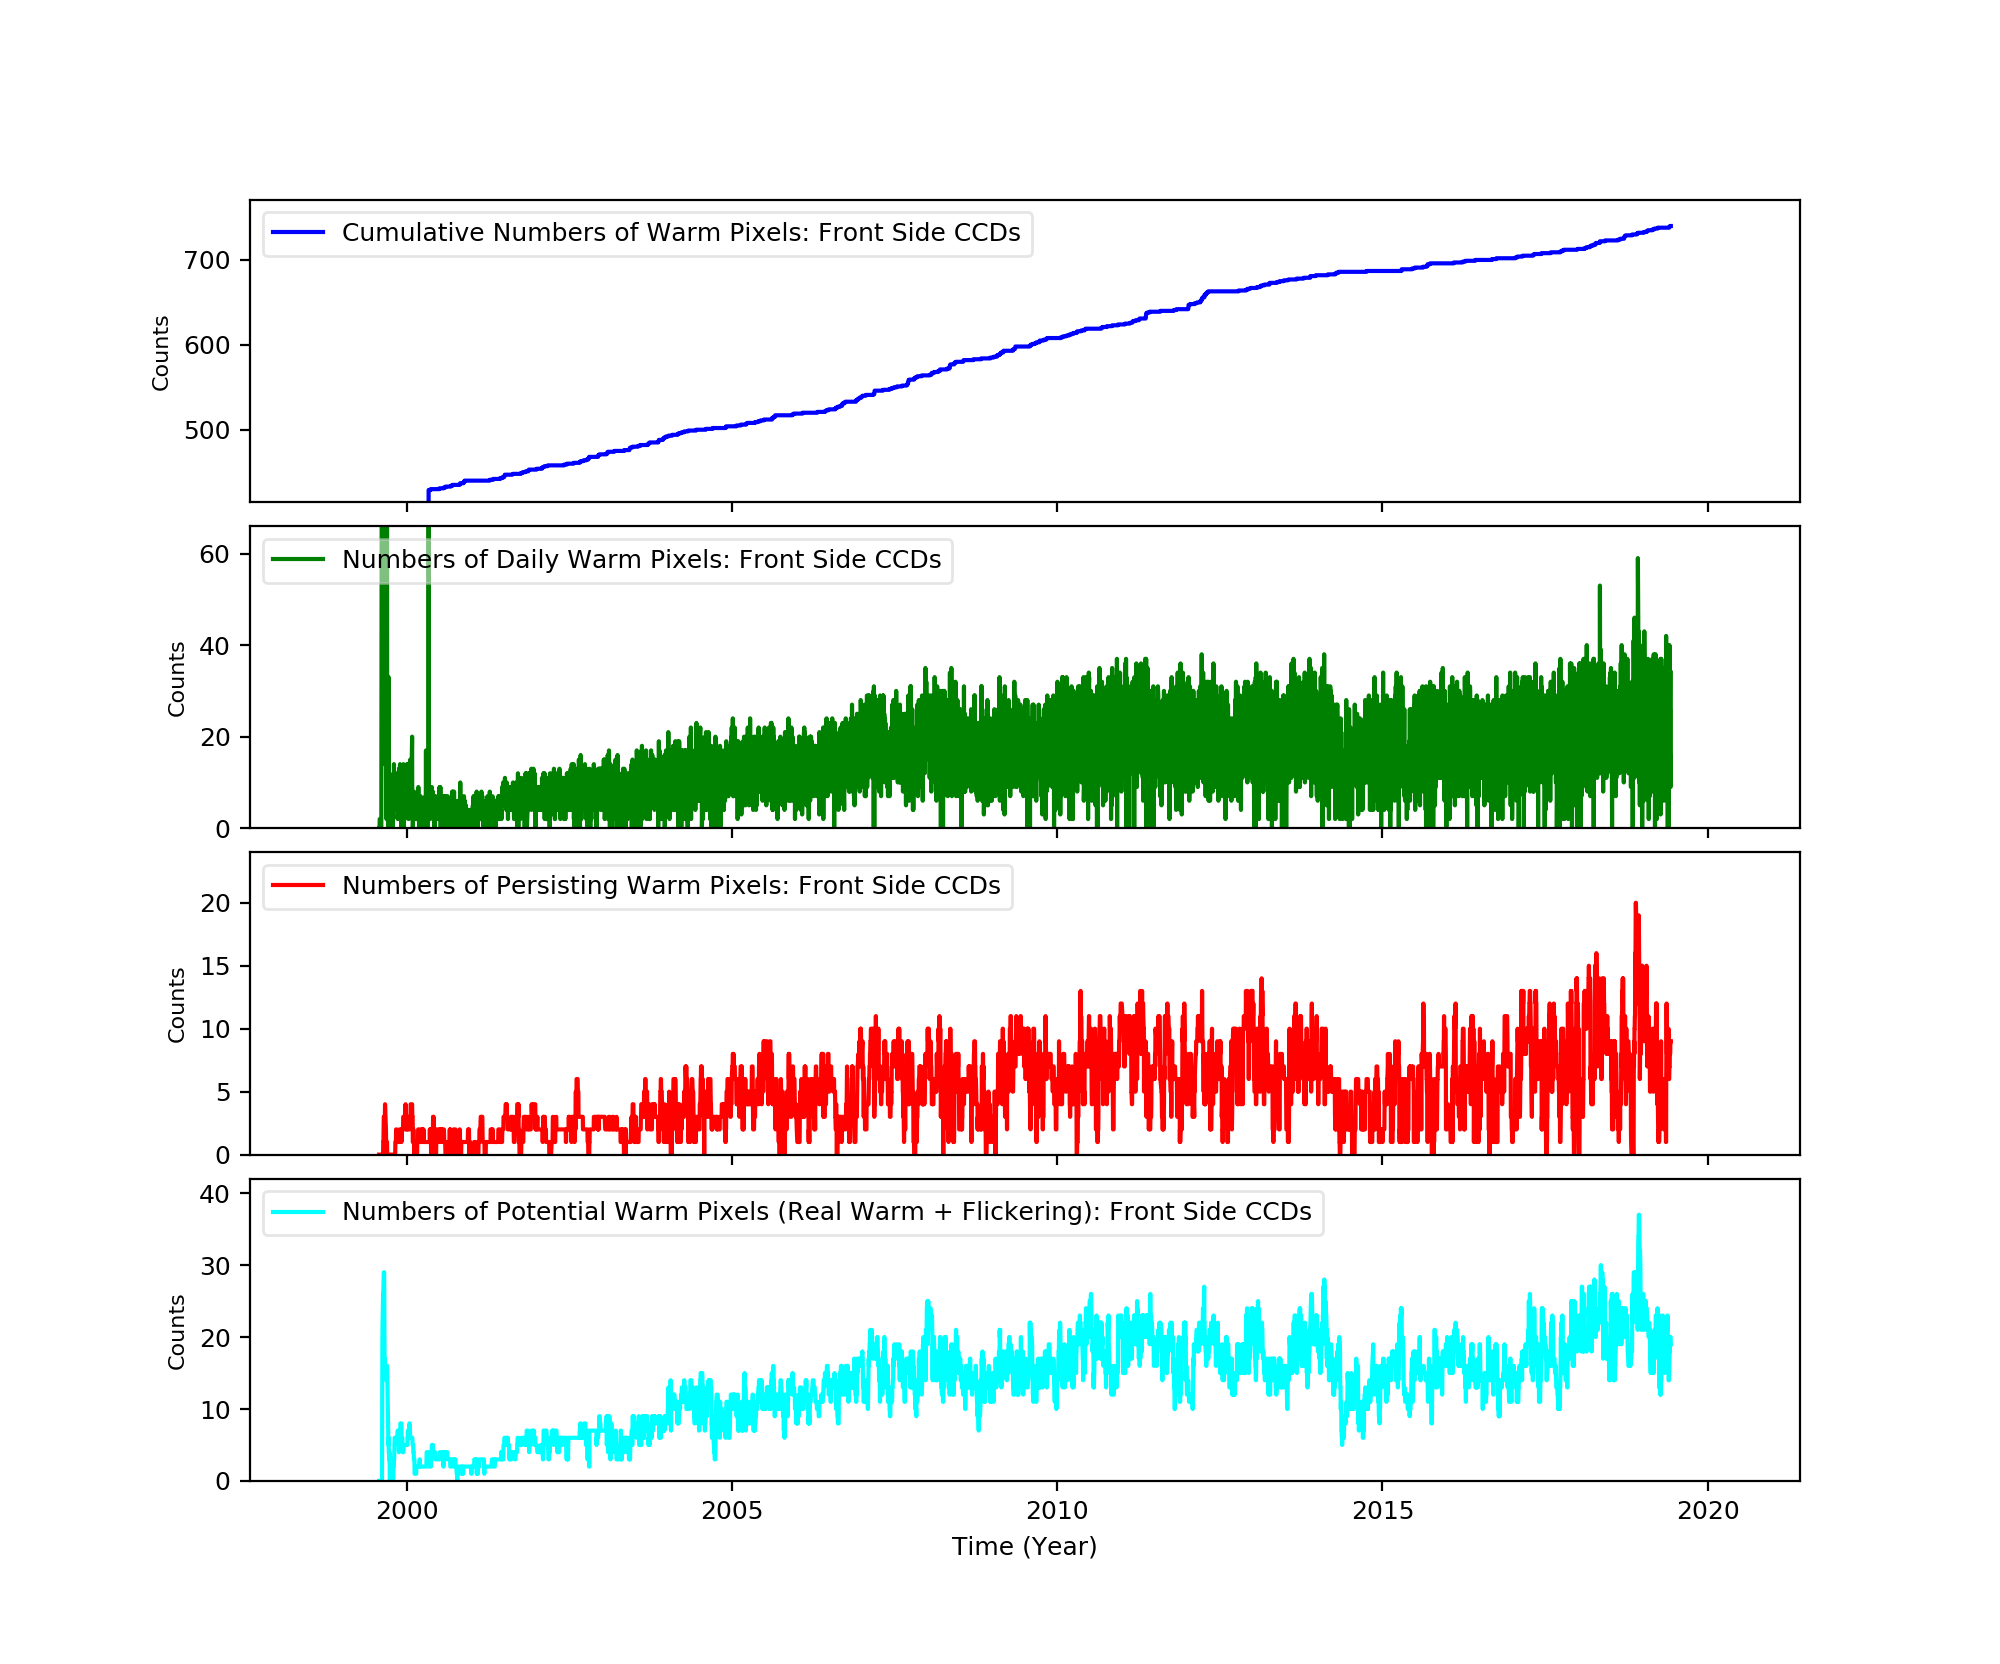
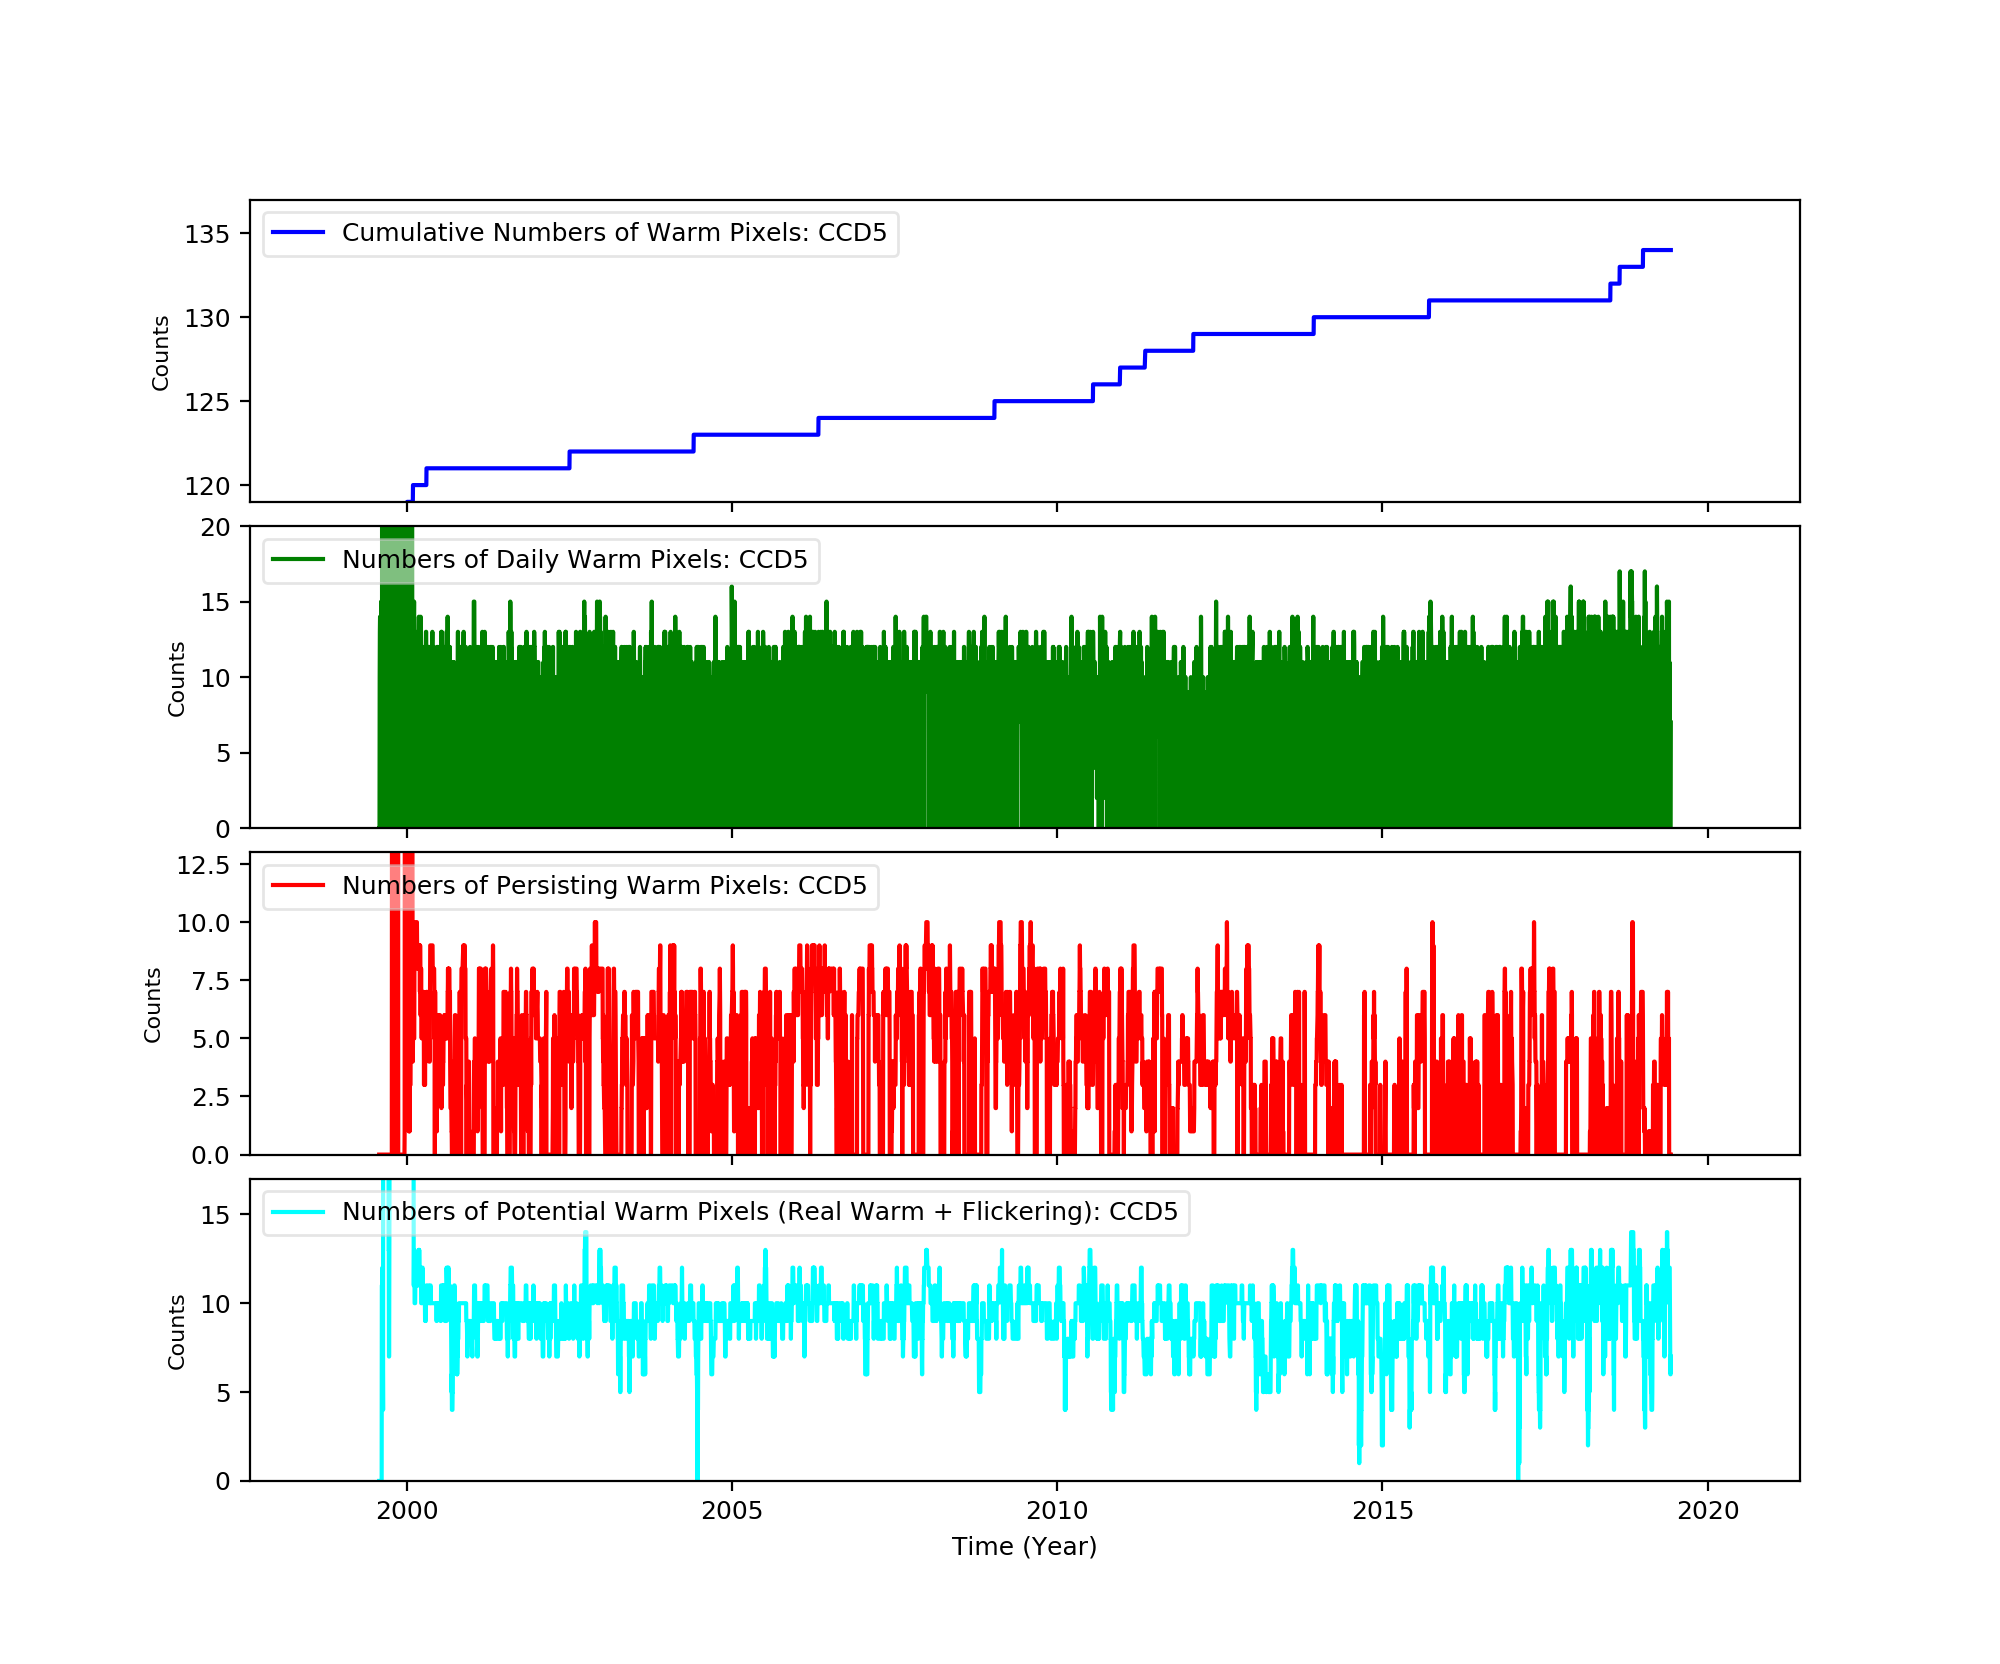
Bad Pixels
The plots below were generated with a new warm pixel finding script. Please see Acis Bad Pixel Page for details.
Front Side CCDs
Back Side CCD (CCD5)
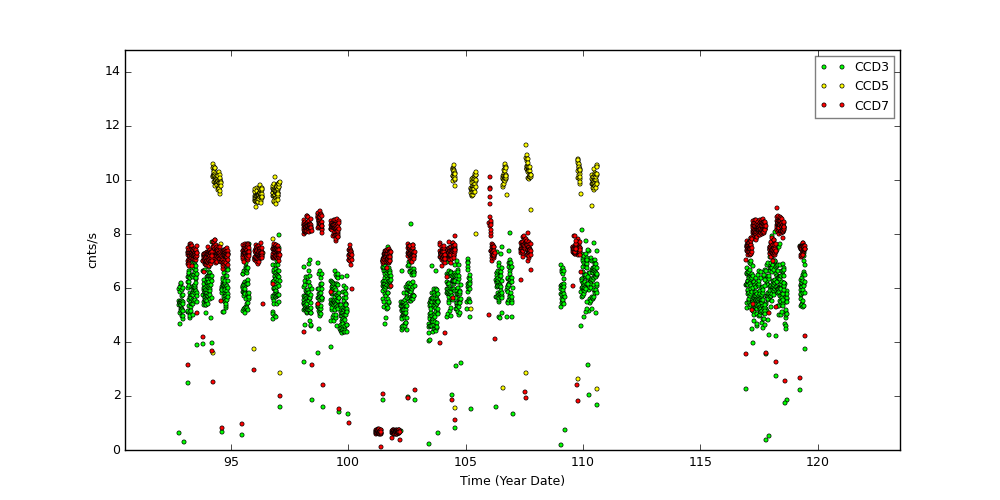
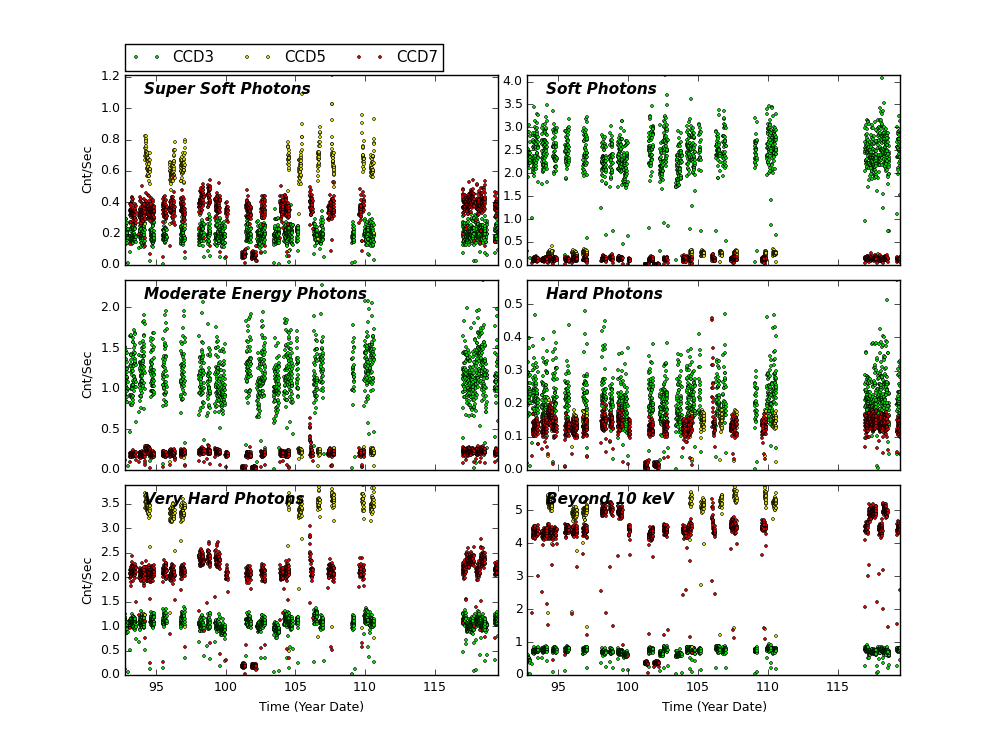
Science Instrument Background Rates
| Name | Low (keV) | High(KeV) | Description |
|---|---|---|---|
| SSoft | 0.00 | 0.50 | Super soft photons |
| Soft | 0.50 | 1.00 | Soft photons |
| Med | 1.00 | 3.00 | Moderate energy photons |
| Hard | 3.00 | 5.00 | Hard Photons |
| Harder | 5.00 | 10.00 | Very Hard photons |
| Hardest | 10.00 | Beyond 10 keV |
HRC
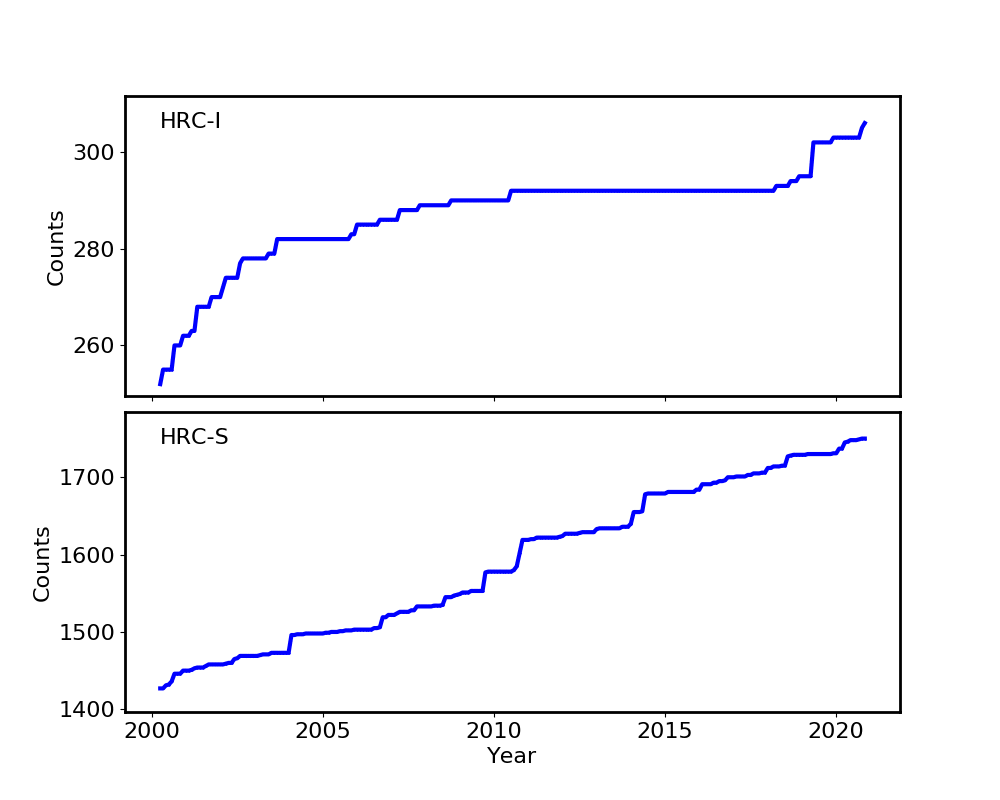
DOSE of Central 4K Pore-Pairs
Please refer to Maximum Dose Trends for more details.
)
|
|---|
IMAGE                NPIX      MEAN    STDDEV      MIN       MAX
HRCI_04_2020.fits  16777216	0.138 	0.375 	0.000 	9.000
)
IMAGE                       NPIX      MEAN    STDDEV      MIN       MAX
HRCI_08_1999_04_2020.fits  16777216	6.402 	6.014 	0.000 	306.000
)
|
|---|
IMAGE                NPIX      MEAN    STDDEV      MIN       MAX
HRCS_04_2020.fits  16777216	0.009 	0.096 	0.000 	4.000
)
IMAGE                       NPIX      MEAN    STDDEV      MIN       MAX
HRCS_08_1999_04_2020.fits  16777216	19.014 	34.209 	0.000 	1750.000
|
|
Max dose trend plots corrected for events that "pile-up"
in the center of the taps due to bad position information.
|
)
|
)
|
)
|
)
|
| Jan 2020 | Oct 2019 | Jul 2019 | Apr 2019 |
|---|
)
|
)
|
)
|
)
|
| Jan 2020 | Oct 2019 | Jul 2019 | Apr 2019 |
|---|
Gratings
Grating Trends/Focus
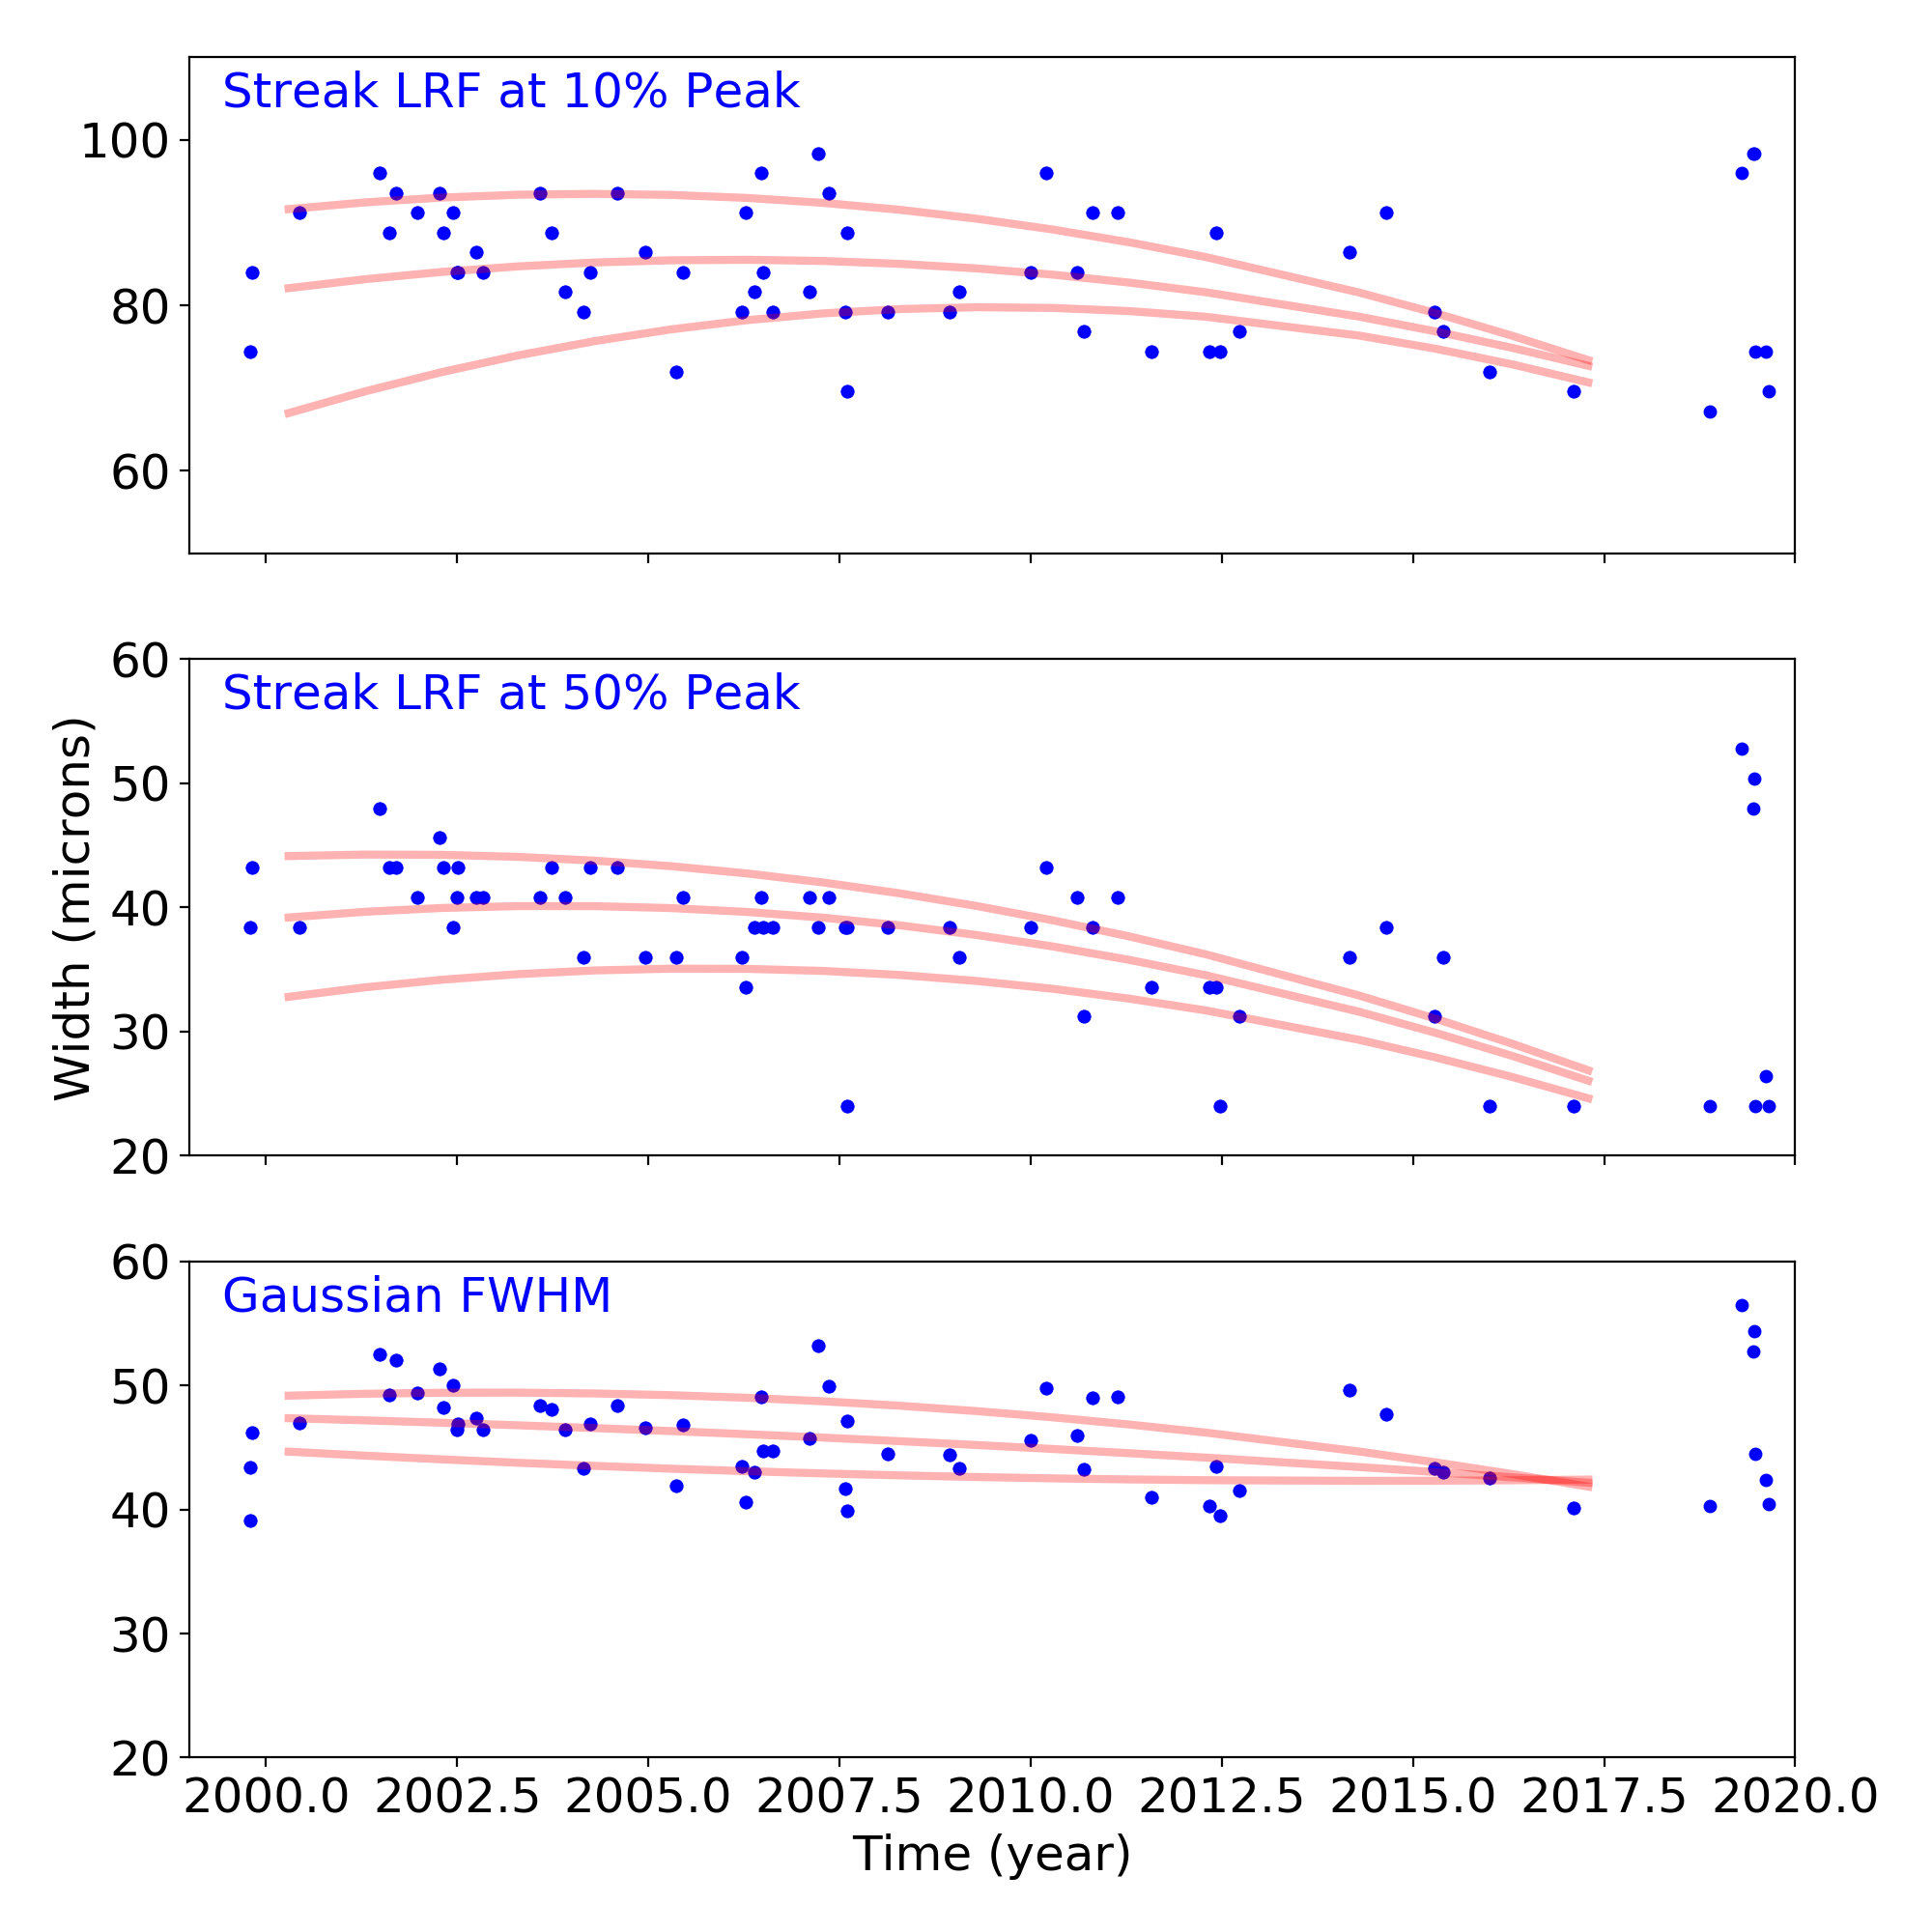
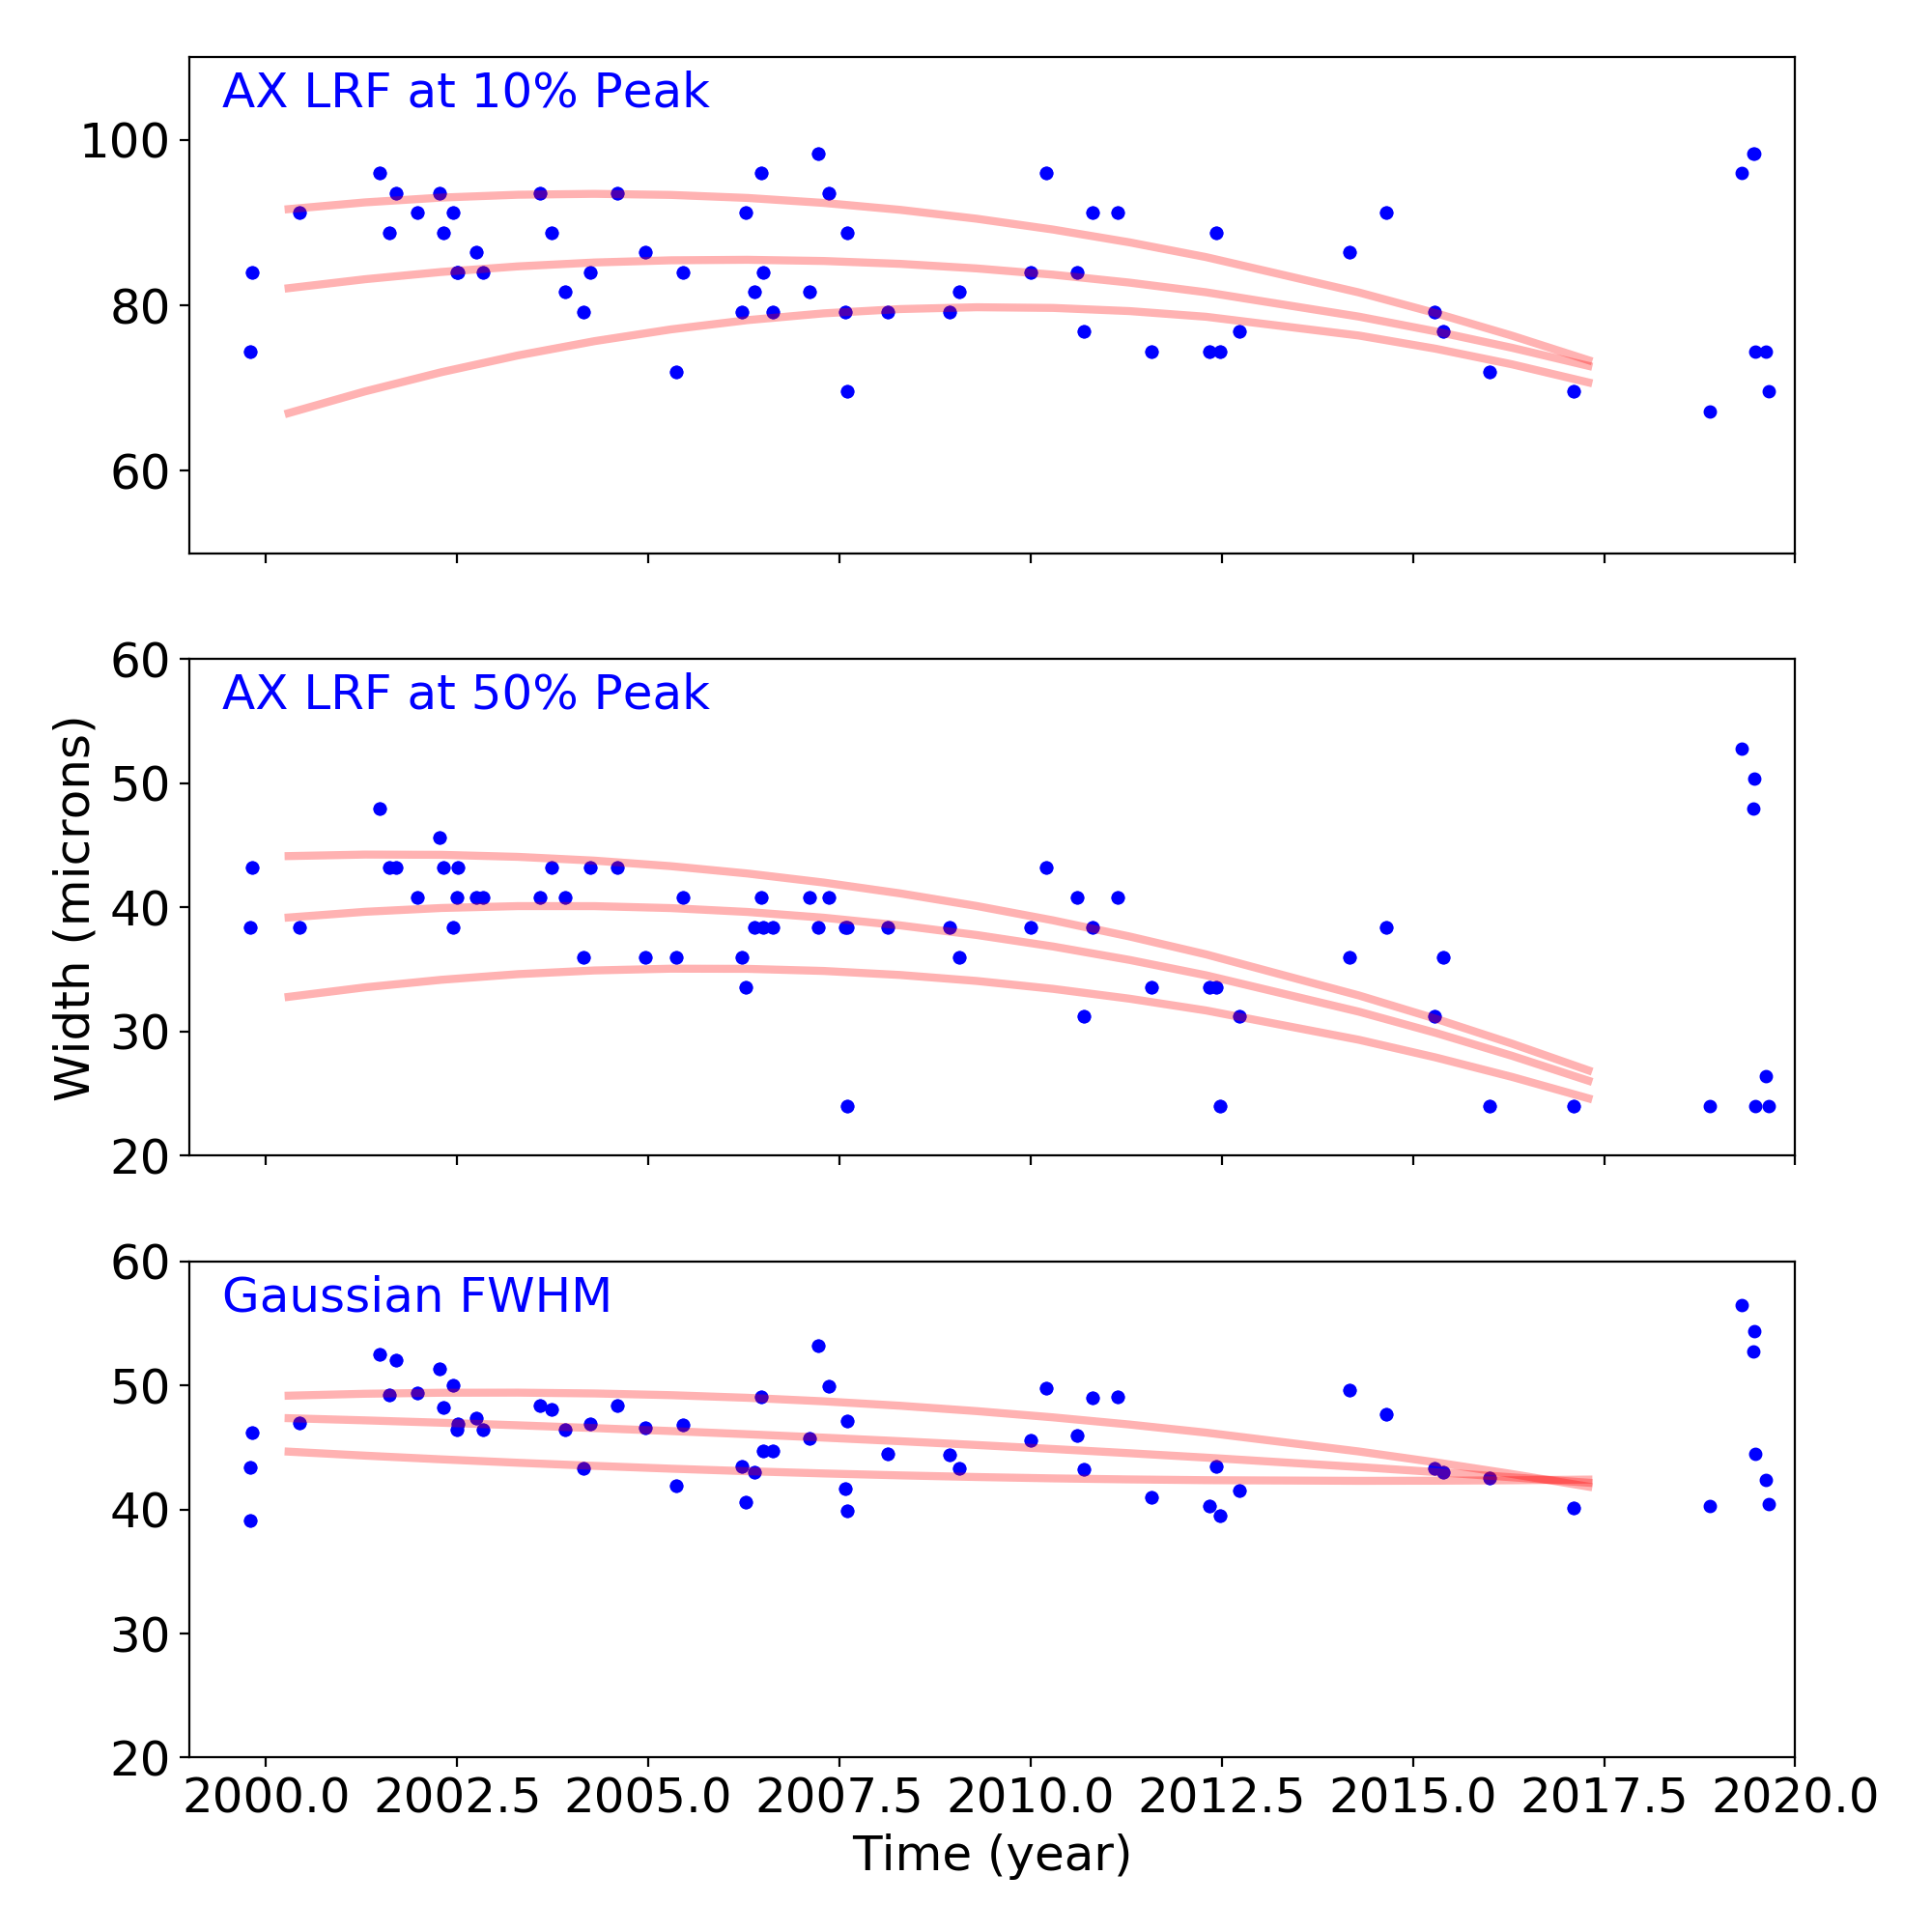
We plot the width of the zero order streak of ACIS/HETG observations and the width of the zero order image for HRC/LETG observations of point sources. No significant defocusing trend is seen at this time. See Gratings Trends pages.
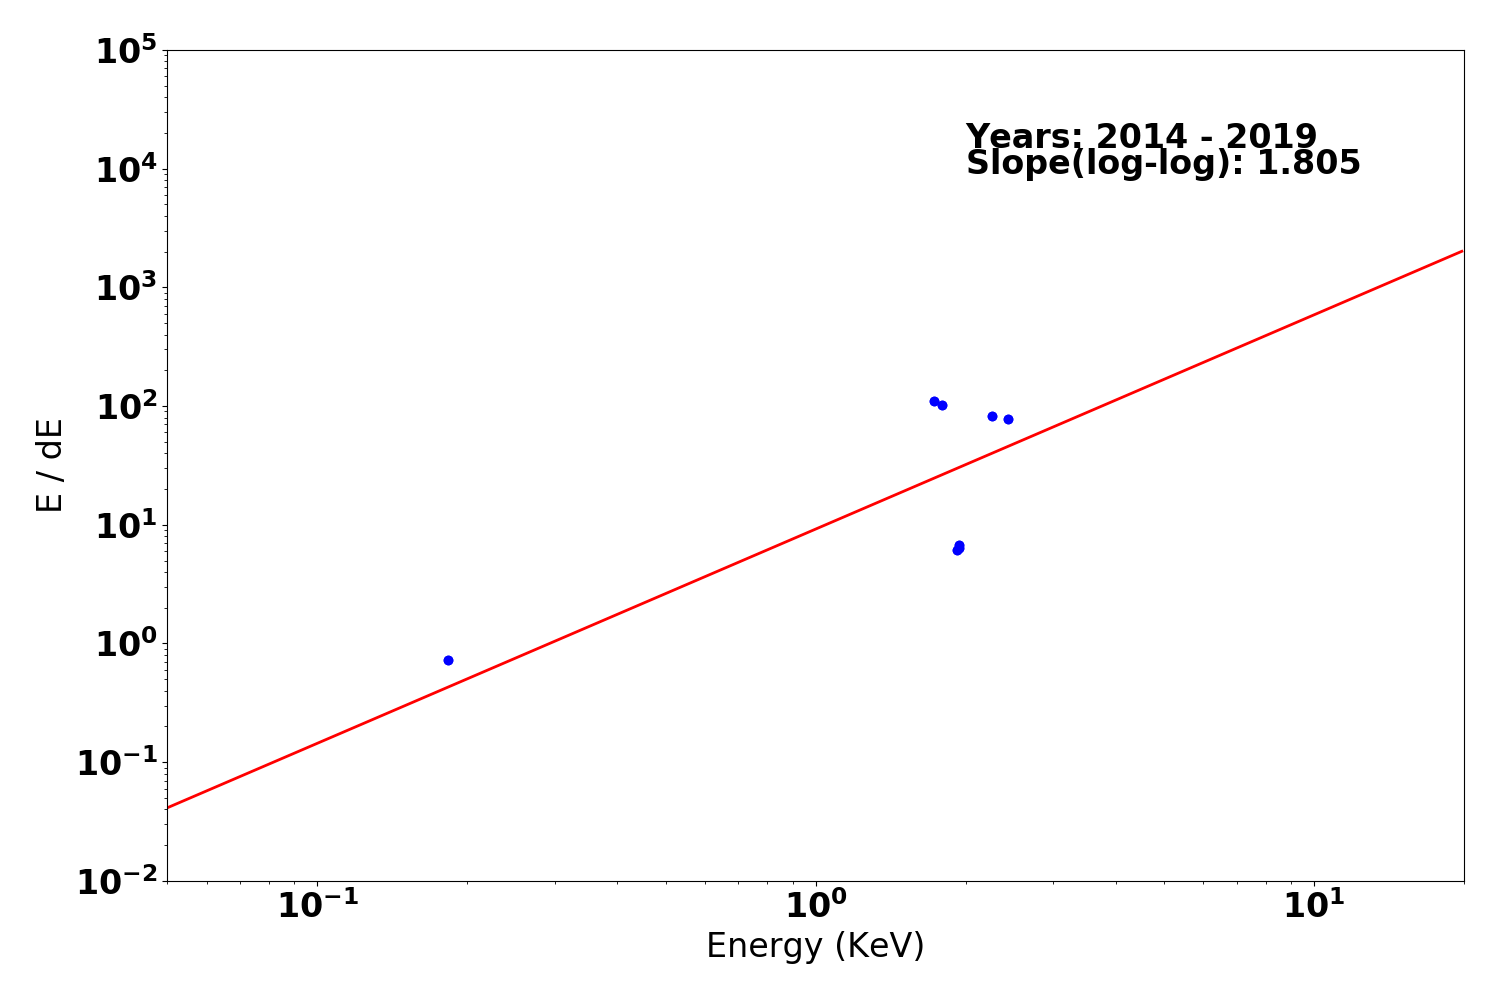
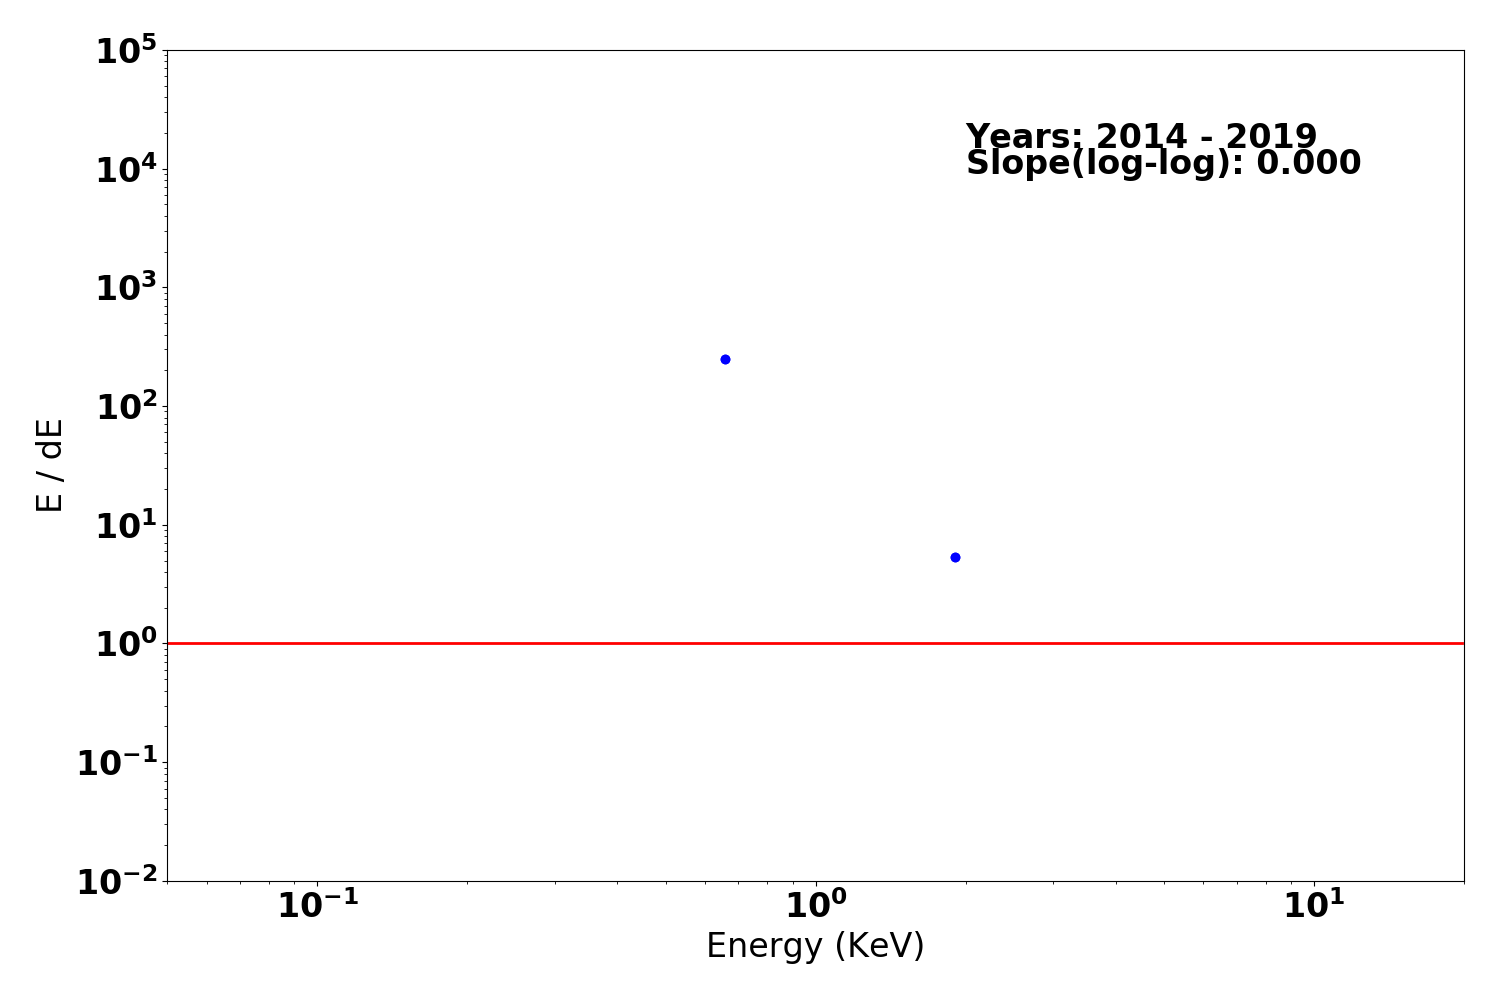
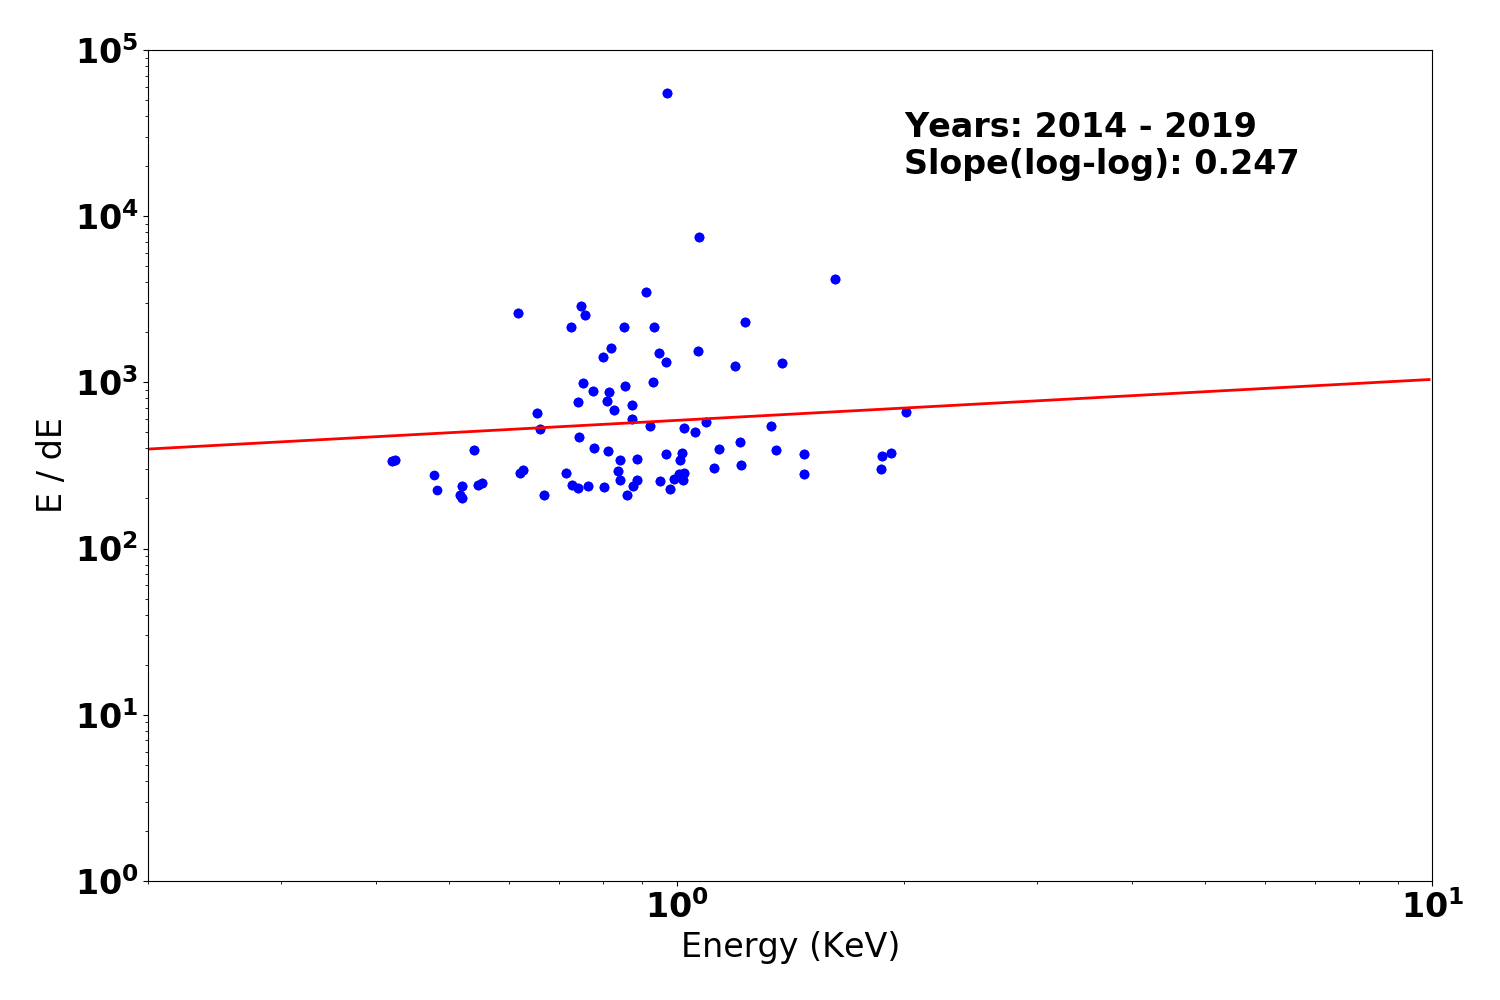
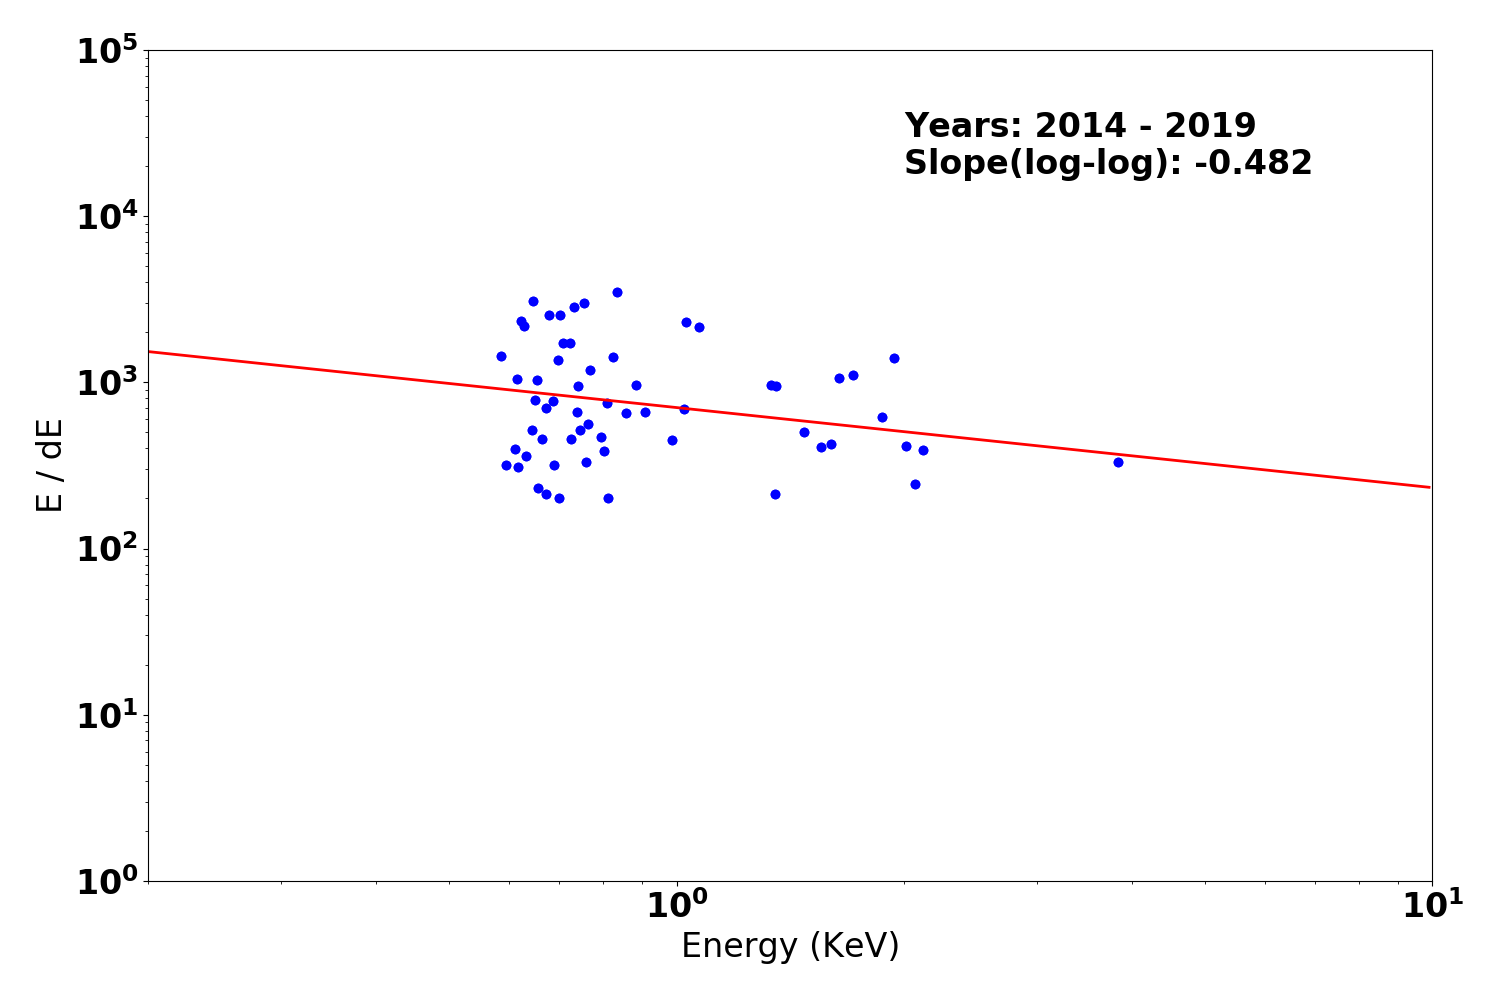
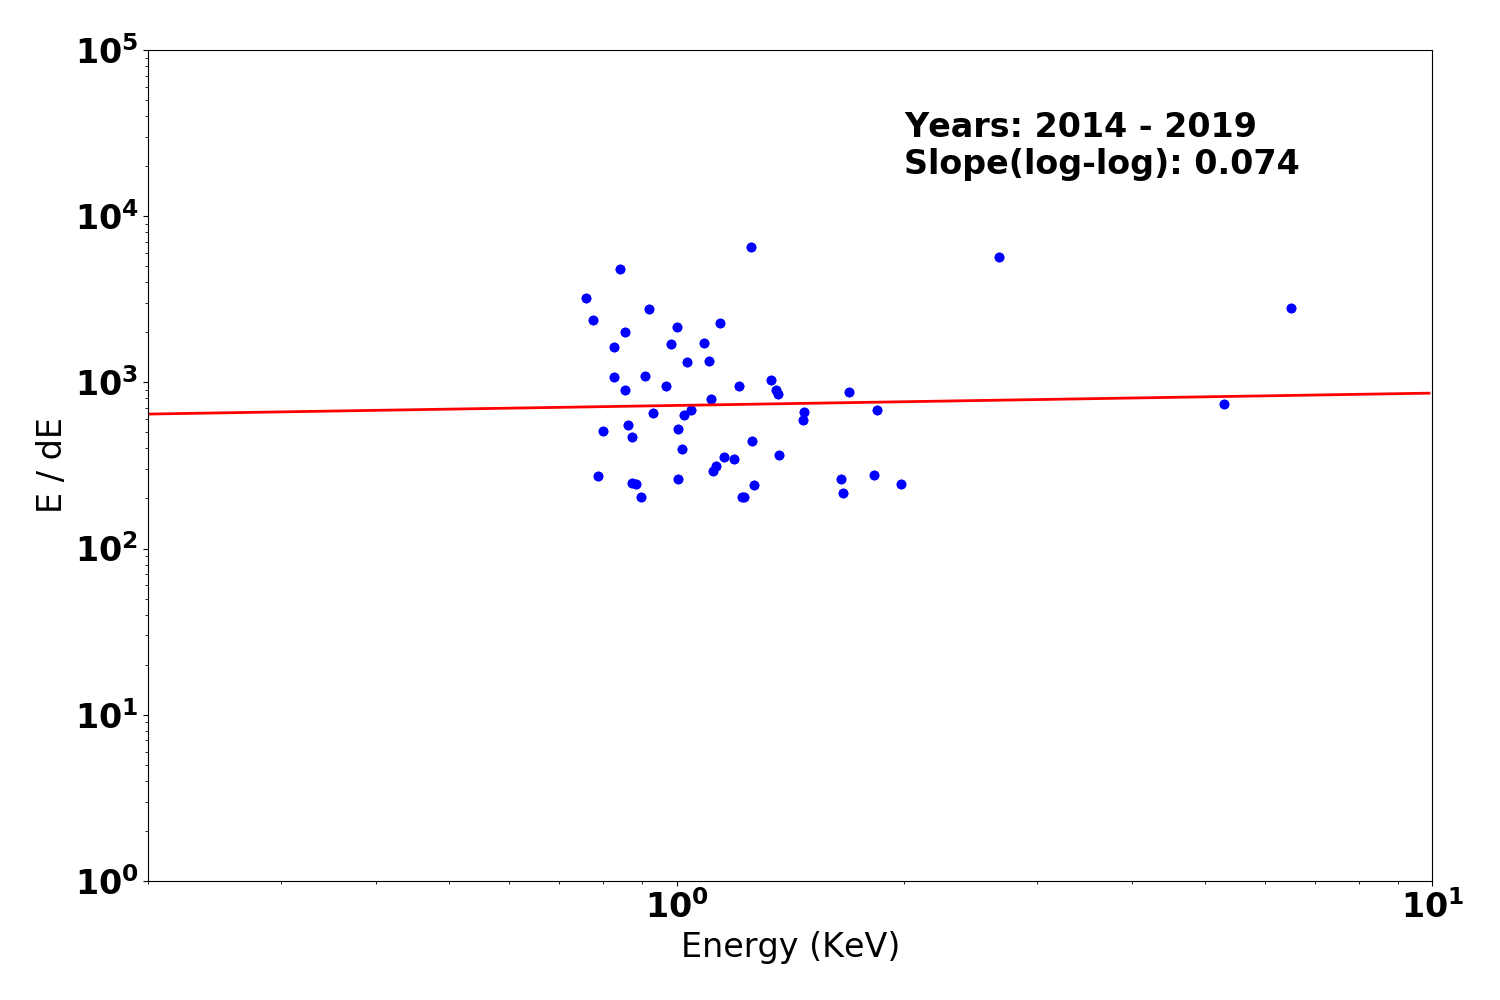
Gratings Resolving Power
We plot E/dE vs. E for fits to detected lines with fwhm_error/fwhm less than 0.15 for the plus and minus arms of HEG, MEG, and LEG. Also shown are conservative (dotted line) and optimistic (dashed line) pre-launch resolving power expectations.
We have selected only calibration observations of Capella, HR1099, and Sigma Gem. See MIT technotes for a parallel analysis.
| Year 2014 - | |
|---|---|
| Letg minus side | Letg plus side |
 |
 |
| Metg minus side | Metg plus side |
 |
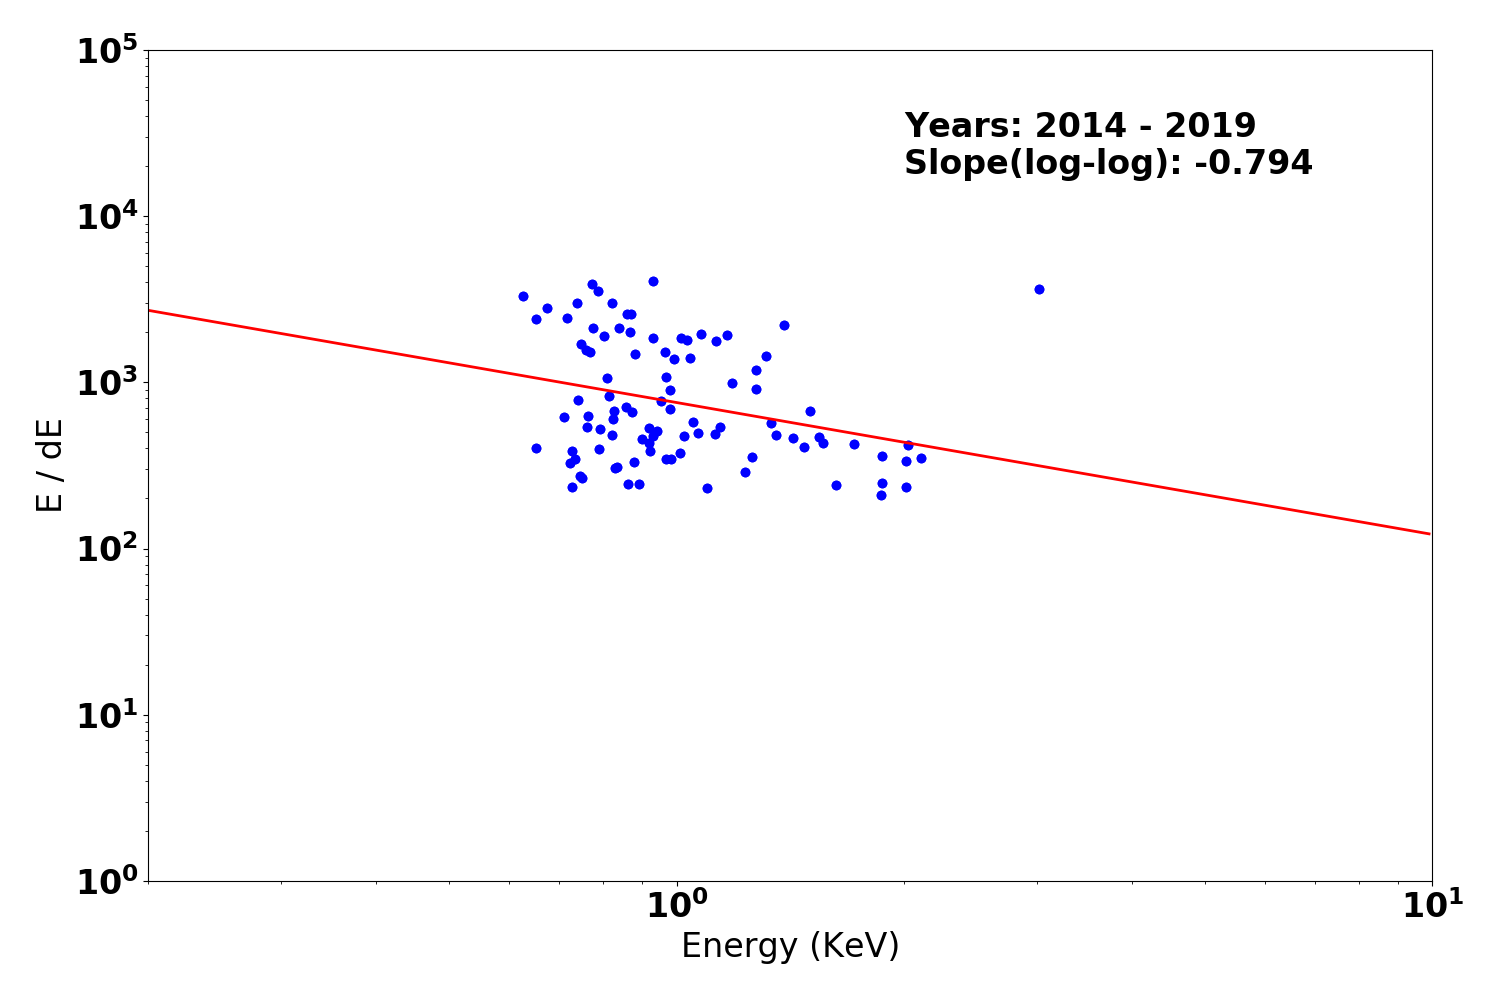 |
| Hetg minus side | Hetg plus side |
 |
 |
PCAD
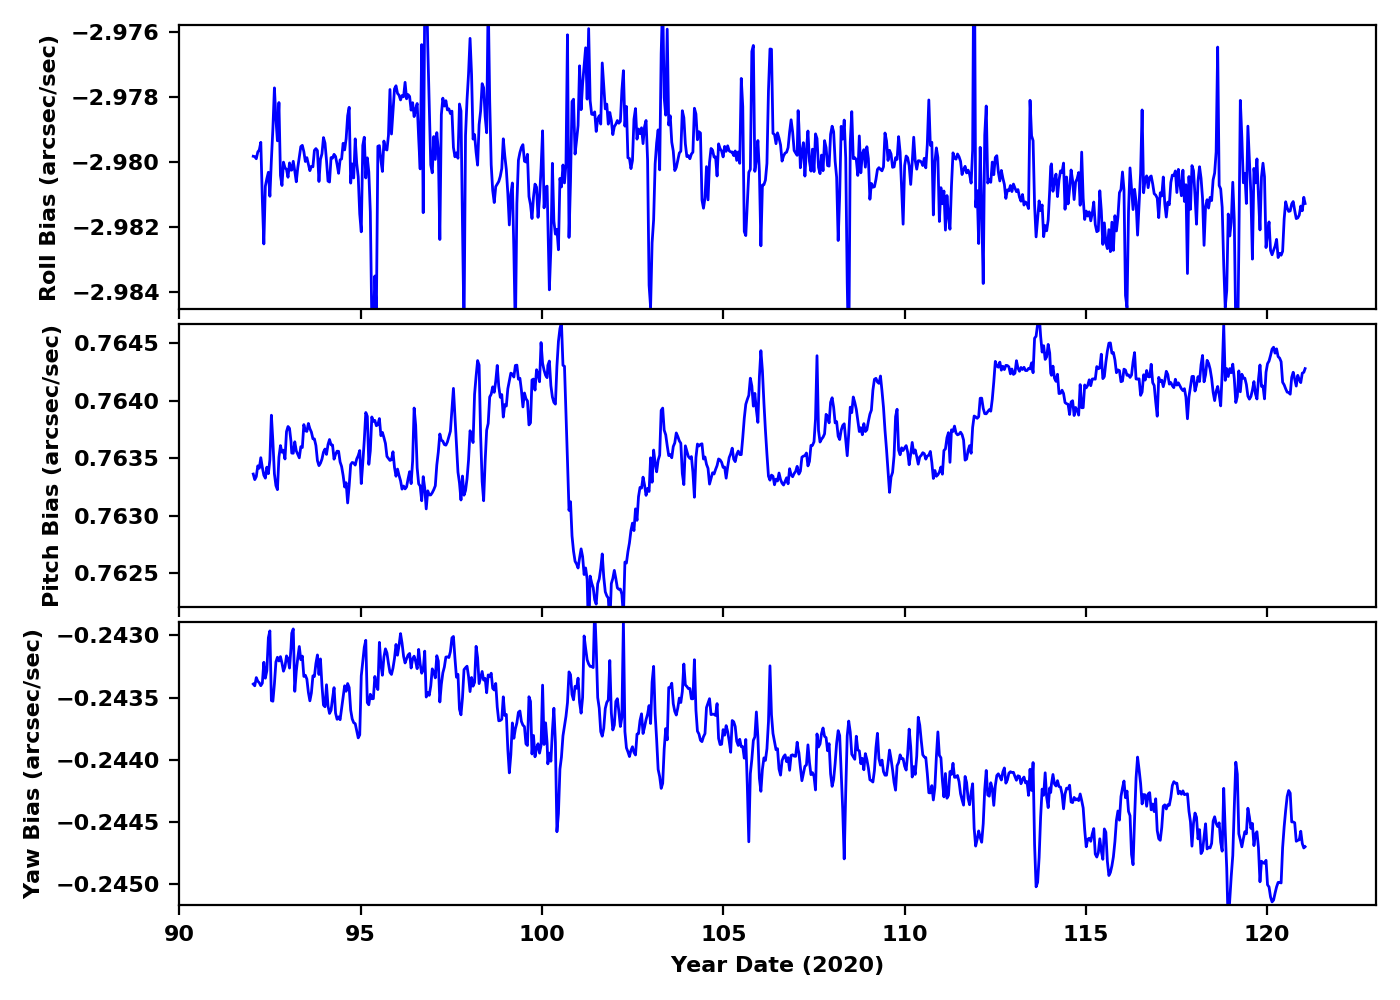
ACA Trending
Gyro Bias Drift
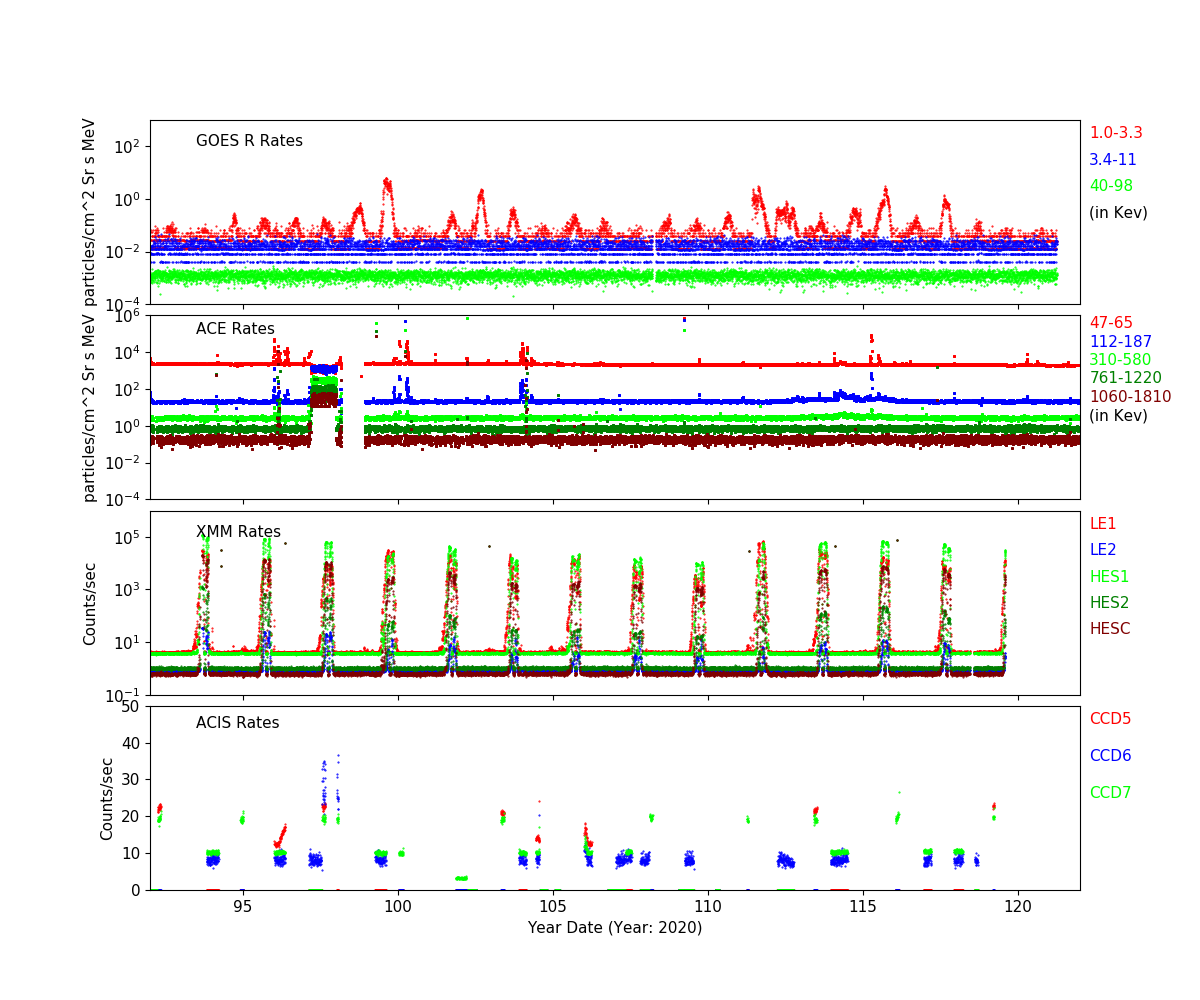
Radiation History
Radiation Count Rates of Apr 2020
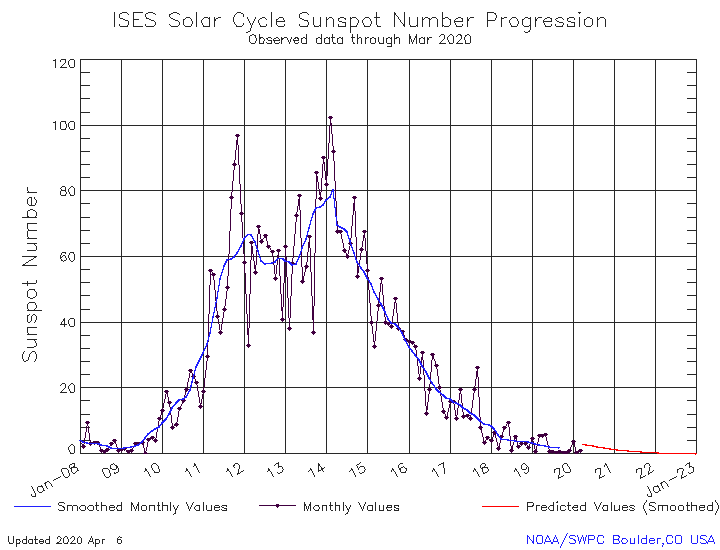
Sun Spot History
SIM
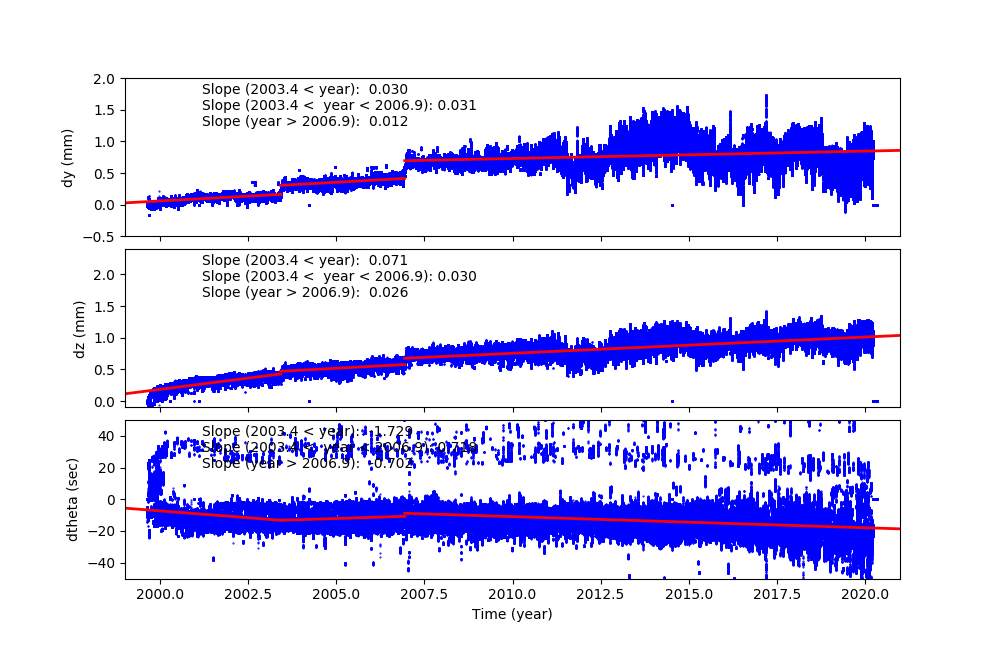
SIM Shift and Twist
SIM Shift and Twist Trend The following plots show trends of SIM shifts (dy and dz) and twist (dtheta). All quantities are directly taken from pcaf*_asol1.fits files. The units are mm for dy and dz, and degree for dtheta. We fit three lines separated before and after (Days of Mission)= 1400 (May 21, 2003), 2700 (Dec 11, 2006), and 4400 (Aug 07, 2011). The unit of slopes are mm per day or degree per day.
The sudden shift around DOM = 1400, 2700 and 4400 are due to fid light drift (see a memo by Aldcroft fiducial light drift). On the dtheta plot, two tracks are clearly observed. The track around 0.01 is due to HRC-I, and all others are clustered around -0.002. For more detail, please see SIM Shift and Twist Trend page
Trending
Quarterly Trends
- EPS Batteries
| Previous Quarter | |||||||
| MSID | MEAN | RMS | DELTA/YR | DELTA/YR/YR | UNITS | DESCRIPTION | |
| eb2ci | -4.710e-04 | 4.904e-05 | 0.30 +/- 0.12 | 0.00 +/- 0.00 | AMP | BATT 2 CHARGE CURRENT | |
|---|---|---|---|---|---|---|---|
| eb2di | -5.429e-04 | 1.109e-04 | 0.02 +/- 0.26 | -(1.53+/-2.20)e-5 | AMP | BATT 2 DISCHARGE CURRENT | |
| eb2v | 8.244e-04 | 4.815e-05 | 32.30 +/- 0.12 | -(2.37+/-15.99)e-4 | V | BATT 2 VOLTAGE | |
| ecnv1v | -2.895e-06 | 3.286e-06 | 14.89 +/- 0.01 | -0.00 +/- 0.00 | V | CONV 1 +15V OUTPUT | |
| ecnv2v | 8.999e-06 | 4.482e-06 | 14.85 +/- 0.01 | -0.00 +/- 0.00 | V | CONV 2 +15V OUTPUT | |
| ecnv3v | -2.158e-13 | 999.000 | 15.29 +/- 0.00 | (1.36+/-3.99)e-4 | V | CONV 3 +15V OUTPUT | |
- Spacecraft Electronics
| Previous Quarter | |||||||
| MSID | MEAN | RMS | DELTA/YR | DELTA/YR/YR | UNITS | DESCRIPTION | |
| elbi | 8.633e-04 | 5.608e-04 | 54.80 +/- 1.30 | 0.32 +/- 0.22 | AMP | LOAD BUS CURRENT | |
|---|---|---|---|---|---|---|---|
| elbv | 0.004 | 3.630e-05 | 28.27 +/- 0.18 | 0.01 +/- 0.01 | V | LOAD BUS VOLTAGE | |
- OBA Heater
| Previous Quarter | |||||||
| MSID | MEAN | RMS | DELTA/YR | DELTA/YR/YR | UNITS | DESCRIPTION | |
| oobthr04 | -0.004 | 3.688e-04 | (3.01+/-0.01)e2 | 0.48 +/- 0.30 | K | RT 27: HRMA STRUT | |
|---|---|---|---|---|---|---|---|
| oobthr12 | -0.004 | 6.241e-04 | (3.00+/-0.01)e2 | 1.25 +/- 0.49 | K | RT 35: OBA CONE | |
| oobthr26 | -0.006 | 0.001 | (3.03+/-0.03)e2 | 1.00 +/- 0.80 | K | RT 48: OBA CONE | |
| oobthr38 | -5.841e-06 | 5.111e-06 | (2.83+/-0.00)e2 | 0.01 +/- 0.00 | K | RT 60: TFTE CONE | |
| oobthr44 | -0.004 | 6.409e-04 | (3.02+/-0.02)e2 | 0.75 +/- 0.54 | K | RT 66: TFTE COVER | |
| oobthr50 | -0.006 | 5.192e-04 | (2.97+/-0.01)e2 | 1.25 +/- 0.45 | K | RT 76: S/C STRUT | |
Spacecraft Motions
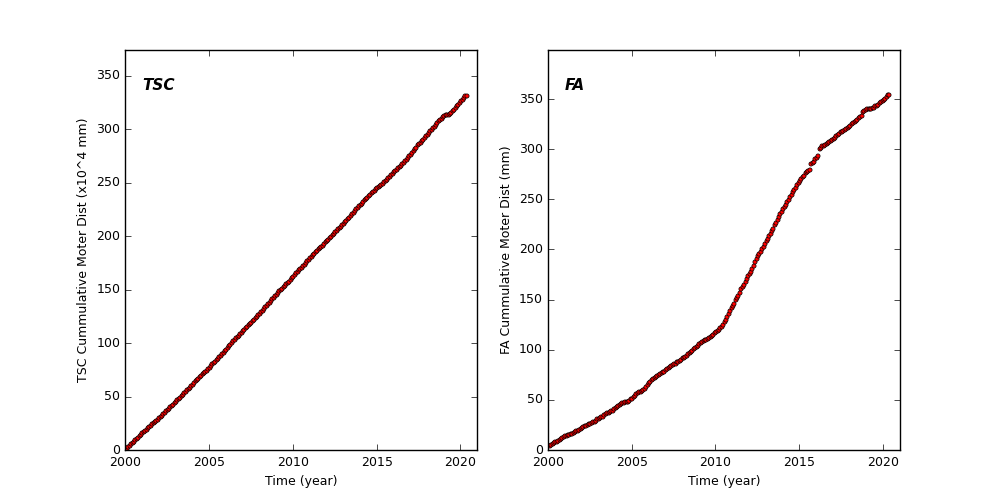
TSC and FA Cummulative Moter Distance
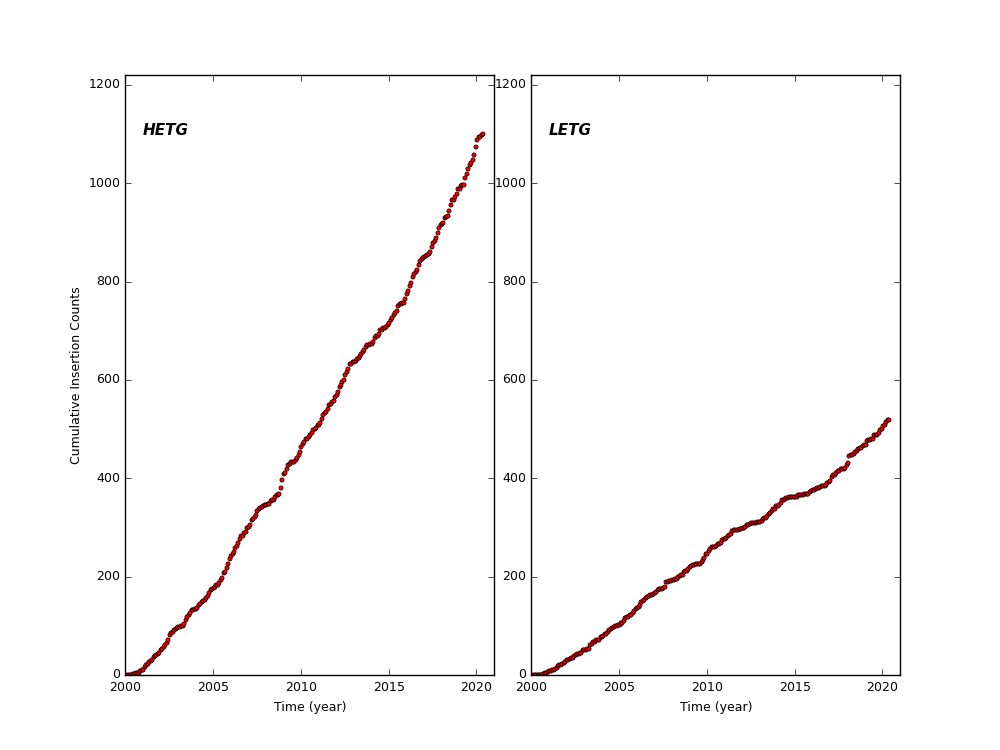
HETG and LETG Cummulative Insertion Counts
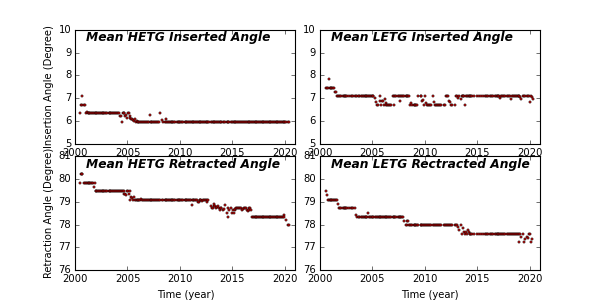
HETG/LETG Insertion/Retraction Angle
Reaction Wheel Rotations