ACIS
ACIS DOSE Registered-Photon-Map
The steps we took to compute the dose map are;
- Level 1 Event files for a specified month are obtained from archive.
- Image data including I2, I3, S2, S3 CCDs are extracted from all event files.
- All the extracted image data were merged to create a month long exposure map for the month.
- The exposure map is opened with ds9, and check a distribution of count rates against energy. From this, estimate the upper threshold value. Any events beyond this upper threshold are assumed erroneous events such as bad pixels.
- Using this upper threshold, the data is filtered, and create a cleaned exposure map for the month.
- The exposure map from each month from the Sep 1999 is added up to create a cumulative exposure map for each month.
- Using fimgstatistic, we compute count rate statistics for each CCDs.
- For observations with high data drop rates (e.g., Crab nebula, Cas A), we corrected the observations by adding events.
Please check more detail plots at Telemetered Photon Dose Trend page.
)
)
)
Statistics:
# IMAGE     NPIX     MEAN        RMS        MIN     MAX
ACIS_may20 6004901       10.805         16.068           0.0     6204


I2 node 0  262654	8.652520	3.690949	0.0	 75.0
I2 node 1  262654	8.892690	4.743161	0.0	1417.0
I2 node 2  262654	8.726666	3.682036	0.0	 96.0
I2 node 3  262654	8.849183	11.271013	0.0	5389.0

I3 node 0  262654	9.808025	14.743593	0.0	6204.0
I3 node 1  262654	9.075568	3.709627	0.0	135.0
I3 node 2  262654	9.184605	3.660014	0.0	104.0
I3 node 3  262654	9.492623	8.189925	0.0	2494.0

S2 node 0  262654	12.821212	4.900007	0.0	108.0
S2 node 1  262654	14.109143	5.916616	0.0	392.0
S2 node 2  262654	14.723338	9.242805	0.0	2455.0
S2 node 3  262654	14.405593	13.504642	0.0	5948.0

S3 node 0  262654	30.520194	31.327231	0.0	306.0
S3 node 1  262654	27.471467	20.880409	0.0	354.0
S3 node 2  262654	22.565177	10.343581	1.0	118.0
S3 node 3  262654	19.261002	6.399112	1.0	 54.0
)
)
)
Statistics:
 IMAGE     NPIX      MEAN        RMS           MIN      MAX
ACIS_total   6004901       2396.772         3089.638           0.0   133982


I2 node 0  262654	2078.405914	414.884648	440.0	12153.0
I2 node 1  262654	2186.258857	583.784221	453.0	106294.0
I2 node 2  262654	2214.003642	468.233415	467.0	12476.0
I2 node 3  262654	2219.438500	572.302214	445.0	28682.0

I3 node 0  262654	2370.253611	583.240567	446.0	11237.0
I3 node 1  262654	2449.128734	1707.752152	475.0	55468.0
I3 node 2  262654	2170.039970	404.302323	439.0	12639.0
I3 node 3  262654	2162.710872	435.177121	406.0	33192.0

S2 node 0  262654	2797.372901	444.670467	1543.0	22074.0
S2 node 1  262654	2964.763488	664.591174	1719.0	16212.0
S2 node 2  262654	3275.140870	665.613503	2146.0	27886.0
S2 node 3  262654	3228.334868	524.311415	1901.0	63992.0

S3 node 0  262654	4936.106338	2346.388640	2162.0	34485.0
S3 node 1  262654	6164.998409	2308.016366	0.0	33067.0
S3 node 2  262654	4907.517122	1290.154785	2148.0	25853.0
S3 node 3  262654	3805.680855	680.072193	2333.0	25267.0
)
|
)
|
)
|
)
|
| Feb 2020 | Nov 2019 | Aug 2019 | May 2019 |
|---|
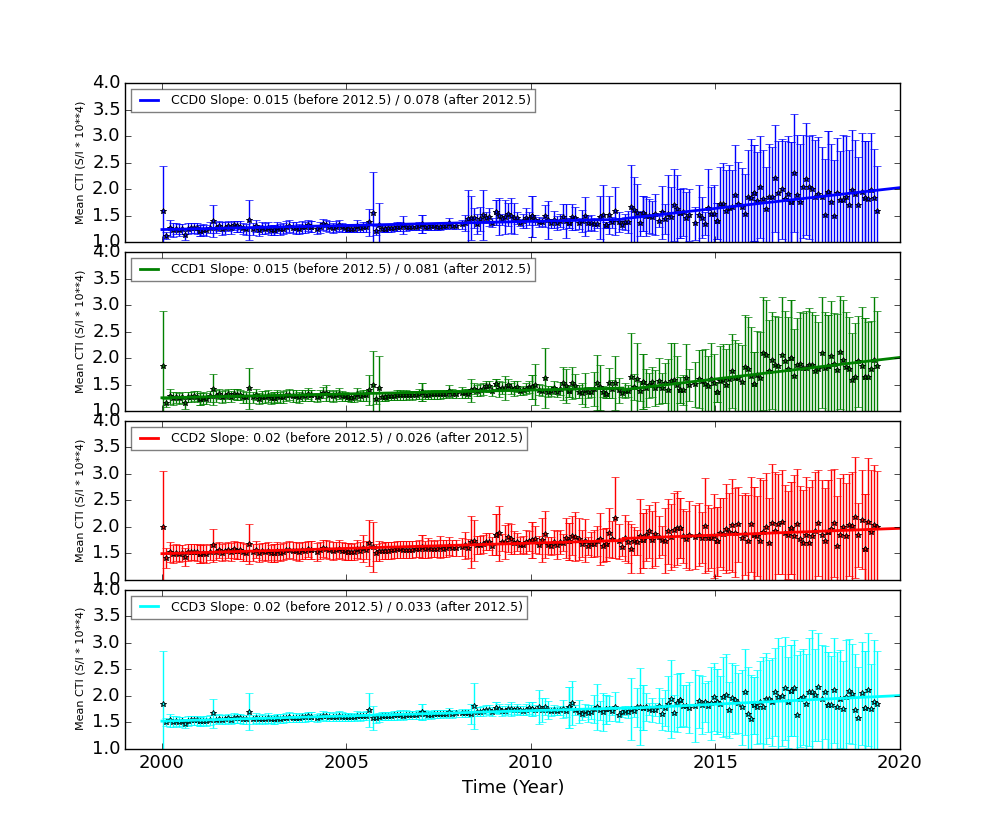
The Mean Detrended CTI
We report CTIs with a refined data definition. CTIs were computed for the temperature dependency corrected data. Please see CTI page for detailed explanation. CTI's are computed for Mn K alpha, and defined as slope/intercept x10^4 of row # vs ADU. Data file: here
Imaging CCDs
Spectral CCDs

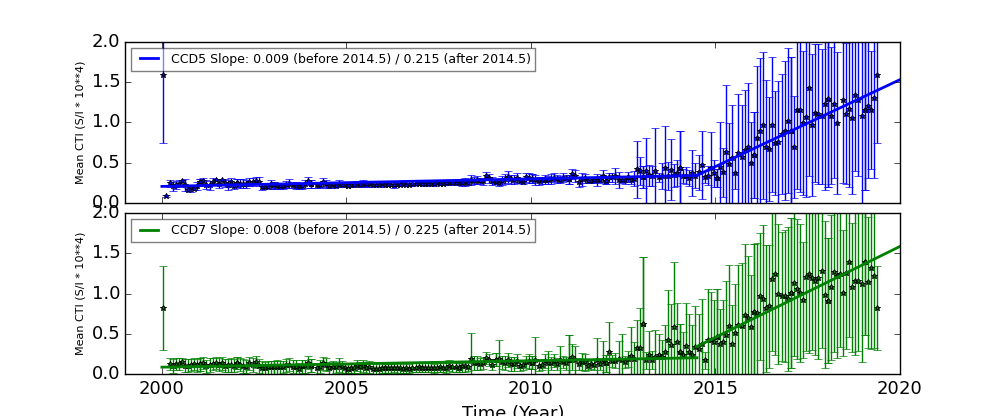
Backside CCDs
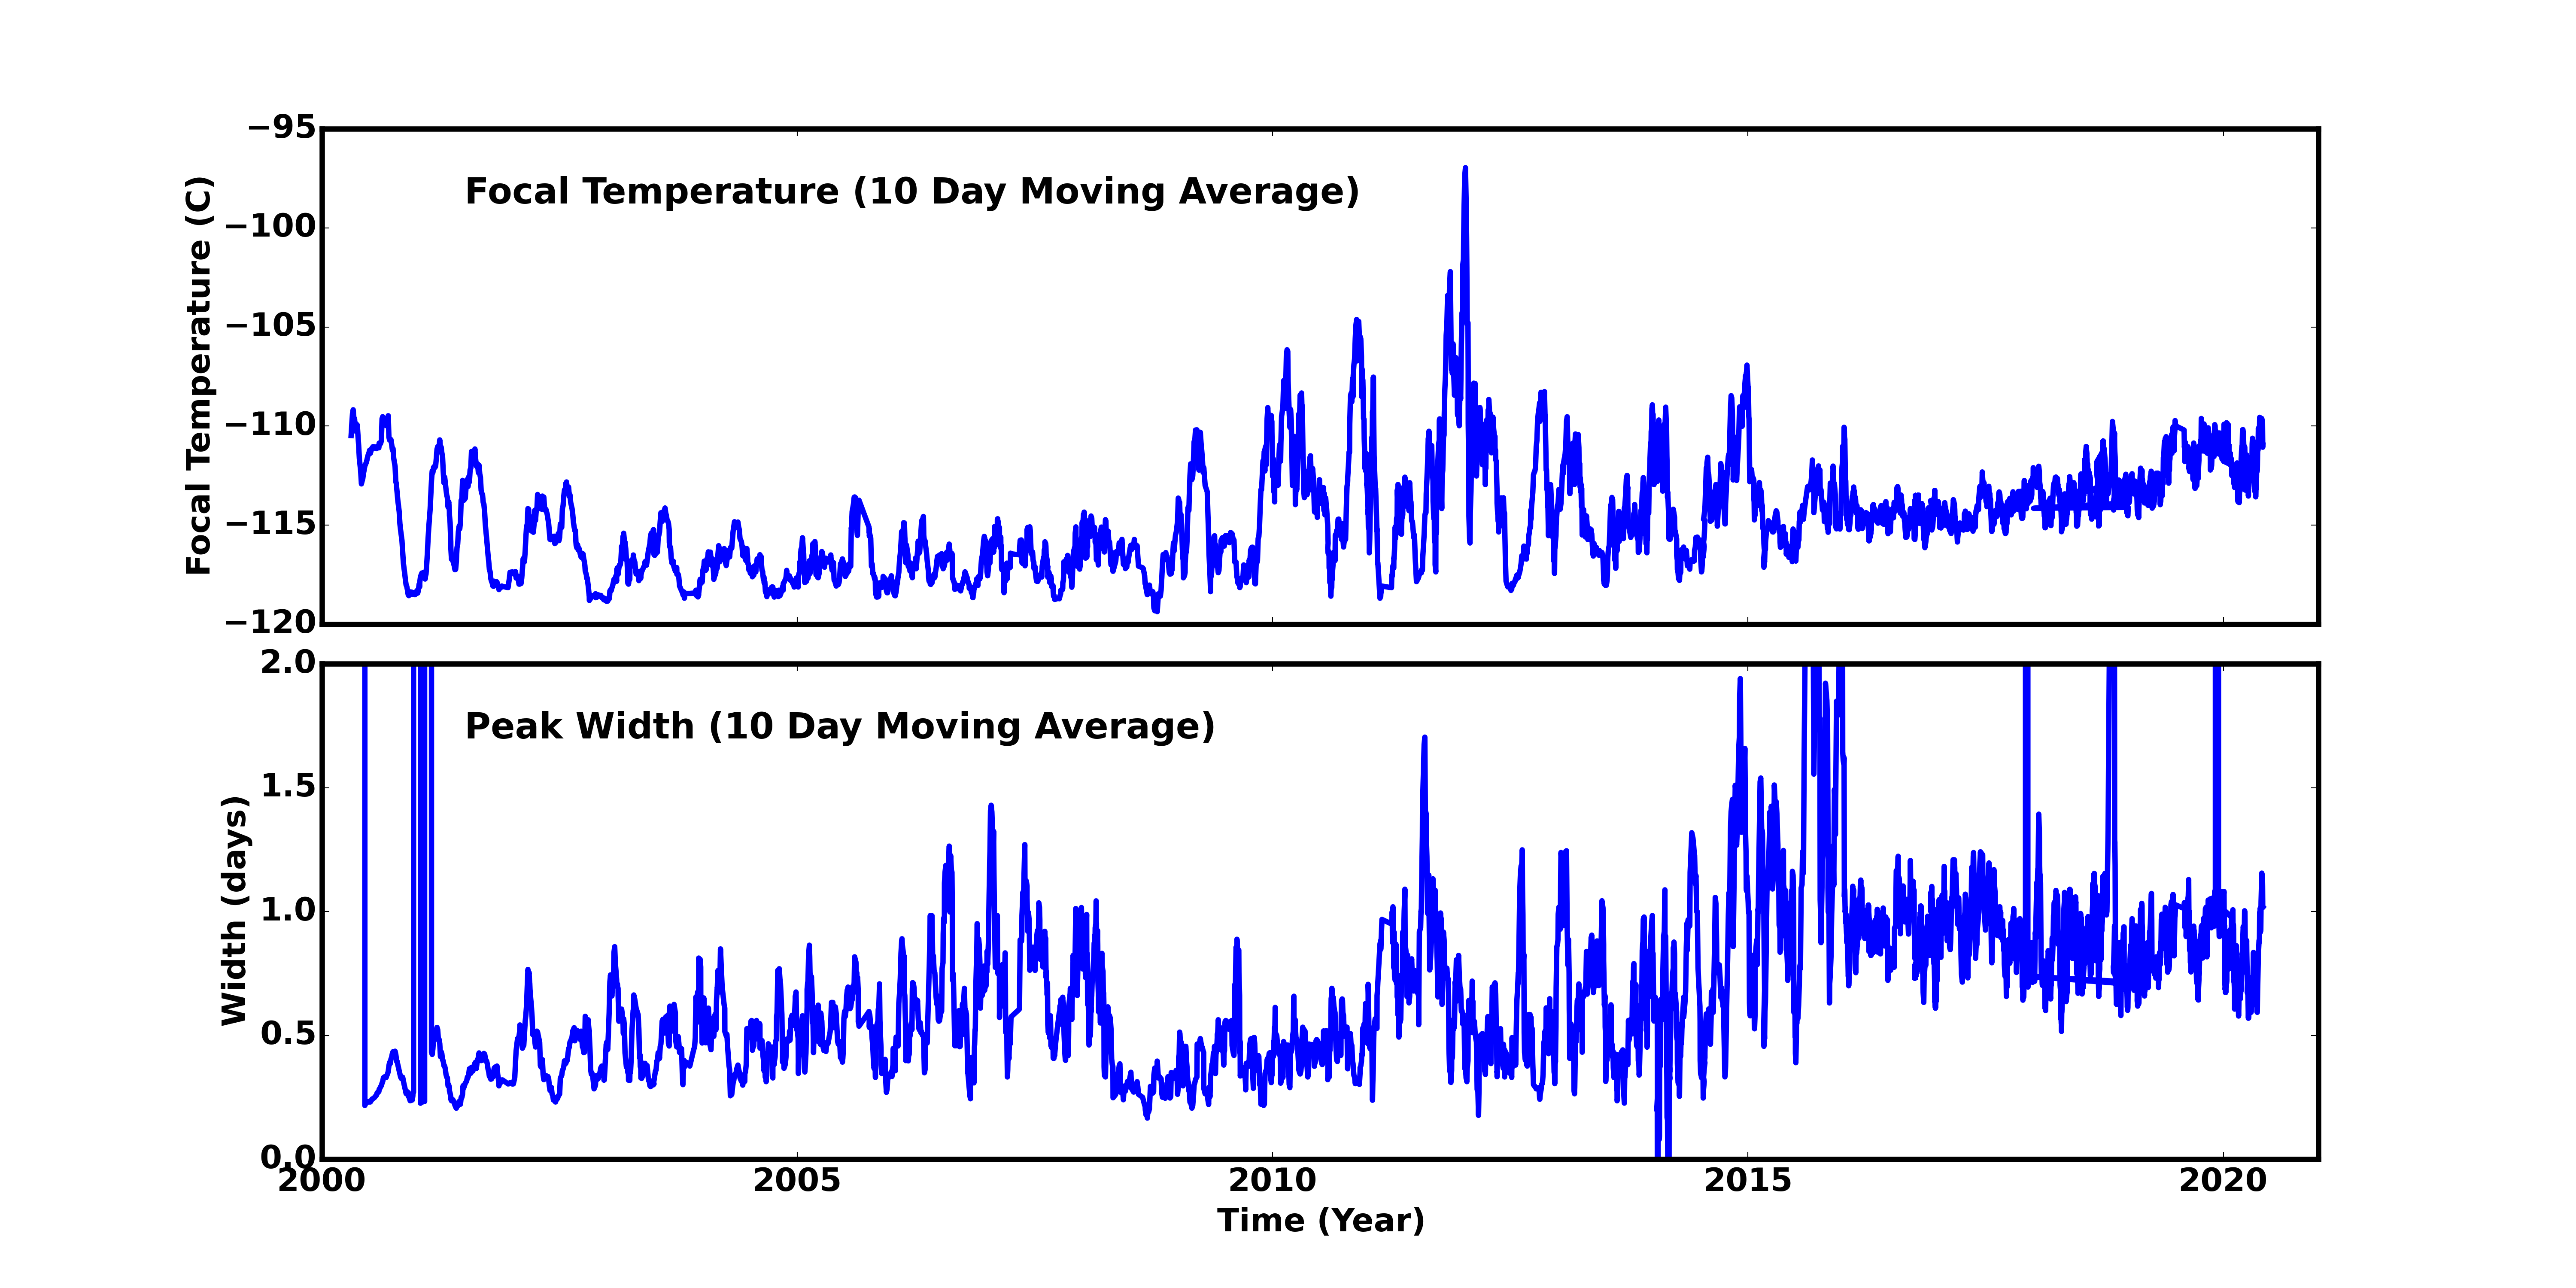
Focal Plane Temperature
May 2020 Focal Temperature
| The Mean (max) FPT: | |
|---|---|
| -111.04 | +/- 3.69 C |
| Mean Width: | |
| 0.87 | +/- 0.48 days |
Averaged Focal Plane Temperature
We are using 10 period moving averages to show trends of peak temperatures and peak widths. Note, the gaps in the width plot are due to missing/corrupted data.
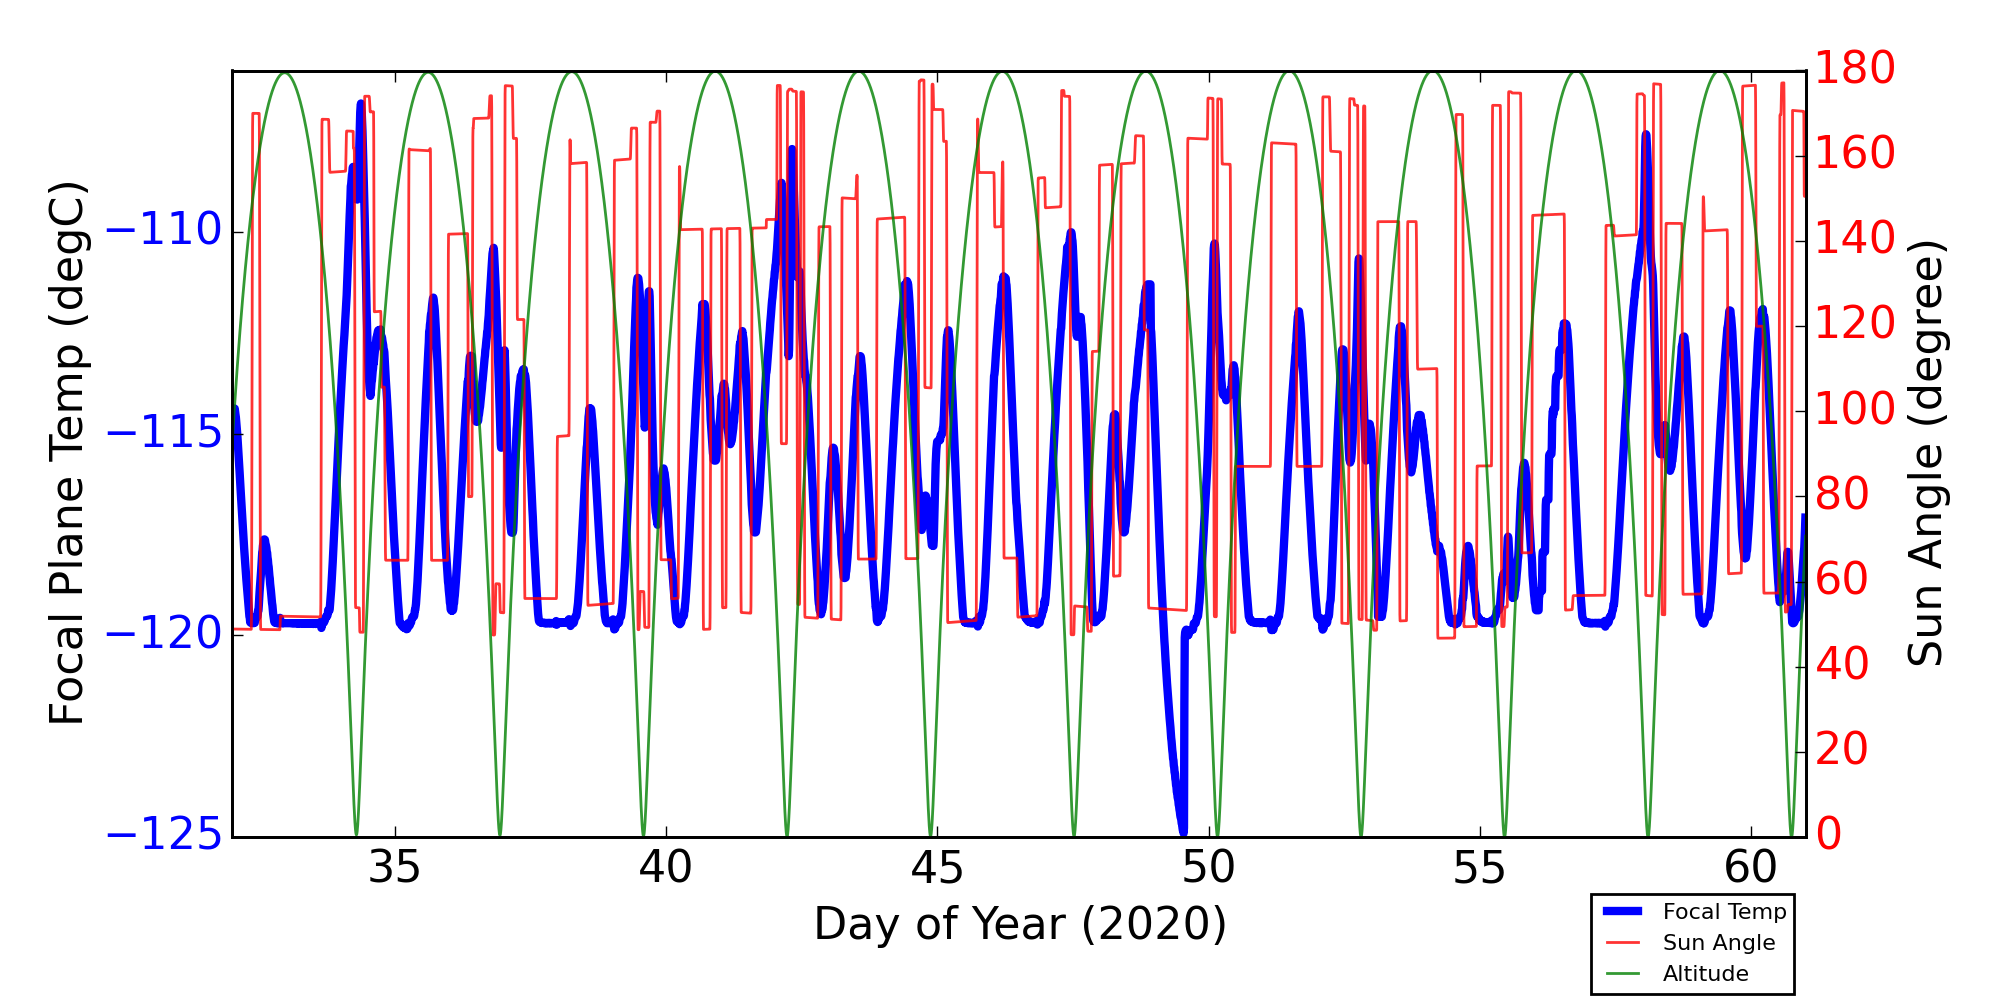
Focal Plane Temperature, Sun Angle and Altitude
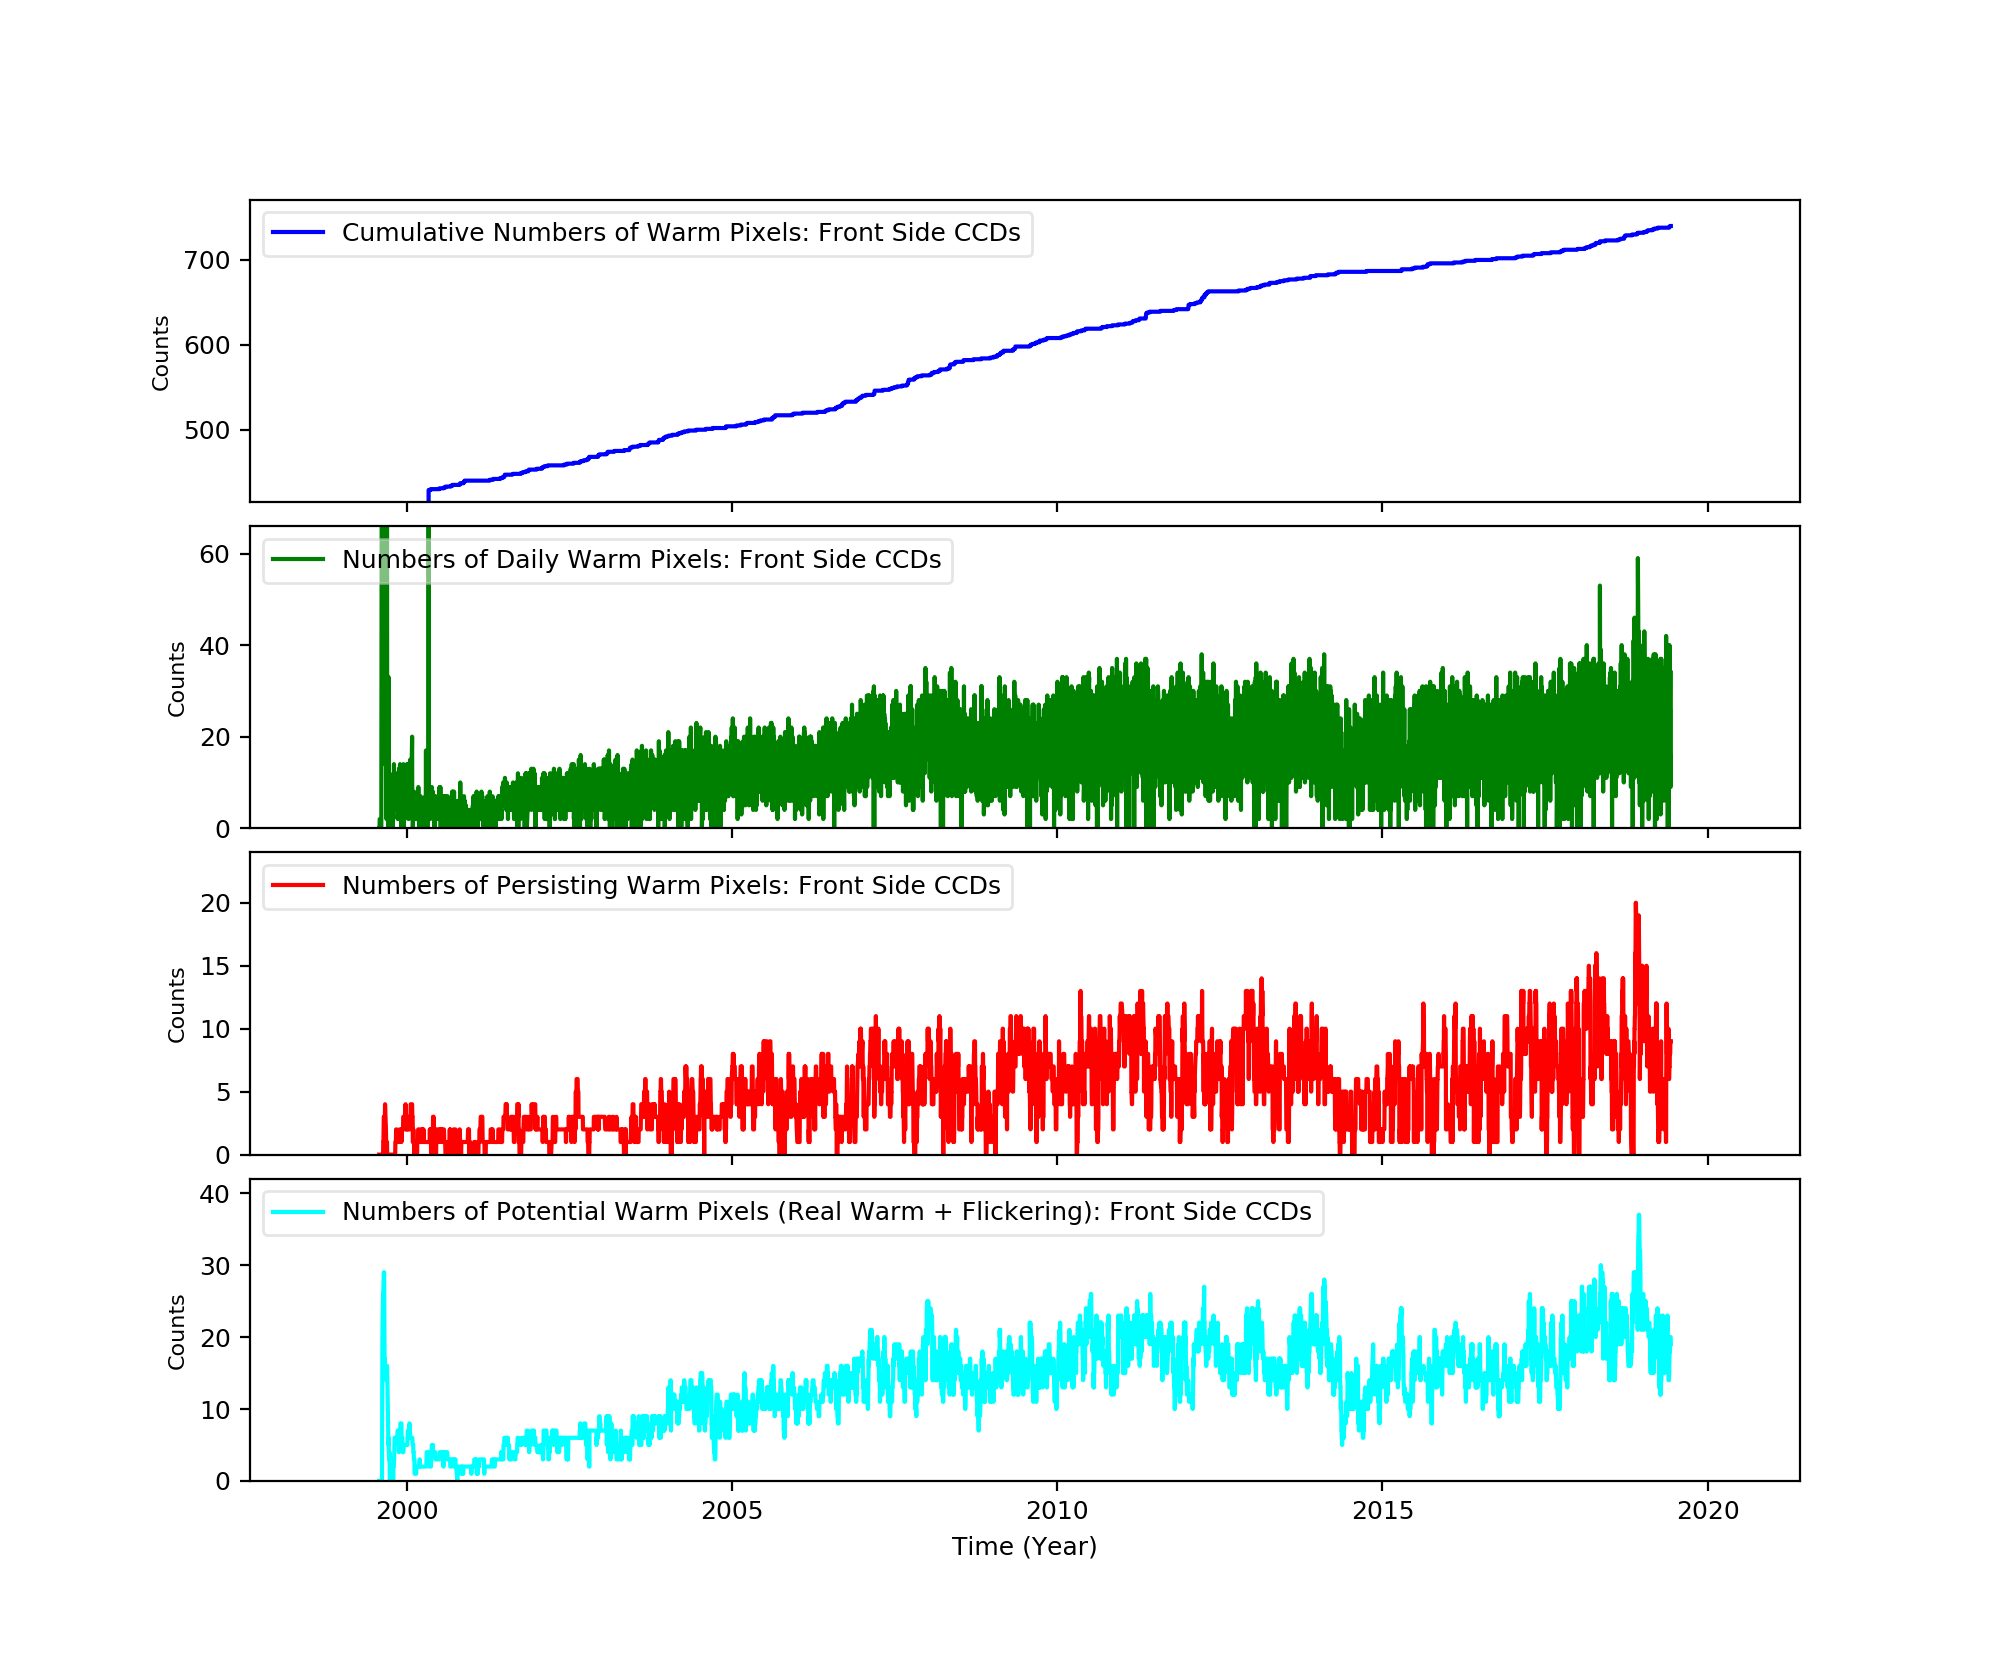
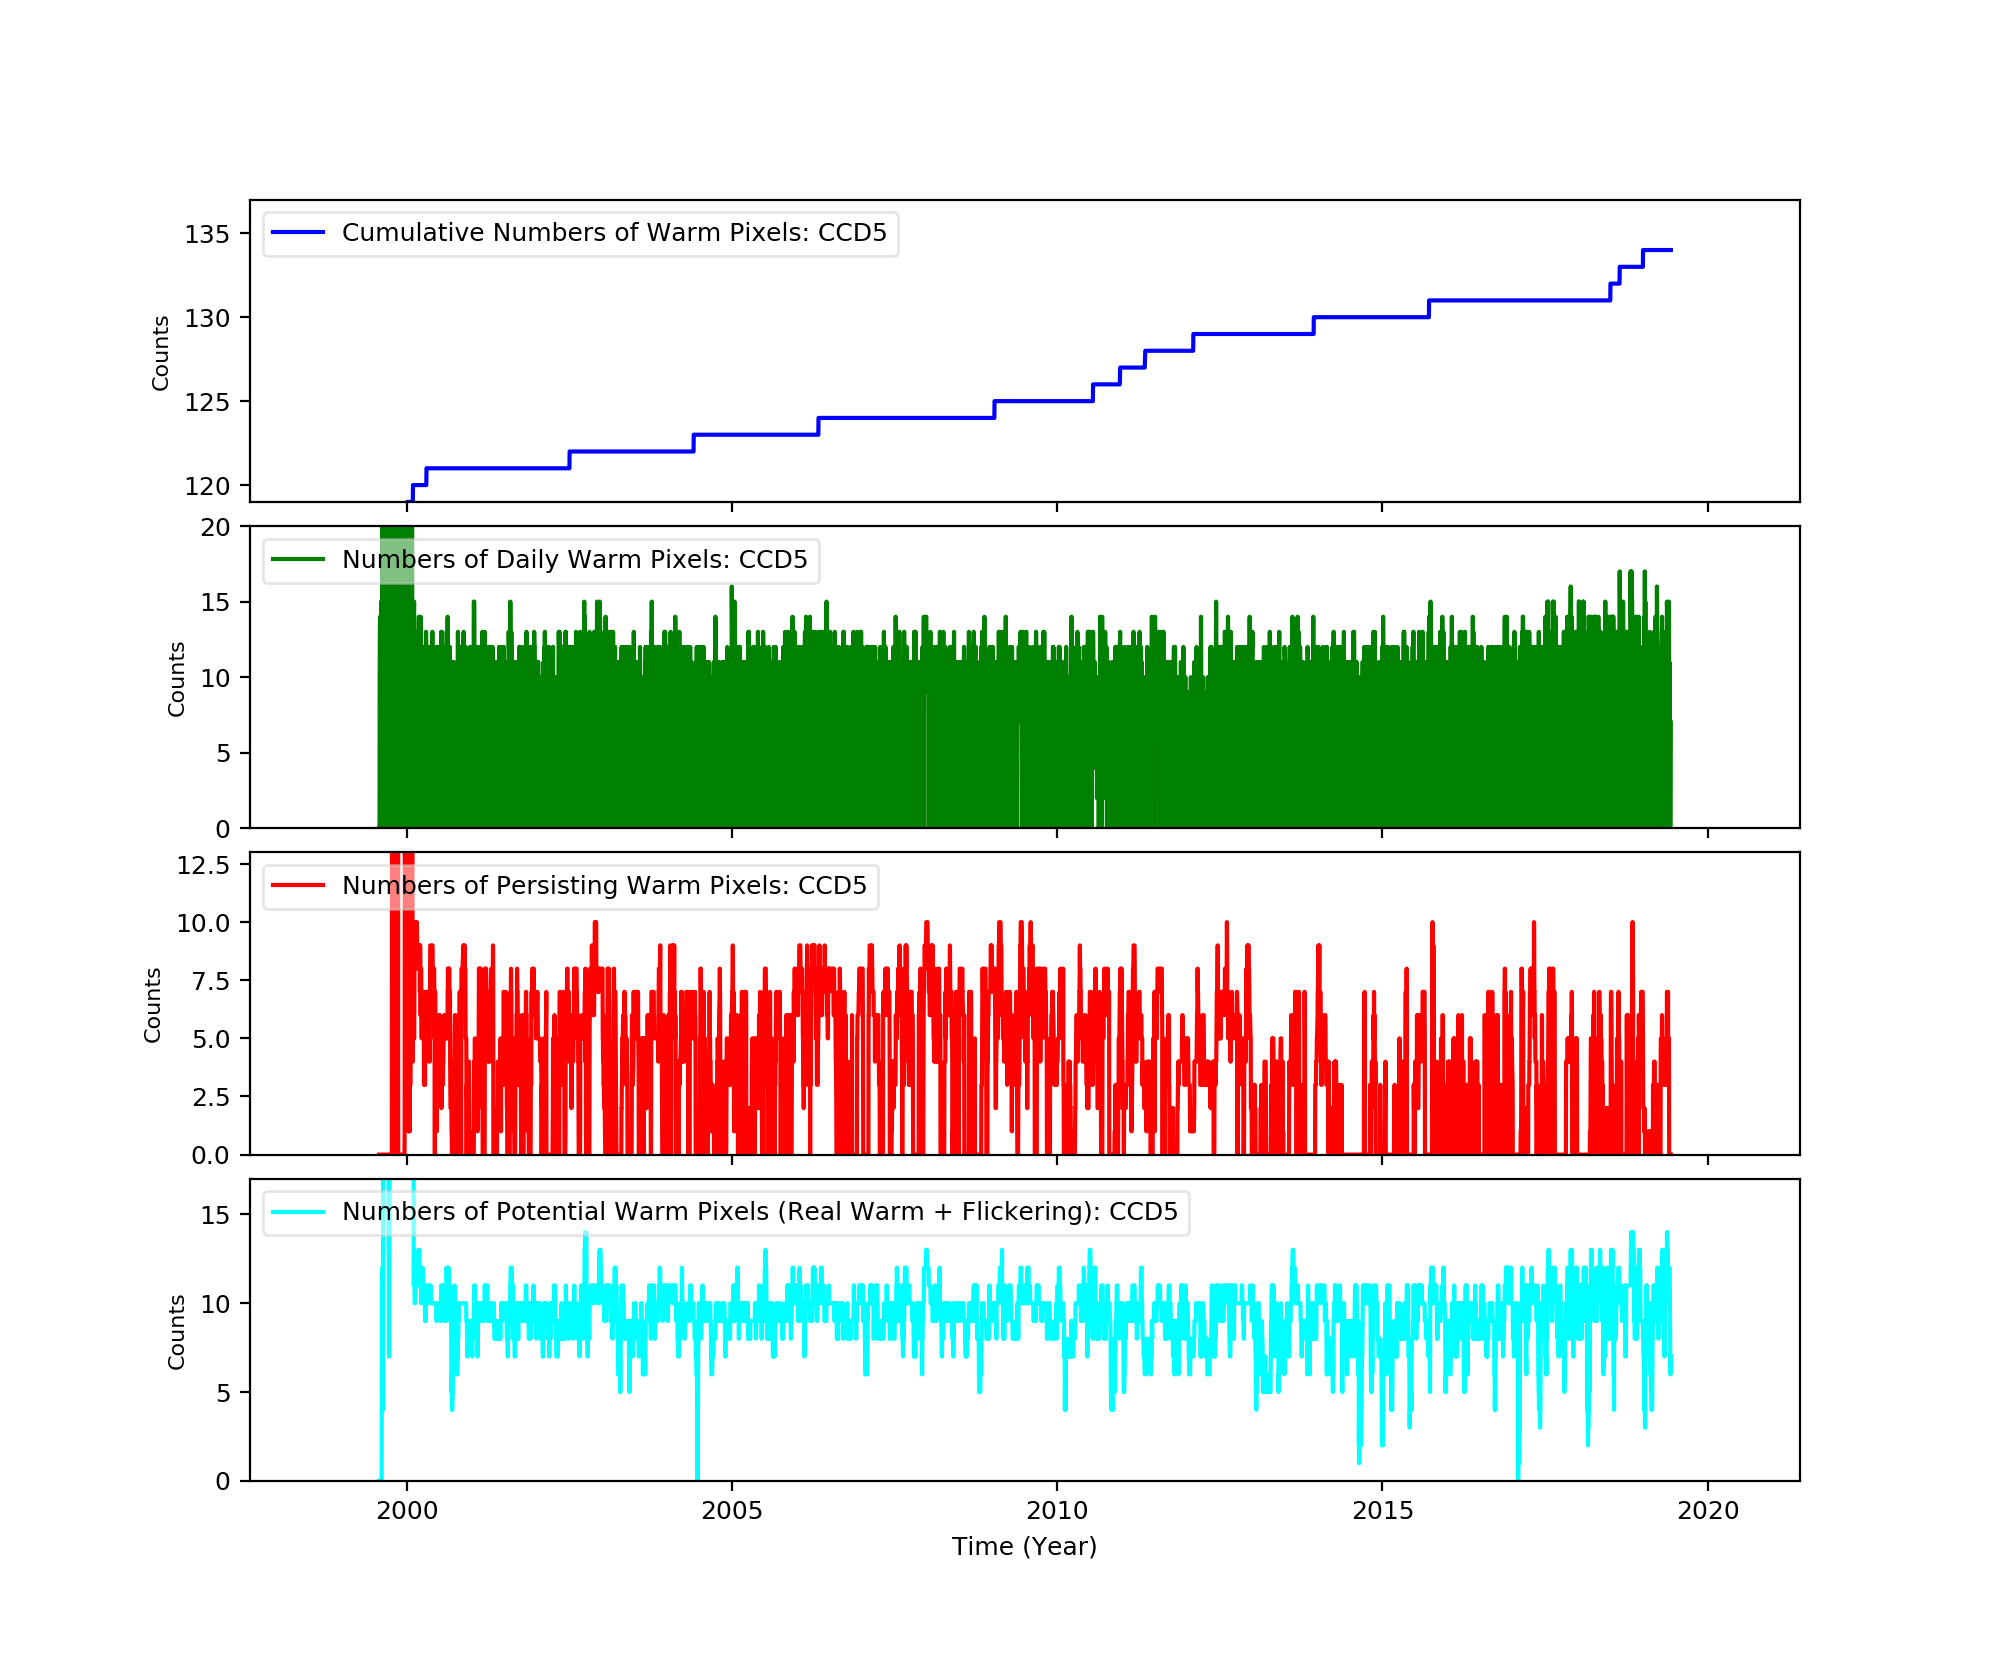
Bad Pixels
The plots below were generated with a new warm pixel finding script. Please see Acis Bad Pixel Page for details.
Front Side CCDs
Back Side CCD (CCD5)
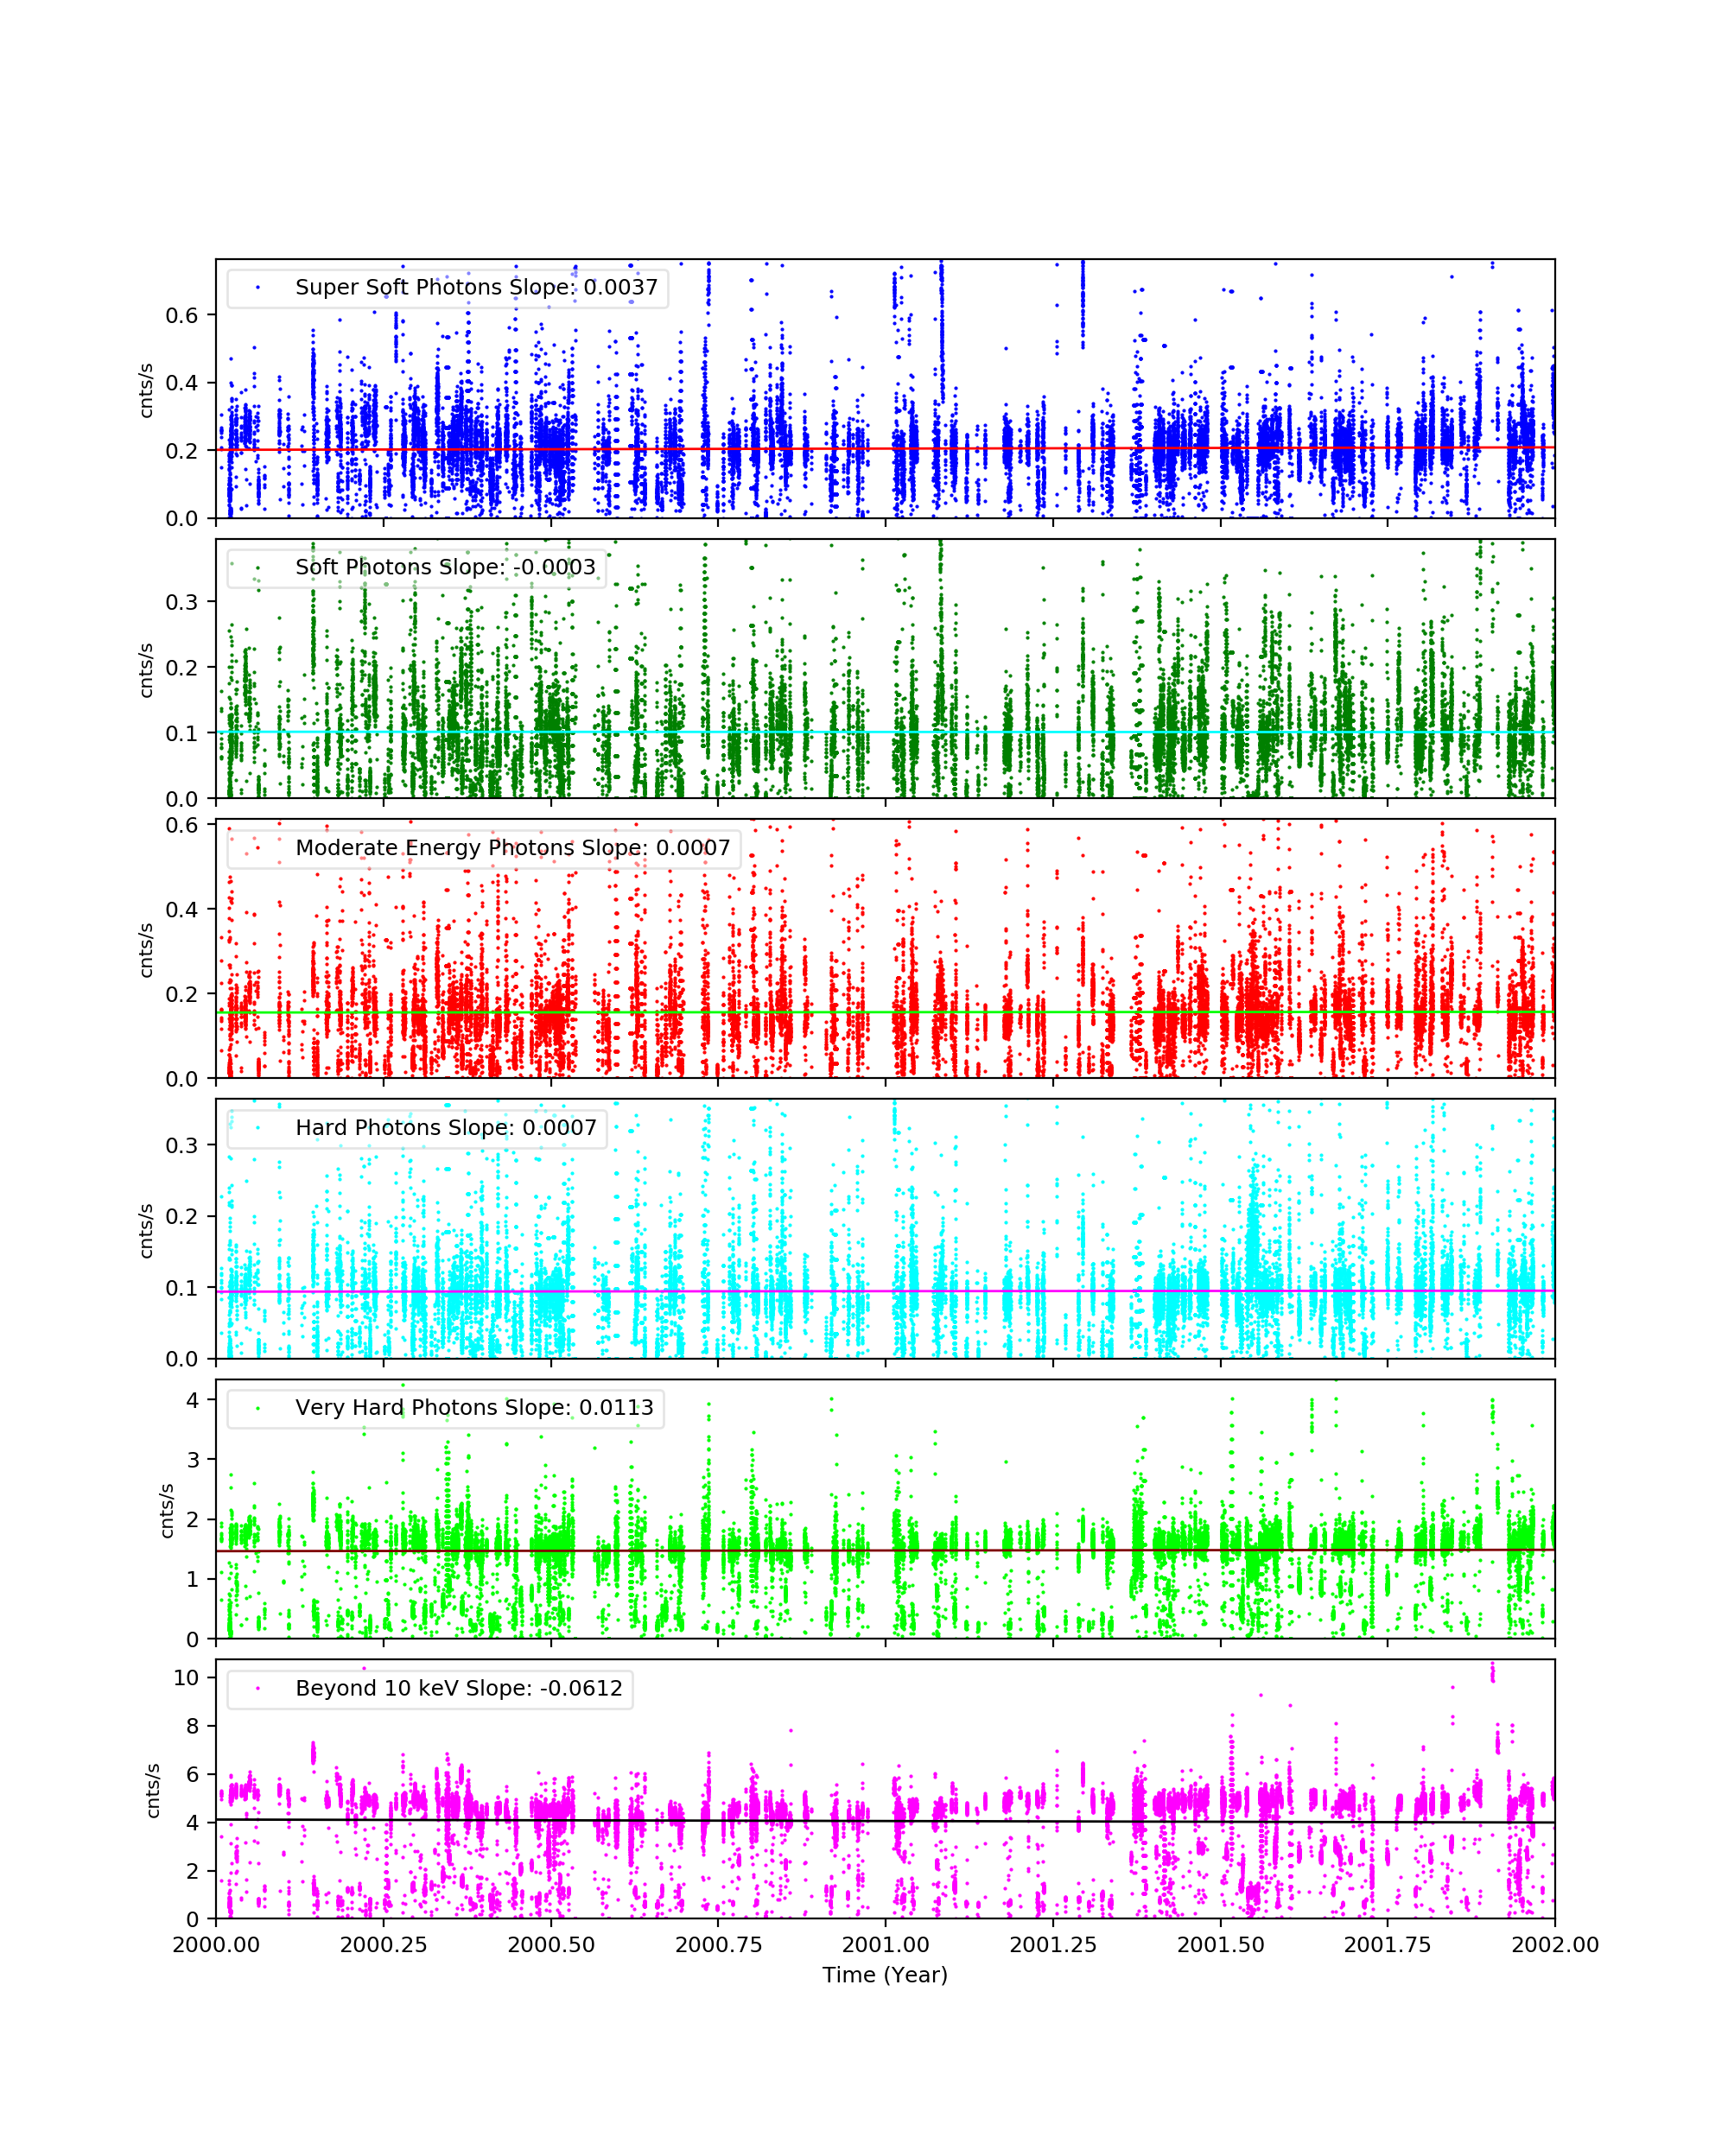
Science Instrument Background Rates
| Name | Low (keV) | High(KeV) | Description |
|---|---|---|---|
| SSoft | 0.00 | 0.50 | Super soft photons |
| Soft | 0.50 | 1.00 | Soft photons |
| Med | 1.00 | 3.00 | Moderate energy photons |
| Hard | 3.00 | 5.00 | Hard Photons |
| Harder | 5.00 | 10.00 | Very Hard photons |
| Hardest | 10.00 | Beyond 10 keV |
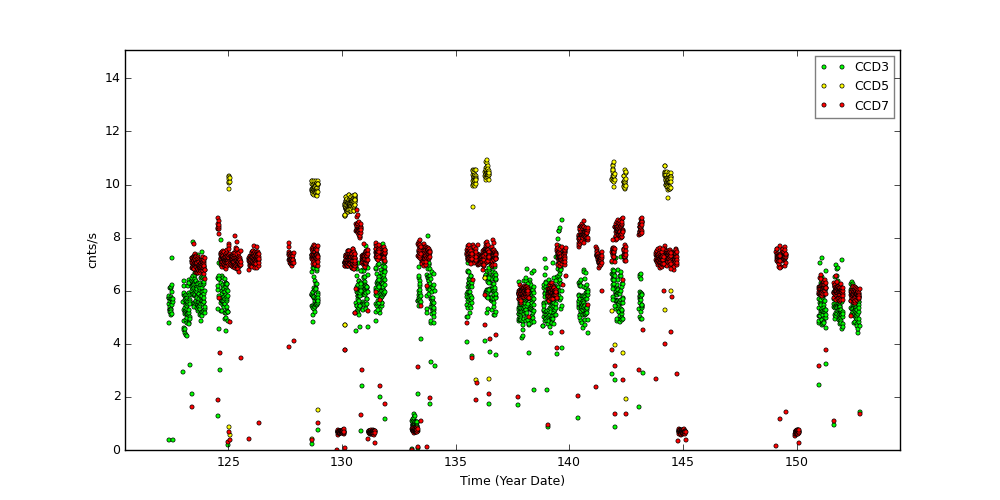
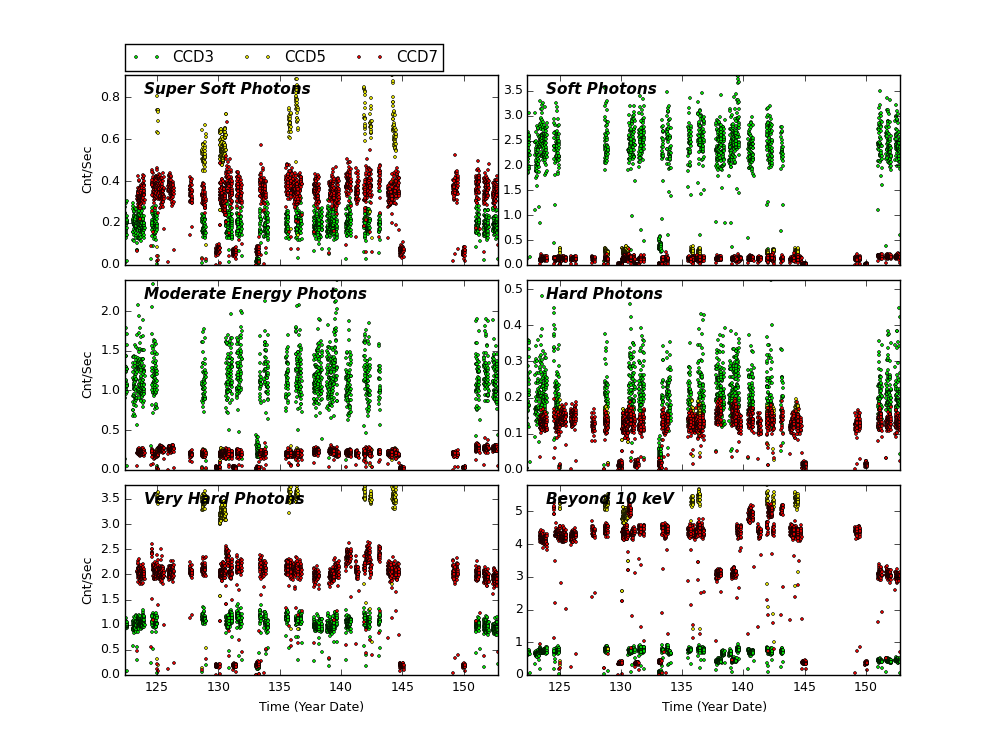
The following three plots show trends of SIB from year 2000. CCDs shown here are CCD3, CCD5, and CCD7. Fitted lines are linear fit after eliminating extreme outliers. For >10 keV plots, 2 lines are fit. One is with a 13 keV filter, and another without.
CCD 3
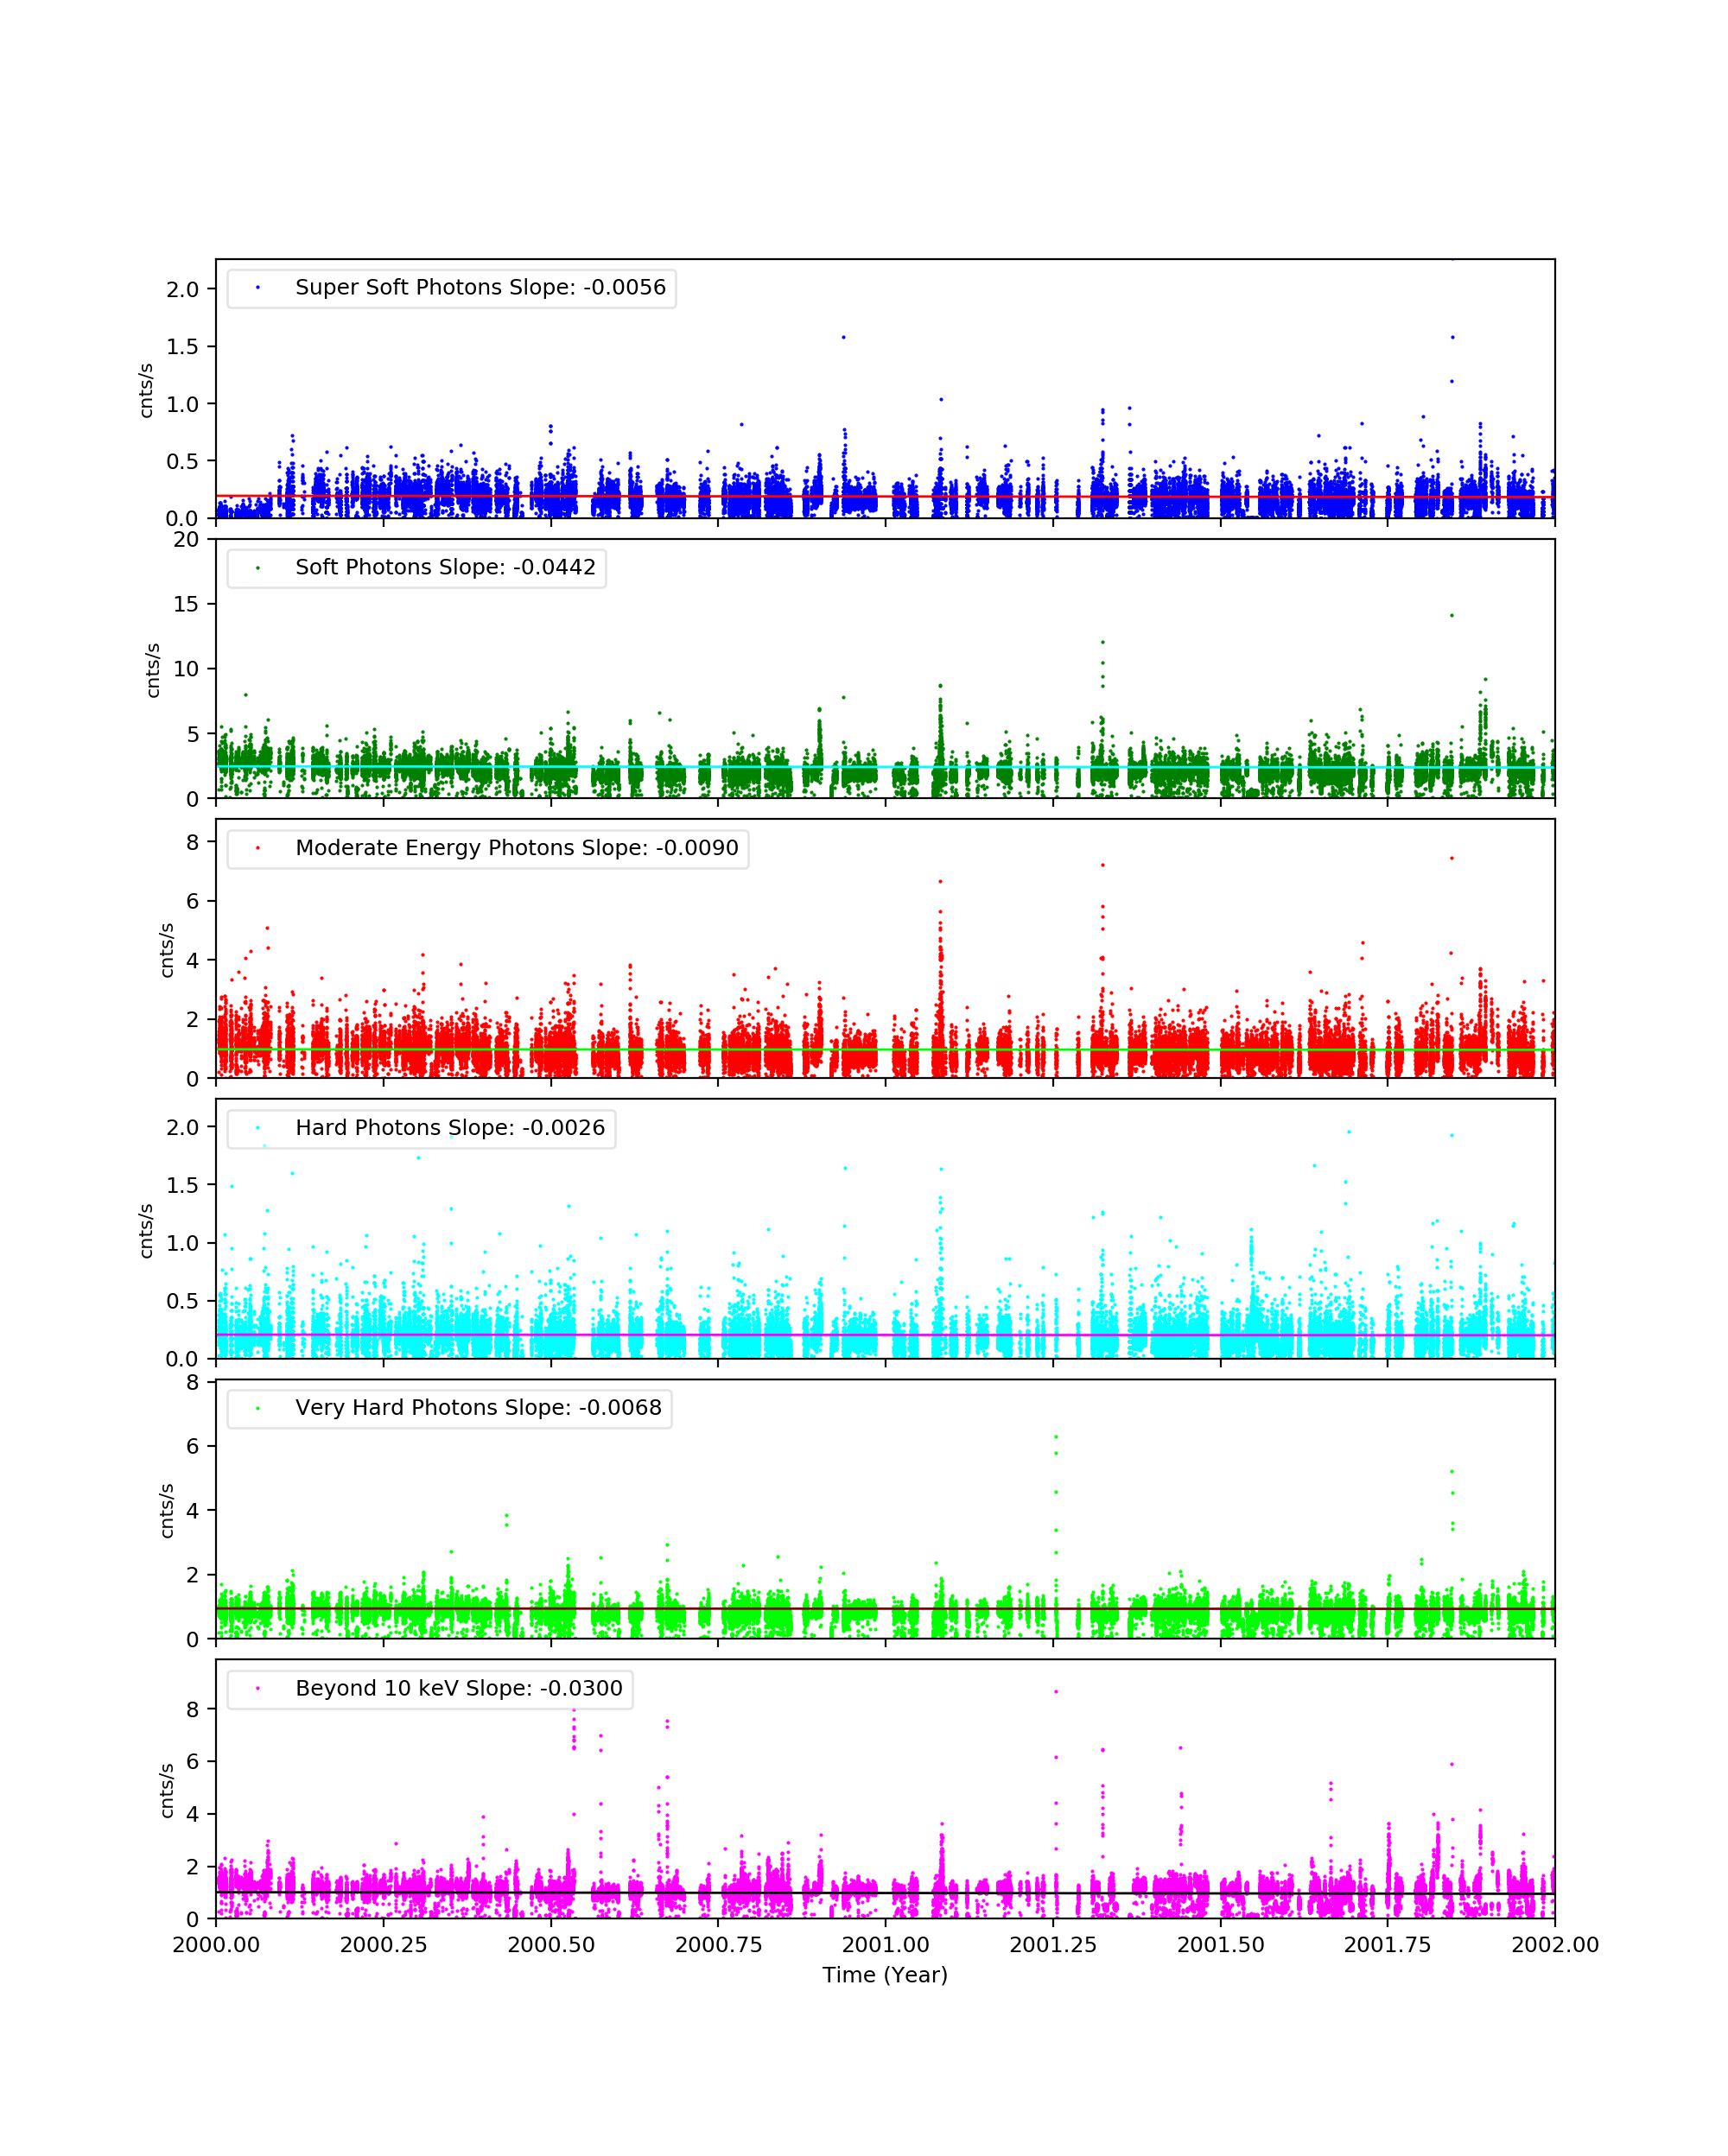
CCD 5
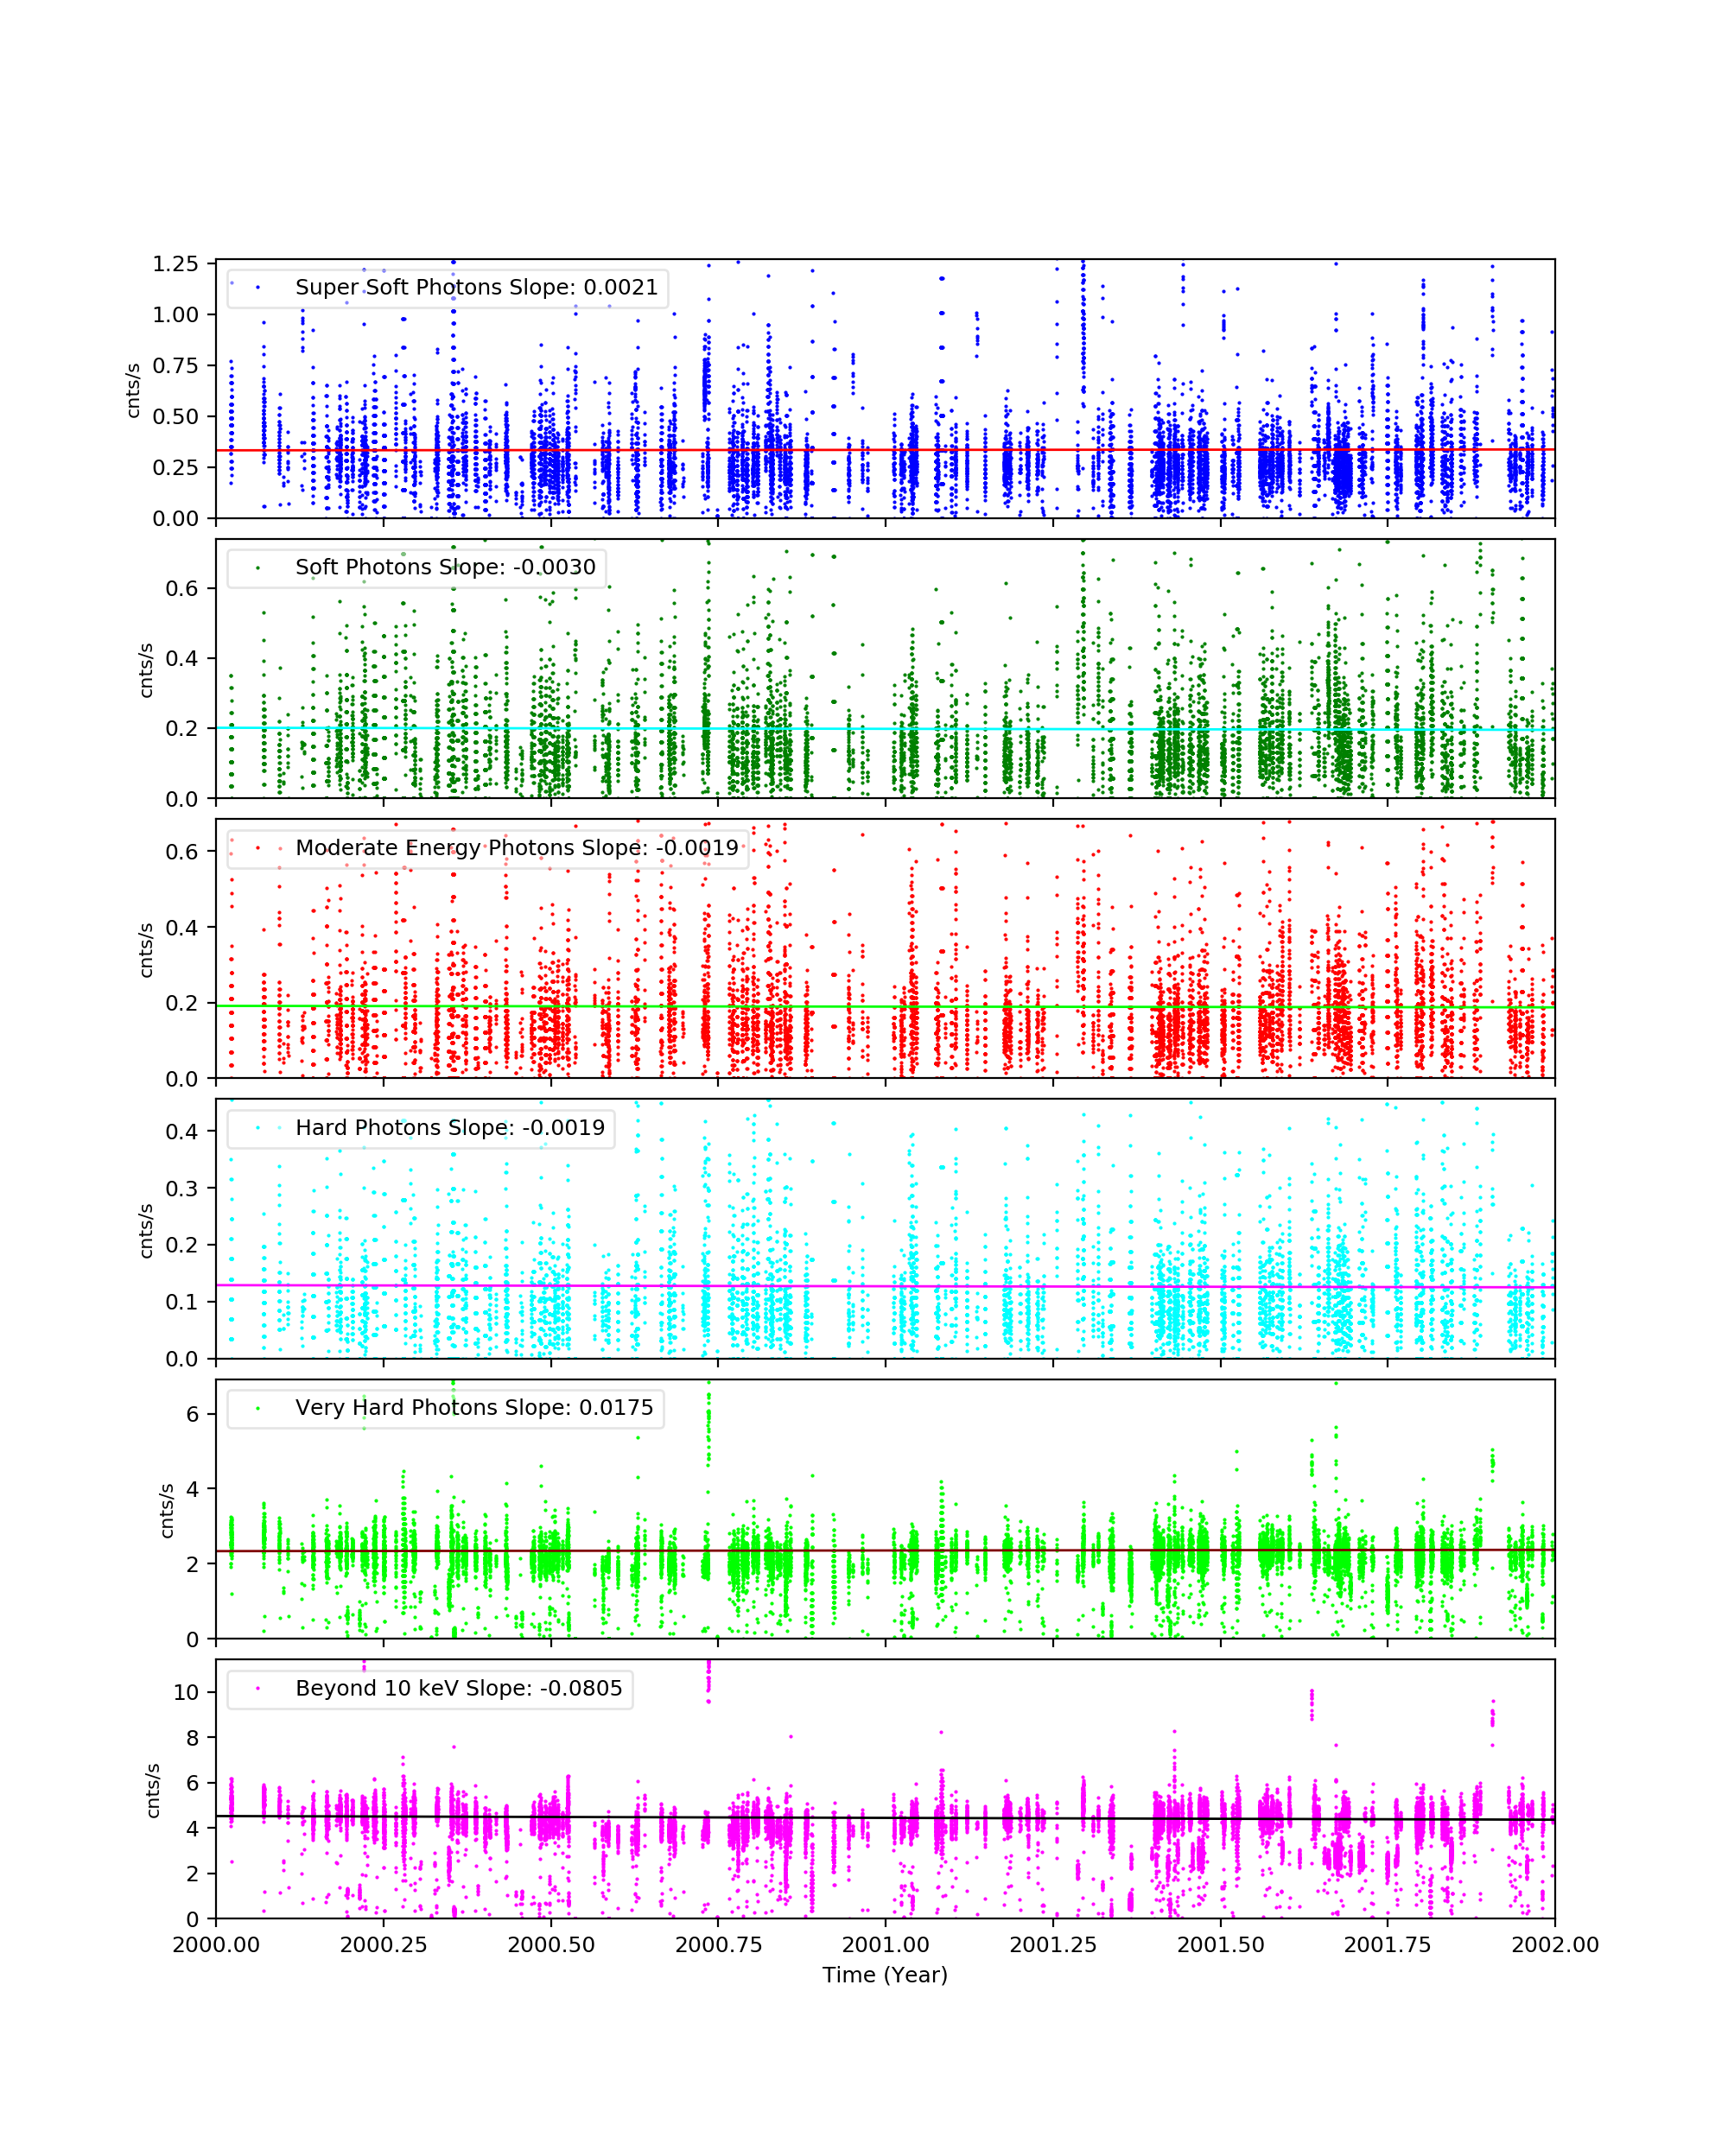
CCD 7
ACIS Histogram Mode Trends
We collected data from acis histogram mode data, and created trend plots of peak portions and peak widths against time (DOM). The peaks were estimated by fitting a simple Gaussian on three peaks (Al, Ti, and Mn), and the widths were estimated by a width at the half max from the peak.
All histogram data are taken under TIMED and GRADED_HIST mode, SIM position is at an external calibration source position, the focal temperature is around -119.7 C, and parameter settings in aciselec, acistemp are set to about same for all.
CCD 3, Peak Position
CCD 3, Peak Widths
CCD 3, Count Rates
HRC
DOSE of Central 4K Pore-Pairs
Please refer to Maximum Dose Trends for more details.
)
|
|---|
IMAGE                NPIX      MEAN    STDDEV      MIN       MAX
HRCI_05_2020.fits  16777216	0.023 	0.154 	0.000 	9.000
)
IMAGE                       NPIX      MEAN    STDDEV      MIN       MAX
HRCI_08_1999_05_2020.fits  16777216	6.425 	6.023 	0.000 	306.000
)
|
|---|
IMAGE                NPIX      MEAN    STDDEV      MIN       MAX
HRCS_05_2020.fits  16777216	0.009 	0.096 	0.000 	3.000
)
IMAGE                       NPIX      MEAN    STDDEV      MIN       MAX
HRCS_08_1999_05_2020.fits  16777216	19.023 	34.213 	0.000 	1750.000
|
|
Max dose trend plots corrected for events that "pile-up"
in the center of the taps due to bad position information.
|
)
|
)
|
)
|
)
|
| Feb 2020 | Nov 2019 | Aug 2019 | May 2019 |
|---|
)
|
)
|
)
|
)
|
| Feb 2020 | Nov 2019 | Aug 2019 | May 2019 |
|---|
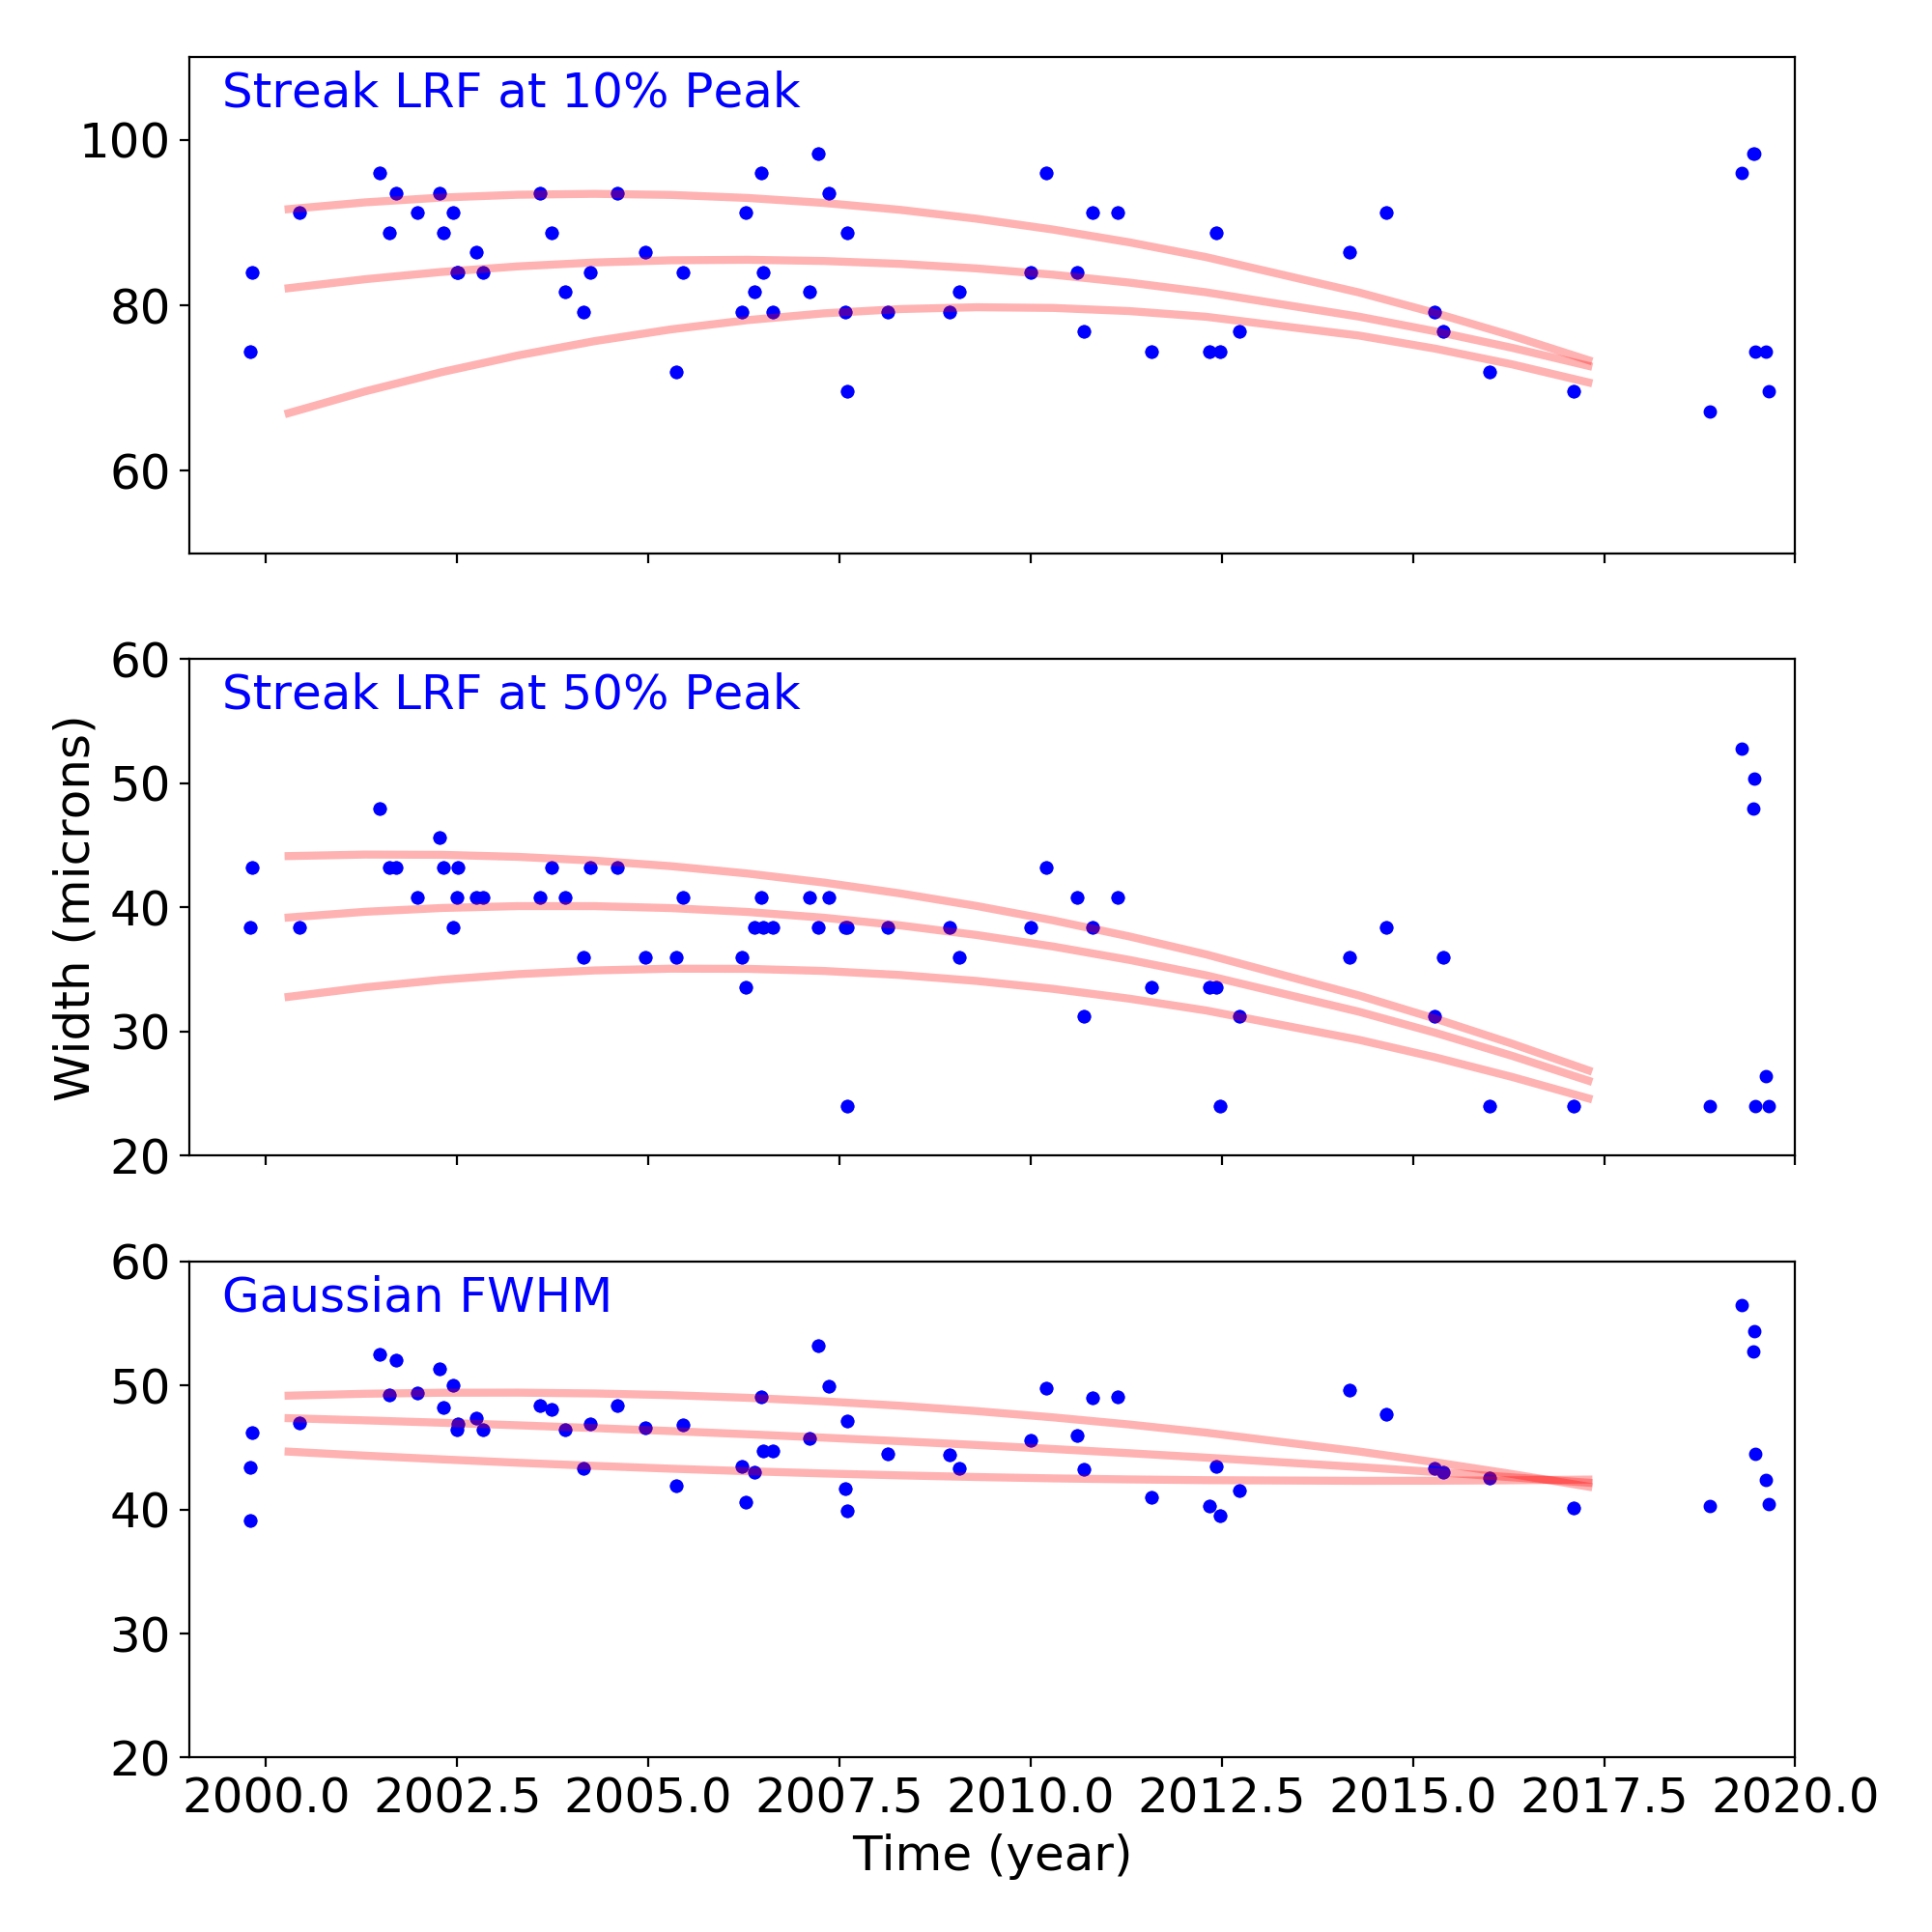
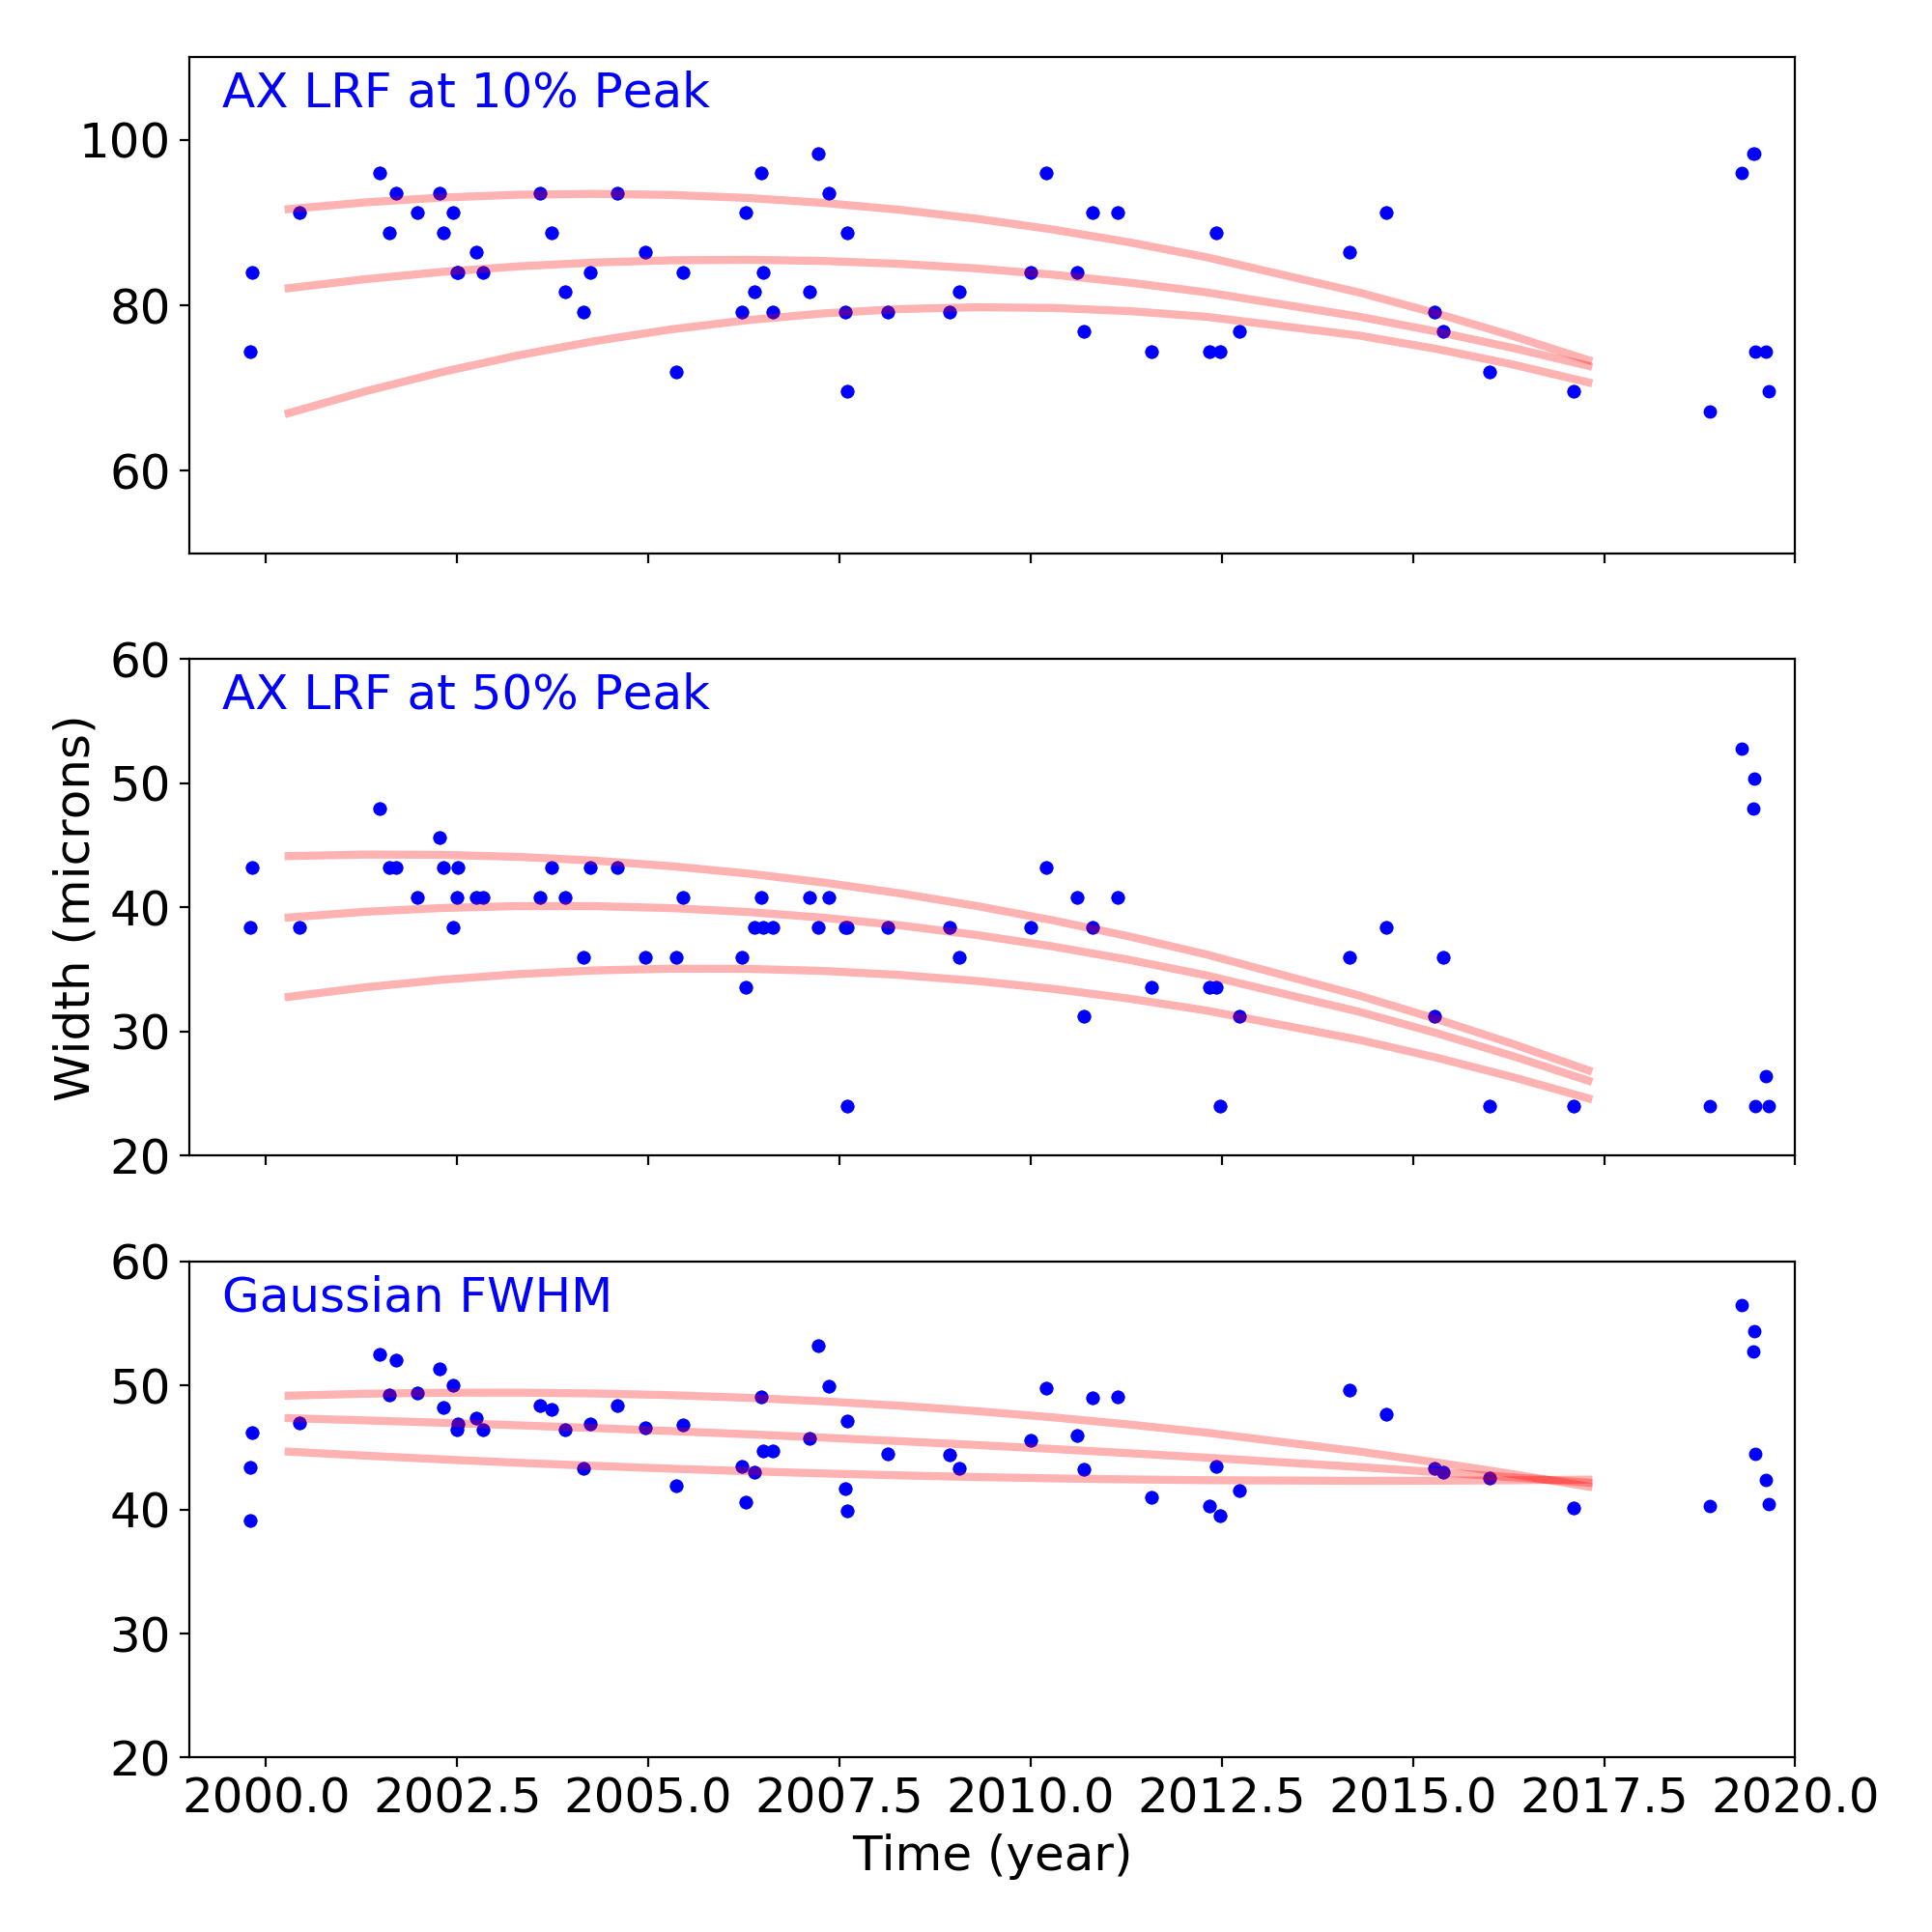
Gratings
Grating Trends/Focus
We plot the width of the zero order streak of ACIS/HETG observations and the width of the zero order image for HRC/LETG observations of point sources. No significant defocusing trend is seen at this time. See Gratings Trends pages.
PCAD
ACA Trending
| ACIS |
)
|
)
|
)
|
|
|---|---|---|---|---|
)
|
)
|
)
| ||
| HRCI |
)
|
)
|
)
|
)
|
| HRCI |
)
|
)
|
)
|
)
|
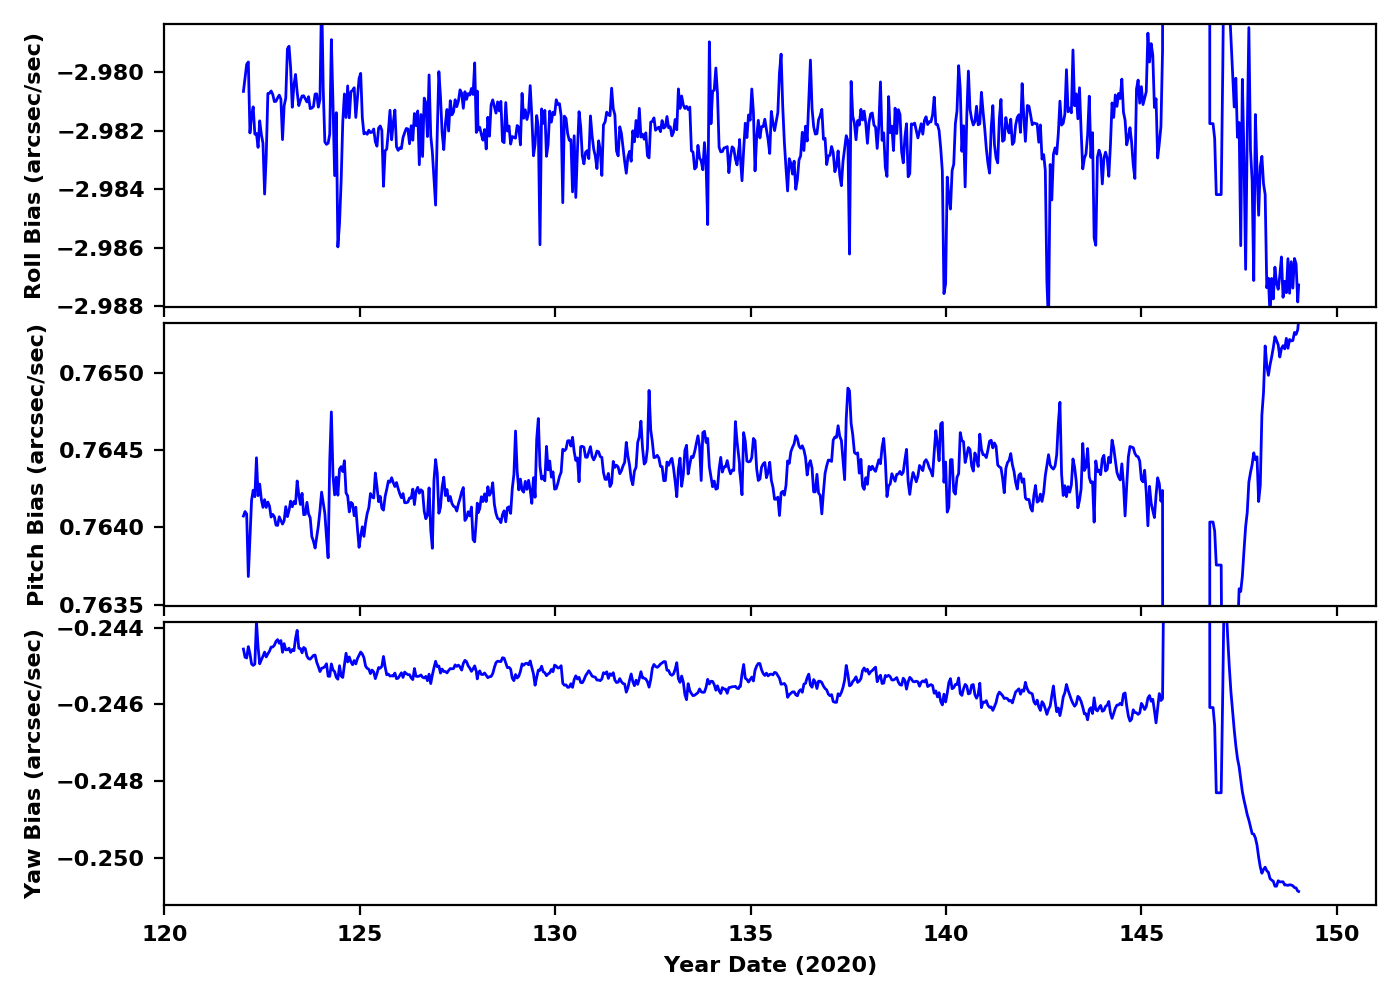
Gyro Bias Drift
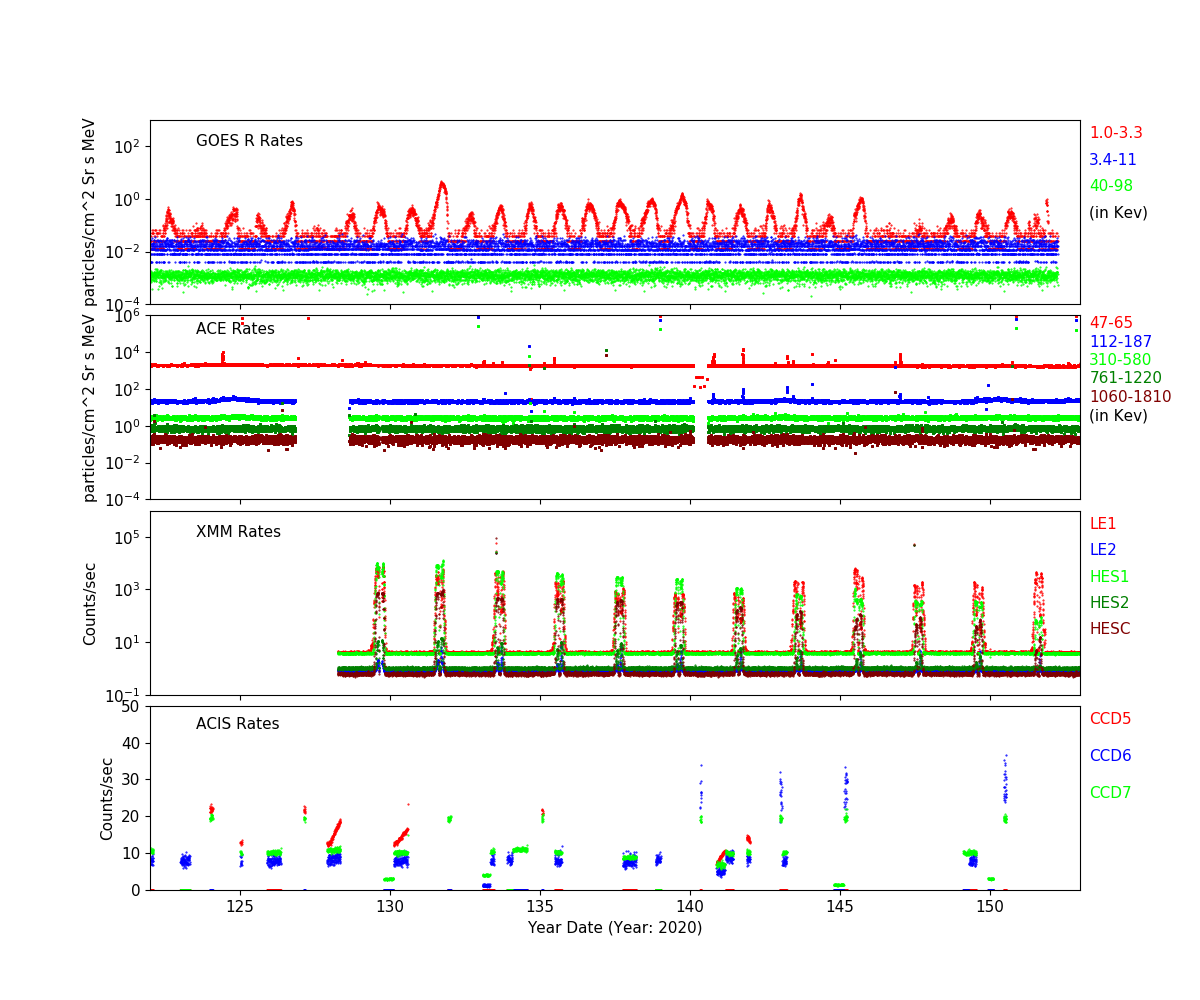
Radiation History
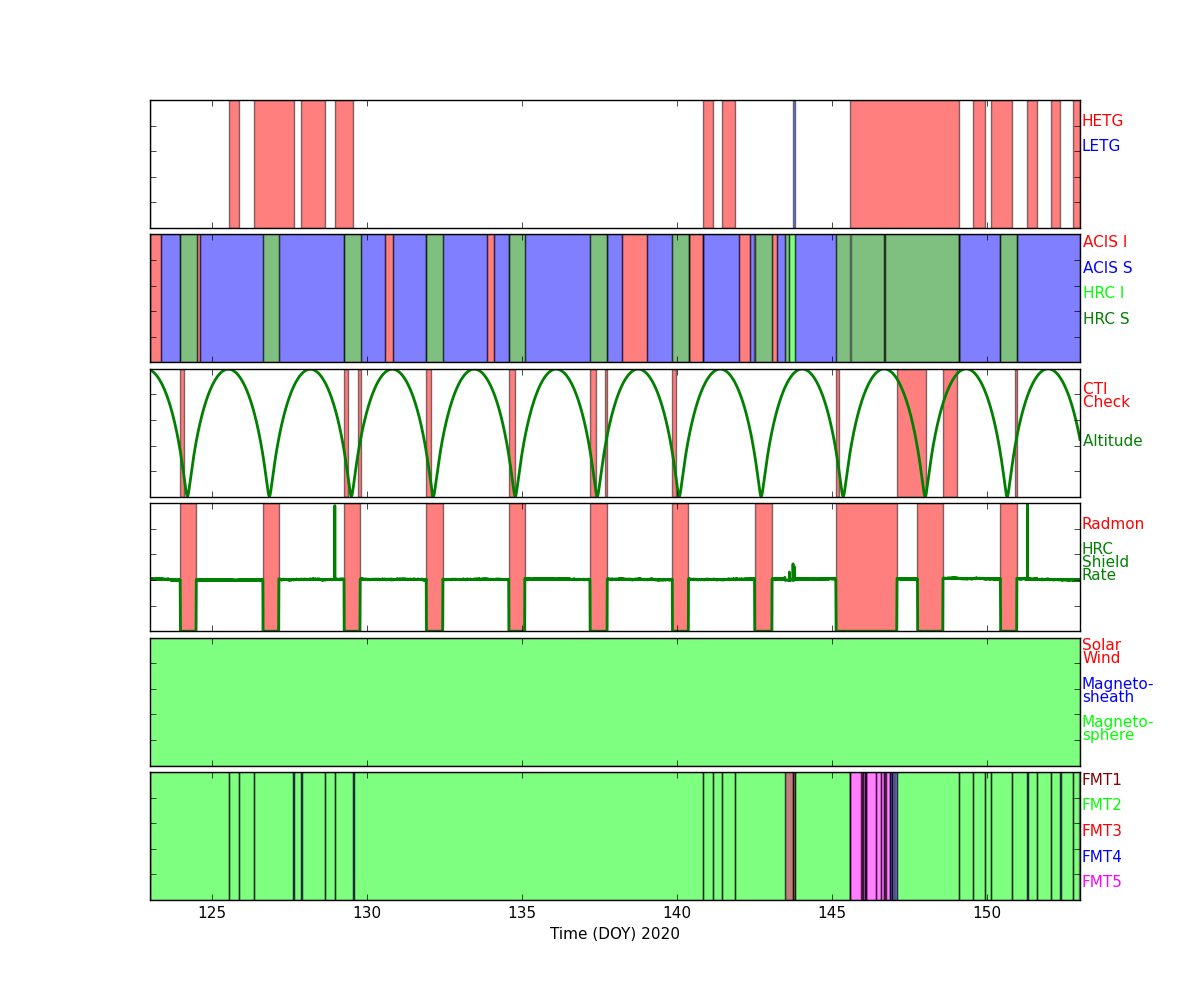
Radiation Count Rates of May 2020
Sun Spot History
Trending
Quarterly Trends
- HRMA Heater
| Previous Quarter | |||||||
| MSID | MEAN | RMS | DELTA/YR | DELTA/YR/YR | UNITS | DESCRIPTION | |
| ohrthr03 | 1.641e-04 | 1.116e-05 | (2.95+/-0.00)e2 | 0.01 +/- 0.00 | K | RT 5: HRMA FORWARD APERTURE PLATE | |
|---|---|---|---|---|---|---|---|
| ohrthr09 | 9.638e-04 | 8.836e-05 | (2.96+/-0.00)e2 | 0.06 +/- 0.03 | K | RT 105: HRMA CAP | |
| ohrthr17 | 0.001 | 9.038e-05 | (2.96+/-0.00)e2 | 0.07 +/- 0.03 | K | RT 125: HSA OUTER CYNLINDER | |
| ohrthr24 | 0.002 | 1.789e-04 | (2.97+/-0.00)e2 | 0.13 +/- 0.10 | K | RT 12: HRMA AFT HEATER PLATE | |
| ohrthr38 | 0.003 | 5.206e-04 | (3.00+/-0.01)e2 | 0.62 +/- 0.37 | K | RT 120: HRMA AFT COLLIMATOR OUTER CYLINDER | |
| ohrthr52 | 9.978e-04 | 9.218e-05 | (2.96+/-0.00)e2 | 0.07 +/- 0.03 | K | RT 100: HRMA CAP | |
- HRMA Thermal
| Previous Quarter | |||||||
| MSID | MEAN | RMS | DELTA/YR | DELTA/YR/YR | UNITS | DESCRIPTION | |
| 4rt568t | 0.003 | 5.542e-04 | (2.99+/-0.01)e2 | 0.47 +/- 0.40 | K | RT 568 - HRMA TEMP | |
|---|---|---|---|---|---|---|---|
| 4rt569t | 9.734e-04 | 1.494e-04 | (2.97+/-0.00)e2 | 0.11 +/- 0.08 | K | RT 569 - HRMA TEMP | |
| 4rt570t | 9.202e-04 | 8.662e-05 | (2.96+/-0.00)e2 | 0.05 +/- 0.03 | K | RT 570 - HRMA TEMP | |
| 4rt575t | 0.005 | 7.338e-04 | (3.04+/-0.02)e2 | 0.77 +/- 0.52 | K | RT 575 - OB CONE TEMP | |
| 4rt576t | 0.003 | 5.389e-04 | (2.95+/-0.01)e2 | 0.55 +/- 0.38 | K | RT 576 - OB CONE TEMP | |
| 4rt578t | 0.004 | 0.001 | (3.02+/-0.03)e2 | 0.81 +/- 0.73 | K | RT 578 - OB CONE TEMP | |
- MUPS
| Previous Quarter | |||||||
| MSID | MEAN | RMS | DELTA/YR | DELTA/YR/YR | UNITS | DESCRIPTION | |
| pm1thv1t | -0.006 | 0.006 | (3.50+/-0.15)e2 | 1.69 +/- 3.78 | K | MUPS 1 THRUSTER VALVE 01 TEMP | |
|---|---|---|---|---|---|---|---|
| pline02t | -0.018 | 0.005 | (3.31+/-0.12)e2 | 1.11 +/- 3.42 | K | PROP LINE TEMP 02 | |
| pline03t | -0.027 | 0.007 | (3.28+/-0.15)e2 | 2.00 +/- 3.63 | K | PROP LINE TEMP 03 | |
| pline04t | -0.021 | 0.005 | (3.13+/-0.11)e2 | 2.53 +/- 3.06 | K | PROP LINE TEMP 04 | |
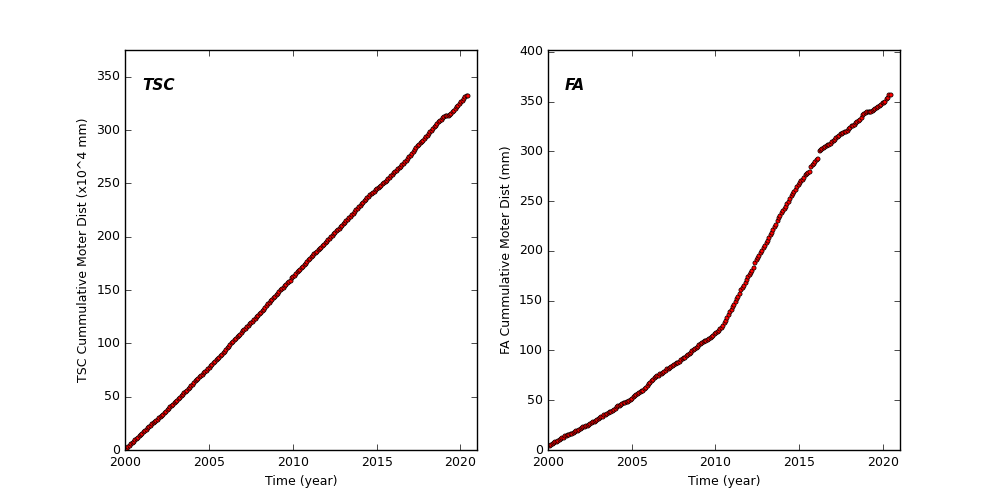
Spacecraft Motions
TSC and FA Cummulative Moter Distance
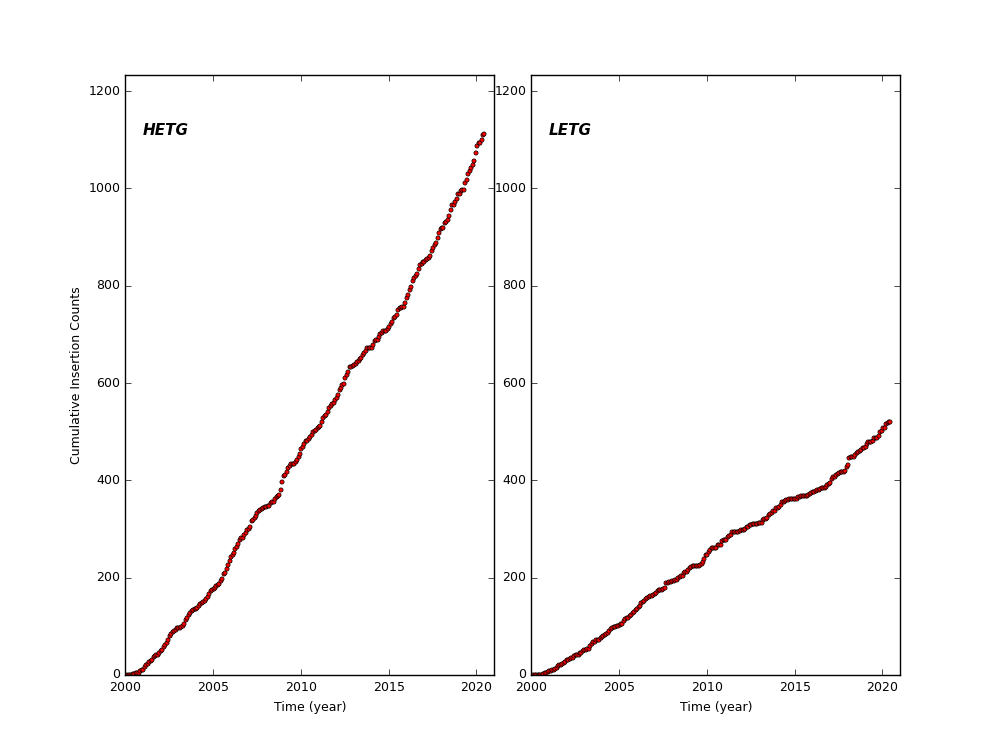
HETG and LETG Cummulative Insertion Counts
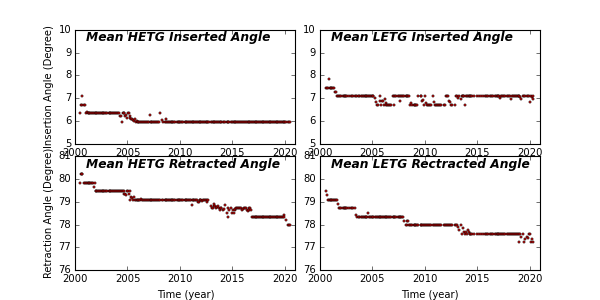
HETG/LETG Insertion/Retraction Angle
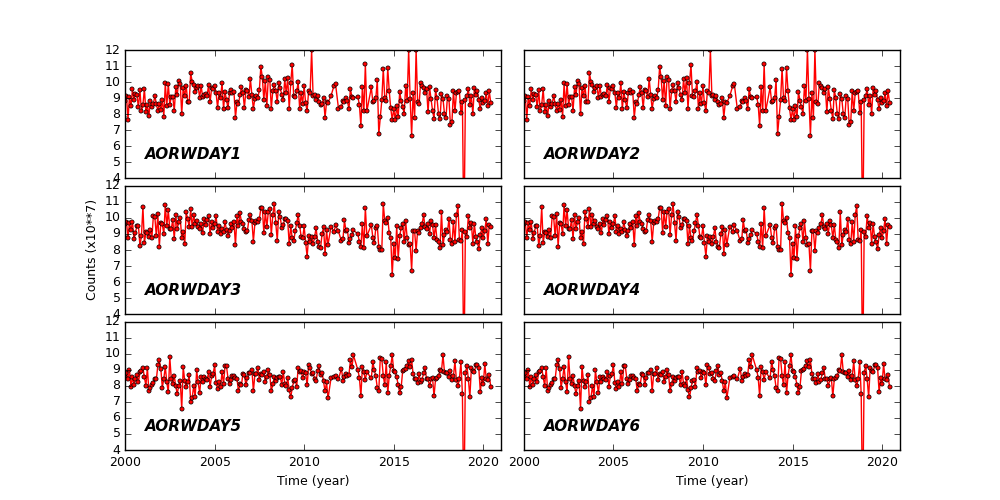
Reaction Wheel Rotations