ACIS
ACIS DOSE Registered-Photon-Map
The steps we took to compute the dose map are;
- Level 1 Event files for a specified month are obtained from archive.
- Image data including I2, I3, S2, S3 CCDs are extracted from all event files.
- All the extracted image data were merged to create a month long exposure map for the month.
- The exposure map is opened with ds9, and check a distribution of count rates against energy. From this, estimate the upper threshold value. Any events beyond this upper threshold are assumed erroneous events such as bad pixels.
- Using this upper threshold, the data is filtered, and create a cleaned exposure map for the month.
- The exposure map from each month from the Sep 1999 is added up to create a cumulative exposure map for each month.
- Using fimgstatistic, we compute count rate statistics for each CCDs.
- For observations with high data drop rates (e.g., Crab nebula, Cas A), we corrected the observations by adding events.
Please check more detail plots at Telemetered Photon Dose Trend page.
)
)
)
Statistics:
# IMAGE     NPIX     MEAN        RMS        MIN     MAX
ACIS_aug20 6004901       6.308         15.433           0.0     3114


I2 node 0  262654	5.819430	2.885754	0.0	 53.0
I2 node 1  262654	6.112497	4.644117	0.0	1778.0
I2 node 2  262654	5.940810	2.900054	0.0	 63.0
I2 node 3  262654	6.008519	3.292196	0.0	535.0

I3 node 0  262654	7.382319	3.486875	0.0	128.0
I3 node 1  262654	7.186468	6.673238	0.0	2960.0
I3 node 2  262654	7.097680	3.187974	0.0	 95.0
I3 node 3  262654	7.059473	6.884173	0.0	3114.0

S2 node 0  262654	6.658383	7.353824	0.0	552.0
S2 node 1  262654	6.989912	8.567365	0.0	749.0
S2 node 2  262654	7.330411	8.742987	0.0	569.0
S2 node 3  262654	7.215831	10.366577	0.0	1977.0

S3 node 0  262654	13.905051	51.222235	0.0	2265.0
S3 node 1  262654	12.940223	14.421204	0.0	854.0
S3 node 2  262654	12.523568	12.559949	0.0	255.0
S3 node 3  262654	11.445763	12.253646	0.0	328.0
)
)
)
Statistics:
 IMAGE     NPIX      MEAN        RMS           MIN      MAX
ACIS_total   6004901       2421.826         3118.390           0.0   135037


I2 node 0  262654	2099.014356	419.541476	445.0	12321.0
I2 node 1  262654	2207.719799	592.480956	456.0	111162.0
I2 node 2  262654	2235.246270	472.750230	471.0	12688.0
I2 node 3  262654	2240.564230	578.188248	448.0	28709.0

I3 node 0  262654	2396.387215	589.553736	448.0	11847.0
I3 node 1  262654	2475.102961	1710.484714	477.0	55508.0
I3 node 2  262654	2195.571677	409.503324	441.0	12814.0
I3 node 3  262654	2187.616989	440.620773	413.0	33431.0

S2 node 0  262654	2824.511275	450.172828	1552.0	22124.0
S2 node 1  262654	2993.491402	671.675311	1732.0	16336.0
S2 node 2  262654	3308.389901	670.690997	2152.0	27920.0
S2 node 3  262654	3267.489110	527.802633	1908.0	64990.0

S3 node 0  262654	4999.696381	2394.872366	2182.0	35392.0
S3 node 1  262654	6222.652789	2322.009412	0.0	34804.0
S3 node 2  262654	4956.708372	1292.699079	2185.0	25988.0
S3 node 3  262654	3847.302642	684.791809	2351.0	25404.0
)
|
)
|
)
|
)
|
| May 2020 | Feb 2020 | Nov 2019 | Aug 2019 |
|---|
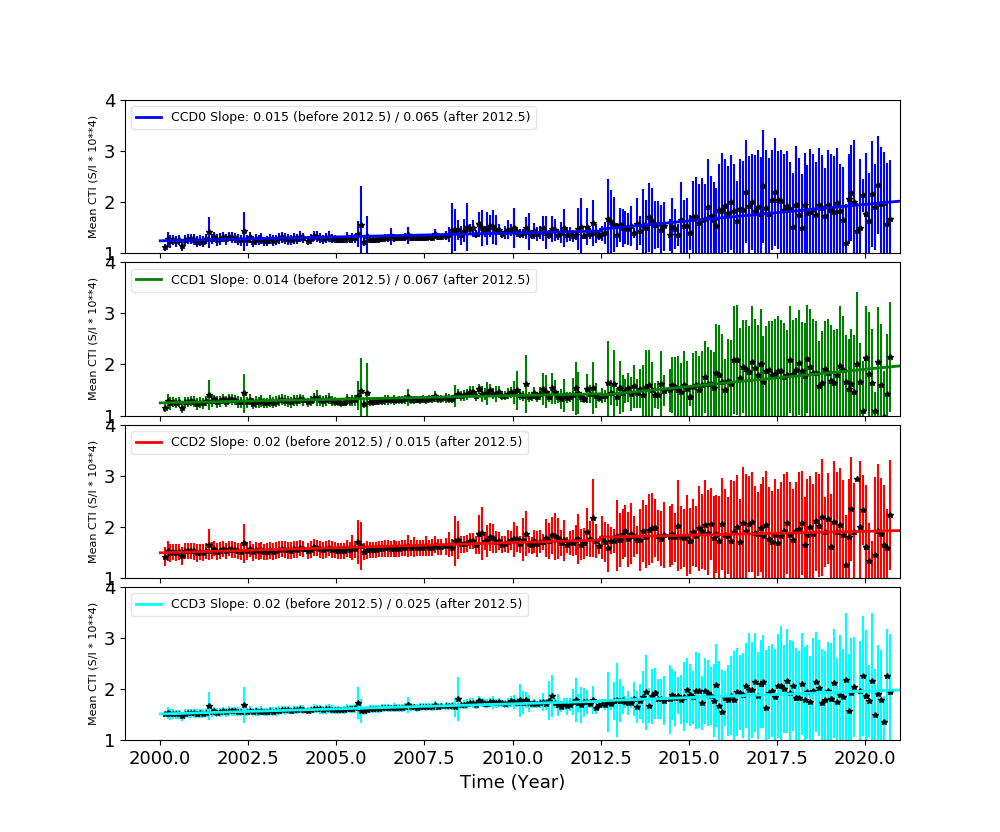
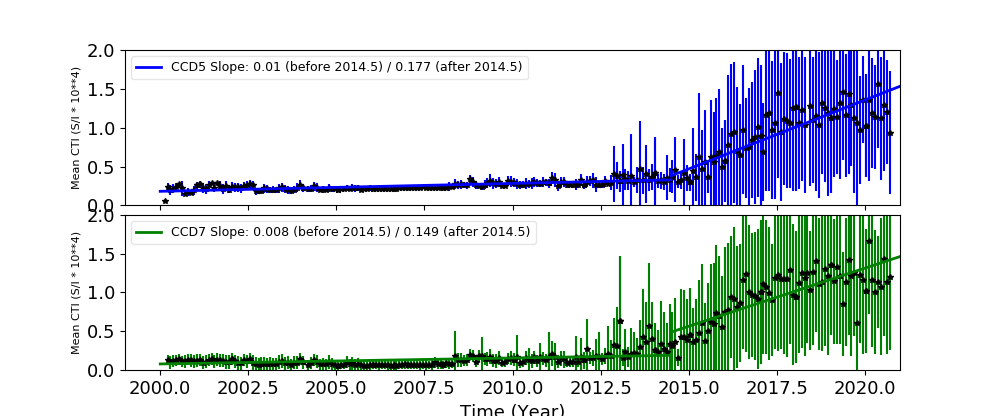
The Mean Detrended CTI
We report CTIs with a refined data definition. CTIs were computed for the temperature dependency corrected data. Please see CTI page for detailed explanation. CTI's are computed for Mn K alpha, and defined as slope/intercept x10^4 of row # vs ADU. Data file: here
Imaging CCDs
Spectral CCDs
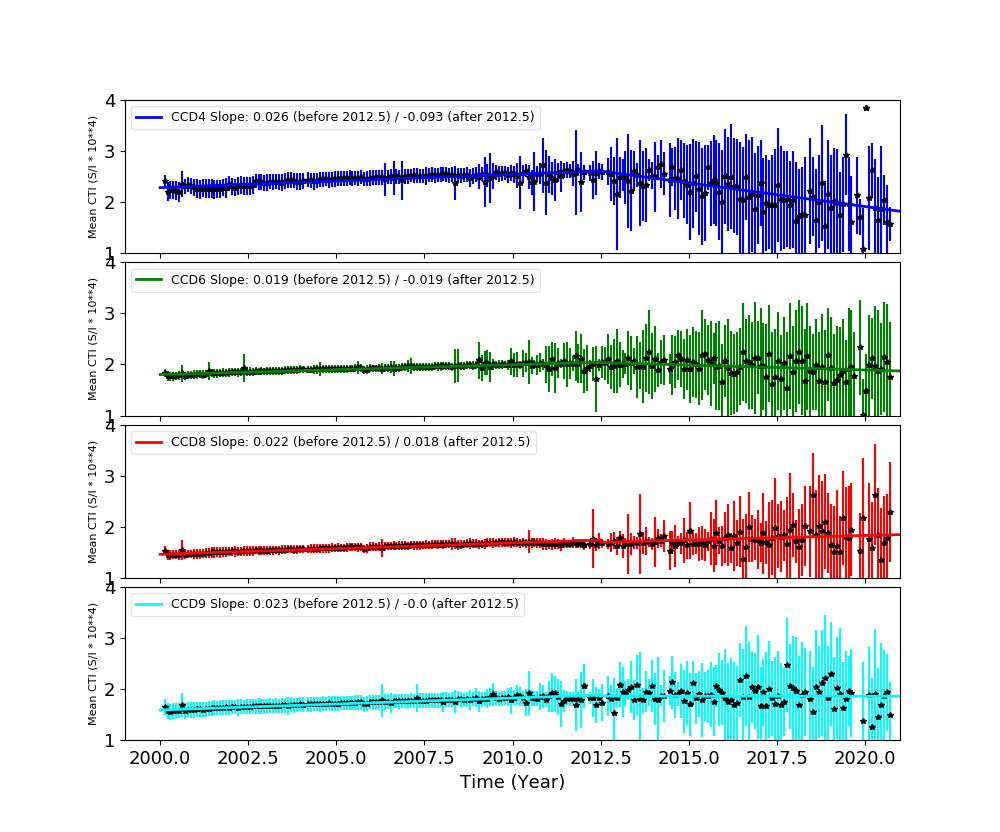
Backside CCDs
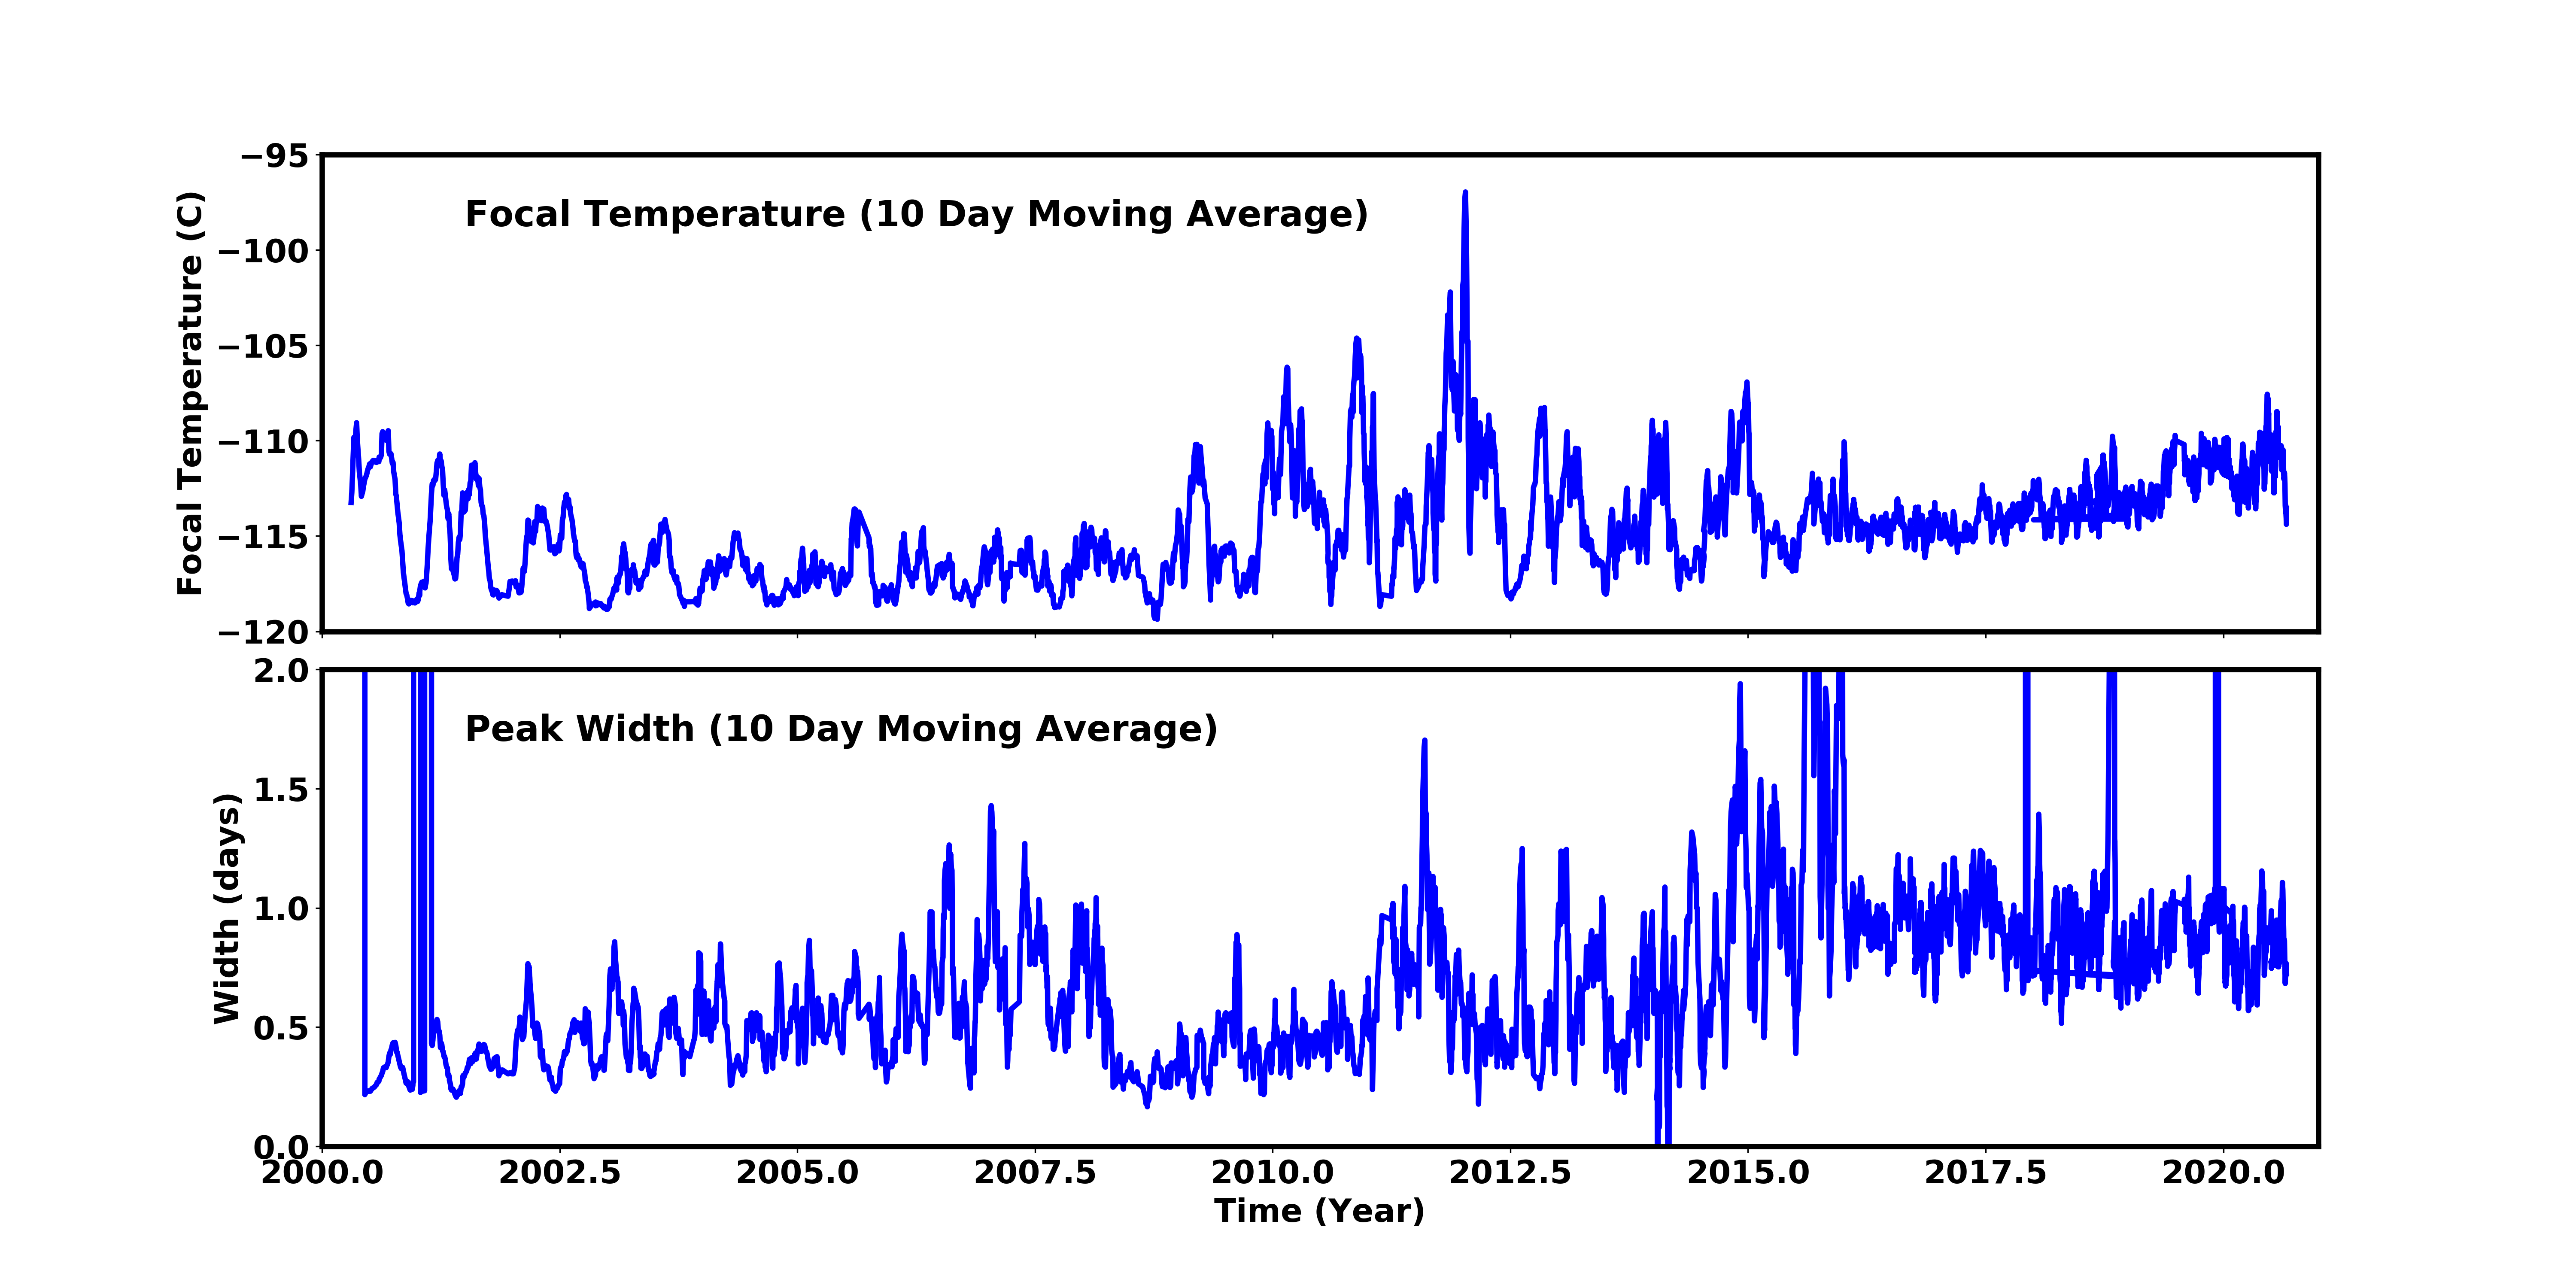
Focal Plane Temperature
Aug 2020 Focal Temperature
| The Mean (max) FPT: | |
|---|---|
| -112.31 | +/- 3.58 C |
| Mean Width: | |
| 0.87 | +/- 0.4 days |
Averaged Focal Plane Temperature
We are using 10 period moving averages to show trends of peak temperatures and peak widths. Note, the gaps in the width plot are due to missing/corrupted data.
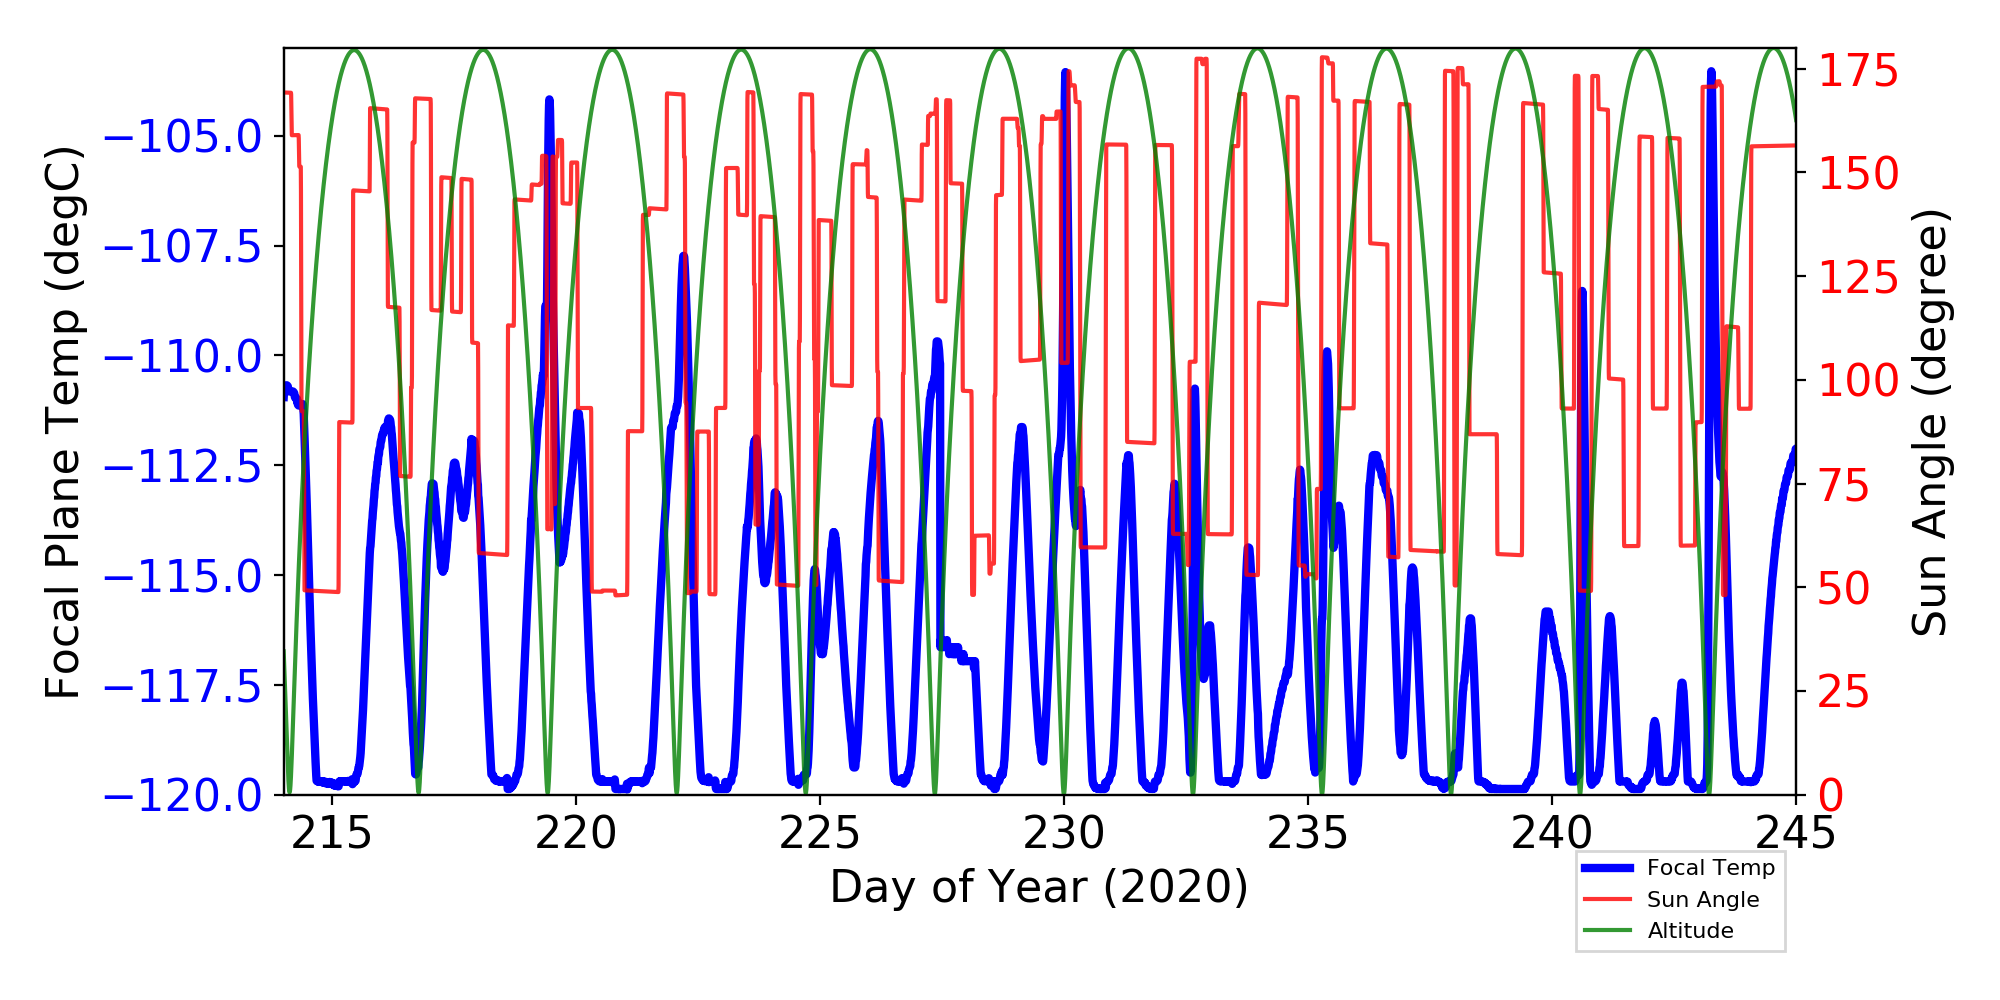
Focal Plane Temperature, Sun Angle and Altitude
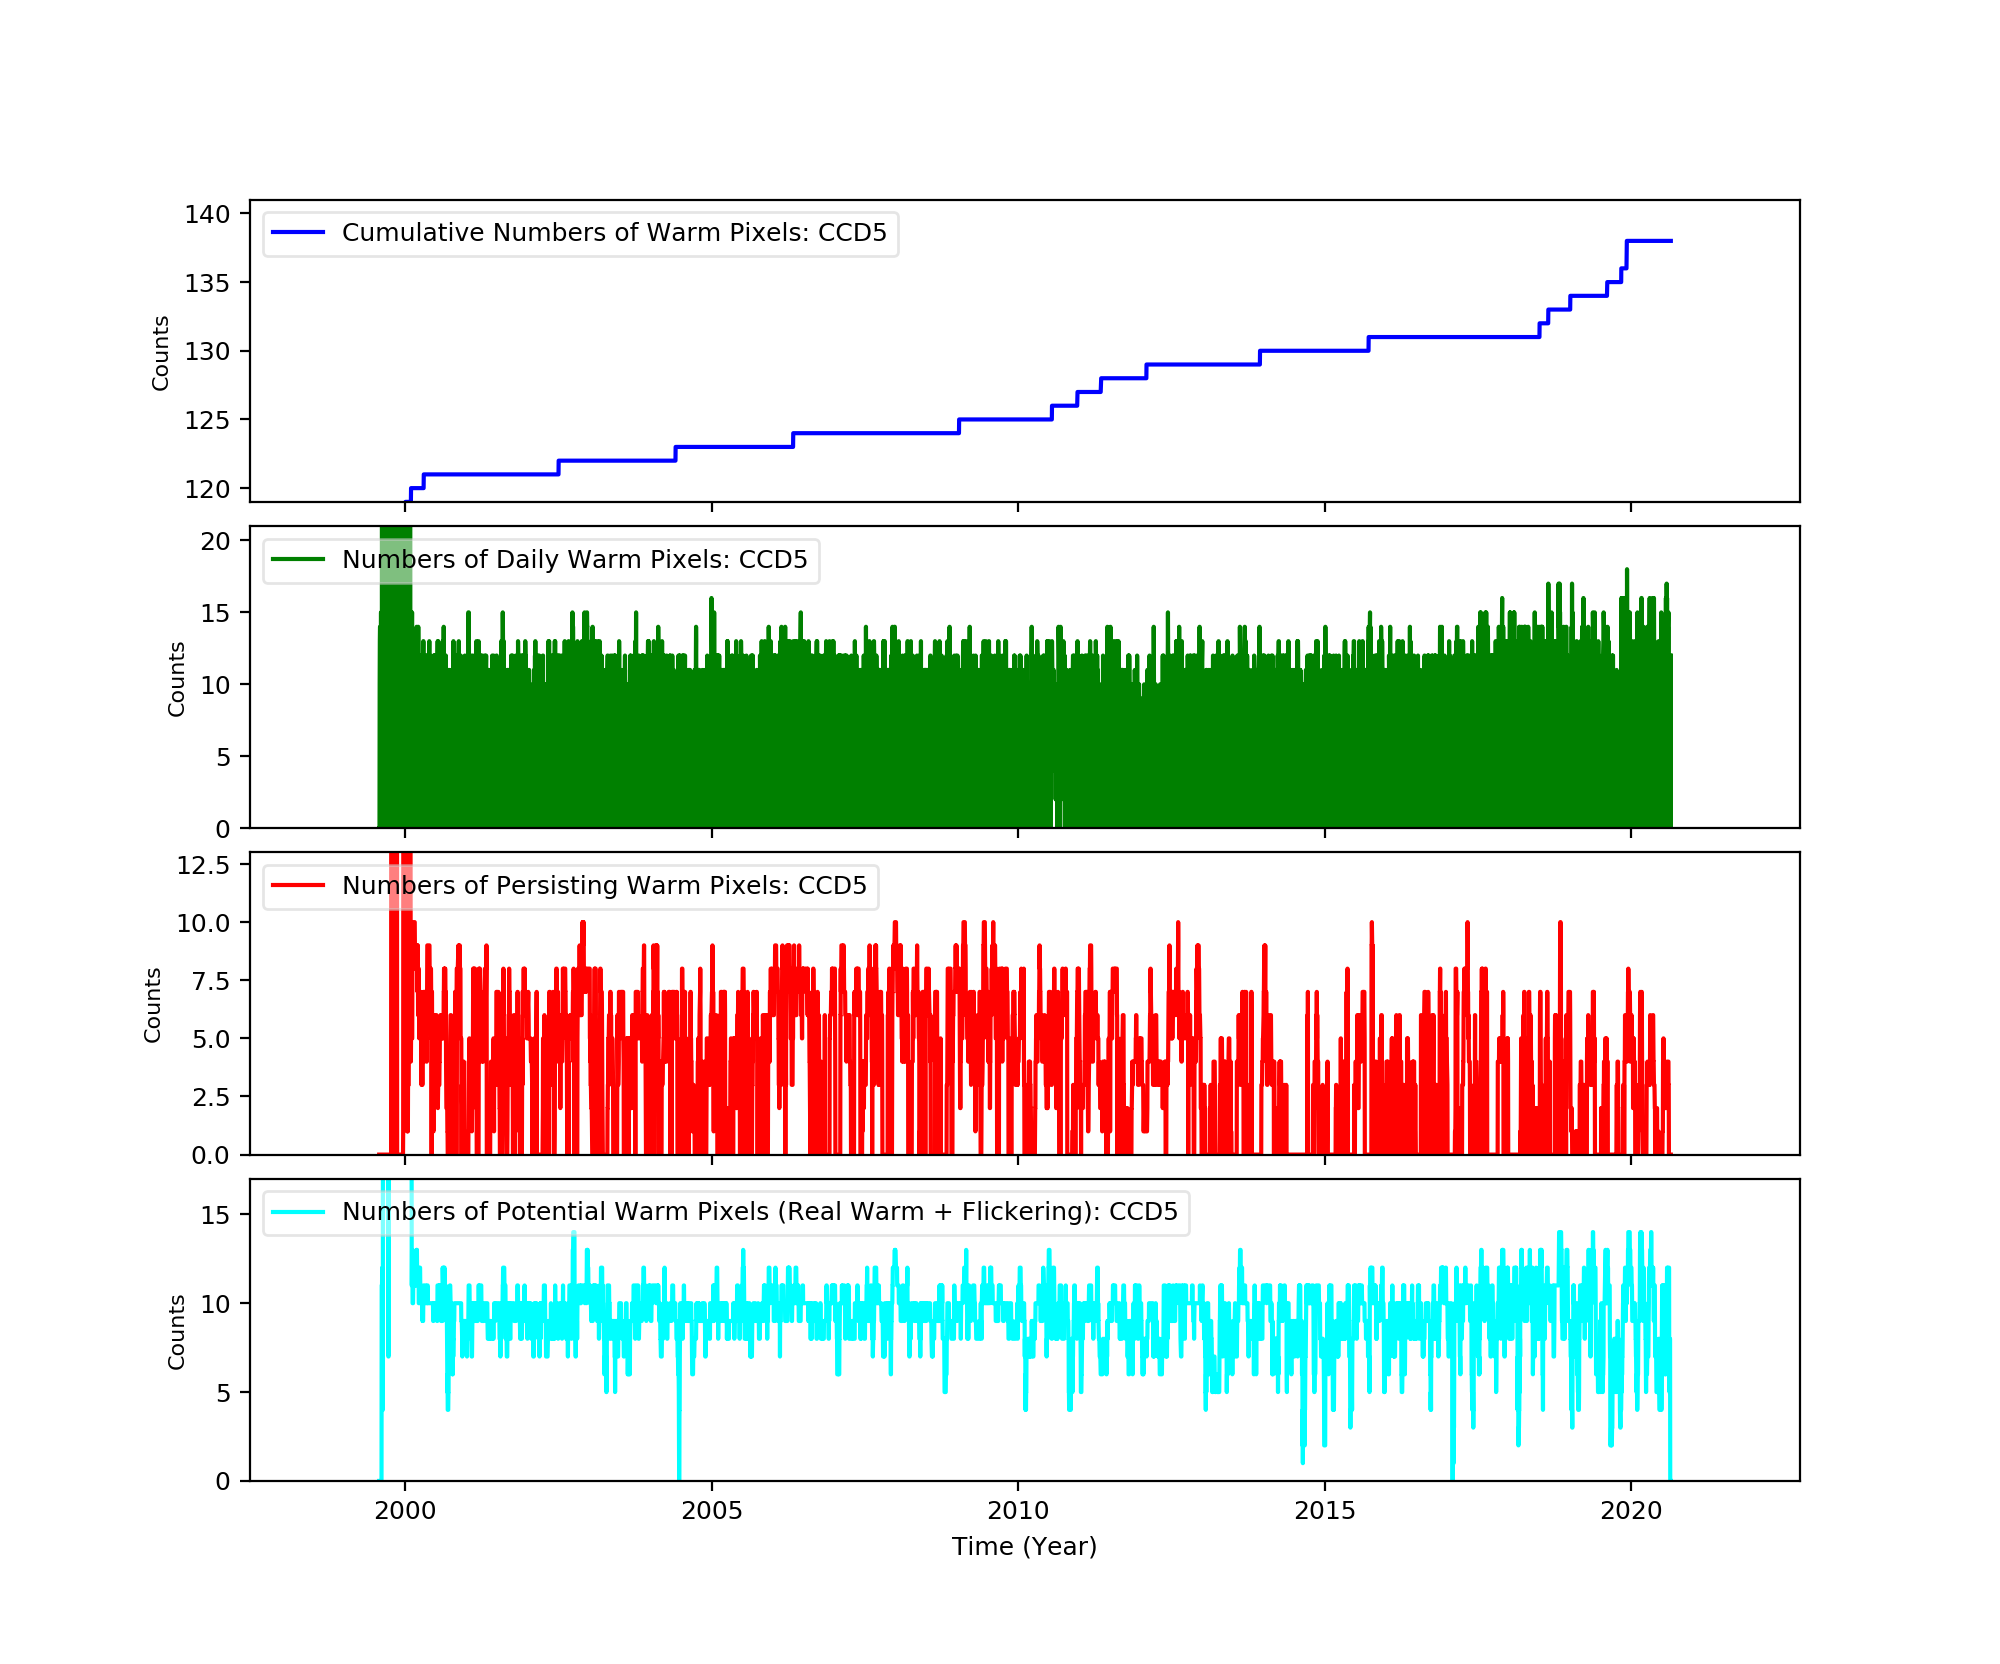
Bad Pixels
The plots below were generated with a new warm pixel finding script. Please see Acis Bad Pixel Page for details.
Front Side CCDs
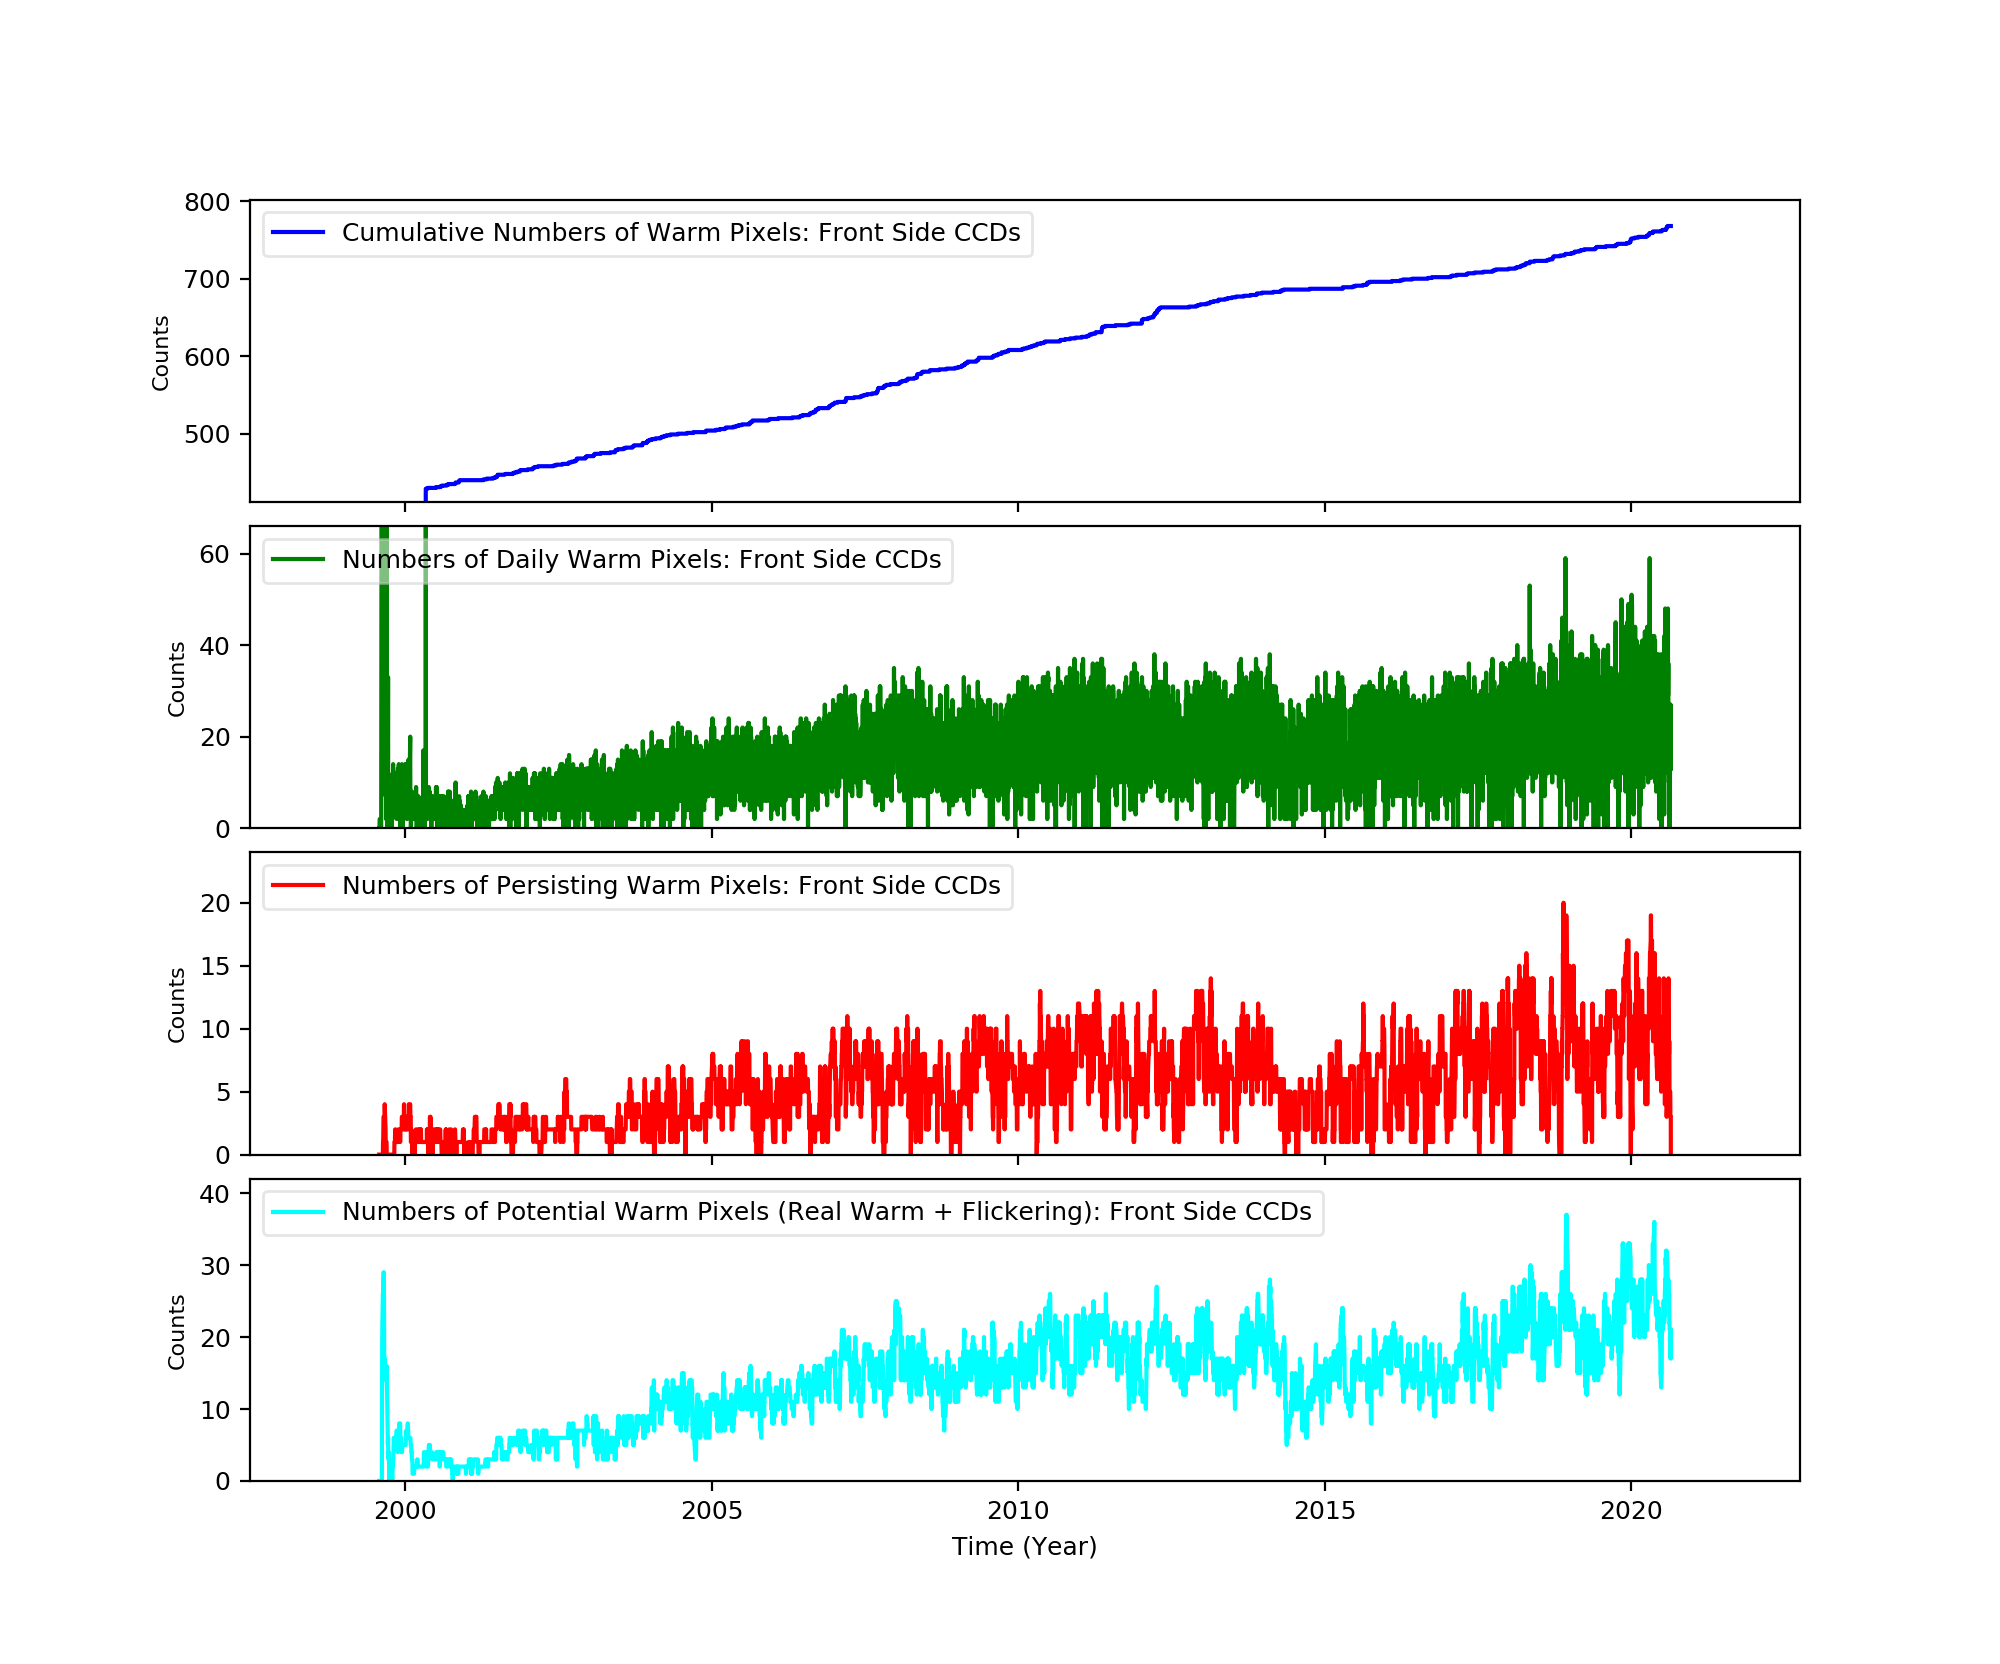
Back Side CCD (CCD5)
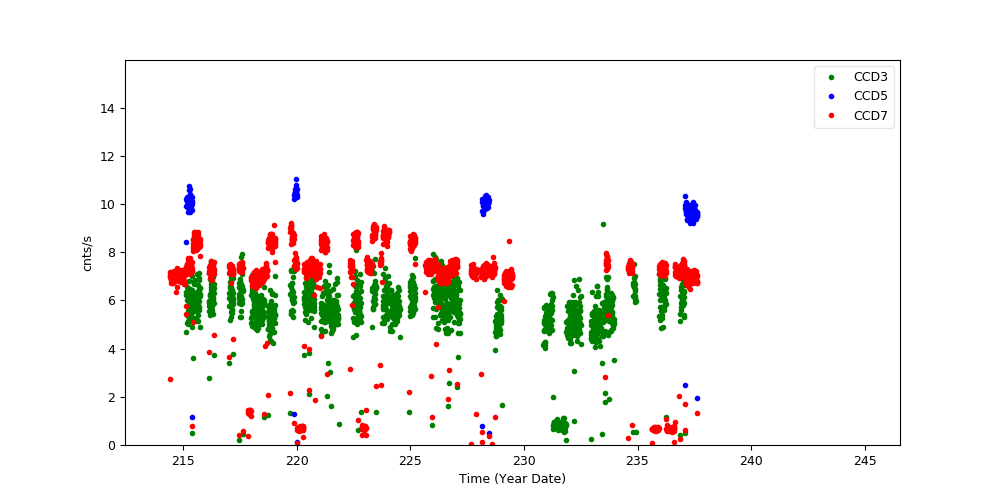
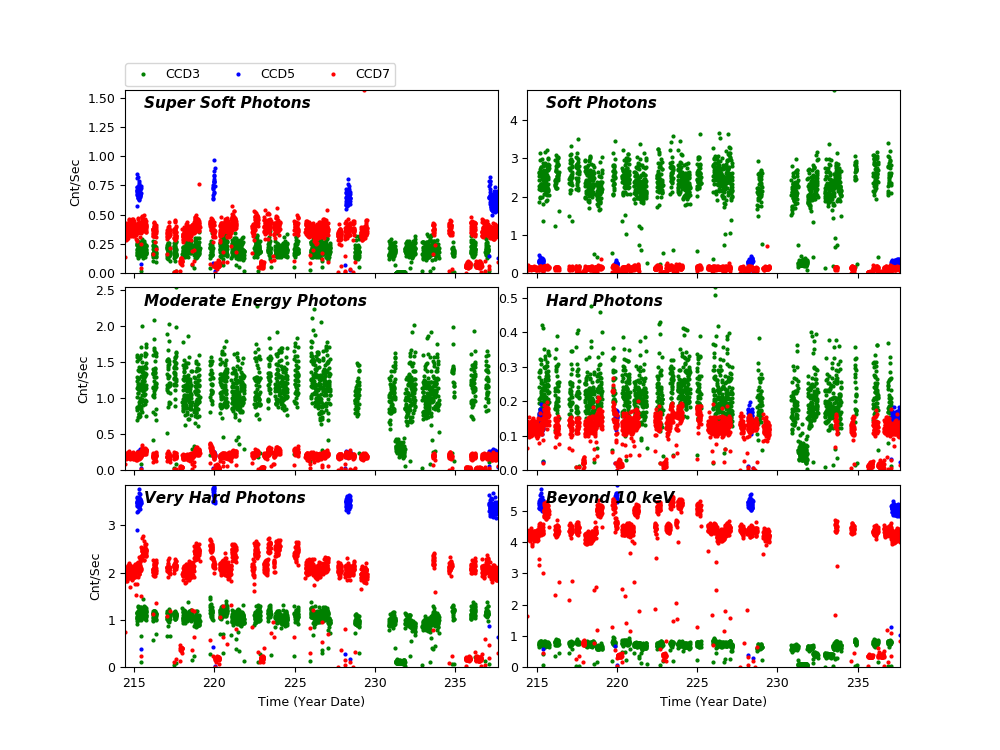
Science Instrument Background Rates
| Name | Low (keV) | High(KeV) | Description |
|---|---|---|---|
| SSoft | 0.00 | 0.50 | Super soft photons |
| Soft | 0.50 | 1.00 | Soft photons |
| Med | 1.00 | 3.00 | Moderate energy photons |
| Hard | 3.00 | 5.00 | Hard Photons |
| Harder | 5.00 | 10.00 | Very Hard photons |
| Hardest | 10.00 | Beyond 10 keV |
HRC
DOSE of Central 4K Pore-Pairs
Please refer to Maximum Dose Trends for more details.
)
|
|---|
IMAGE                NPIX      MEAN    STDDEV      MIN       MAX
HRCI_08_2020.fits  16777216	0.004 	0.066 	0.000 	2.000
)
IMAGE                       NPIX      MEAN    STDDEV      MIN       MAX
HRCI_08_1999_08_2020.fits  16777216	6.441 	6.038 	0.000 	306.000
)
|
|---|
IMAGE                NPIX      MEAN    STDDEV      MIN       MAX
HRCS_08_2020.fits  16777216	0.016 	0.128 	0.000 	3.000
)
IMAGE                       NPIX      MEAN    STDDEV      MIN       MAX
HRCS_08_1999_08_2020.fits  16777216	19.086 	34.394 	0.000 	1750.000
|
|
Max dose trend plots corrected for events that "pile-up"
in the center of the taps due to bad position information.
|
)
|
)
|
)
|
)
|
| May 2020 | Feb 2020 | Nov 2019 | Aug 2019 |
|---|
)
|
)
|
)
|
)
|
| May 2020 | Feb 2020 | Nov 2019 | Aug 2019 |
|---|
HRMA Focus
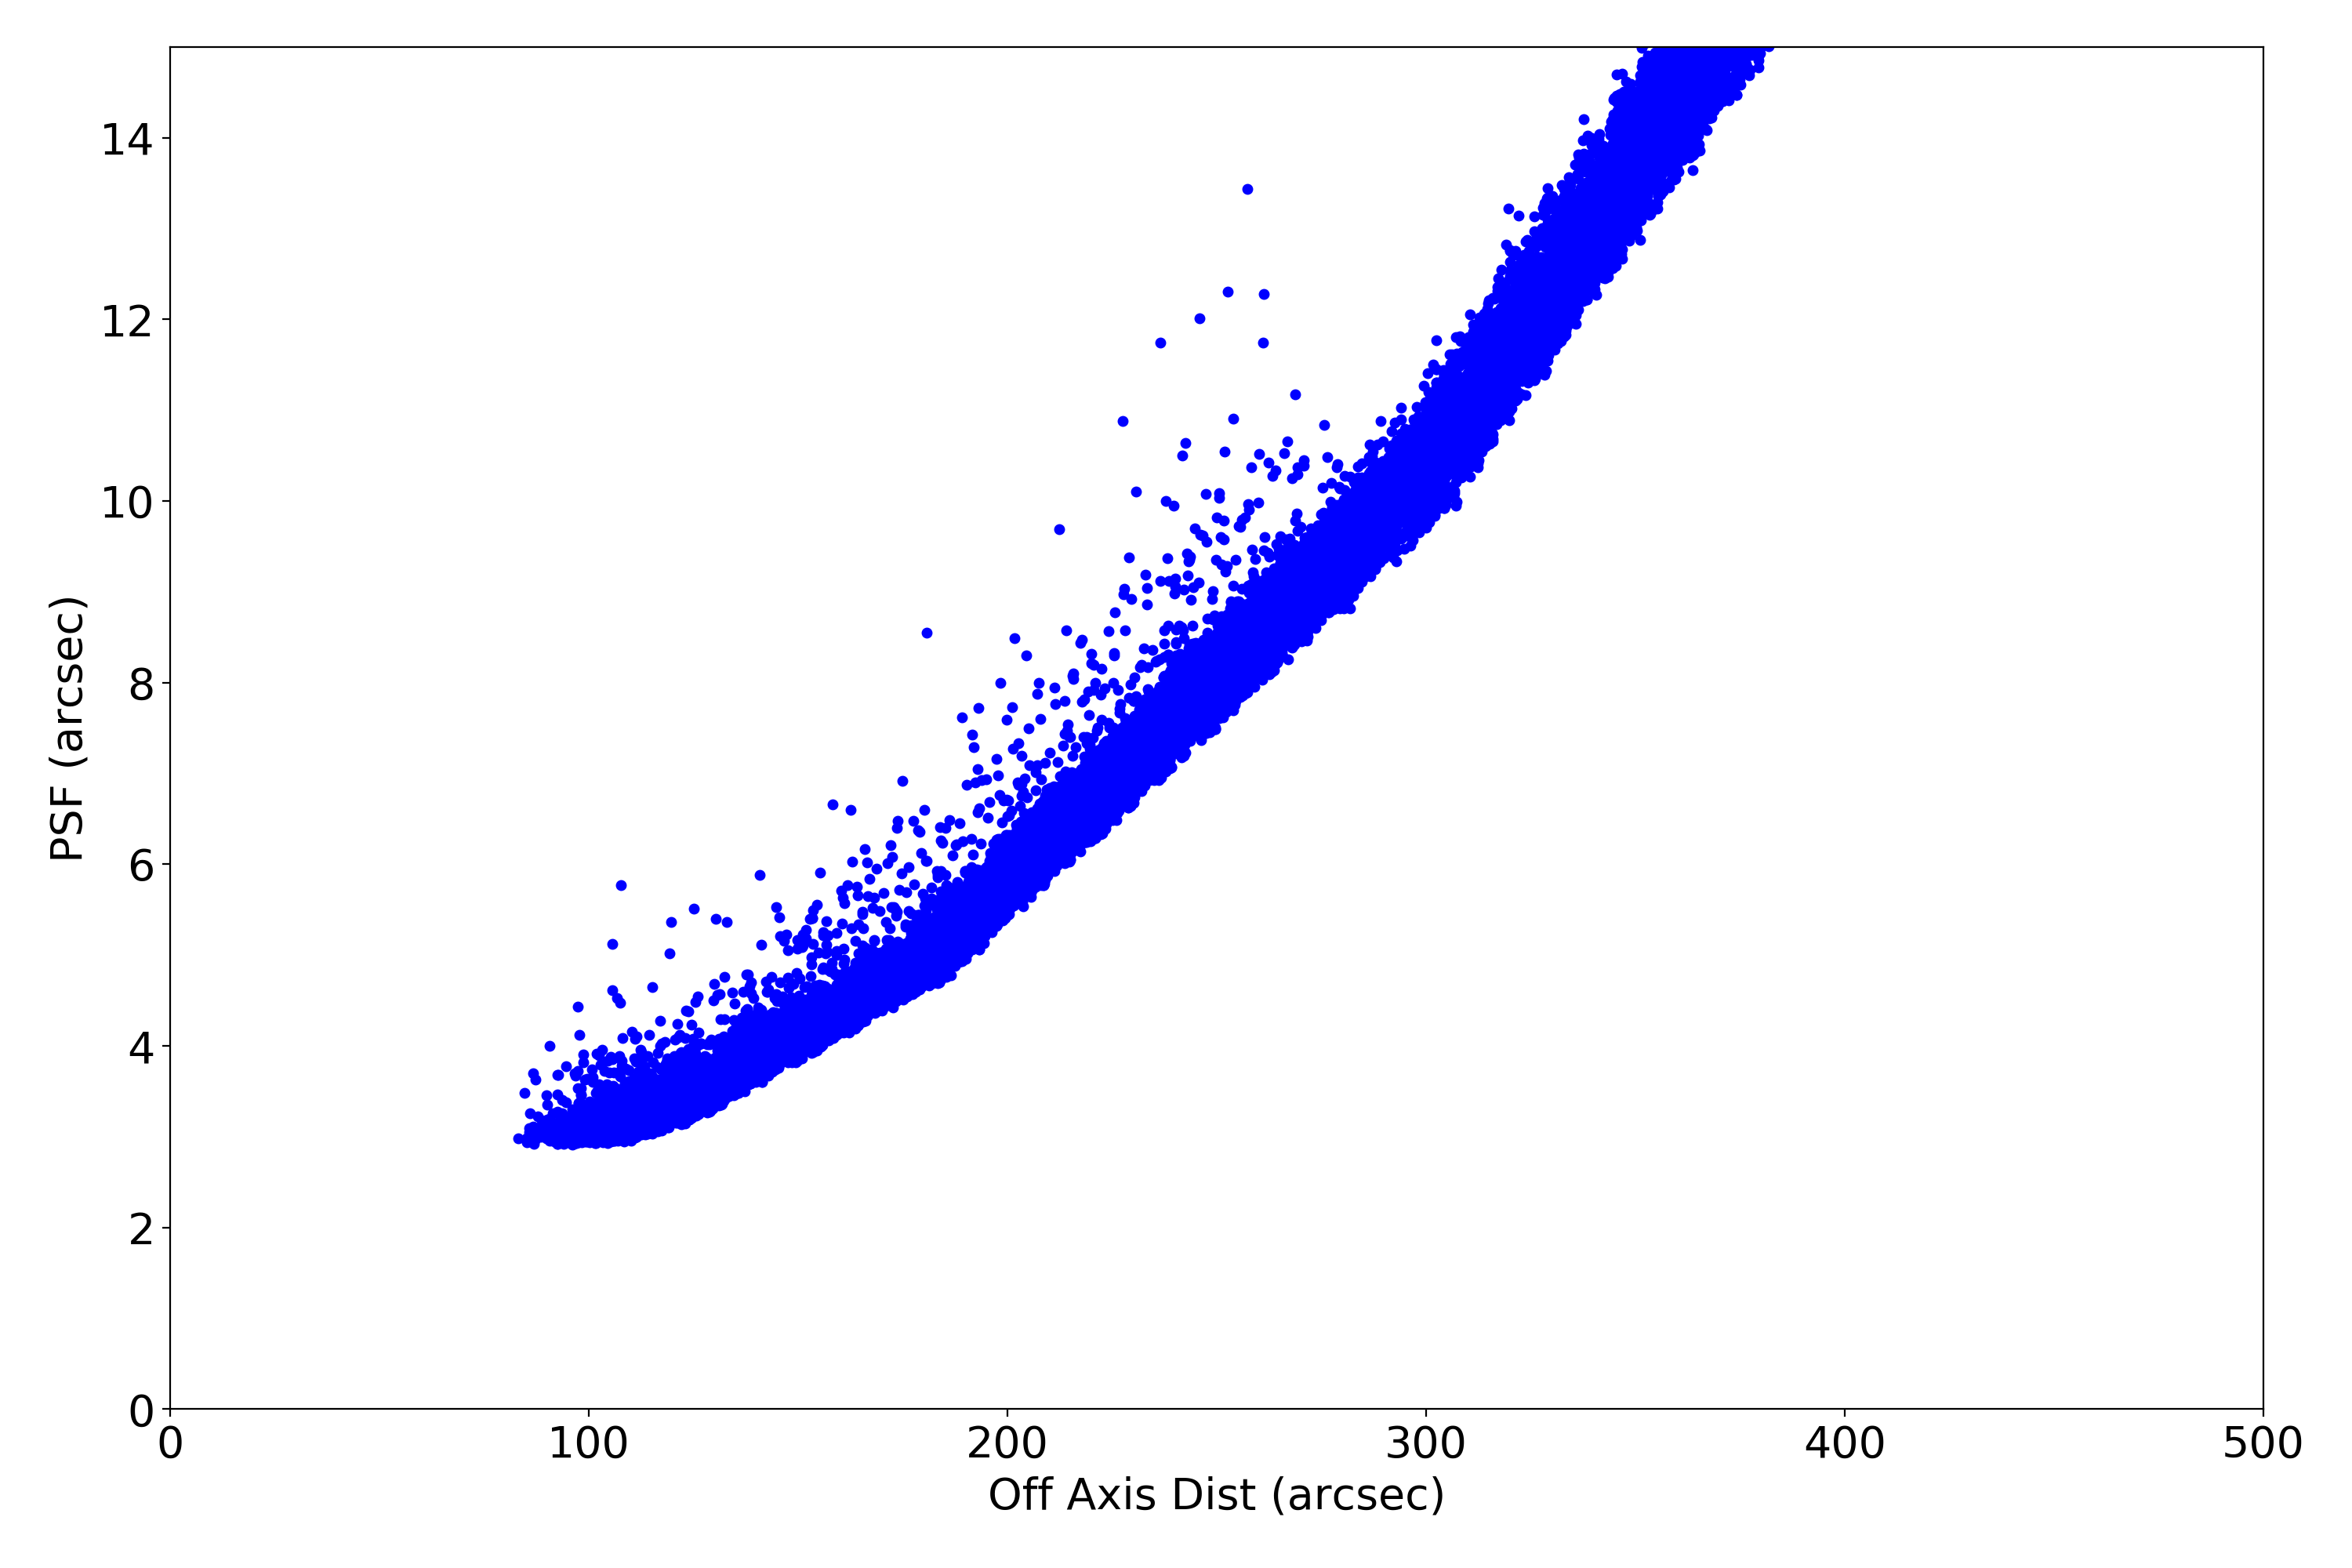
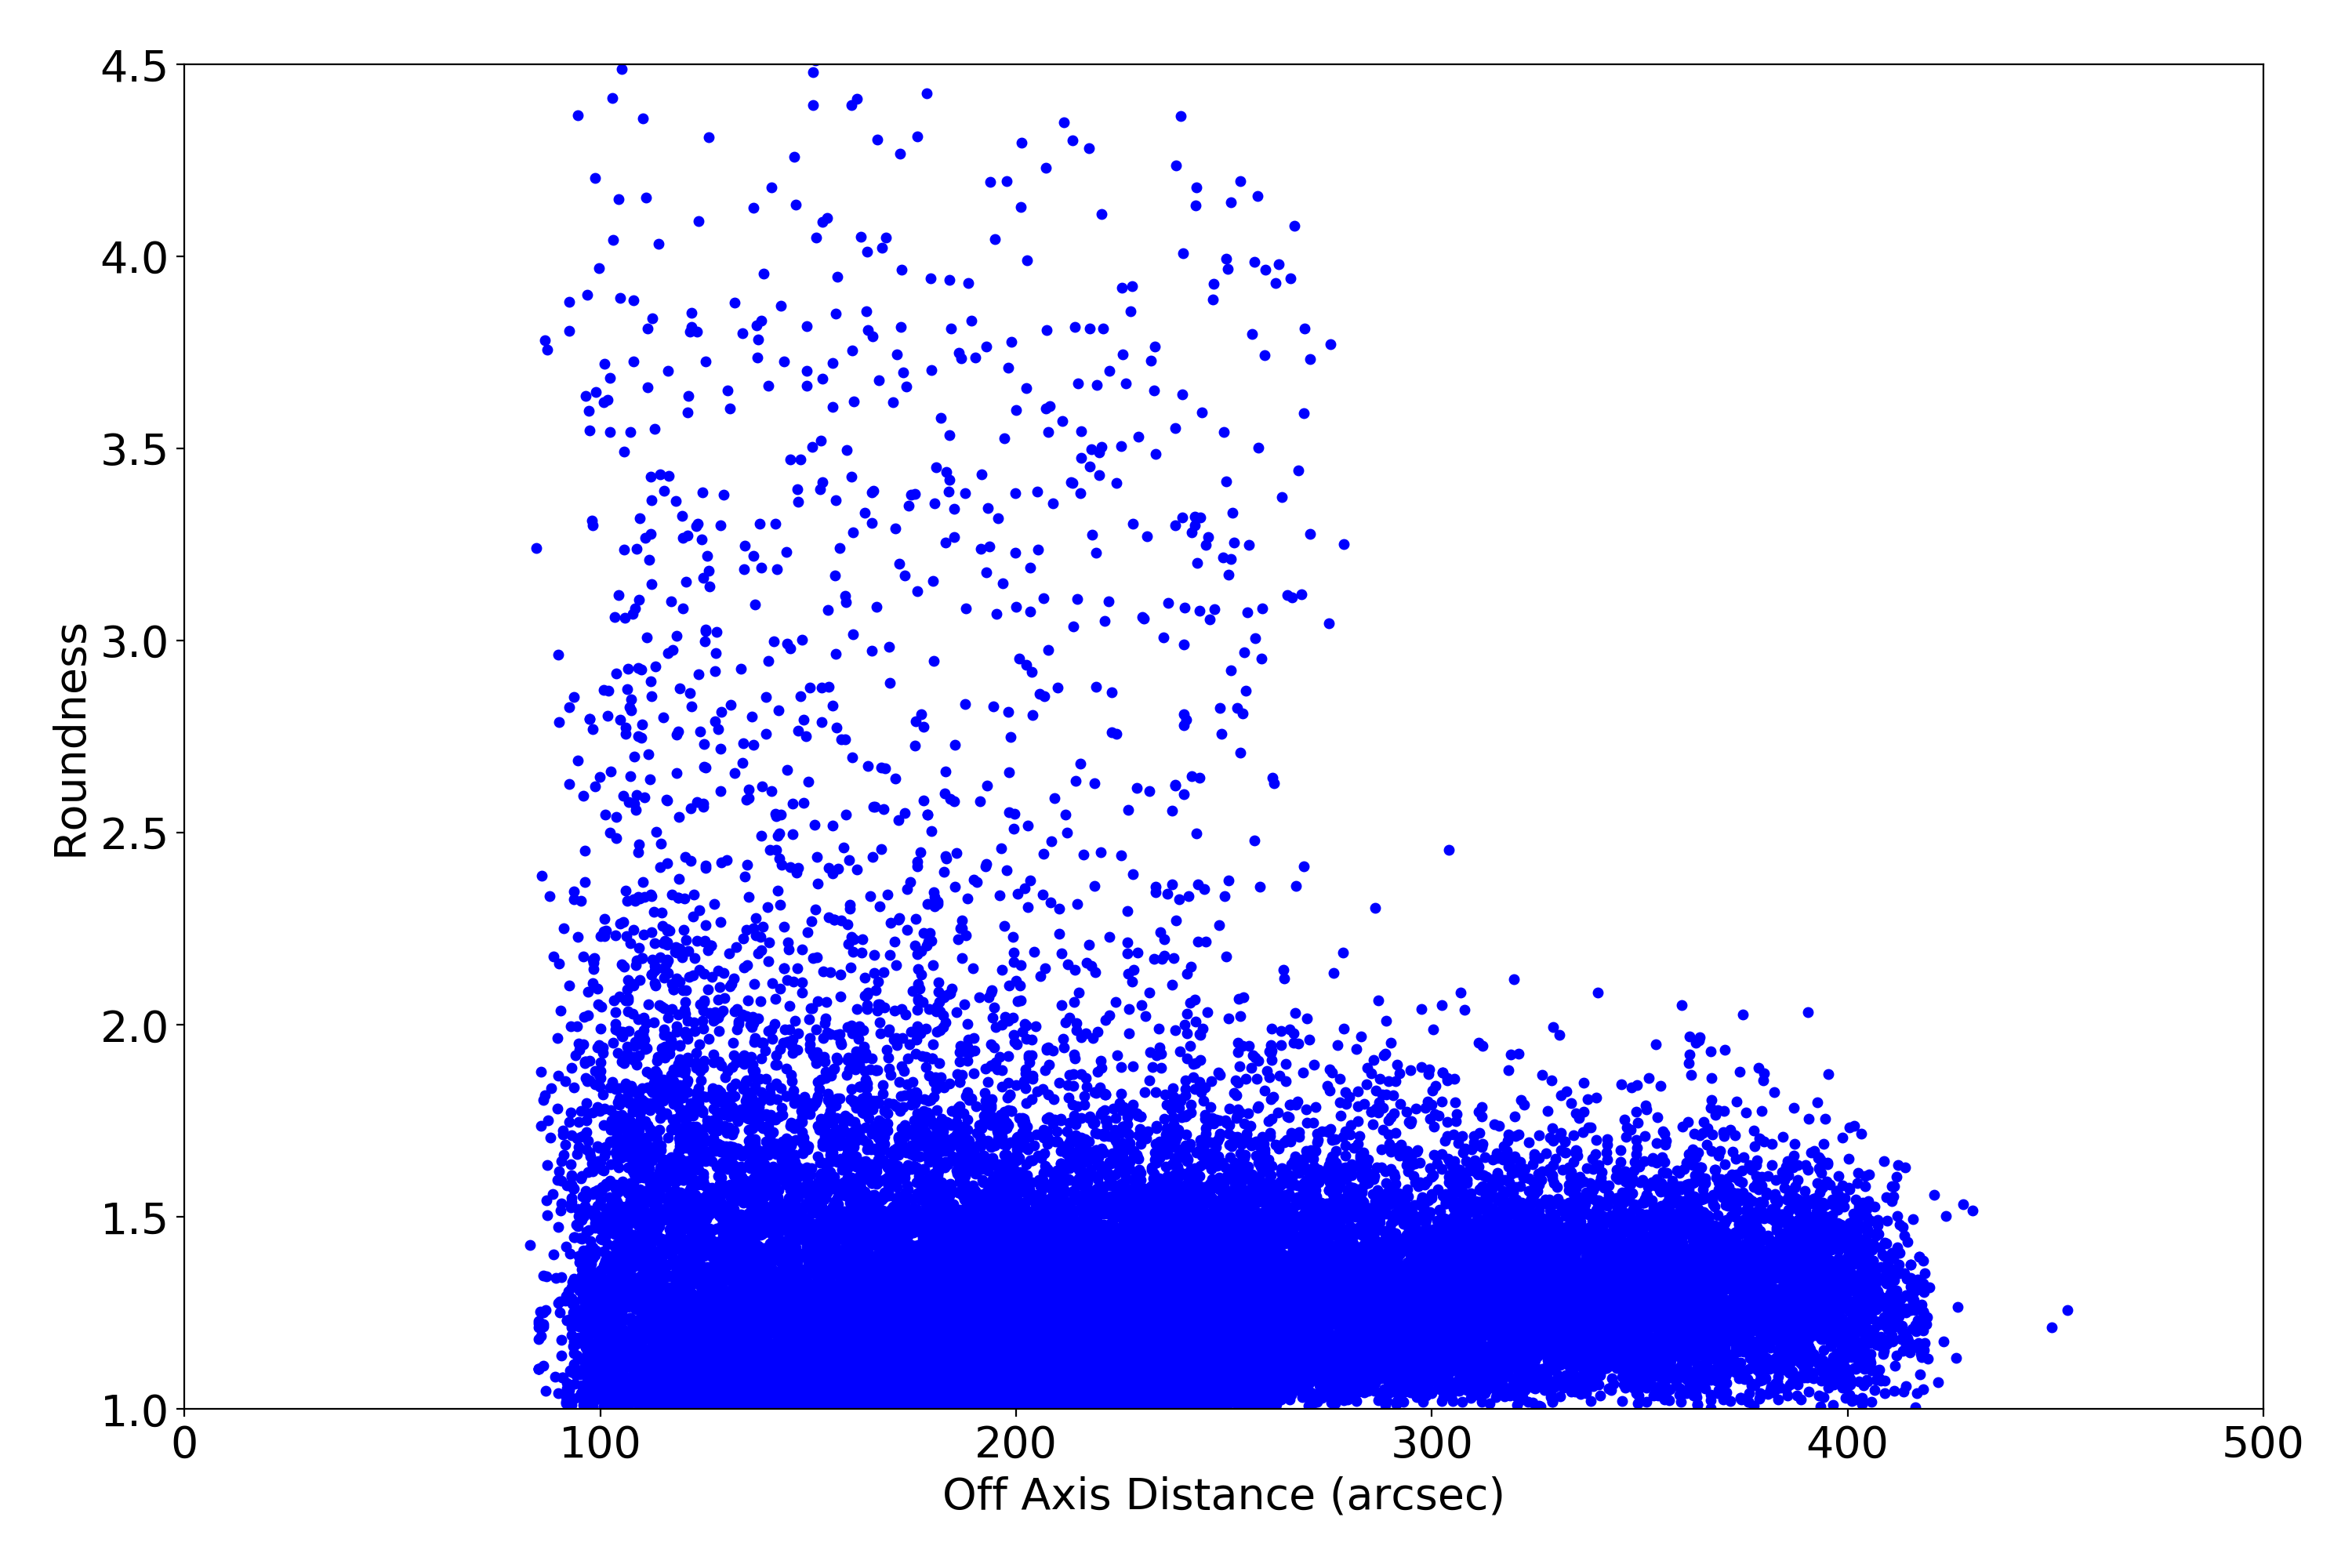
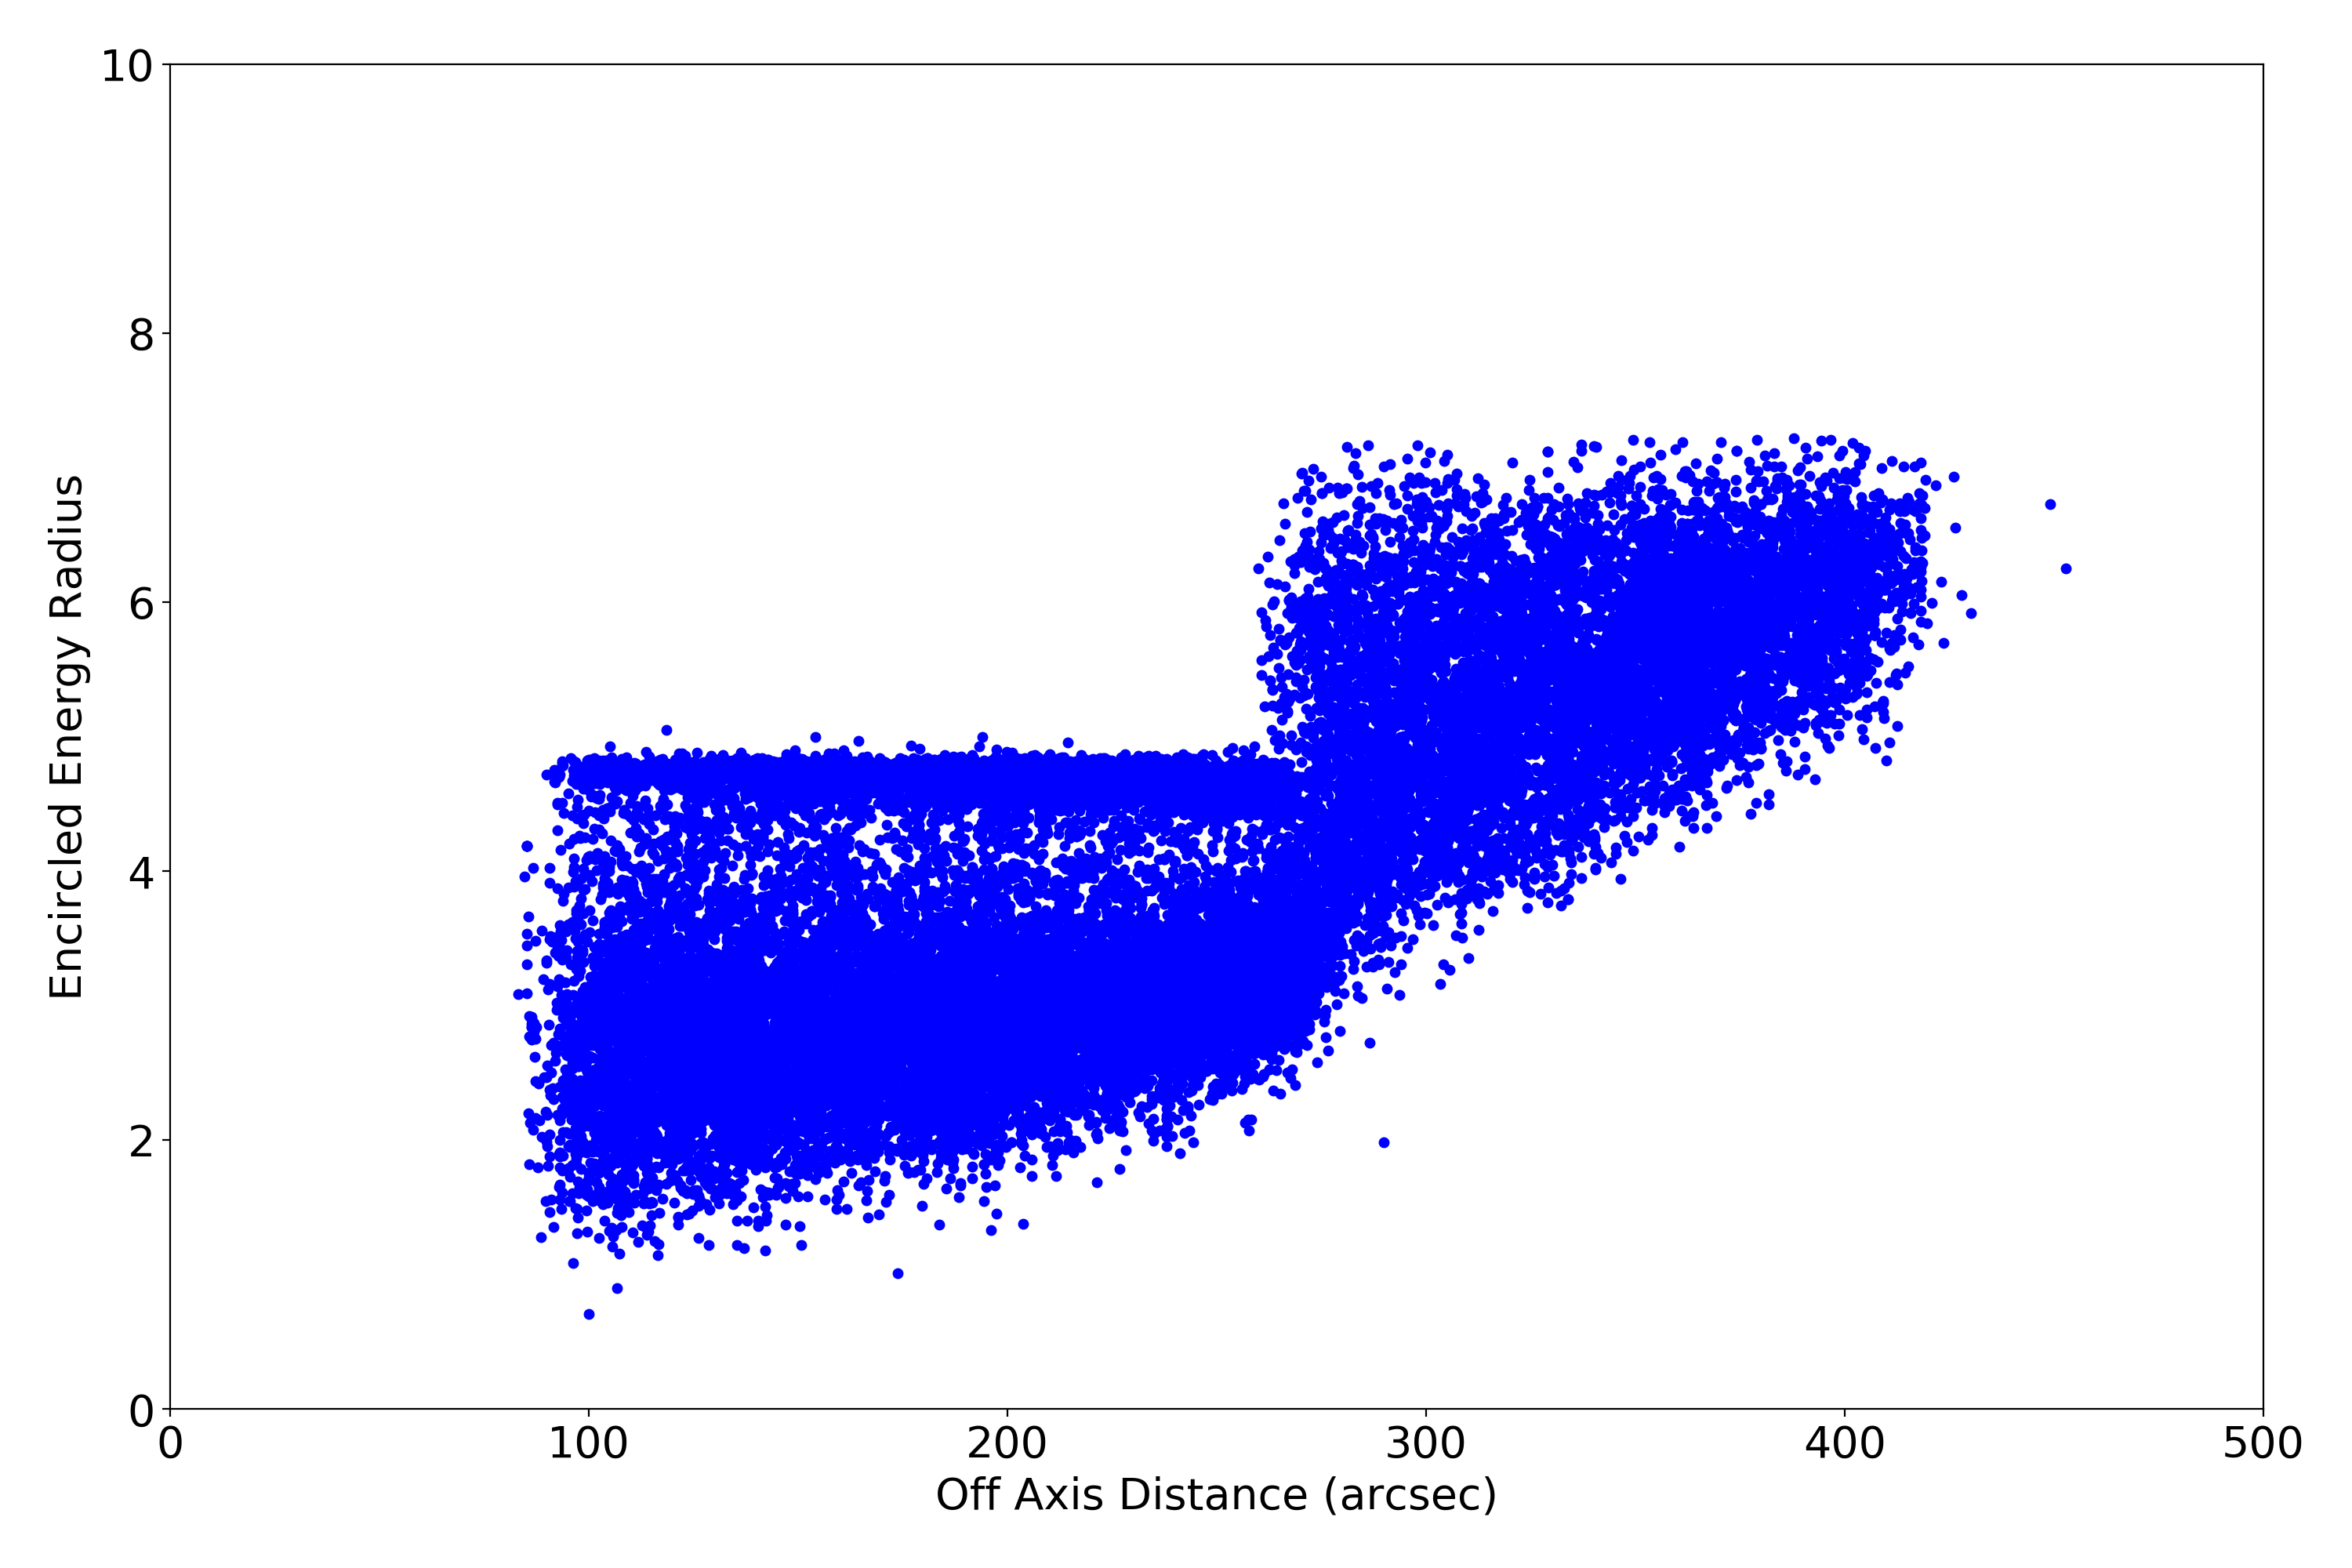
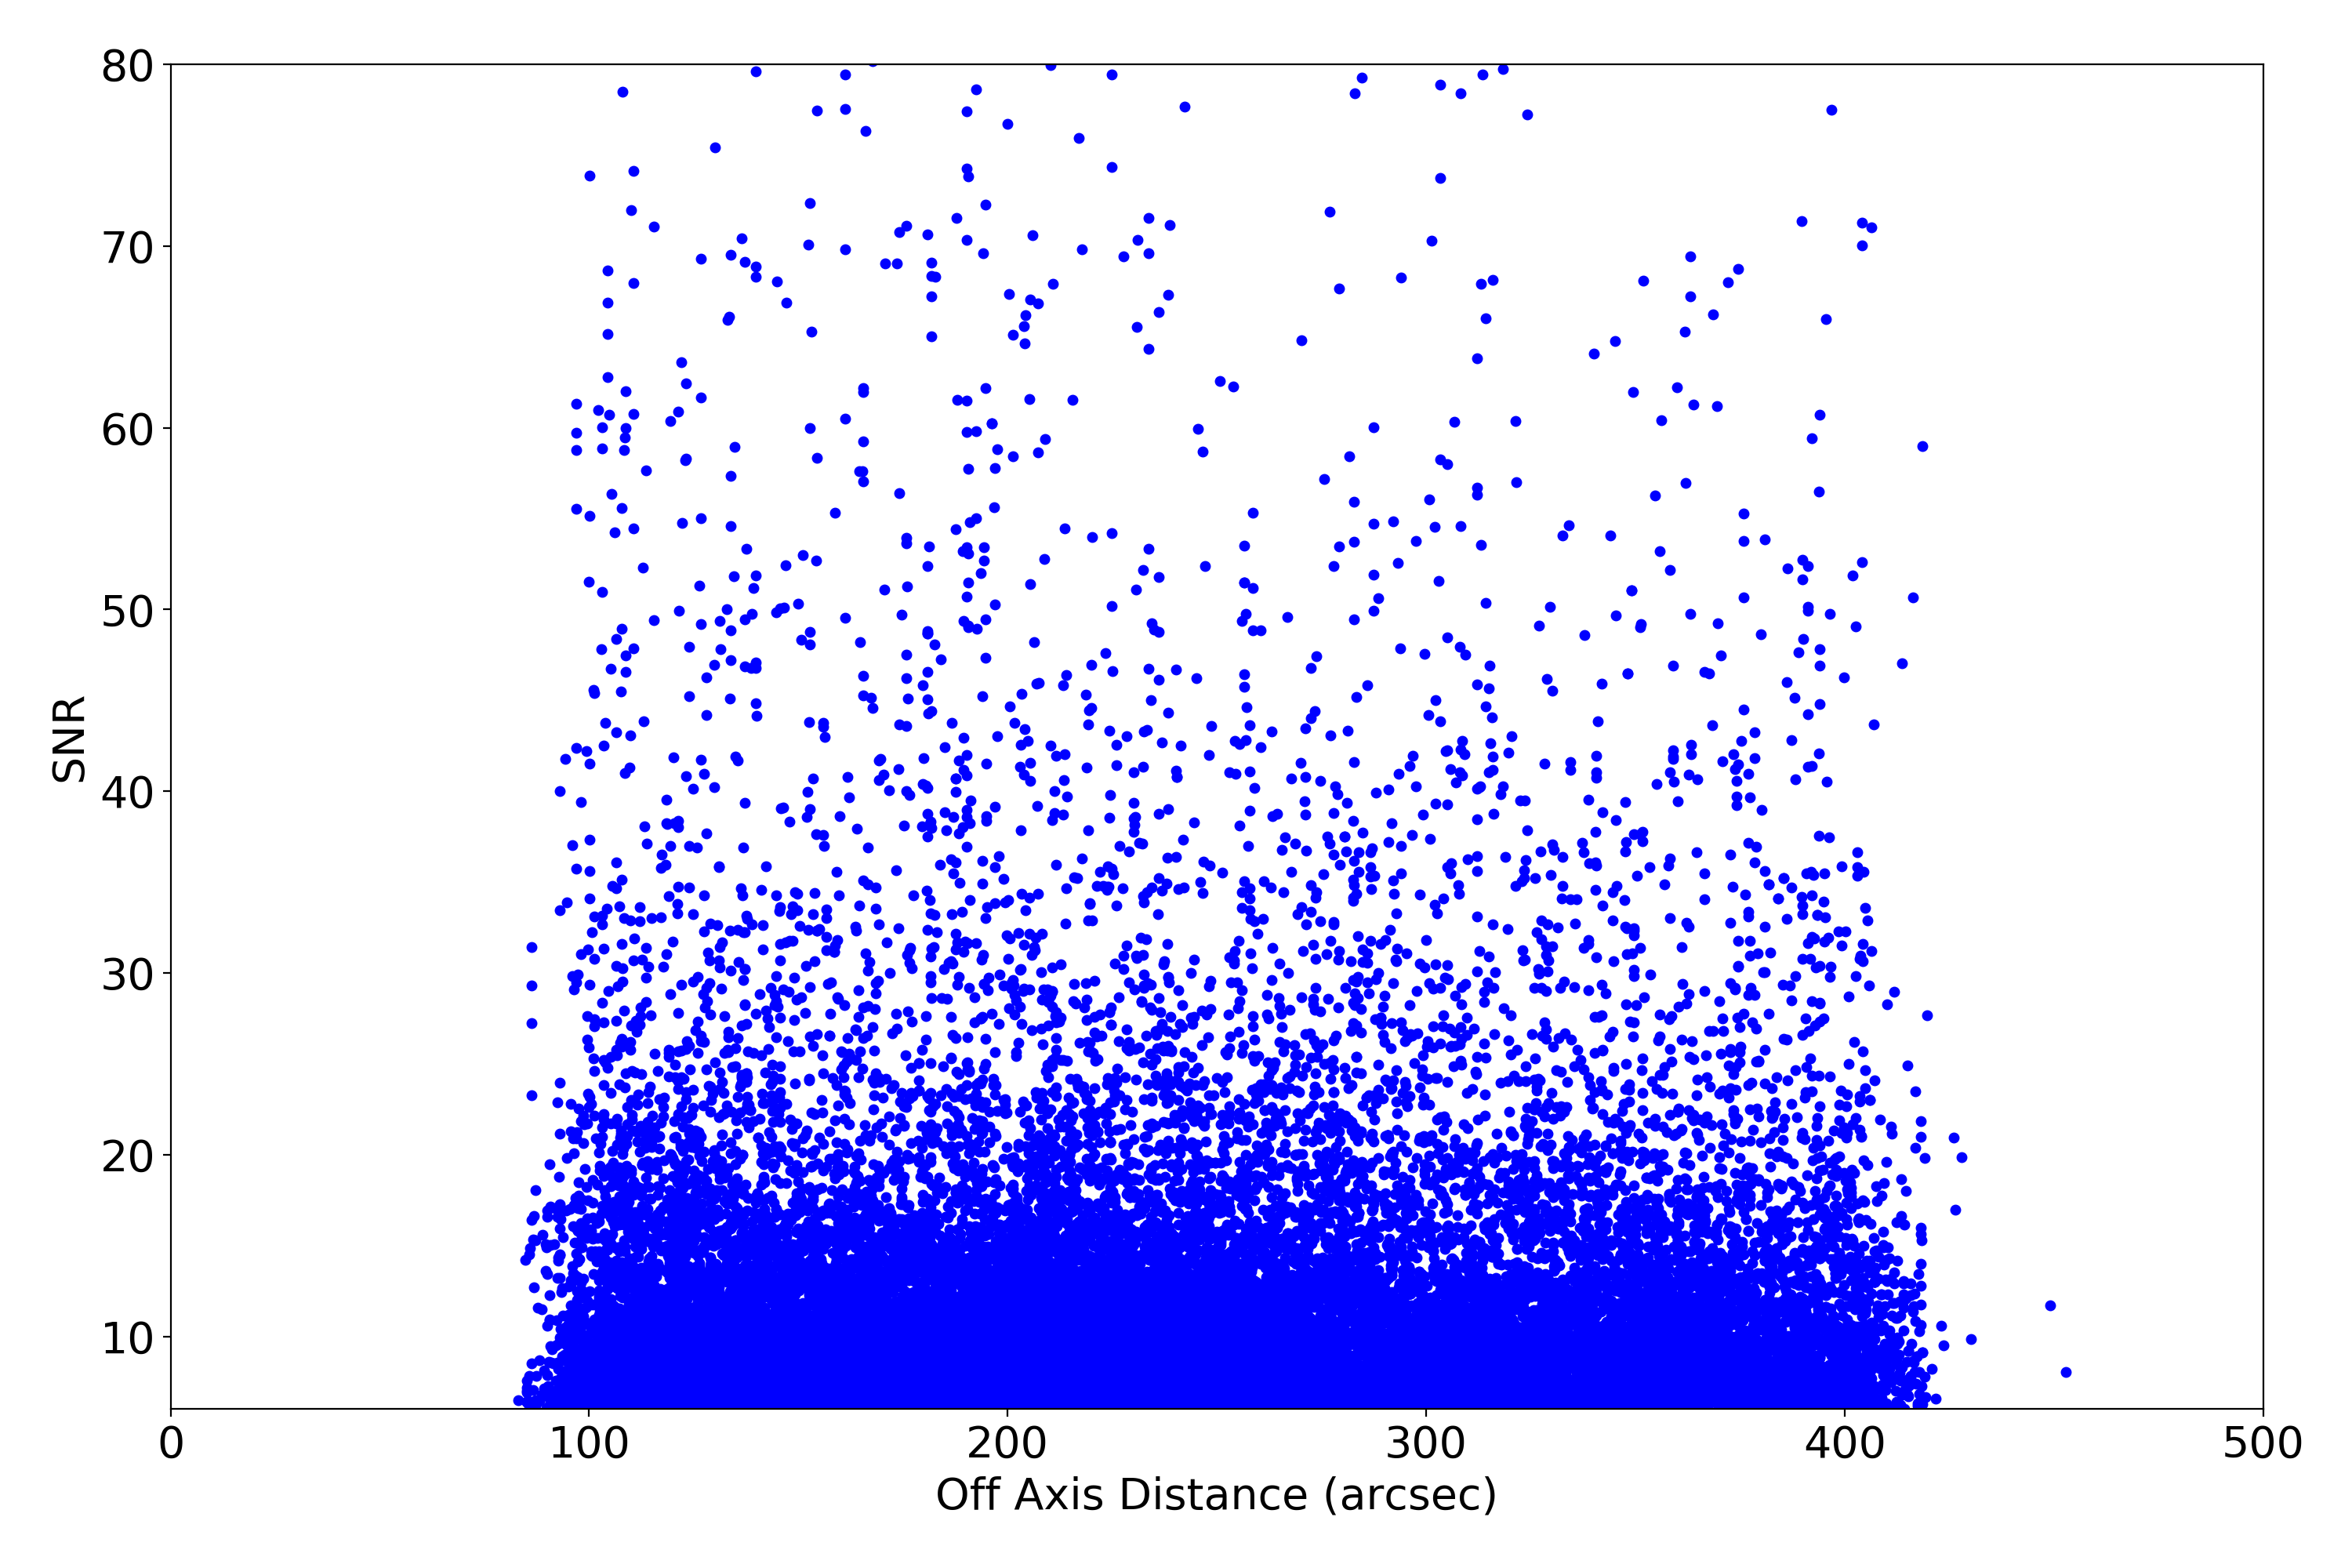
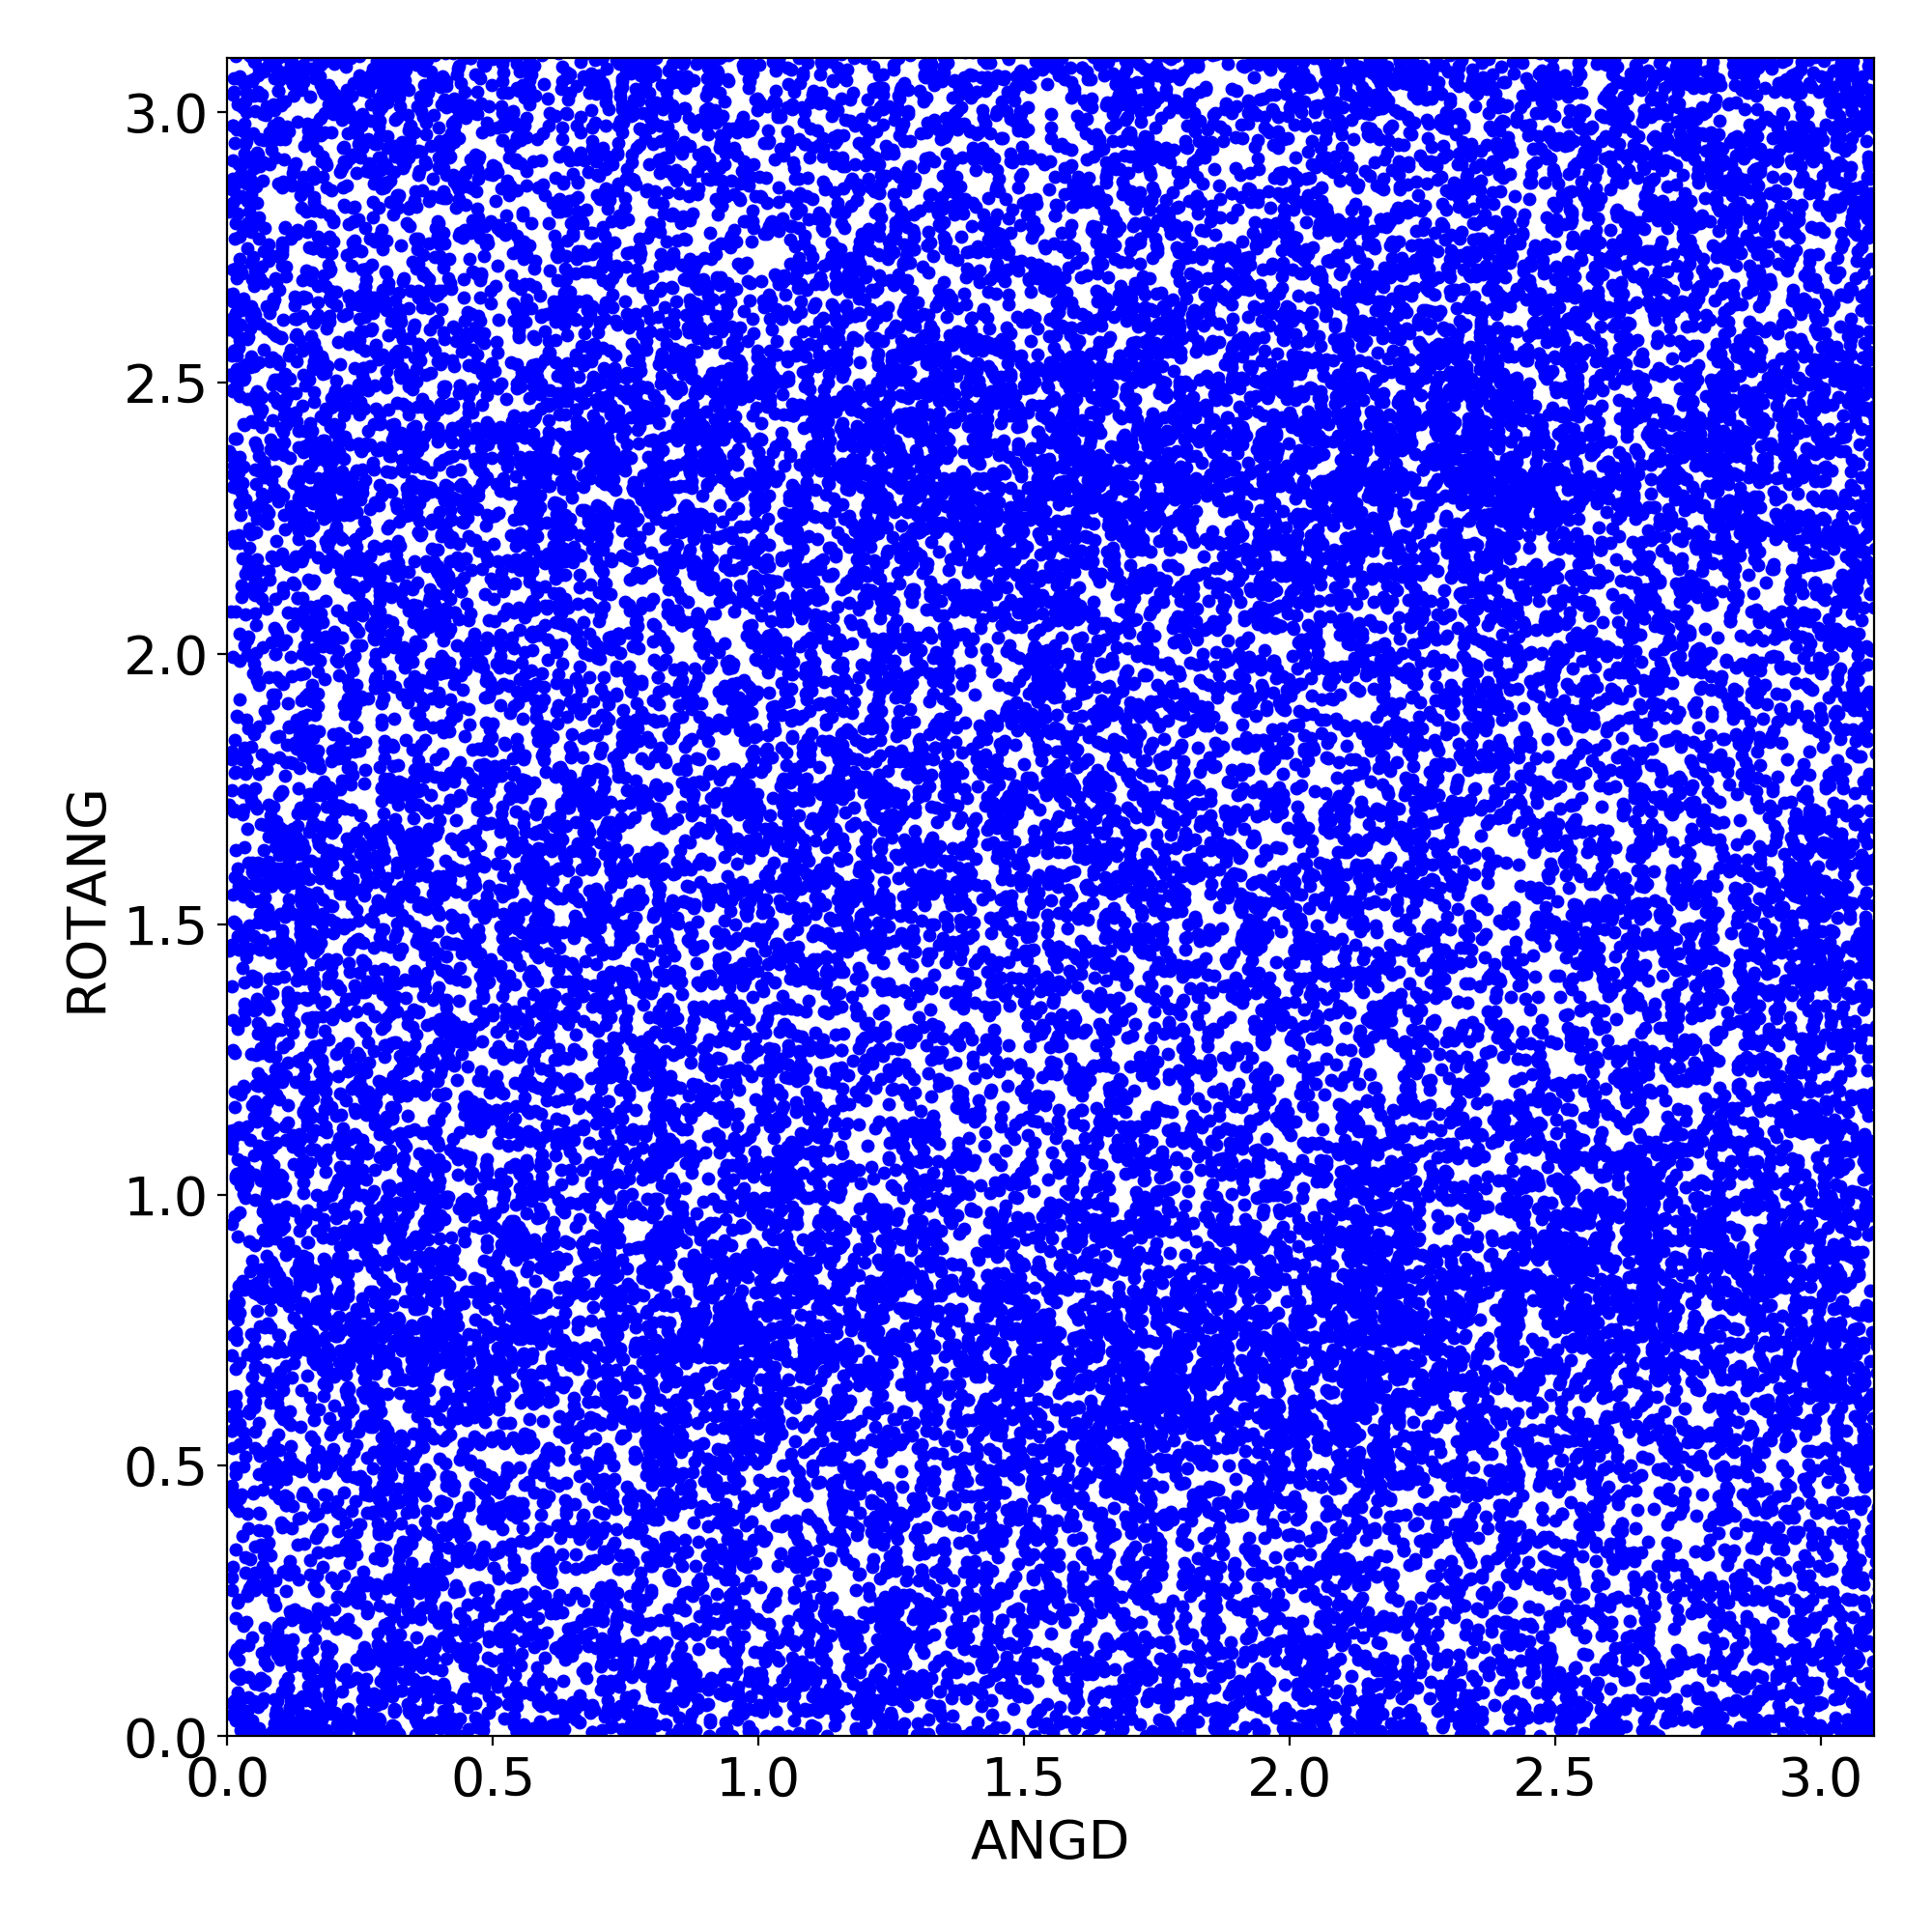
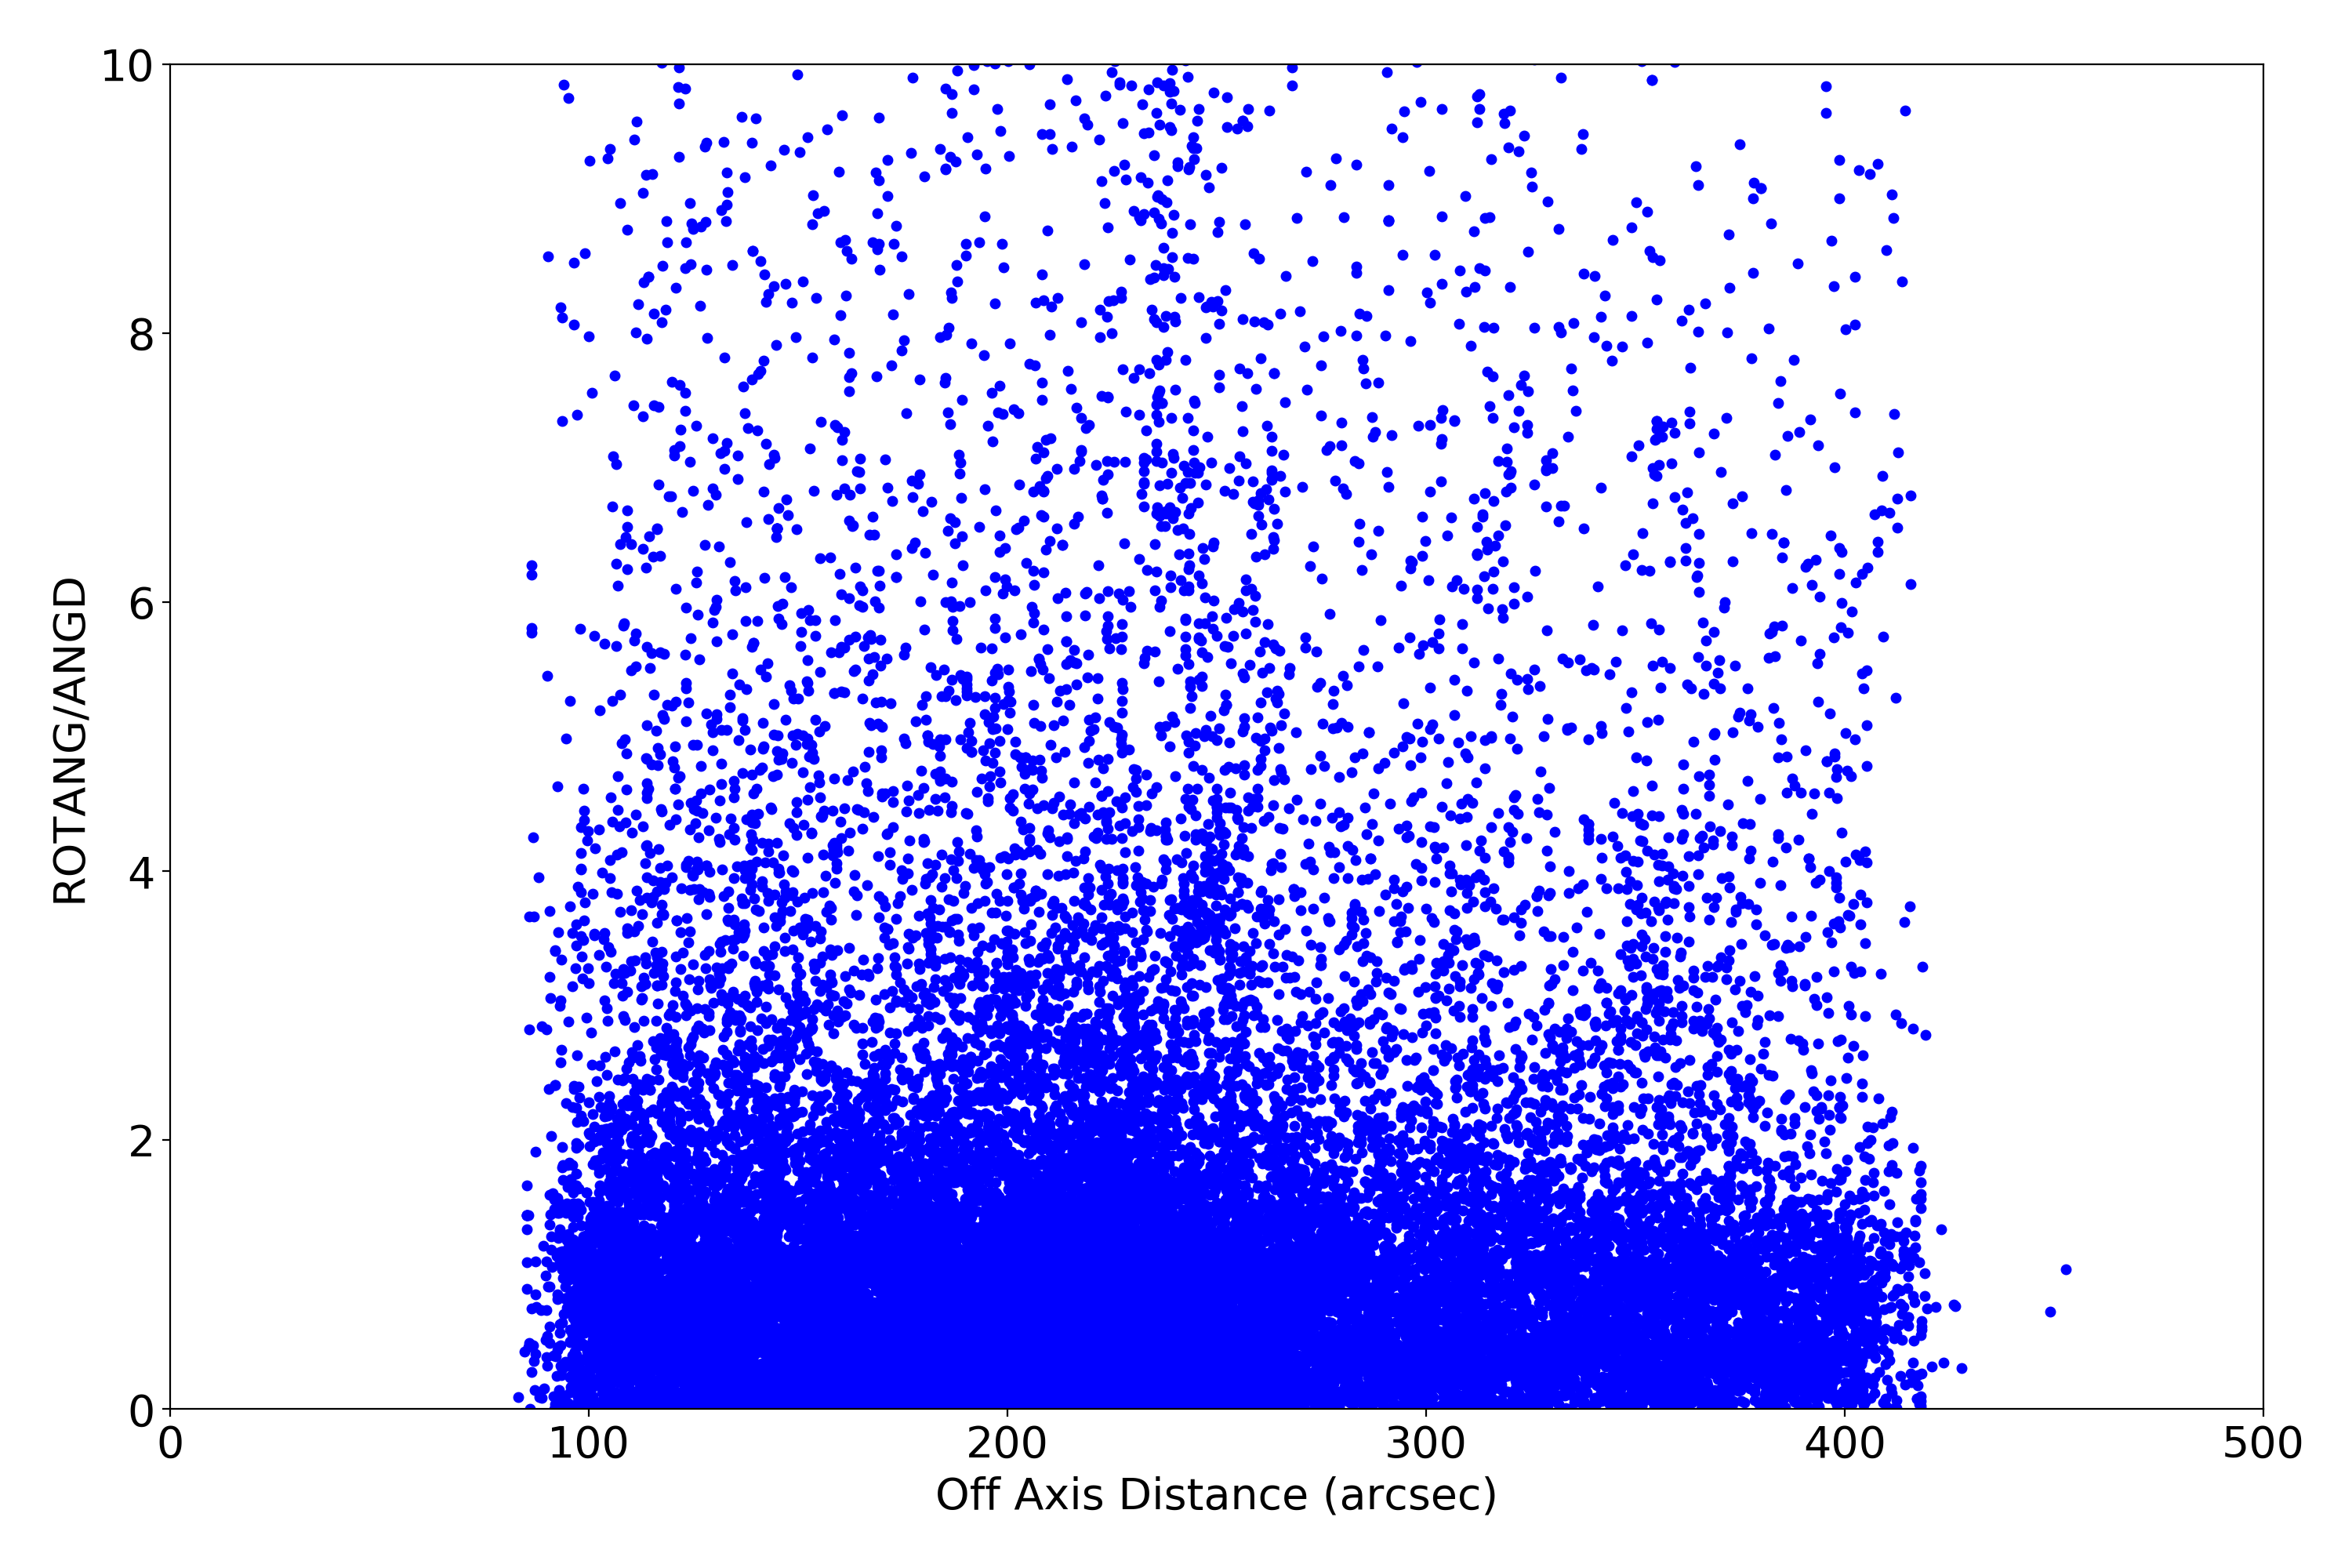
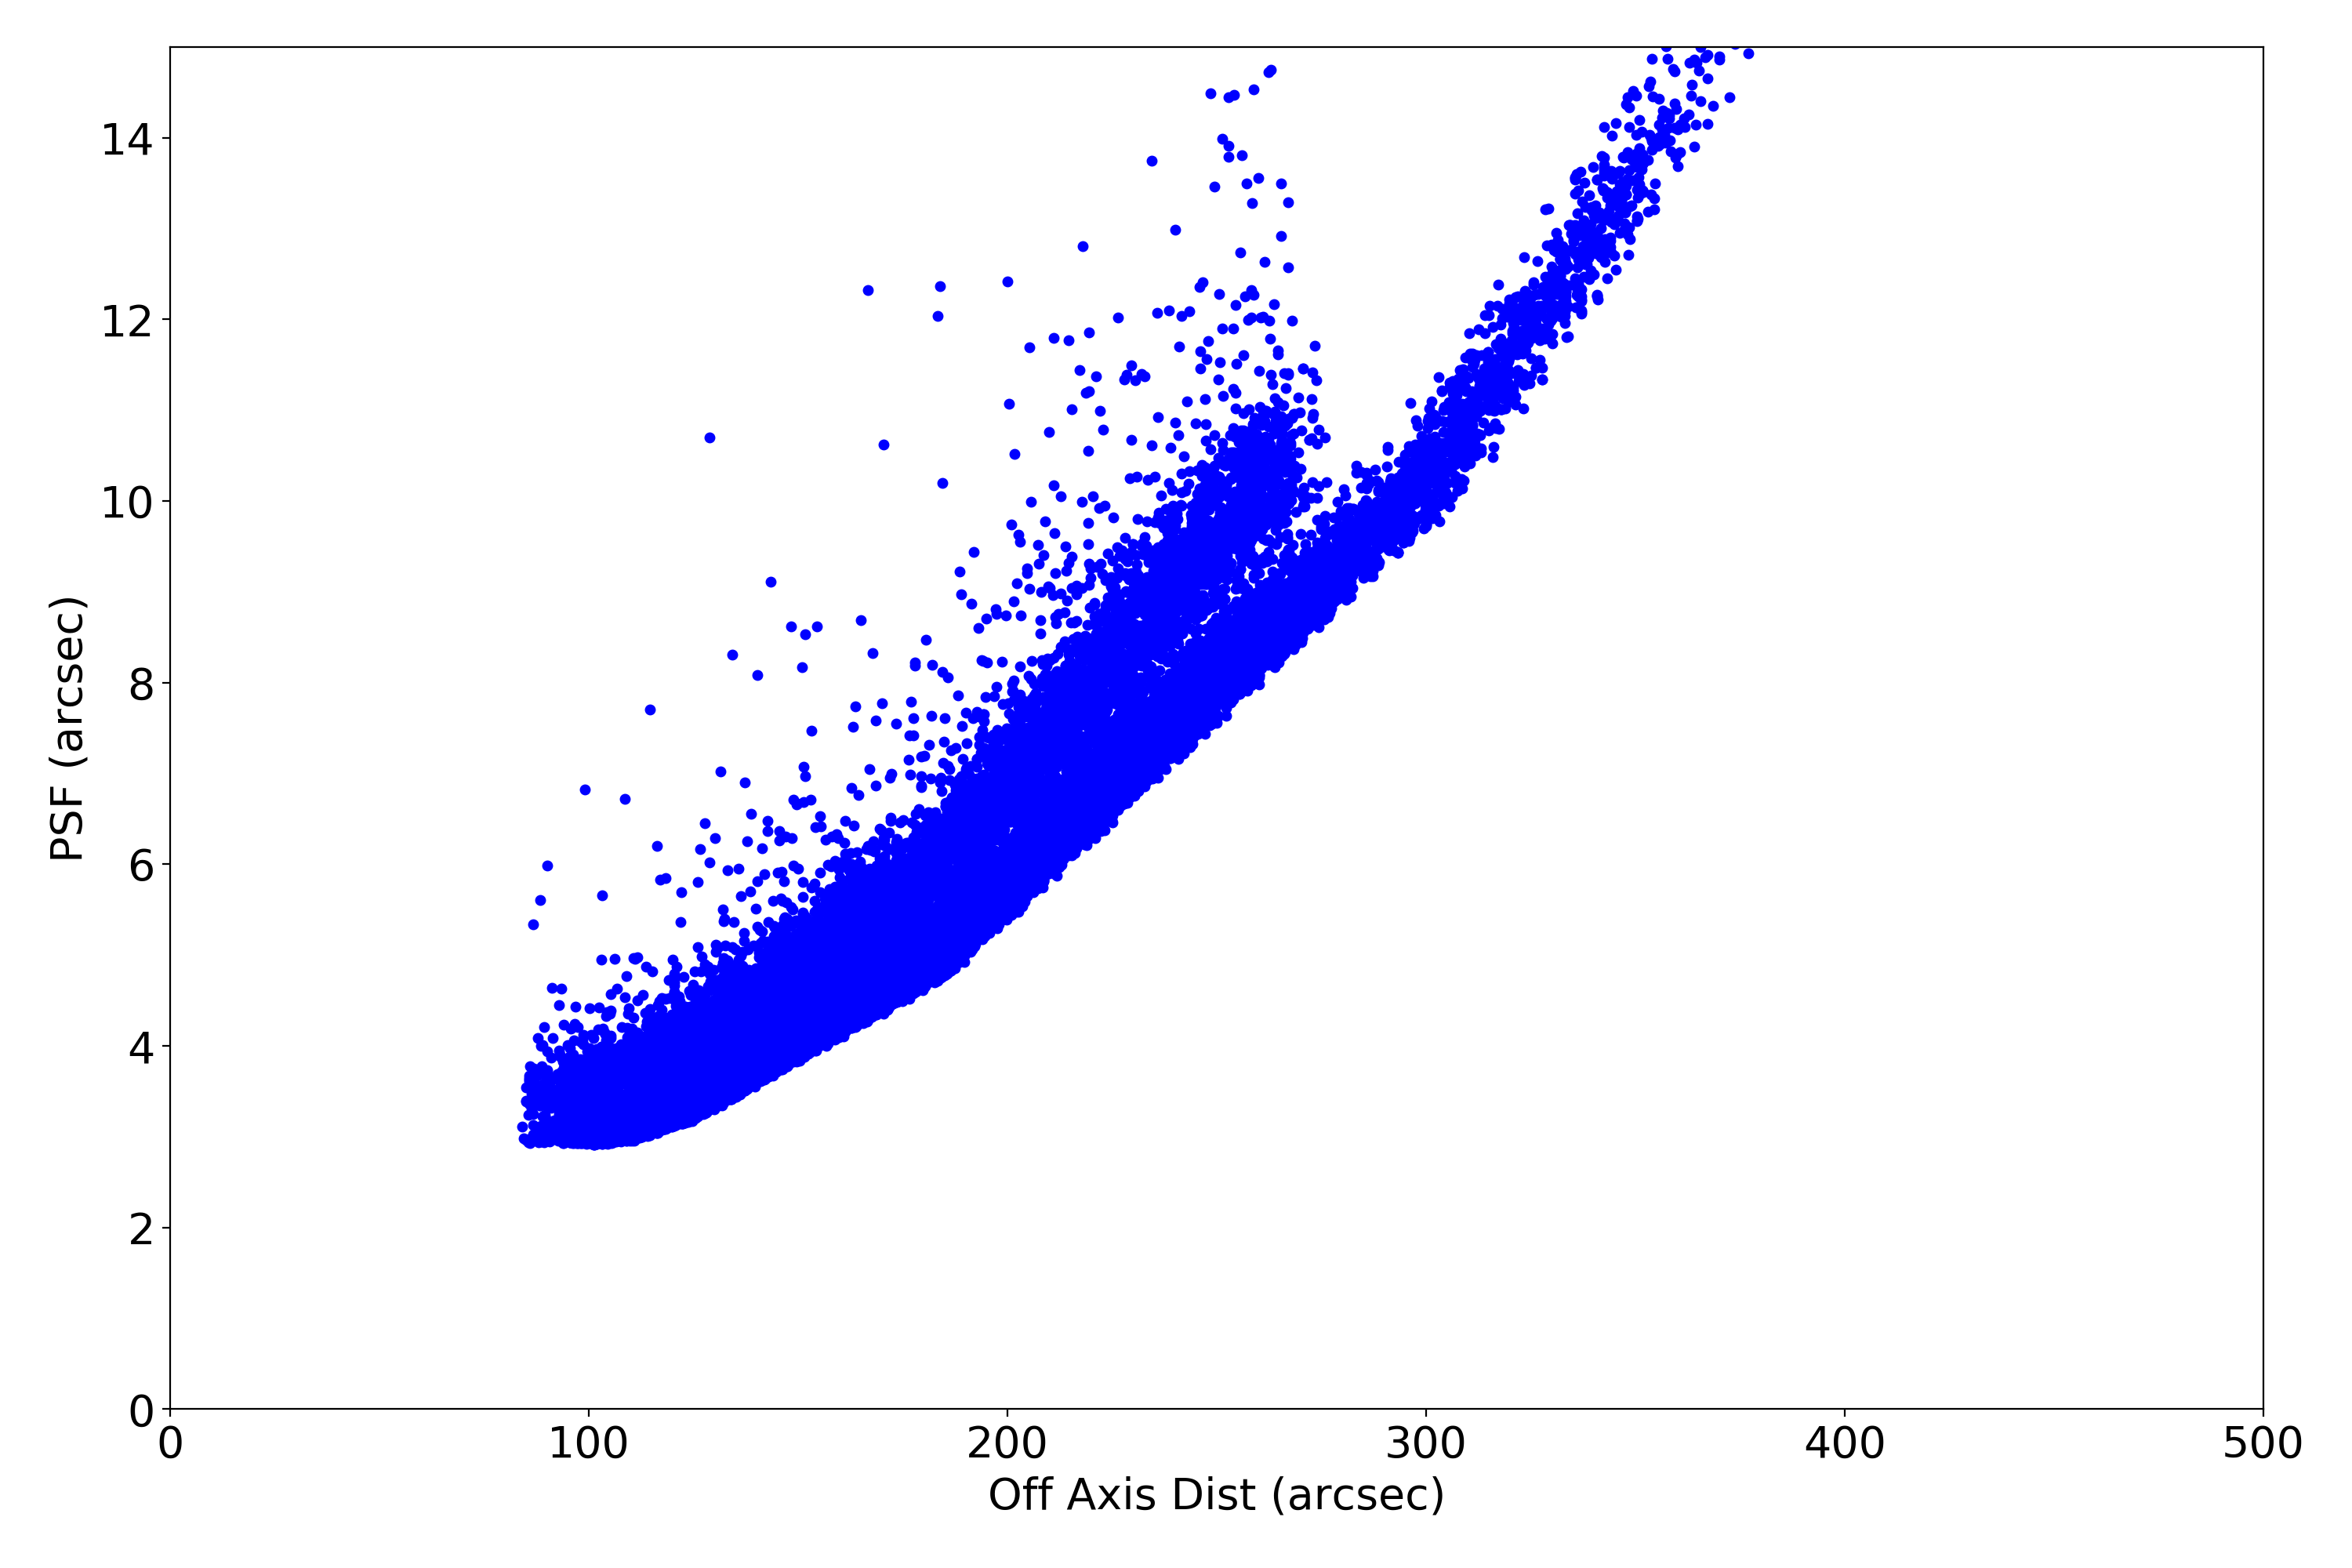
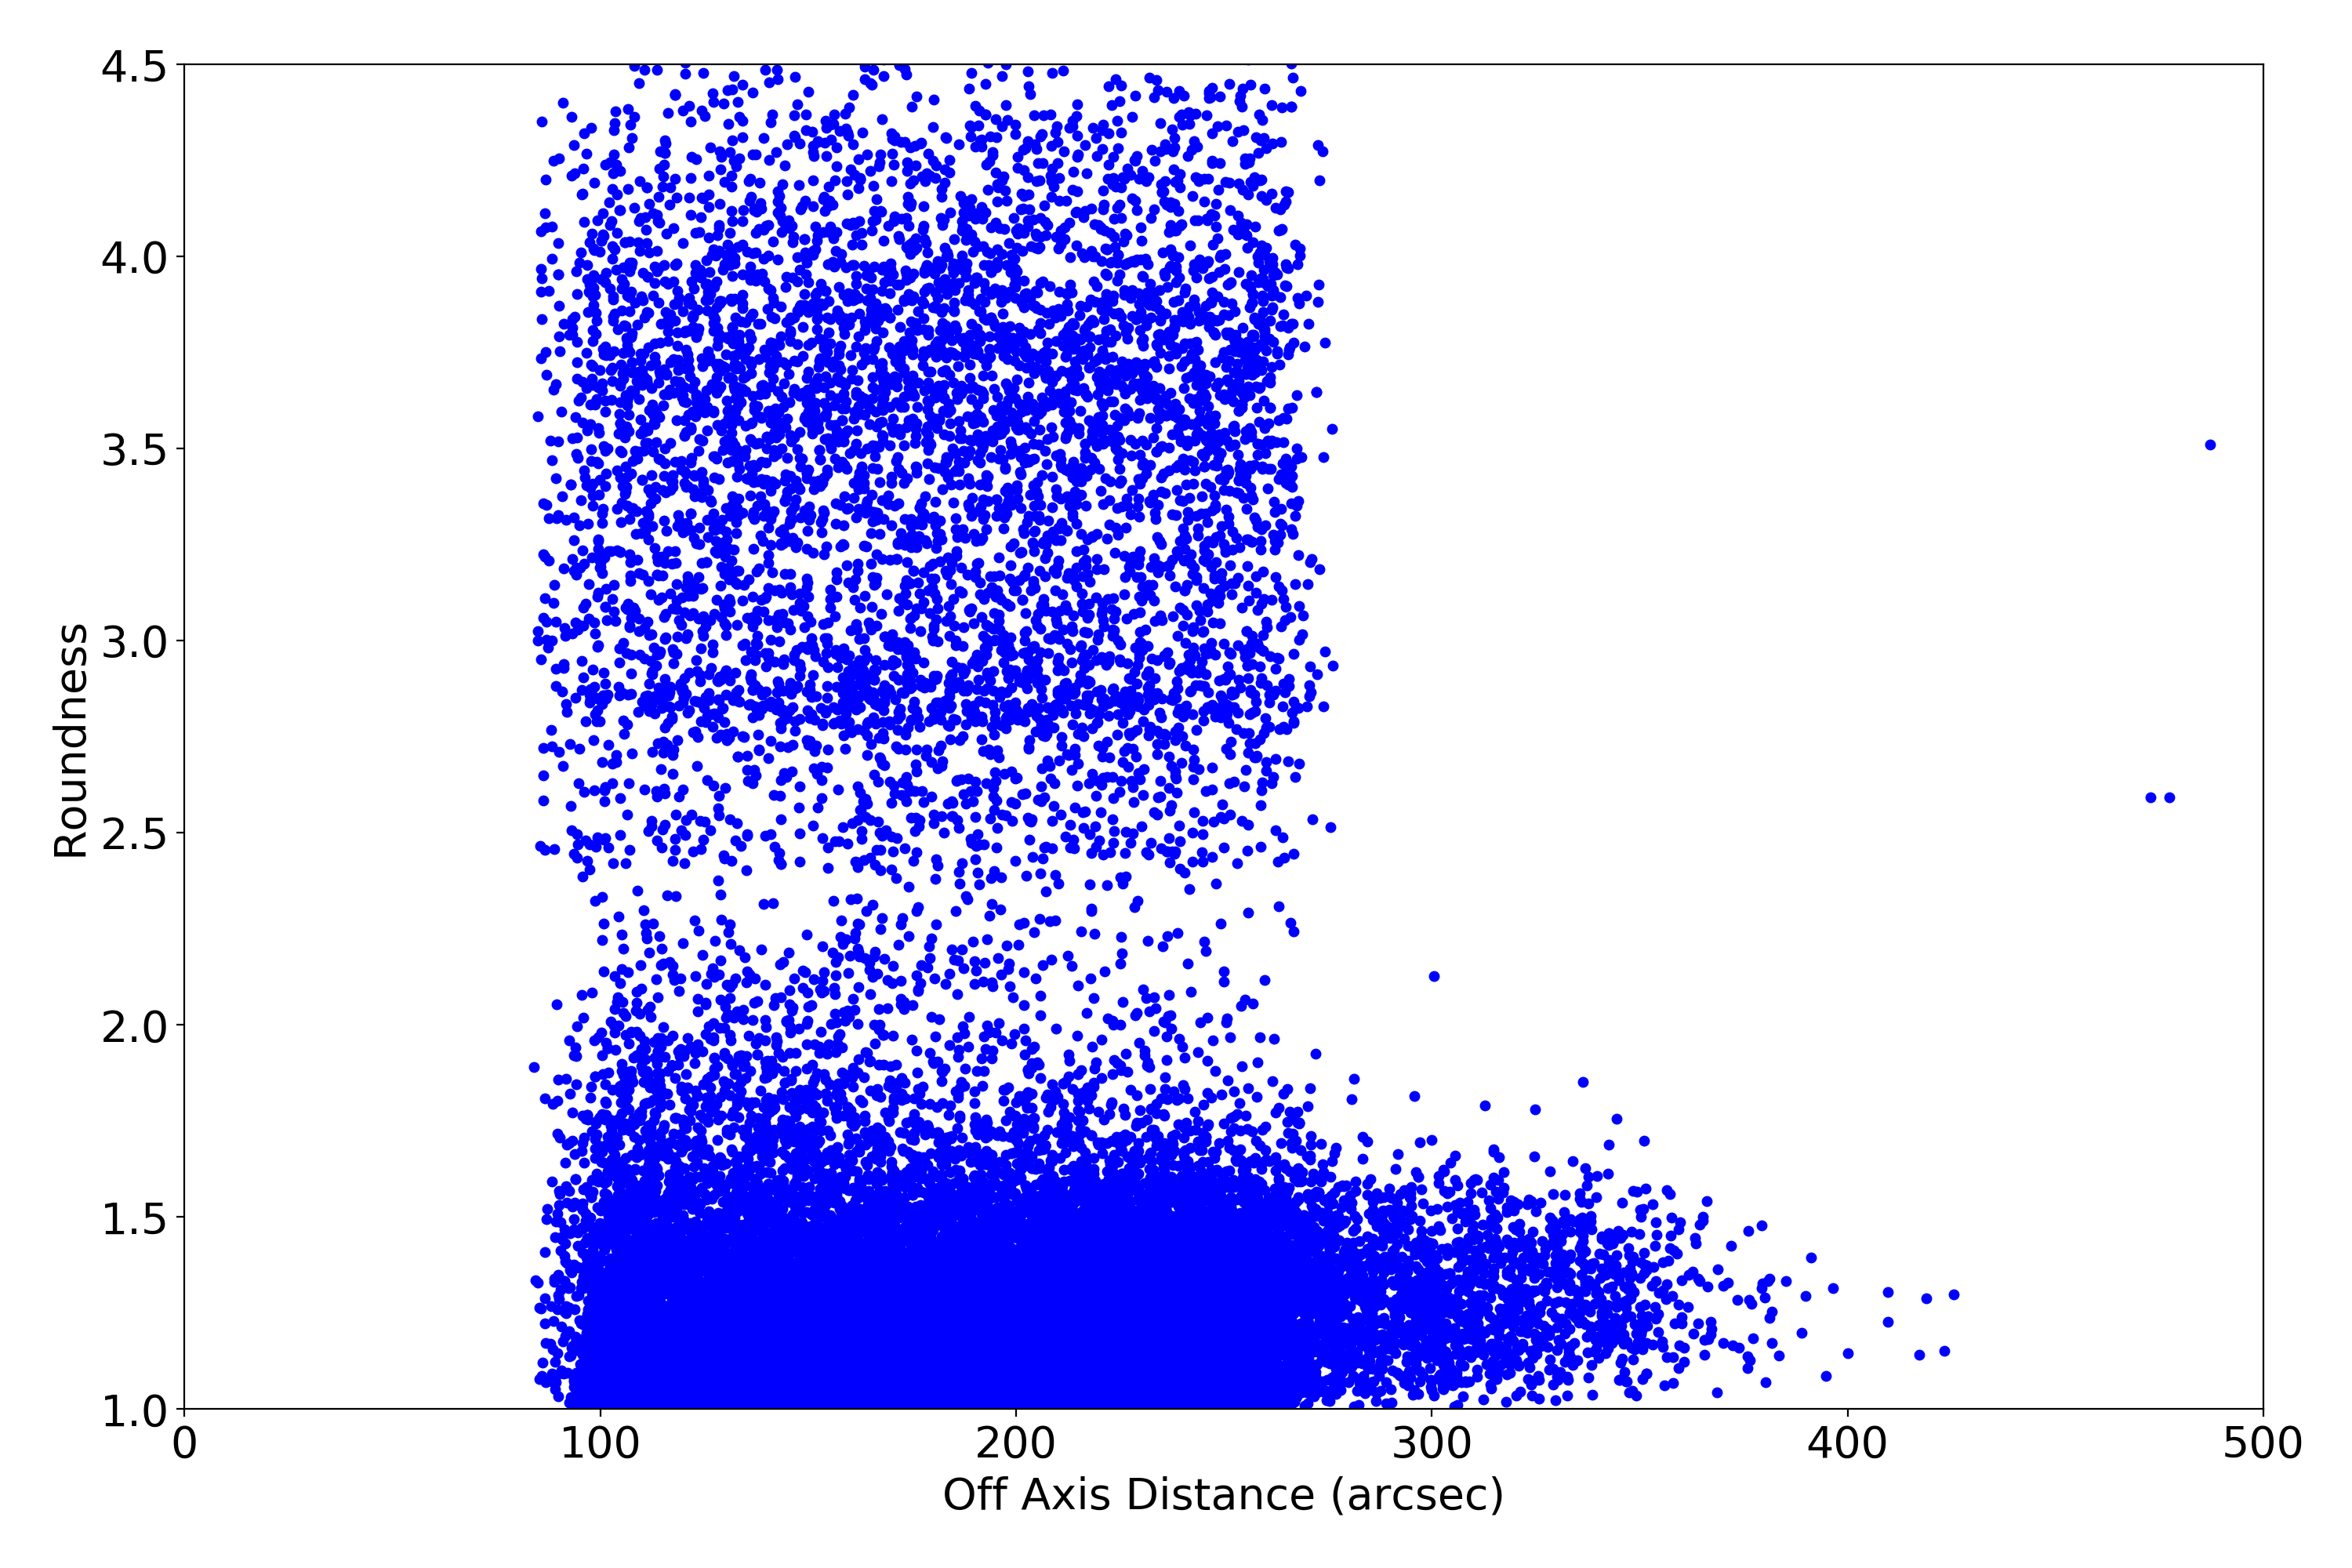
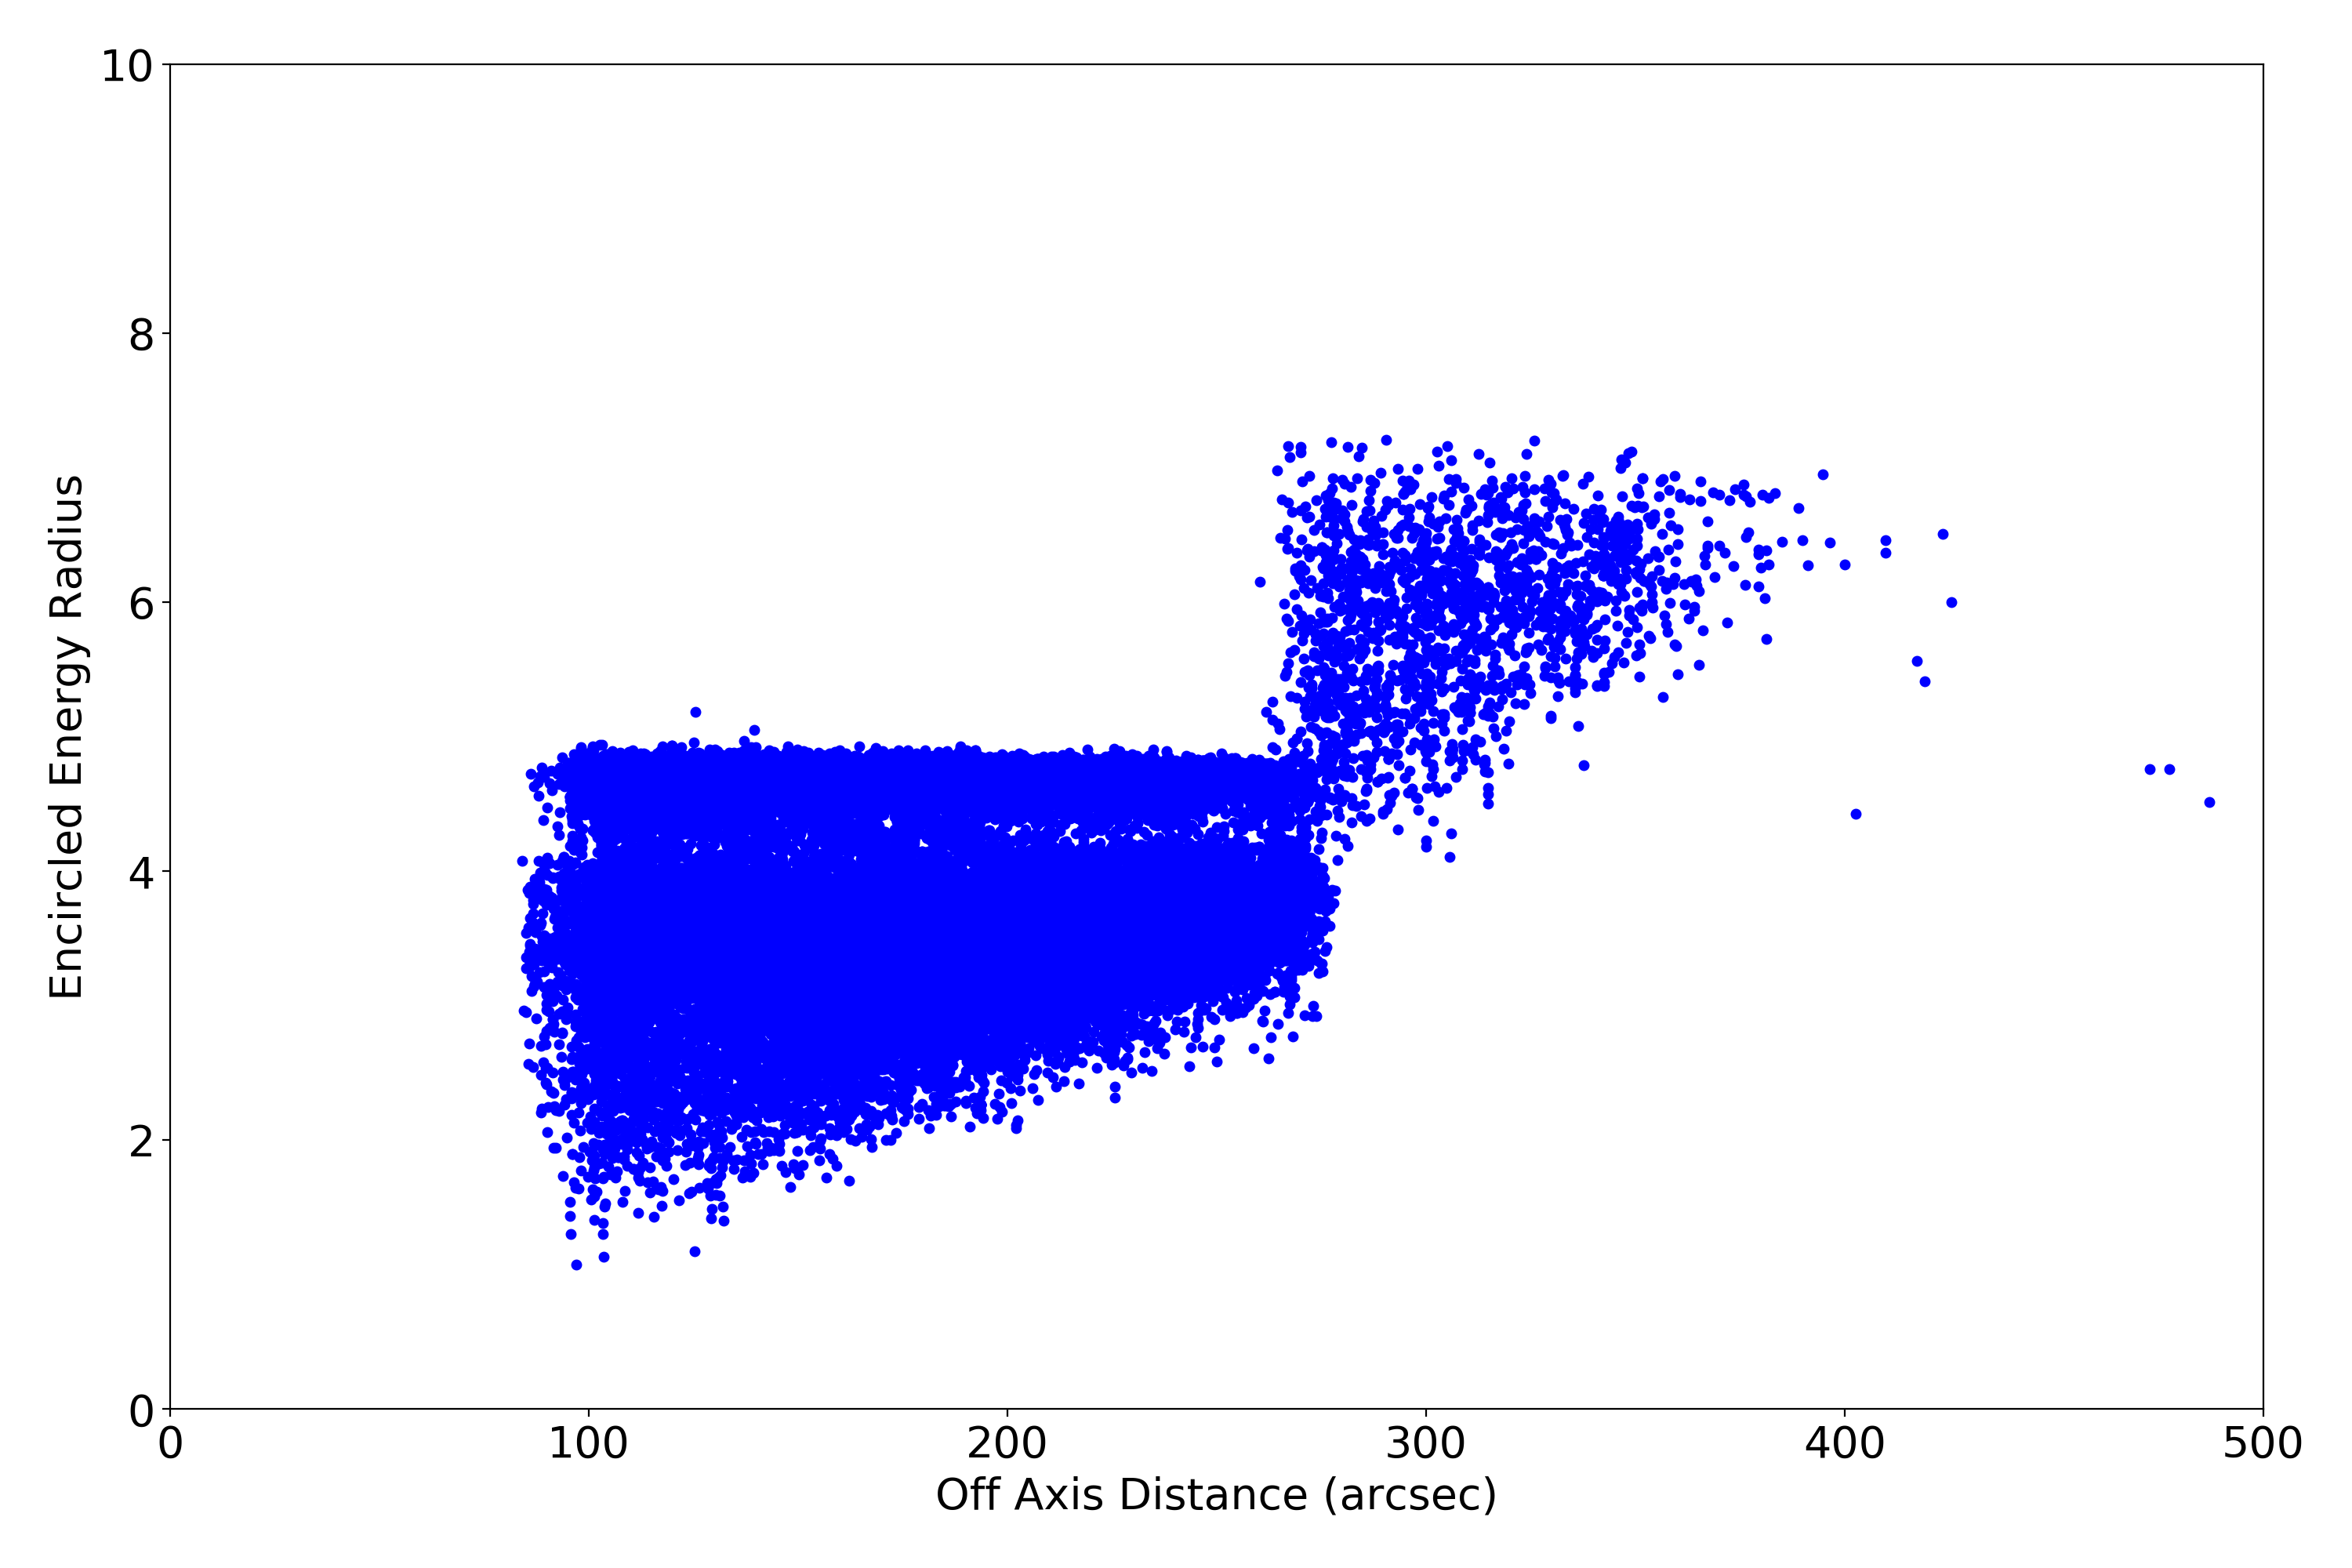
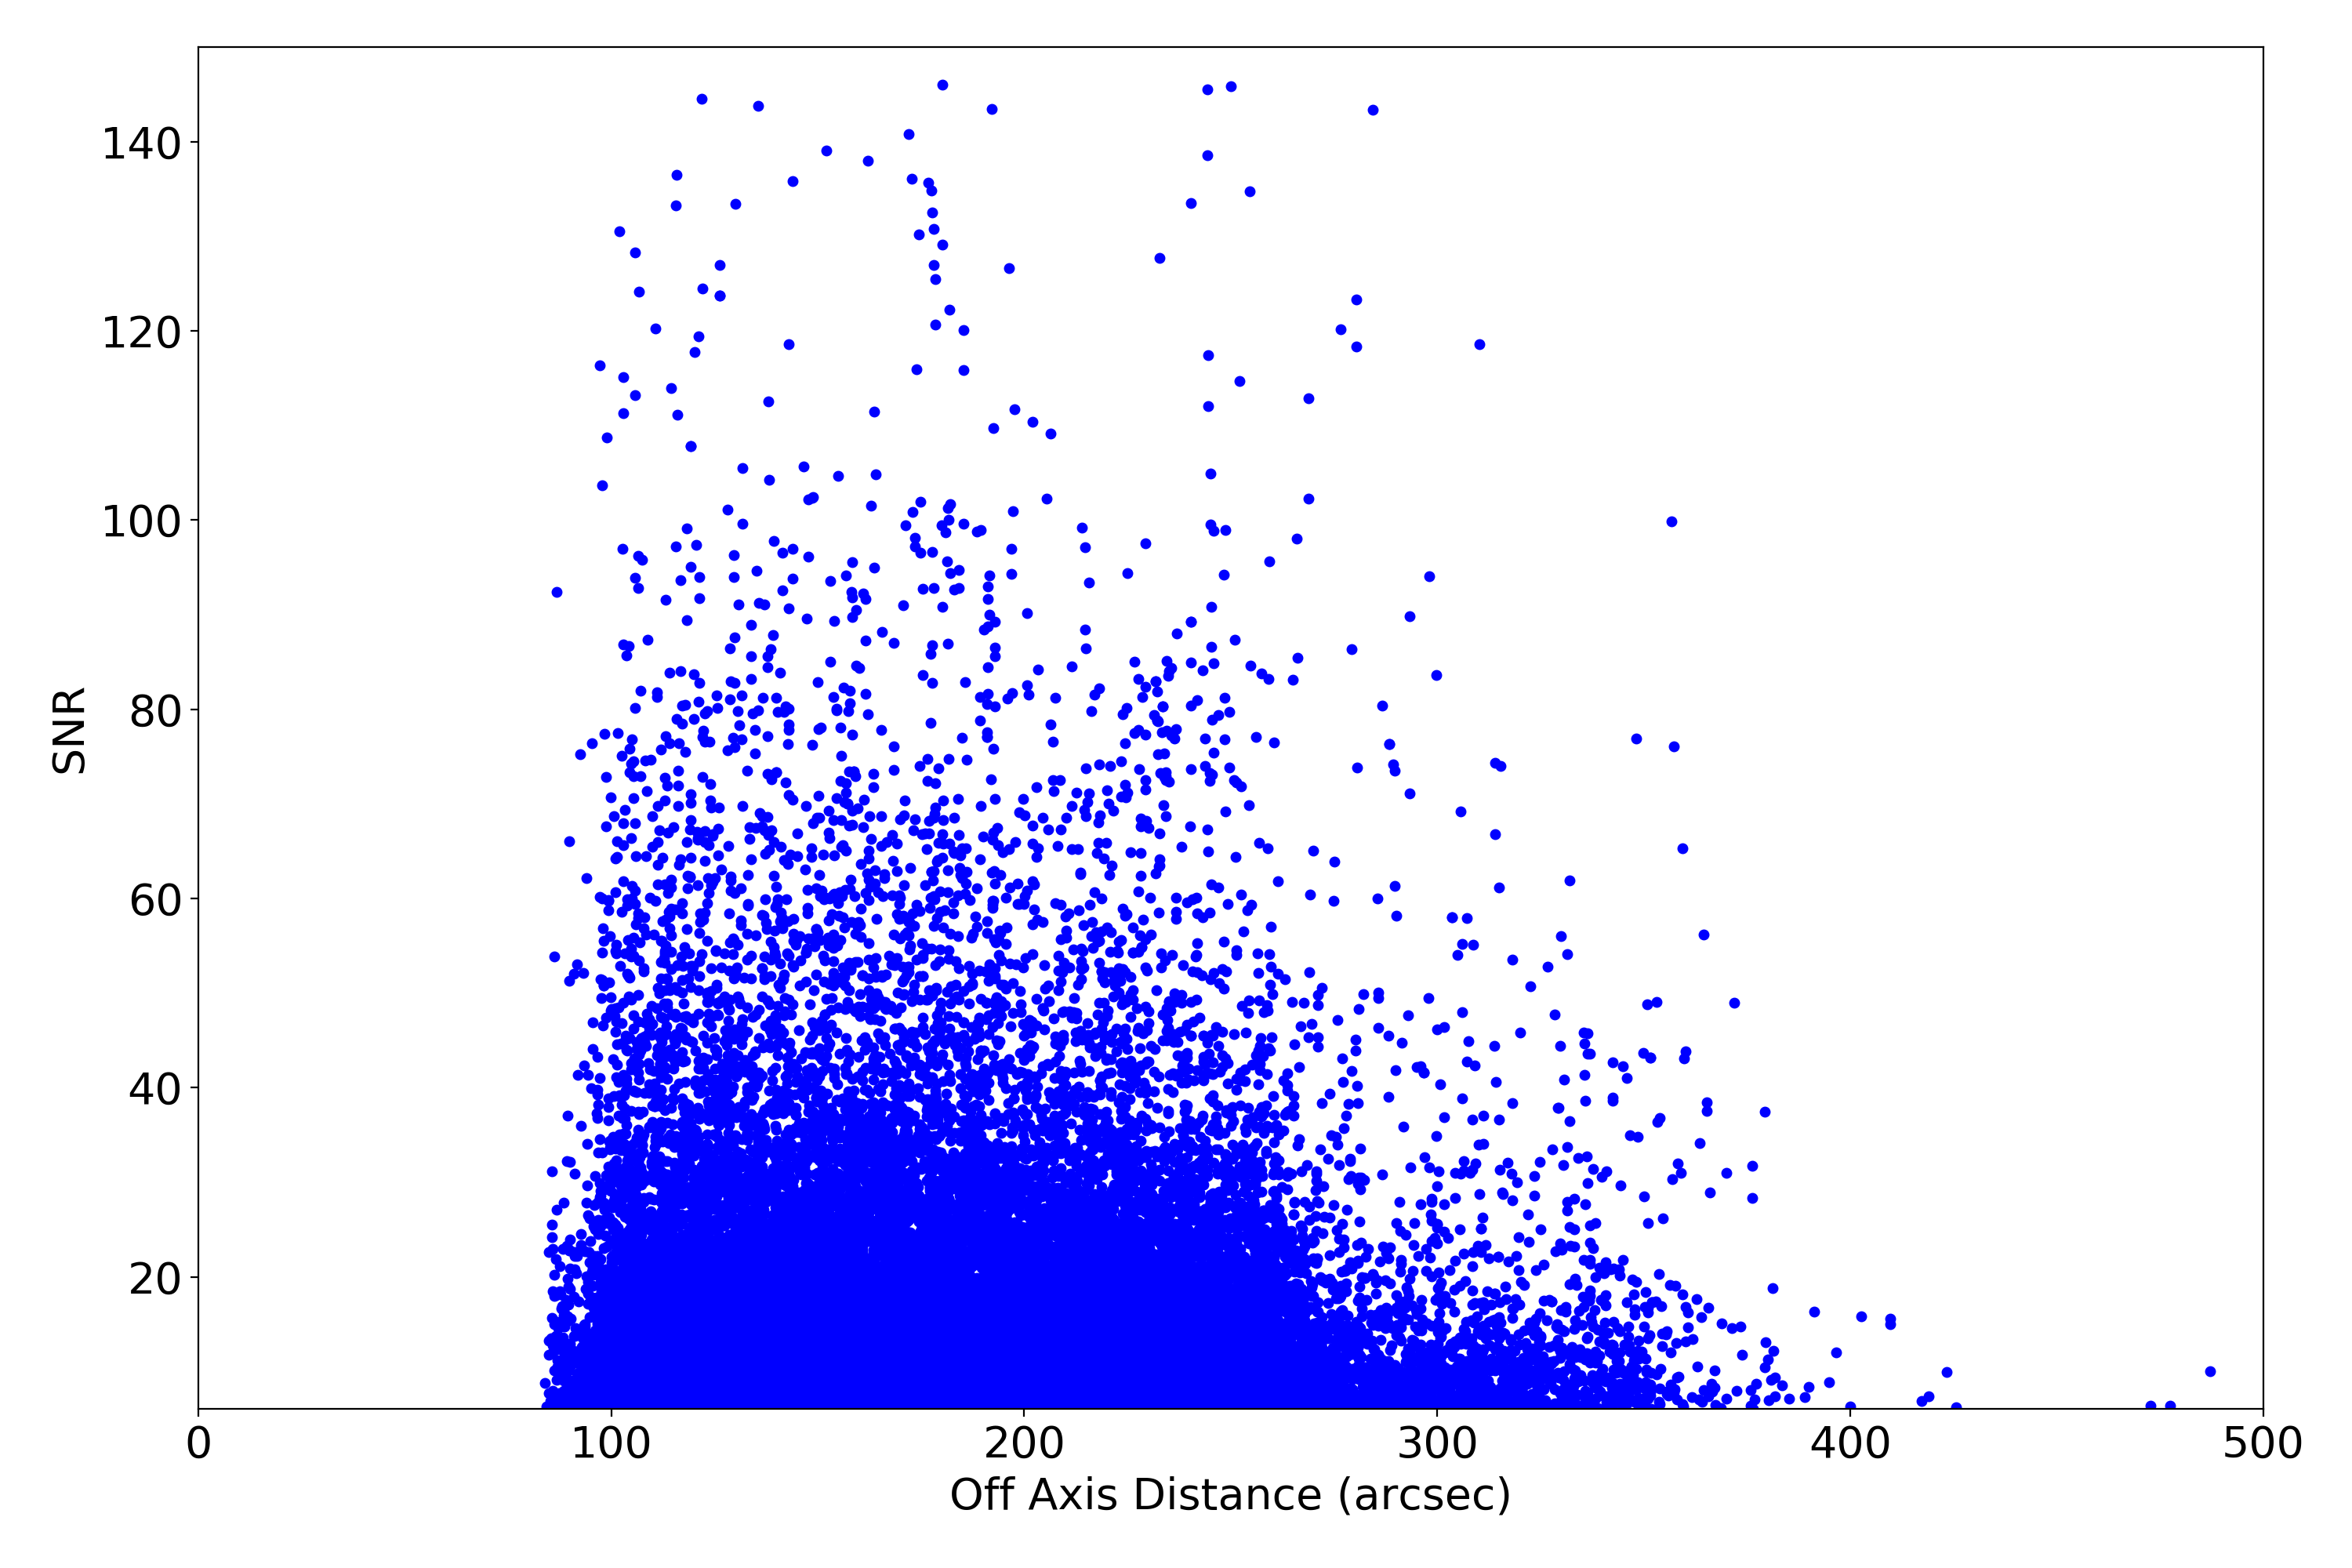
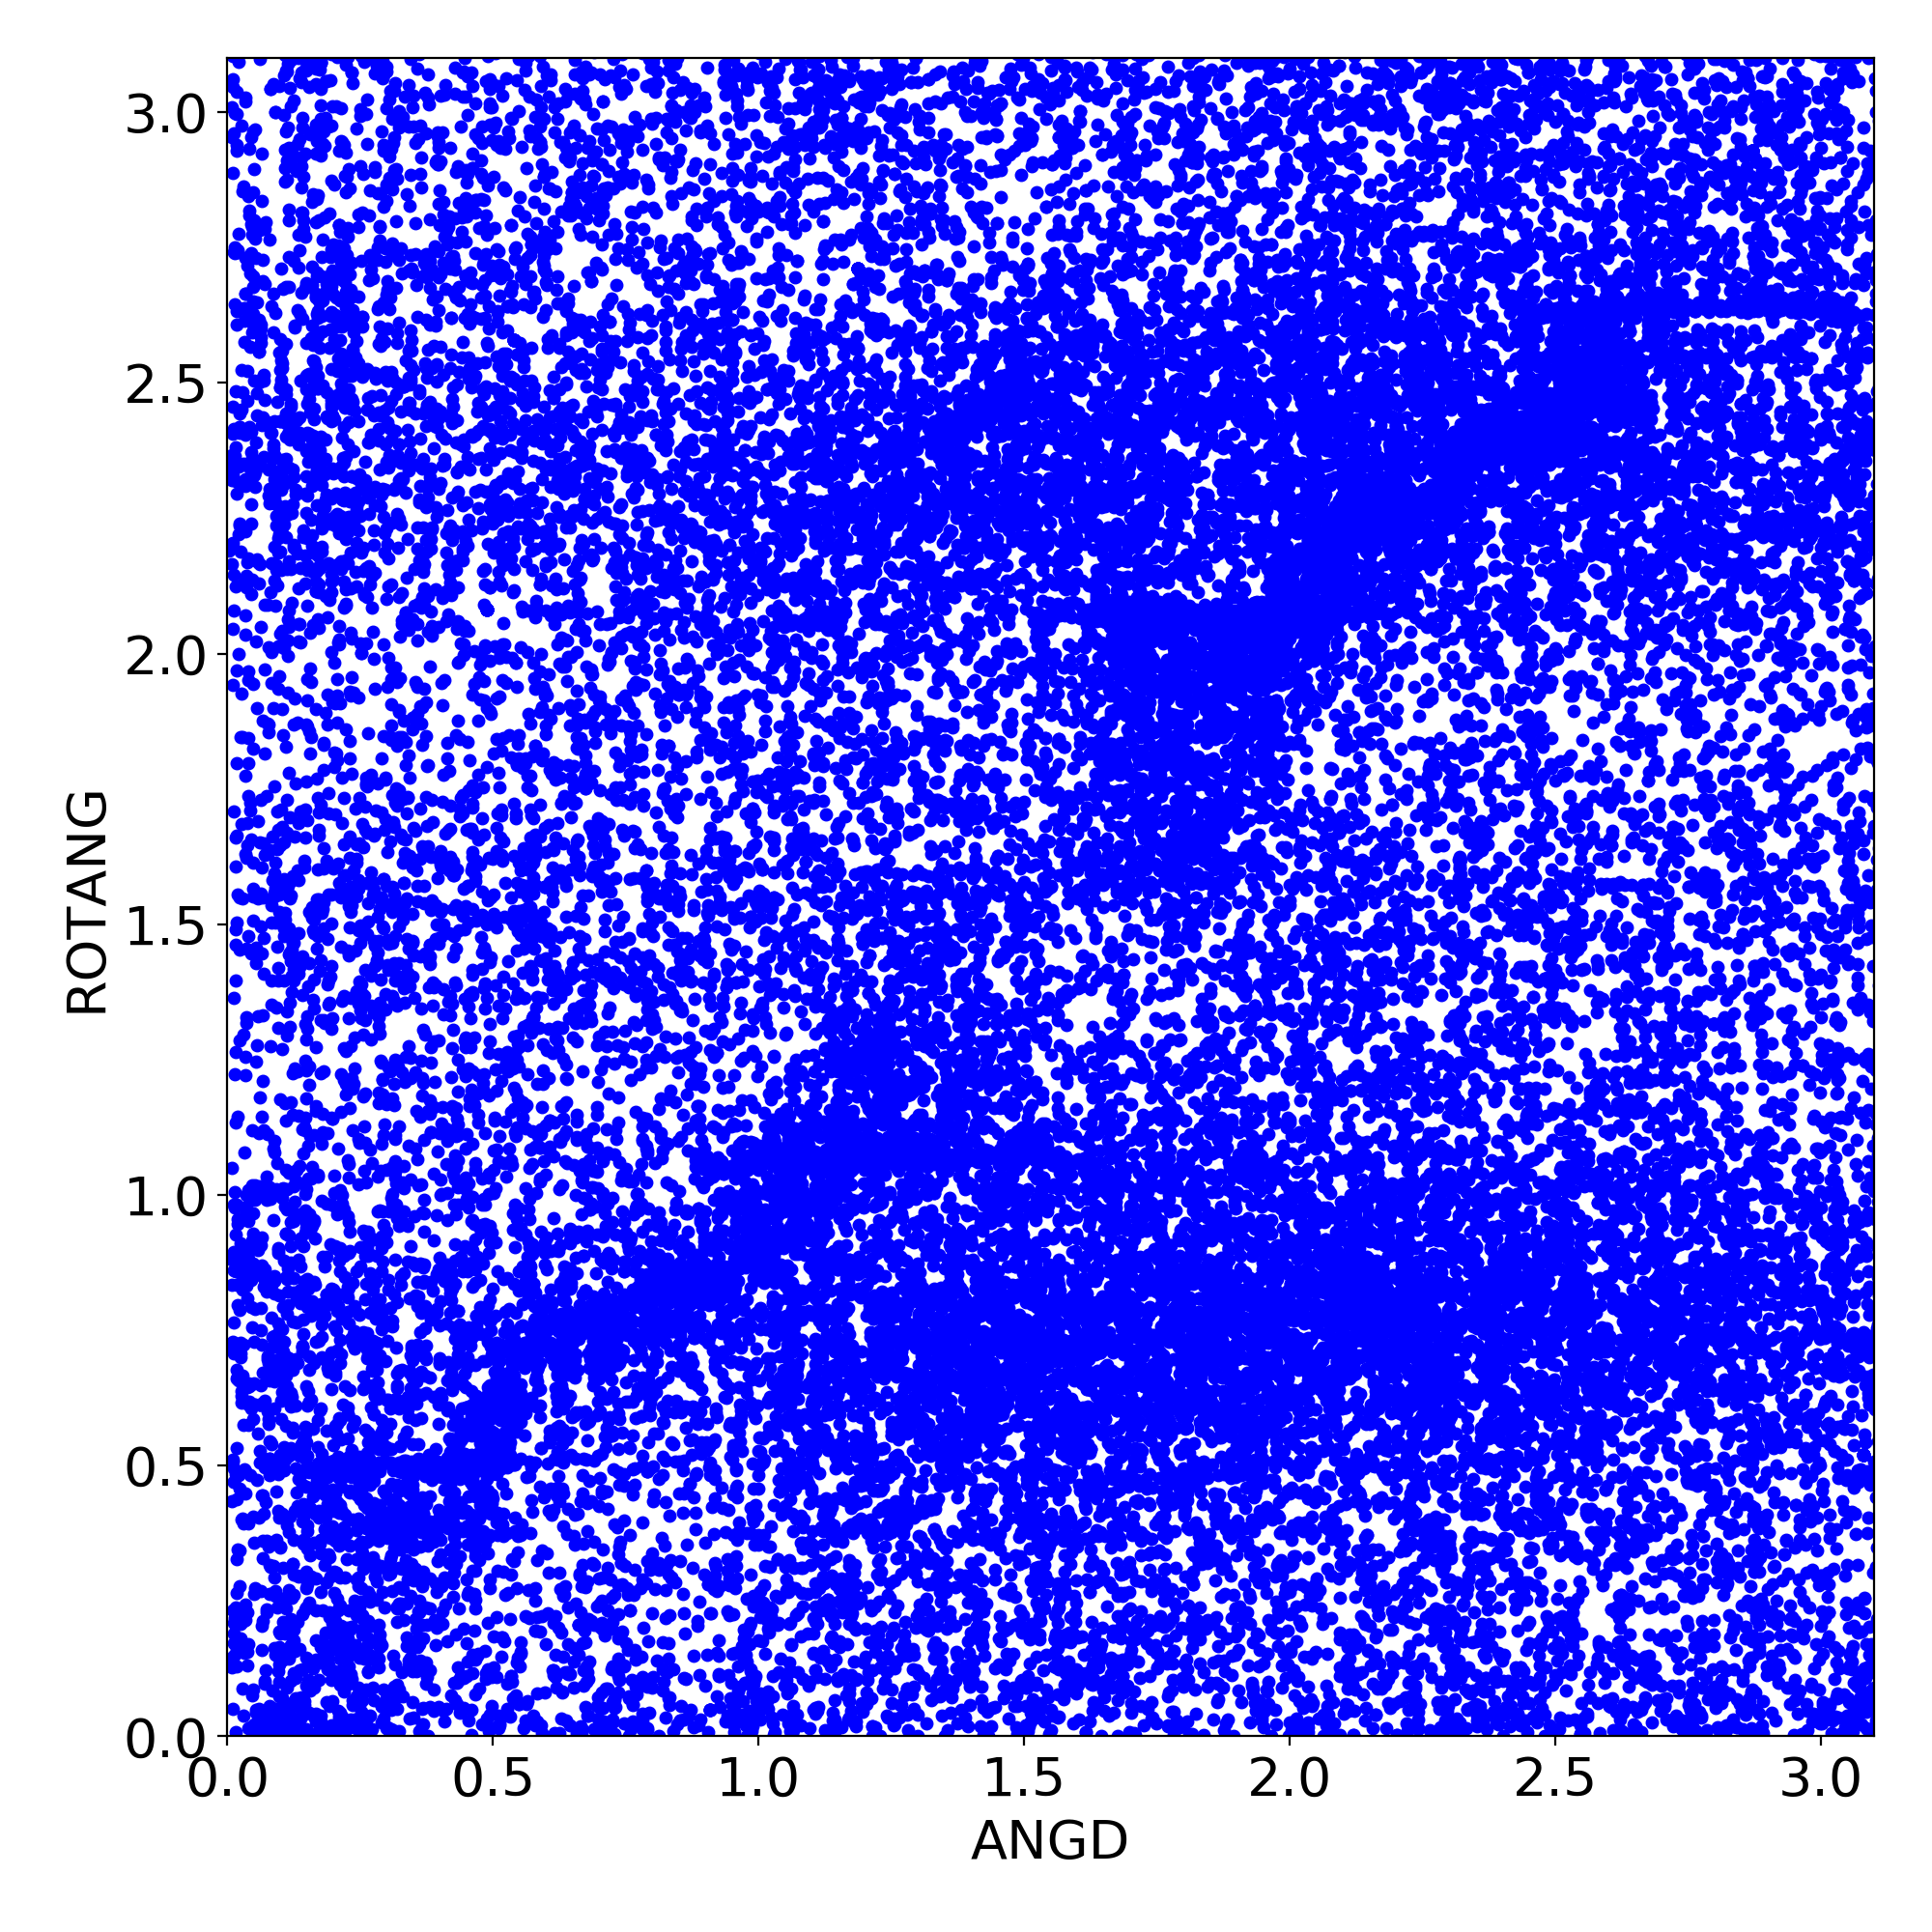
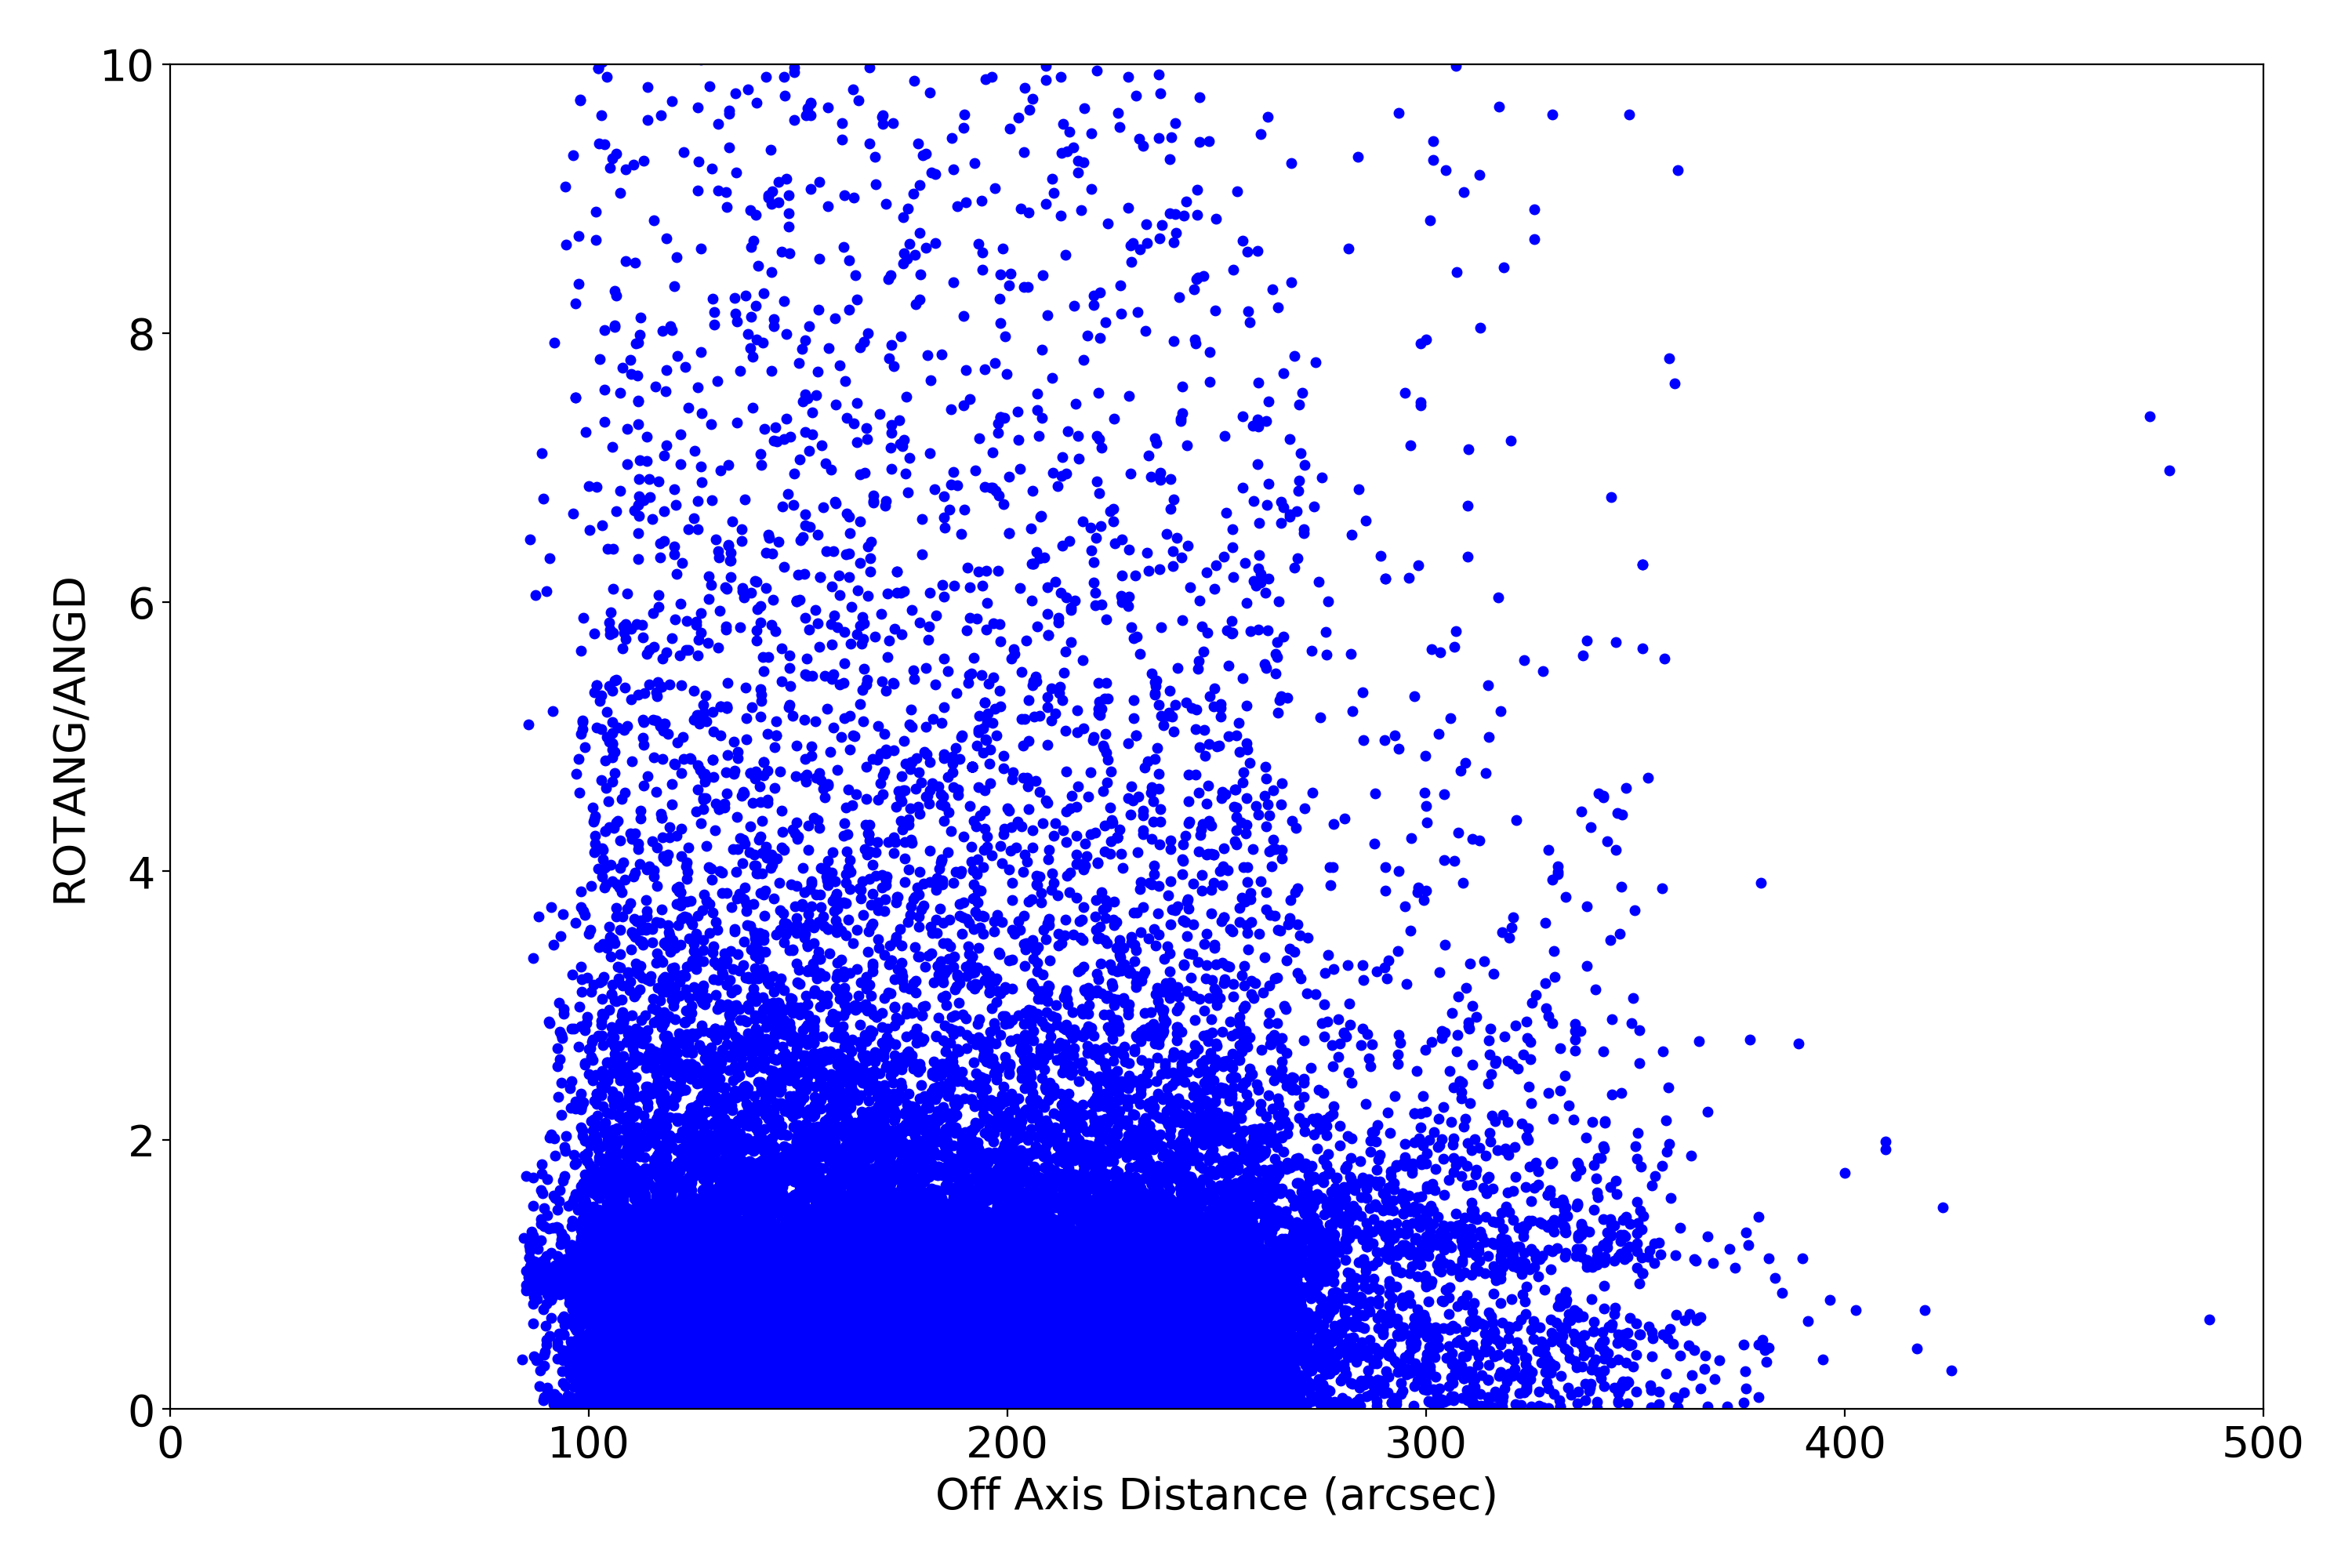
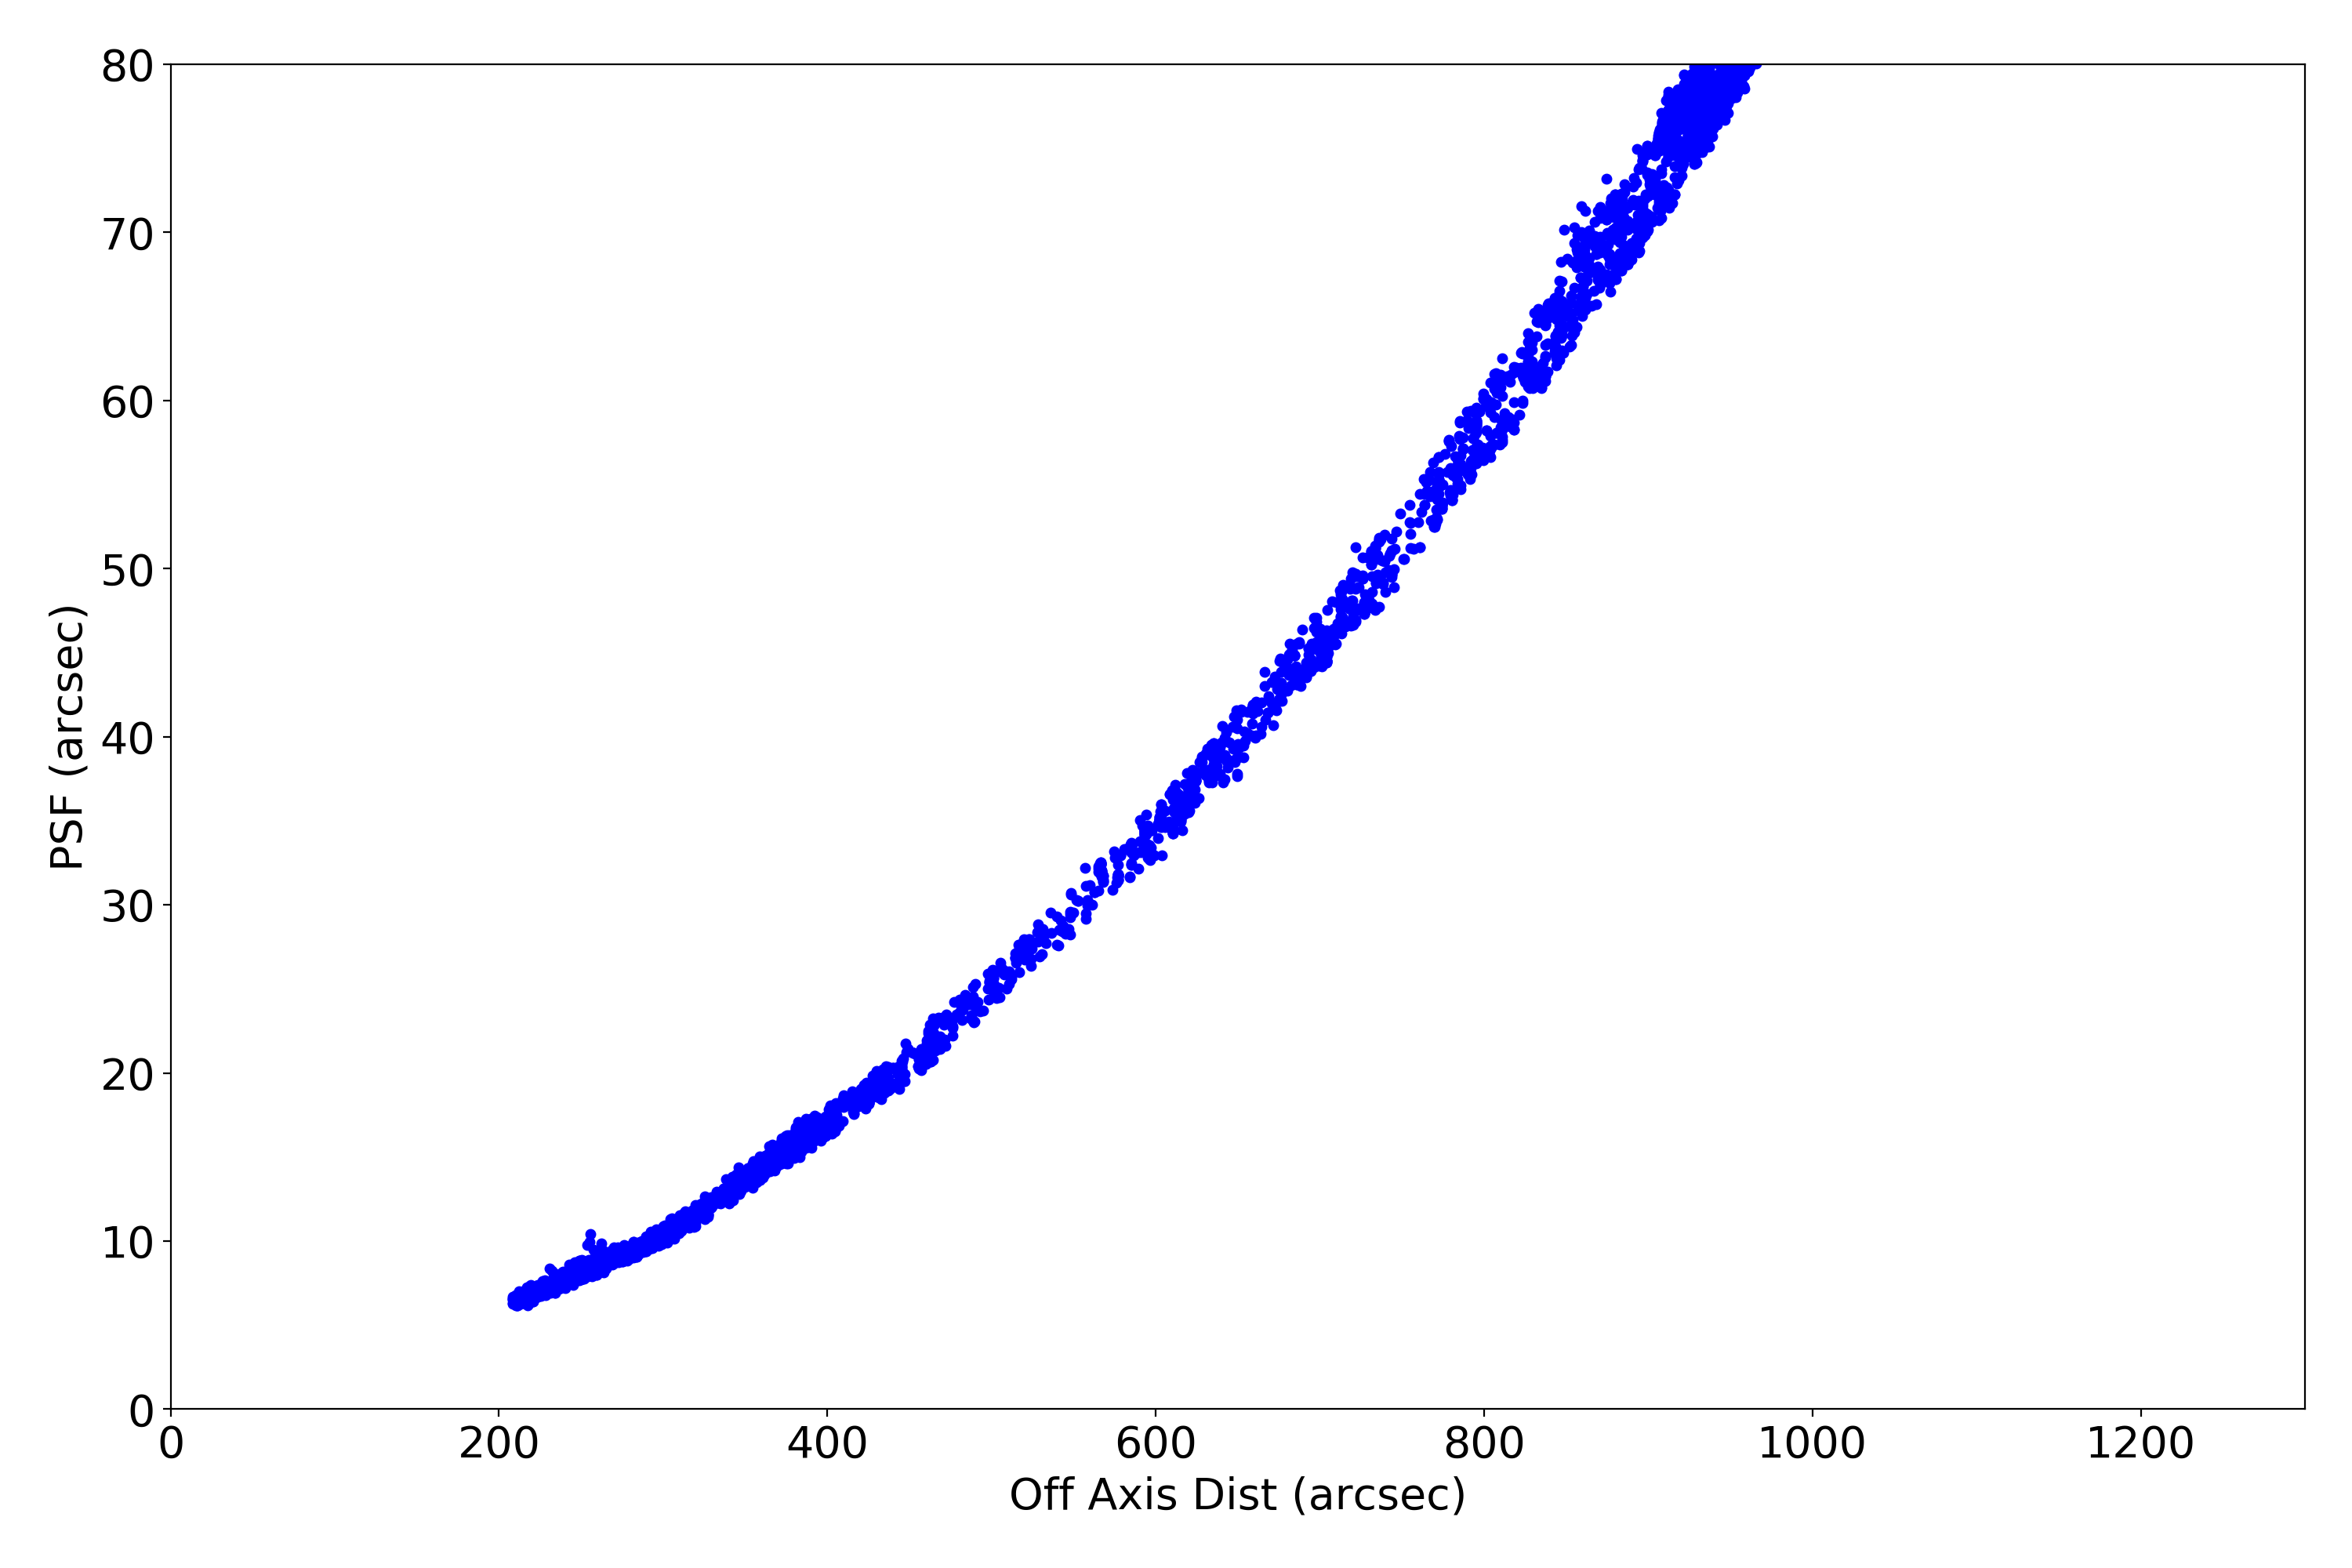
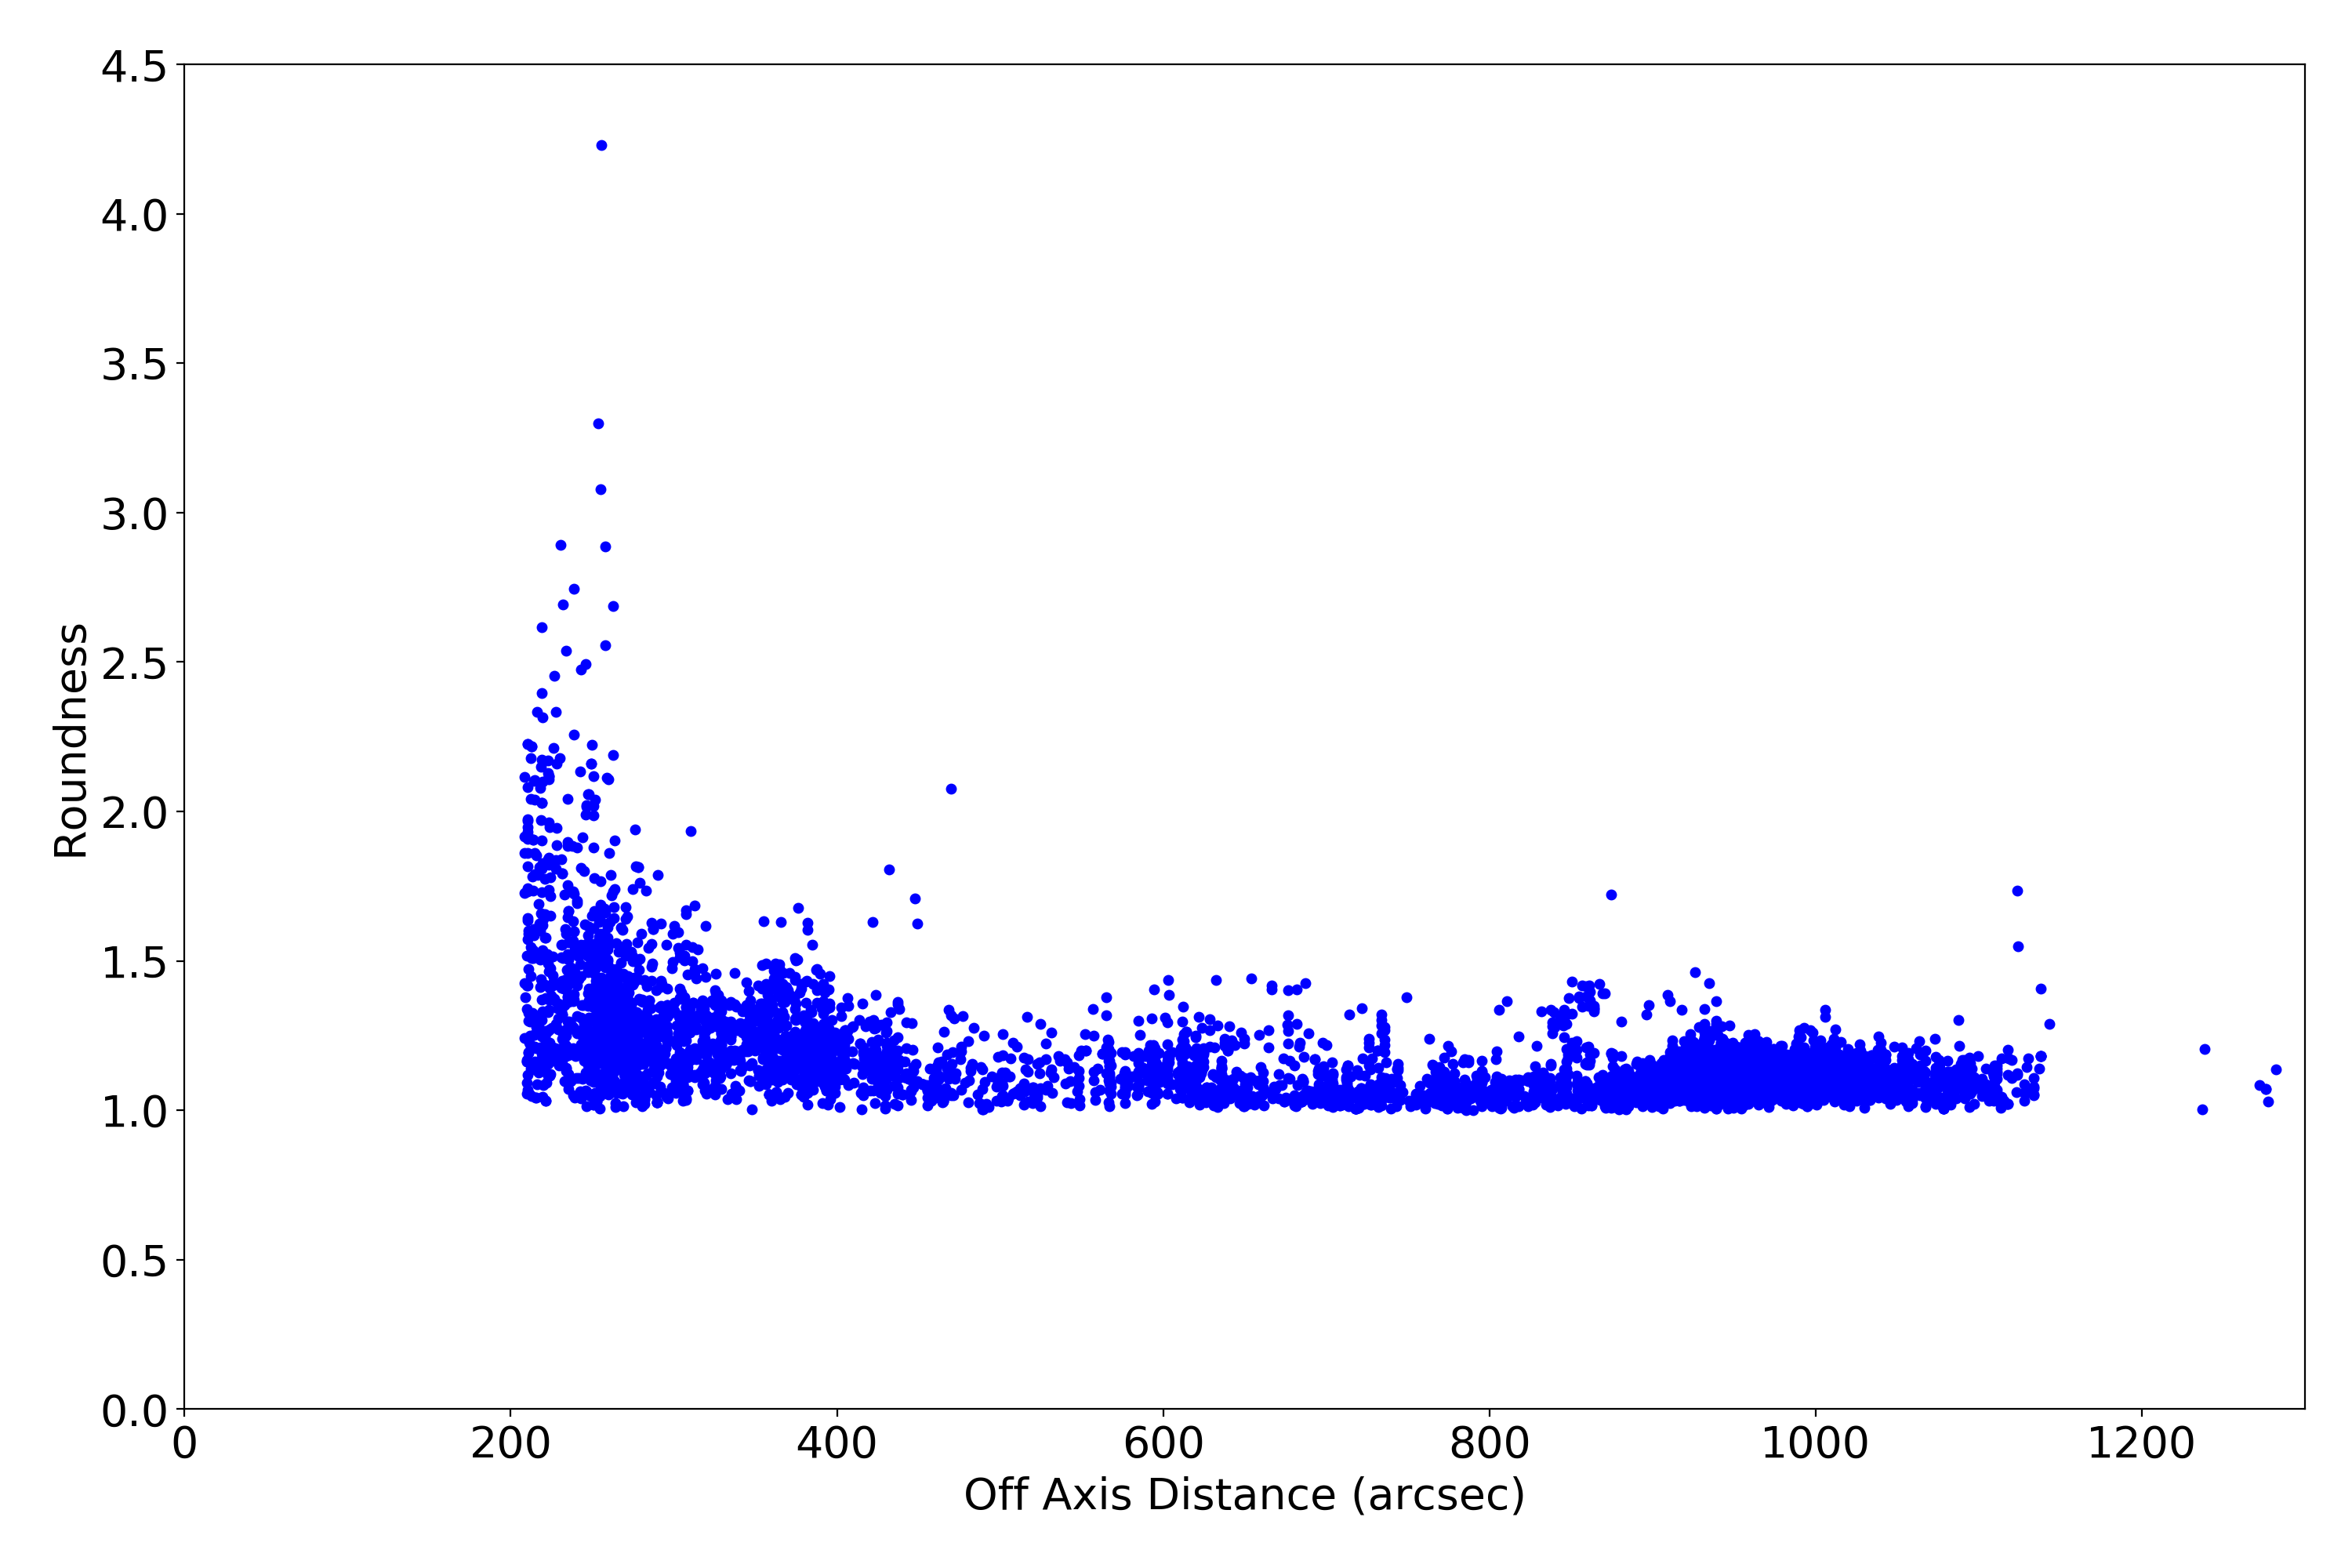
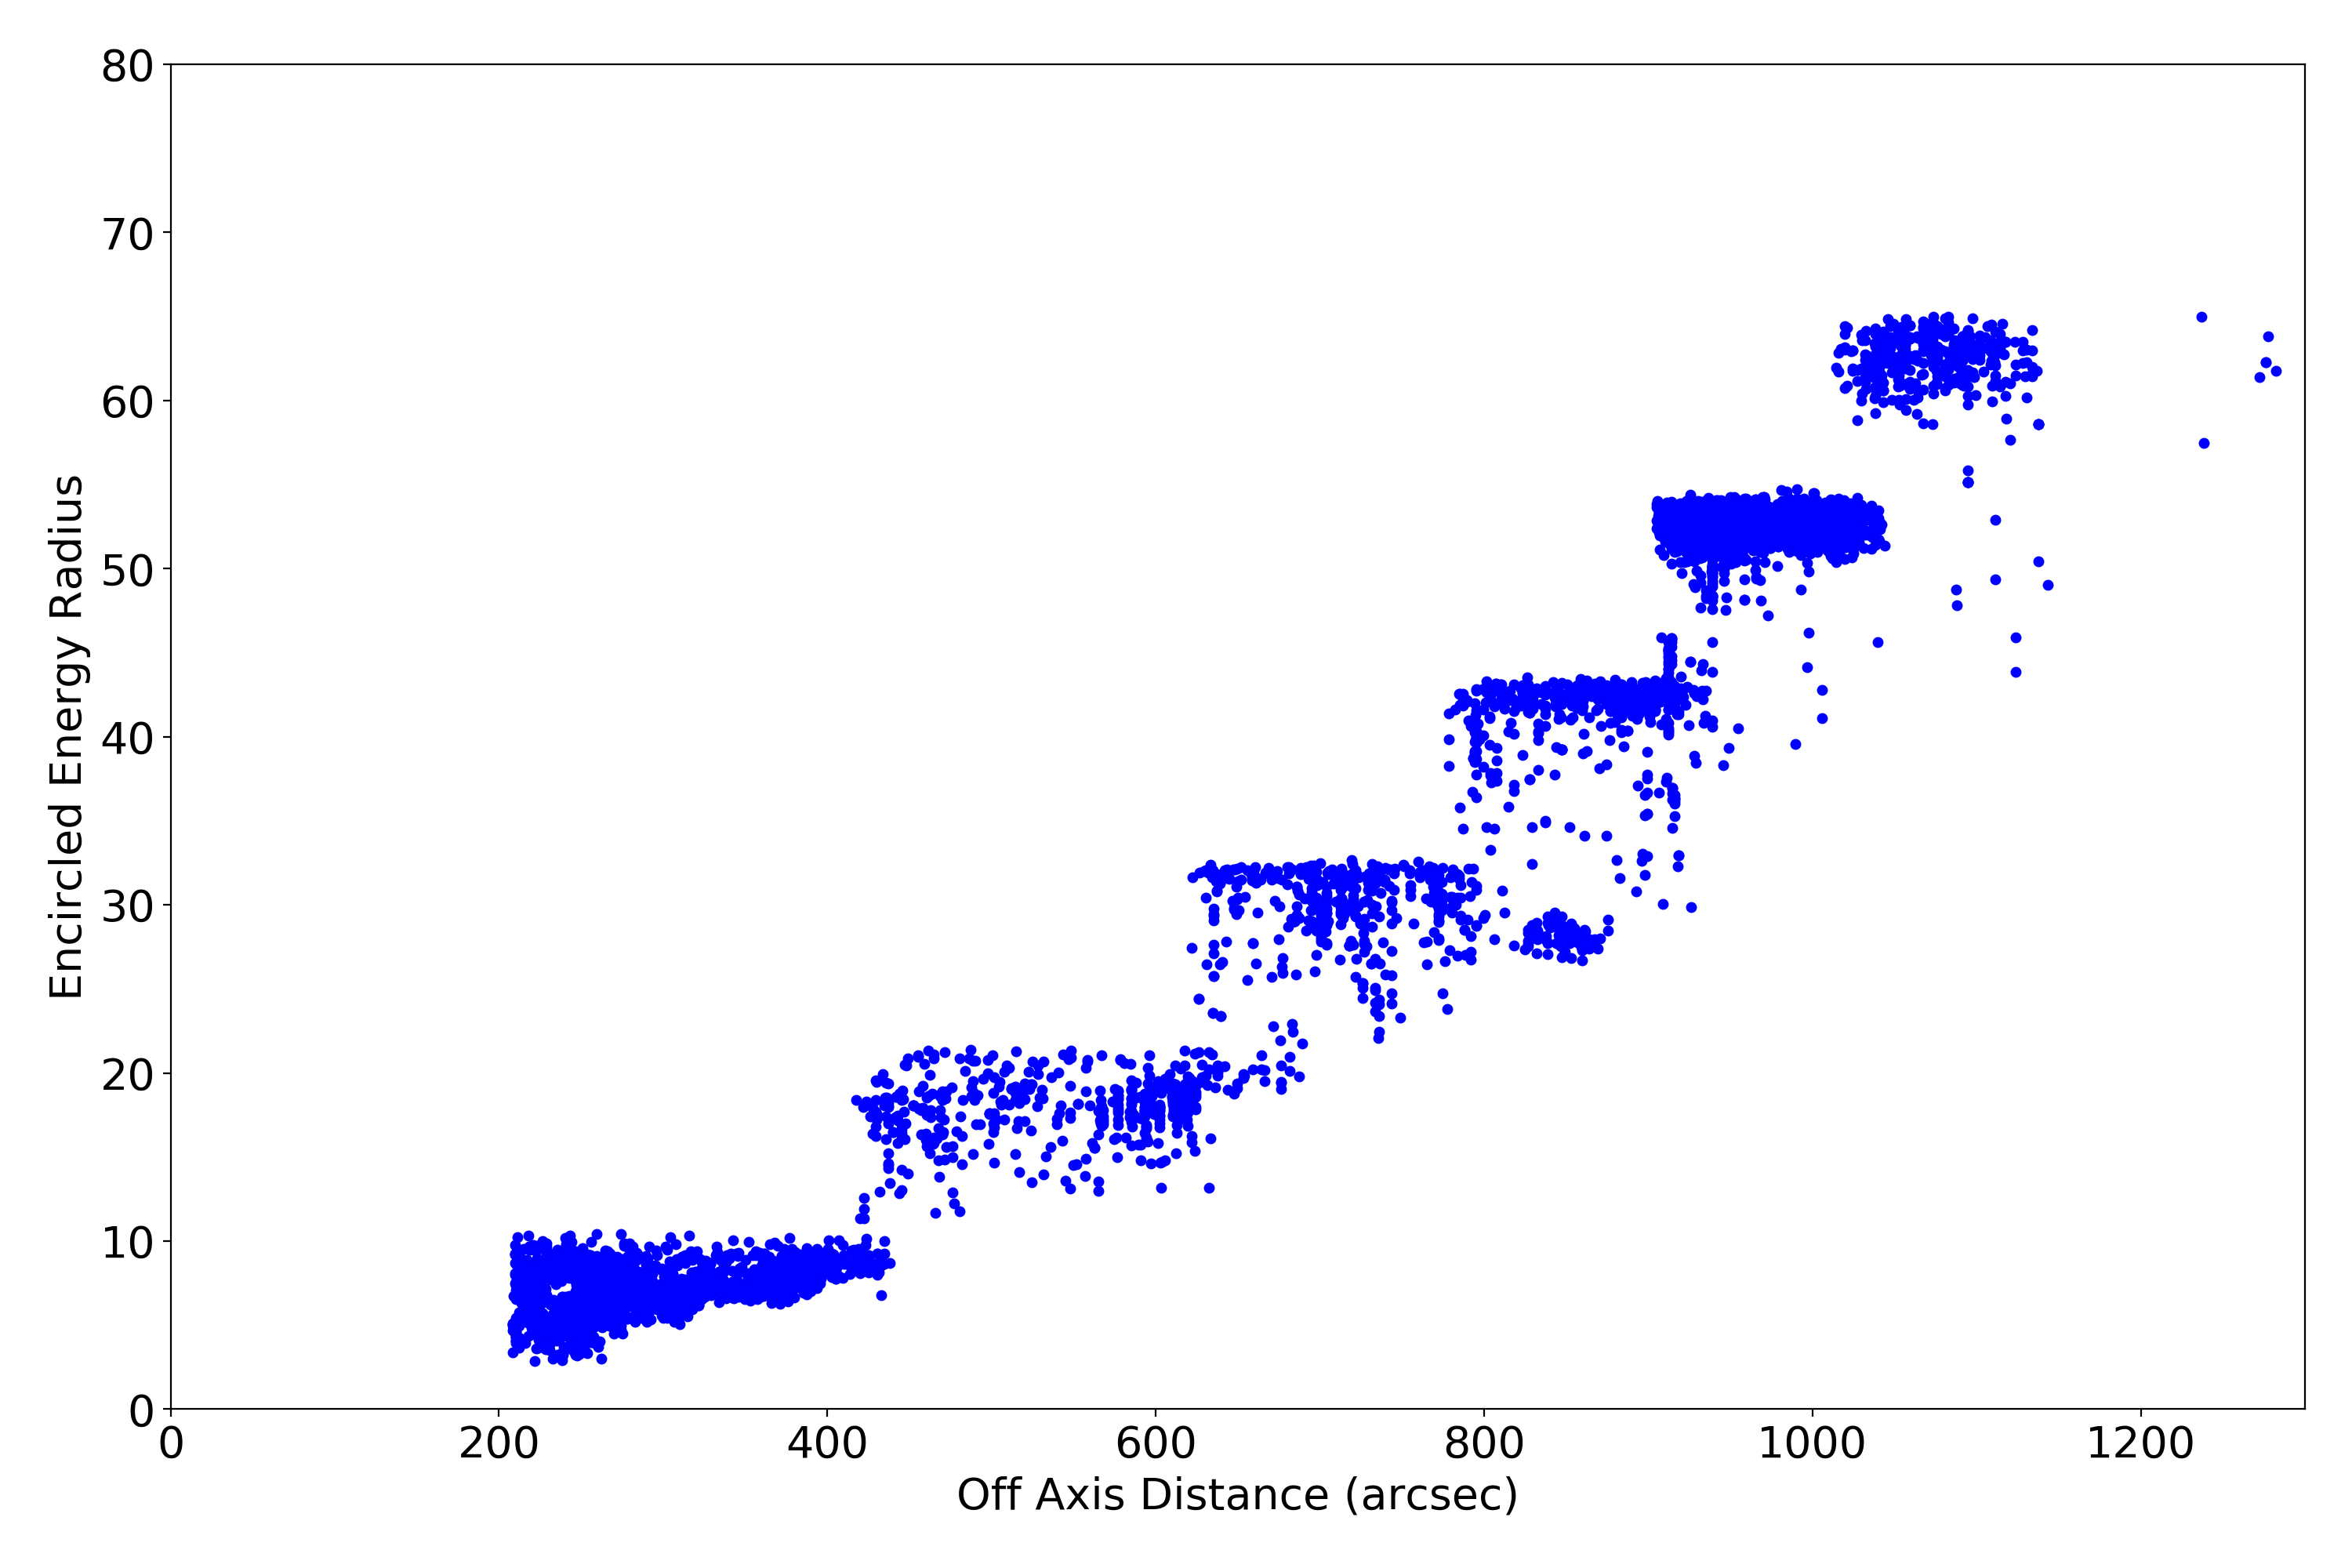
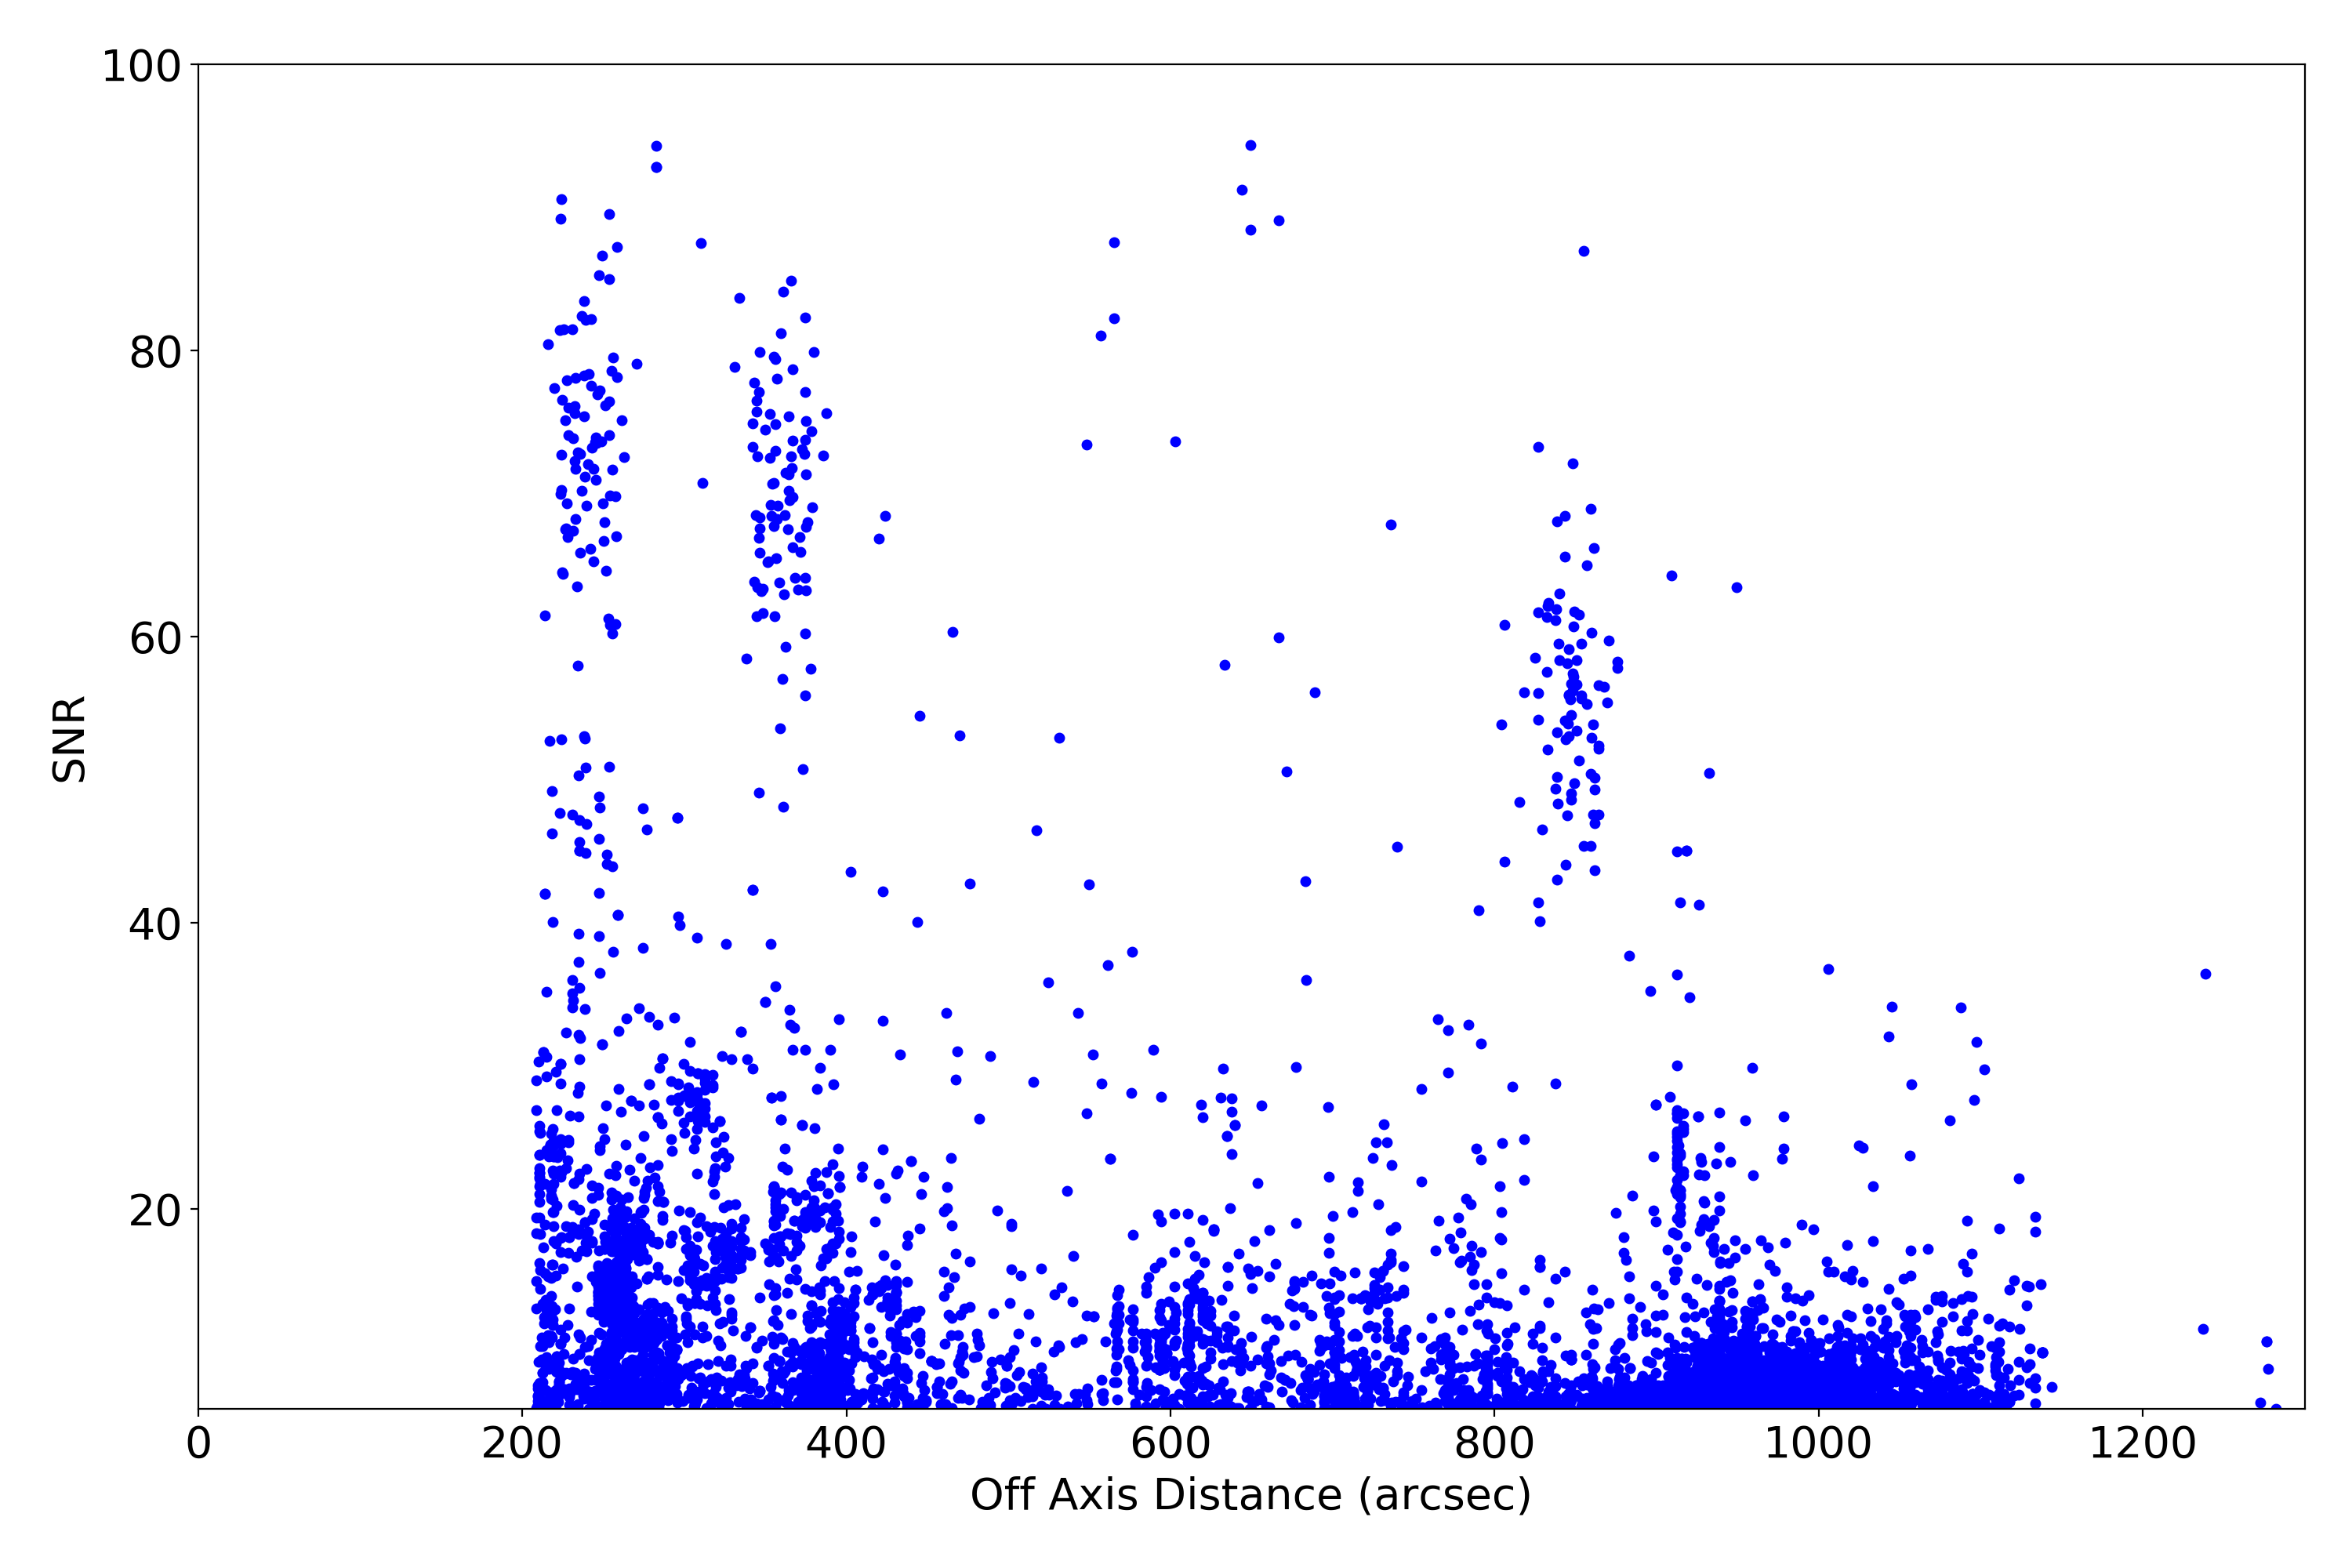
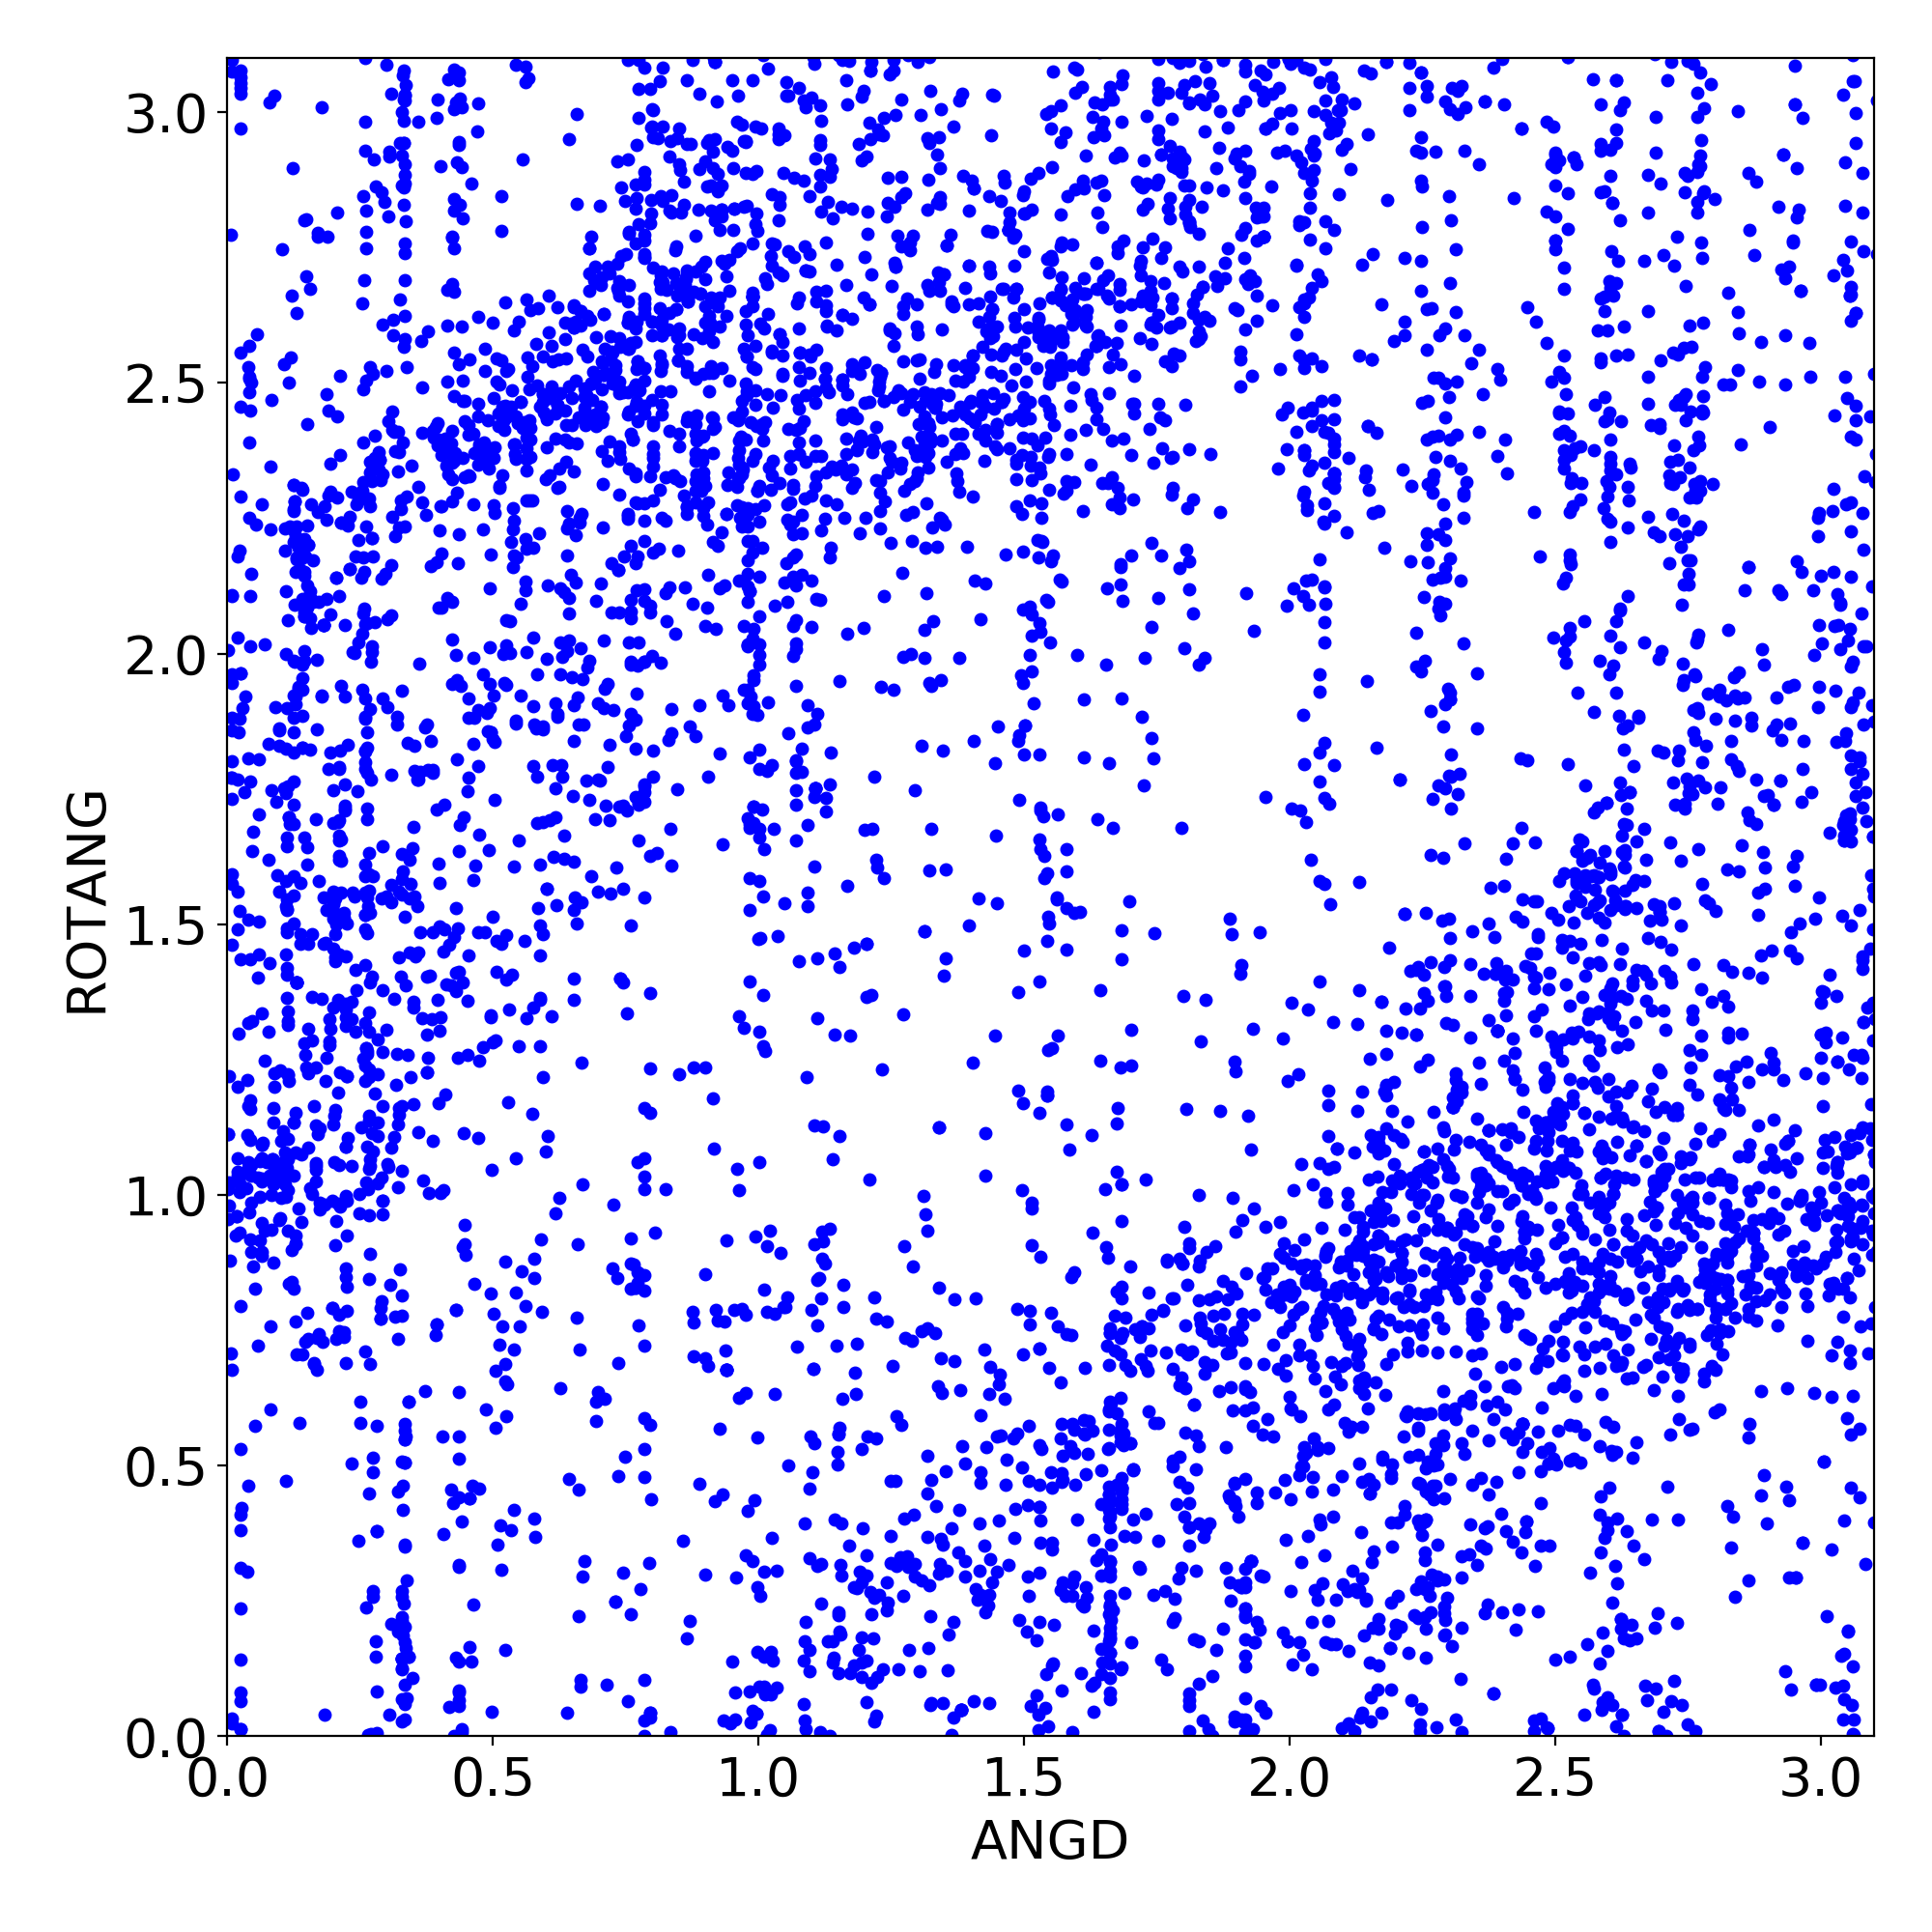
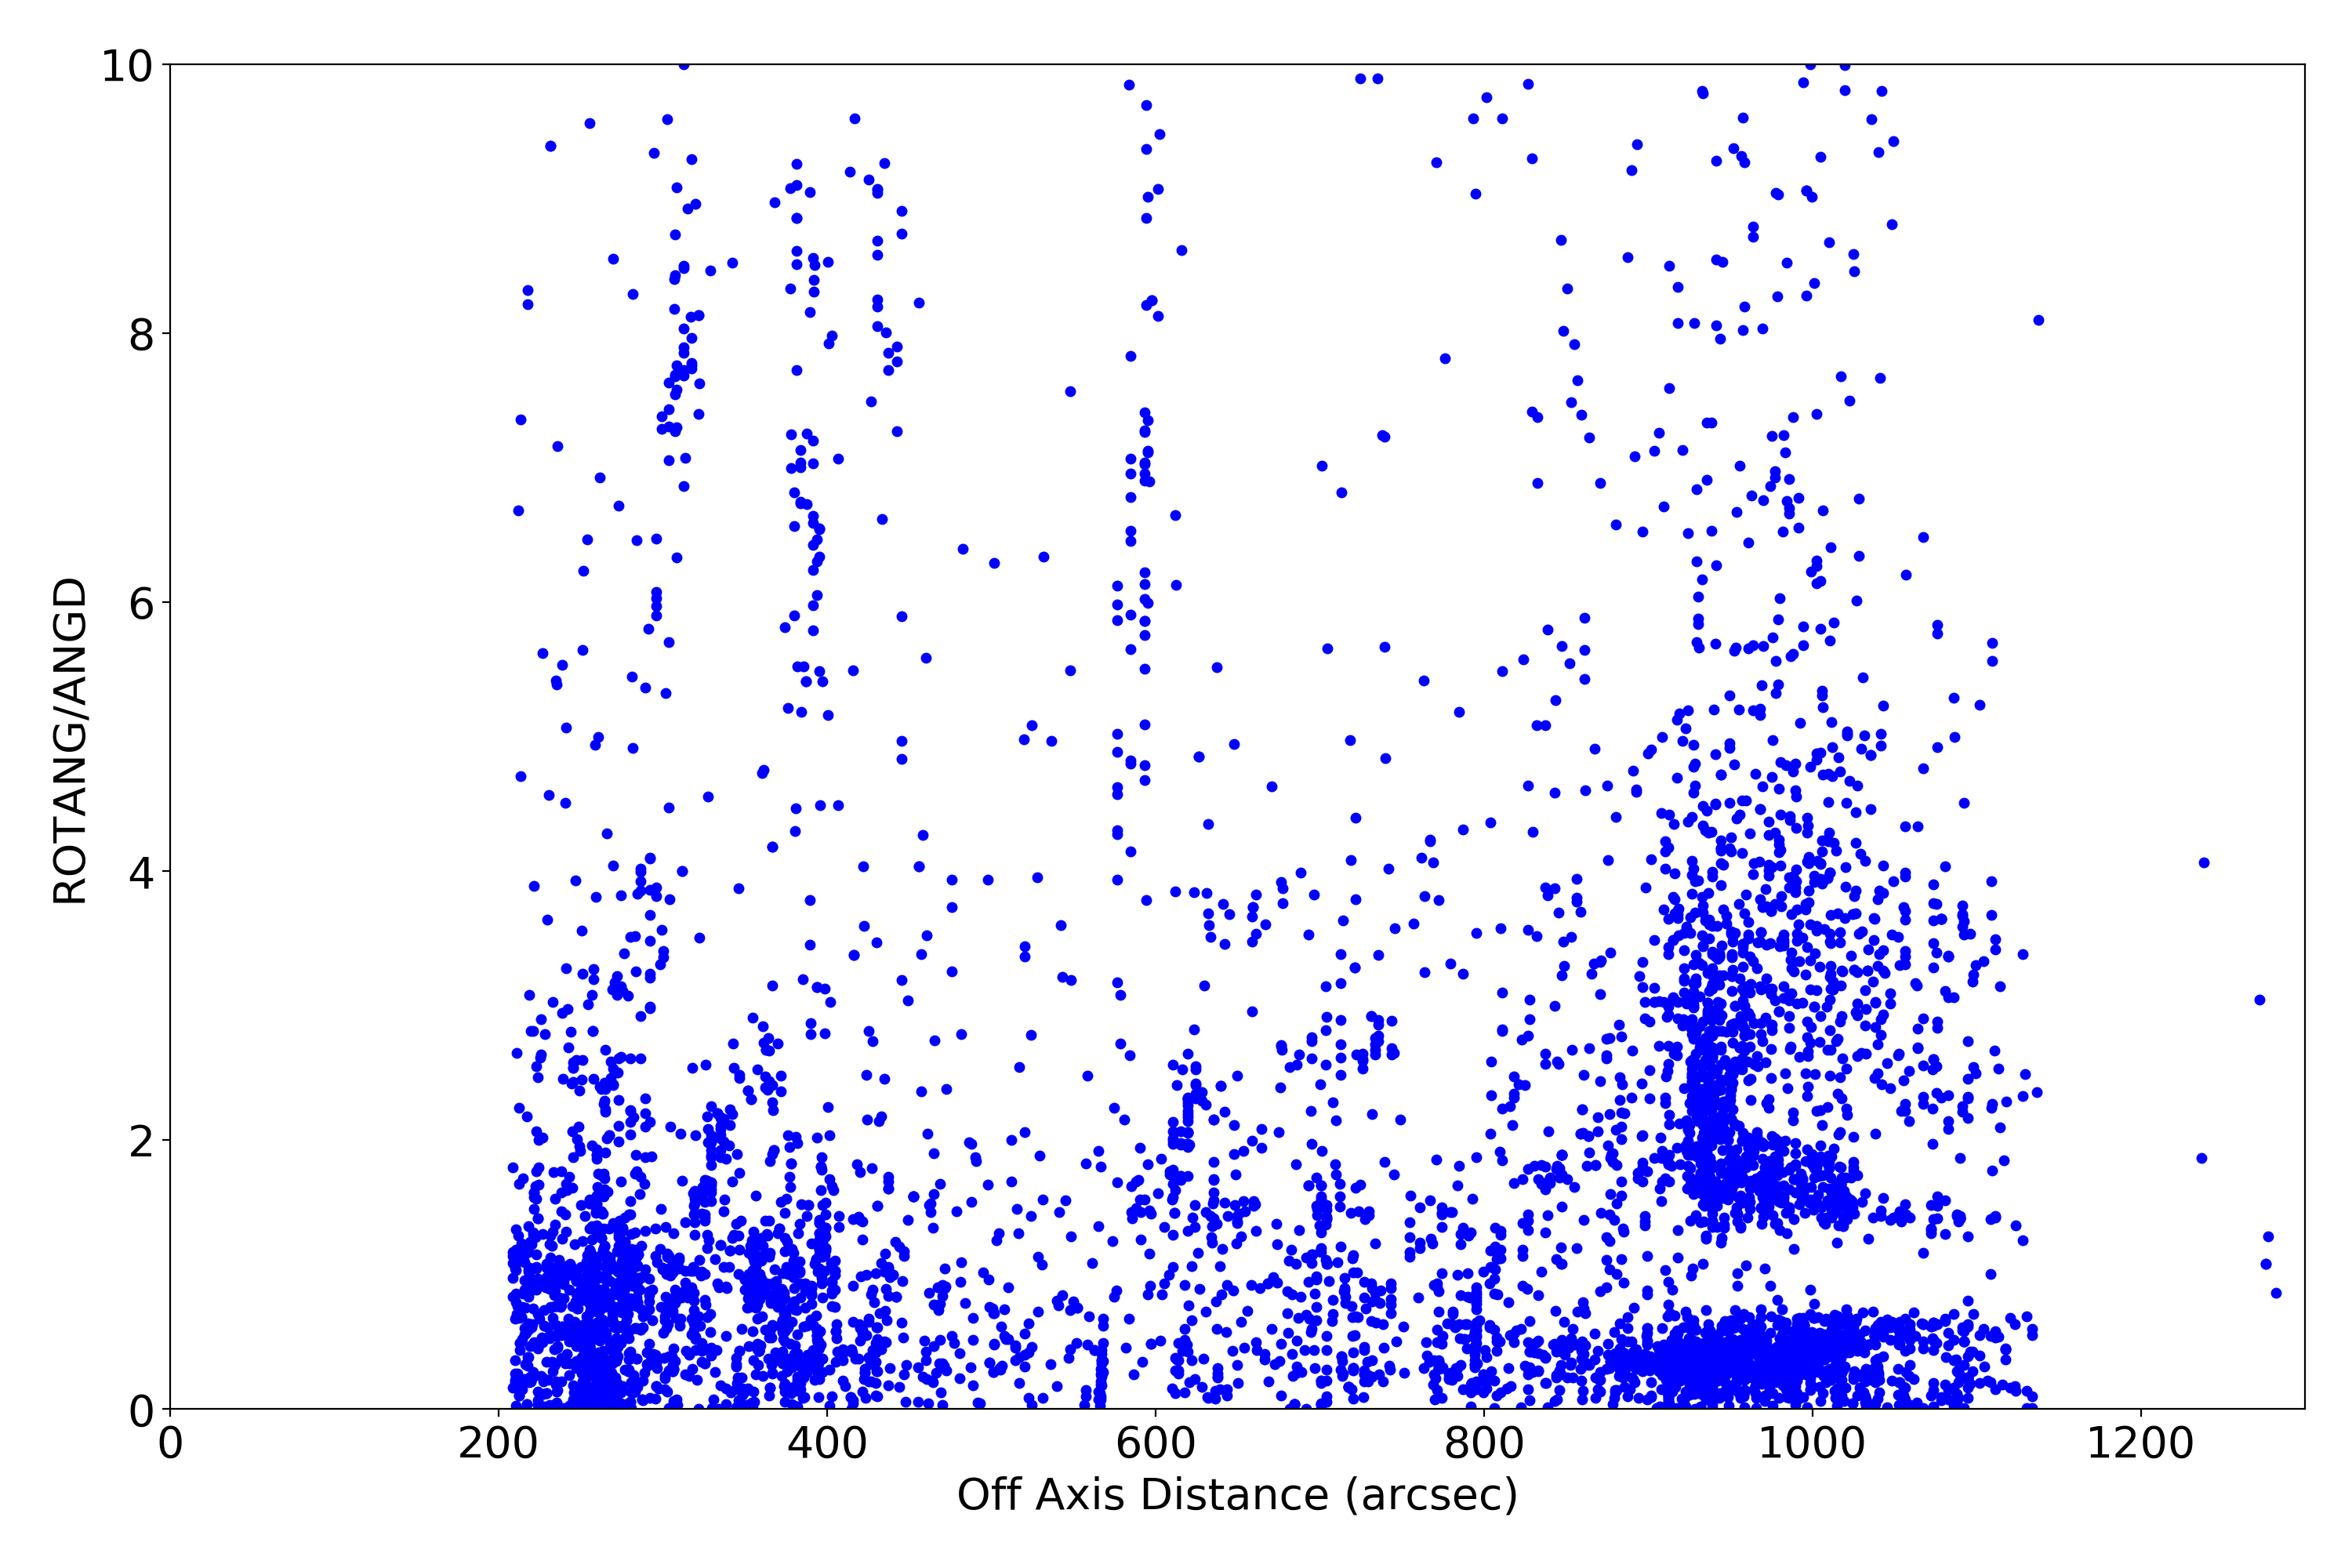
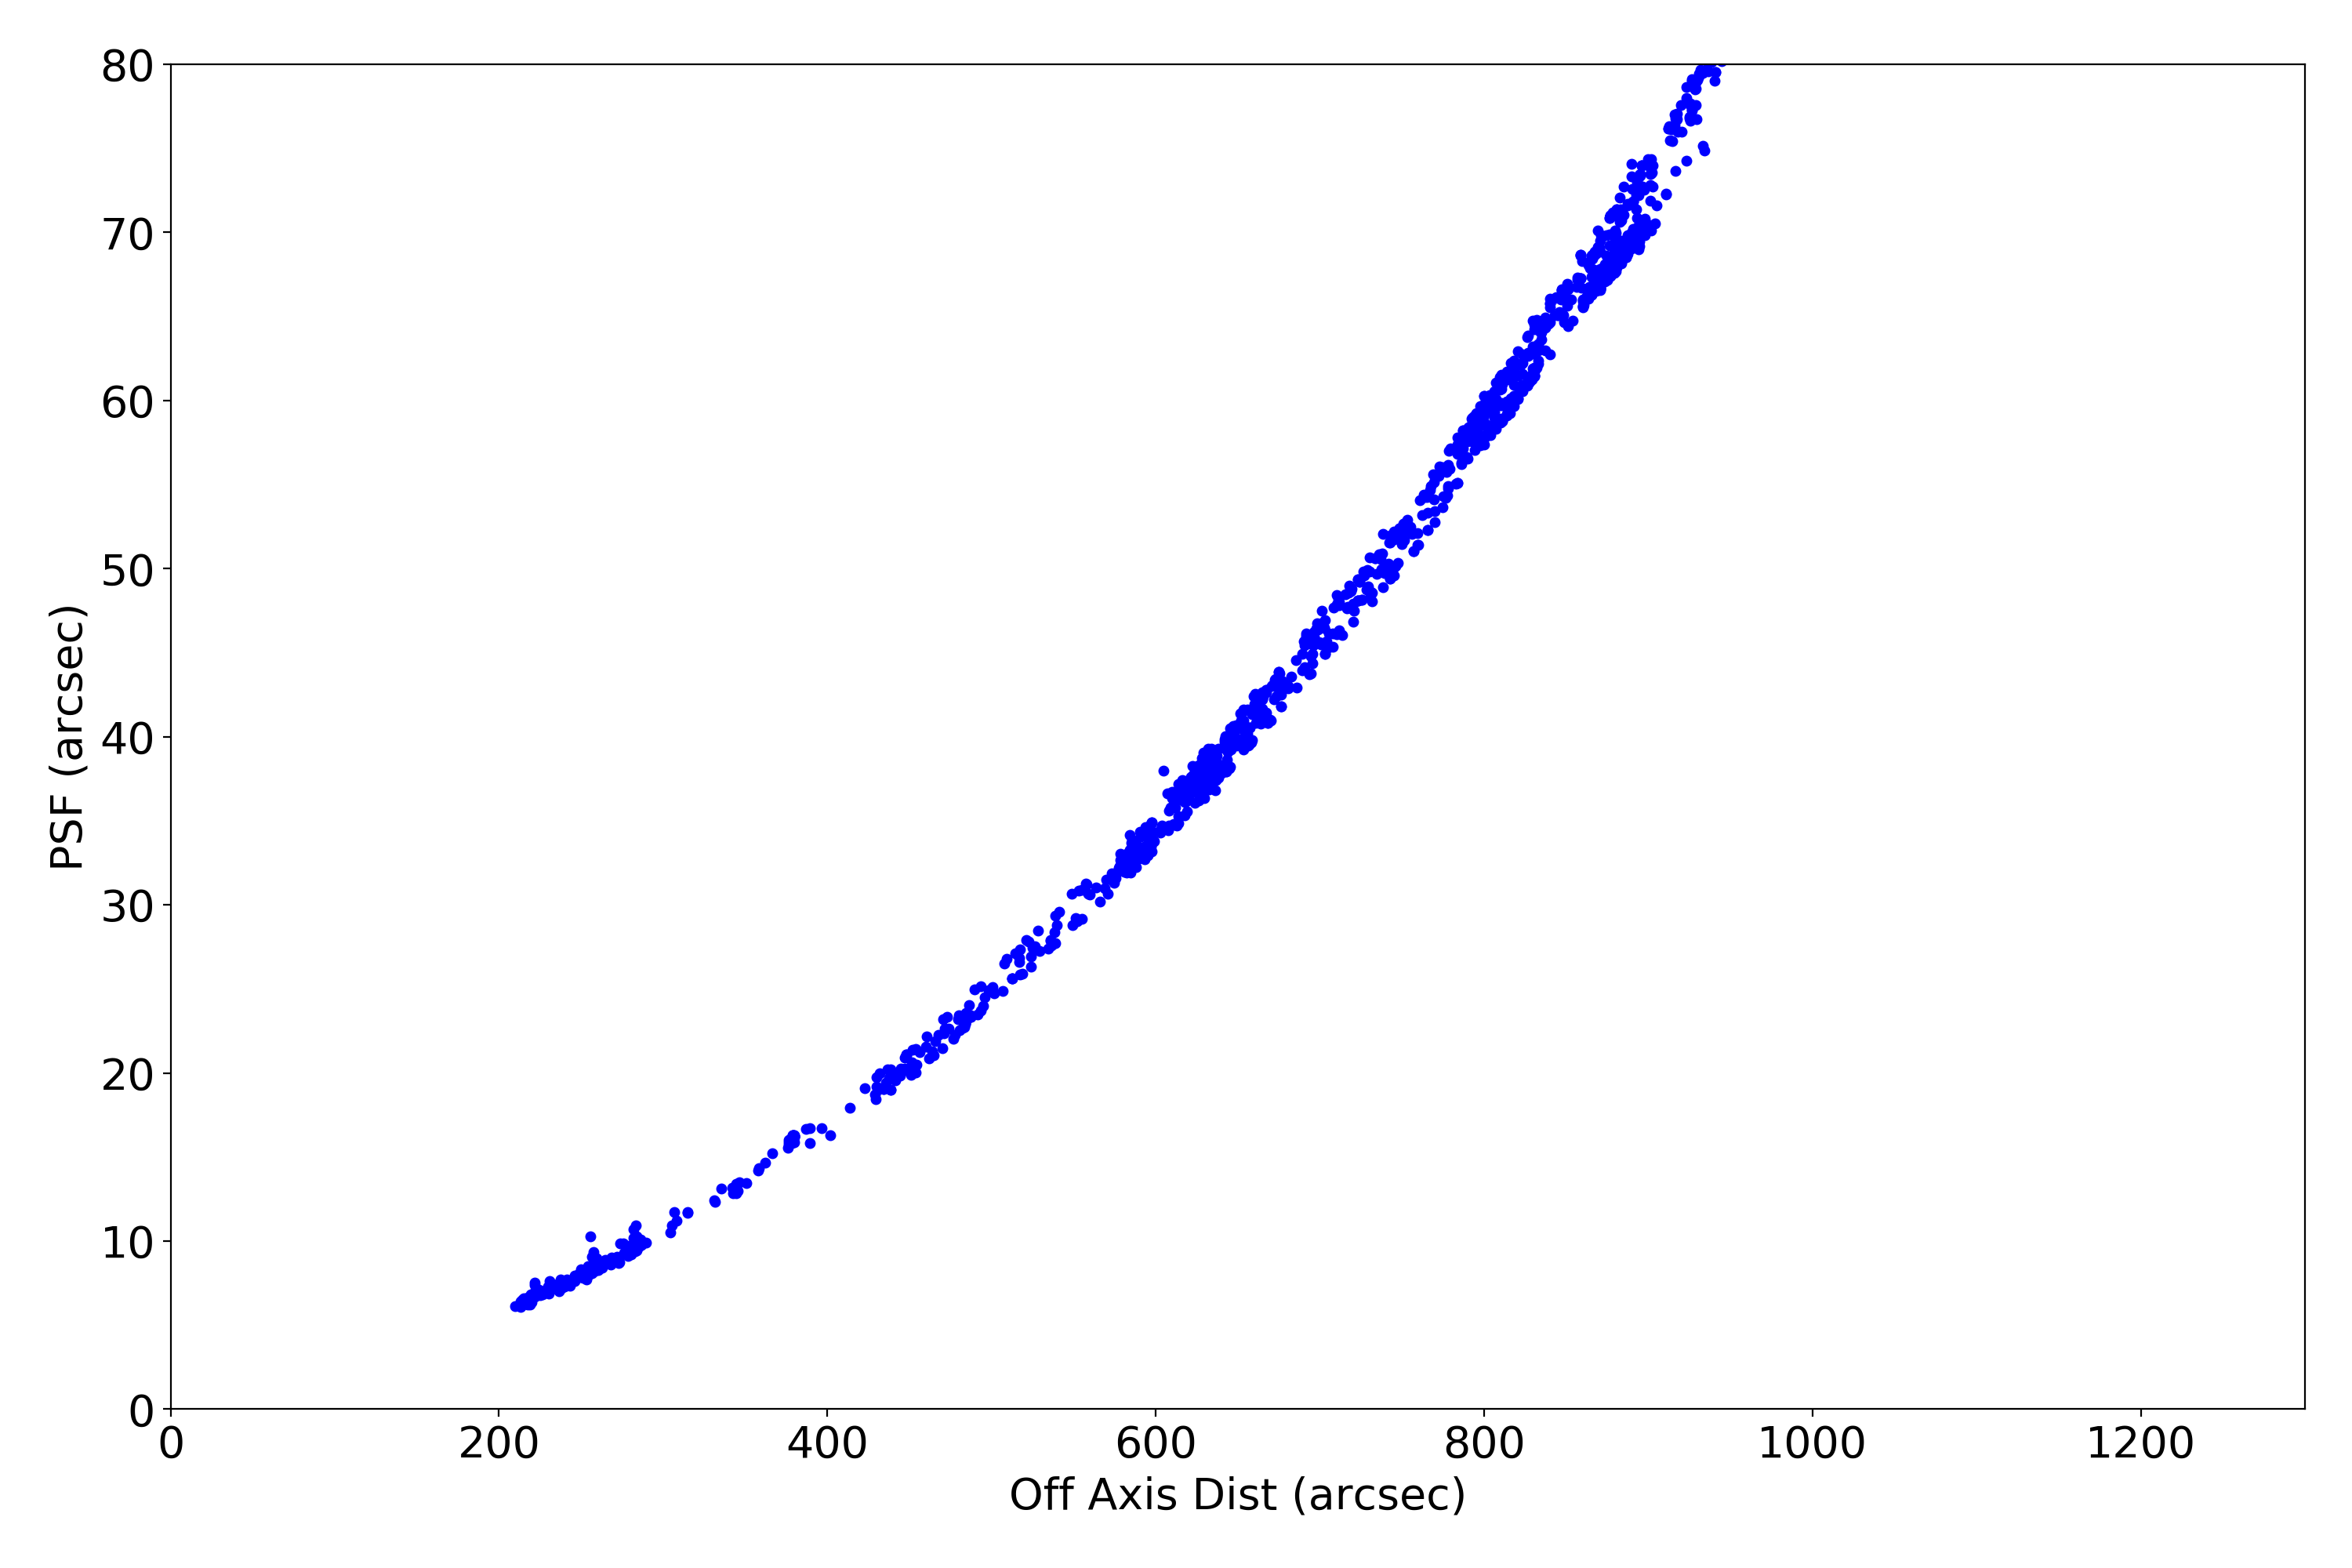
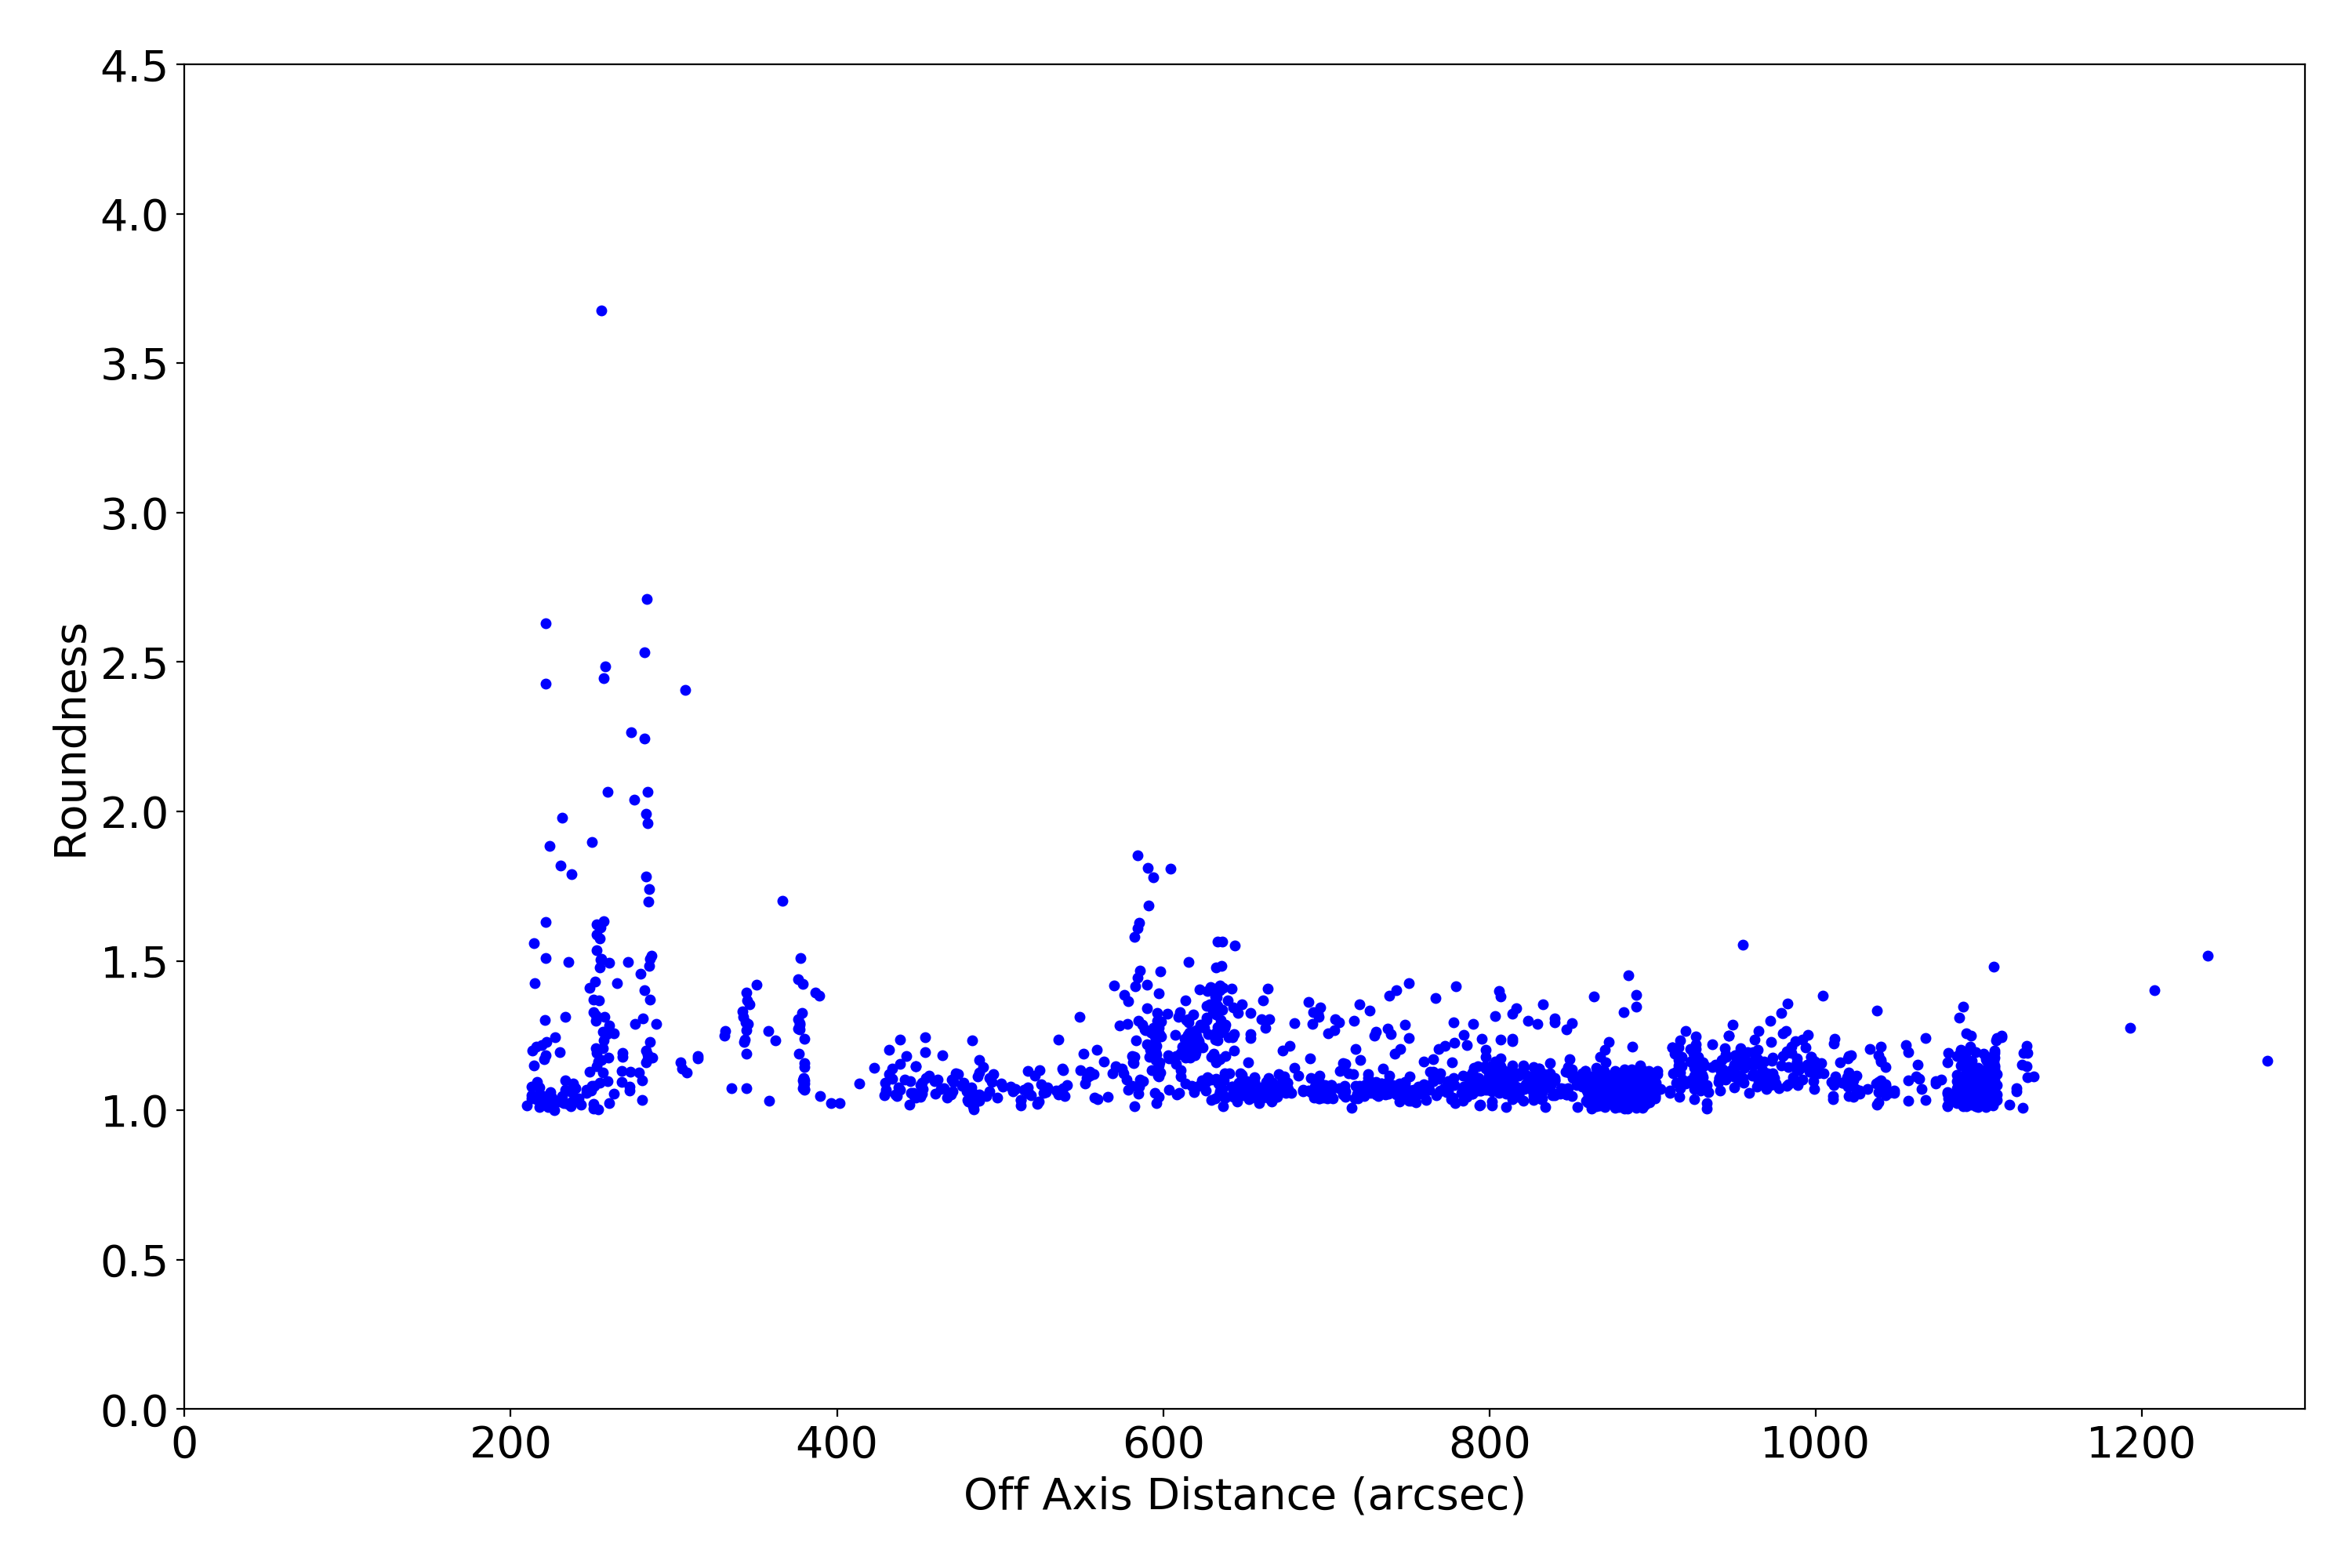
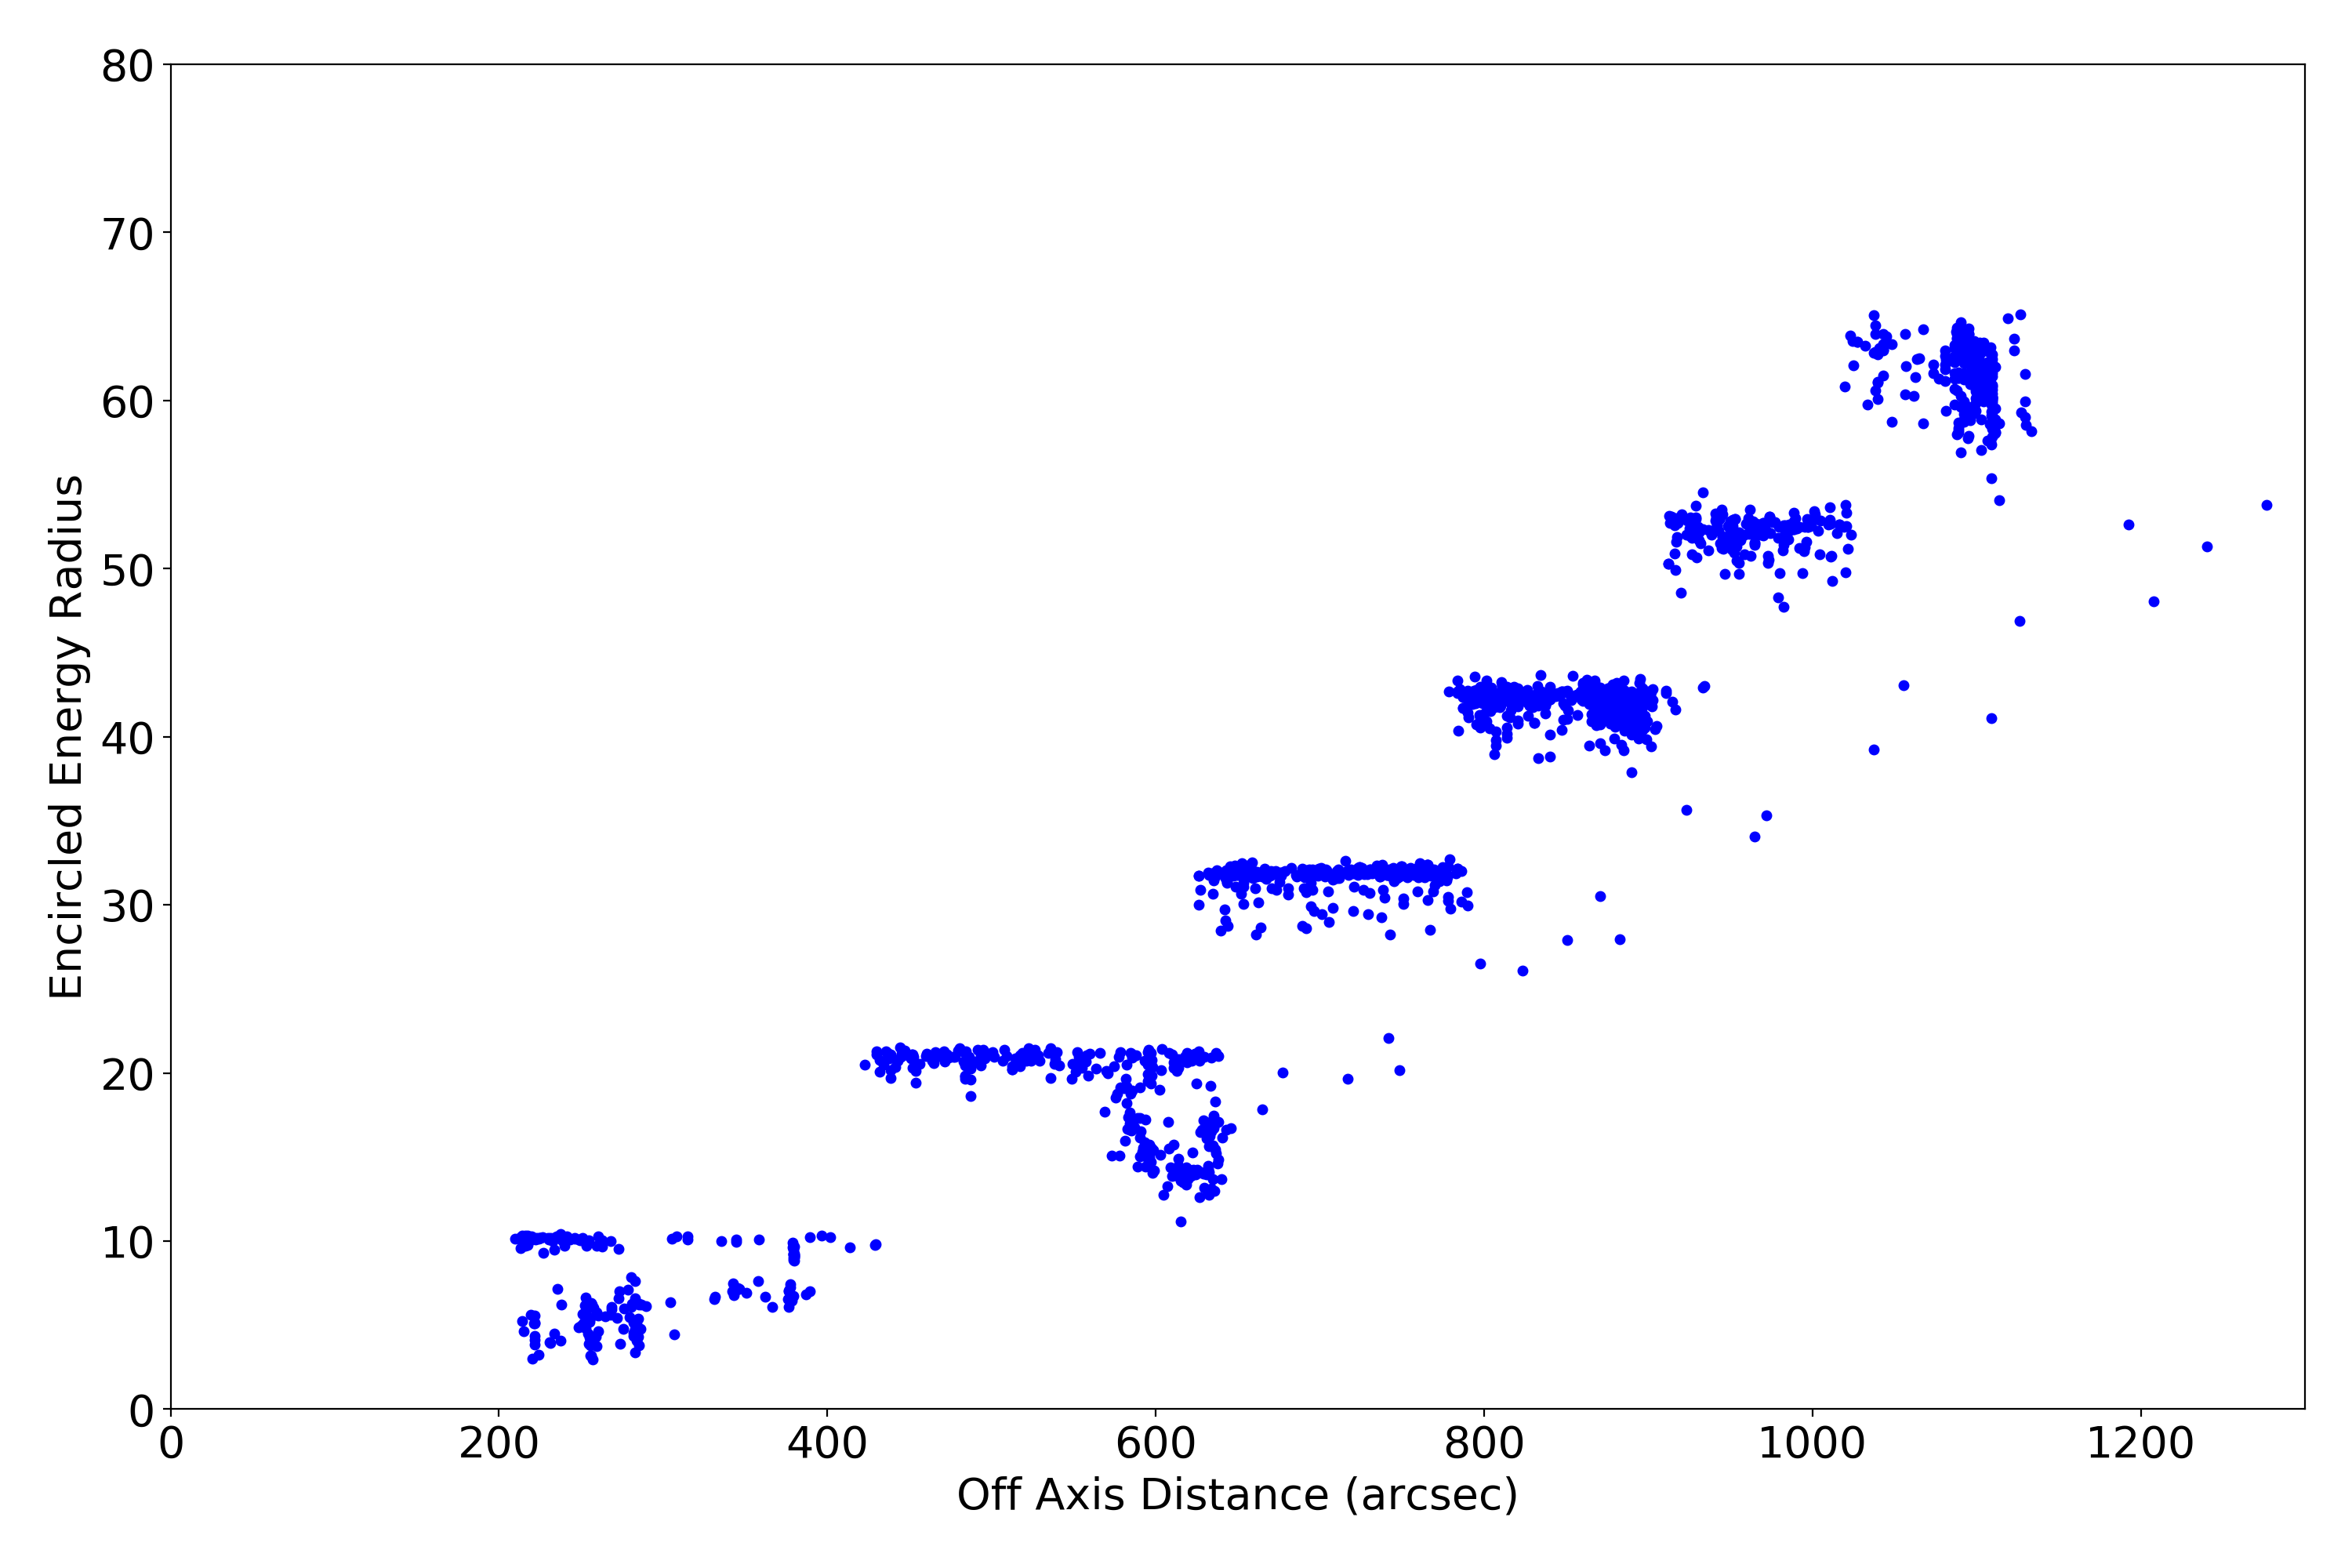
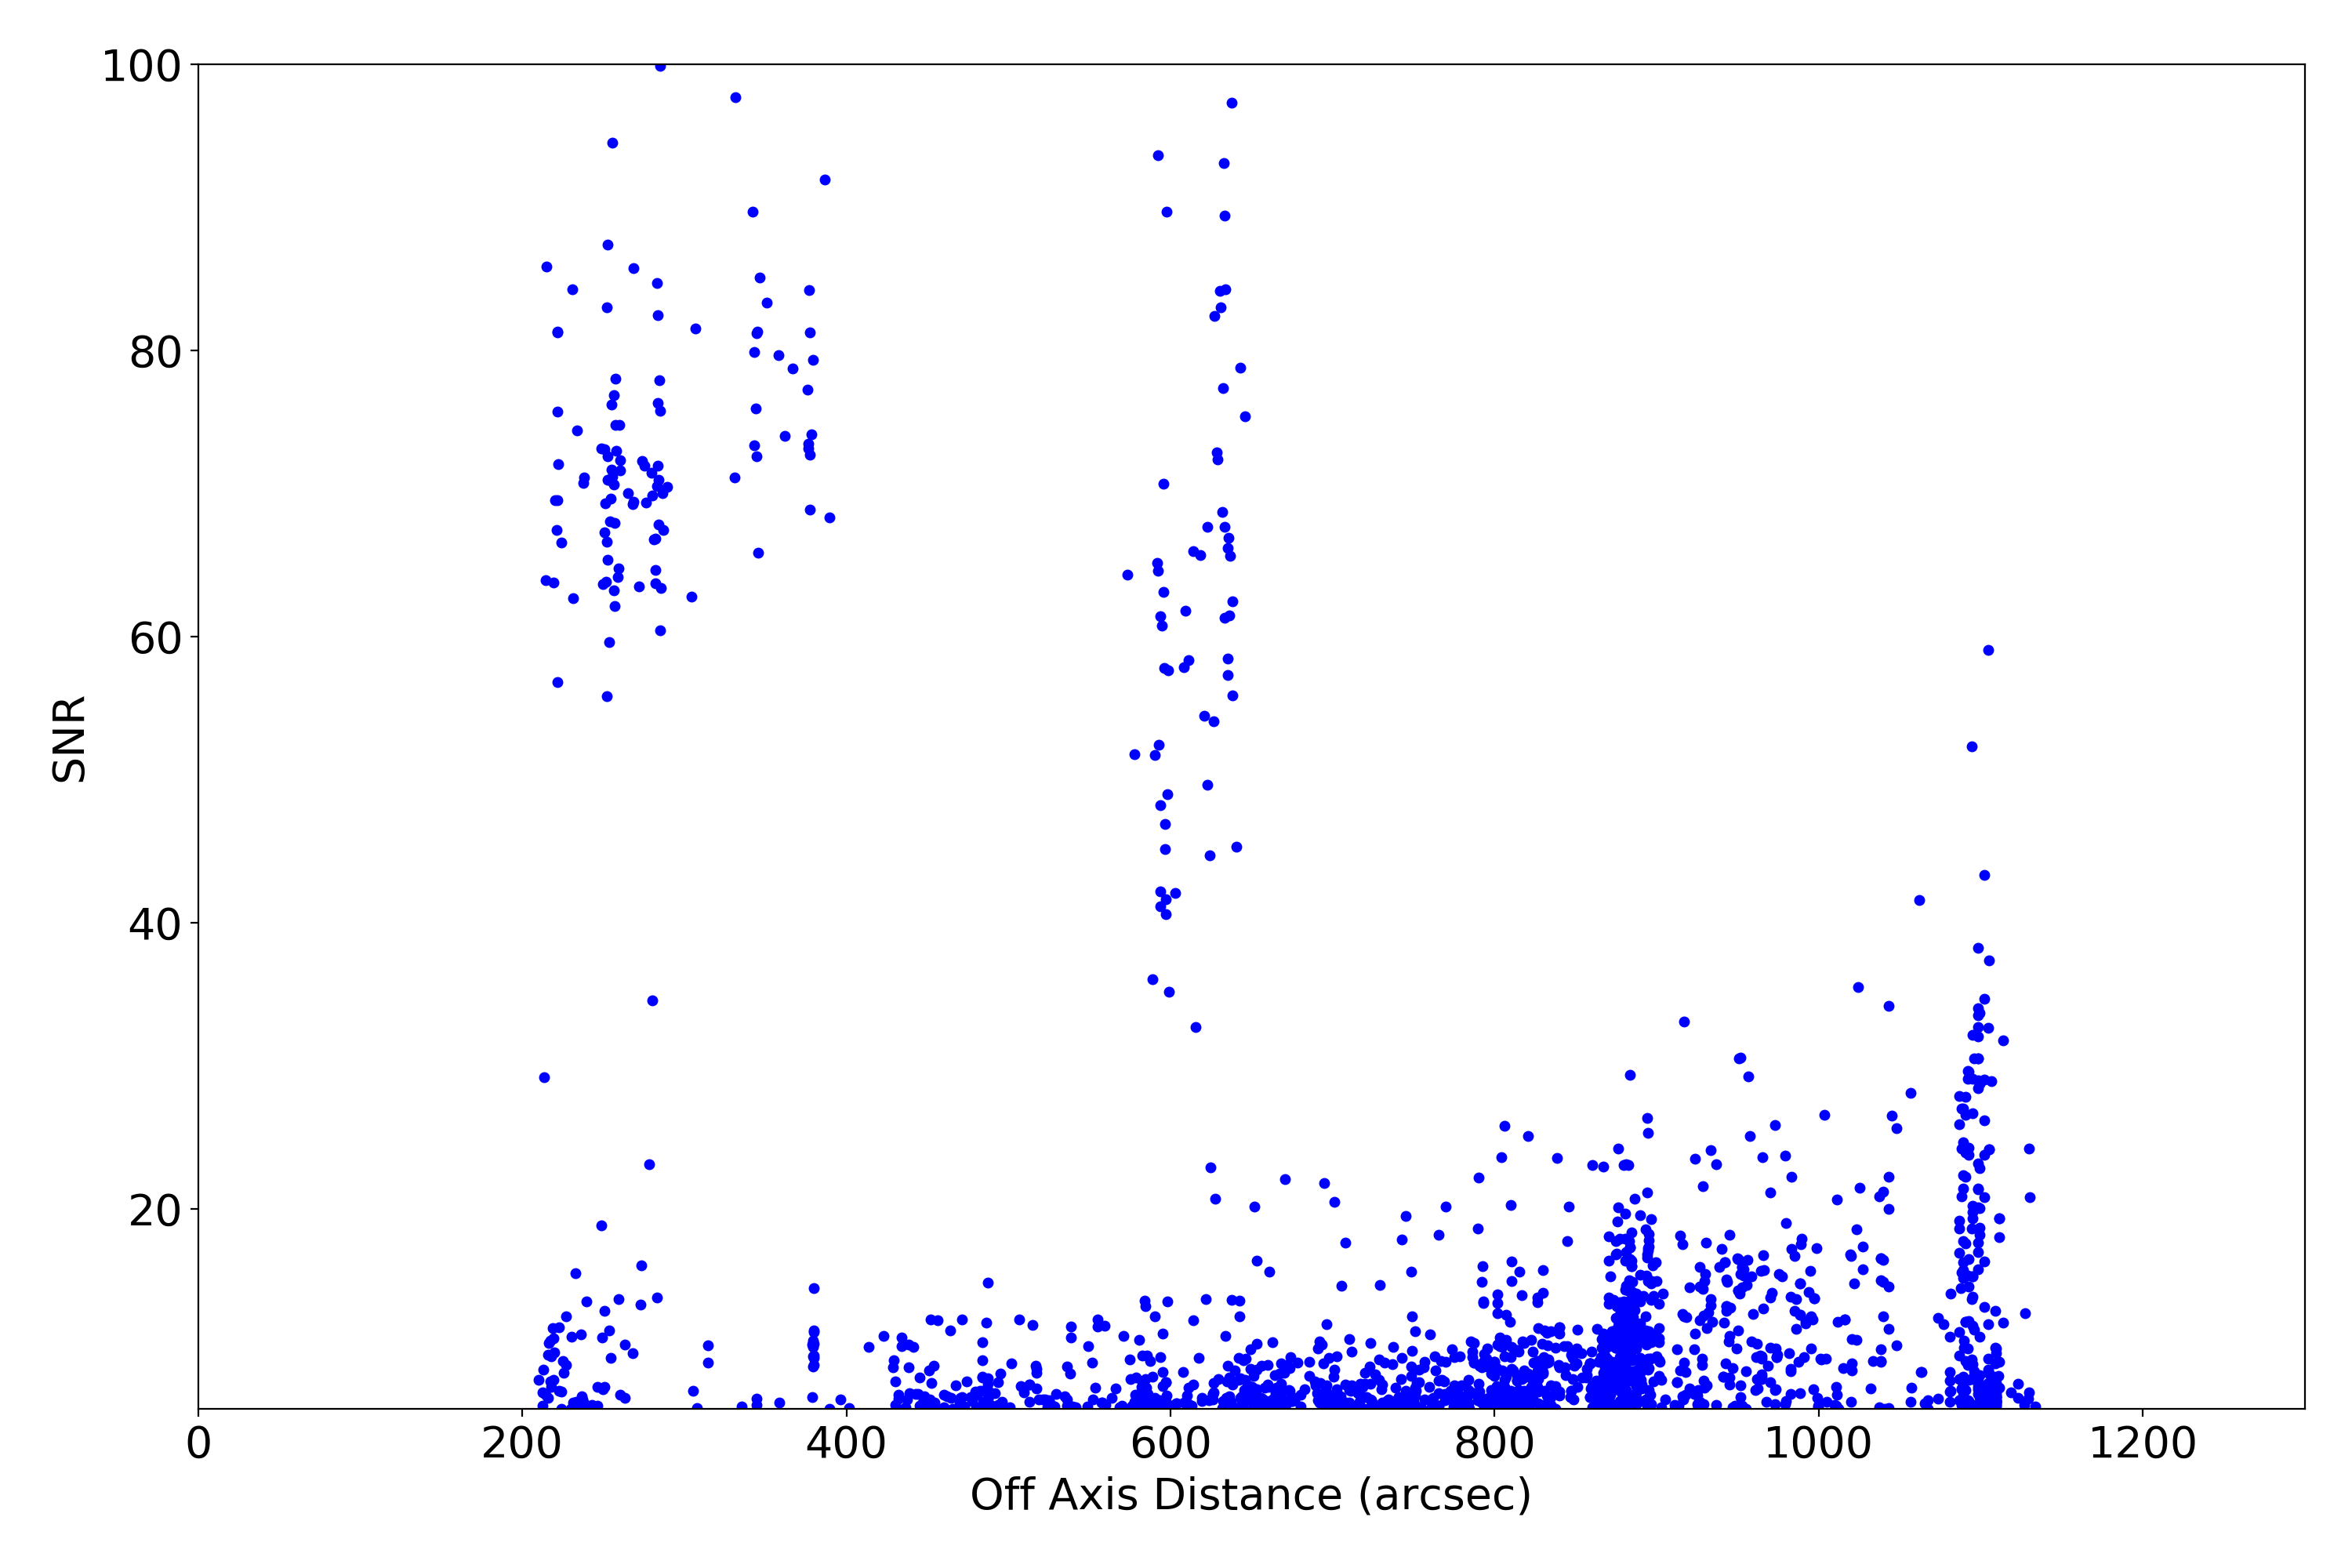
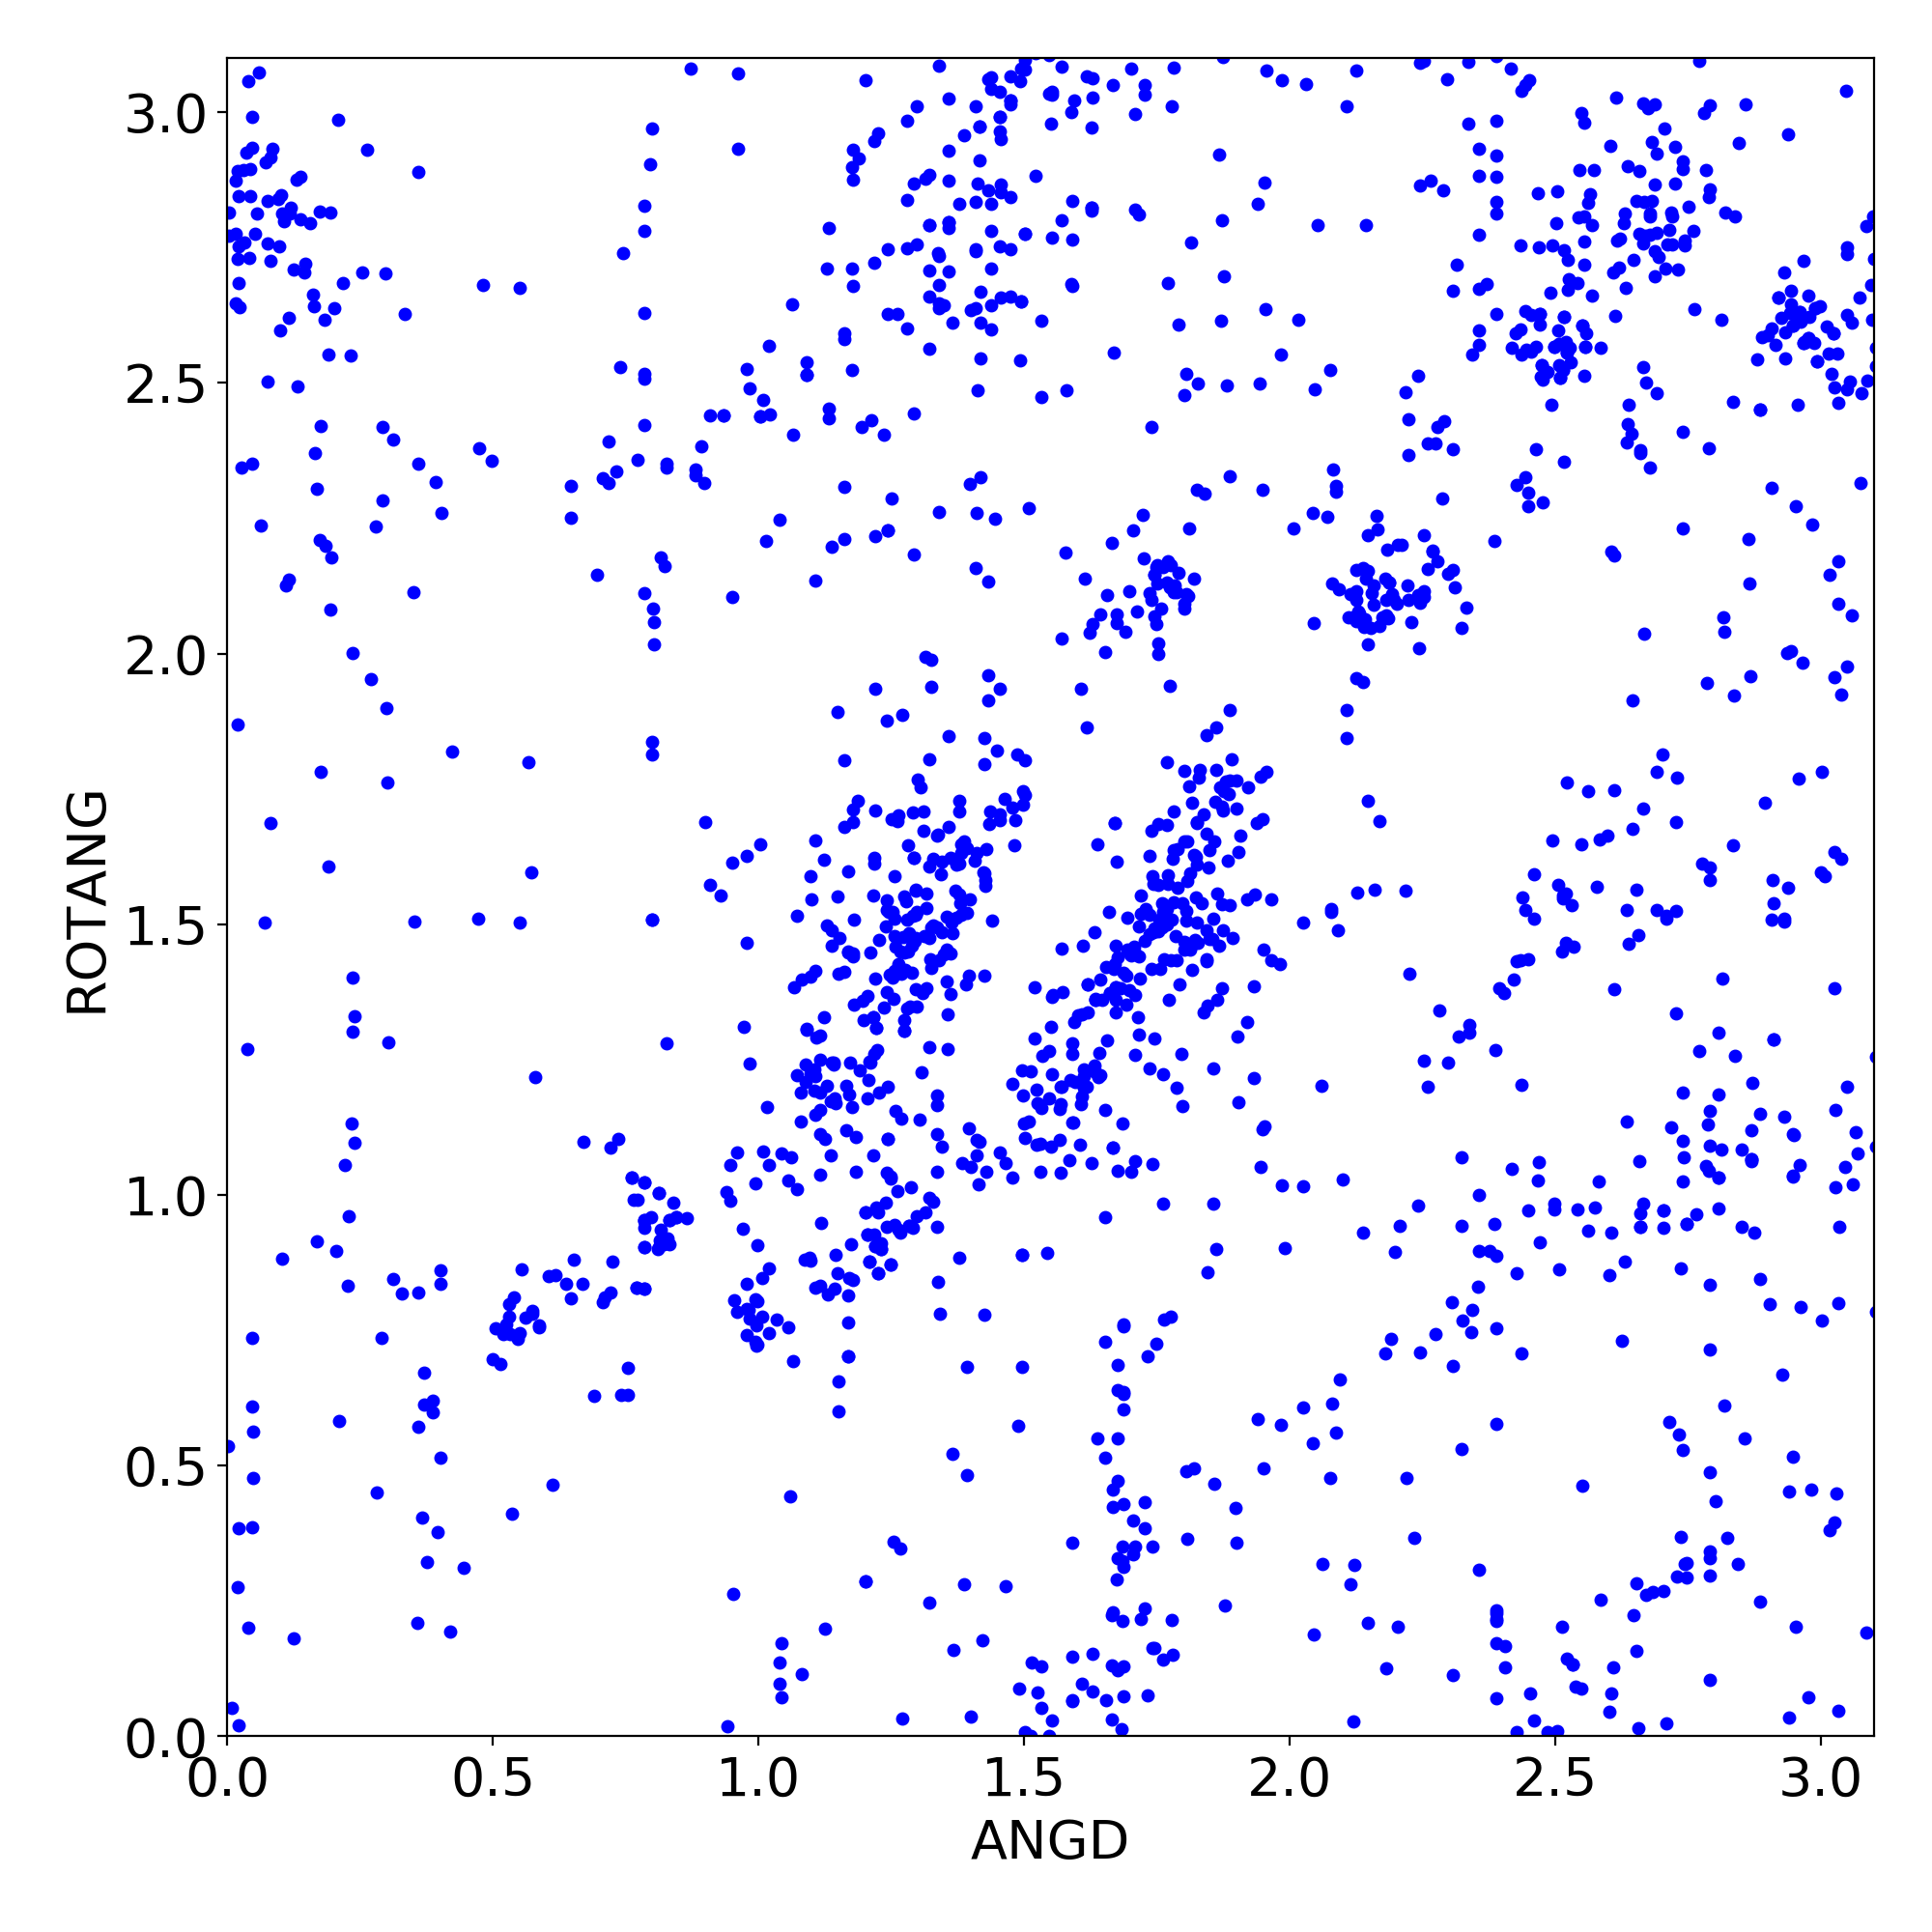
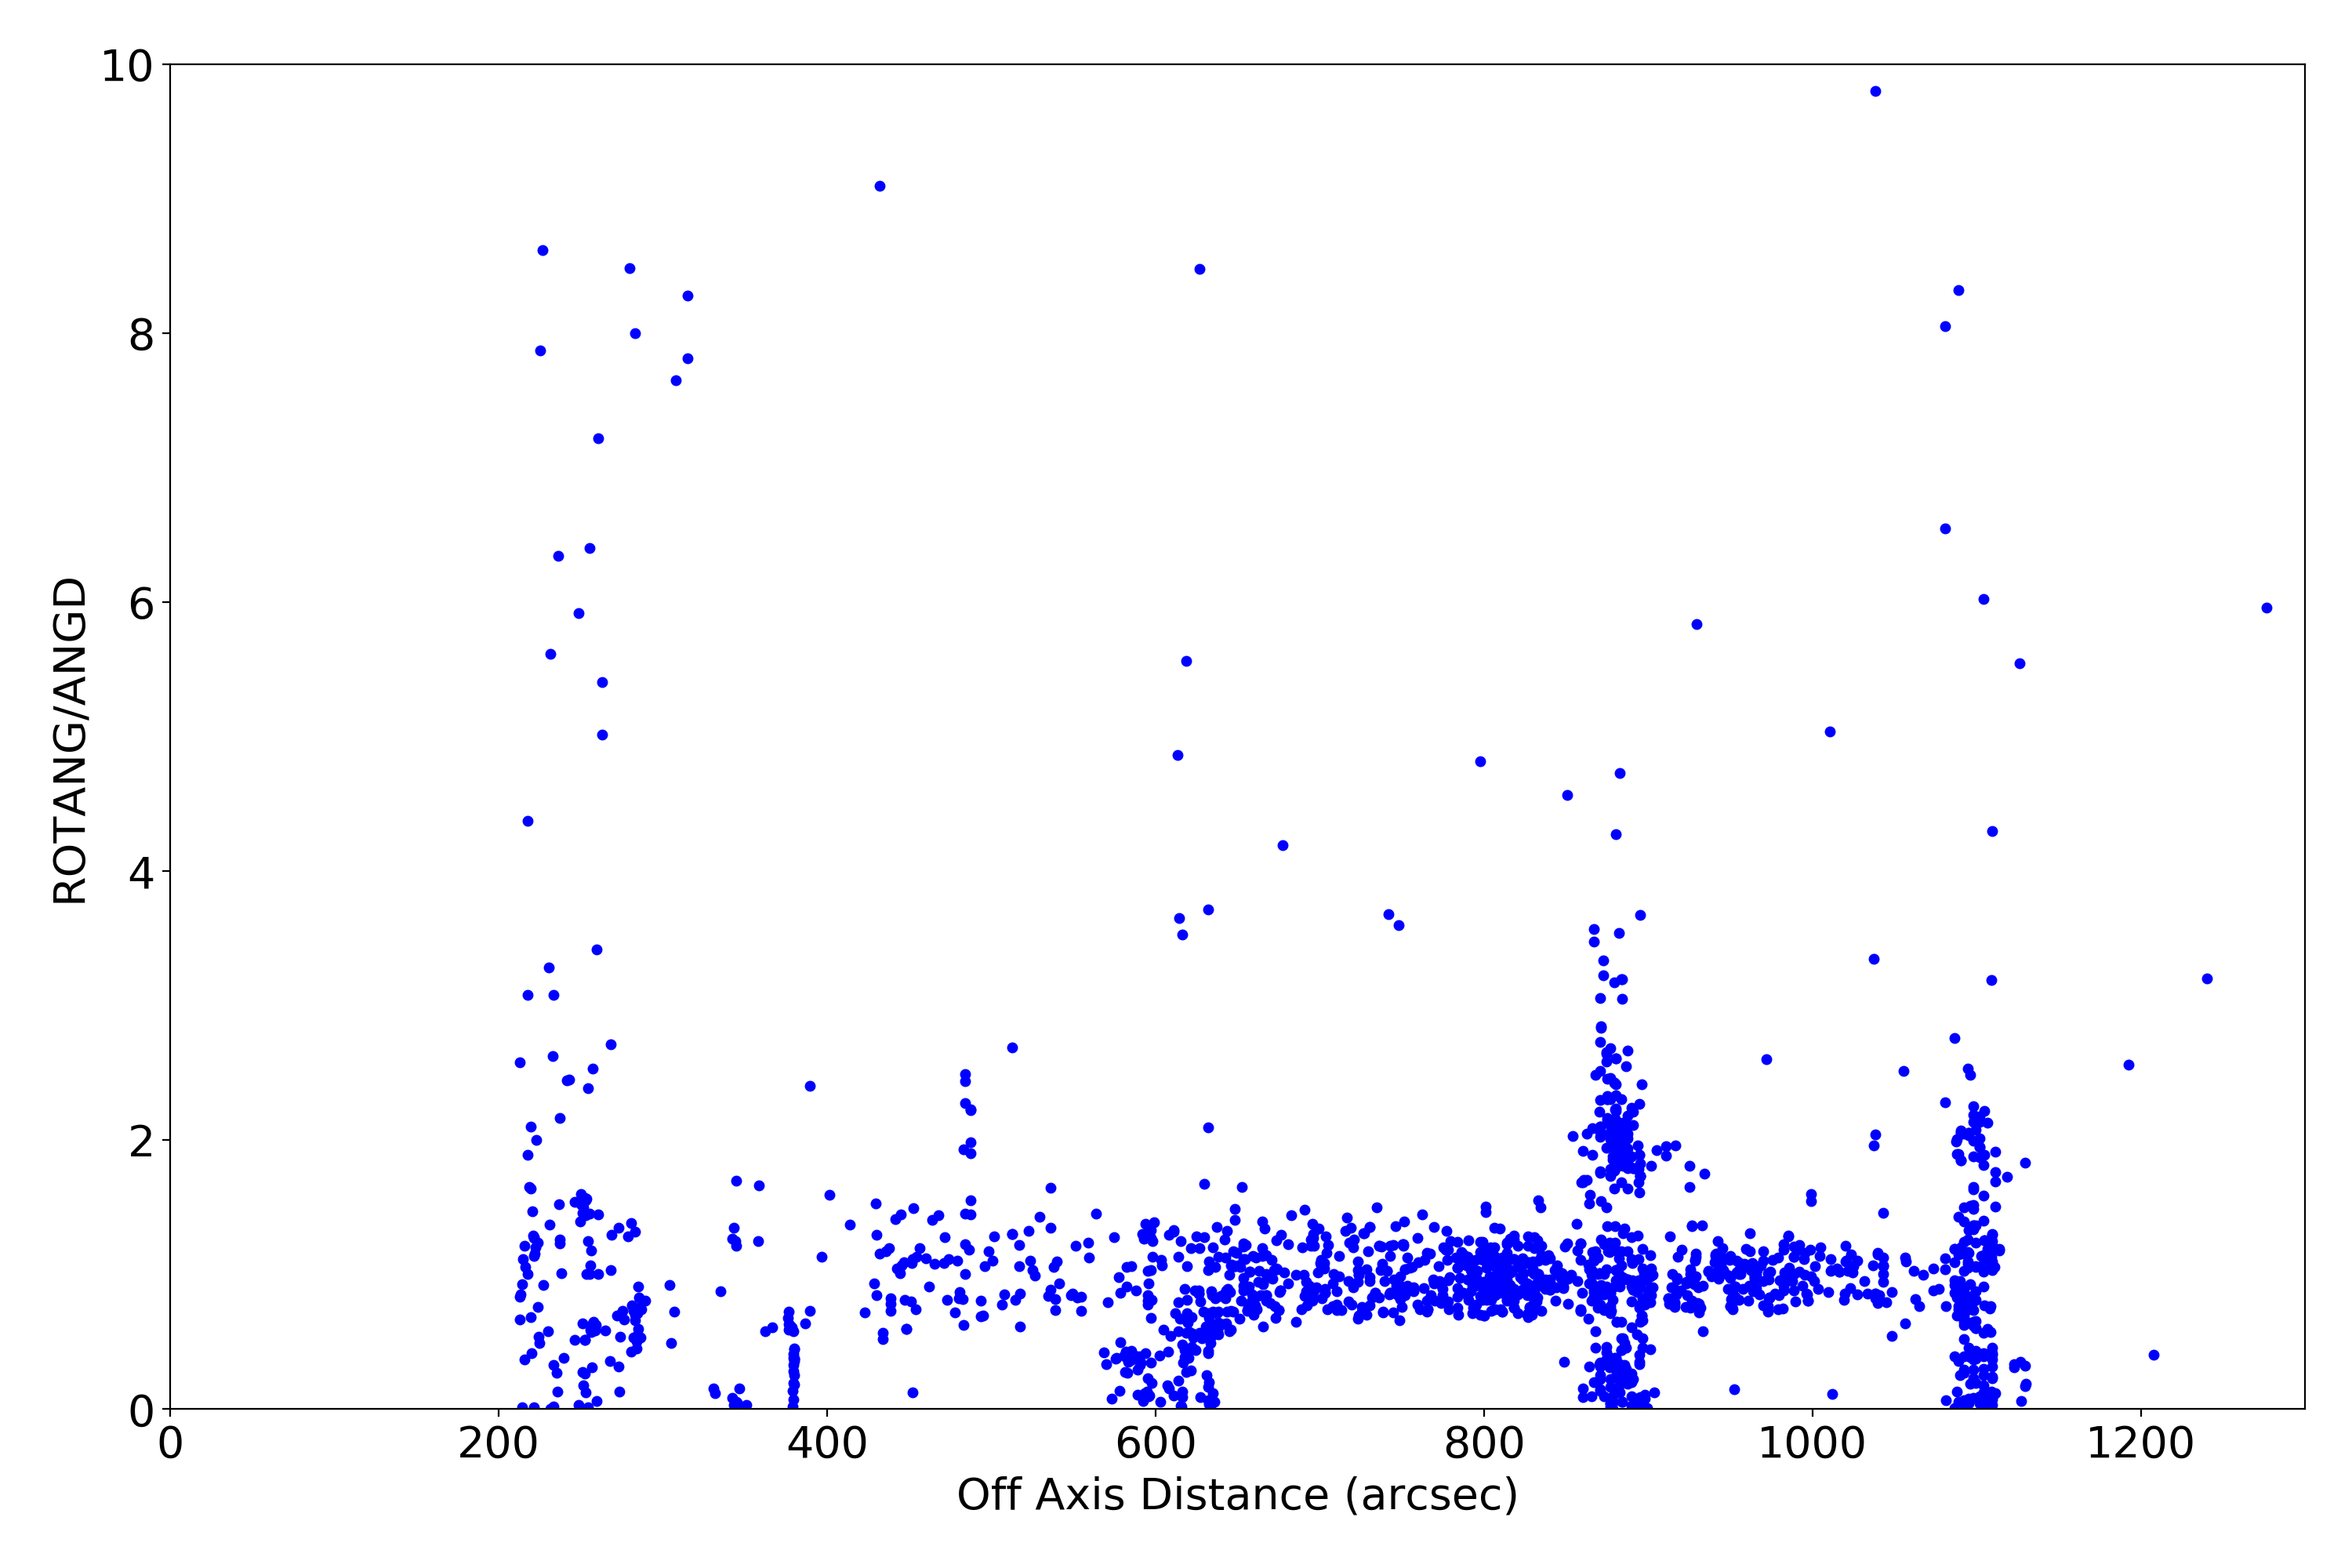
Plots below show various characteristics of detected imaging sources. Standard level 2 data products (*src2.fits) are used. Only observations with focus (sim_x) within 0.01 mm of nominal value for given SI configuration are used. Sources are also filtered for strength (SNR > 15).
| XY | PSF | Roundness | EE Radius | SNR | Rotation | Rotation2 | |
|---|---|---|---|---|---|---|---|
| ACIS I | 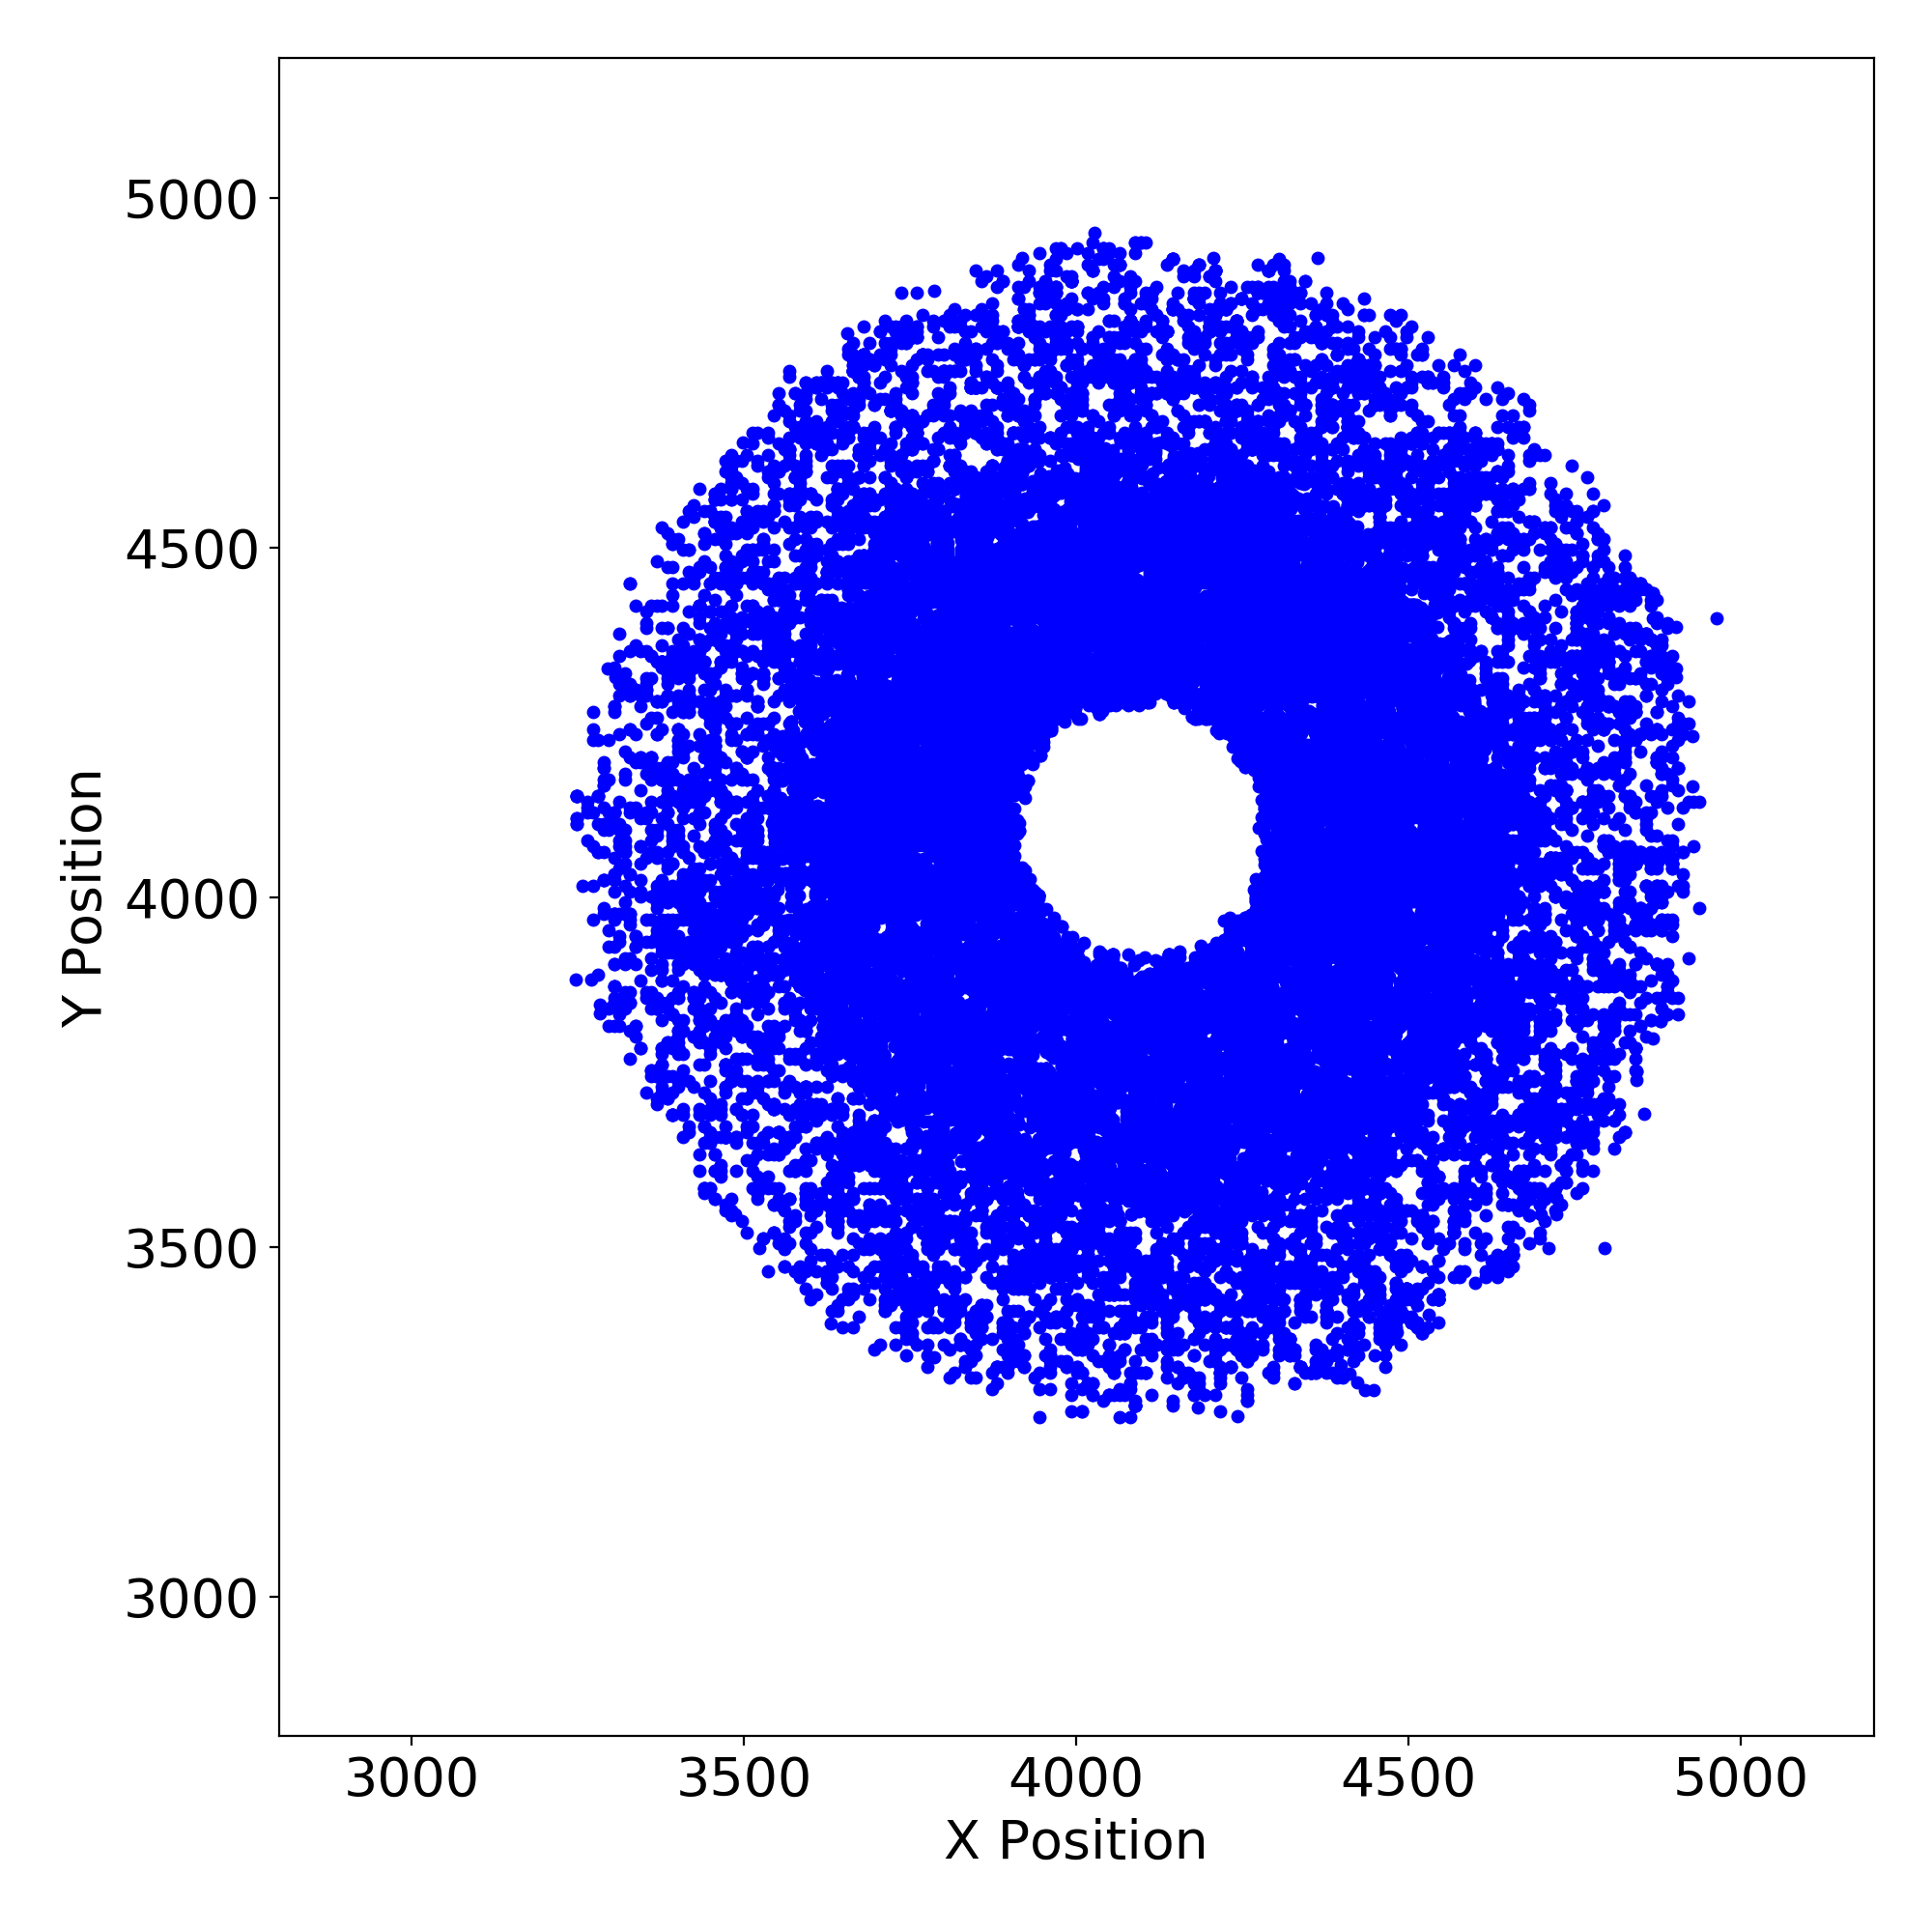 |
 |
 |
 |
 |
 |
 |
| ACIS S | 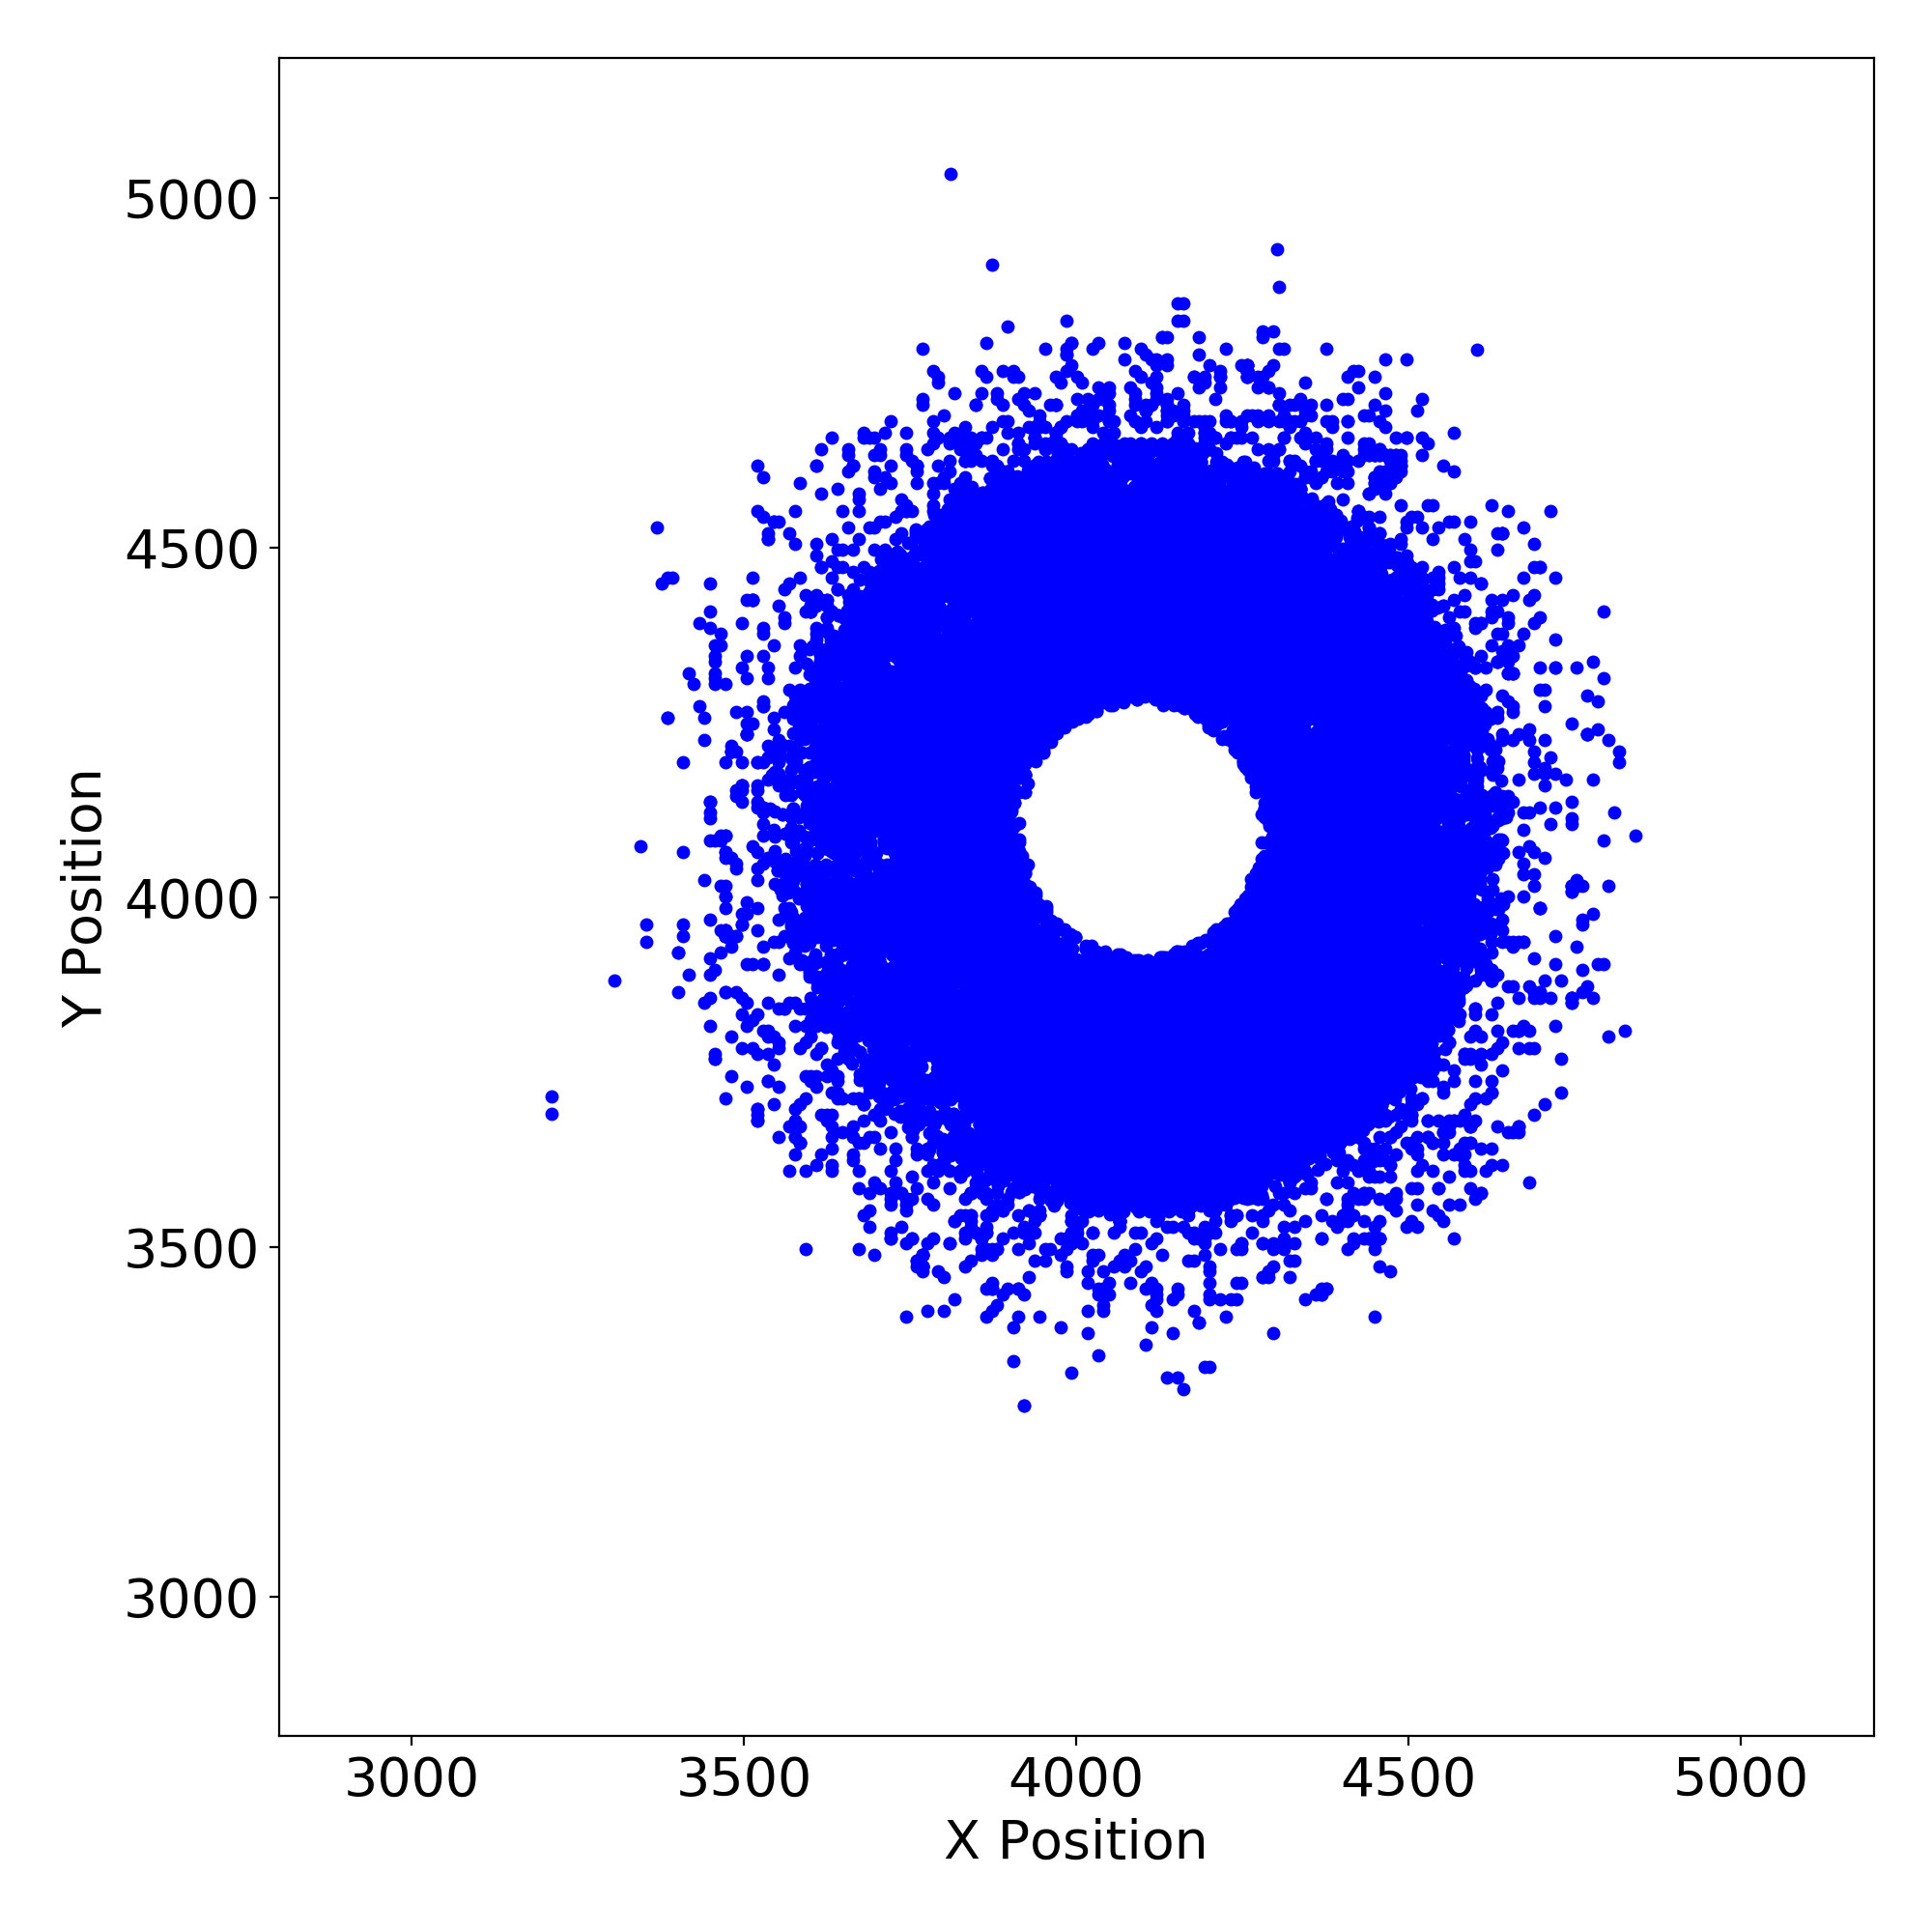 |
 |
 |
 |
 |
 |
 |
| HRC I | 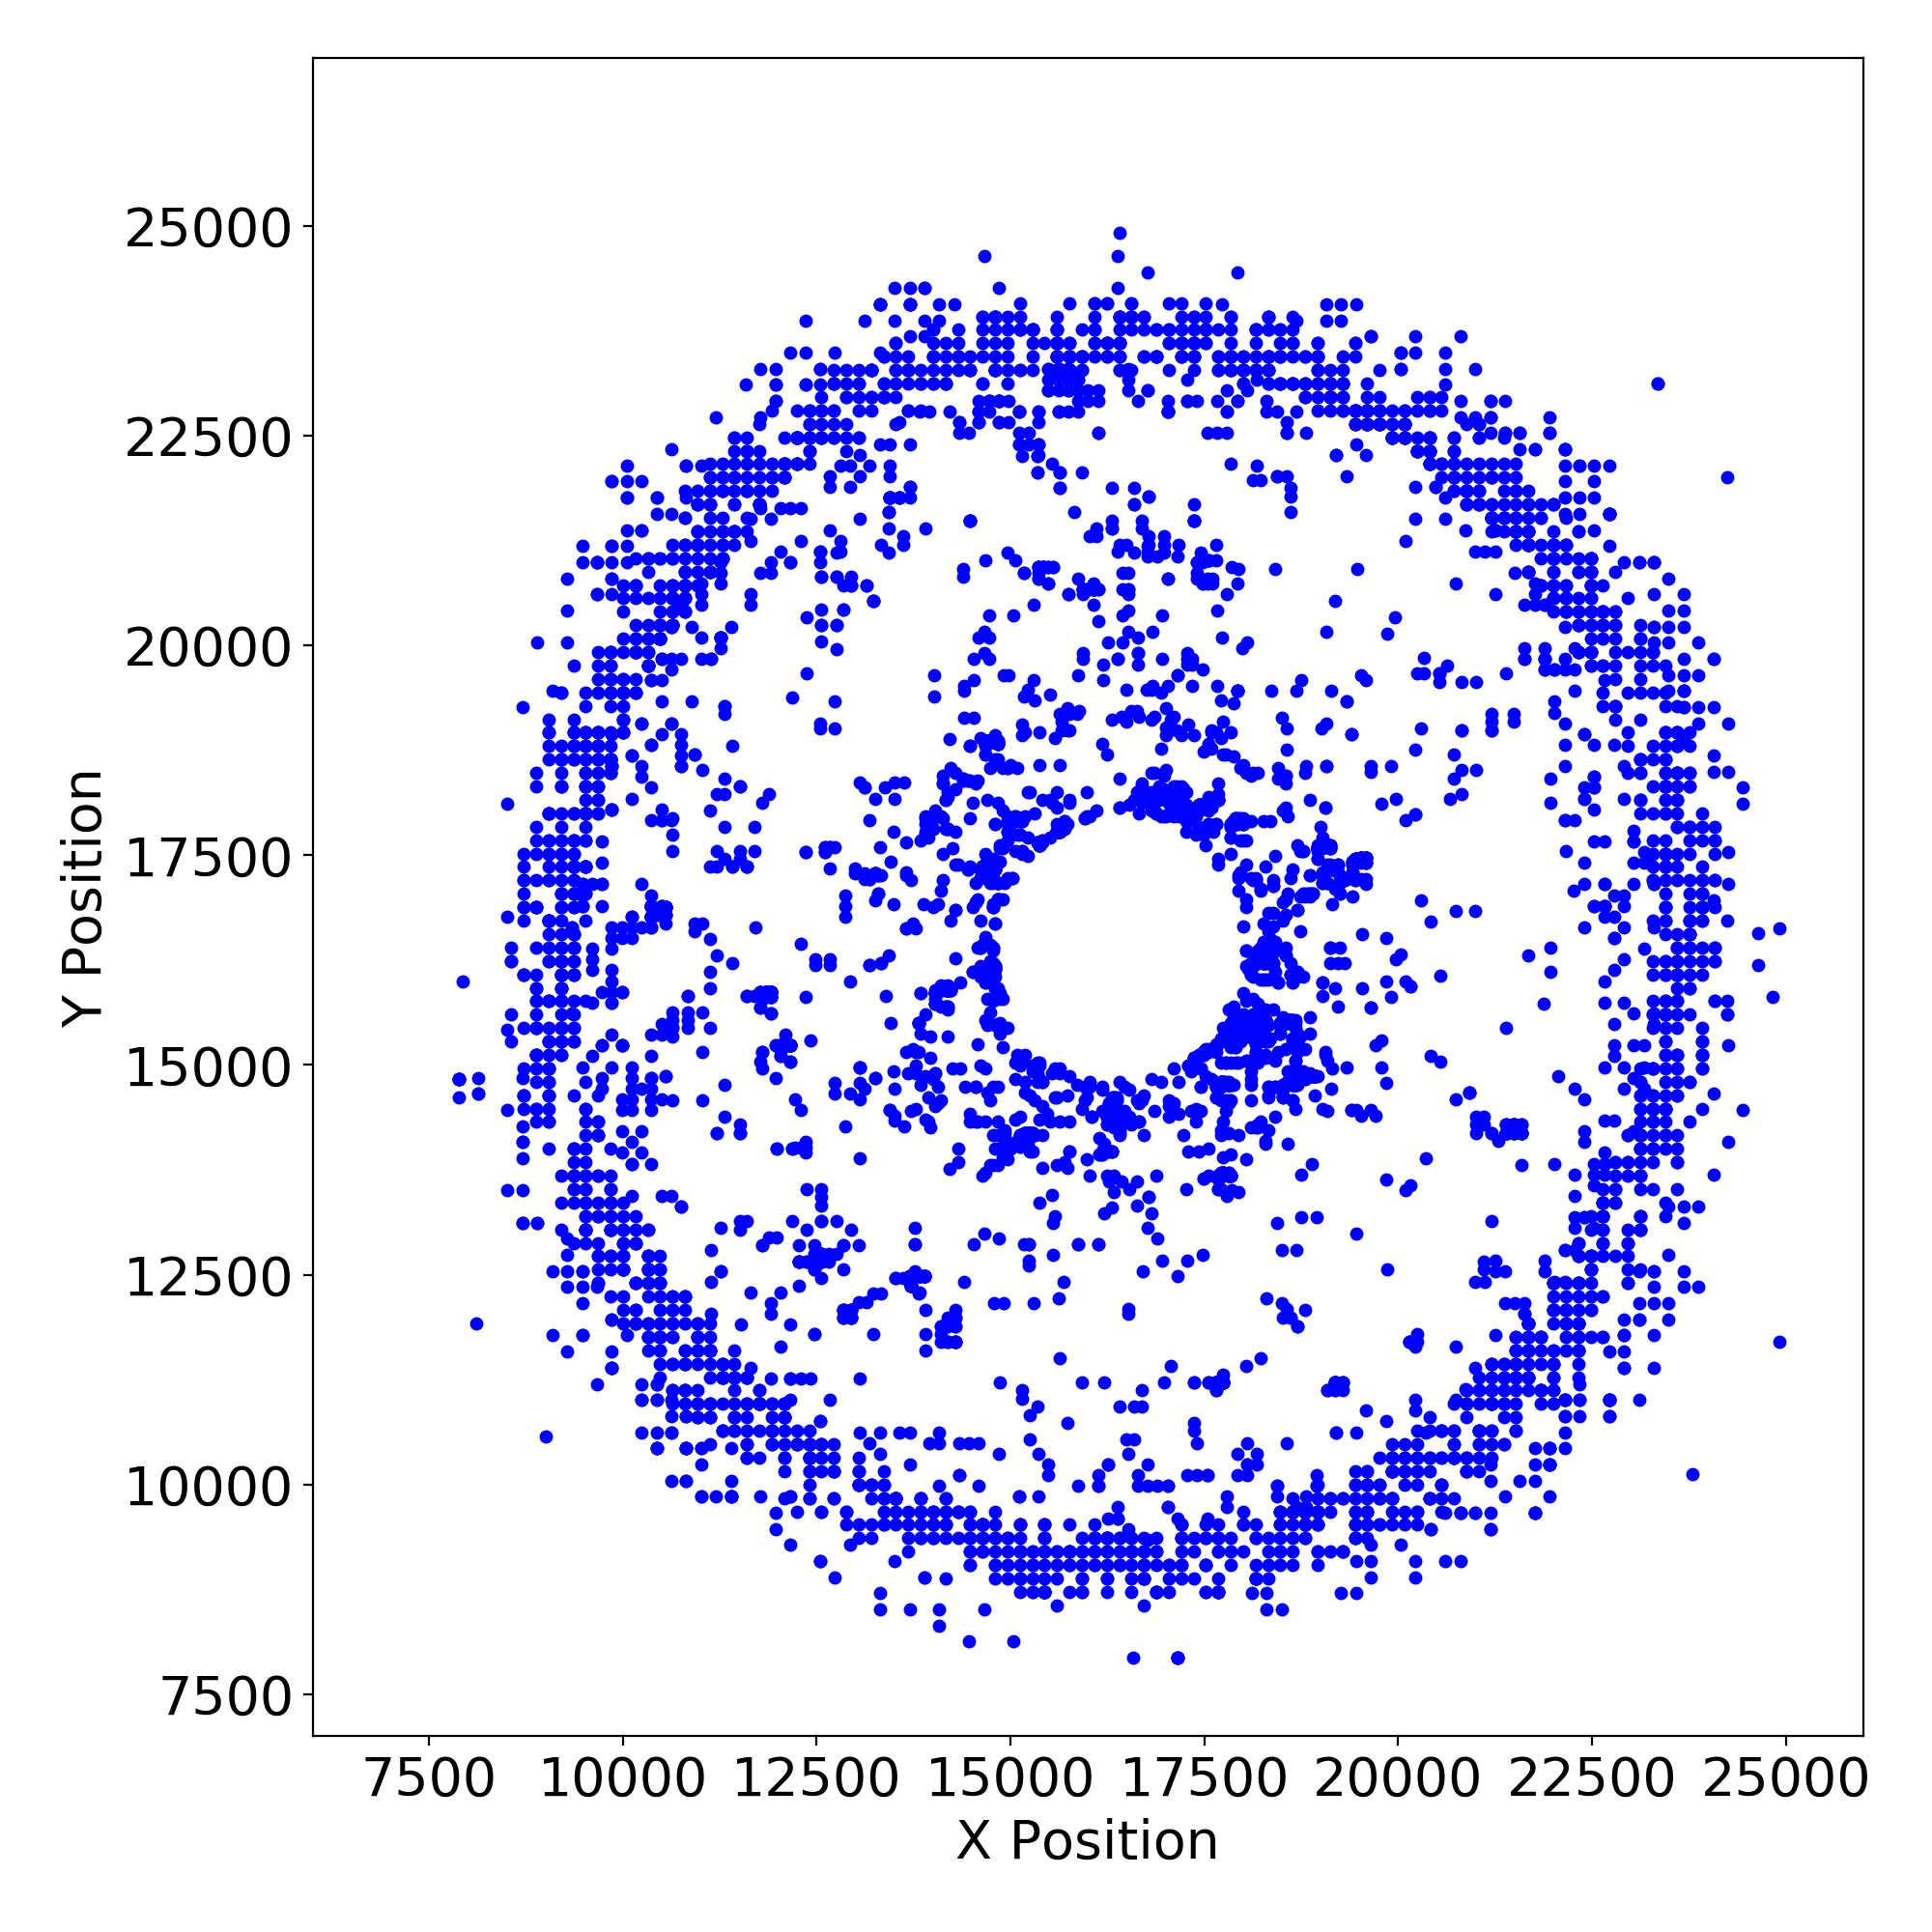 |
 |
 |
 |
 |
 |
 |
| HRC S | 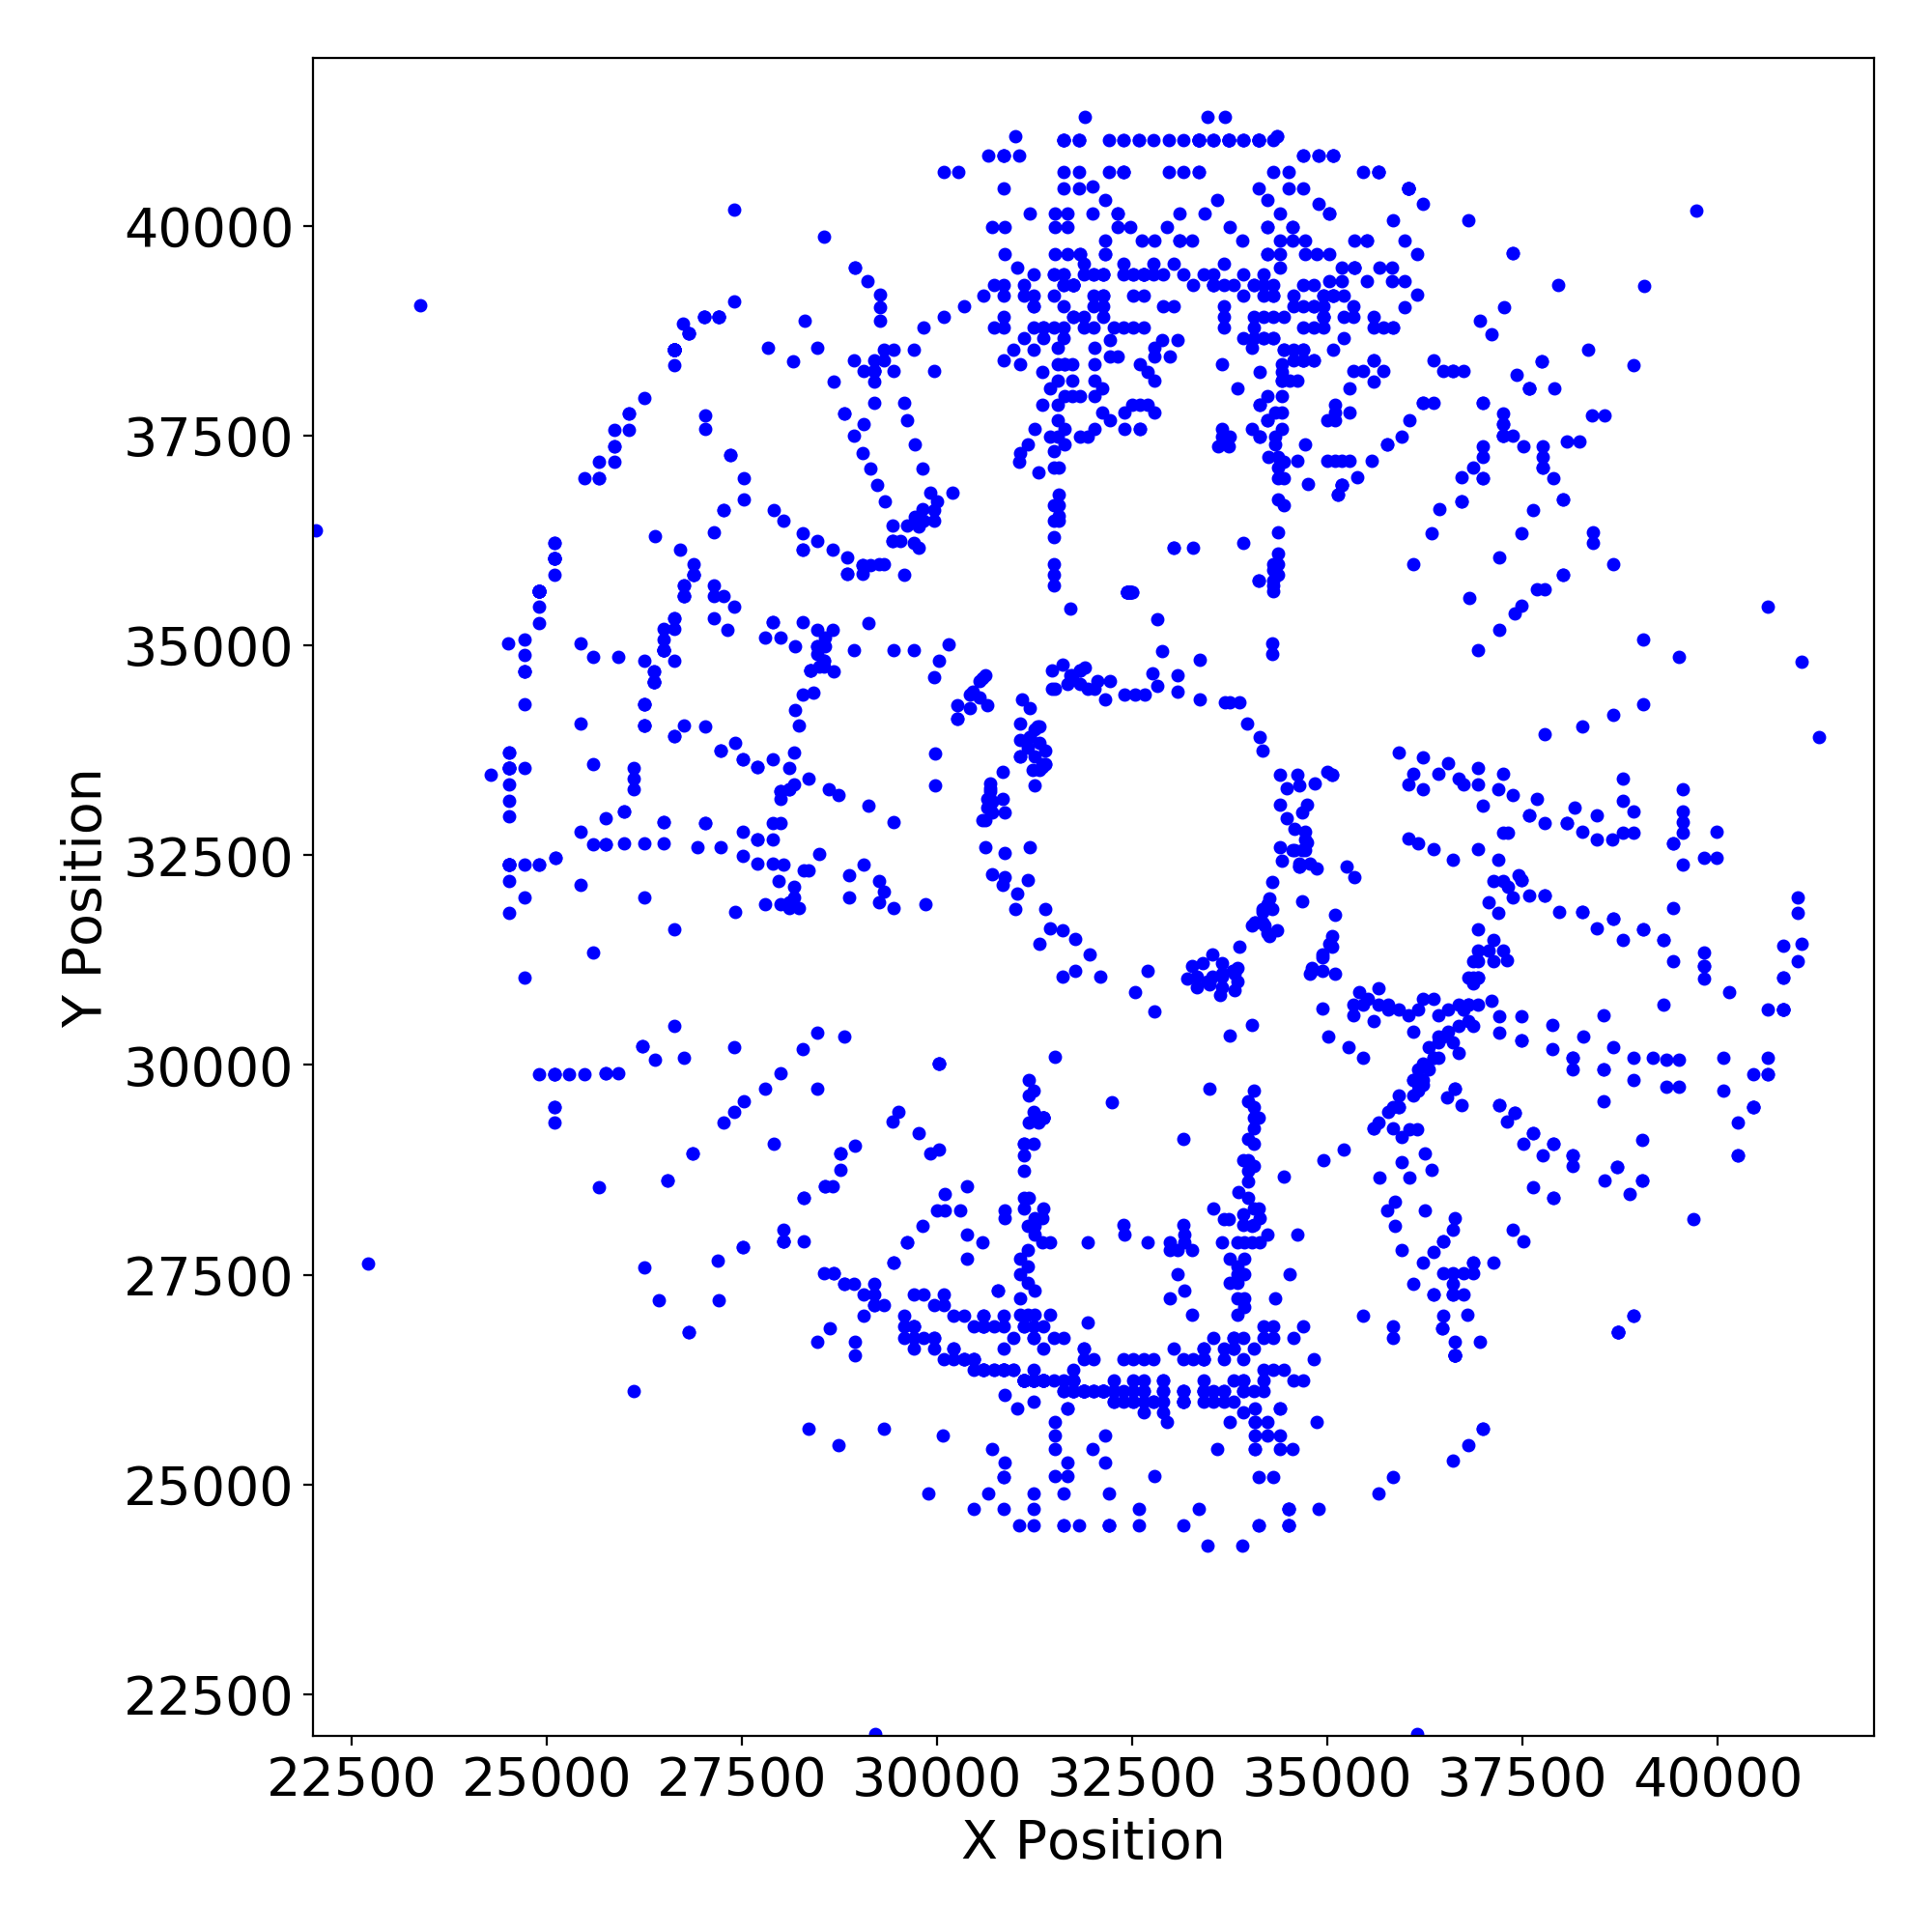 |
 |
 |
 |
 |
 |
 |
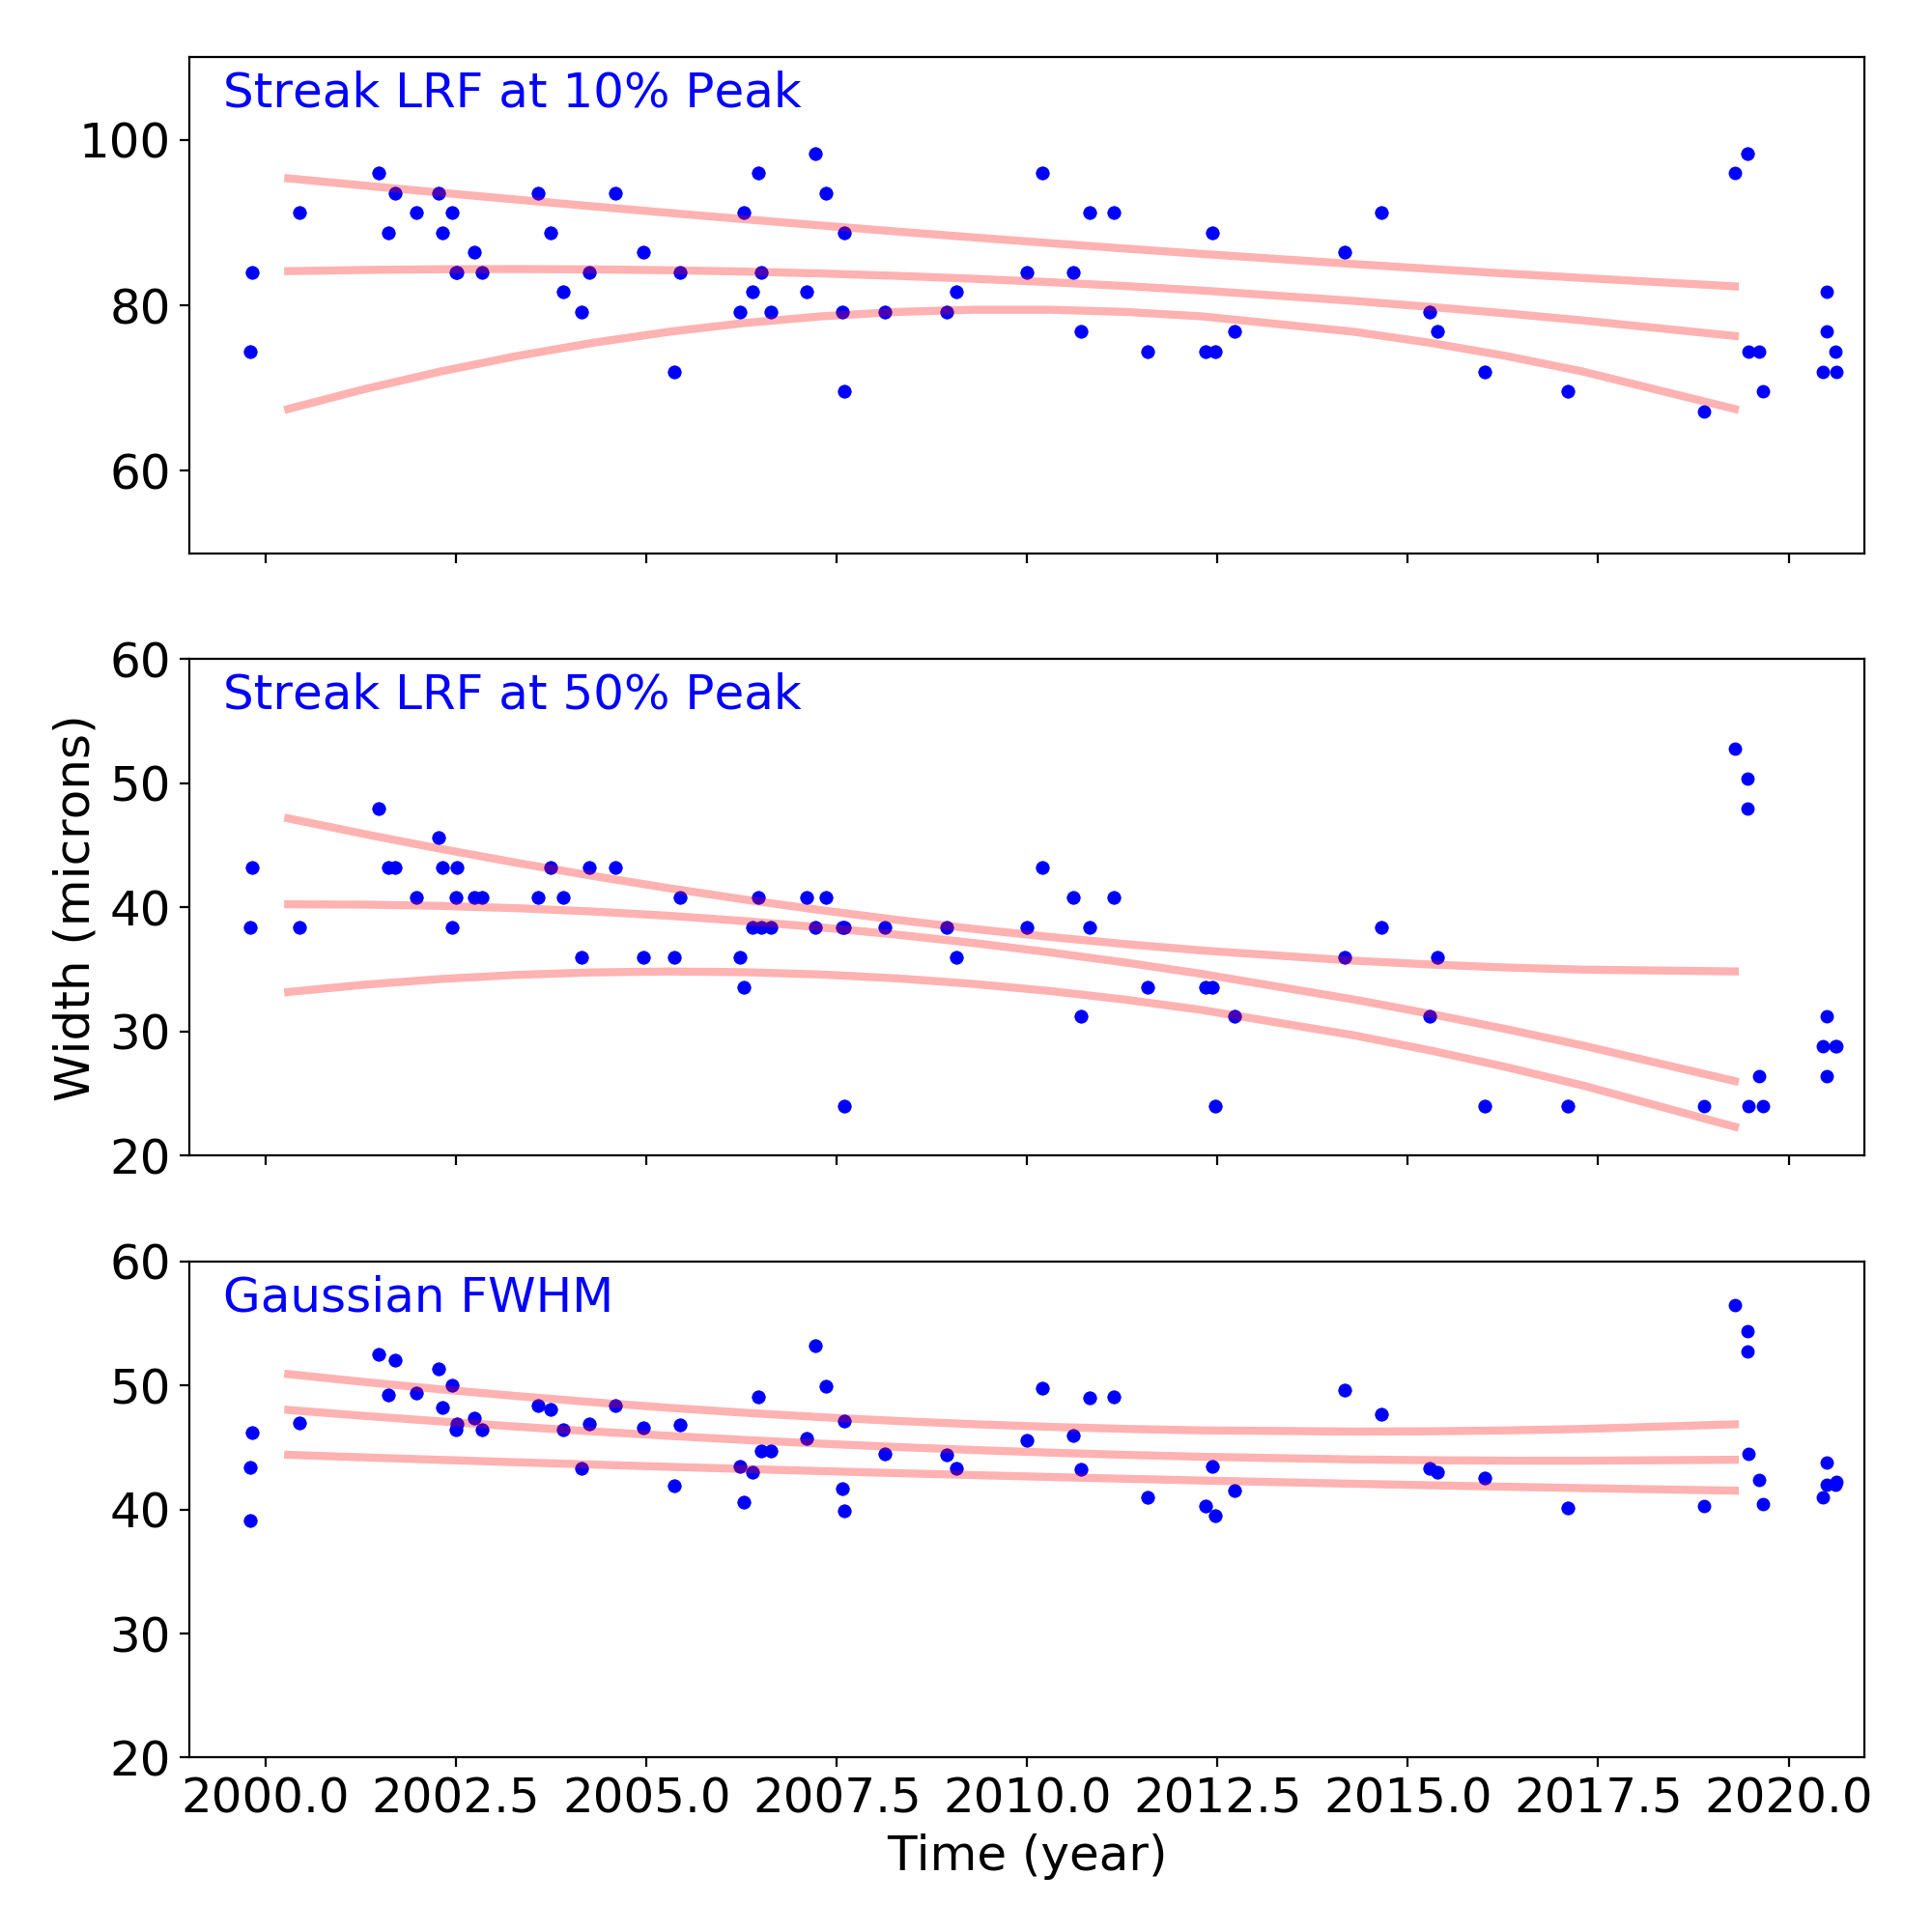
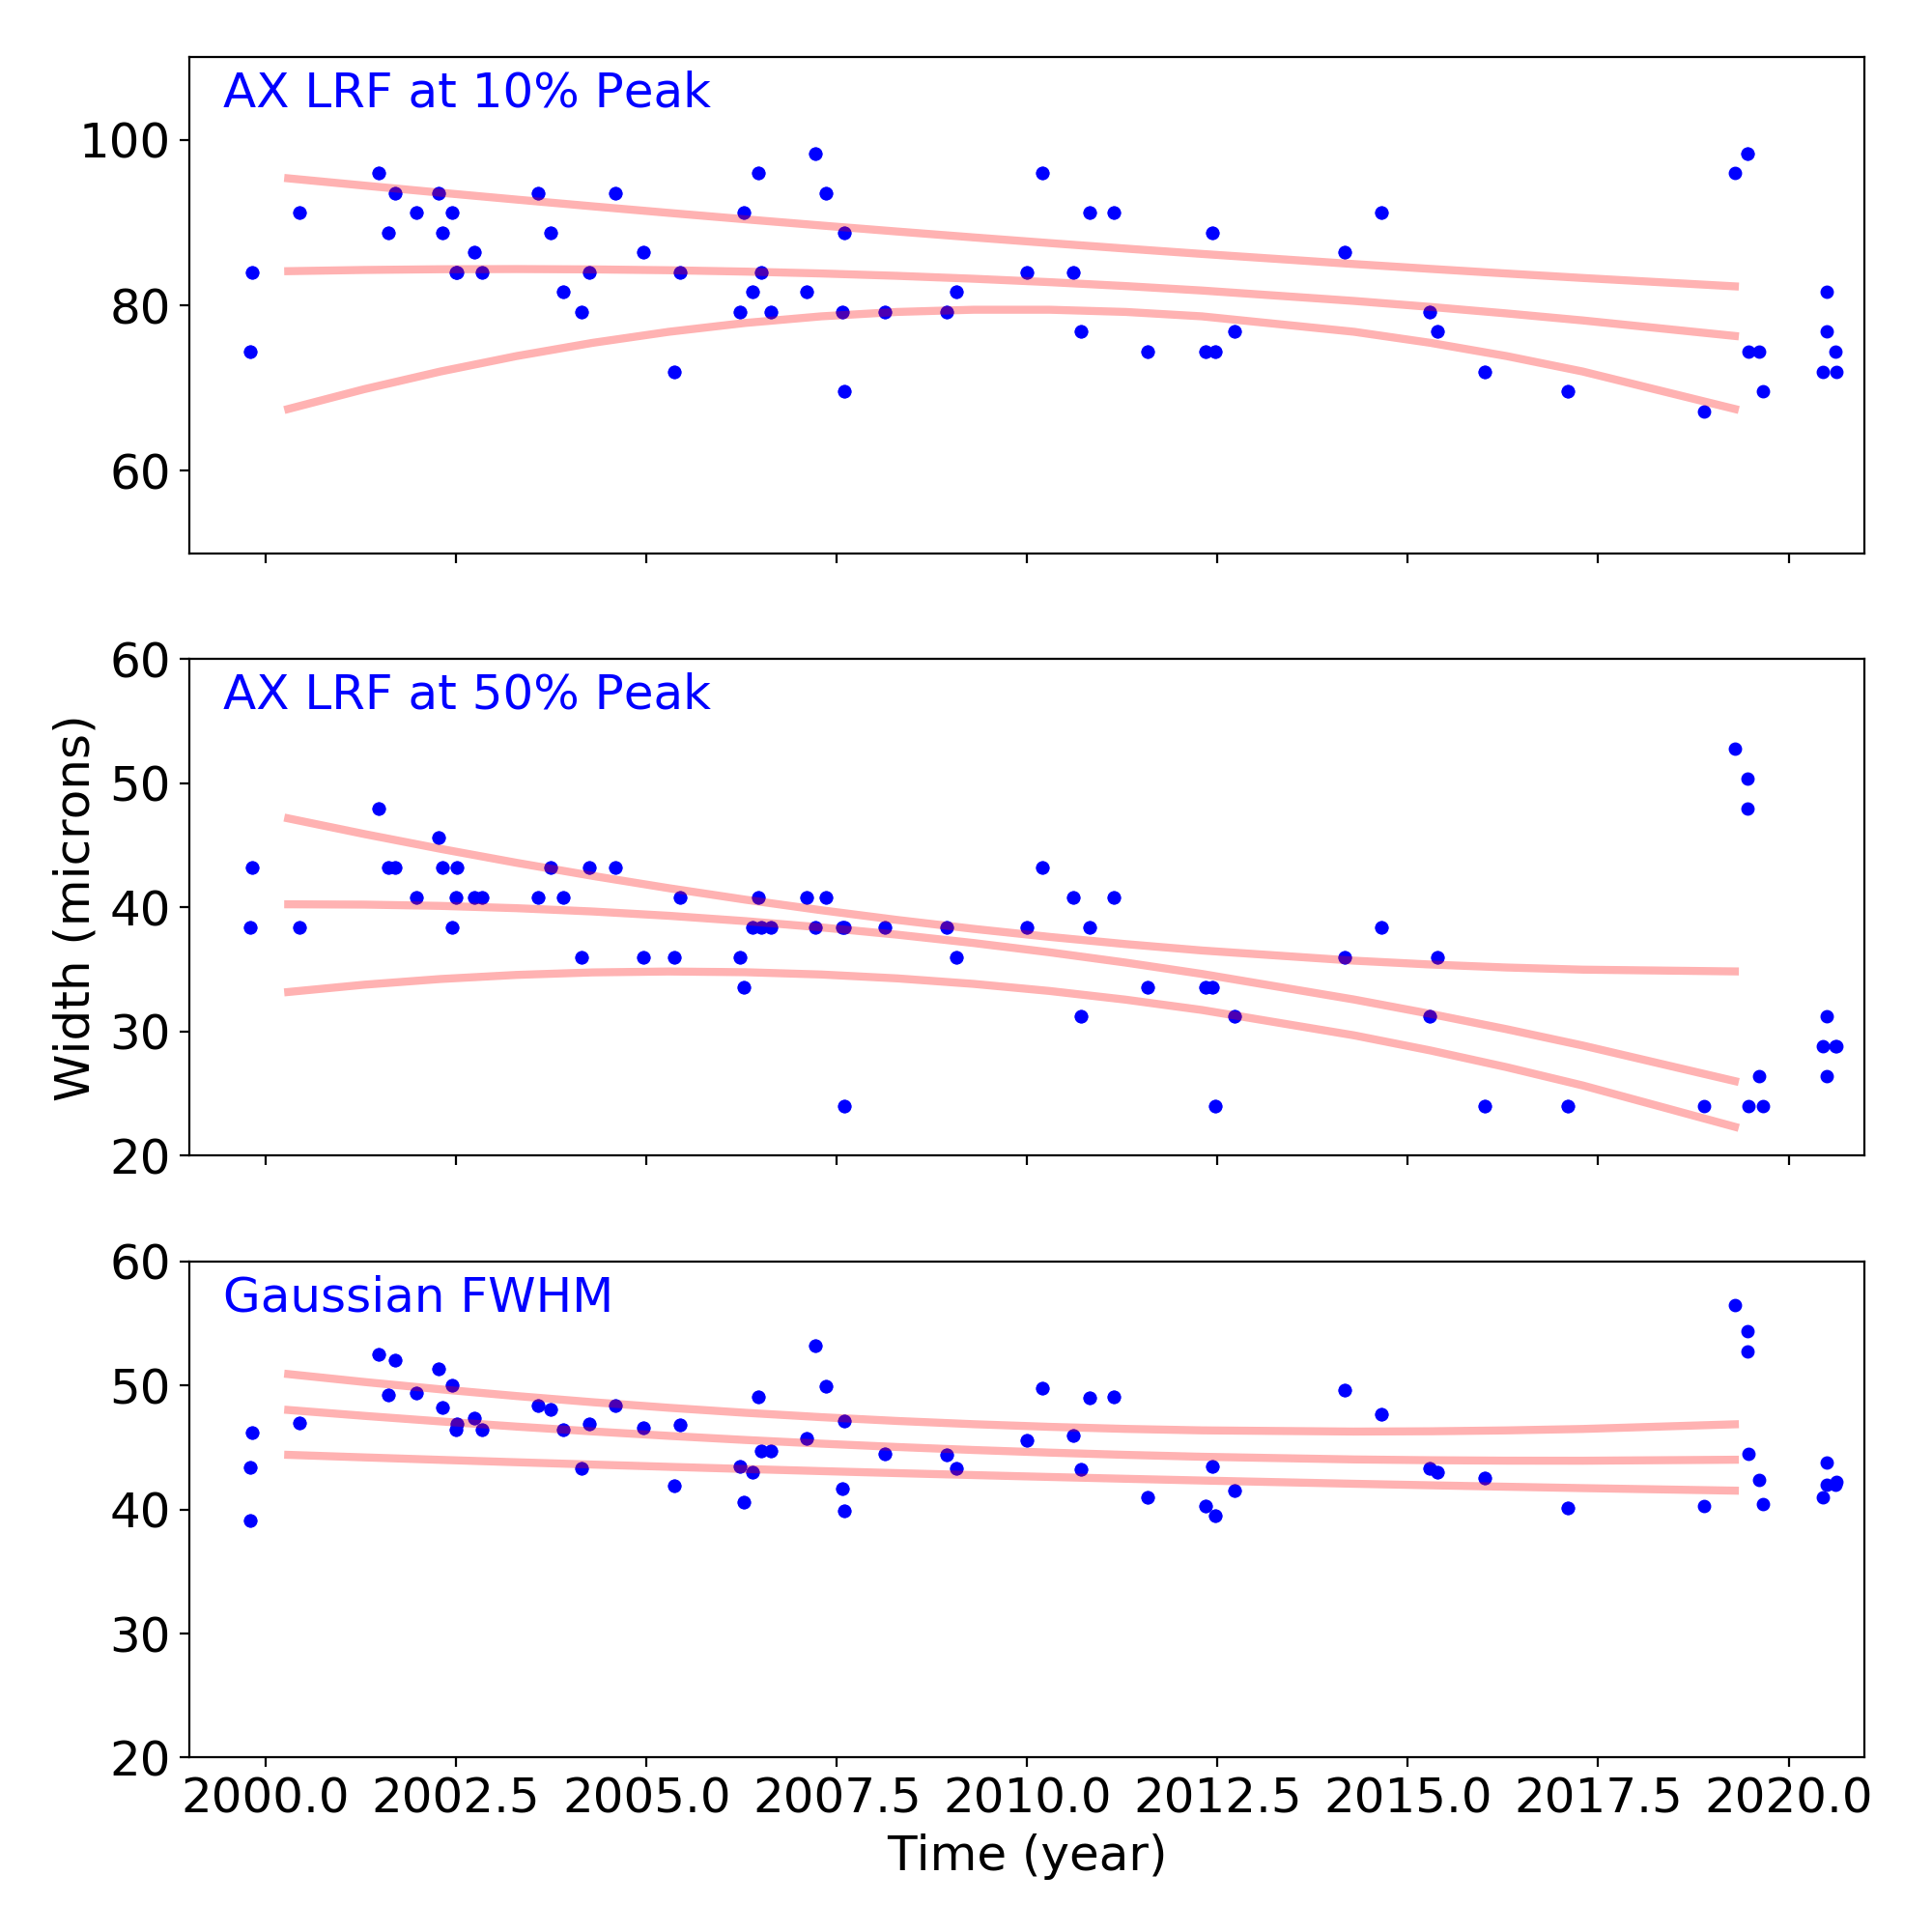
Gratings
Grating Trends/Focus
We plot the width of the zero order streak of ACIS/HETG observations and the width of the zero order image for HRC/LETG observations of point sources. No significant defocusing trend is seen at this time. See Gratings Trends pages.
PCAD
ACA Trending
| ACIS |
)
|
)
|
)
|
|
|---|---|---|---|---|
)
|
)
|
)
| ||
| HRCI |
)
|
)
|
)
|
)
|
| HRCI |
)
|
)
|
)
|
)
|
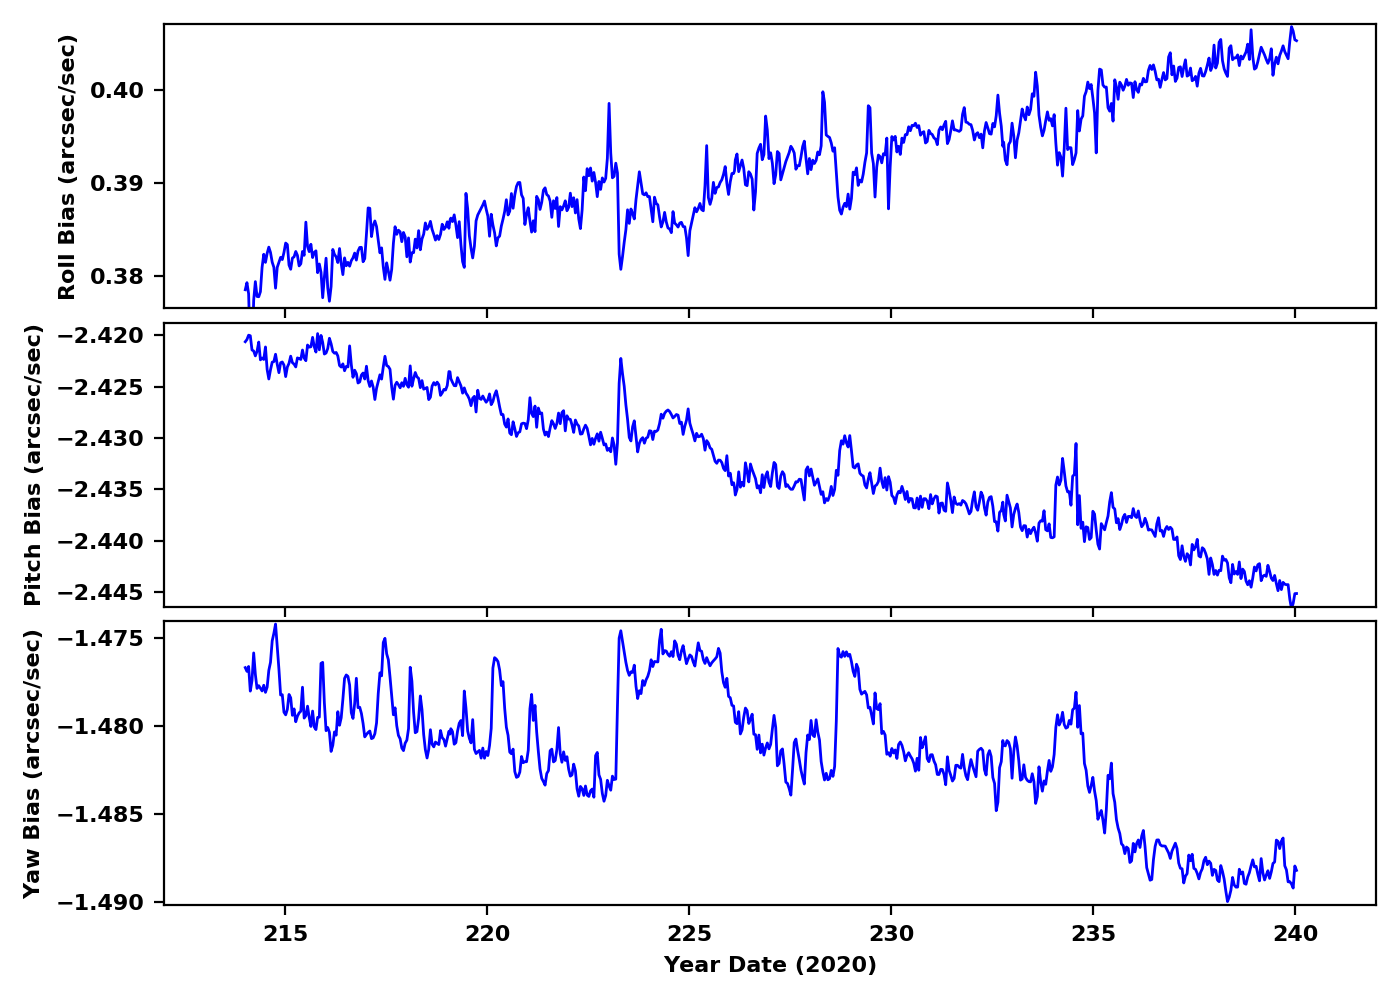
Gyro Bias Drift
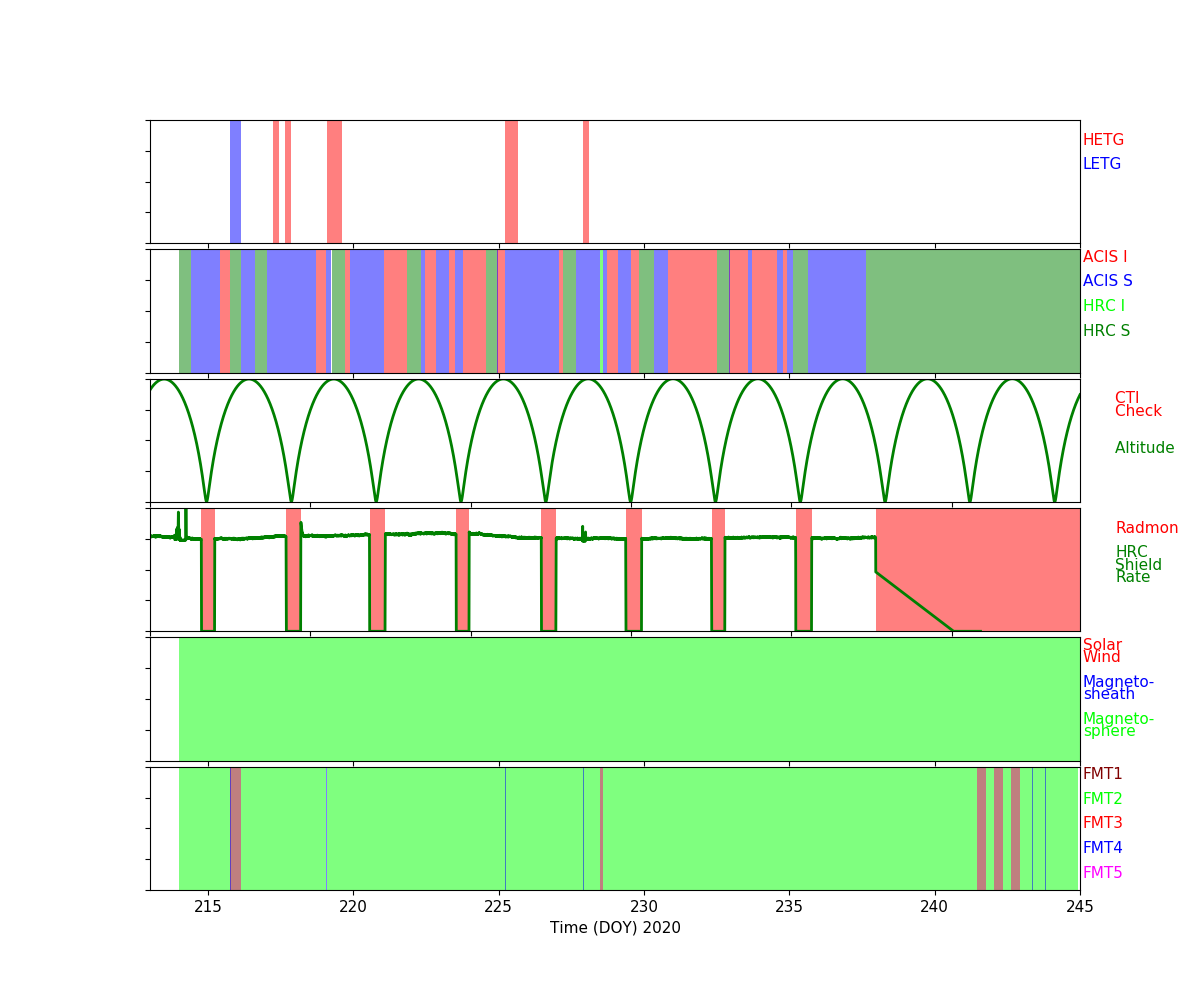
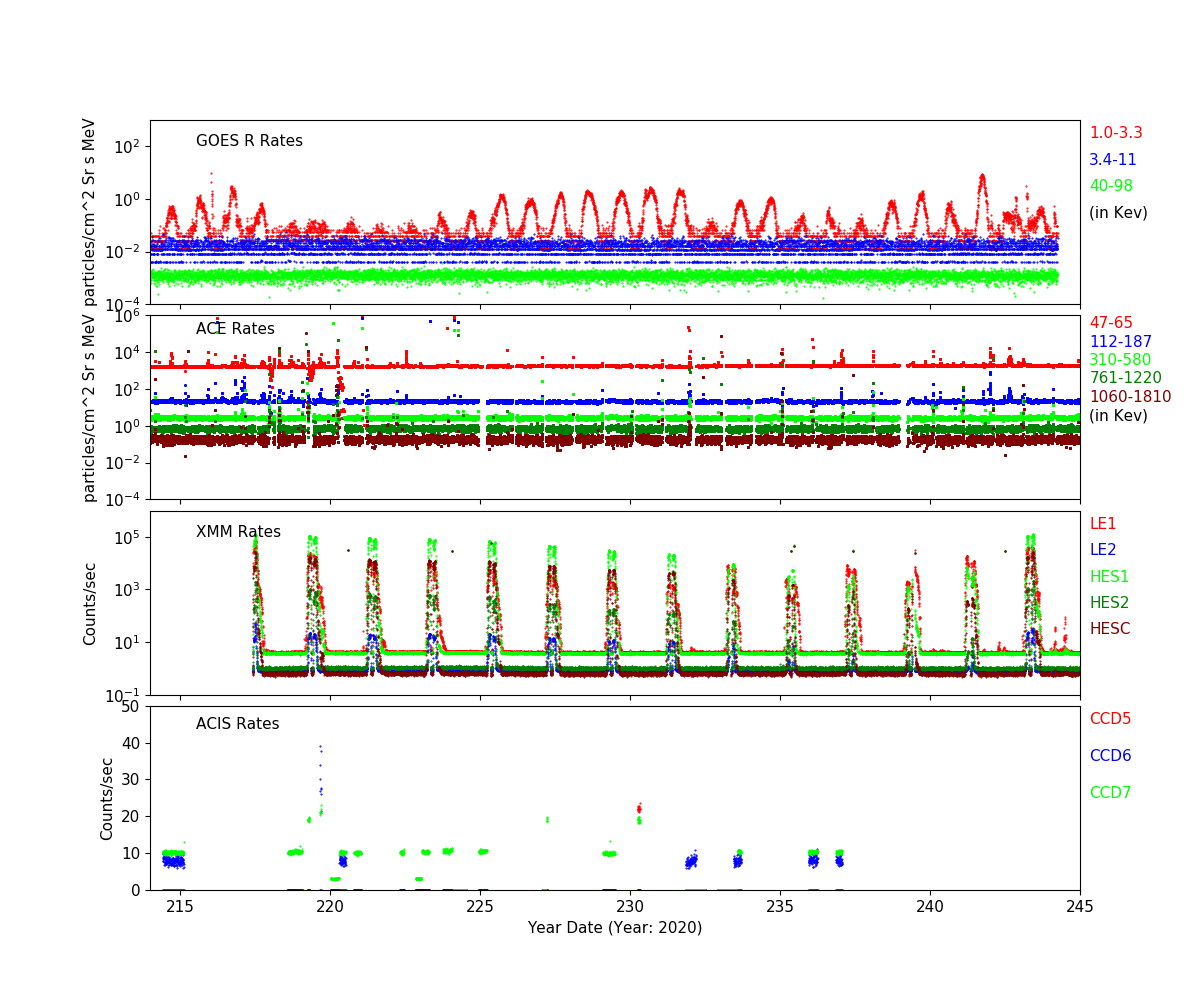
Radiation History
Radiation Count Rates of Aug 2020
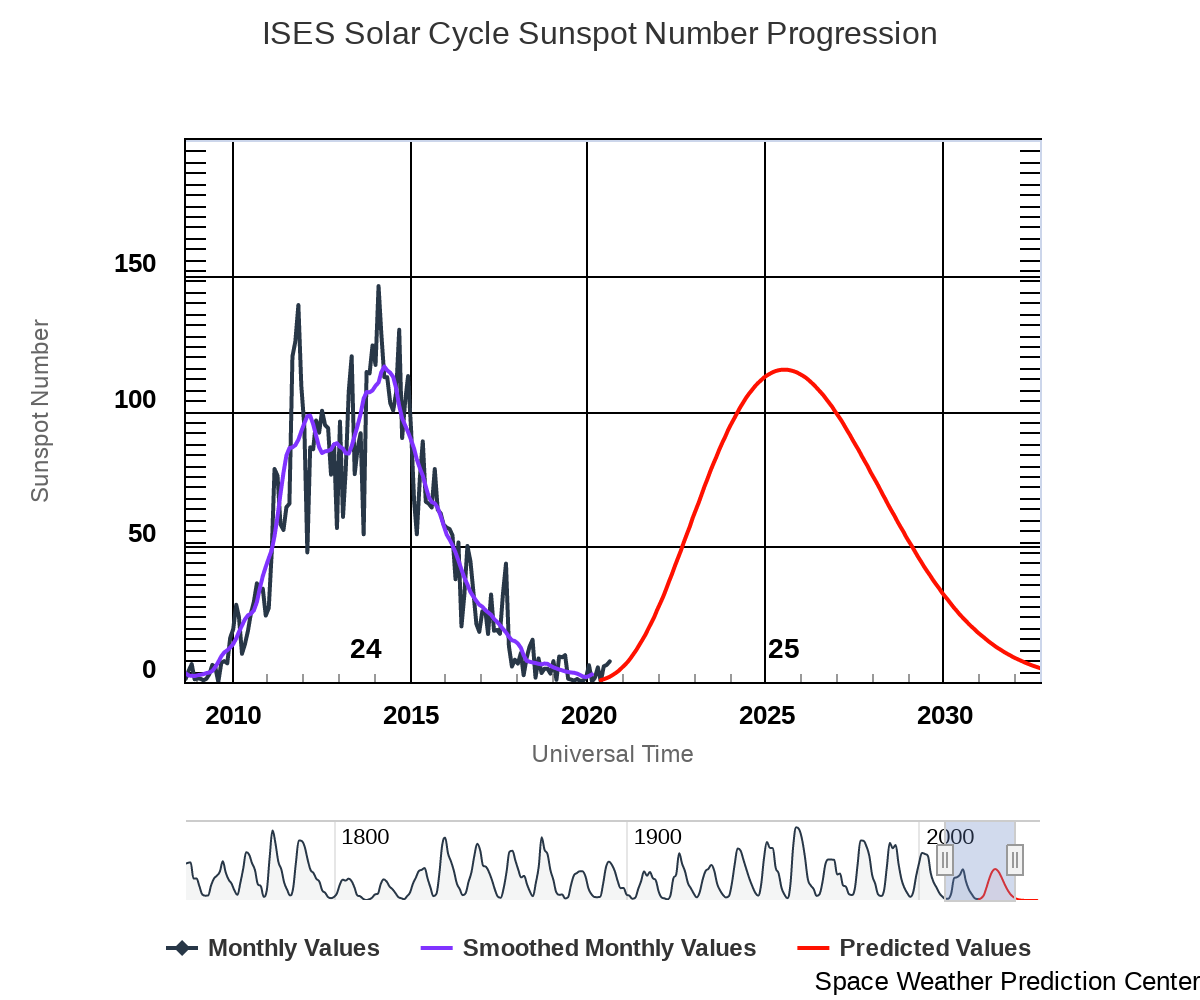
Sun Spot History (See:NOAA Page)
Trending
Quarterly Trends
- HRC Temperature
| Previous Quarter | |||||||
| MSID | MEAN | RMS | DELTA/YR | DELTA/YR/YR | UNITS | DESCRIPTION | |
| 2ceahvpt | -0.022 | 0.002 | (2.99+/-0.04)e2 | -2.37 +/- 0.88 | K | CEA RADIATOR TEMPERATURE AT CENTER | |
|---|---|---|---|---|---|---|---|
| 2chtrpzt | -0.022 | 0.002 | (2.96+/-0.04)e2 | -2.31 +/- 0.89 | K | CENTRAL ELECTRONICS BOX TEMP | |
| 2condmxt | -0.027 | 0.002 | (2.92+/-0.04)e2 | -2.53 +/- 0.94 | K | CONDUIT -X FACE TEMPERATURE | |
| 2dcentrt | -0.020 | 0.001 | (2.92+/-0.03)e2 | -0.82 +/- 0.78 | K | DETECTOR HOUSING TEMP 2 | |
| 2dtstatt | -0.028 | 0.002 | (2.92+/-0.04)e2 | -1.33 +/- 0.85 | K | DETECTOR HOUSING TEMP 1 | |
| 2fhtrmzt | -0.039 | 0.002 | (2.94+/-0.05)e2 | -3.59 +/- 1.06 | K | FRONT END ELECTRONICS BOX TEMPERATURE | |
| 2fradpyt | -0.037 | 0.002 | (2.90+/-0.05)e2 | -2.86 +/- 1.08 | K | FRONT END ASSEMBLY +Y AT RADIATOR CENTER TEMP | |
| 2pmt1t | -0.006 | 0.001 | (2.94+/-0.03)e2 | 1.81 +/- 0.88 | K | PMT 1 TEMPERATURE | |
| 2pmt2t | -0.008 | 0.001 | (2.96+/-0.03)e2 | 1.34 +/- 0.89 | K | PMT 2 TEMPERATURE | |
| 2uvlspxt | -0.013 | 0.001 | (2.88+/-0.03)e2 | 0.08 +/- 0.90 | K | UV LIGHT SHIELD NEXT TO SNOUT TEMP | |
- HRC HK
| Previous Quarter | |||||||
| MSID | MEAN | RMS | DELTA/YR | DELTA/YR/YR | UNITS | DESCRIPTION | |
| 2fe00atm | -4.661e-04 | 8.426e-04 | 21.53 +/- 1.82 | 1.02 +/- 0.72 | C | Front end temperature | |
|---|---|---|---|---|---|---|---|
| 2fepratm | on | -9.815e-04 | 9.489e-04 | 24.16 +/- 2.05 | 1.15 +/- 0.81 | C | FE temp card temperature | off | -6.097 | 1.447 | 7.62 +/- 8.61 | (0.00+/-0.00)e0 |
| 2imhvatm | on | -0.008 | 7.522e-04 | 31.24 +/- 1.65 | -0.32 +/- 0.53 | C | Imaging det HVPS temperature | off | -4.363 | 0.701 | 18.86 +/- 5.45 | (0.00+/-0.00)e0 |
| 2iminatm | on | -0.001 | 8.718e-04 | 18.60 +/- 1.88 | -0.44 +/- 0.68 | C | Imaging det temperature | off | -4.812 | 0.629 | 4.79 +/- 5.76 | (0.00+/-0.00)e0 |
| 2lvplatm | on | -4.281e-04 | 7.460e-04 | 27.57 +/- 1.61 | -0.49 +/- 0.54 | C | LVPS plate temperature | off | -4.013 | 0.773 | 15.90 +/- 5.26 | (0.00+/-0.00)e0 |
| 2prbscr | on | -4.063e-05 | 1.588e-05 | 1.57 +/- 0.03 | 0.01 +/- 0.01 | AMP | Primary bus current | off | 0.028 | 0.008 | 1.66 +/- 0.04 | (0.00+/-0.00)e0 |
| 2prbsvl | 0.002 | 4.850e-05 | 27.62 +/- 0.12 | 0.01 +/- 0.02 | V | Primary bus voltage | |
| 2smtratm | on | -8.385e-04 | 1.278e-05 | 5.69 +/- 0.04 | (6.85+/-2.86)e-13 | C | Selected motor temperature | off | 0.000e+00 | 2.385e-08 | 5.66 +/- 0.00 | (0.00+/-0.00)e0 |
| 2sphvatm | on | 0.008 | 8.302e-04 | 31.51 +/- 1.82 | -0.44 +/- 0.60 | C | Spect det HVPS temperature | off | -4.069 | 0.677 | 19.17 +/- 5.12 | (0.00+/-0.00)e0 |
| 2spinatm | on | 7.057e-04 | 8.691e-04 | 19.75 +/- 1.86 | -0.45 +/- 0.65 | C | Spect det temperature | off | -4.518 | 0.578 | 6.97 +/- 5.39 | (0.00+/-0.00)e0 |
- PCAD Temperature
| Previous Quarter | |||||||
| MSID | MEAN | RMS | DELTA/YR | DELTA/YR/YR | UNITS | DESCRIPTION | |
| aacccdpt | -0.012 | 5.602e-04 | (2.64+/-0.01)e2 | -0.20 +/- 0.45 | K | AC CCD TEMP (PRI) | |
|---|---|---|---|---|---|---|---|
| aacccdrt | -0.012 | 5.759e-04 | (3.08+/-0.01)e2 | -0.23 +/- 0.48 | K | AC CCD TEMP (RDNT) | |
| aach1t | -0.012 | 5.679e-04 | (3.05+/-0.01)e2 | -0.20 +/- 0.47 | K | AC HOUSING TEMP (ACH1) | |
| aach2t | -0.012 | 5.694e-04 | (3.05+/-0.01)e2 | -0.23 +/- 0.47 | K | AC HOUSING TEMP (ACH2) | |
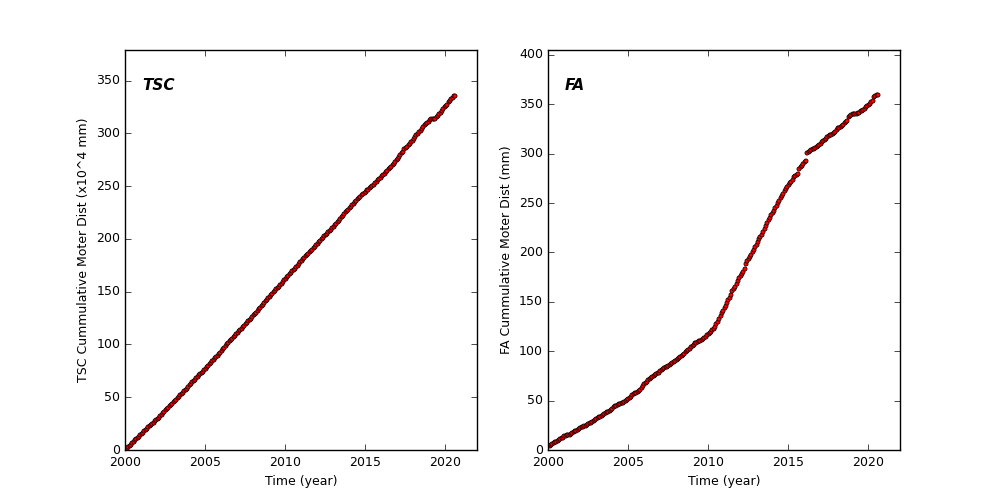
Spacecraft Motions
TSC and FA Cummulative Moter Distance
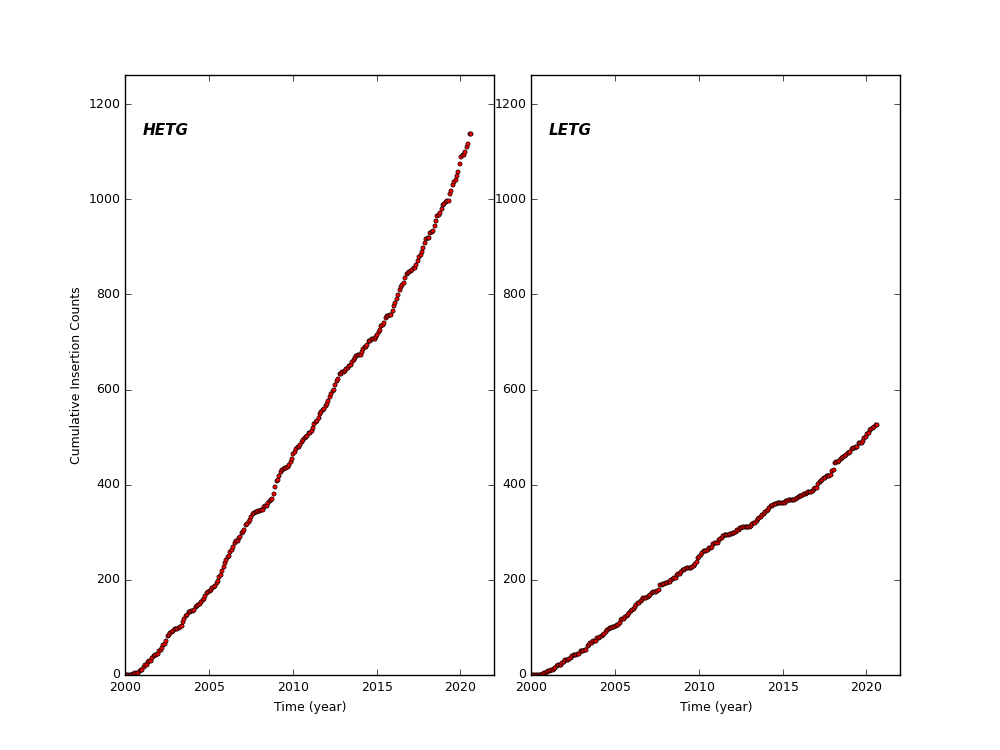
HETG and LETG Cummulative Insertion Counts
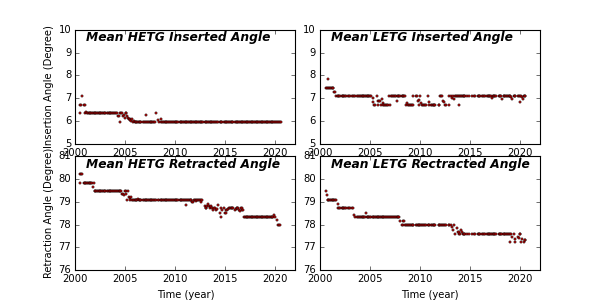
HETG/LETG Insertion/Retraction Angle
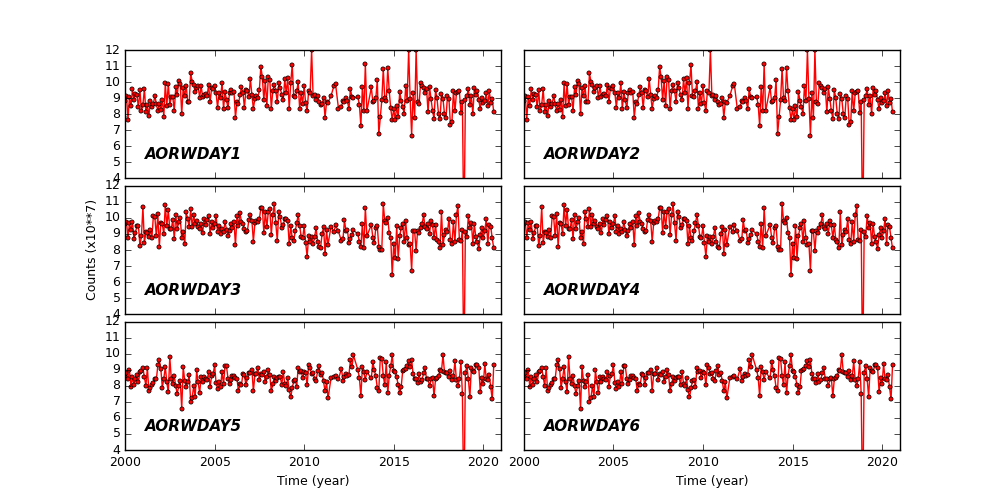
Reaction Wheel Rotations