ACIS
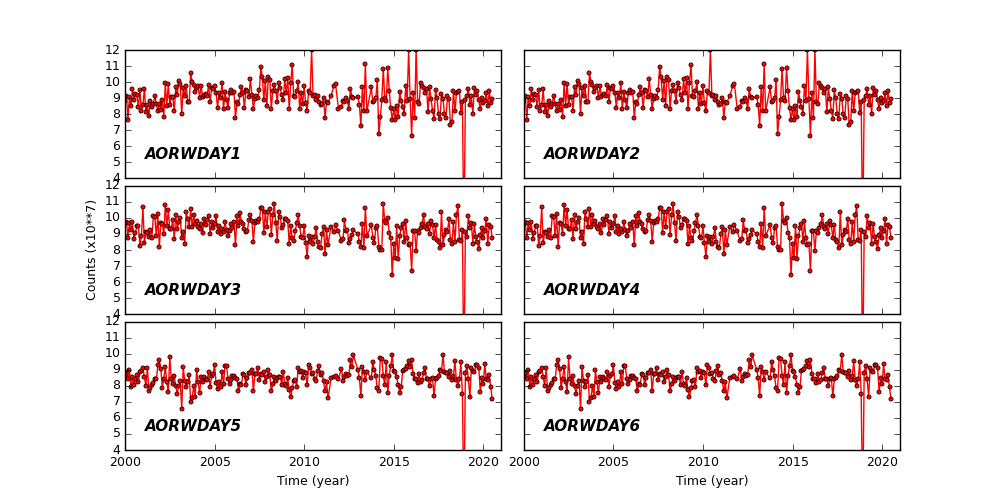
ACIS DOSE Registered-Photon-Map
The steps we took to compute the dose map are;
- Level 1 Event files for a specified month are obtained from archive.
- Image data including I2, I3, S2, S3 CCDs are extracted from all event files.
- All the extracted image data were merged to create a month long exposure map for the month.
- The exposure map is opened with ds9, and check a distribution of count rates against energy. From this, estimate the upper threshold value. Any events beyond this upper threshold are assumed erroneous events such as bad pixels.
- Using this upper threshold, the data is filtered, and create a cleaned exposure map for the month.
- The exposure map from each month from the Sep 1999 is added up to create a cumulative exposure map for each month.
- Using fimgstatistic, we compute count rate statistics for each CCDs.
- For observations with high data drop rates (e.g., Crab nebula, Cas A), we corrected the observations by adding events.
Please check more detail plots at Telemetered Photon Dose Trend page.
)
)
)
Statistics:
# IMAGE     NPIX     MEAN        RMS        MIN     MAX
ACIS_jun20 6004901       8.958         14.472           0.0     4677


I2 node 0  262654	8.319024	3.615813	0.0	 73.0
I2 node 1  262654	8.588560	11.771623	0.0	4492.0
I2 node 2  262654	8.569430	3.599356	0.0	 93.0
I2 node 3  262654	8.526225	6.713867	0.0	2547.0

I3 node 0  262654	9.360835	6.578238	0.0	2526.0
I3 node 1  262654	9.007855	3.773473	0.0	144.0
I3 node 2  262654	9.002295	3.686602	0.0	 95.0
I3 node 3  262654	8.988239	3.751780	0.0	169.0

S2 node 0  262654	8.688205	5.122066	0.0	452.0
S2 node 1  262654	8.930019	6.061393	0.0	772.0
S2 node 2  262654	10.241697	8.121579	0.0	2499.0
S2 node 3  262654	13.639981	12.471771	0.0	4677.0

S3 node 0  262654	26.648545	36.053175	1.0	919.0
S3 node 1  262654	22.622269	19.156612	0.0	525.0
S3 node 2  262654	15.492896	5.669703	0.0	155.0
S3 node 3  262654	13.587473	5.005135	0.0	183.0
)
)
)
Statistics:
 IMAGE     NPIX      MEAN        RMS           MIN      MAX
ACIS_total   6004901       2405.730         3100.308           0.0   134365


I2 node 0  262654	2086.724938	416.728736	442.0	12226.0
I2 node 1  262654	2194.847416	588.084521	454.0	109384.0
I2 node 2  262654	2222.573072	470.003354	468.0	12569.0
I2 node 3  262654	2227.964725	574.683866	447.0	28694.0

I3 node 0  262654	2379.614447	585.662432	447.0	11507.0
I3 node 1  262654	2458.136589	1708.805048	475.0	55487.0
I3 node 2  262654	2179.042265	406.150859	440.0	12709.0
I3 node 3  262654	2171.699112	437.114531	408.0	33290.0

S2 node 0  262654	2806.061106	446.419523	1544.0	22089.0
S2 node 1  262654	2973.693507	666.811935	1723.0	16262.0
S2 node 2  262654	3285.382567	667.597966	2147.0	27904.0
S2 node 3  262654	3241.974850	527.185836	1905.0	64296.0

S3 node 0  262654	4962.754883	2366.516388	2172.0	35142.0
S3 node 1  262654	6187.620678	2315.655266	0.0	33592.0
S3 node 2  262654	4923.010018	1291.643848	2164.0	25878.0
S3 node 3  262654	3819.268328	680.969152	2339.0	25289.0
)
|
)
|
)
|
)
|
| Mar 2020 | Dec 2019 | Sep 2019 | Jun 2019 |
|---|
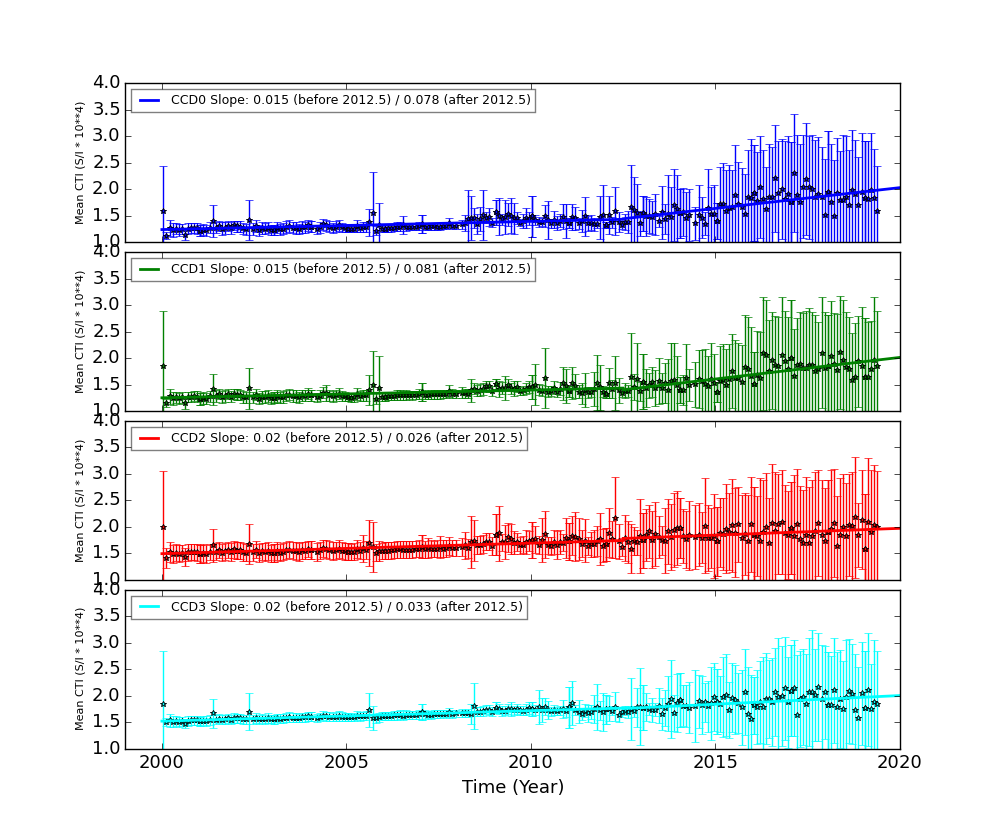
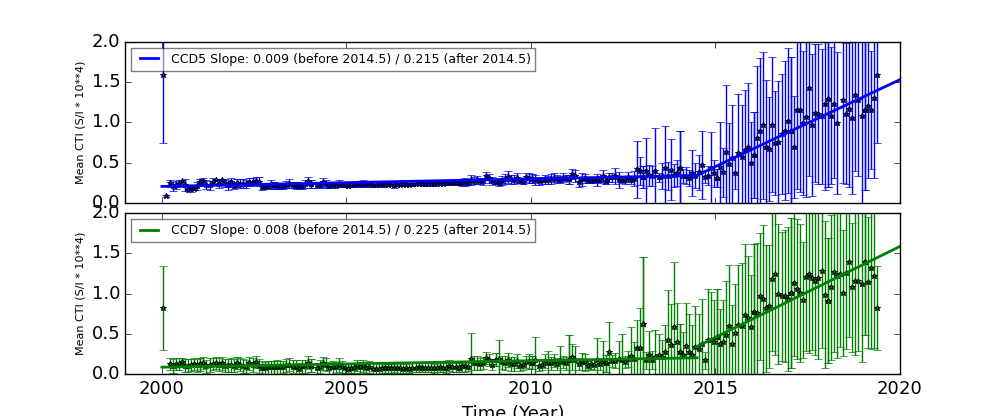
The Mean Detrended CTI
We report CTIs with a refined data definition. CTIs were computed for the temperature dependency corrected data. Please see CTI page for detailed explanation. CTI's are computed for Mn K alpha, and defined as slope/intercept x10^4 of row # vs ADU. Data file: here
Imaging CCDs
Spectral CCDs
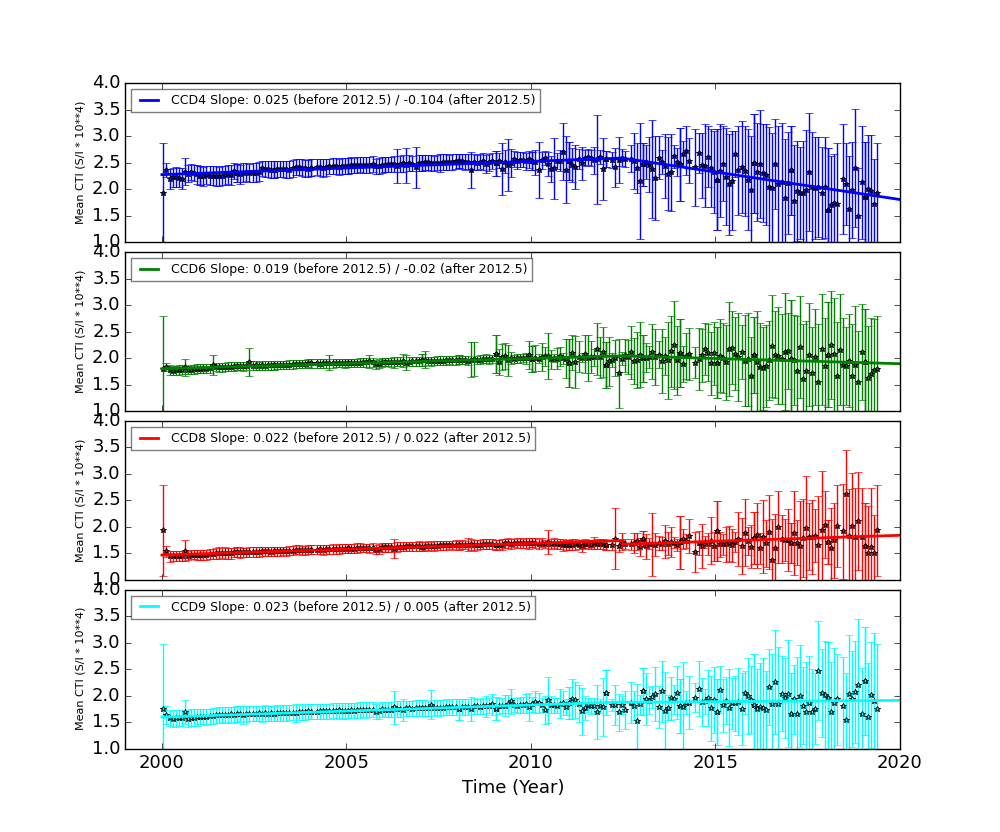
Backside CCDs
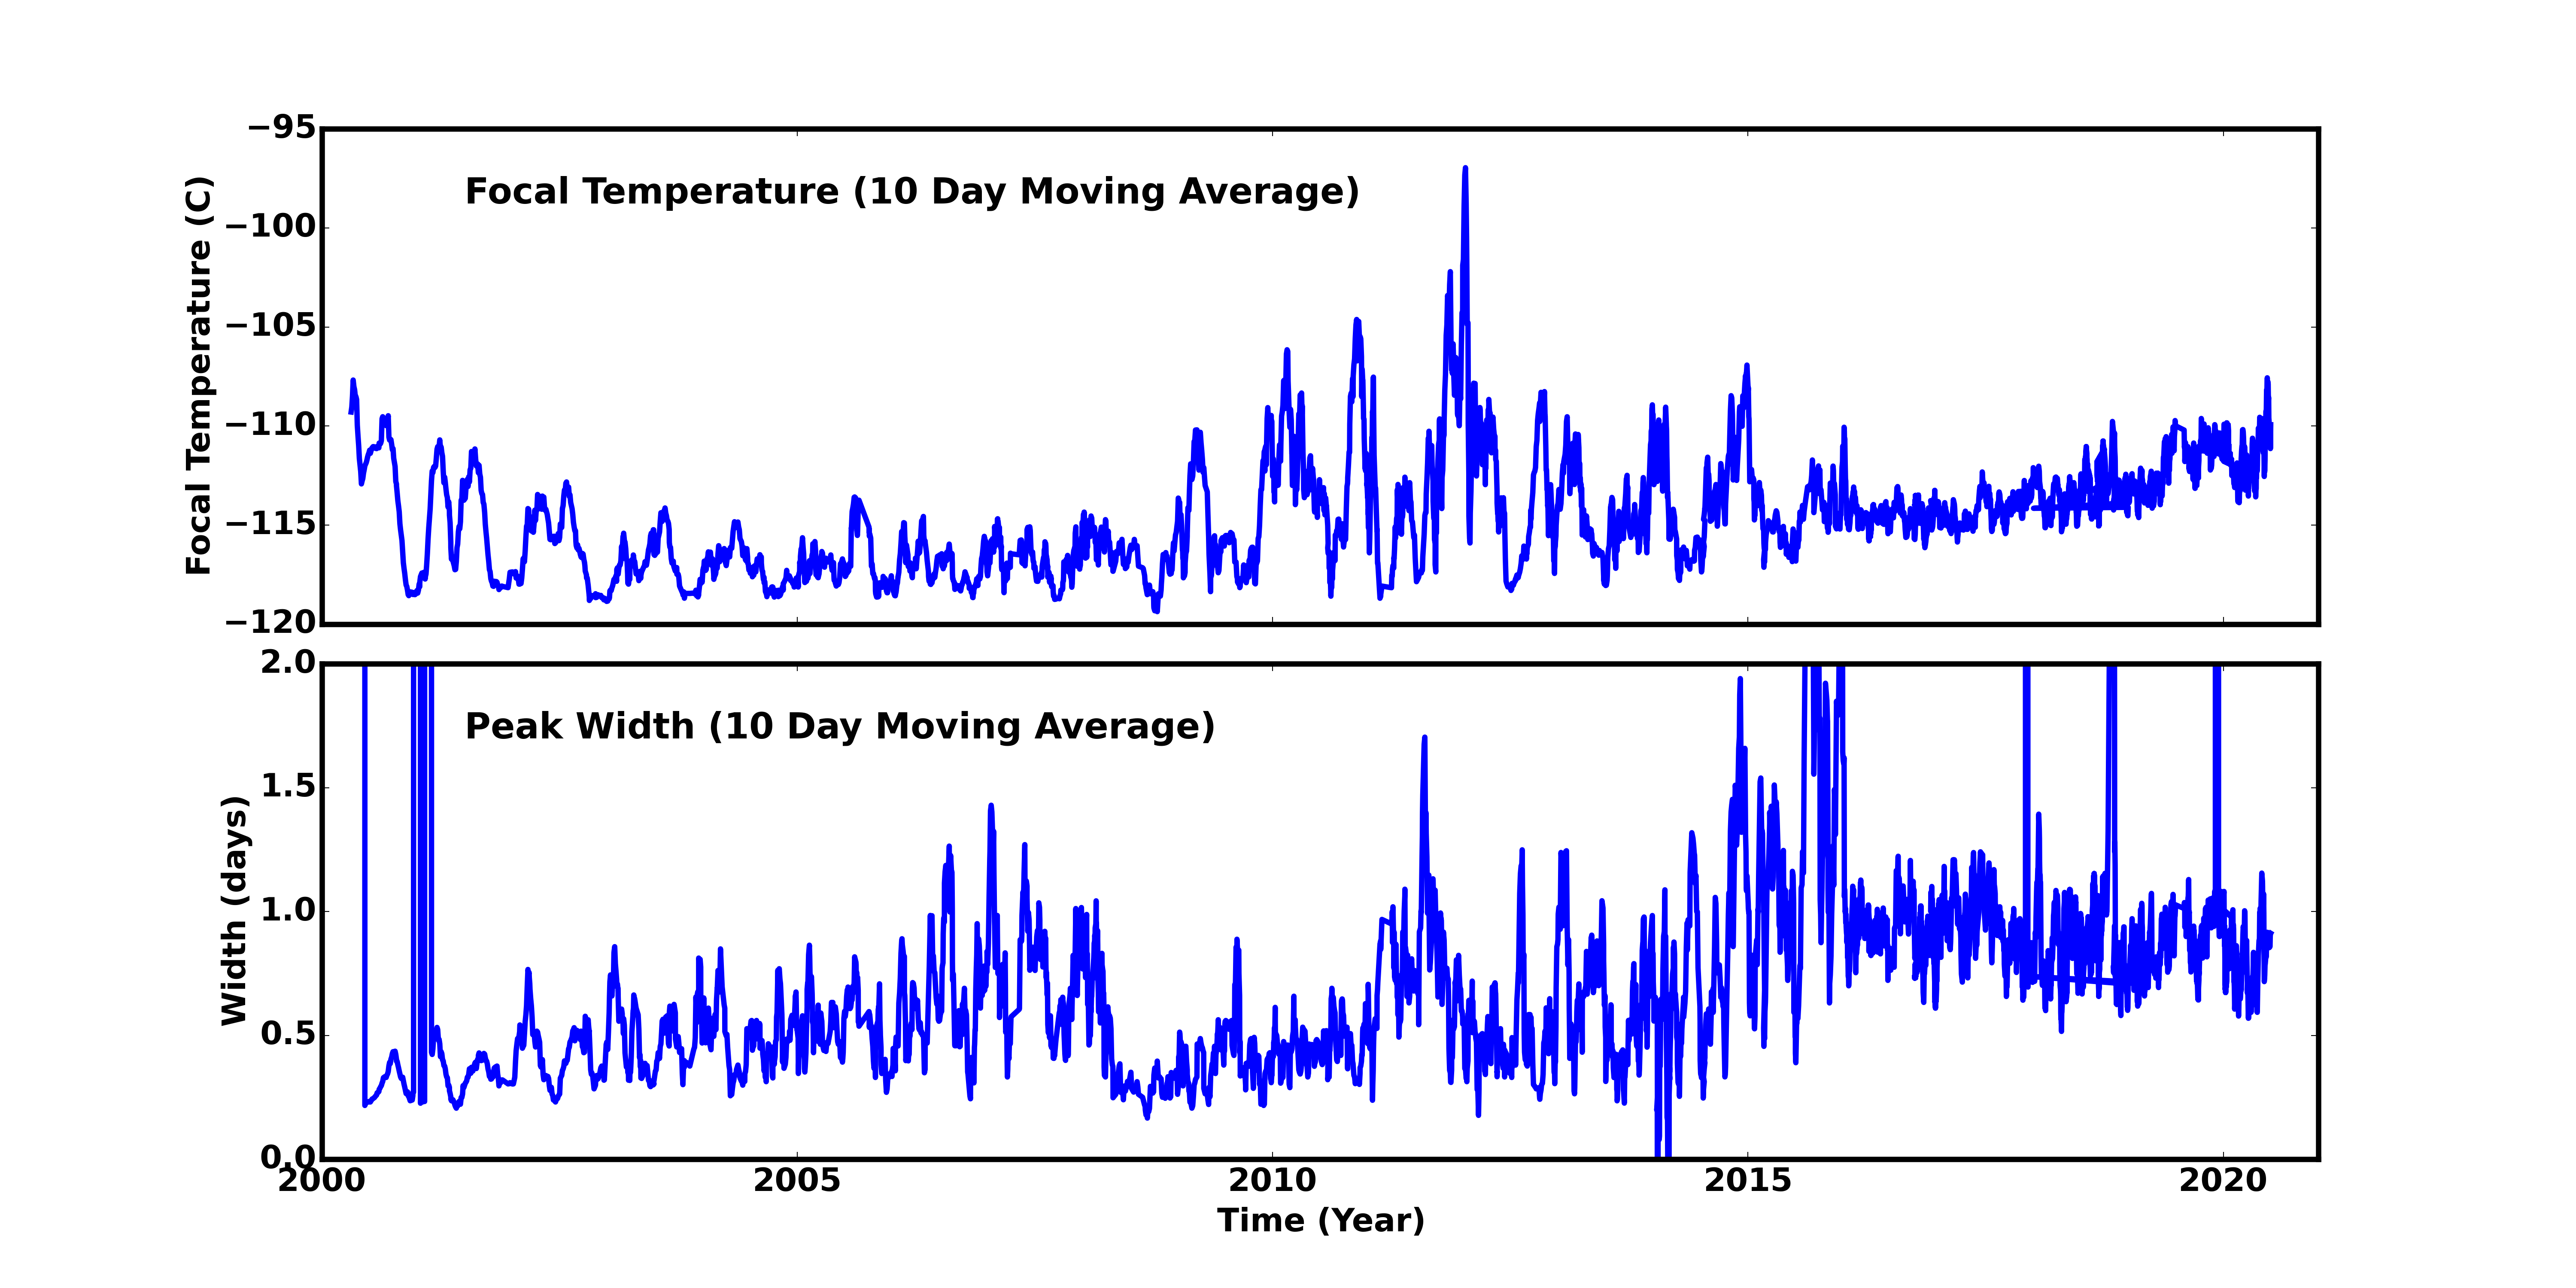
Focal Plane Temperature
Jun 2020 Focal Temperature
| The Mean (max) FPT: | |
|---|---|
| -109.61 | +/- 5.0 C |
| Mean Width: | |
| 0.88 | +/- 0.2 days |
Averaged Focal Plane Temperature
We are using 10 period moving averages to show trends of peak temperatures and peak widths. Note, the gaps in the width plot are due to missing/corrupted data.
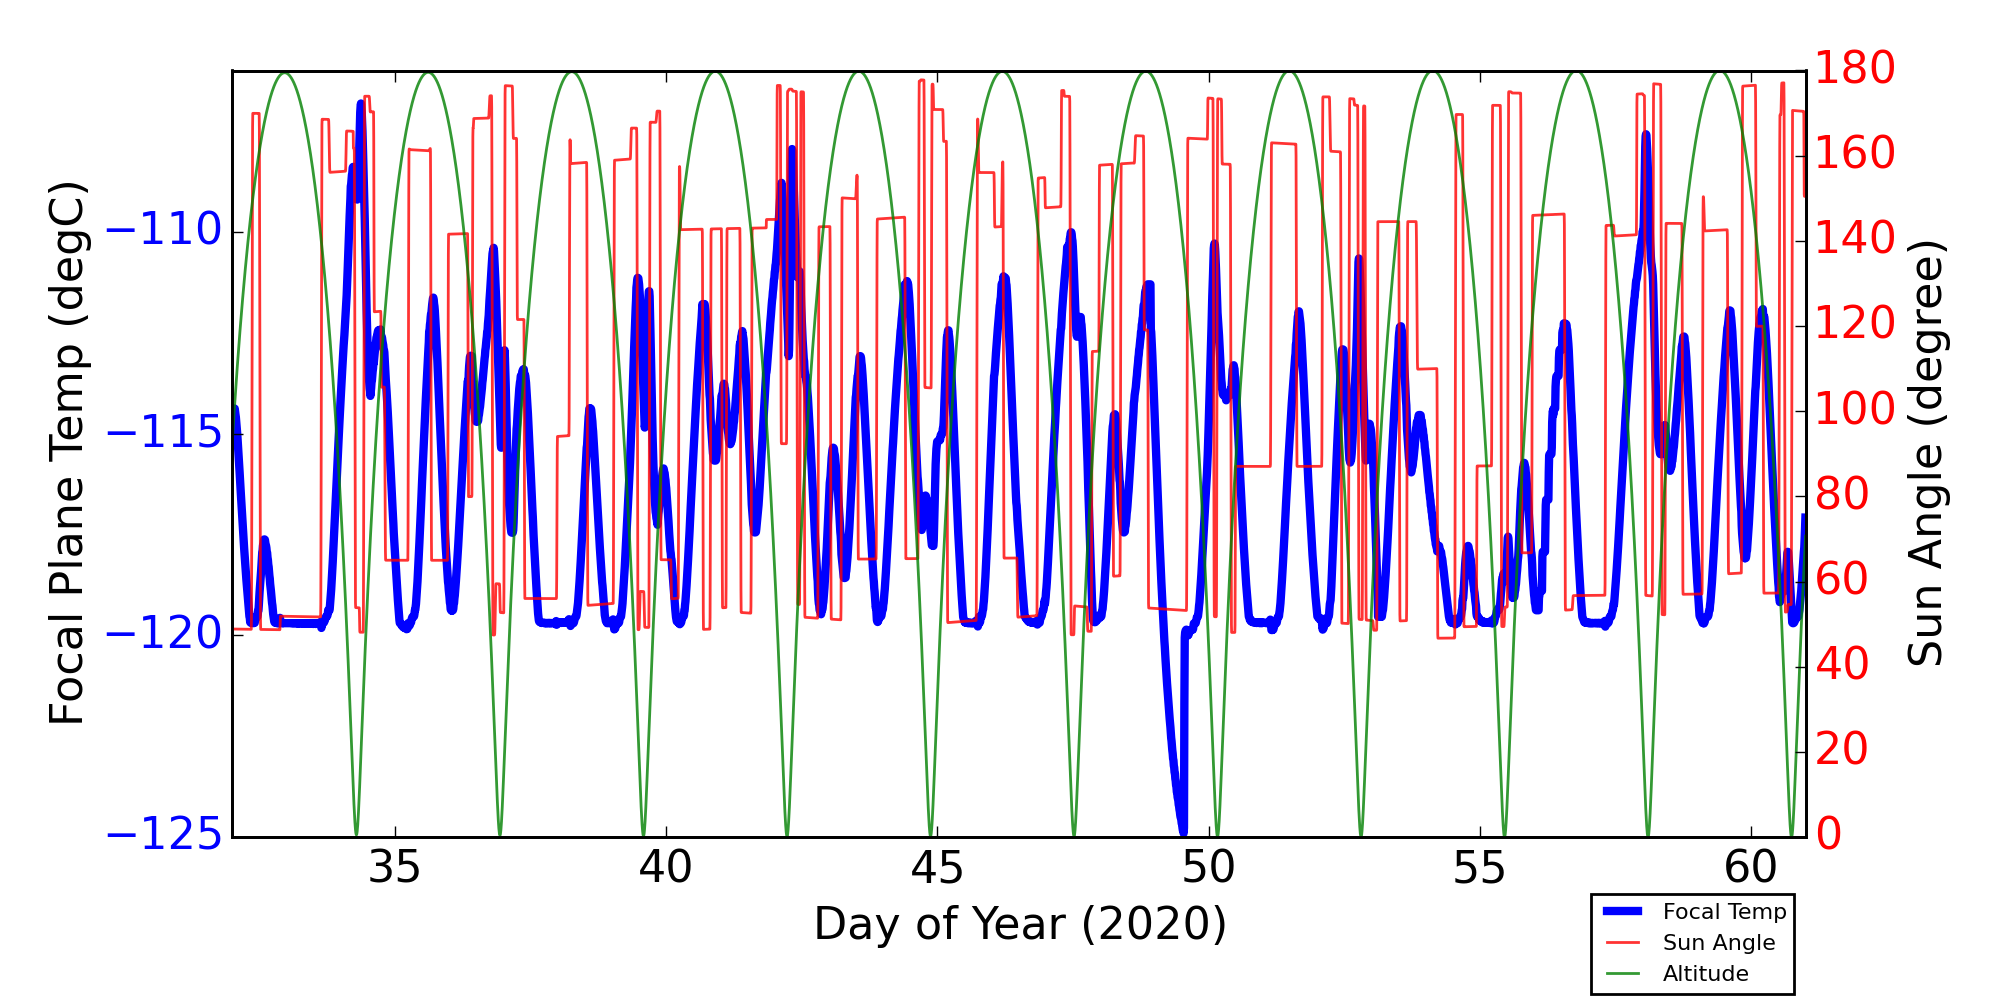
Focal Plane Temperature, Sun Angle and Altitude
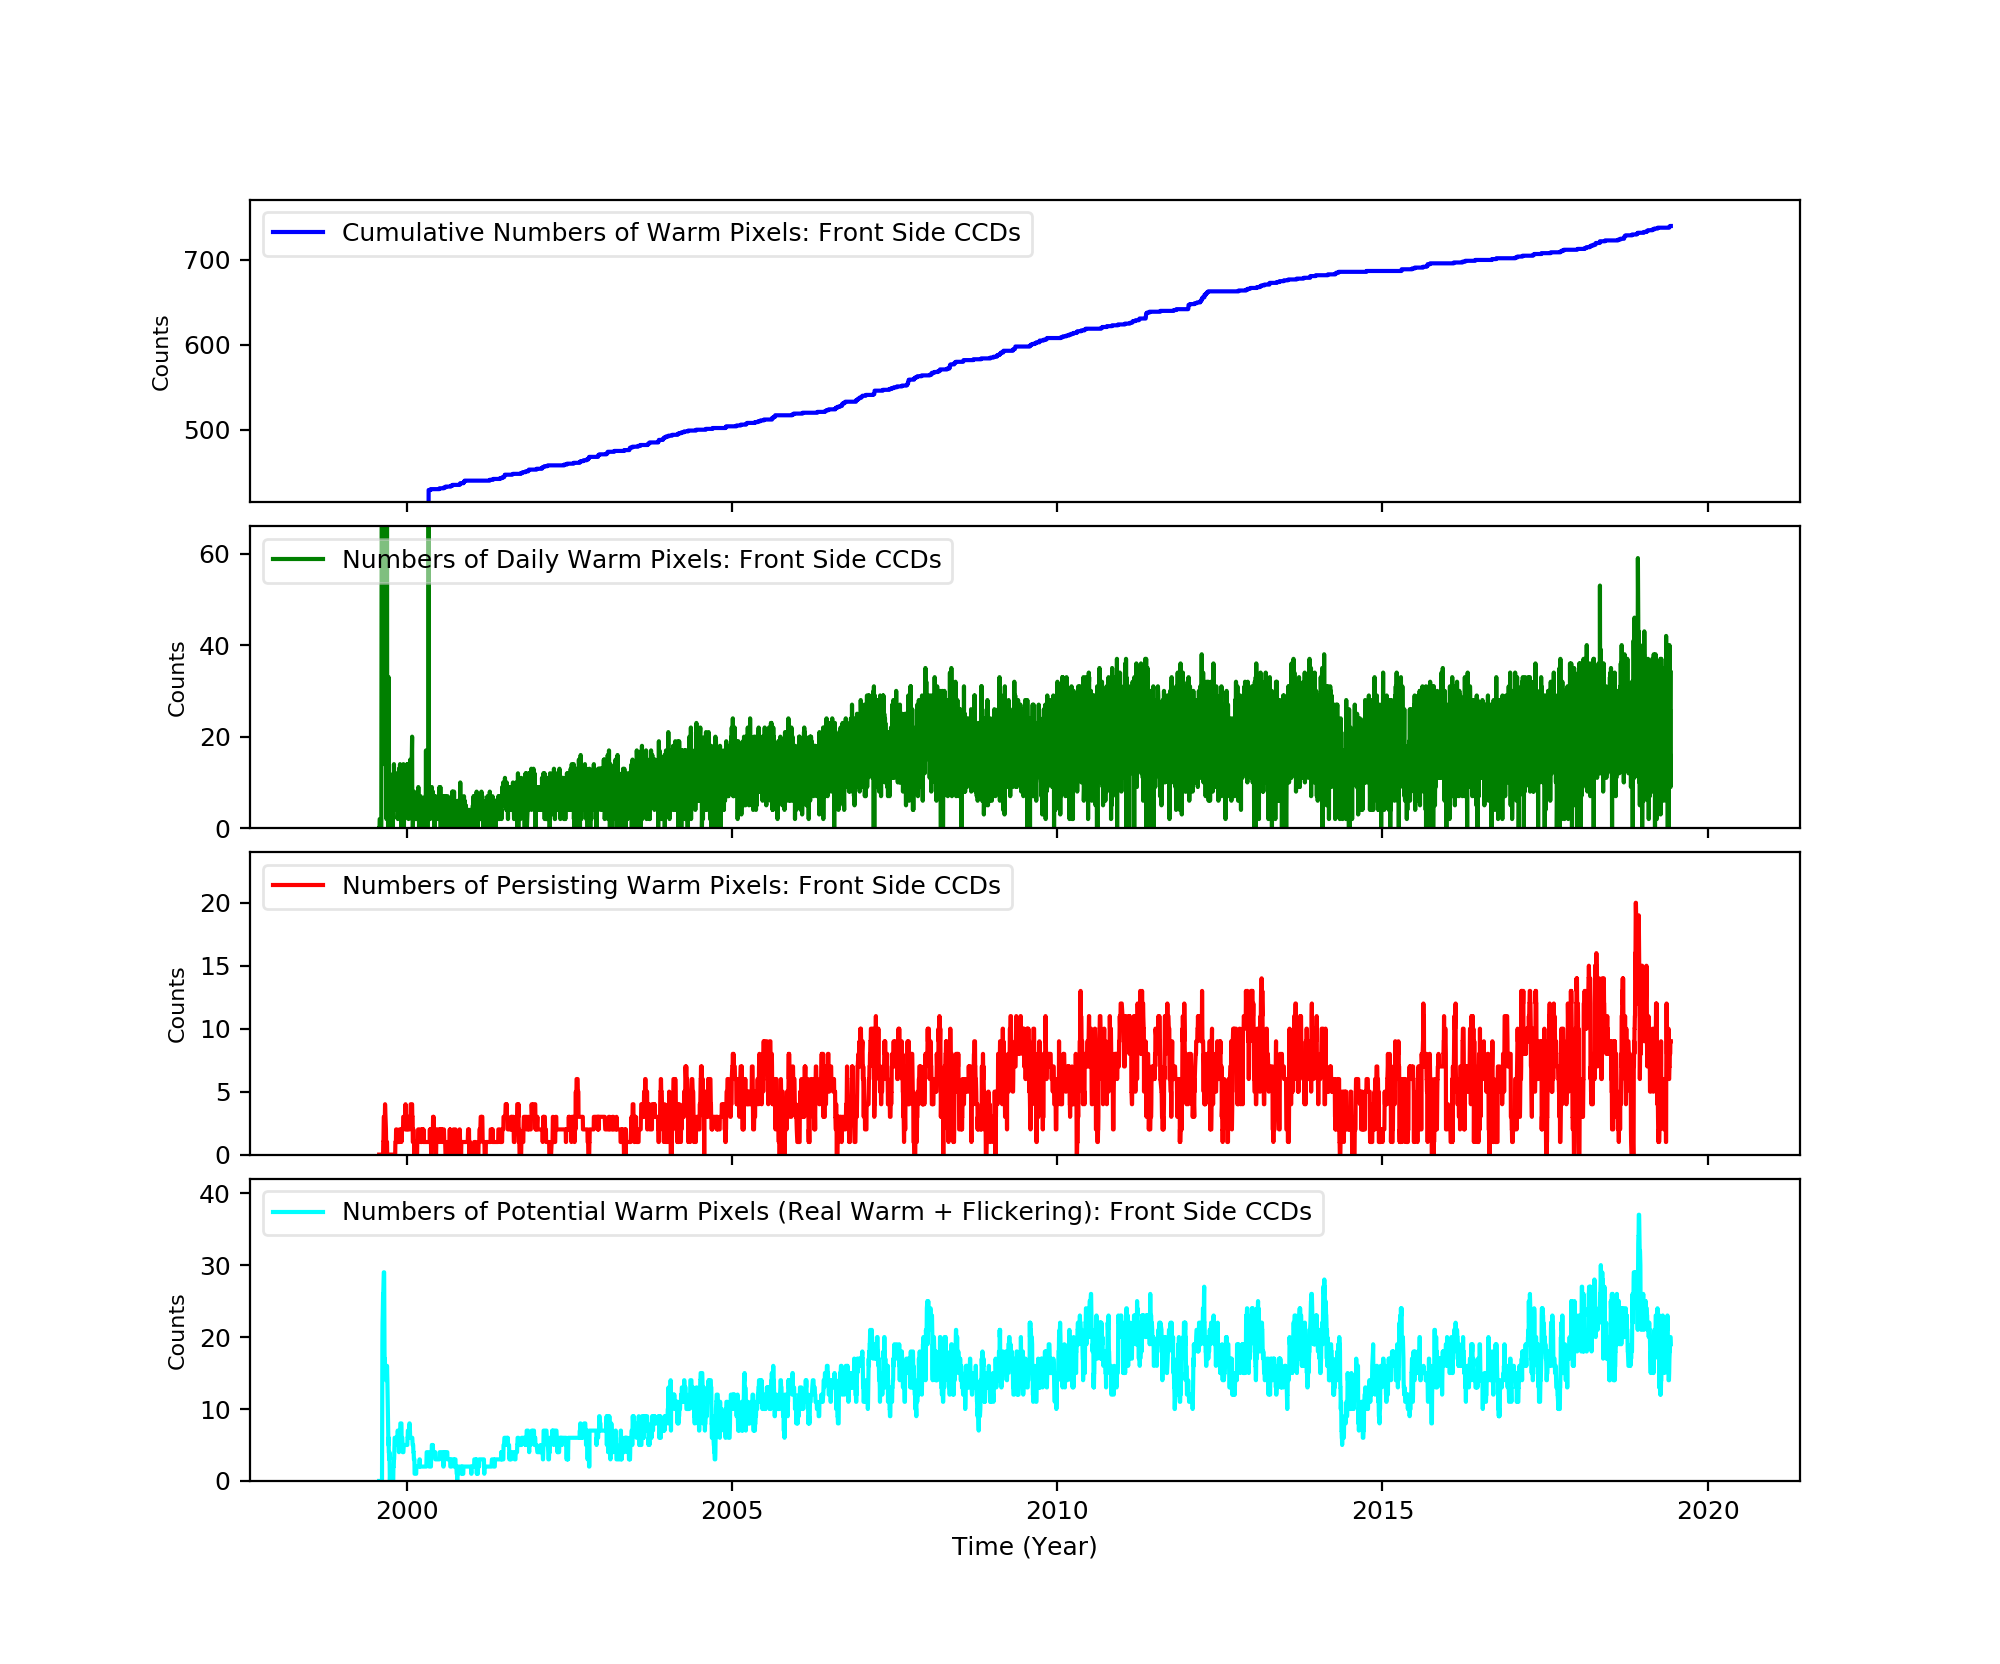
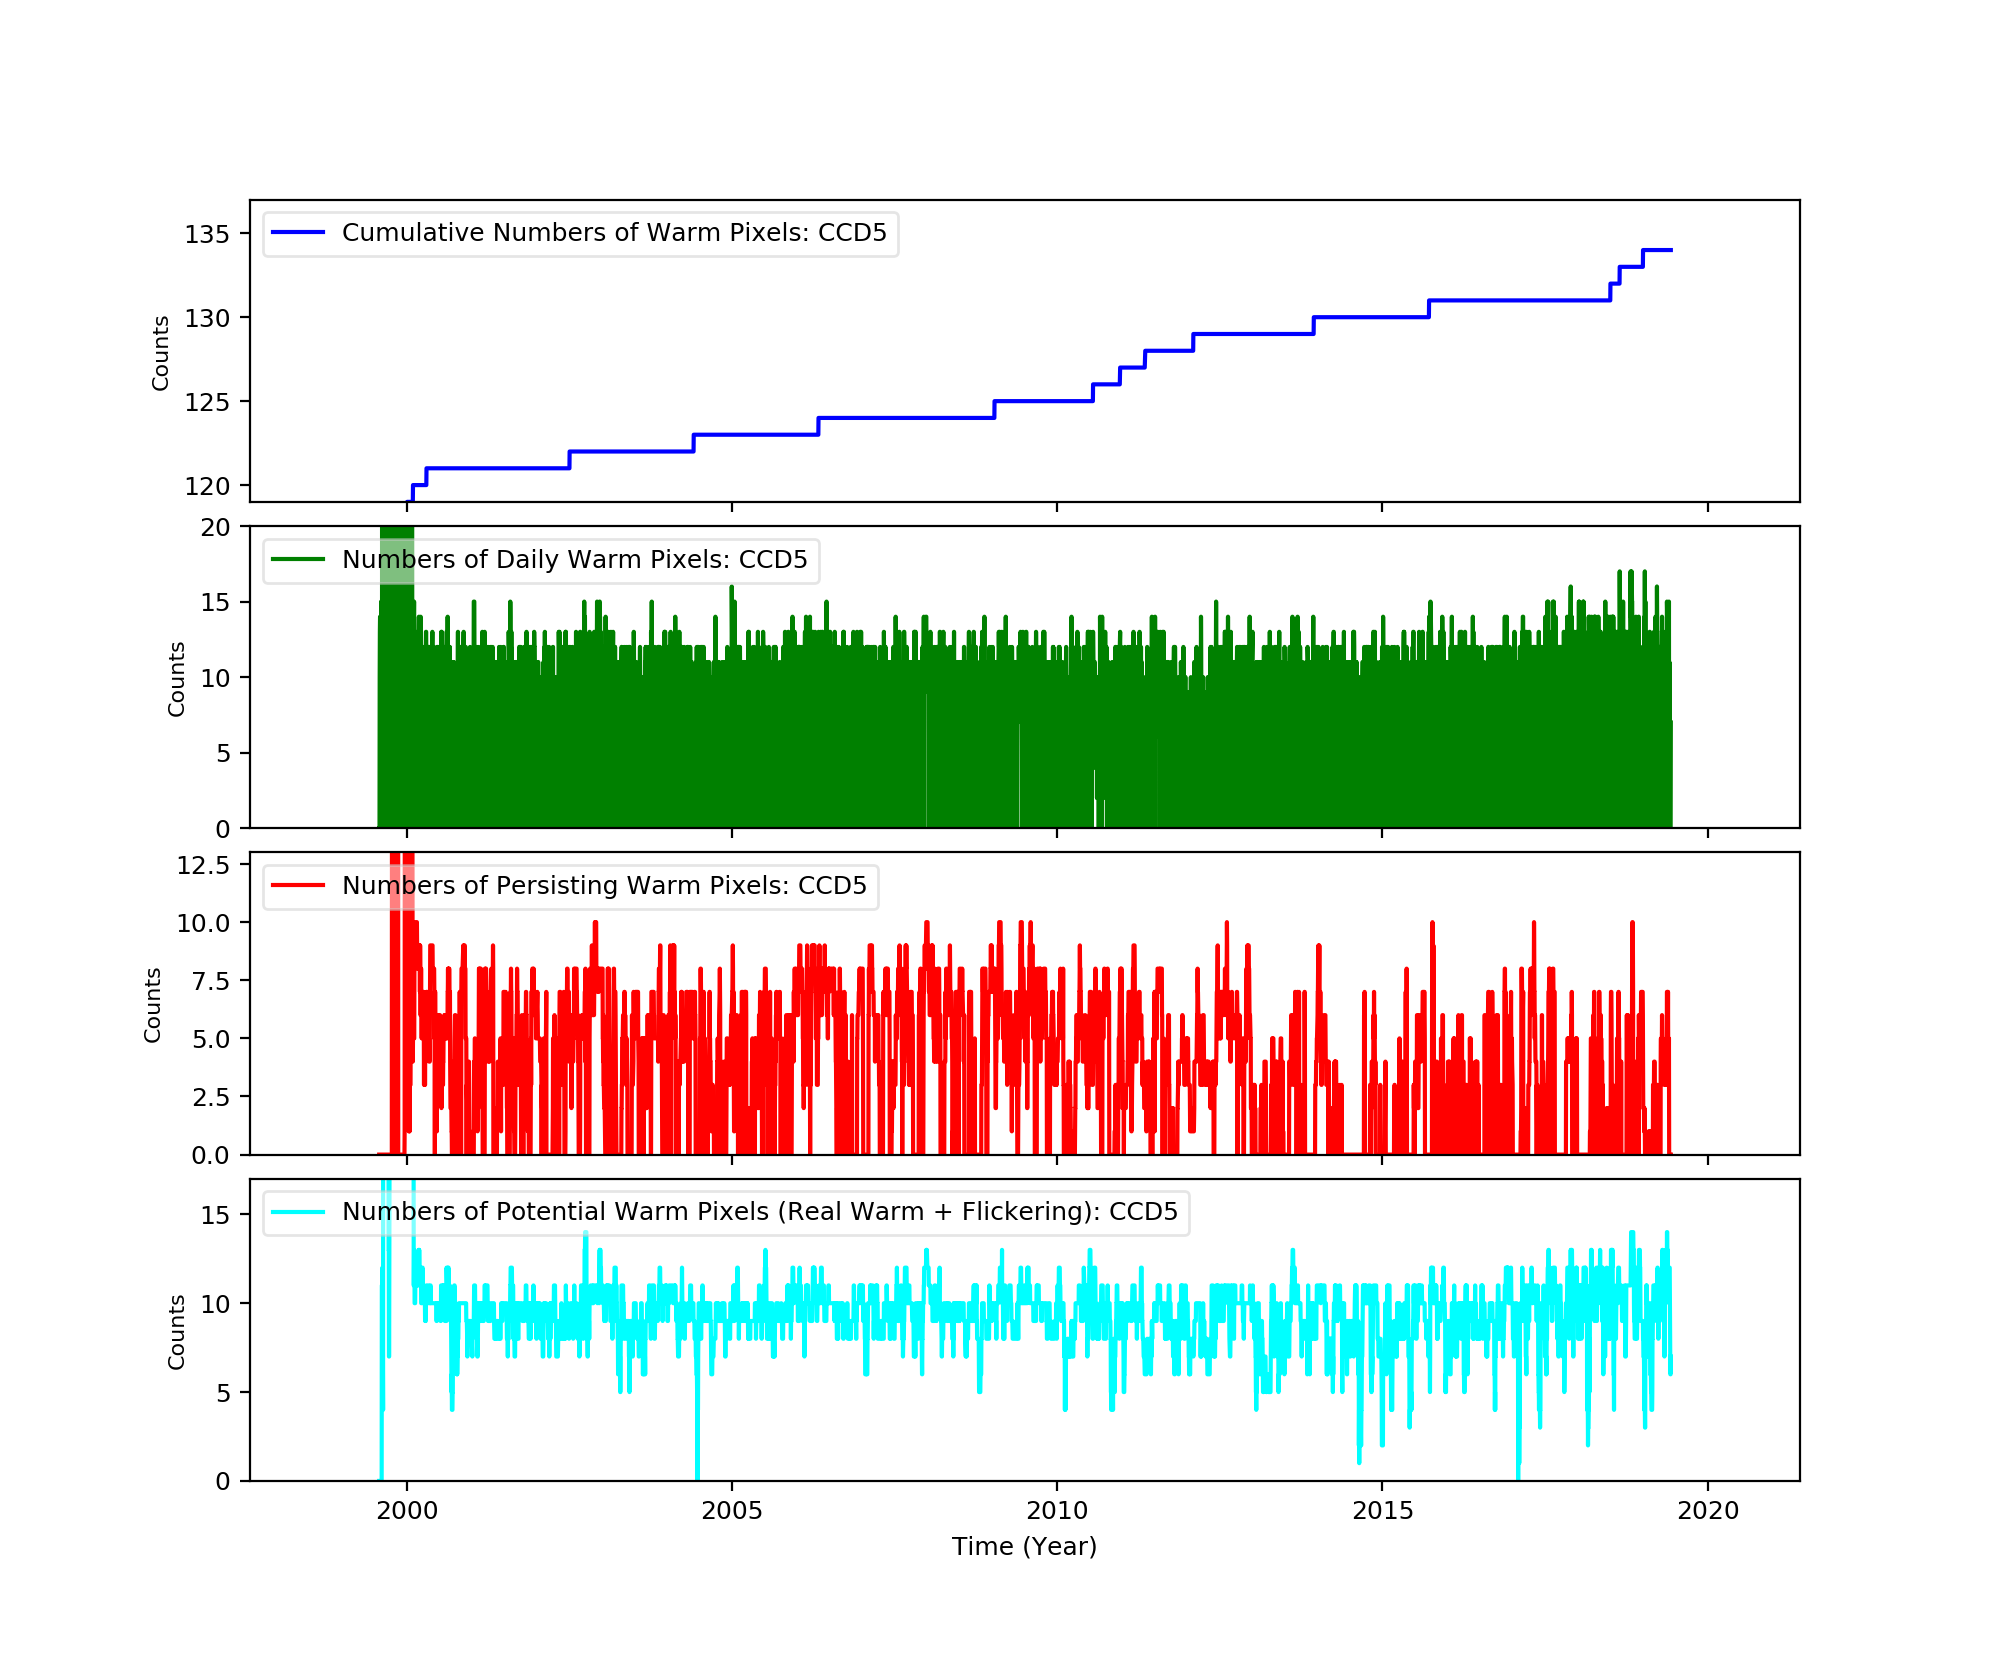
Bad Pixels
The plots below were generated with a new warm pixel finding script. Please see Acis Bad Pixel Page for details.
Front Side CCDs
Back Side CCD (CCD5)
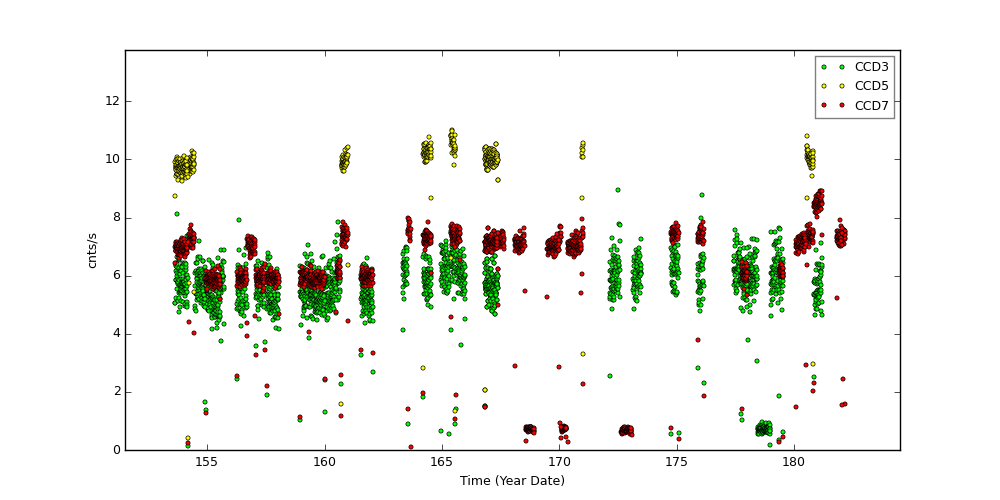
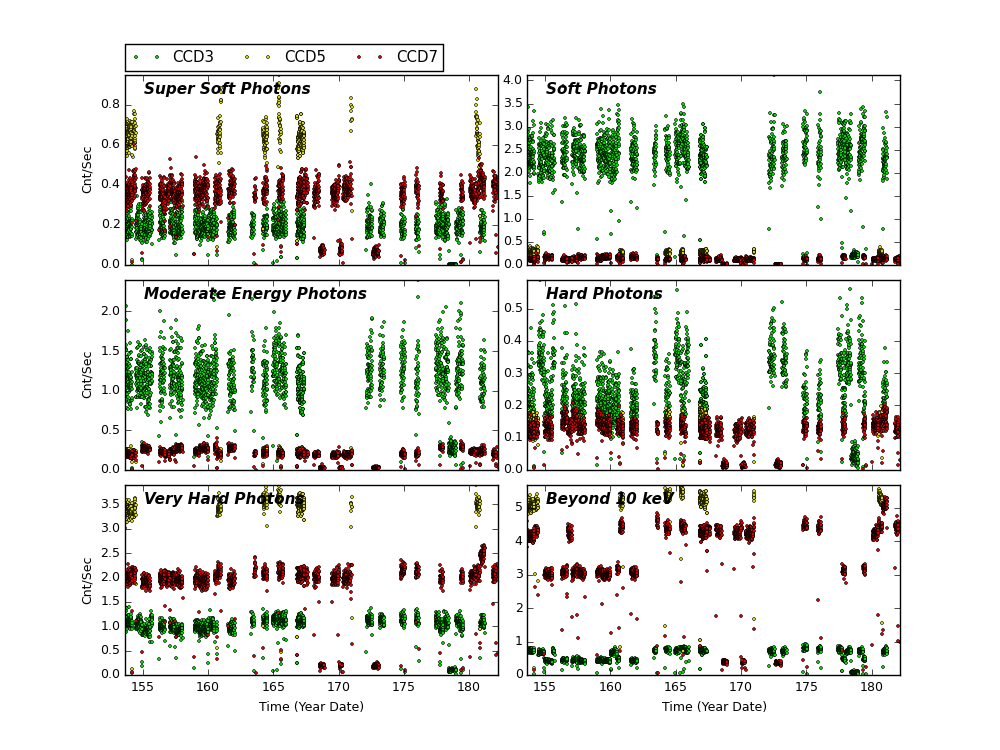
Science Instrument Background Rates
| Name | Low (keV) | High(KeV) | Description |
|---|---|---|---|
| SSoft | 0.00 | 0.50 | Super soft photons |
| Soft | 0.50 | 1.00 | Soft photons |
| Med | 1.00 | 3.00 | Moderate energy photons |
| Hard | 3.00 | 5.00 | Hard Photons |
| Harder | 5.00 | 10.00 | Very Hard photons |
| Hardest | 10.00 | Beyond 10 keV |
HRC
DOSE of Central 4K Pore-Pairs
Please refer to Maximum Dose Trends for more details.
)
|
|---|
IMAGE                NPIX      MEAN    STDDEV      MIN       MAX
HRCI_06_2020.fits  16777216	0.012 	0.113 	0.000 	10.000
)
IMAGE                       NPIX      MEAN    STDDEV      MIN       MAX
HRCI_08_1999_06_2020.fits  16777216	6.437 	6.037 	0.000 	306.000
)
|
|---|
IMAGE                NPIX      MEAN    STDDEV      MIN       MAX
HRCS_06_2020.fits  16777216	0.004 	0.065 	0.000 	3.000
)
IMAGE                       NPIX      MEAN    STDDEV      MIN       MAX
HRCS_08_1999_06_2020.fits  16777216	19.027 	34.214 	0.000 	1750.000
|
|
Max dose trend plots corrected for events that "pile-up"
in the center of the taps due to bad position information.
|
)
|
)
|
)
|
)
|
| Mar 2020 | Dec 2019 | Sep 2019 | Jun 2019 |
|---|
)
|
)
|
)
|
)
|
| Mar 2020 | Dec 2019 | Sep 2019 | Jun 2019 |
|---|
Gratings
Grating Trends/Focus
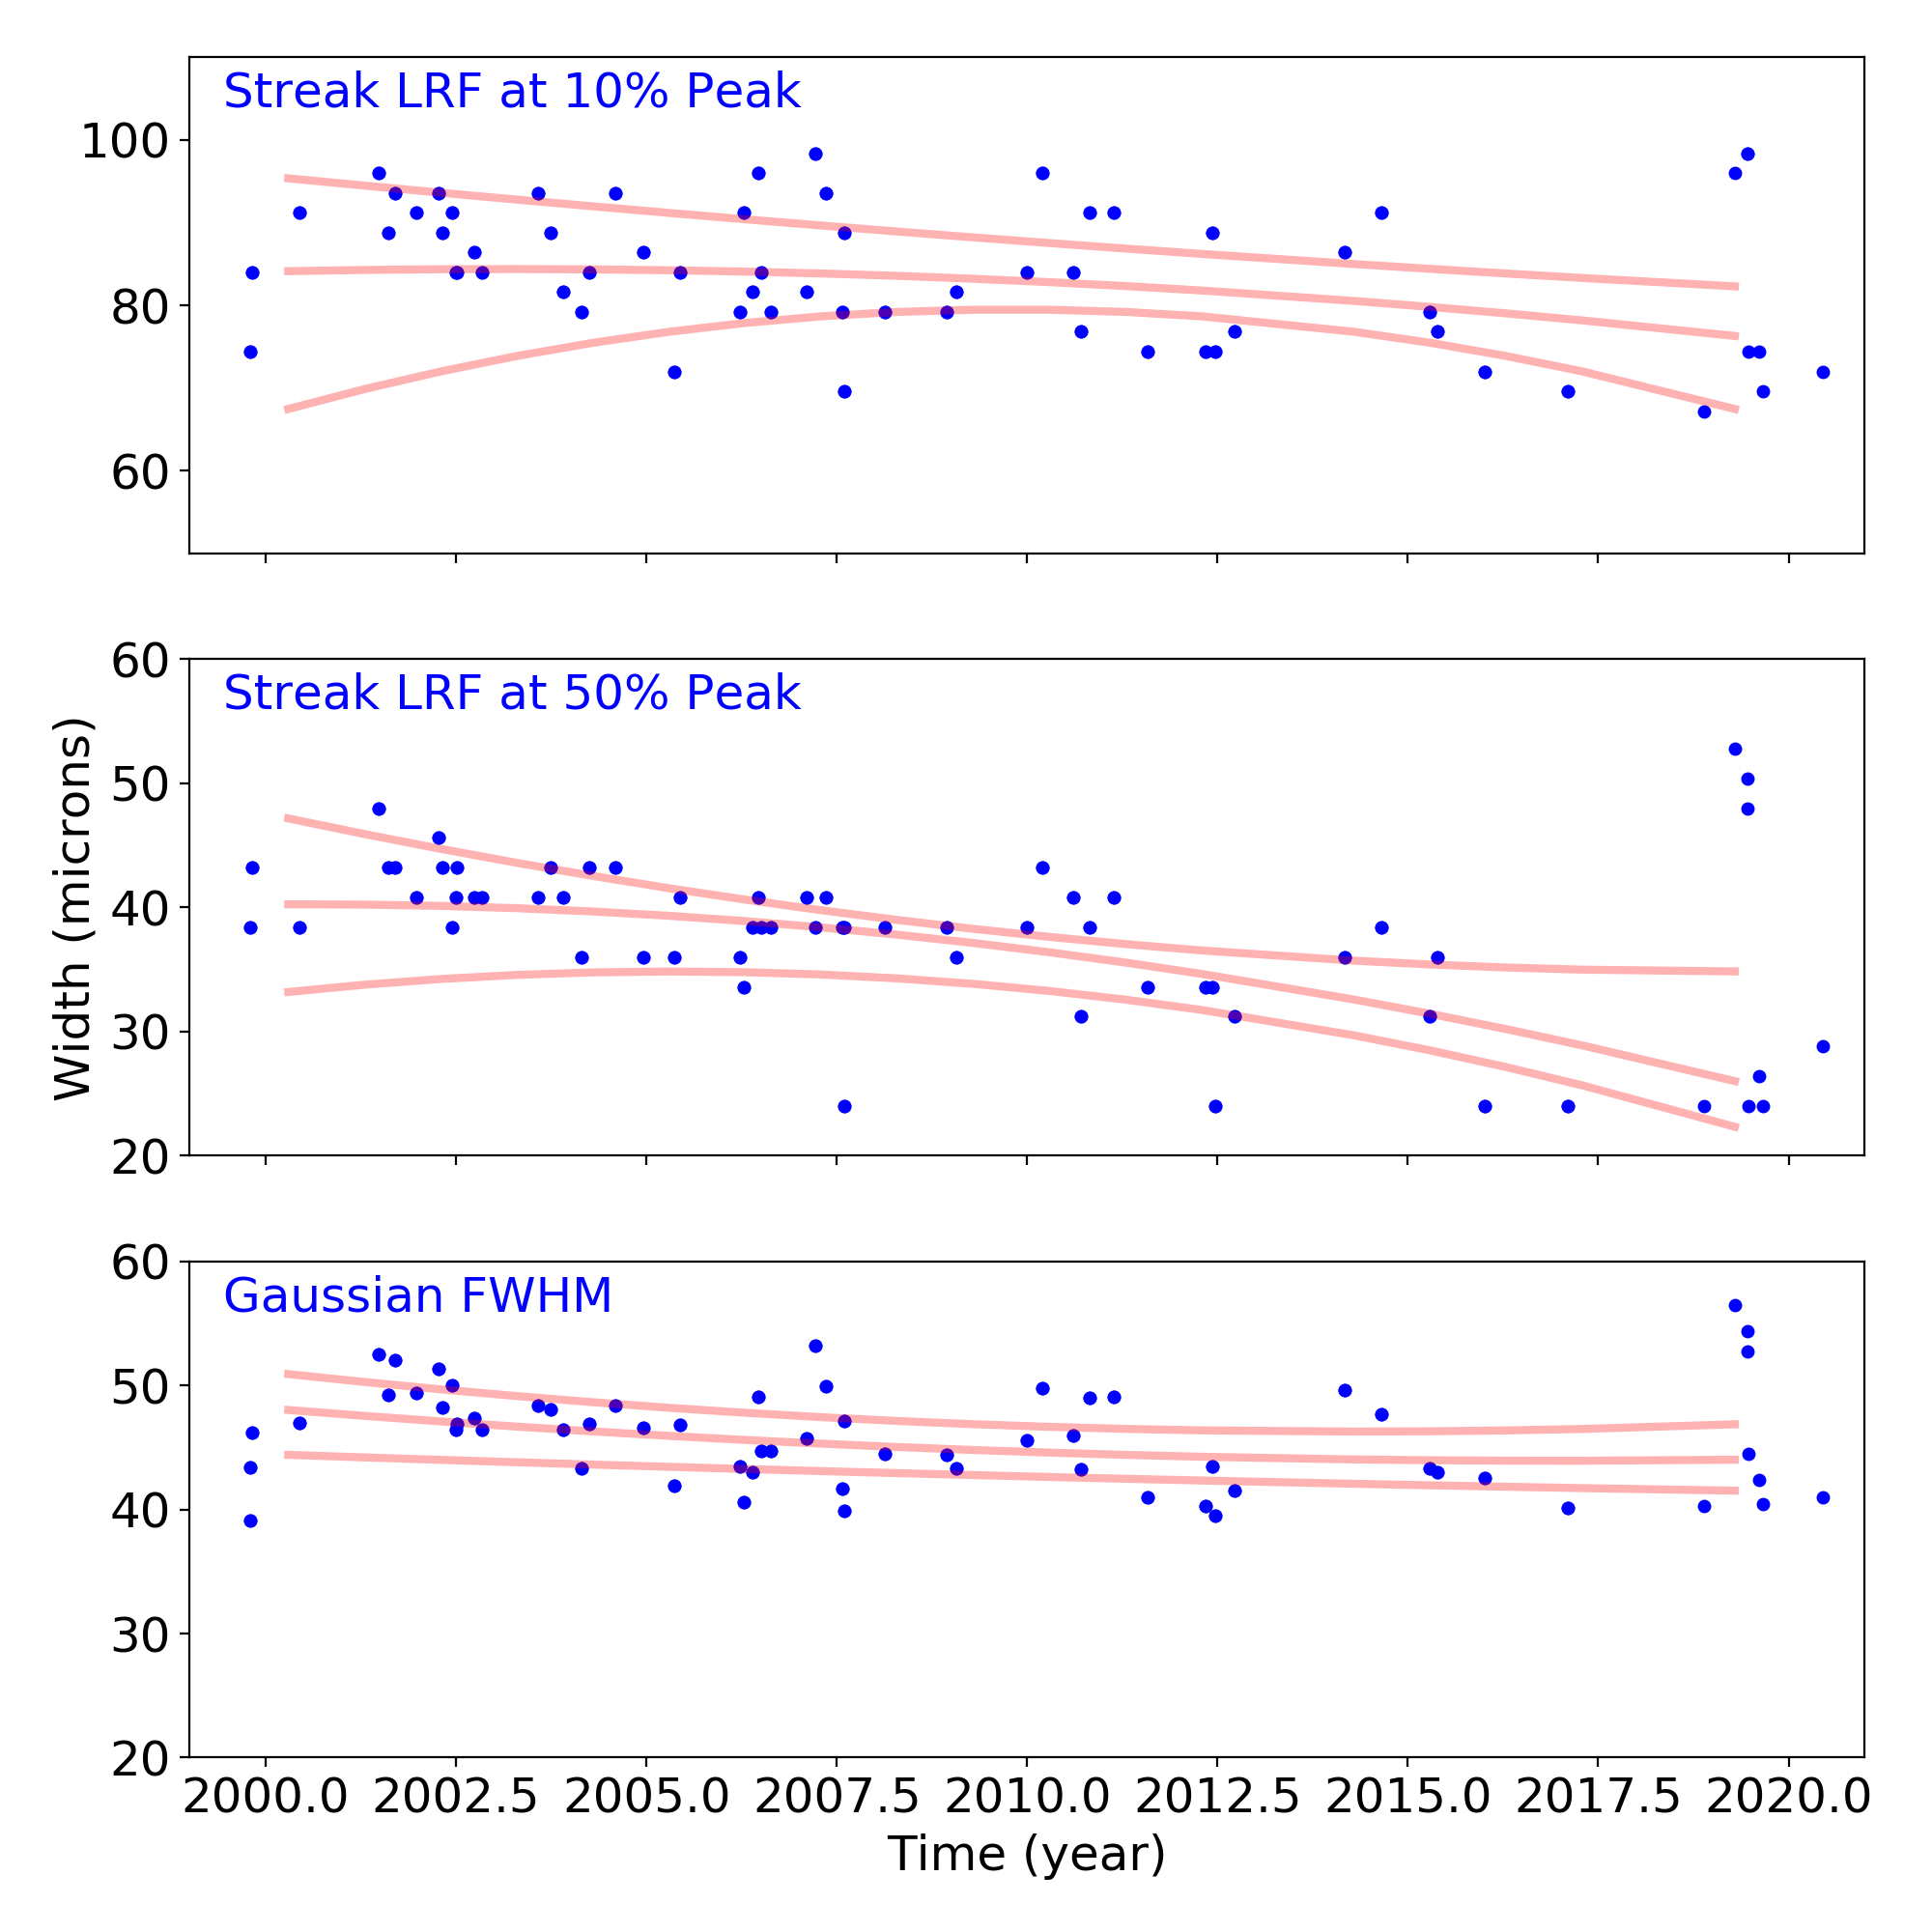
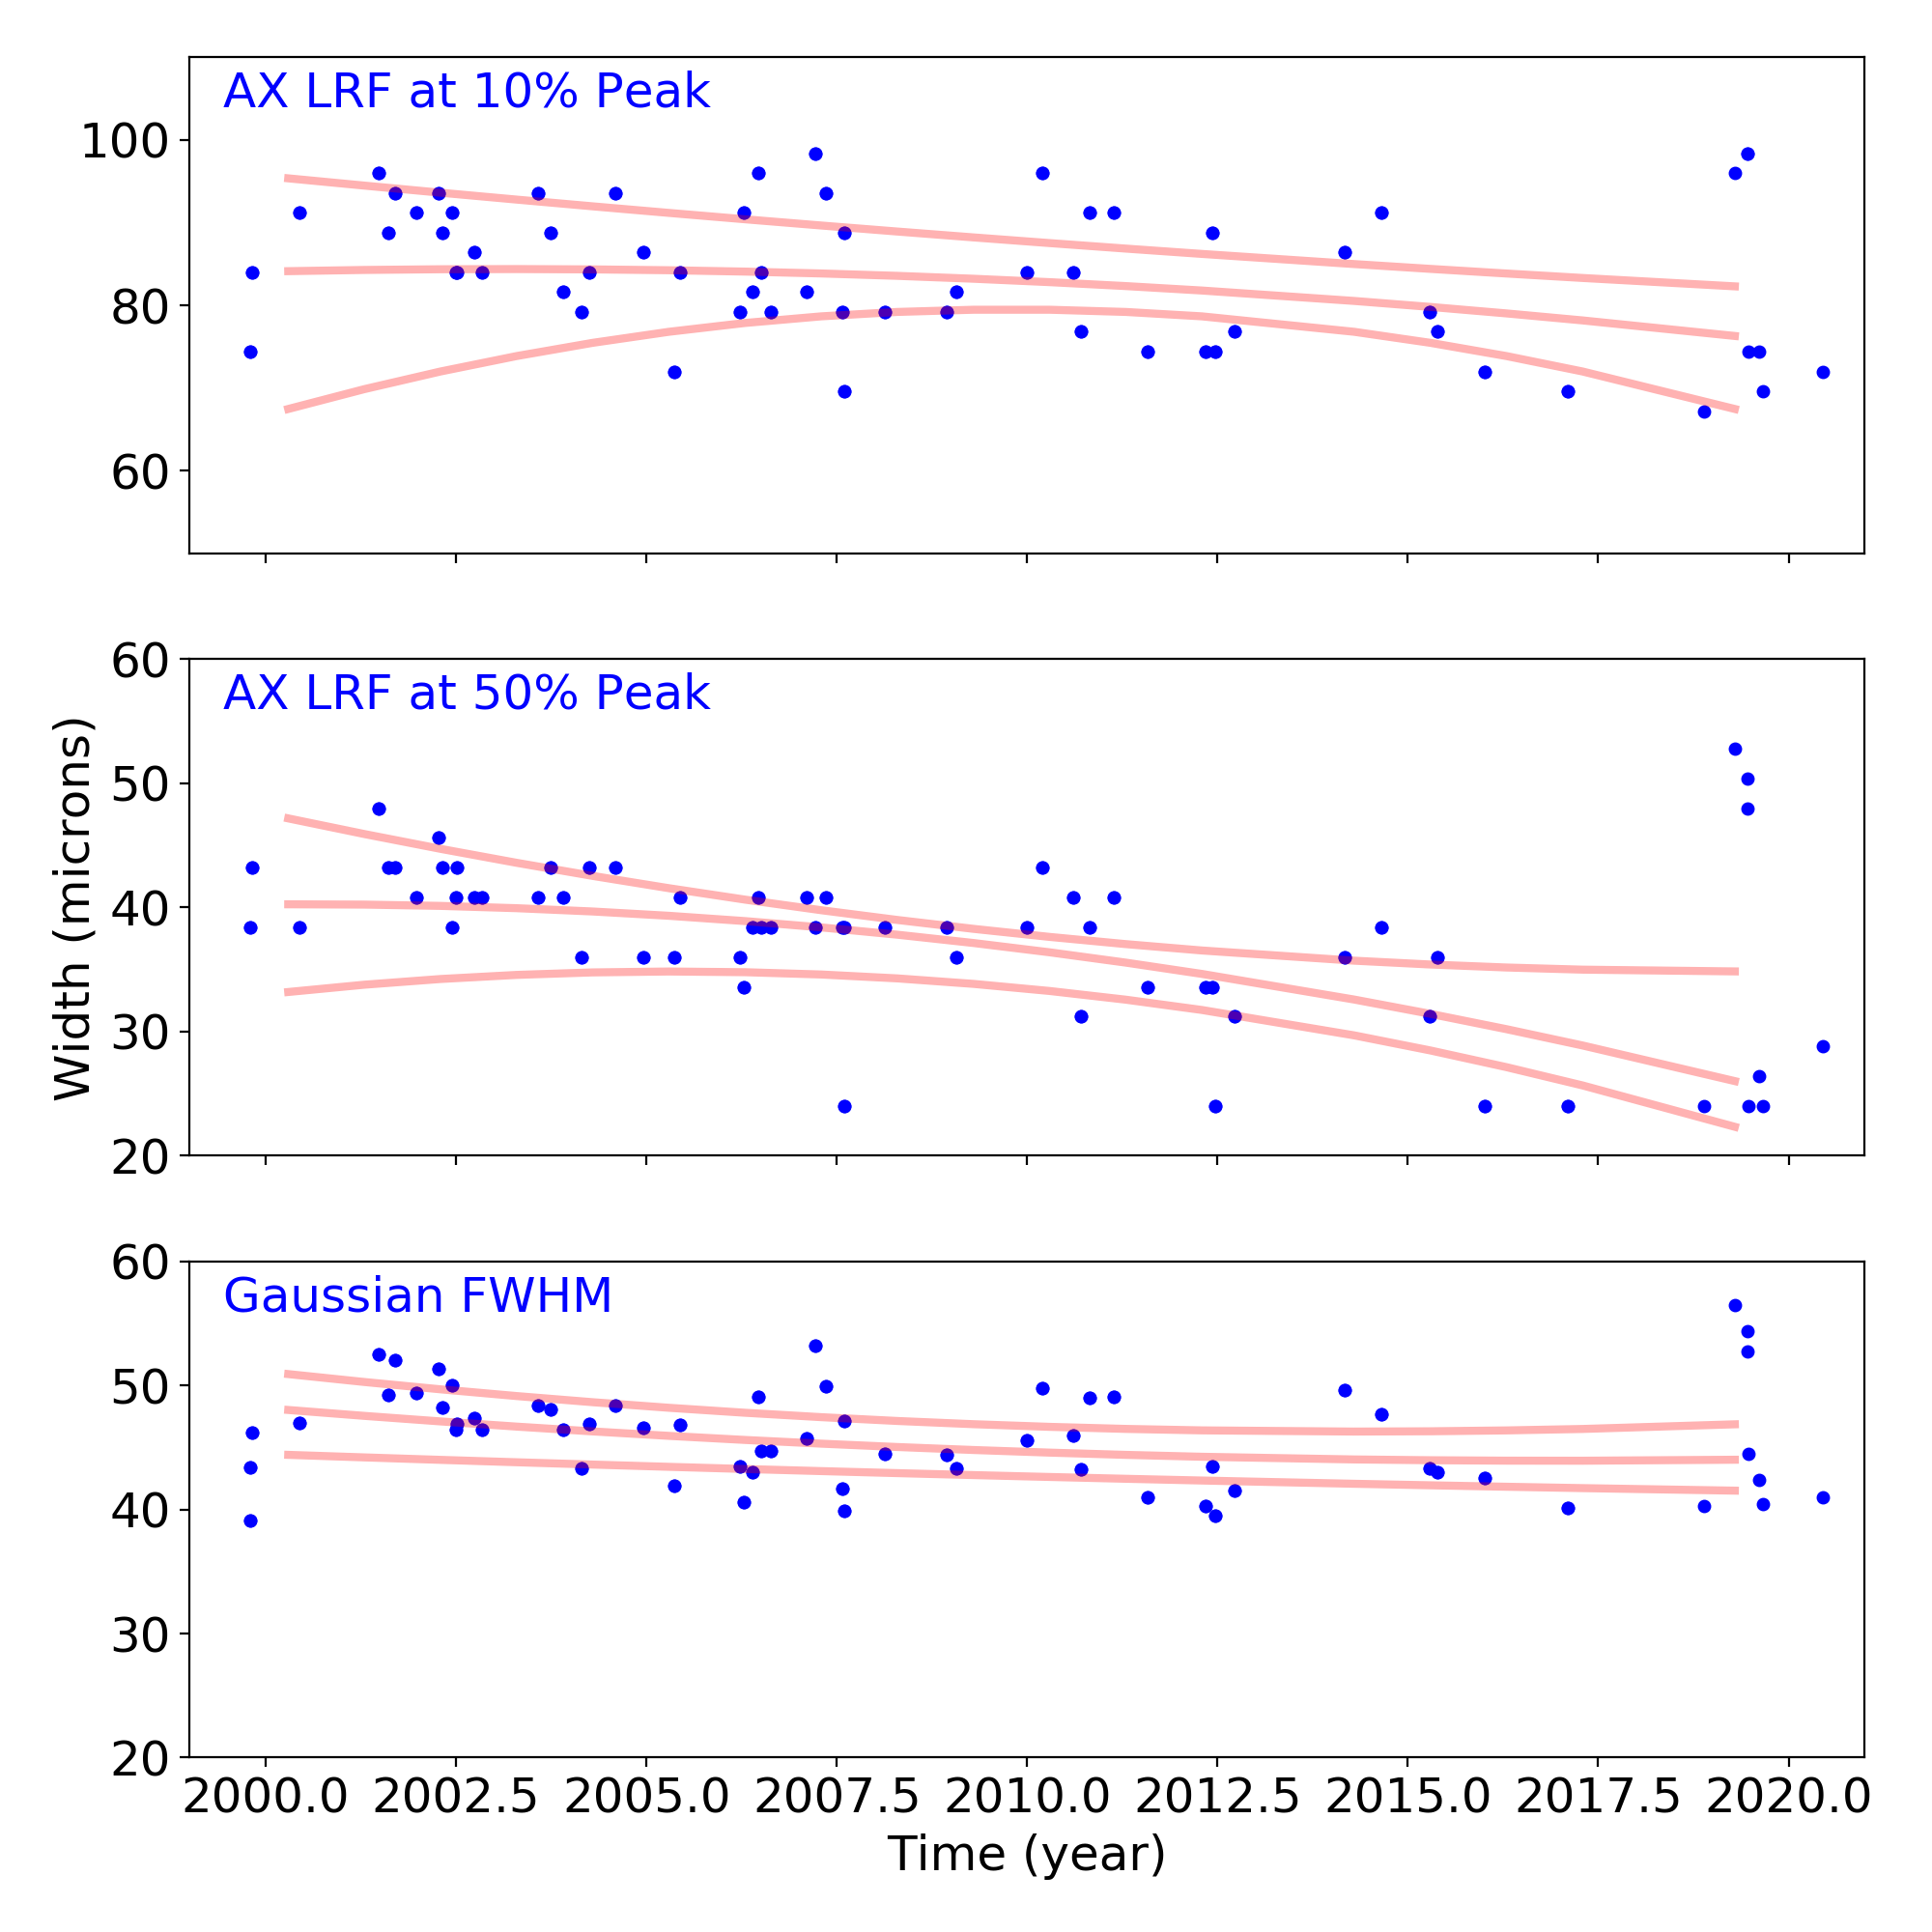
We plot the width of the zero order streak of ACIS/HETG observations and the width of the zero order image for HRC/LETG observations of point sources. No significant defocusing trend is seen at this time. See Gratings Trends pages.
PCAD
ACA Trending
| ACIS |
)
|
)
|
)
|
|
|---|---|---|---|---|
)
|
)
|
)
| ||
| HRCI |
)
|
)
|
)
|
)
|
| HRCI |
)
|
)
|
)
|
)
|
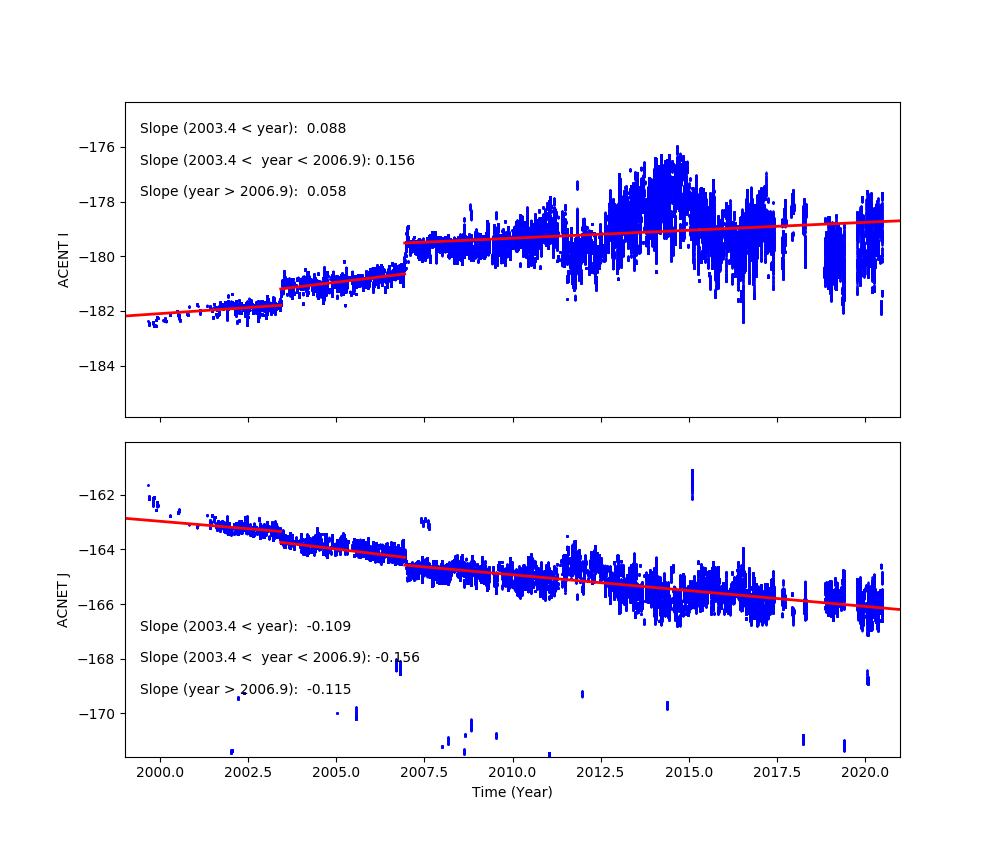
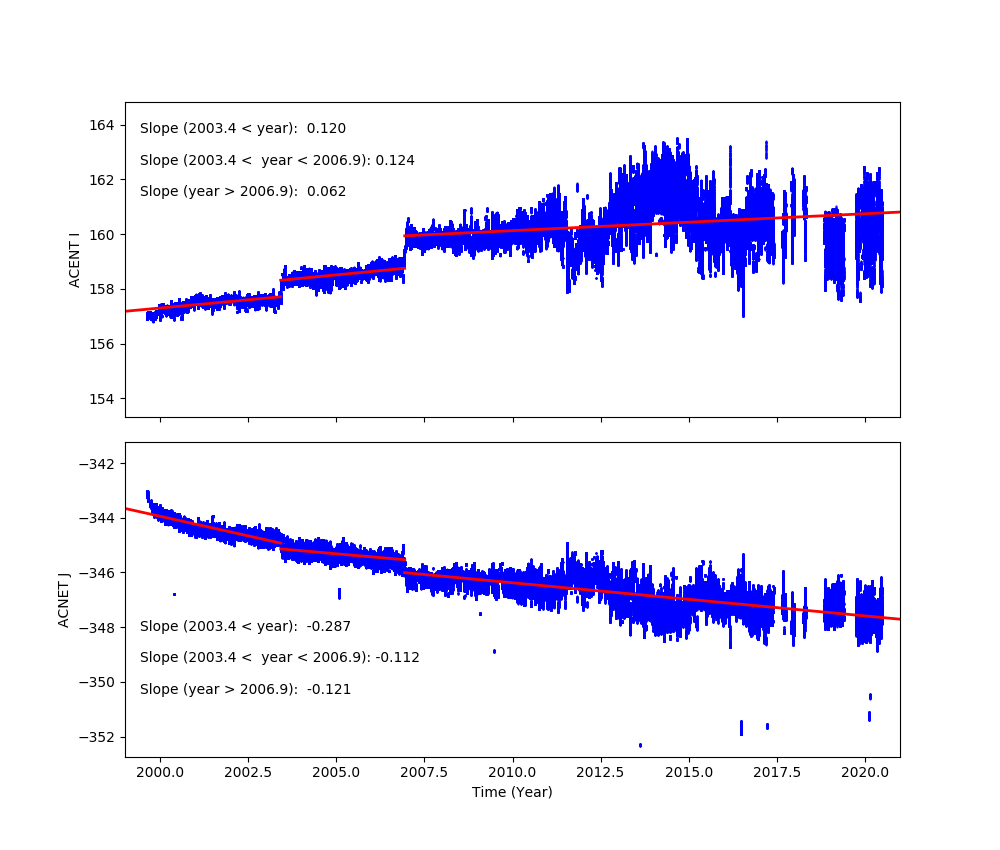
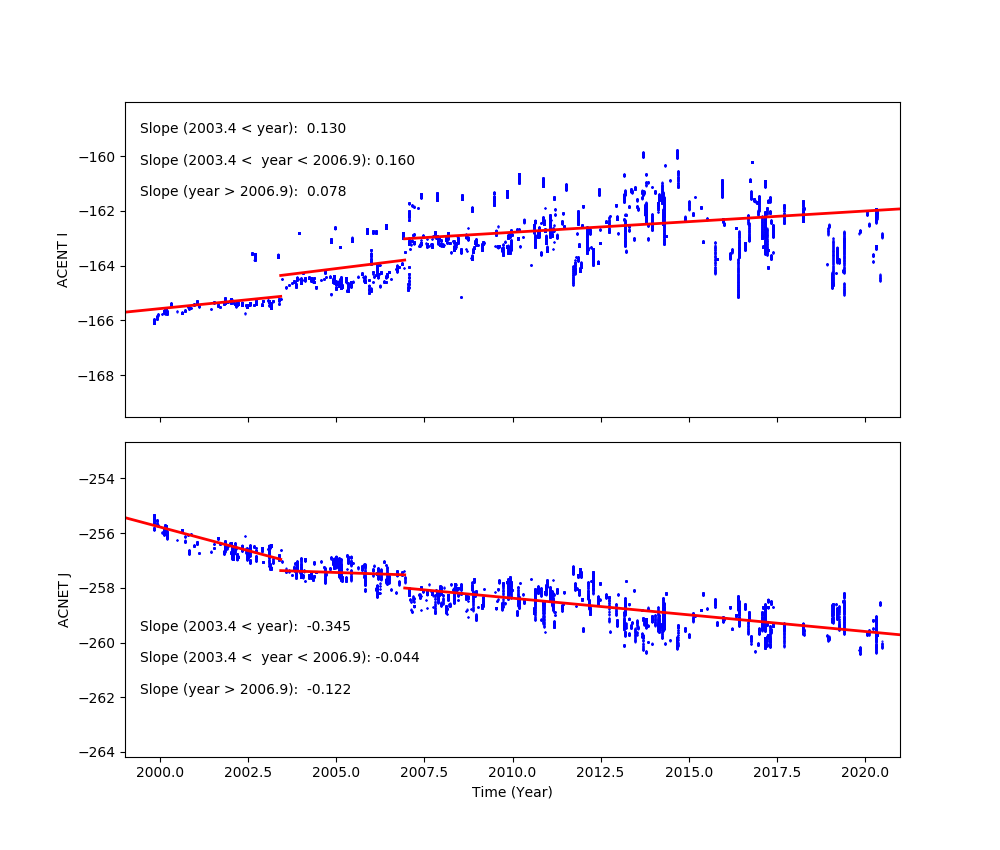
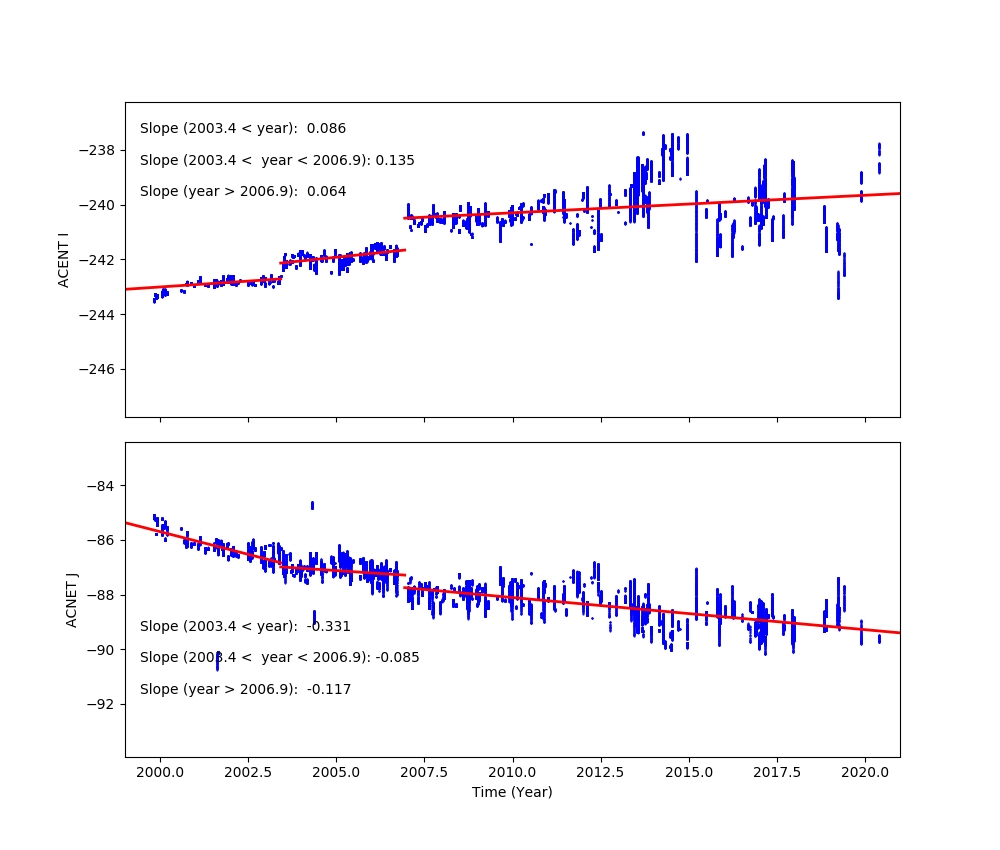
Fid Light Drift
Fid light positions on ACA drift with time. The drift trends of Fid light 2 with ACIS-I and ACIS-S configurations are shown below.
The top panel shows Fid light 2 drift in ACENT I (app. along with -Y axis), and the
bottom panel shows that in ACENT J (app. along with Z axis). The unit is a pixel, and
one pixel is approximately 0.5 arcsec. The slope listed at the top right corner is
the change in a position per year (arcsec/yr). The vertical line on DOM = 1411 (Jun 1, 2003)
indicates a transition date of use of IRU-1 to IRU-2.
See also Tom Aldcroft's updated page:
https://cxc.cfa.harvard.edu/mta/ASPECT/fid_drift
Fid 2 (ACIS-I)
Fid 2 (ACIS-S)
Fid 8 (HRC-I)
Fid 12 (HRC-S)
Gyro Bias Drift

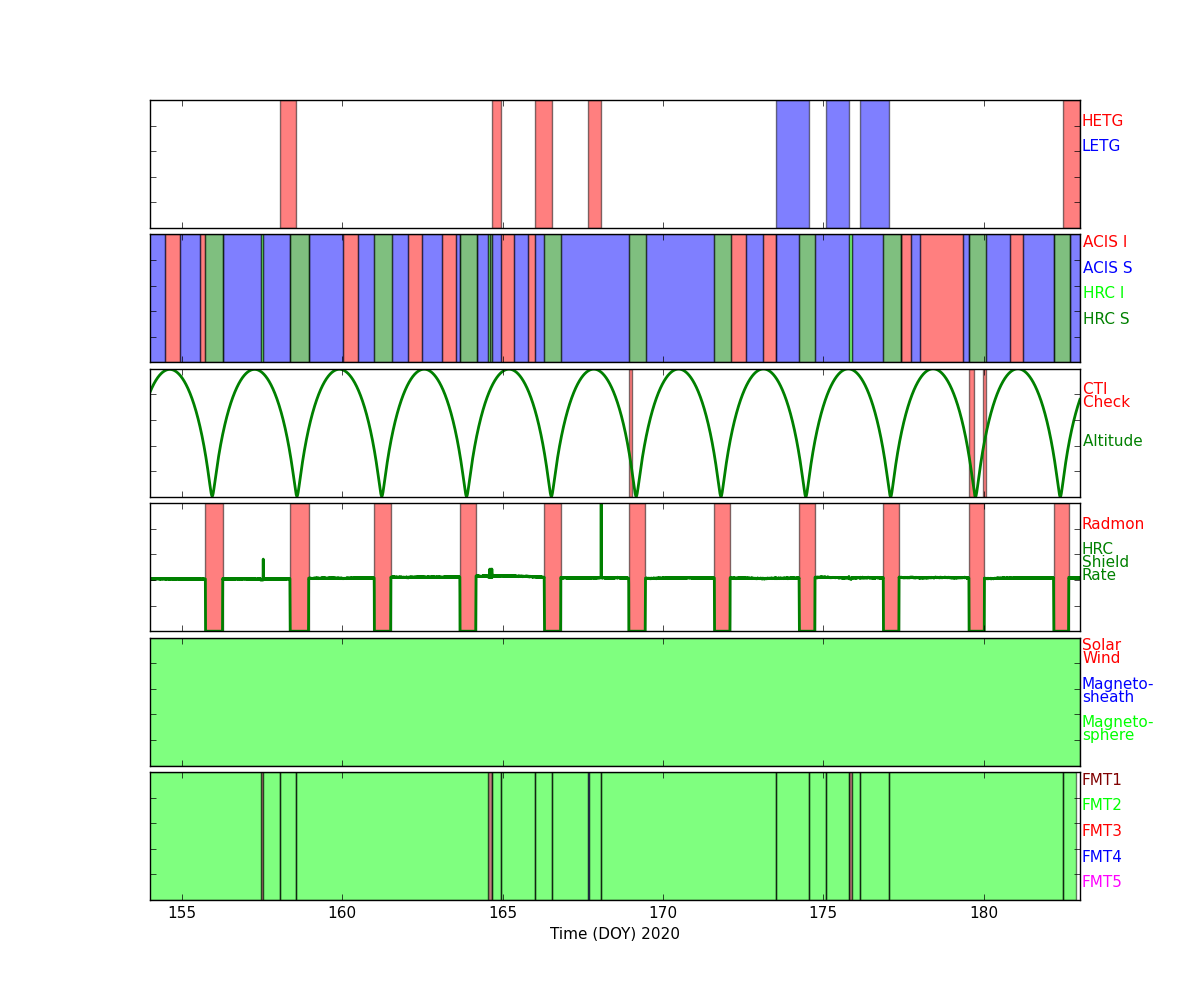
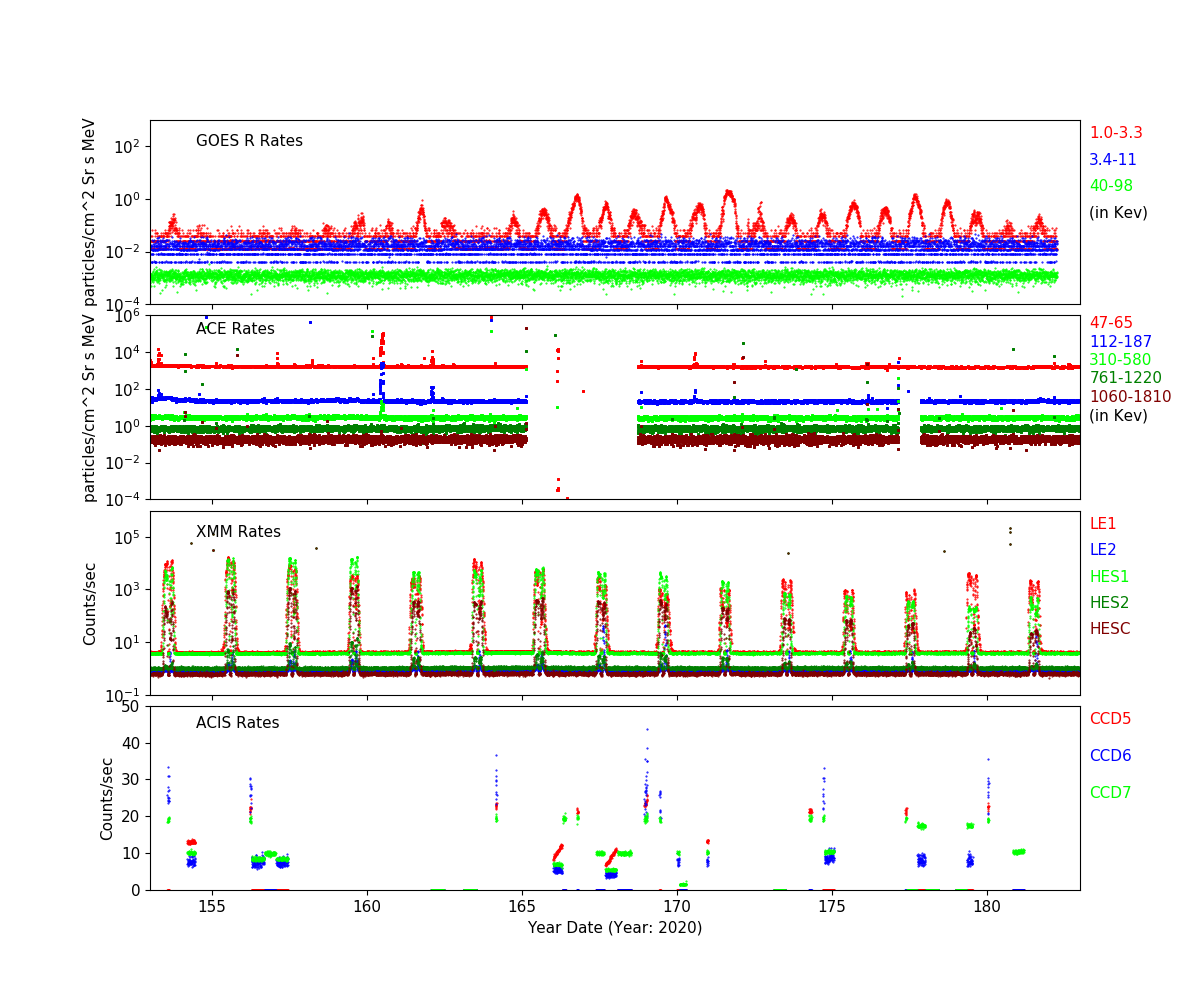
Radiation History
Radiation Count Rates of Jun 2020
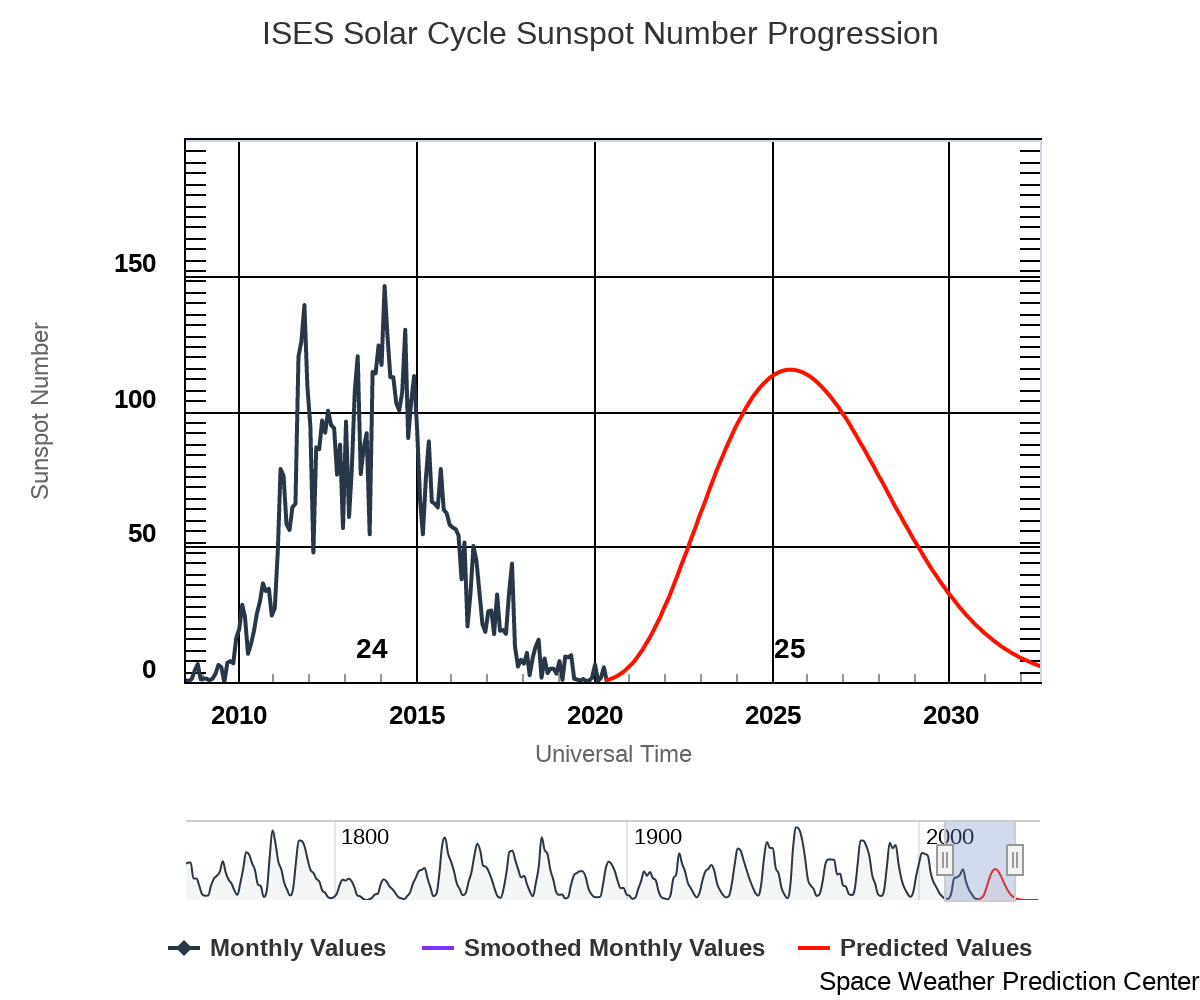
Sun Spot History (See:NOAA Page)
Trending
Critical Trends
| ACIS Temperatures - Daily Maximums | |||||||
|---|---|---|---|---|---|---|---|
| MSID | MEAN | RMS | DELTA/YR | DELTA/YR/YR | UNITS | DESCRIPTION | |
| 1pdeaat | -0.033 | 0.003 | (3.04+/-0.07)e2 | -2.04 +/- 2.48 | K | PSMC DEA PS A TEMP | |
| HRMA Computed Averages - Daily Maximums | |||||||
|---|---|---|---|---|---|---|---|
| MSID | MEAN | RMS | DELTA/YR | DELTA/YR/YR | UNITS | DESCRIPTION | |
| obaavg | -0.242 | 0.138 | (2.98+/-0.02)e2 | -46.00 +/- 93.39 | TEMP | OBA/TFTE | |
| EPHIN Temperatures - Daily Maximums | |||||||
|---|---|---|---|---|---|---|---|
| MSID | MEAN | RMS | DELTA/YR | DELTA/YR/YR | UNITS | DESCRIPTION | |
| teio | -0.010 | 0.011 | (3.20+/-0.24)e2 | 4.41 +/- 5.89 | K | EPHIN ELECTRONICS HOUSING TEMP | |
| tephin | -0.006 | 0.003 | (3.29+/-0.07)e2 | -0.87 +/- 2.52 | K | EPHIN SENSOR HOUSING TEMP | |
| S/C Main Temperatures - Daily Maximums | |||||||
|---|---|---|---|---|---|---|---|
| MSID | MEAN | RMS | DELTA/YR | DELTA/YR/YR | UNITS | DESCRIPTION | |
| tcylfmzm | -0.071 | 0.008 | (3.15+/-0.18)e2 | 2.62 +/- 5.43 | K | CNT CYL TEMP:-Z SIDE UNDER LAE-1 | |
| tcylfmzp | -0.058 | 0.007 | (3.16+/-0.17)e2 | 2.31 +/- 4.95 | K | CNT CYL TEMP:-Z SIDE UNDER LAE-2 | |
| S/C Ancillary Temperatures - Daily Maximums | |||||||
|---|---|---|---|---|---|---|---|
| MSID | MEAN | RMS | DELTA/YR | DELTA/YR/YR | UNITS | DESCRIPTION | |
| tfssbkt1 | -0.034 | 0.012 | (3.39+/-0.28)e2 | 2.63 +/- 6.06 | K | FSS BRAC | |
| tfssbkt2 | -0.023 | 0.014 | (3.35+/-0.32)e2 | 2.84 +/- 6.88 | K | FSS BRAC | |
| tsctsf1 | 0.001 | 0.002 | (3.15+/-0.04)e2 | 0.18 +/- 1.50 | K | SC-TS FITTING -1 TEMP | |
| tsctsf6 | -0.007 | 0.002 | (3.15+/-0.04)e2 | -0.91 +/- 1.47 | K | SC-TS FITTING -6 TEMP | |
| MUPS - Daily Maximums | |||||||
|---|---|---|---|---|---|---|---|
| MSID | MEAN | RMS | DELTA/YR | DELTA/YR/YR | UNITS | DESCRIPTION | |
| pm1thv1t | -0.017 | 0.006 | (3.49+/-0.15)e2 | 1.47 +/- 3.32 | K | MUPS 1 THRUSTER VALVE 01 TEMP | |
| pm2thv1t | -0.005 | 0.014 | (3.33+/-0.32)e2 | -5.20 +/- 7.16 | K | MUPS 2 THRUSTER VALVE 01 TEMP | |
| pm1thv2t | -0.013 | 0.006 | (3.51+/-0.14)e2 | -0.69 +/- 3.13 | K | MUPS 1 THRUSTER VALVE 02 TEMP | |
| pm2thv2t | 0.015 | 0.019 | (3.20+/-0.43)e2 | 7.16 +/- 11.12 | K | MUPS 2 THRUSTER VALVE 02 TEMP | |
| pline02t | -0.017 | 0.005 | (3.30+/-0.12)e2 | 1.71 +/- 3.34 | K | PROP LINE TEMP 02 | |
| pline03t | -0.030 | 0.007 | (3.26+/-0.15)e2 | 5.23 +/- 3.71 | K | PROP LINE TEMP 03 | |
| pline04t | -0.014 | 0.005 | (3.12+/-0.11)e2 | 2.20 +/- 3.38 | K | PROP LINE TEMP 04 | |
Quarterly Trends
- HRMA Struts
| Previous Quarter | |||||||
| MSID | MEAN | RMS | DELTA/YR | DELTA/YR/YR | UNITS | DESCRIPTION | |
| 4rt584t | 0.004 | 4.390e-04 | (3.01+/-0.01)e2 | -0.45 +/- 0.33 | K | RT 584 - STRUT TEMP | |
|---|---|---|---|---|---|---|---|
| 4rt585t | 0.005 | 4.271e-04 | (3.01+/-0.01)e2 | -0.17 +/- 0.32 | K | RT 585 - STRUT TEMP | |
| 4rt586t | 0.004 | 3.492e-04 | (2.98+/-0.01)e2 | -0.26 +/- 0.26 | K | RT 586 - STRUT TEMP | |
| 4rt587t | 0.003 | 2.652e-04 | (2.93+/-0.01)e2 | -0.16 +/- 0.19 | K | RT 587 - STRUT TEMP | |
| 4rt597t | 0.009 | 0.001 | (3.07+/-0.02)e2 | -1.00 +/- 0.81 | K | RT 597 - TFTE TEMP | |
| 4rt598t | 0.010 | 0.001 | (3.07+/-0.02)e2 | -0.58 +/- 0.82 | K | RT 598 - TFTE TEMP | |
- OB Forward Bulkhead
| Previous Quarter | |||||||
| MSID | MEAN | RMS | DELTA/YR | DELTA/YR/YR | UNITS | DESCRIPTION | |
| 4rt705t | 0.004 | 5.323e-04 | (2.93+/-0.01)e2 | -0.69 +/- 0.43 | K | RT 705 - OB BUL | |
|---|---|---|---|---|---|---|---|
| 4rt706t | 0.004 | 5.355e-04 | (2.92+/-0.01)e2 | -0.73 +/- 0.44 | K | RT 706 - OB BUL | |
| 4rt707t | 0.004 | 5.257e-04 | (2.96+/-0.01)e2 | -0.80 +/- 0.43 | K | RT 707 - OB BULKHEAD TEMP | |
| 4rt708t | 0.005 | 5.851e-04 | (3.00+/-0.01)e2 | -0.85 +/- 0.48 | K | RT 708 - OB BULKHEAD TEMP | |
| 4rt709t | 0.006 | 6.418e-04 | (3.00+/-0.02)e2 | -0.92 +/- 0.52 | K | RT 709 - OB BULKHEAD TEMP | |
| 4rt710t | 0.007 | 6.965e-04 | (3.02+/-0.02)e2 | -0.97 +/- 0.57 | K | RT 710 - OB BULKHEAD TEMP | |
- HRMA Thermal
- HRMA Thermal
| Previous Quarter | |||||||
| MSID | MEAN | RMS | DELTA/YR | DELTA/YR/YR | UNITS | DESCRIPTION | |
| 4rt568t | 0.005 | 5.899e-04 | (2.99+/-0.01)e2 | -0.46 +/- 0.46 | K | RT 568 - HRMA TEMP | |
|---|---|---|---|---|---|---|---|
| 4rt569t | 0.002 | 1.611e-04 | (2.97+/-0.00)e2 | -0.14 +/- 0.10 | K | RT 569 - HRMA TEMP | |
| 4rt570t | 0.001 | 7.893e-05 | (2.96+/-0.00)e2 | 0.03 +/- 0.04 | K | RT 570 - HRMA TEMP | |
| 4rt575t | 0.007 | 7.803e-04 | (3.04+/-0.02)e2 | -0.82 +/- 0.61 | K | RT 575 - OB CONE TEMP | |
| 4rt576t | 0.005 | 5.892e-04 | (2.95+/-0.01)e2 | -0.30 +/- 0.46 | K | RT 576 - OB CONE TEMP | |
| 4rt578t | 0.007 | 0.001 | (3.02+/-0.03)e2 | -0.19 +/- 0.88 | K | RT 578 - OB CONE TEMP | |
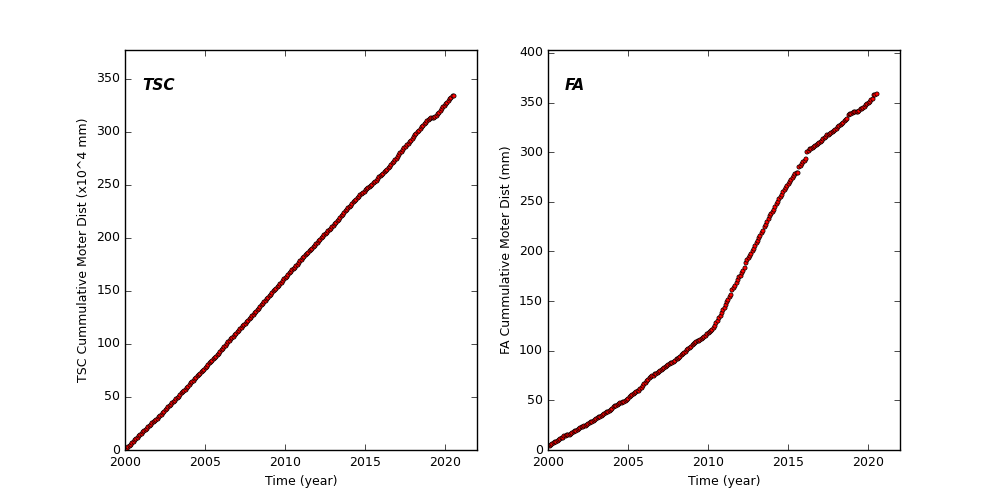
Spacecraft Motions
TSC and FA Cummulative Moter Distance
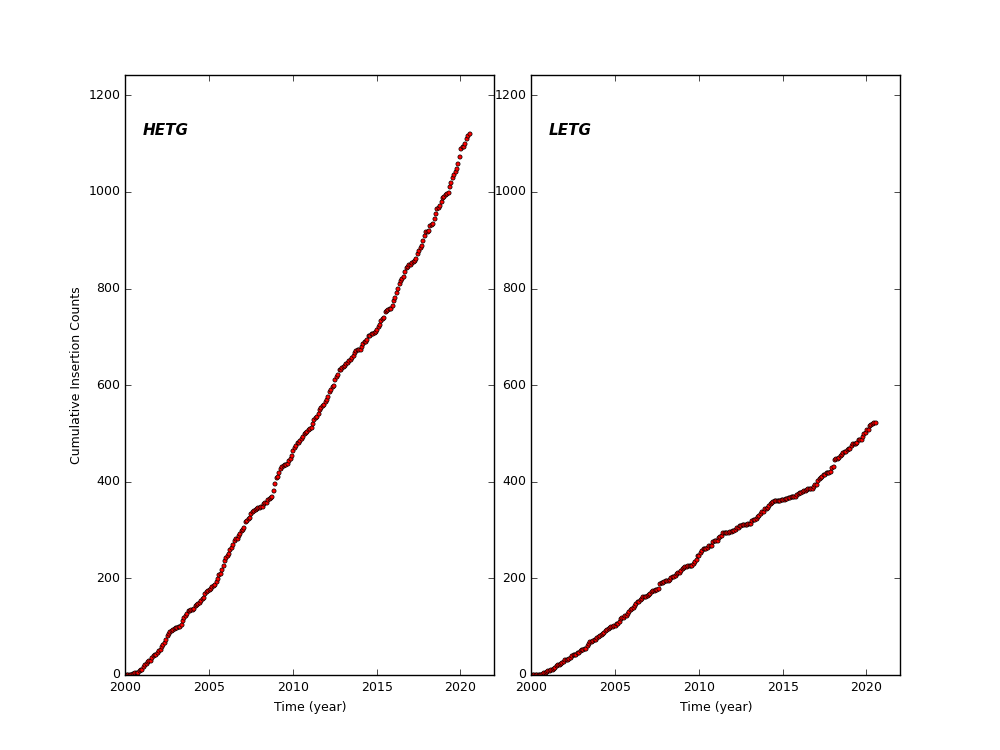
HETG and LETG Cummulative Insertion Counts
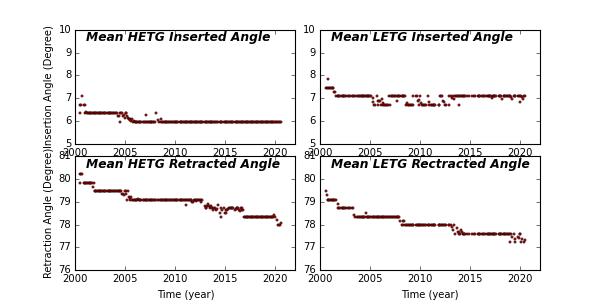
HETG/LETG Insertion/Retraction Angle
Reaction Wheel Rotations