ACIS
ACIS DOSE Registered-Photon-Map
The steps we took to compute the dose map are;
- Level 1 Event files for a specified month are obtained from archive.
- Image data including I2, I3, S2, S3 CCDs are extracted from all event files.
- All the extracted image data were merged to create a month long exposure map for the month.
- The exposure map is opened with ds9, and check a distribution of count rates against energy. From this, estimate the upper threshold value. Any events beyond this upper threshold are assumed erroneous events such as bad pixels.
- Using this upper threshold, the data is filtered, and create a cleaned exposure map for the month.
- The exposure map from each month from the Sep 1999 is added up to create a cumulative exposure map for each month.
- Using fimgstatistic, we compute count rate statistics for each CCDs.
- For observations with high data drop rates (e.g., Crab nebula, Cas A), we corrected the observations by adding events.
Please check more detail plots at Telemetered Photon Dose Trend page.
)
)
)
Statistics:
# IMAGE     NPIX     MEAN        RMS        MIN     MAX
ACIS_oct20 6004901       9.596         15.103           0.0     1449


I2 node 0  262654	6.522337	3.119512	0.0	 48.0
I2 node 1  262654	6.891331	4.820166	0.0	1449.0
I2 node 2  262654	6.624239	3.078325	0.0	 74.0
I2 node 3  262654	6.707898	4.335061	0.0	1436.0

I3 node 0  262654	8.823436	3.903102	0.0	429.0
I3 node 1  262654	8.618823	3.706054	0.0	131.0
I3 node 2  262654	8.426238	3.530595	0.0	114.0
I3 node 3  262654	8.631838	3.660674	0.0	167.0

S2 node 0  262654	11.074820	4.450597	0.0	265.0
S2 node 1  262654	12.215562	6.586465	0.0	387.0
S2 node 2  262654	15.050414	15.254654	0.0	569.0
S2 node 3  262654	17.896715	26.630461	0.0	1332.0

S3 node 0  262654	21.102060	26.492927	1.0	415.0
S3 node 1  262654	21.691939	18.504510	0.0	667.0
S3 node 2  262654	22.860635	19.167063	2.0	252.0
S3 node 3  262654	17.915344	9.005642	0.0	171.0
)
)
)
Statistics:
 IMAGE     NPIX      MEAN        RMS           MIN      MAX
ACIS_total   6004901       2436.460         3133.943           0.0   135735


I2 node 0  262654	2109.461316	421.834962	447.0	12397.0
I2 node 1  262654	2218.633865	595.656729	461.0	112232.0
I2 node 2  262654	2245.858072	474.841756	476.0	12810.0
I2 node 3  262654	2251.273208	580.853379	450.0	28715.0

I3 node 0  262654	2409.529510	592.703327	449.0	12120.0
I3 node 1  262654	2487.953947	1712.684258	480.0	55535.0
I3 node 2  262654	2208.155131	412.013272	449.0	12916.0
I3 node 3  262654	2200.472045	443.367942	414.0	33561.0

S2 node 0  262654	2841.857342	453.010569	1561.0	22147.0
S2 node 1  262654	3012.445421	675.923261	1740.0	16427.0
S2 node 2  262654	3331.696013	672.851688	2159.0	27938.0
S2 node 3  262654	3294.990720	526.600827	1912.0	65823.0

S3 node 0  262654	5031.122036	2402.896603	2196.0	35570.0
S3 node 1  262654	6255.439473	2321.604607	0.0	35623.0
S3 node 2  262654	4990.788063	1287.895263	2210.0	26031.0
S3 node 3  262654	3874.460870	684.858389	2369.0	25429.0
)
|
)
|
)
|
)
|
| Jul 2020 | Apr 2020 | Jan 2020 | Oct 2019 |
|---|
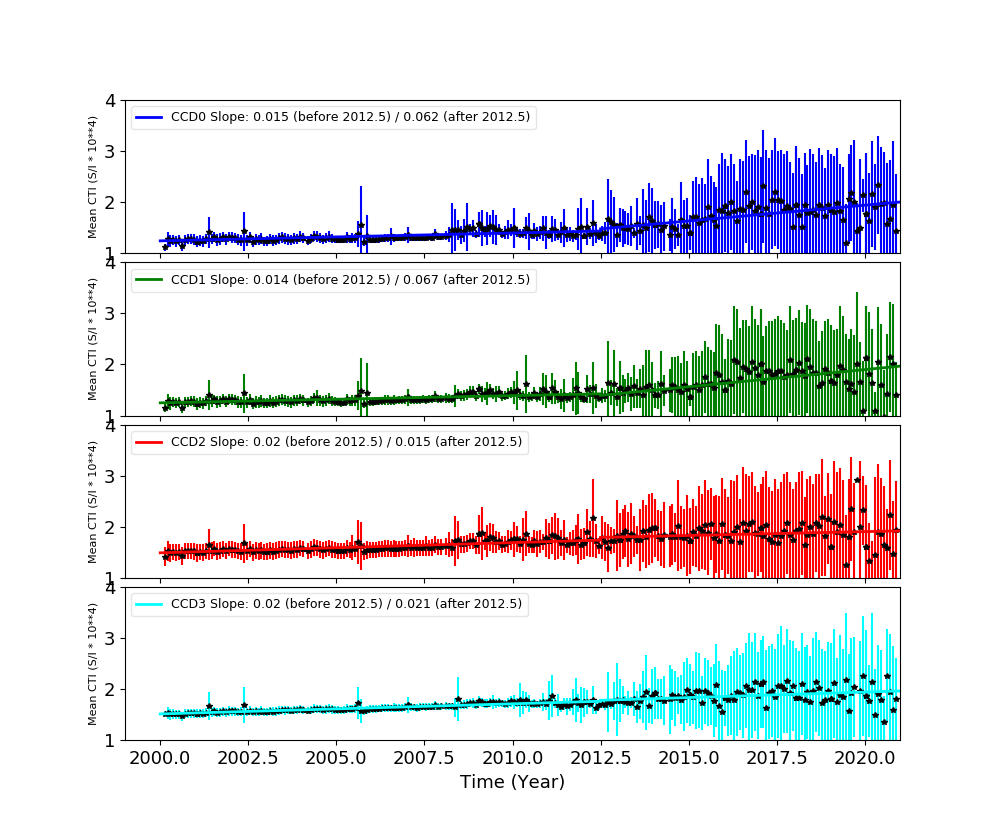
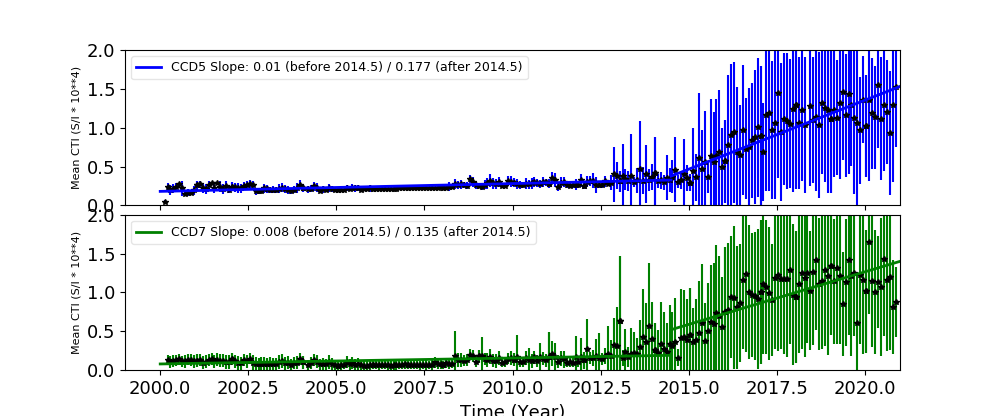
The Mean Detrended CTI
We report CTIs with a refined data definition. CTIs were computed for the temperature dependency corrected data. Please see CTI page for detailed explanation. CTI's are computed for Mn K alpha, and defined as slope/intercept x10^4 of row # vs ADU. Data file: here
Imaging CCDs
Spectral CCDs
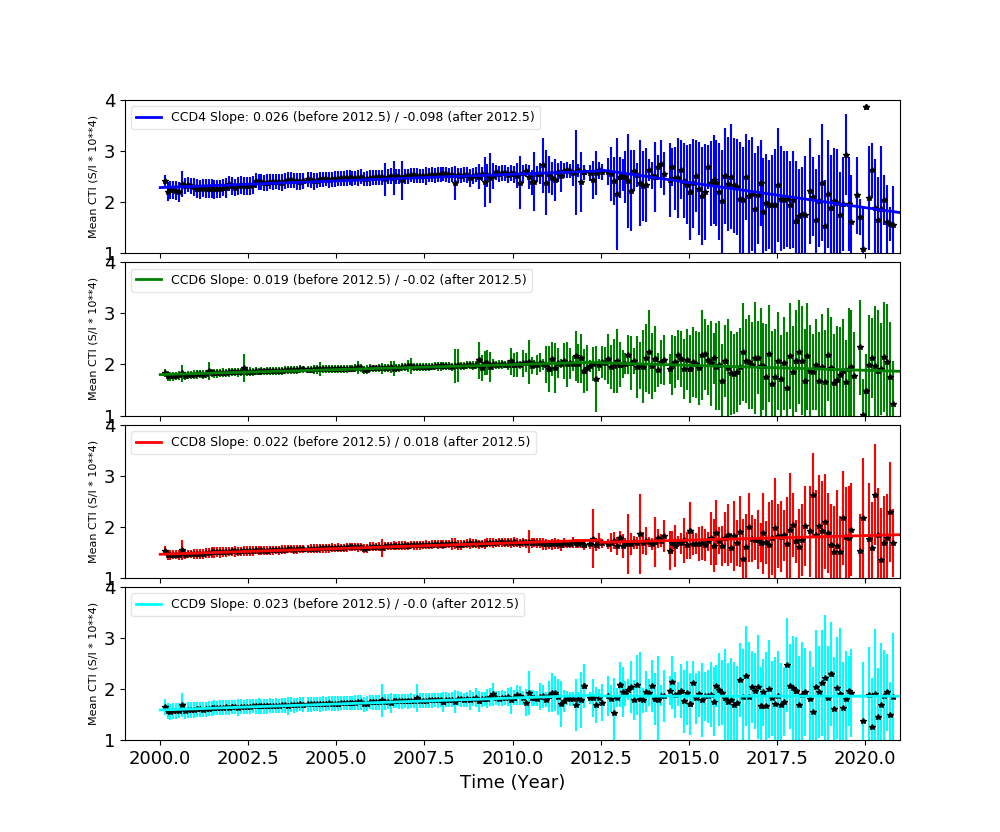
Backside CCDs
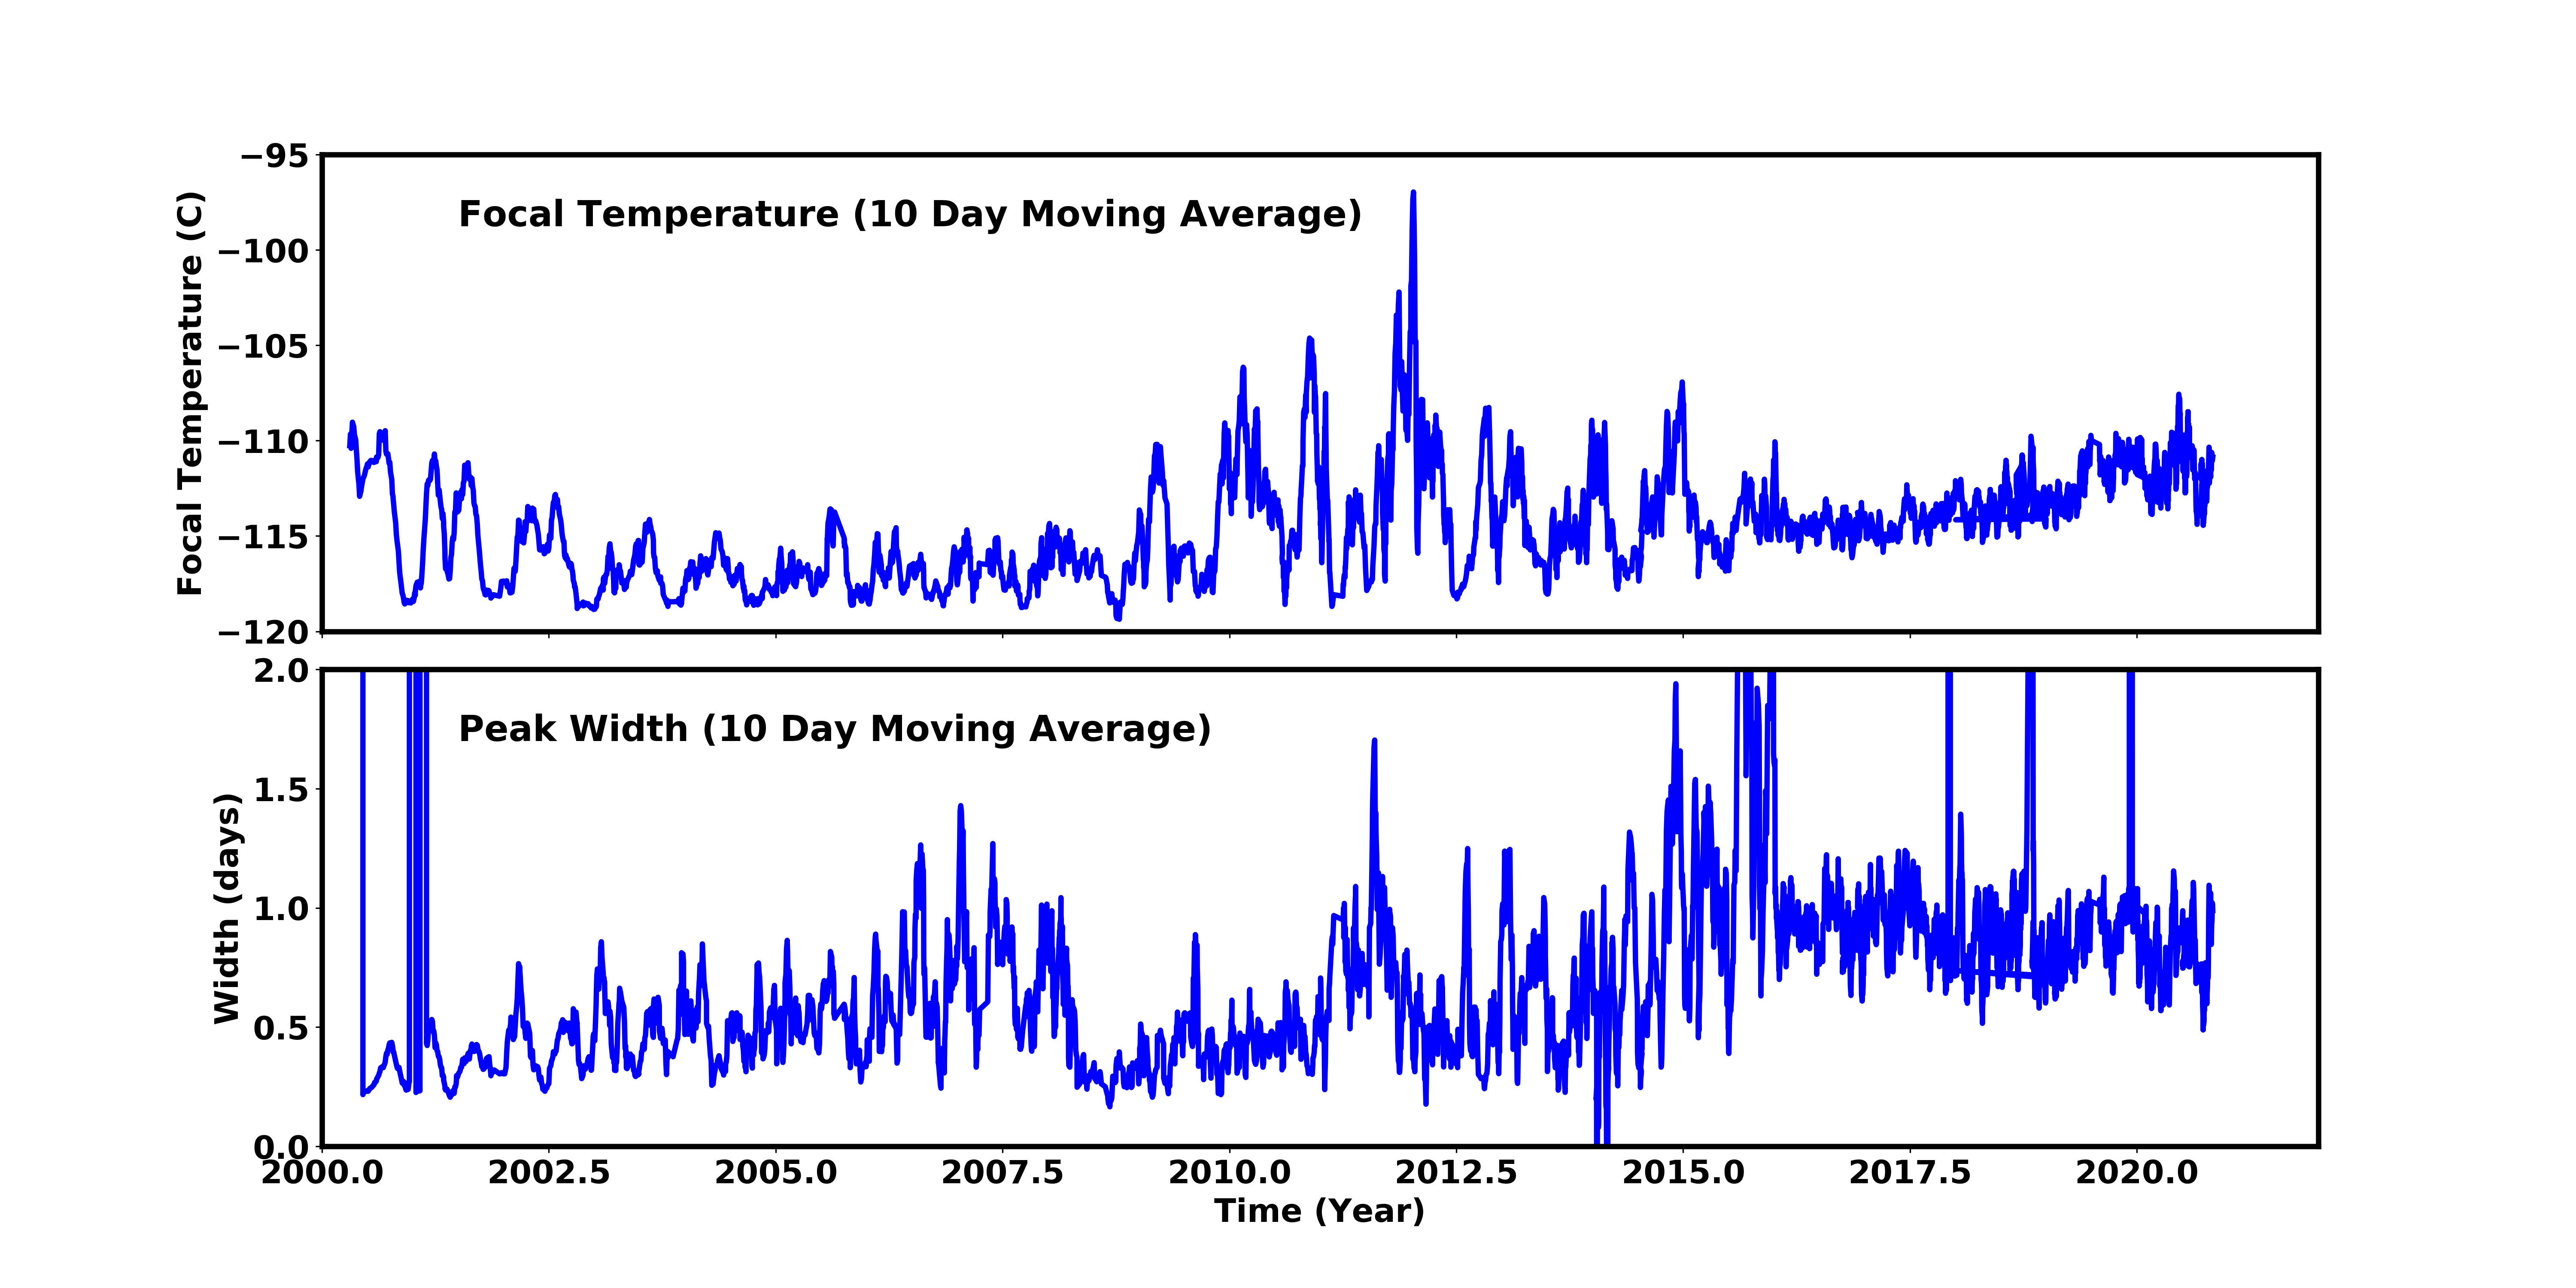
Focal Plane Temperature
Oct 2020 Focal Temperature
| The Mean (max) FPT: | |
|---|---|
| -111.72 | +/- 3.64 C |
| Mean Width: | |
| 0.87 | +/- 0.45 days |
Averaged Focal Plane Temperature
We are using 10 period moving averages to show trends of peak temperatures and peak widths. Note, the gaps in the width plot are due to missing/corrupted data.
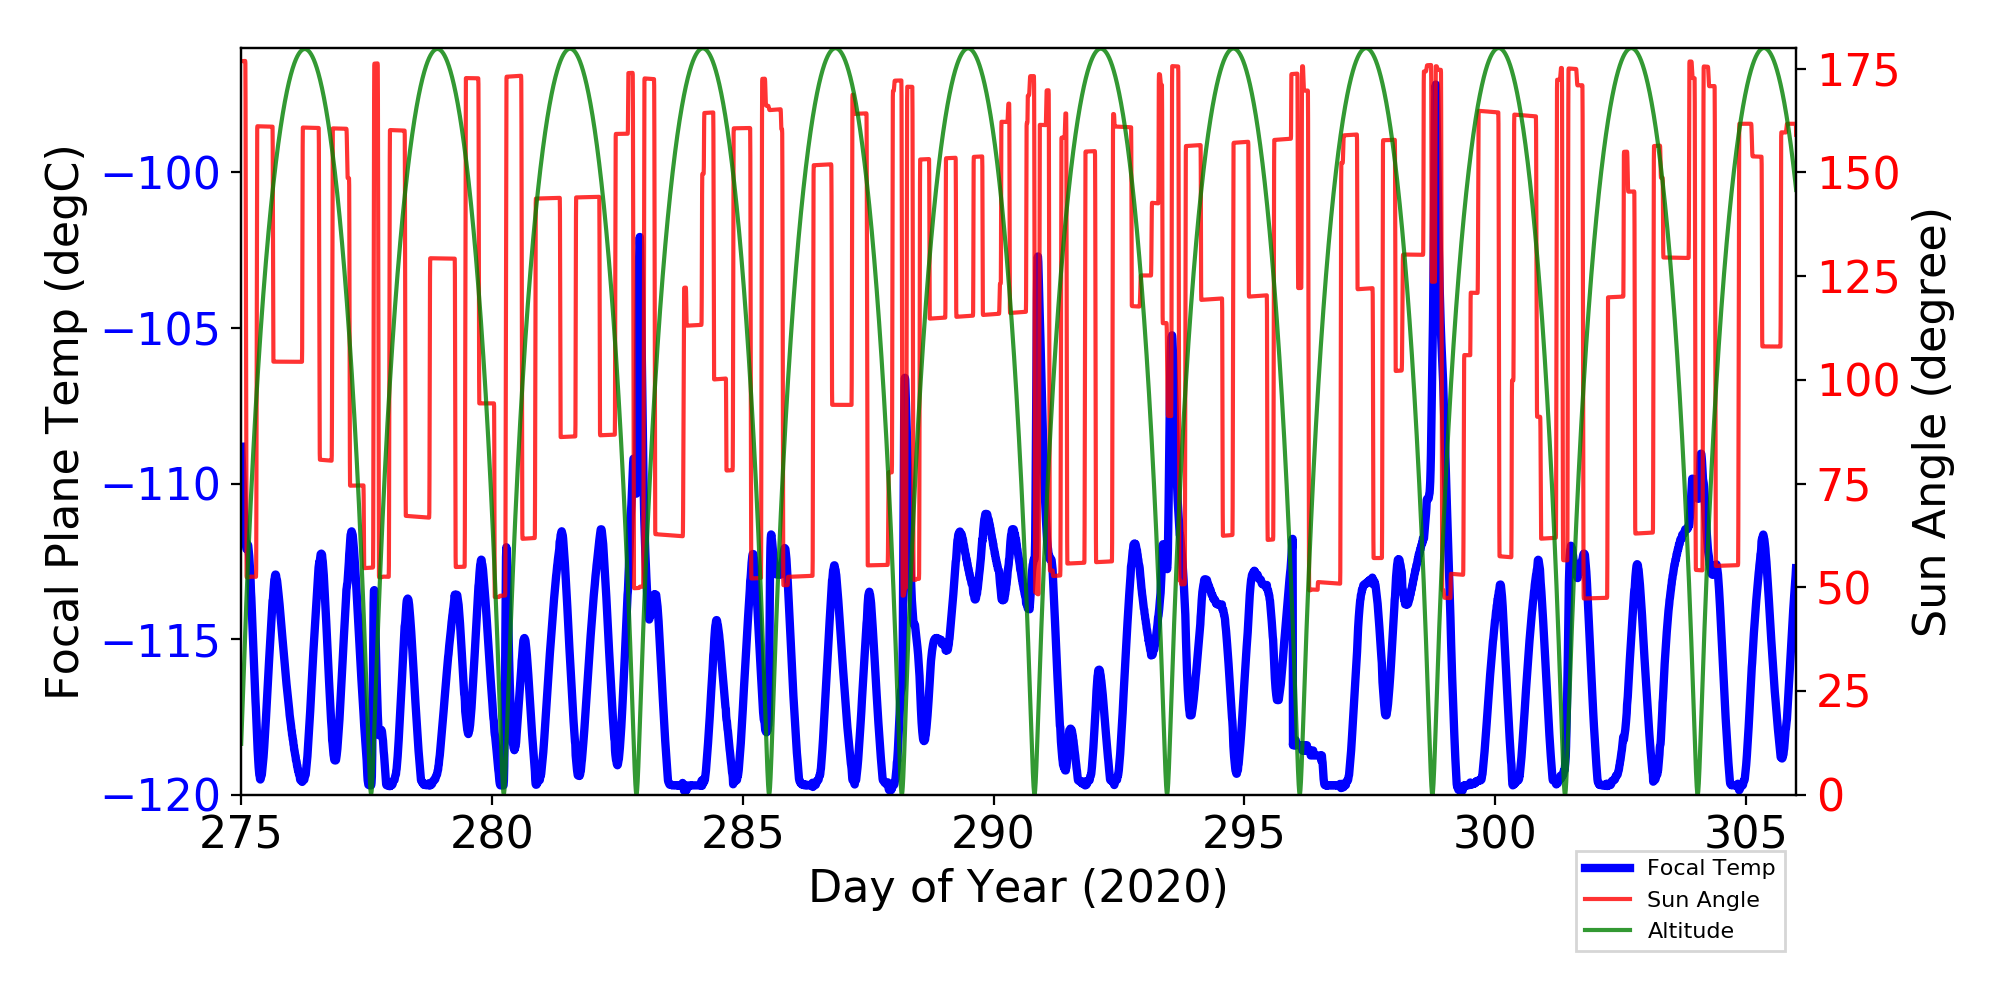
Focal Plane Temperature, Sun Angle and Altitude
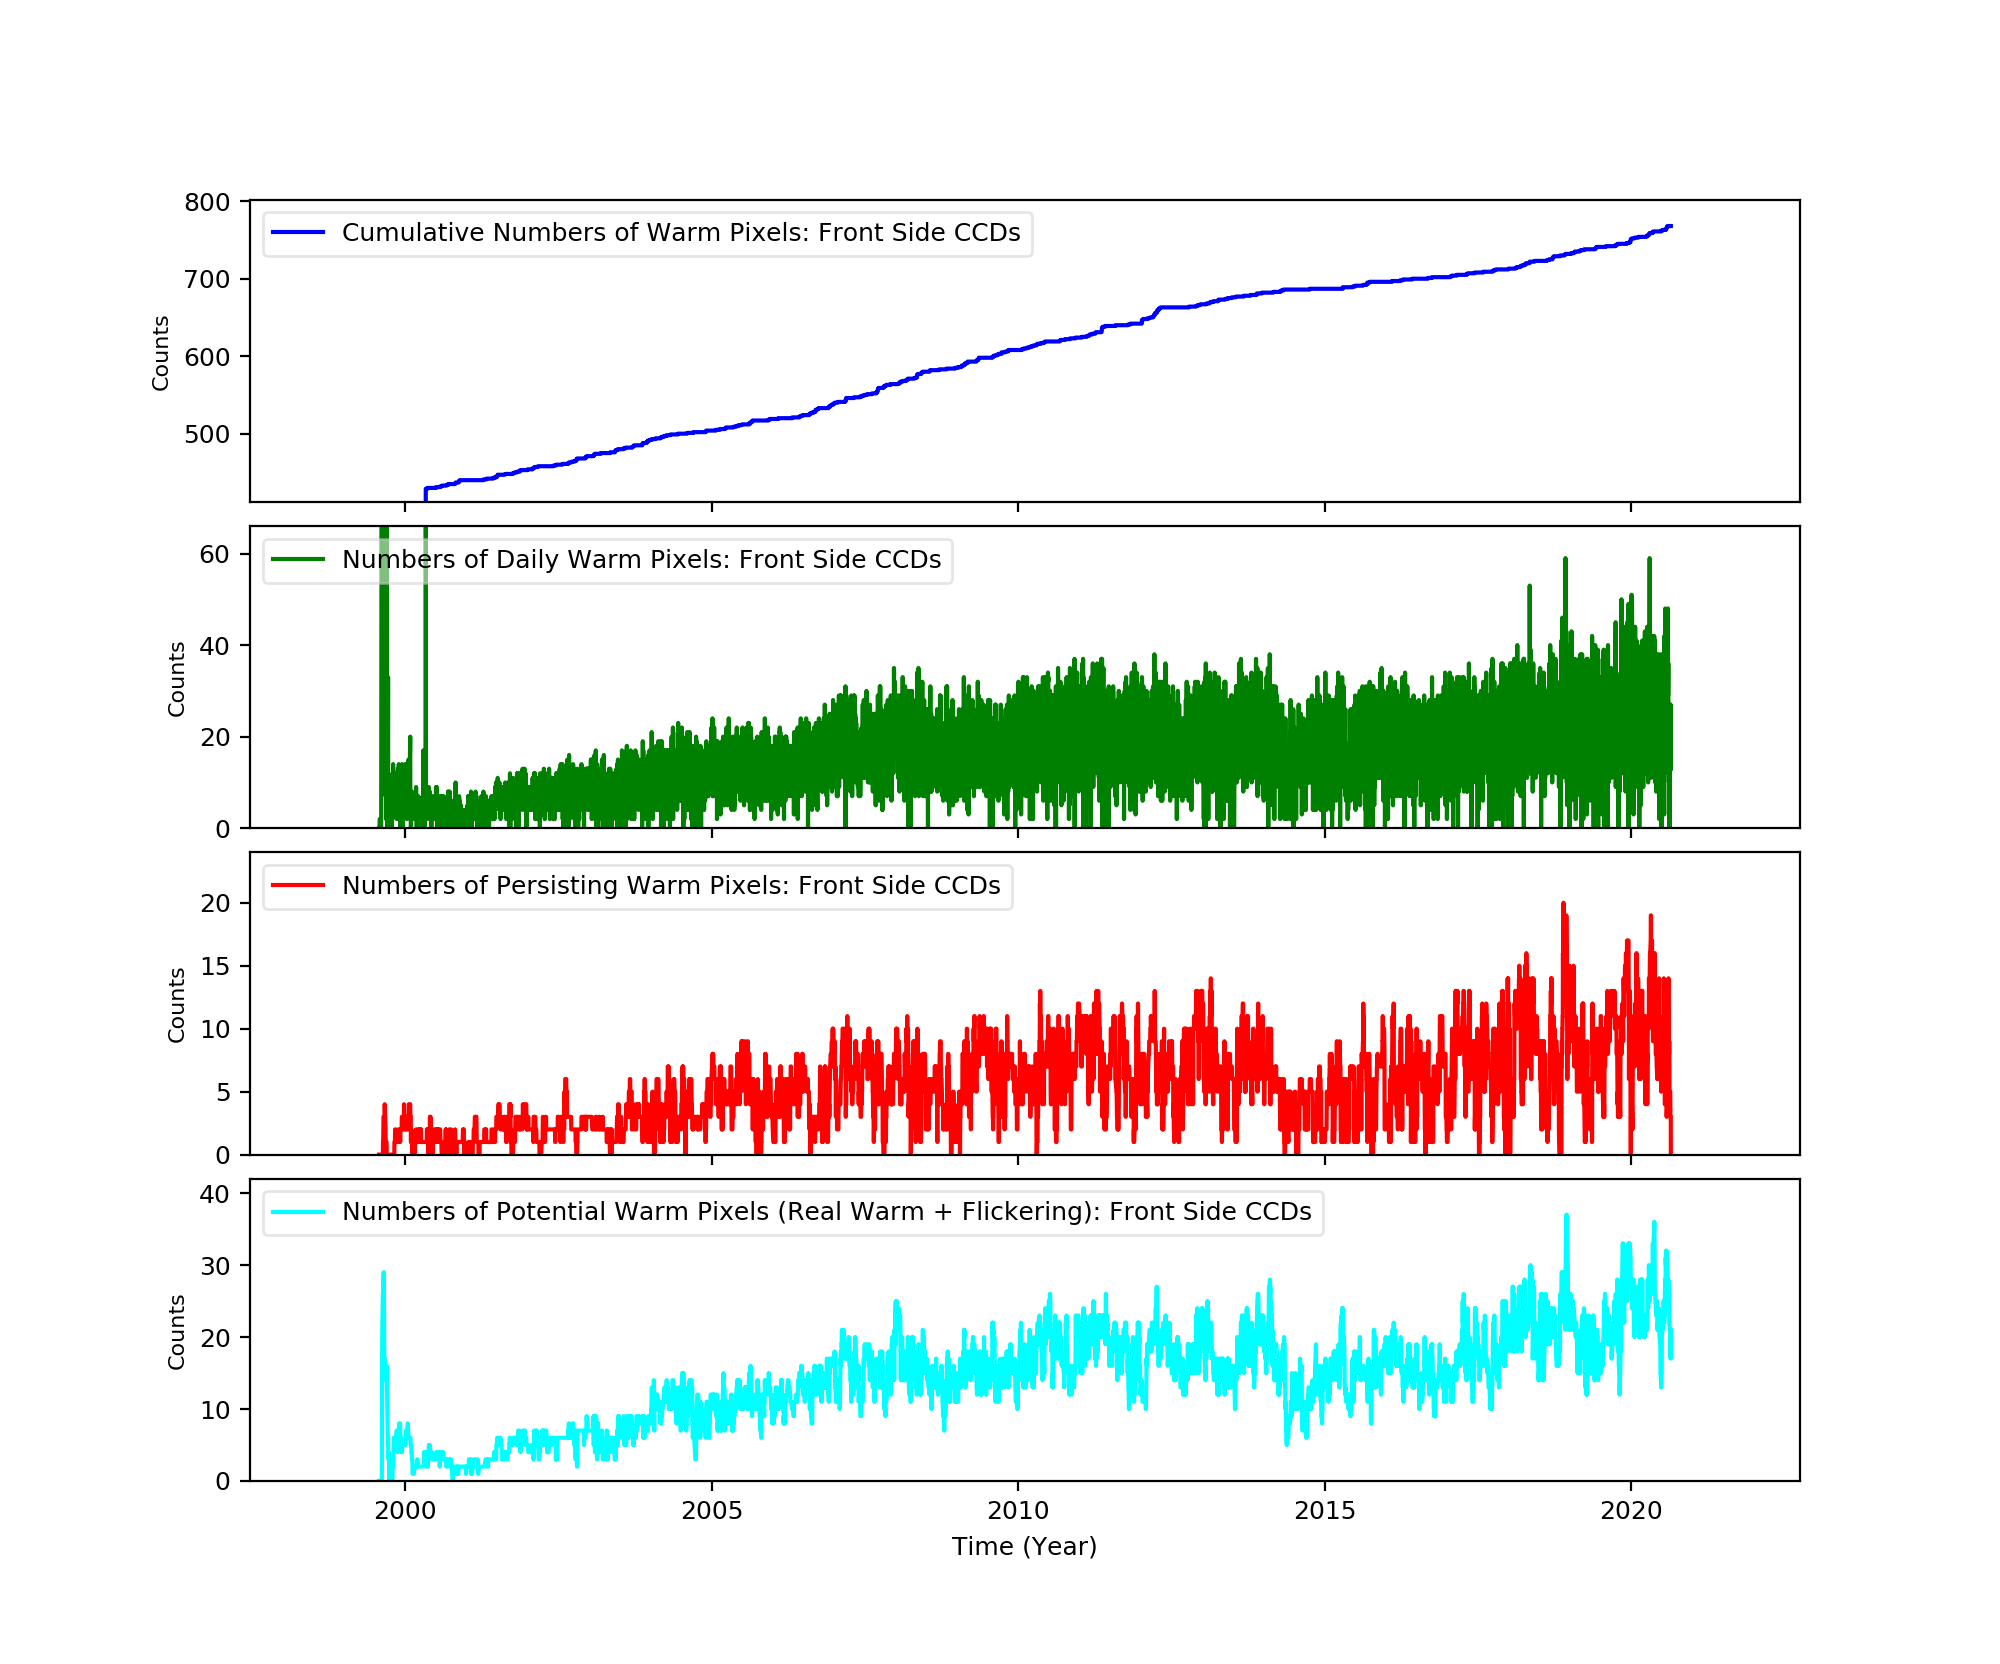
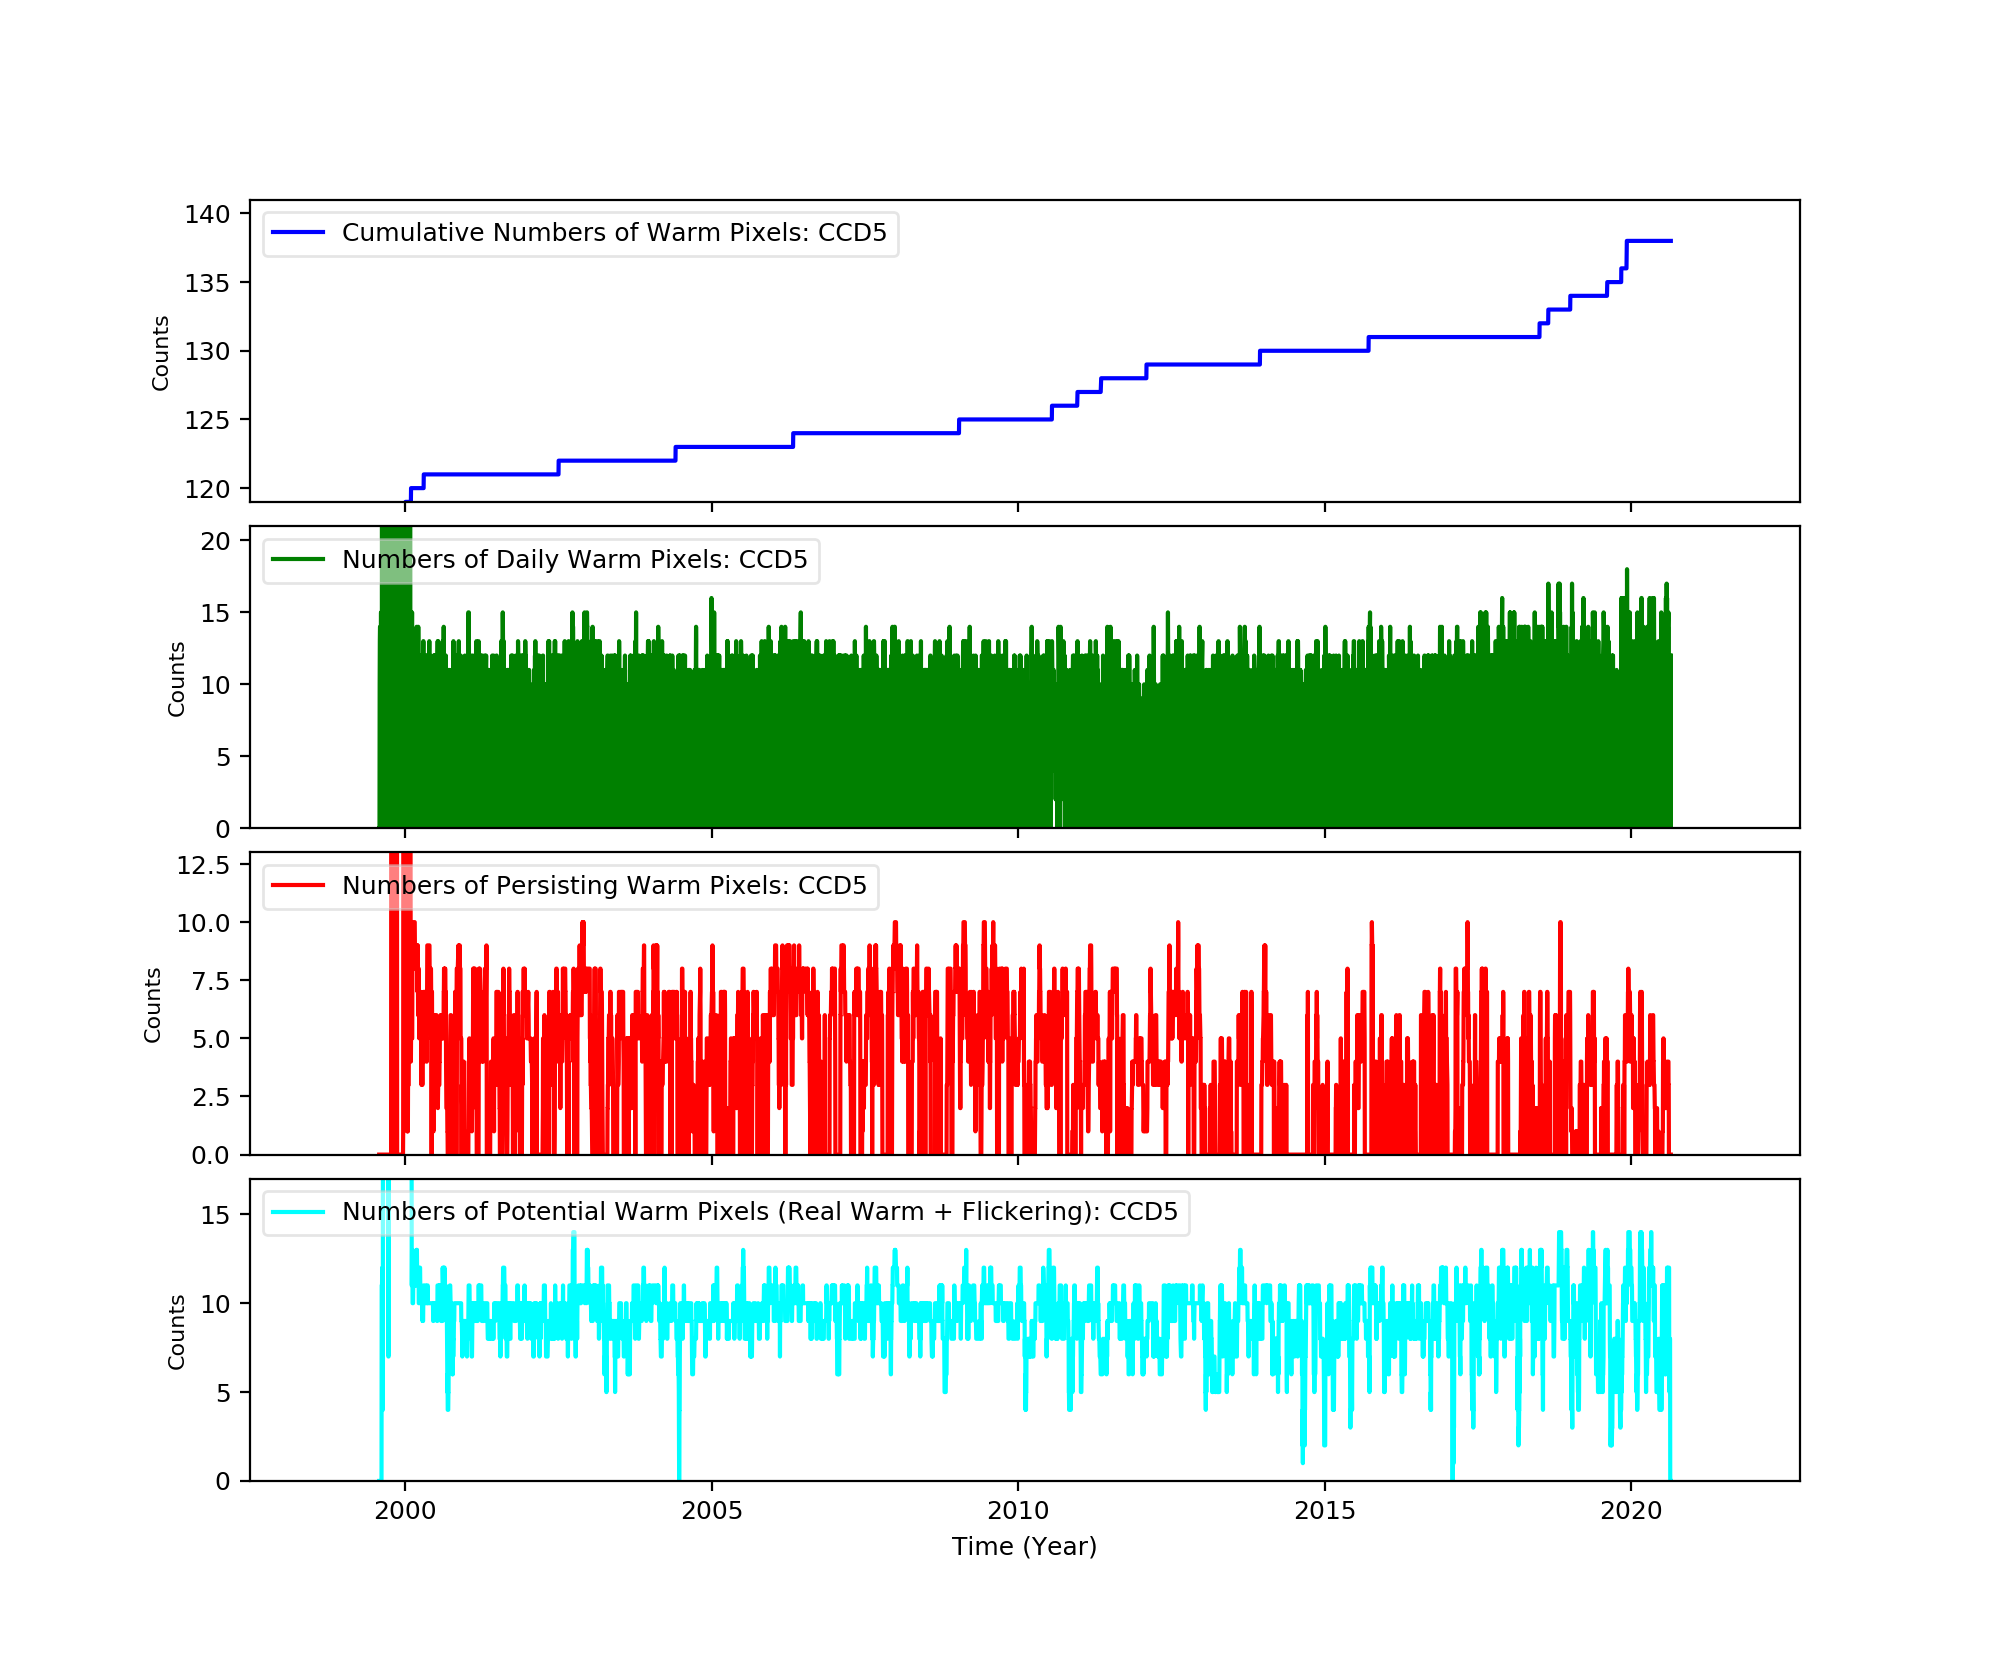
Bad Pixels
The plots below were generated with a new warm pixel finding script. Please see Acis Bad Pixel Page for details.
Front Side CCDs
Back Side CCD (CCD5)
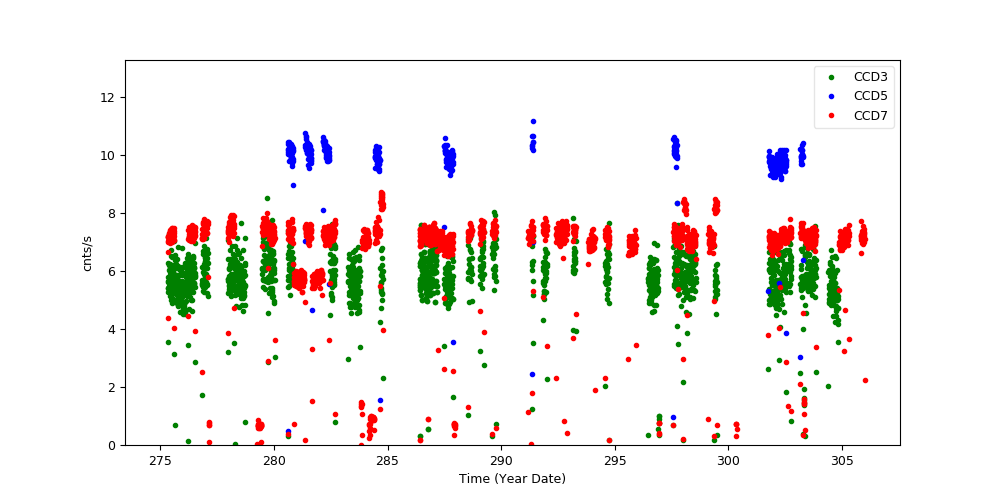
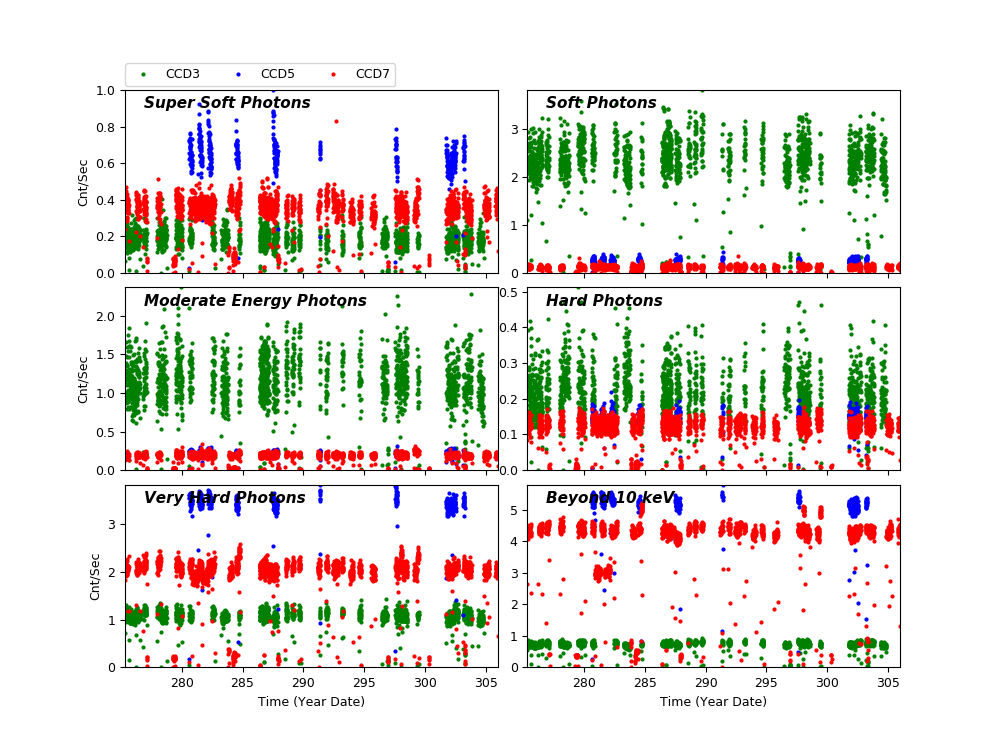
Science Instrument Background Rates
| Name | Low (keV) | High(KeV) | Description |
|---|---|---|---|
| SSoft | 0.00 | 0.50 | Super soft photons |
| Soft | 0.50 | 1.00 | Soft photons |
| Med | 1.00 | 3.00 | Moderate energy photons |
| Hard | 3.00 | 5.00 | Hard Photons |
| Harder | 5.00 | 10.00 | Very Hard photons |
| Hardest | 10.00 | Beyond 10 keV |
HRC
DOSE of Central 4K Pore-Pairs
Please refer to Maximum Dose Trends for more details.
)
|
|---|
IMAGE                NPIX      MEAN    STDDEV      MIN       MAX
HRCI_10_2020.fits  16777216	0.163 	0.432 	0.000 	8.000
)
IMAGE                       NPIX      MEAN    STDDEV      MIN       MAX
HRCI_08_1999_10_2020.fits  16777216	 6.609   6.126   0.000   307.000
)
|
|---|
IMAGE                NPIX      MEAN    STDDEV      MIN       MAX
HRCS_10_2020.fits  16777216	0.004 	0.076 	0.000 	12.000
)
IMAGE                       NPIX      MEAN    STDDEV      MIN       MAX
HRCS_08_1999_10_2020.fits  16777216	19.090   34.408  0.000   1751.000
|
|
Max dose trend plots corrected for events that "pile-up"
in the center of the taps due to bad position information.
|
)
|
)
|
)
|
)
|
| Jul 2020 | Apr 2020 | Jan 2020 | Oct 2019 |
|---|
)
|
)
|
)
|
)
|
| Jul 2020 | Apr 2020 | Jan 2020 | Oct 2019 |
|---|
Gratings
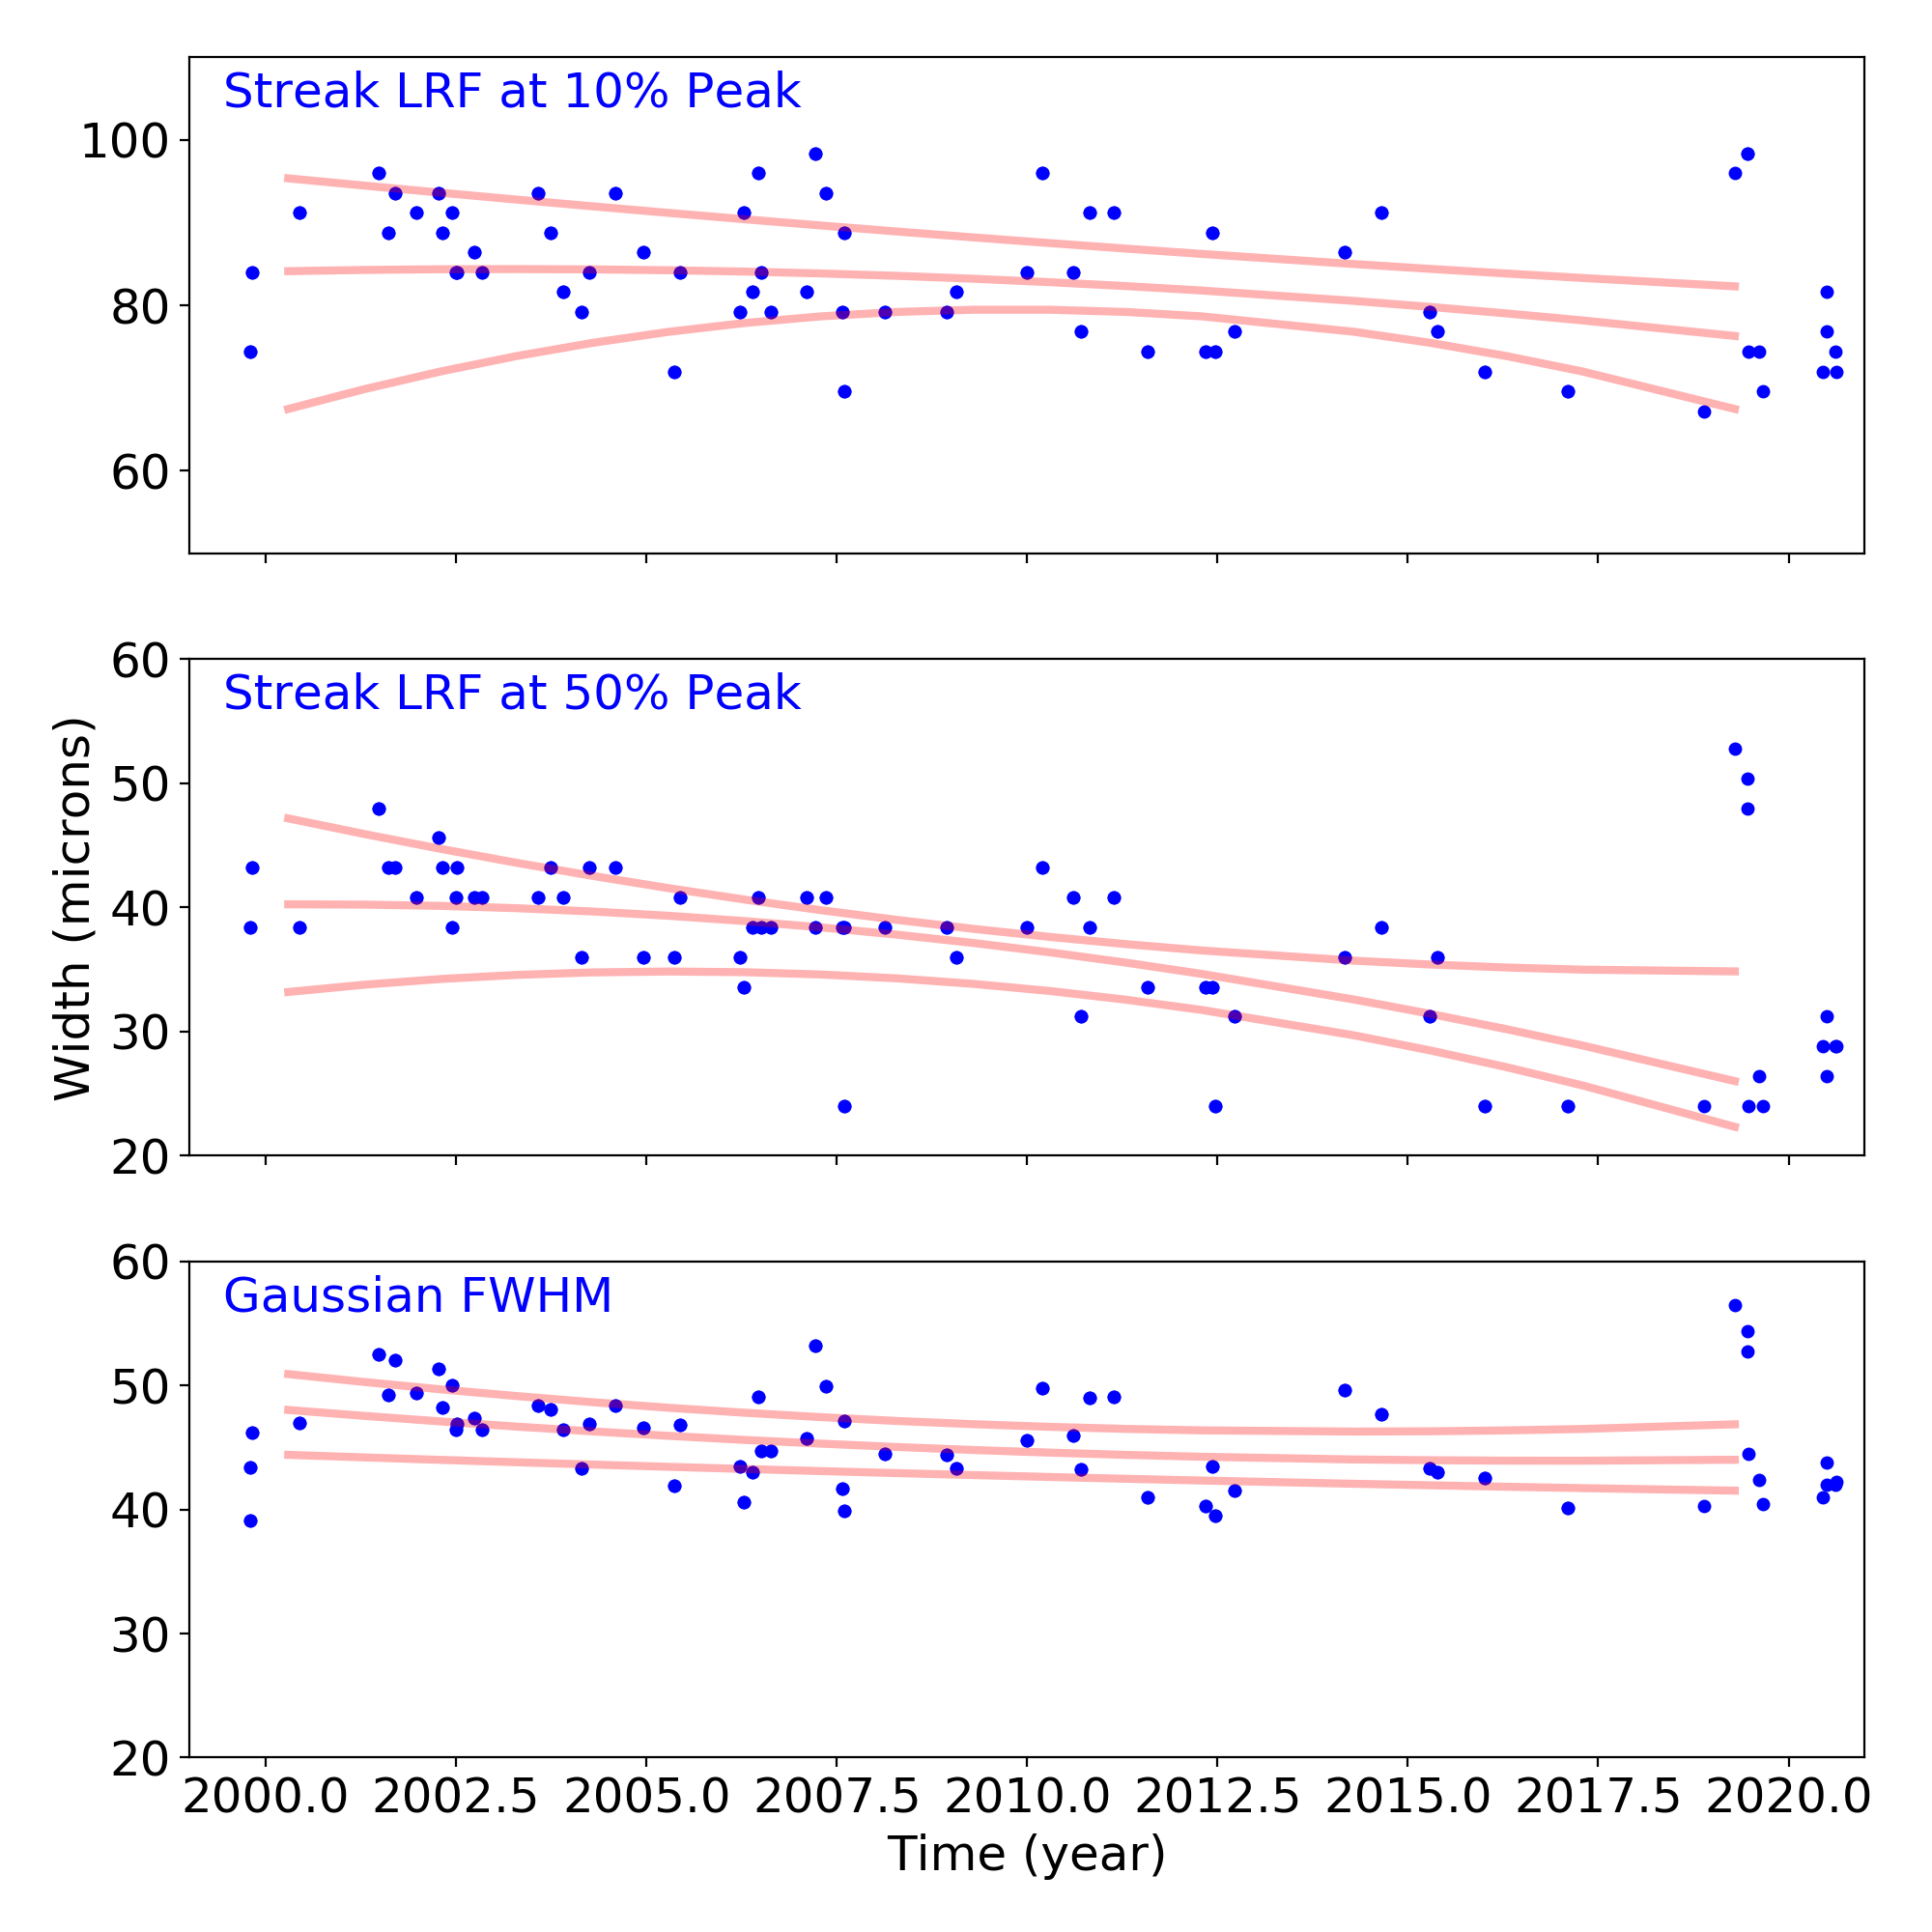
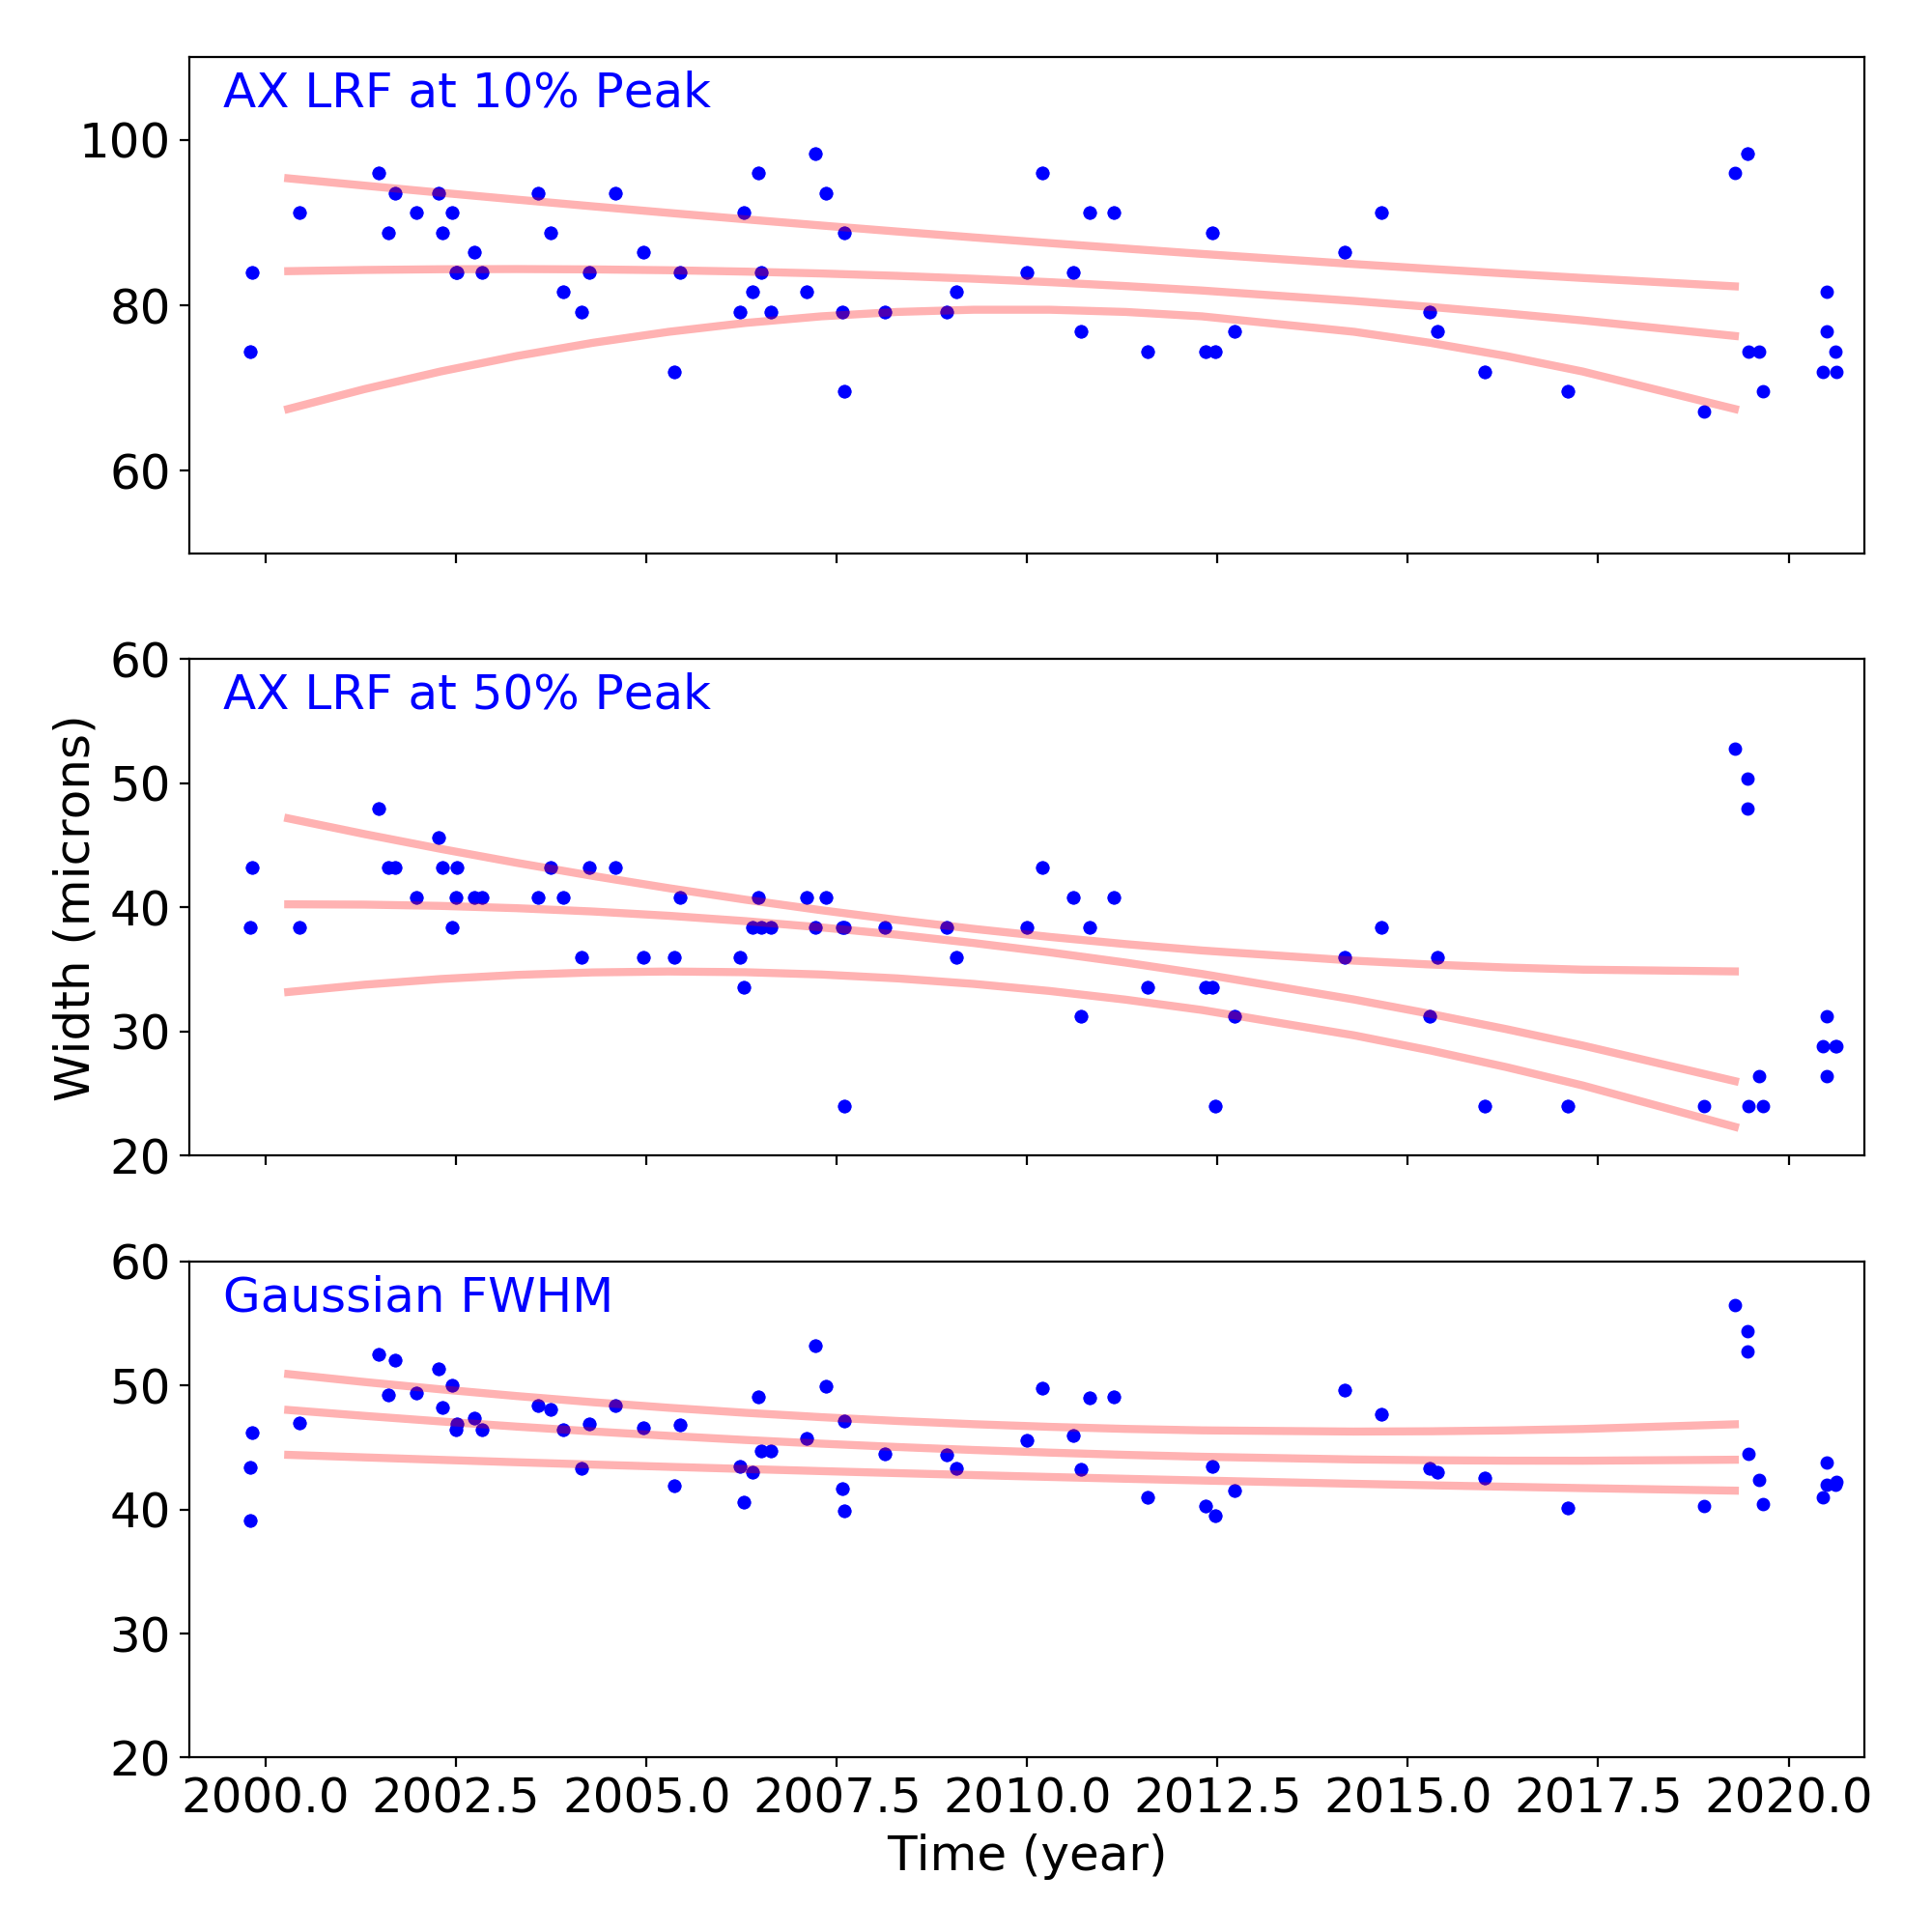
Grating Trends/Focus
We plot the width of the zero order streak of ACIS/HETG observations and the width of the zero order image for HRC/LETG observations of point sources. No significant defocusing trend is seen at this time. See Gratings Trends pages.
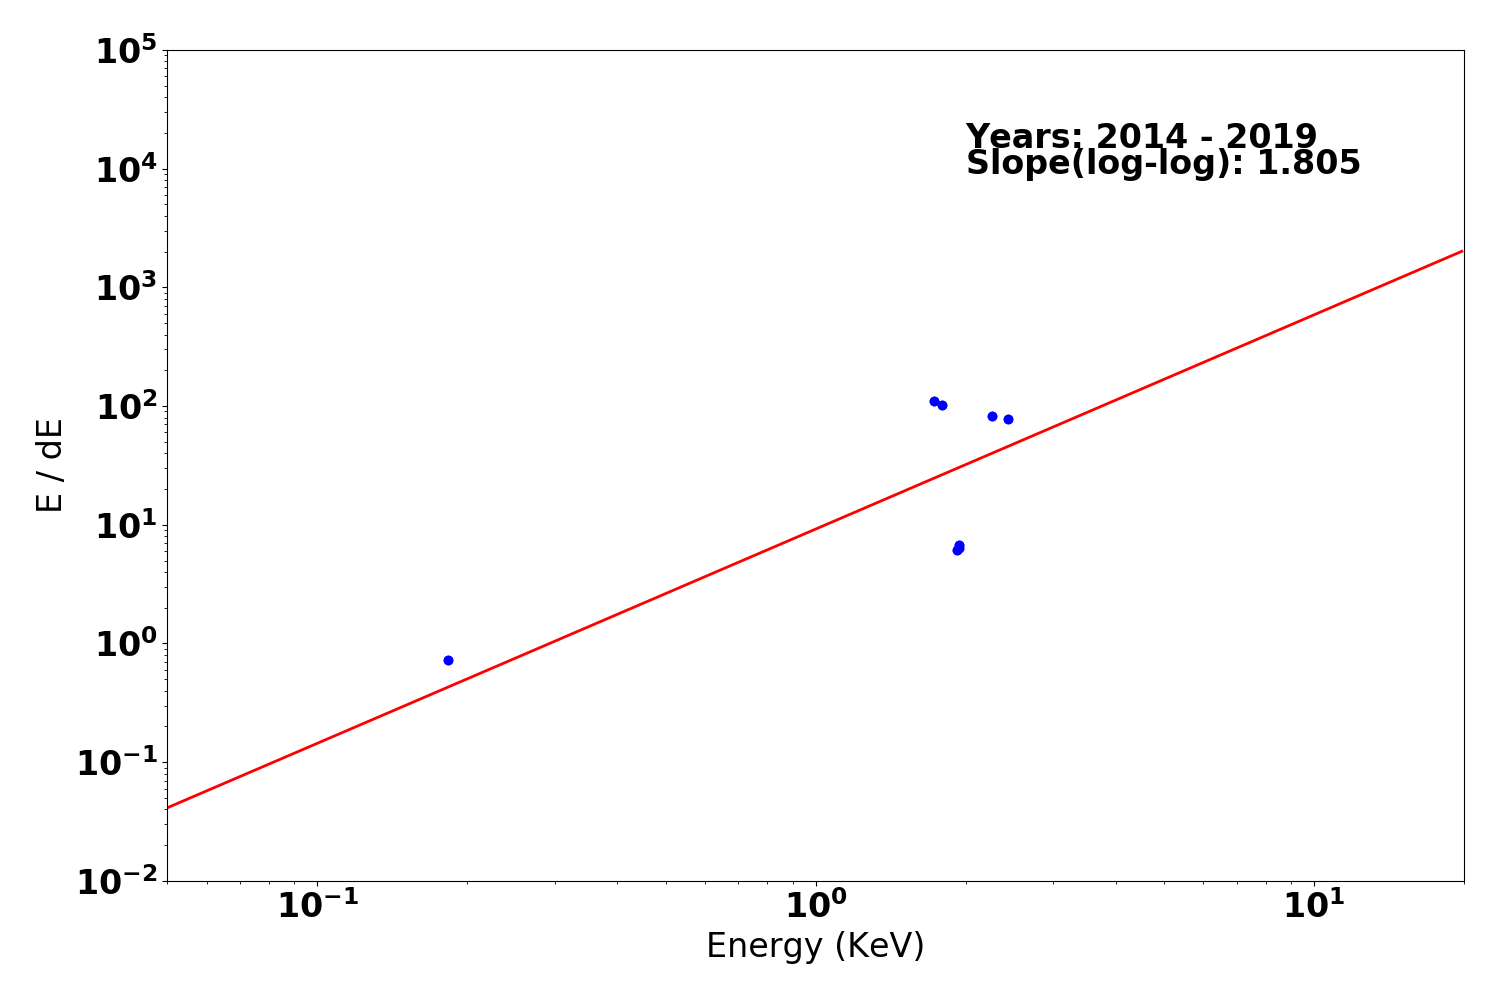
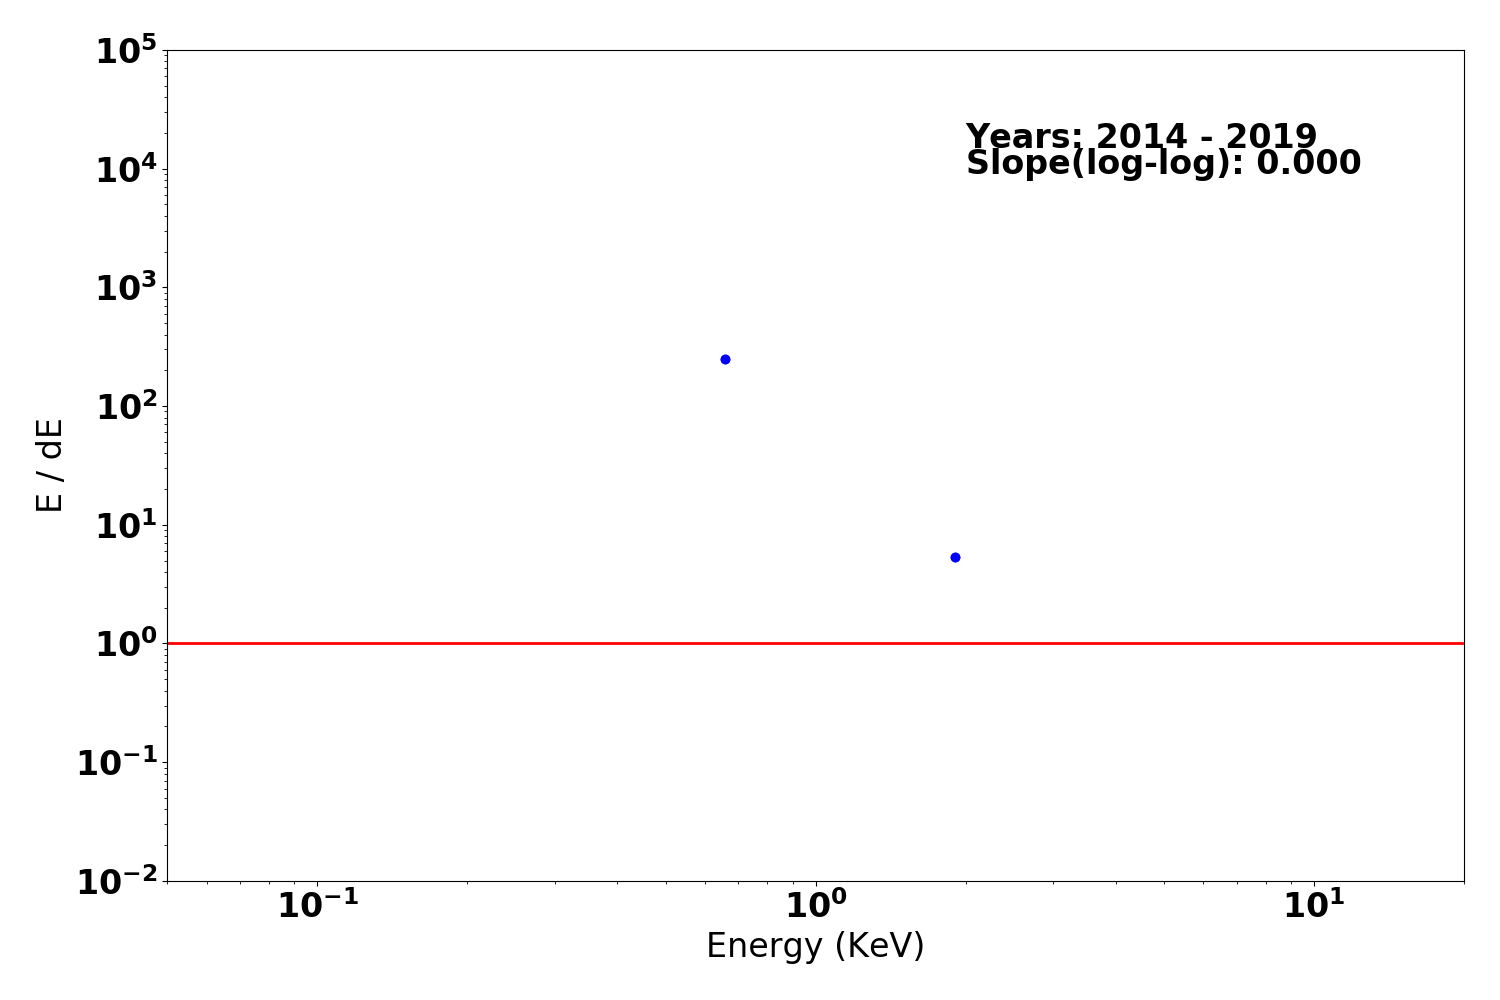
Gratings Resolving Power
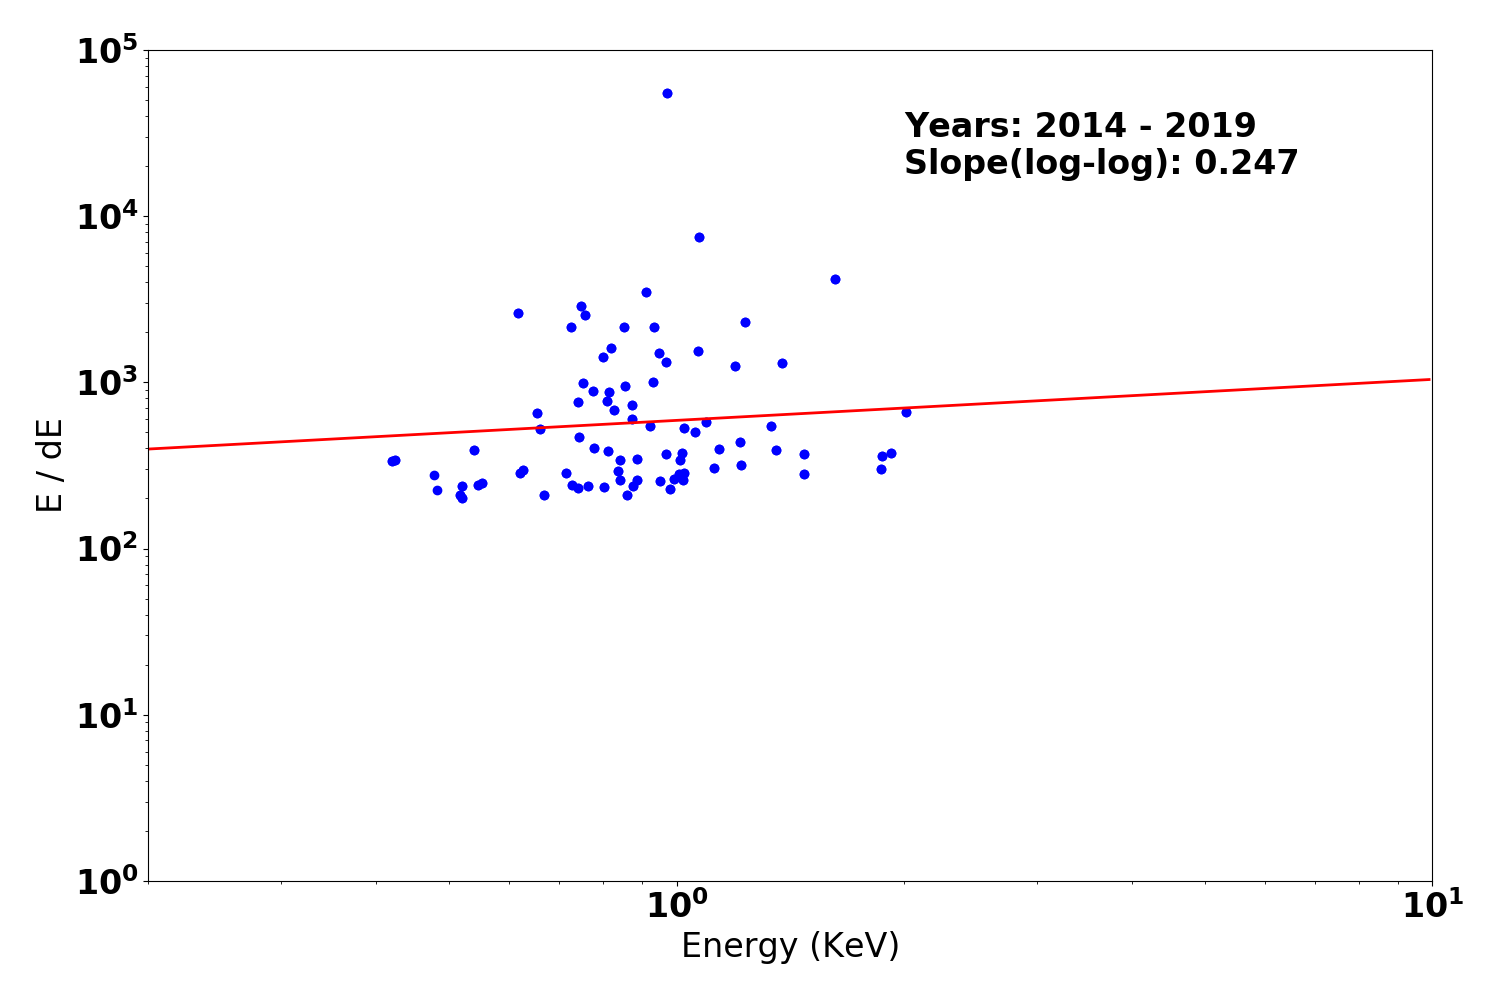
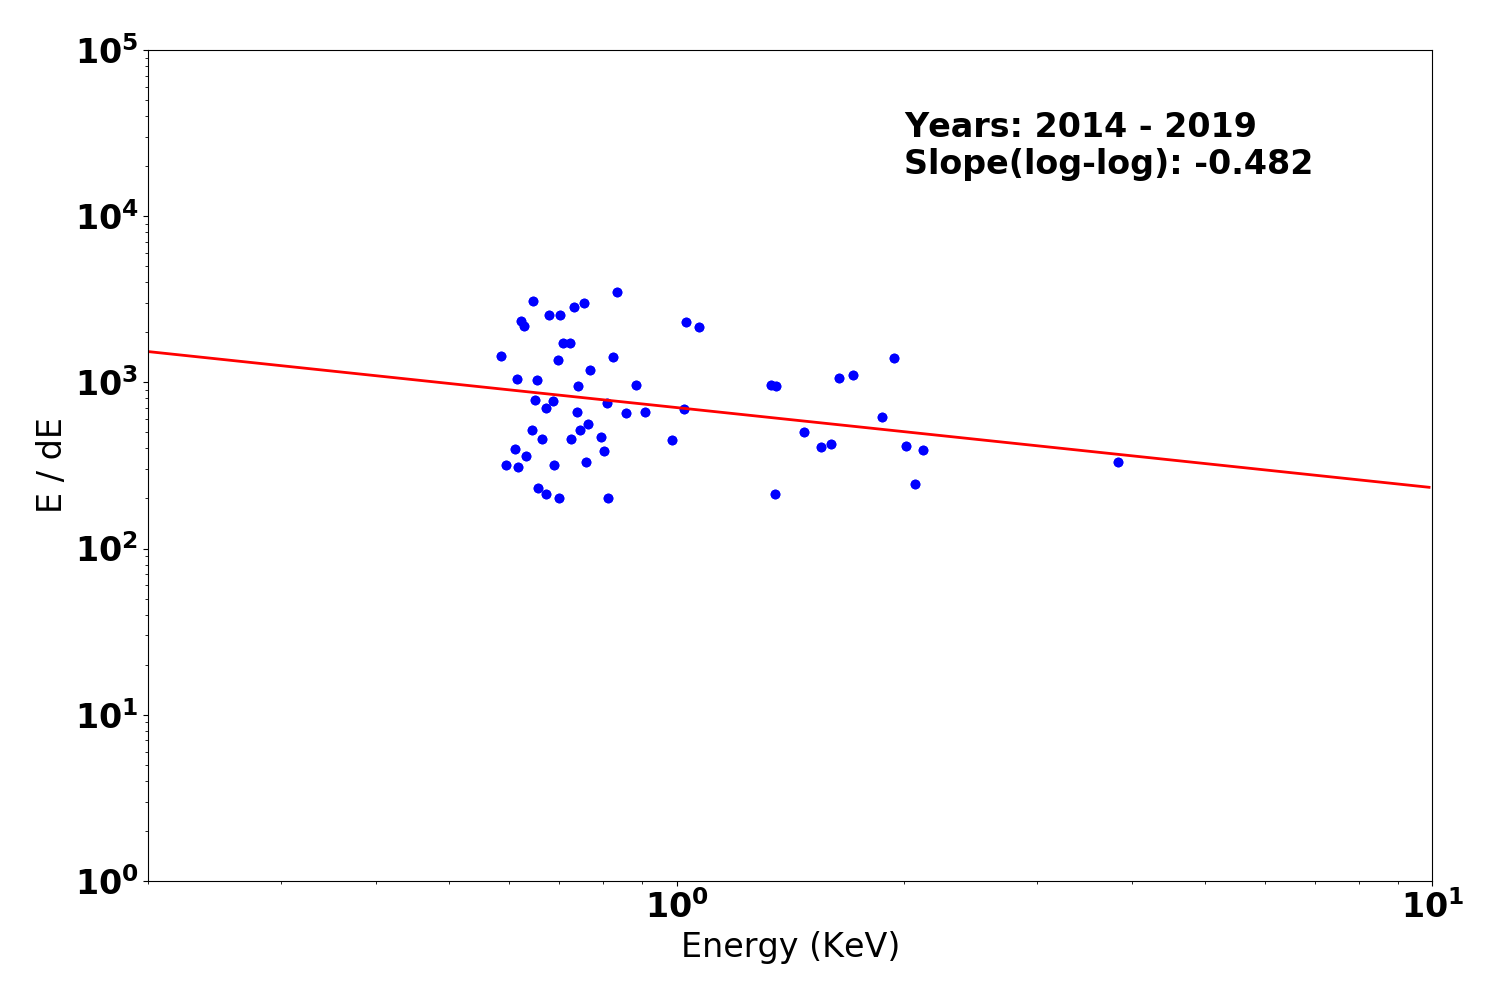
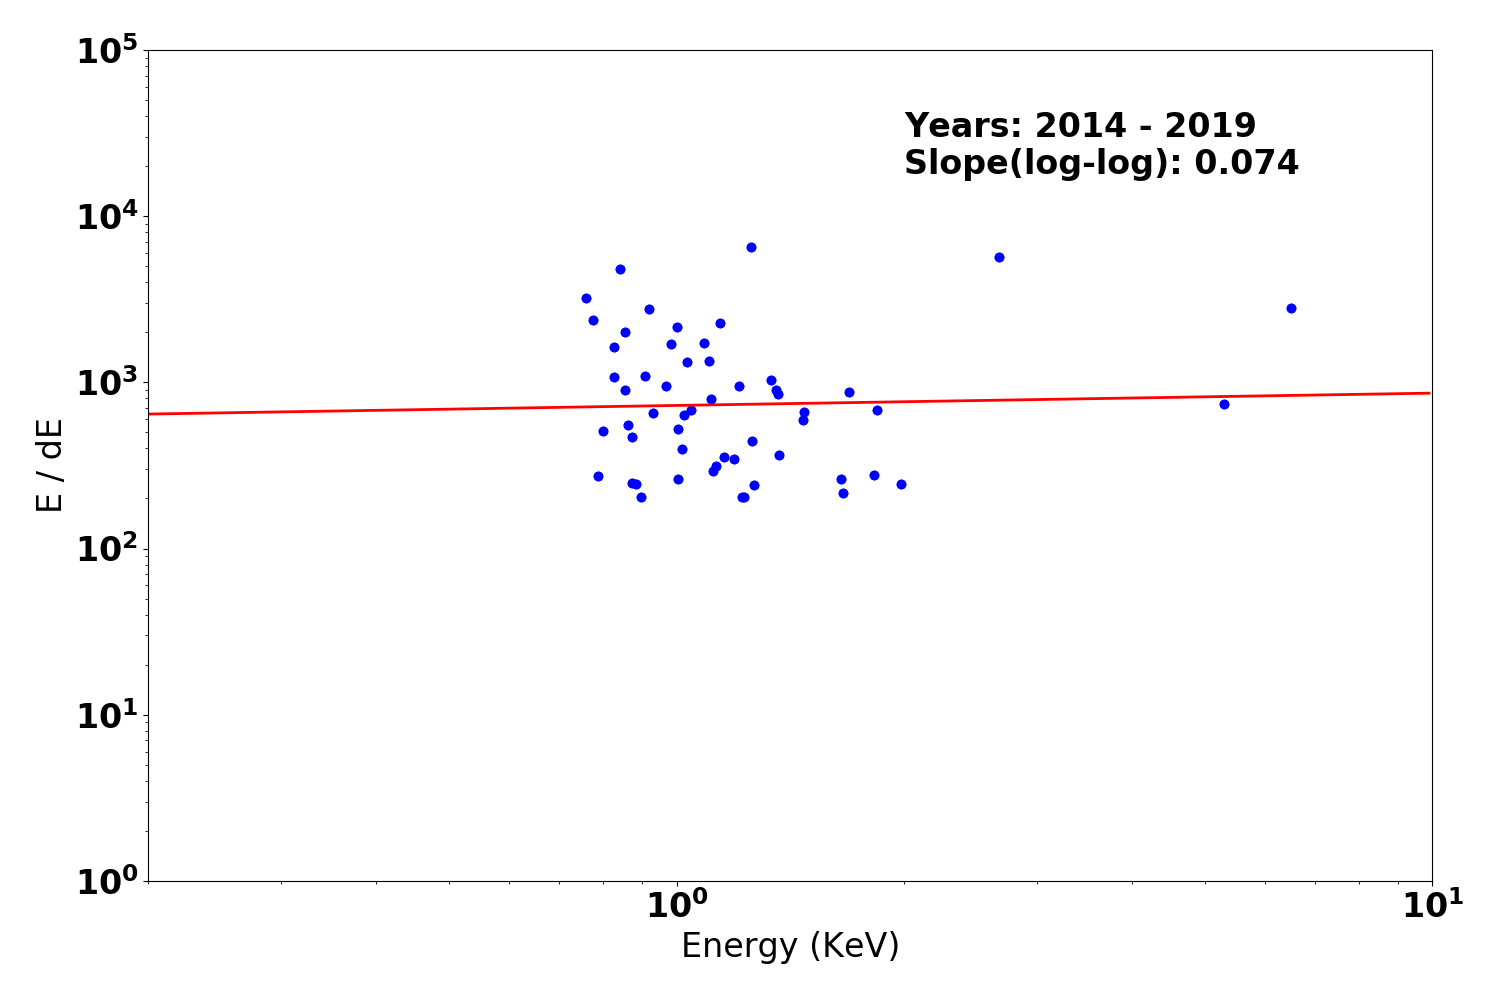
We plot E/dE vs. E for fits to detected lines with fwhm_error/fwhm less than 0.15 for the plus and minus arms of HEG, MEG, and LEG. Also shown are conservative (dotted line) and optimistic (dashed line) pre-launch resolving power expectations.
We have selected only calibration observations of Capella, HR1099, and Sigma Gem. See MIT technotes for a parallel analysis.
| Year 2014 - | |
|---|---|
| Letg minus side | Letg plus side |
 |
 |
| Metg minus side | Metg plus side |
 |
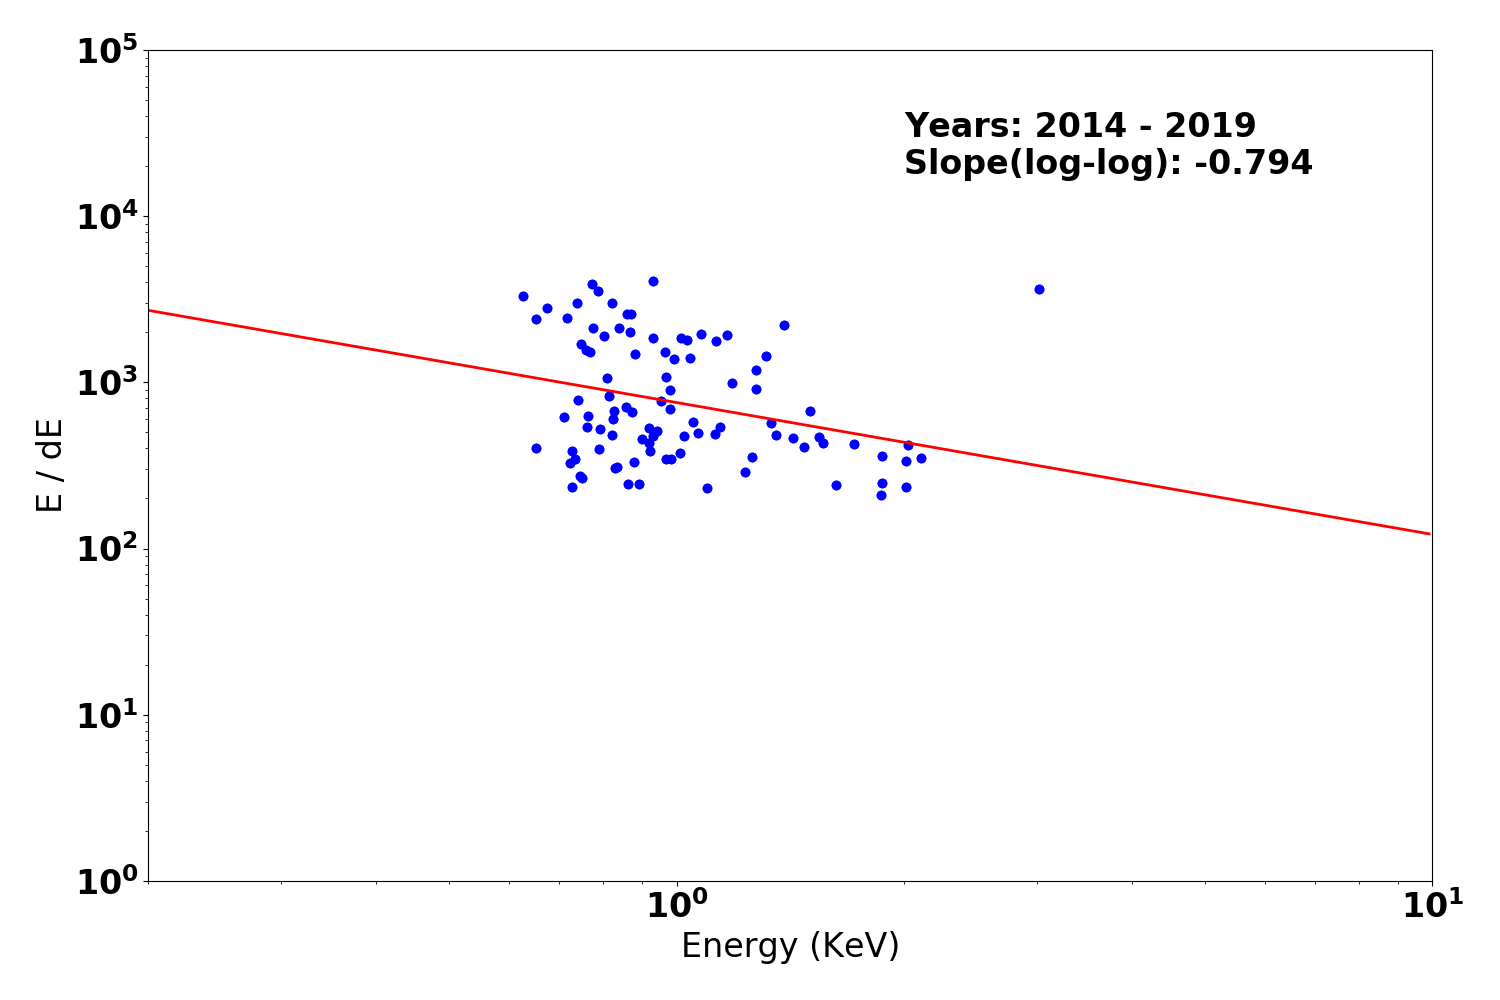 |
| Hetg minus side | Hetg plus side |
 |
 |
PCAD
ACA Trending
| ACIS |
)
|
)
|
)
|
|
|---|---|---|---|---|
)
|
)
|
)
| ||
| HRCI |
)
|
)
|
)
|
)
|
| HRCI |
)
|
)
|
)
|
)
|
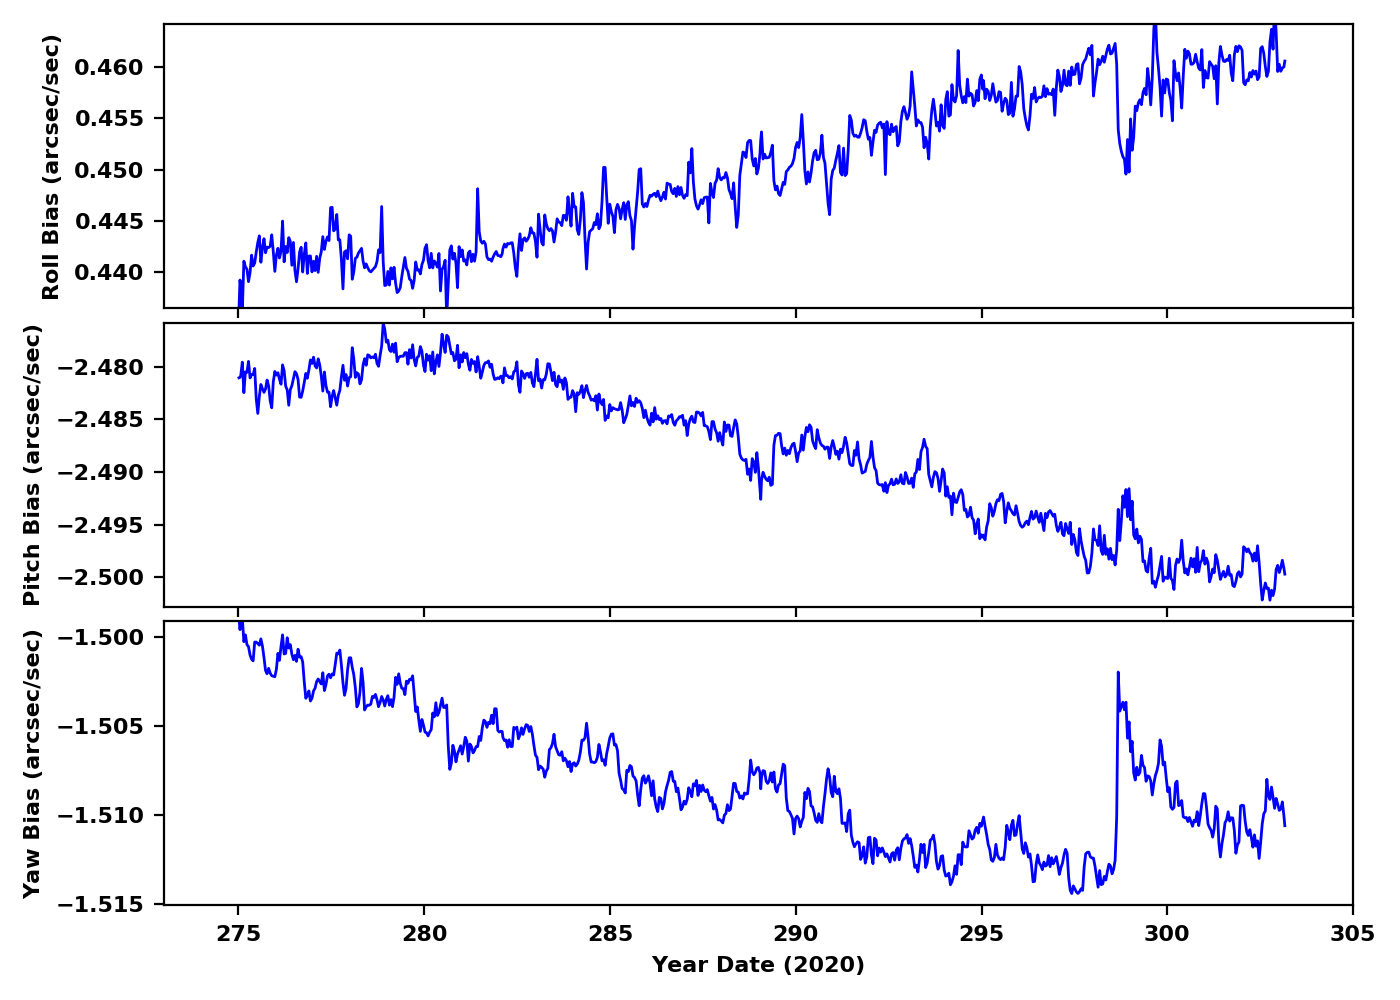
Gyro Bias Drift
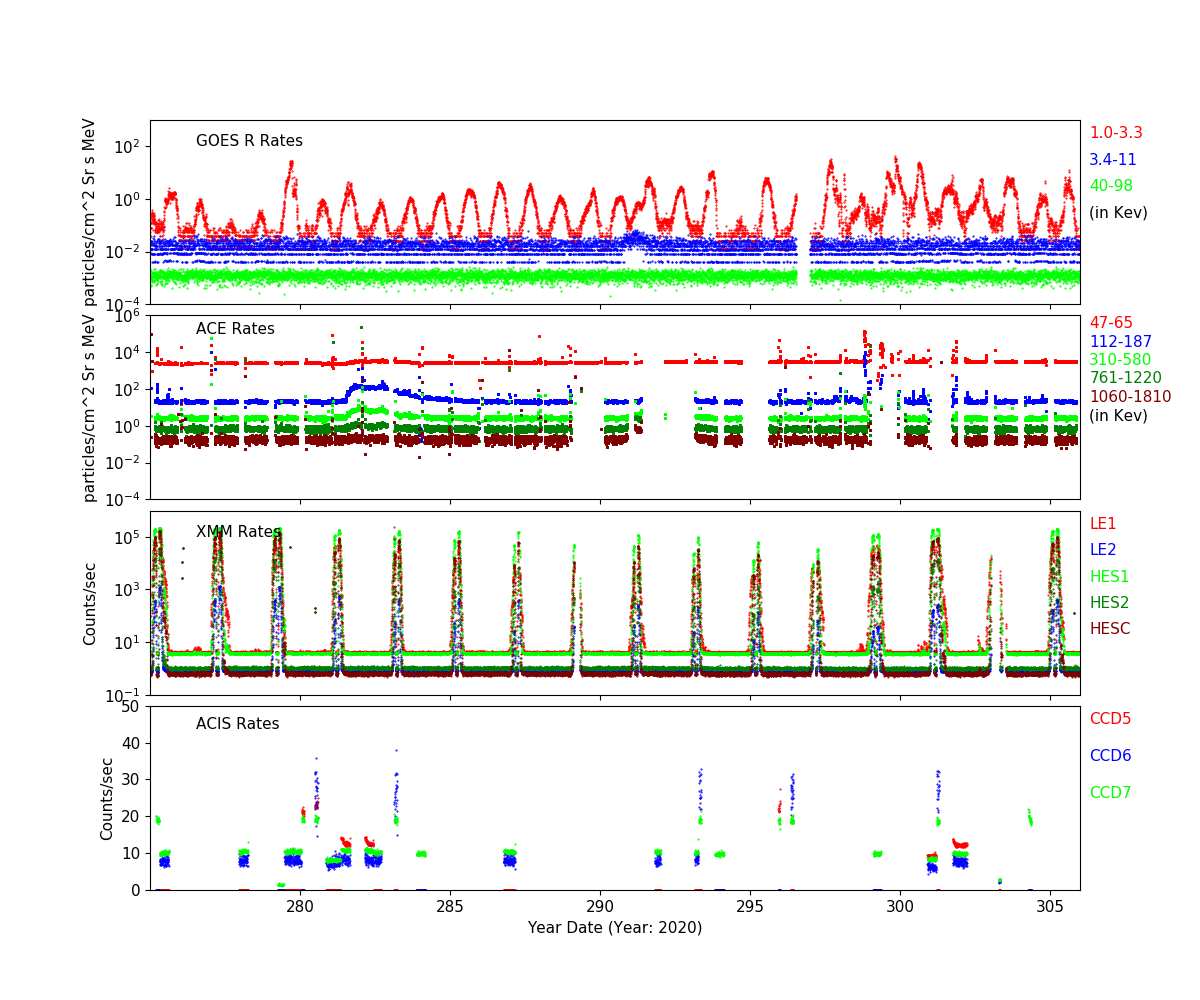
Radiation History
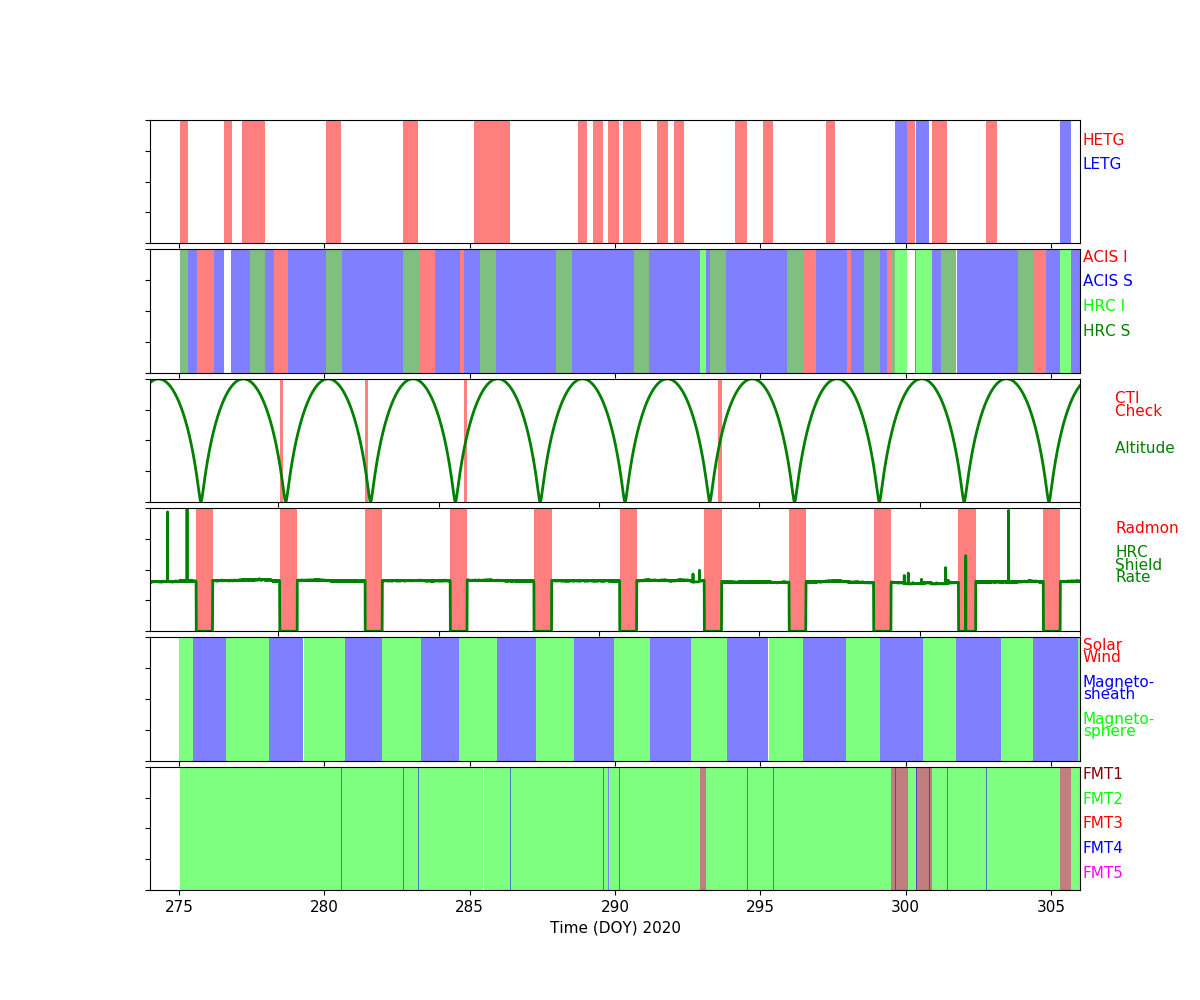
Radiation Count Rates of Oct 2020
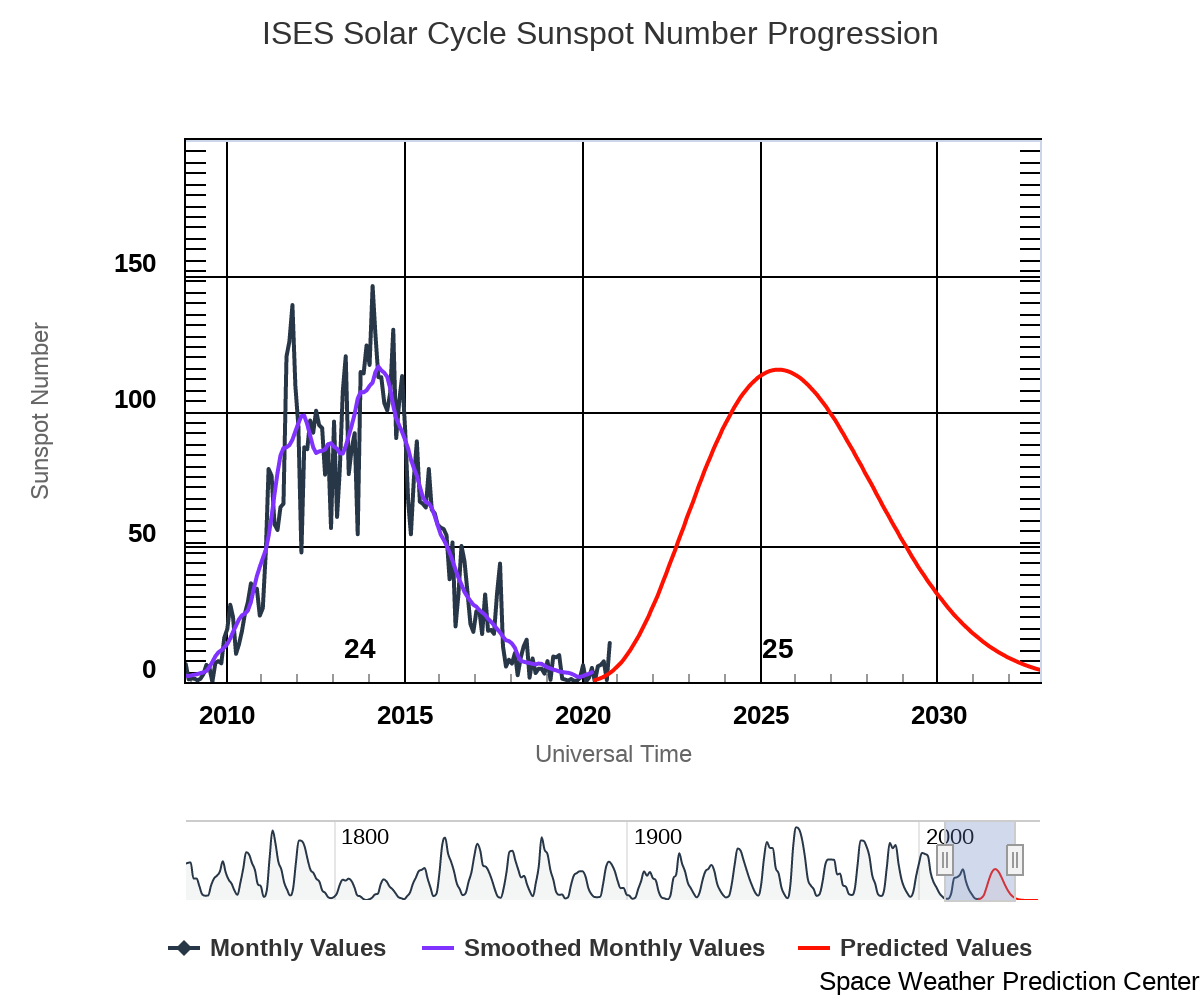
Sun Spot History (See:NOAA Page)
SIM
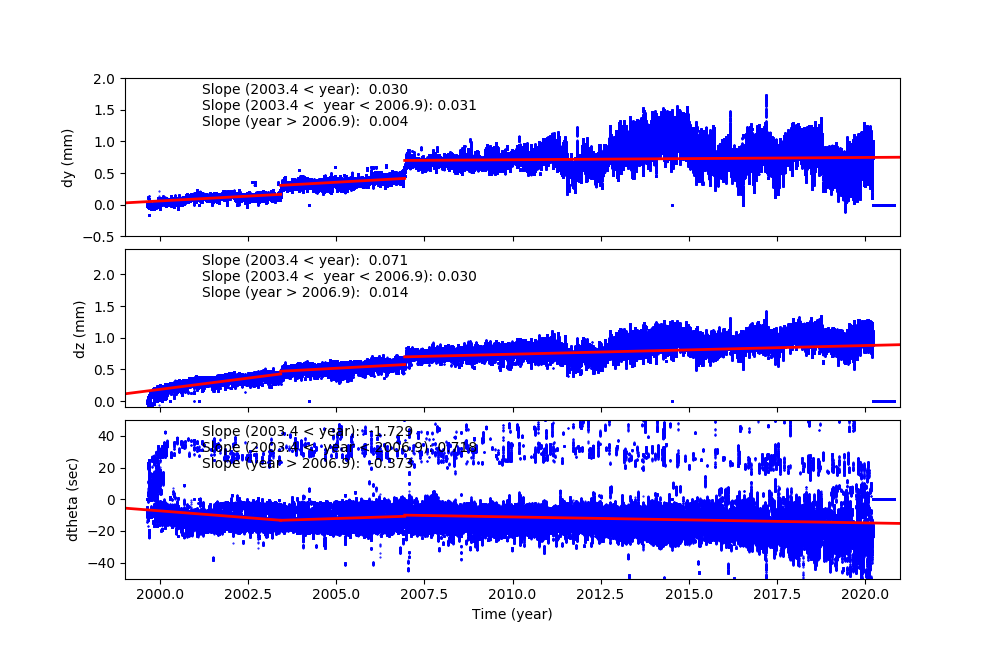
SIM Shift and Twist
SIM Shift and Twist Trend The following plots show trends of SIM shifts (dy and dz) and twist (dtheta). All quantities are directly taken from pcaf*_asol1.fits files. The units are mm for dy and dz, and degree for dtheta. We fit three lines separated before and after (Days of Mission)= 1400 (May 21, 2003), 2700 (Dec 11, 2006), and 4400 (Aug 07, 2011). The unit of slopes are mm per day or degree per day.
The sudden shift around DOM = 1400, 2700 and 4400 are due to fid light drift (see a memo by Aldcroft fiducial light drift). On the dtheta plot, two tracks are clearly observed. The track around 0.01 is due to HRC-I, and all others are clustered around -0.002. For more detail, please see SIM Shift and Twist Trend page
Trending
Quarterly Trends
- EPS Batteries
| Previous Quarter | |||||||
| MSID | MEAN | RMS | DELTA/YR | DELTA/YR/YR | UNITS | DESCRIPTION | |
| eb2ci | off | -8.761e-05 | 4.169e-05 | 0.28 +/- 0.10 | -(9.65+/-14.21)e-4 | AMP | BATT 2 CHARGE CURRENT | on | -0.011 | 0.012 | 0.33 +/- 0.33 | (0.00+/-0.00)e0 |
|---|---|---|---|---|---|---|---|
| eb2di | off | -3.005e-04 | 8.881e-05 | 0.02 +/- 0.21 | (2.84+/-1.70)e-5 | AMP | BATT 2 DISCHARGE CURRENT | on | 0.003 | 0.059 | 0.42 +/- 1.54 | (0.00+/-0.00)e0 |
| eb2v | off | 7.587e-04 | 4.604e-05 | 32.30 +/- 0.11 | -0.00 +/- 0.00 | V | BATT 2 VOLTAGE | on | 0.009 | 0.027 | 31.99 +/- 0.71 | (0.00+/-0.00)e0 |
| ecnv1v | -1.335e-05 | 3.034e-06 | 14.89 +/- 0.01 | 0.00 +/- 0.00 | V | CONV 1 +15V OUTPUT | |
| ecnv2v | 1.417e-05 | 4.992e-06 | 14.85 +/- 0.01 | 0.01 +/- 0.00 | V | CONV 2 +15V OUTPUT | |
| ecnv3v | -1.168e-13 | 999.000 | 15.29 +/- 0.00 | (2.17+/-4.78)e-4 | V | CONV 3 +15V OUTPUT | |
- Spacecraft Electronics
| Previous Quarter | |||||||
| MSID | MEAN | RMS | DELTA/YR | DELTA/YR/YR | UNITS | DESCRIPTION | |
| elbi | -0.003 | 6.007e-04 | 54.69 +/- 1.39 | -0.20 +/- 0.23 | AMP | LOAD BUS CURRENT | |
|---|---|---|---|---|---|---|---|
| elbv | off | -0.004 | 4.364e-05 | 28.67 +/- 0.18 | -0.01 +/- 0.02 | V | LOAD BUS VOLTAGE | on | -0.014 | 0.006 | 28.81 +/- 0.17 | (0.00+/-0.00)e0 |
- OBA Heater
| Previous Quarter | |||||||
| MSID | MEAN | RMS | DELTA/YR | DELTA/YR/YR | UNITS | DESCRIPTION | |
| oobthr04 | -0.011 | 6.429e-04 | (3.00+/-0.02)e2 | 0.28 +/- 0.35 | K | RT 27: HRMA STRUT | |
|---|---|---|---|---|---|---|---|
| oobthr12 | -0.017 | 9.640e-04 | (2.99+/-0.02)e2 | 0.11 +/- 0.52 | K | RT 35: OBA CONE | |
| oobthr26 | -0.013 | 0.002 | (3.02+/-0.04)e2 | 1.08 +/- 0.78 | K | RT 48: OBA CONE | |
| oobthr38 | -1.040e-04 | 4.635e-06 | (2.83+/-0.00)e2 | 0.00 +/- 0.00 | K | RT 60: TFTE CONE | |
| oobthr44 | -0.013 | 8.981e-04 | (3.01+/-0.02)e2 | 0.41 +/- 0.62 | K | RT 66: TFTE COVER | |
| oobthr50 | -0.011 | 8.755e-04 | (2.95+/-0.02)e2 | 0.67 +/- 0.50 | K | RT 76: S/C STRUT | |
Spacecraft Motions
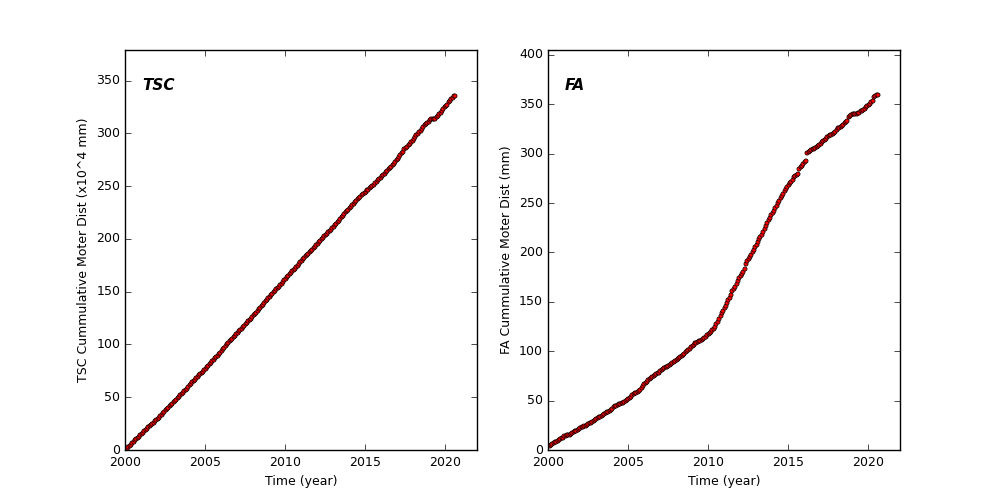
TSC and FA Cummulative Moter Distance
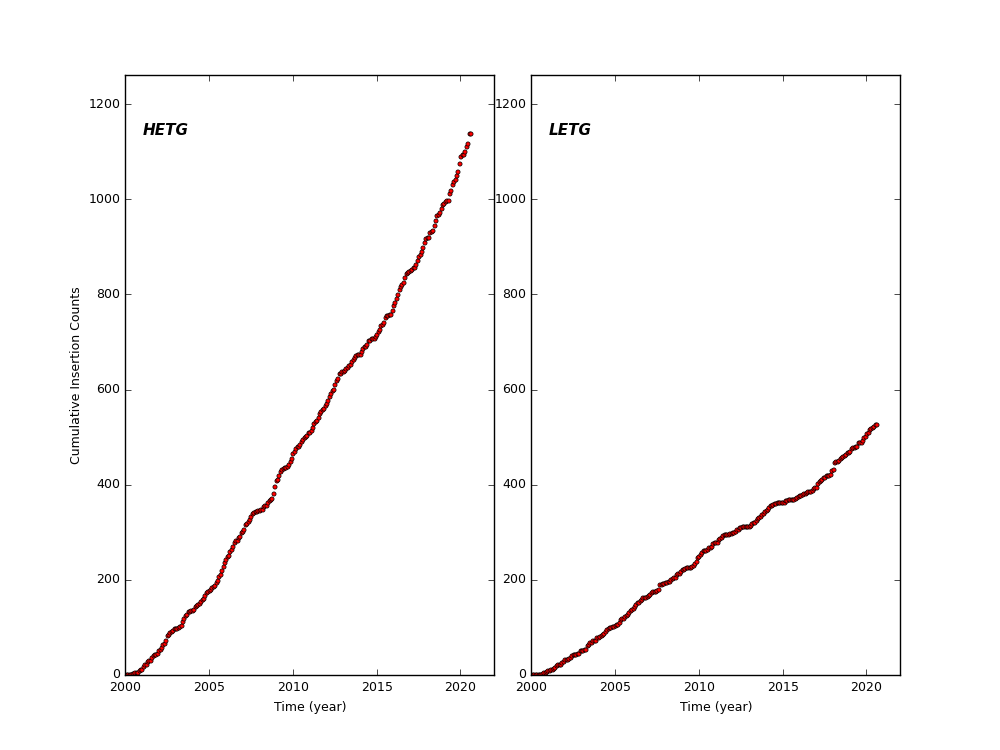
HETG and LETG Cummulative Insertion Counts
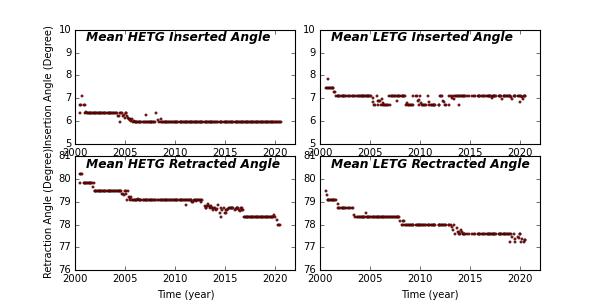
HETG/LETG Insertion/Retraction Angle
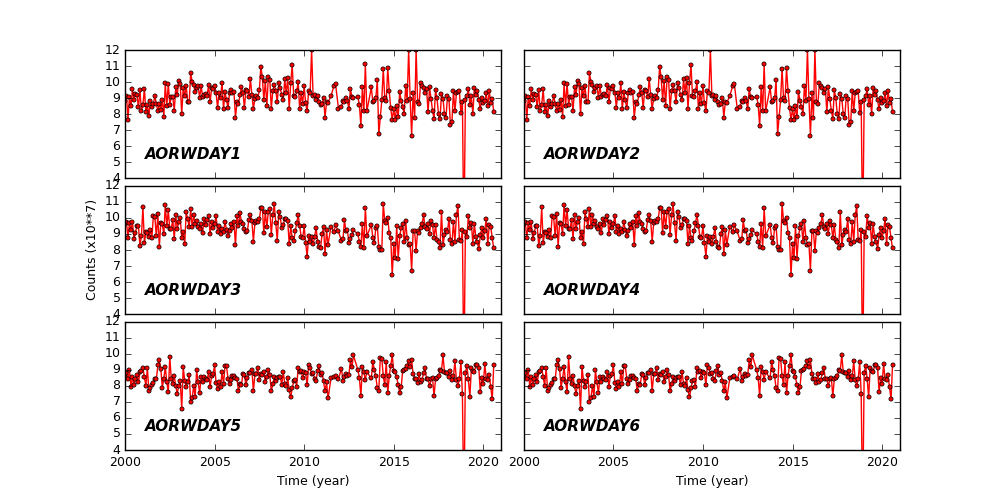
Reaction Wheel Rotations