ACIS
ACIS DOSE Registered-Photon-Map
The steps we took to compute the dose map are;
- Level 1 Event files for a specified month are obtained from archive.
- Image data including I2, I3, S2, S3 CCDs are extracted from all event files.
- All the extracted image data were merged to create a month long exposure map for the month.
- The exposure map is opened with ds9, and check a distribution of count rates against energy. From this, estimate the upper threshold value. Any events beyond this upper threshold are assumed erroneous events such as bad pixels.
- Using this upper threshold, the data is filtered, and create a cleaned exposure map for the month.
- The exposure map from each month from the Sep 1999 is added up to create a cumulative exposure map for each month.
- Using fimgstatistic, we compute count rate statistics for each CCDs.
- For observations with high data drop rates (e.g., Crab nebula, Cas A), we corrected the observations by adding events.
Please check more detail plots at Telemetered Photon Dose Trend page.
)
)
)
Statistics:
# IMAGE     NPIX     MEAN        RMS        MIN     MAX
ACIS_nov20 6004901       7.947         10.909           0.0     1010


I2 node 0  262654	4.290538	2.426819	0.0	 28.0
I2 node 1  262654	4.419629	2.640809	0.0	462.0
I2 node 2  262654	4.291528	2.372684	0.0	 41.0
I2 node 3  262654	4.253056	2.479239	0.0	140.0

I3 node 0  262654	7.010239	3.247717	0.0	 96.0
I3 node 1  262654	6.801335	3.688425	0.0	1010.0
I3 node 2  262654	6.580619	3.013179	0.0	 78.0
I3 node 3  262654	6.739023	3.132194	0.0	113.0

S2 node 0  262654	9.881426	3.998121	0.0	134.0
S2 node 1  262654	10.543277	4.837434	0.0	310.0
S2 node 2  262654	12.016686	7.938049	0.0	363.0
S2 node 3  262654	13.411546	13.280538	0.0	586.0

S3 node 0  262654	18.982809	15.383477	1.0	259.0
S3 node 1  262654	19.934991	9.895324	0.0	148.0
S3 node 2  262654	20.155450	9.155465	2.0	133.0
S3 node 3  262654	16.914461	5.522346	0.0	 74.0
)
)
)
Statistics:
 IMAGE     NPIX      MEAN        RMS           MIN      MAX
ACIS_total   6004901       2444.407         3142.455           0.0   136129


I2 node 0  262654	2113.751854	422.787172	448.0	12425.0
I2 node 1  262654	2223.053494	596.896405	464.0	112694.0
I2 node 2  262654	2250.149599	475.706934	477.0	12850.0
I2 node 3  262654	2255.526263	581.837422	452.0	28721.0

I3 node 0  262654	2416.539748	594.263448	449.0	12216.0
I3 node 1  262654	2494.755282	1713.326332	482.0	55542.0
I3 node 2  262654	2214.735750	413.336213	450.0	12962.0
I3 node 3  262654	2207.211067	444.834950	414.0	33632.0

S2 node 0  262654	2851.738768	454.668515	1568.0	22157.0
S2 node 1  262654	3022.988698	678.337863	1743.0	16481.0
S2 node 2  262654	3343.712699	674.188252	2164.0	28041.0
S2 node 3  262654	3308.402265	527.011749	1914.0	66247.0

S3 node 0  262654	5050.104844	2408.997555	2205.0	35747.0
S3 node 1  262654	6275.374463	2321.188188	0.0	35733.0
S3 node 2  262654	5010.943513	1286.475394	2225.0	26056.0
S3 node 3  262654	3891.375331	684.710481	2378.0	25446.0
)
|
)
|
)
|
)
|
| Aug 2020 | May 2020 | Feb 2020 | Nov 2019 |
|---|
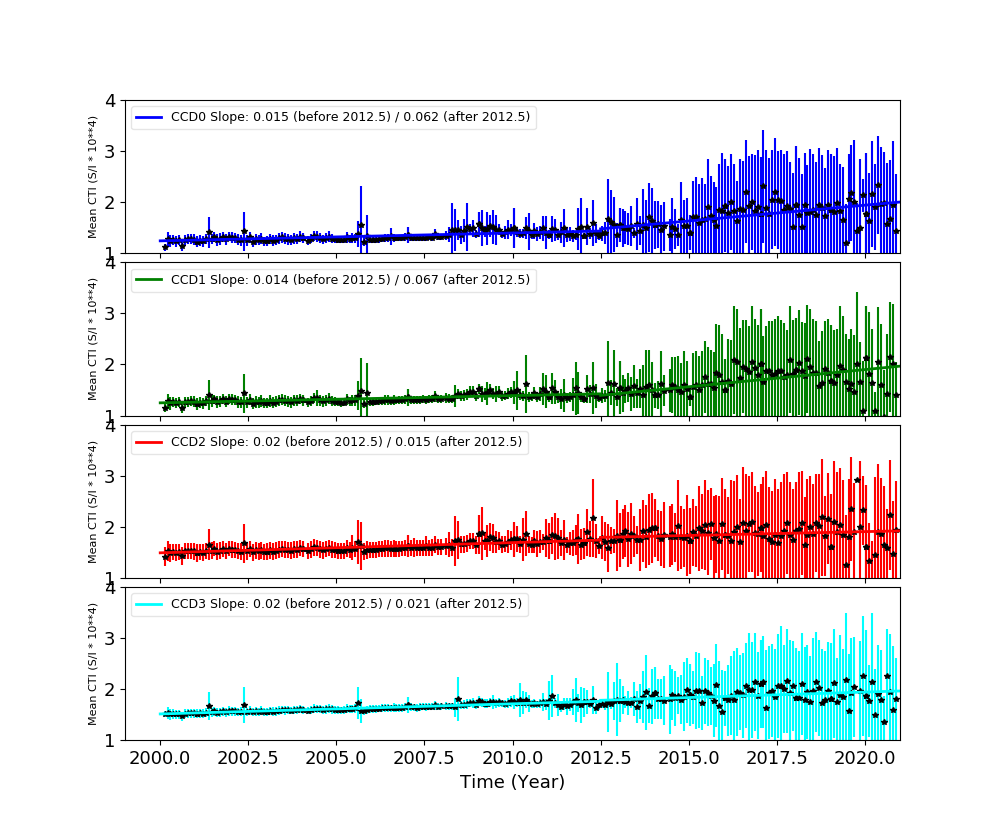
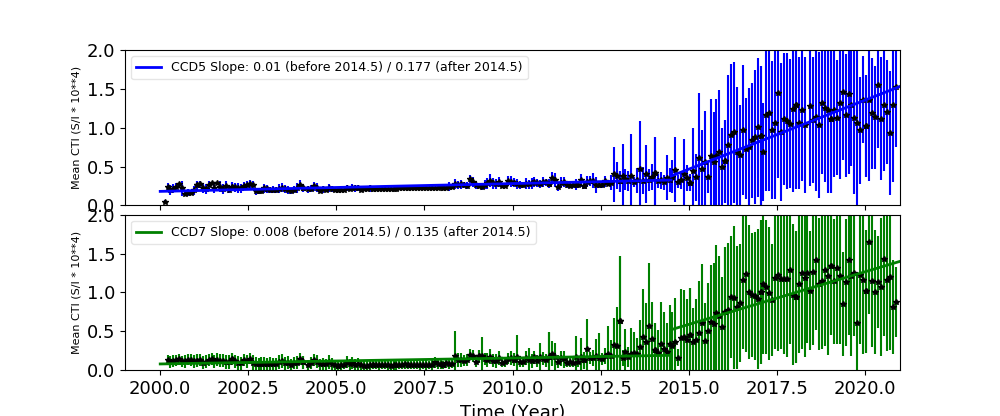
The Mean Detrended CTI
We report CTIs with a refined data definition. CTIs were computed for the temperature dependency corrected data. Please see CTI page for detailed explanation. CTI's are computed for Mn K alpha, and defined as slope/intercept x10^4 of row # vs ADU. Data file: here
Imaging CCDs
Spectral CCDs
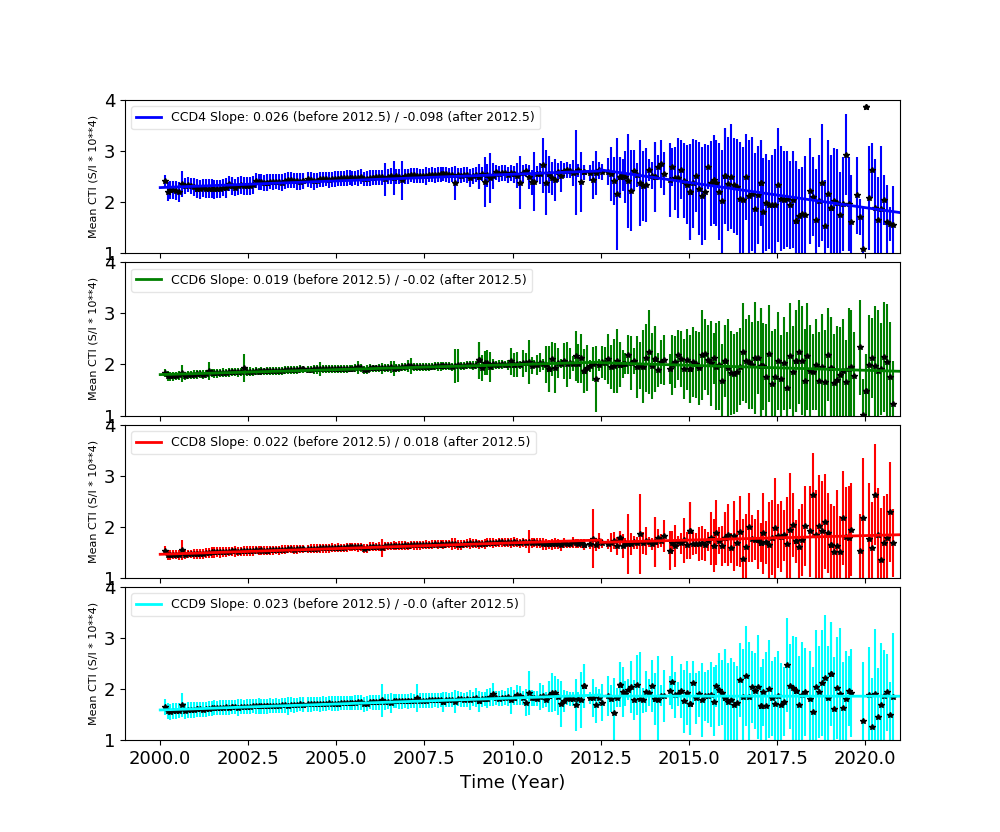
Backside CCDs
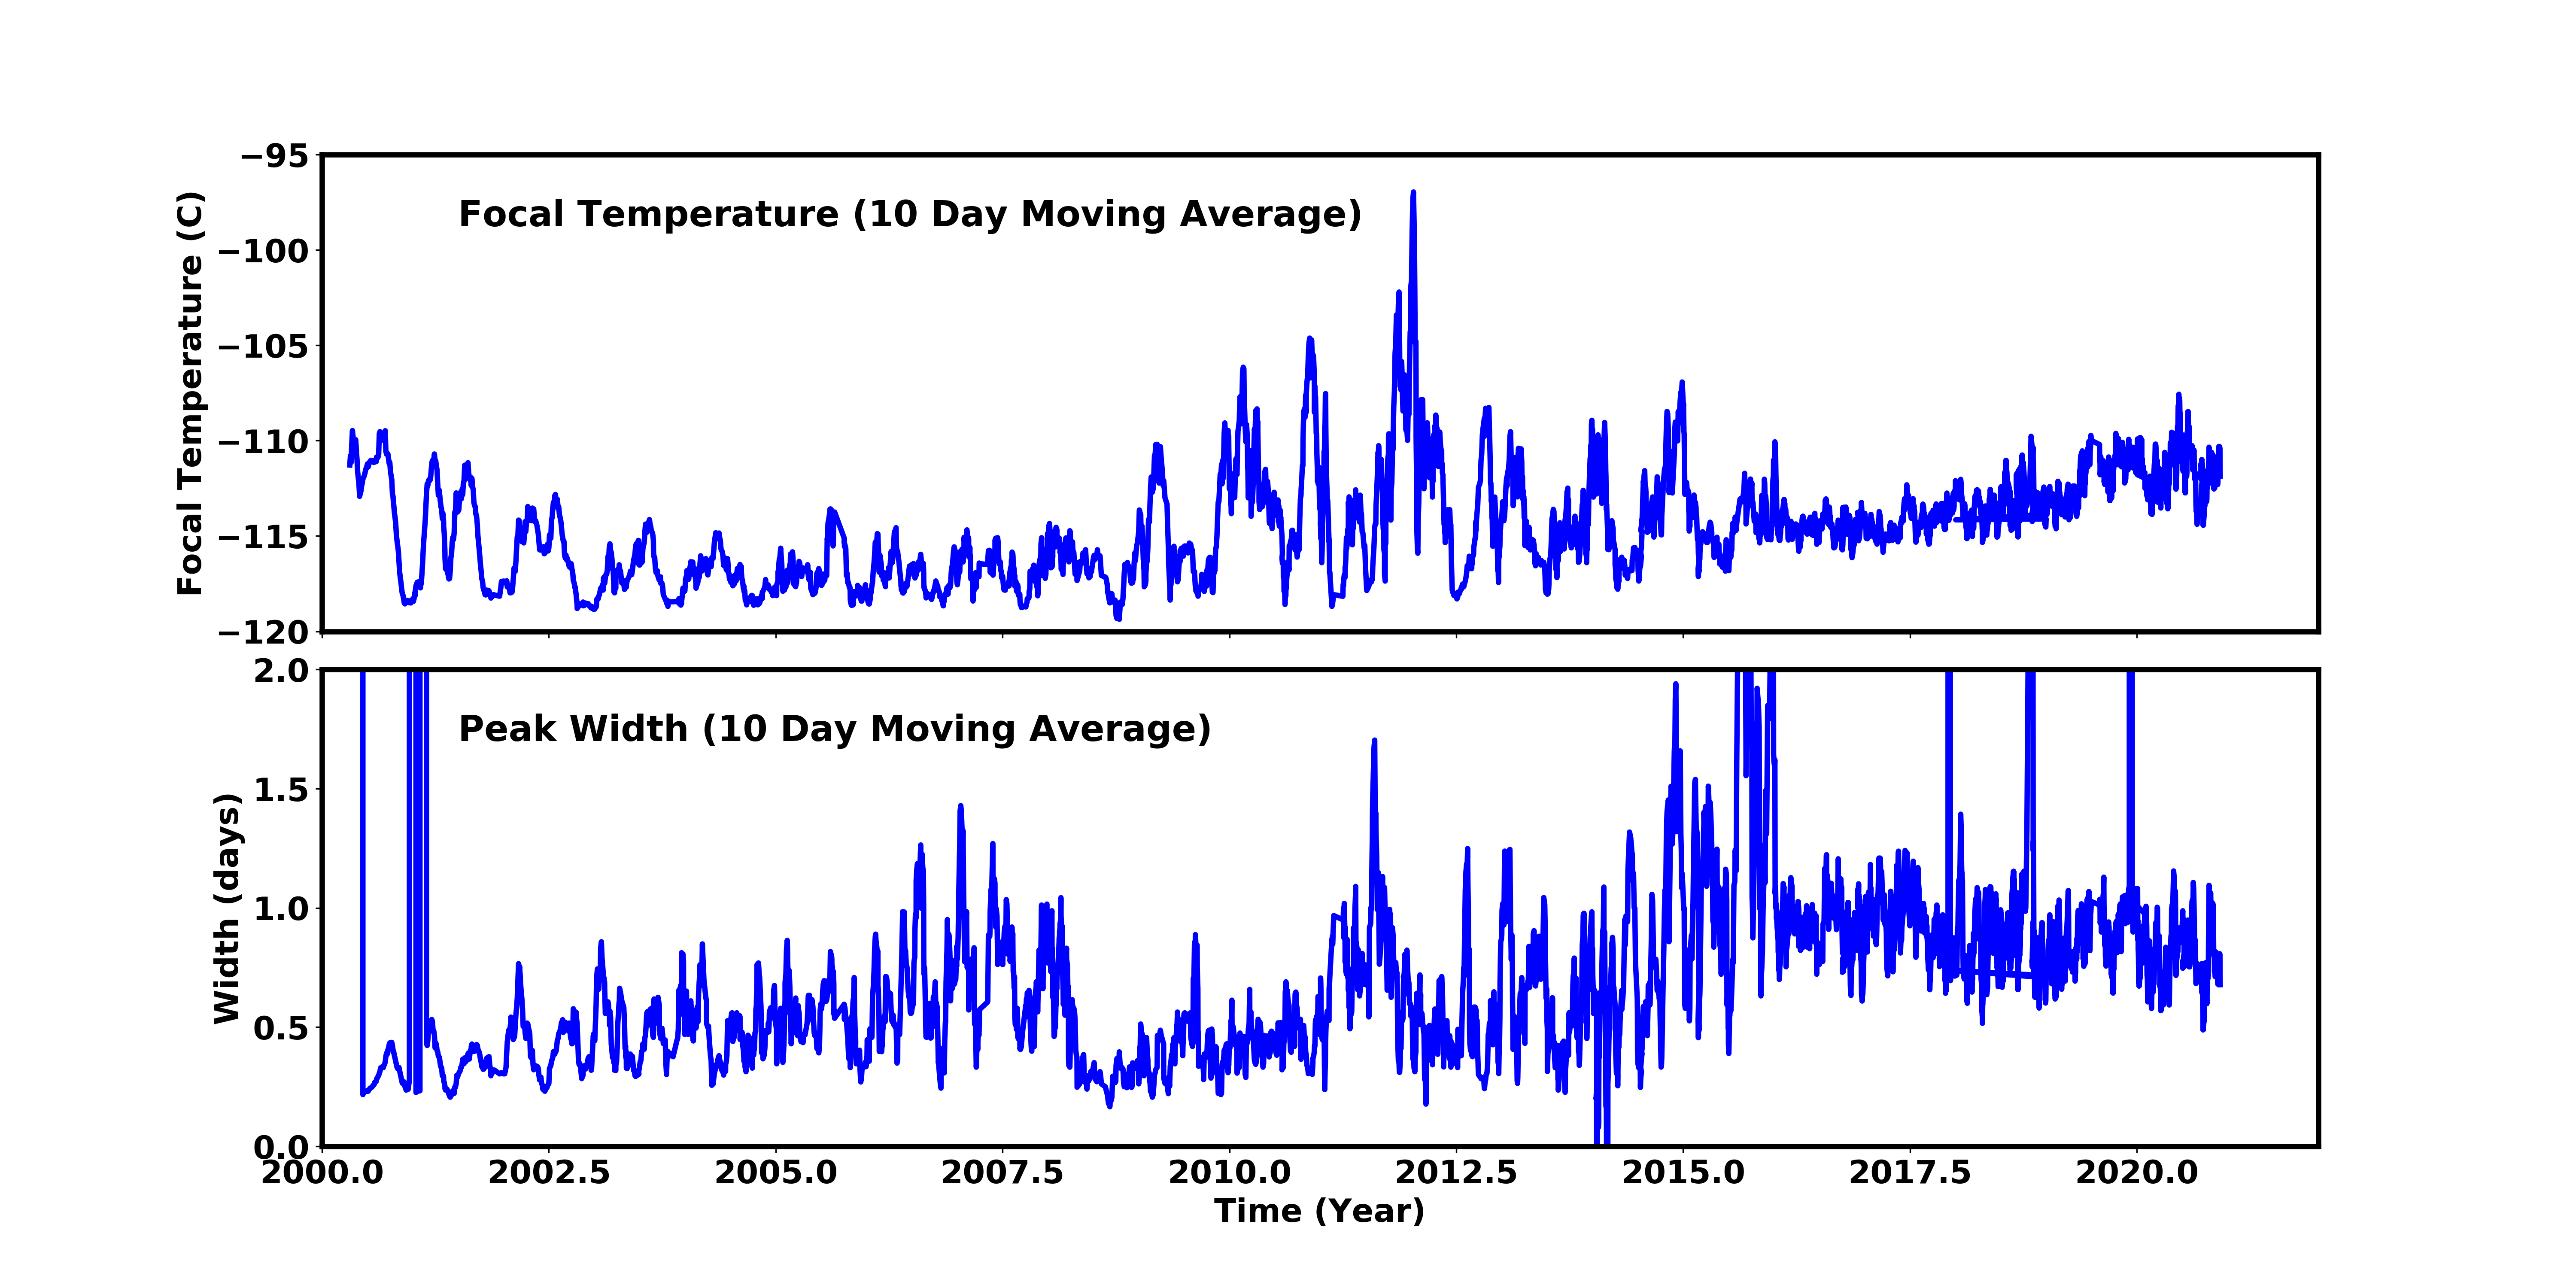
Focal Plane Temperature
Nov 2020 Focal Temperature
| The Mean (max) FPT: | |
|---|---|
| -111.84 | +/- 2.71 C |
| Mean Width: | |
| 0.74 | +/- 0.25 days |
Averaged Focal Plane Temperature
We are using 10 period moving averages to show trends of peak temperatures and peak widths. Note, the gaps in the width plot are due to missing/corrupted data.
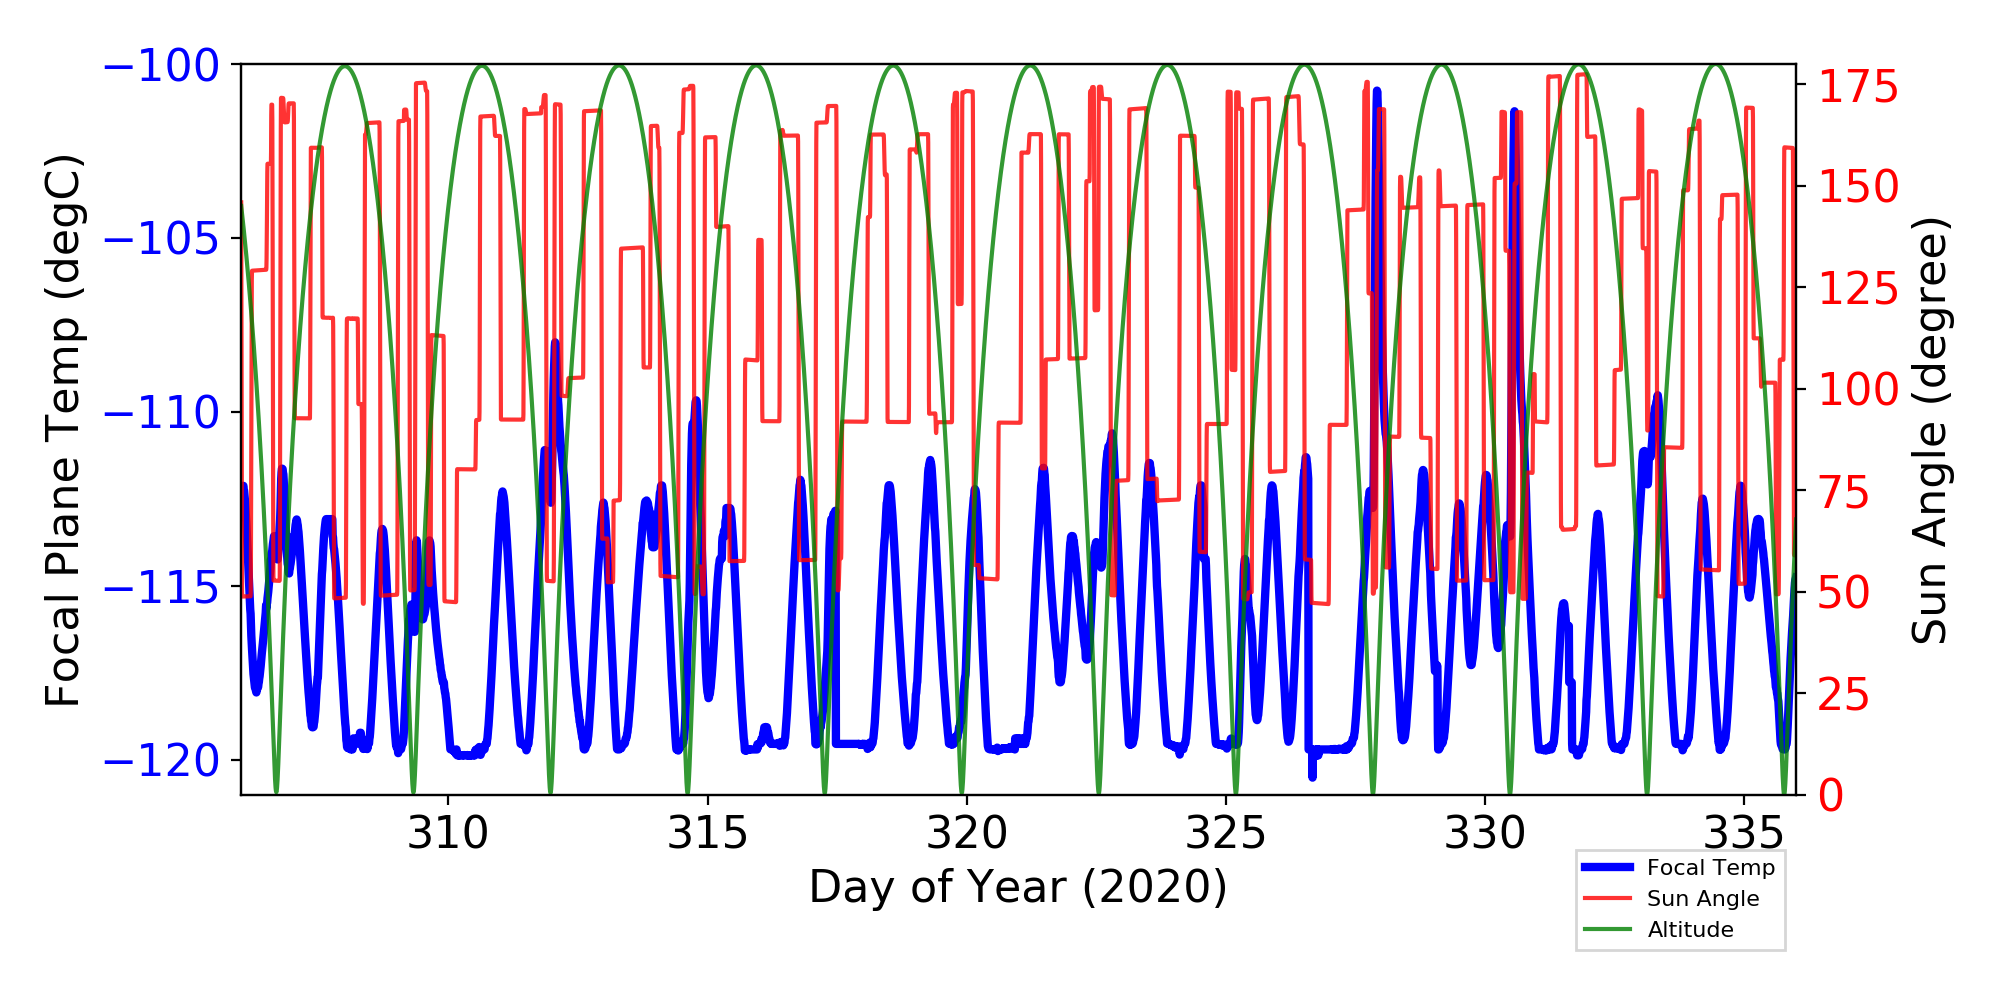
Focal Plane Temperature, Sun Angle and Altitude
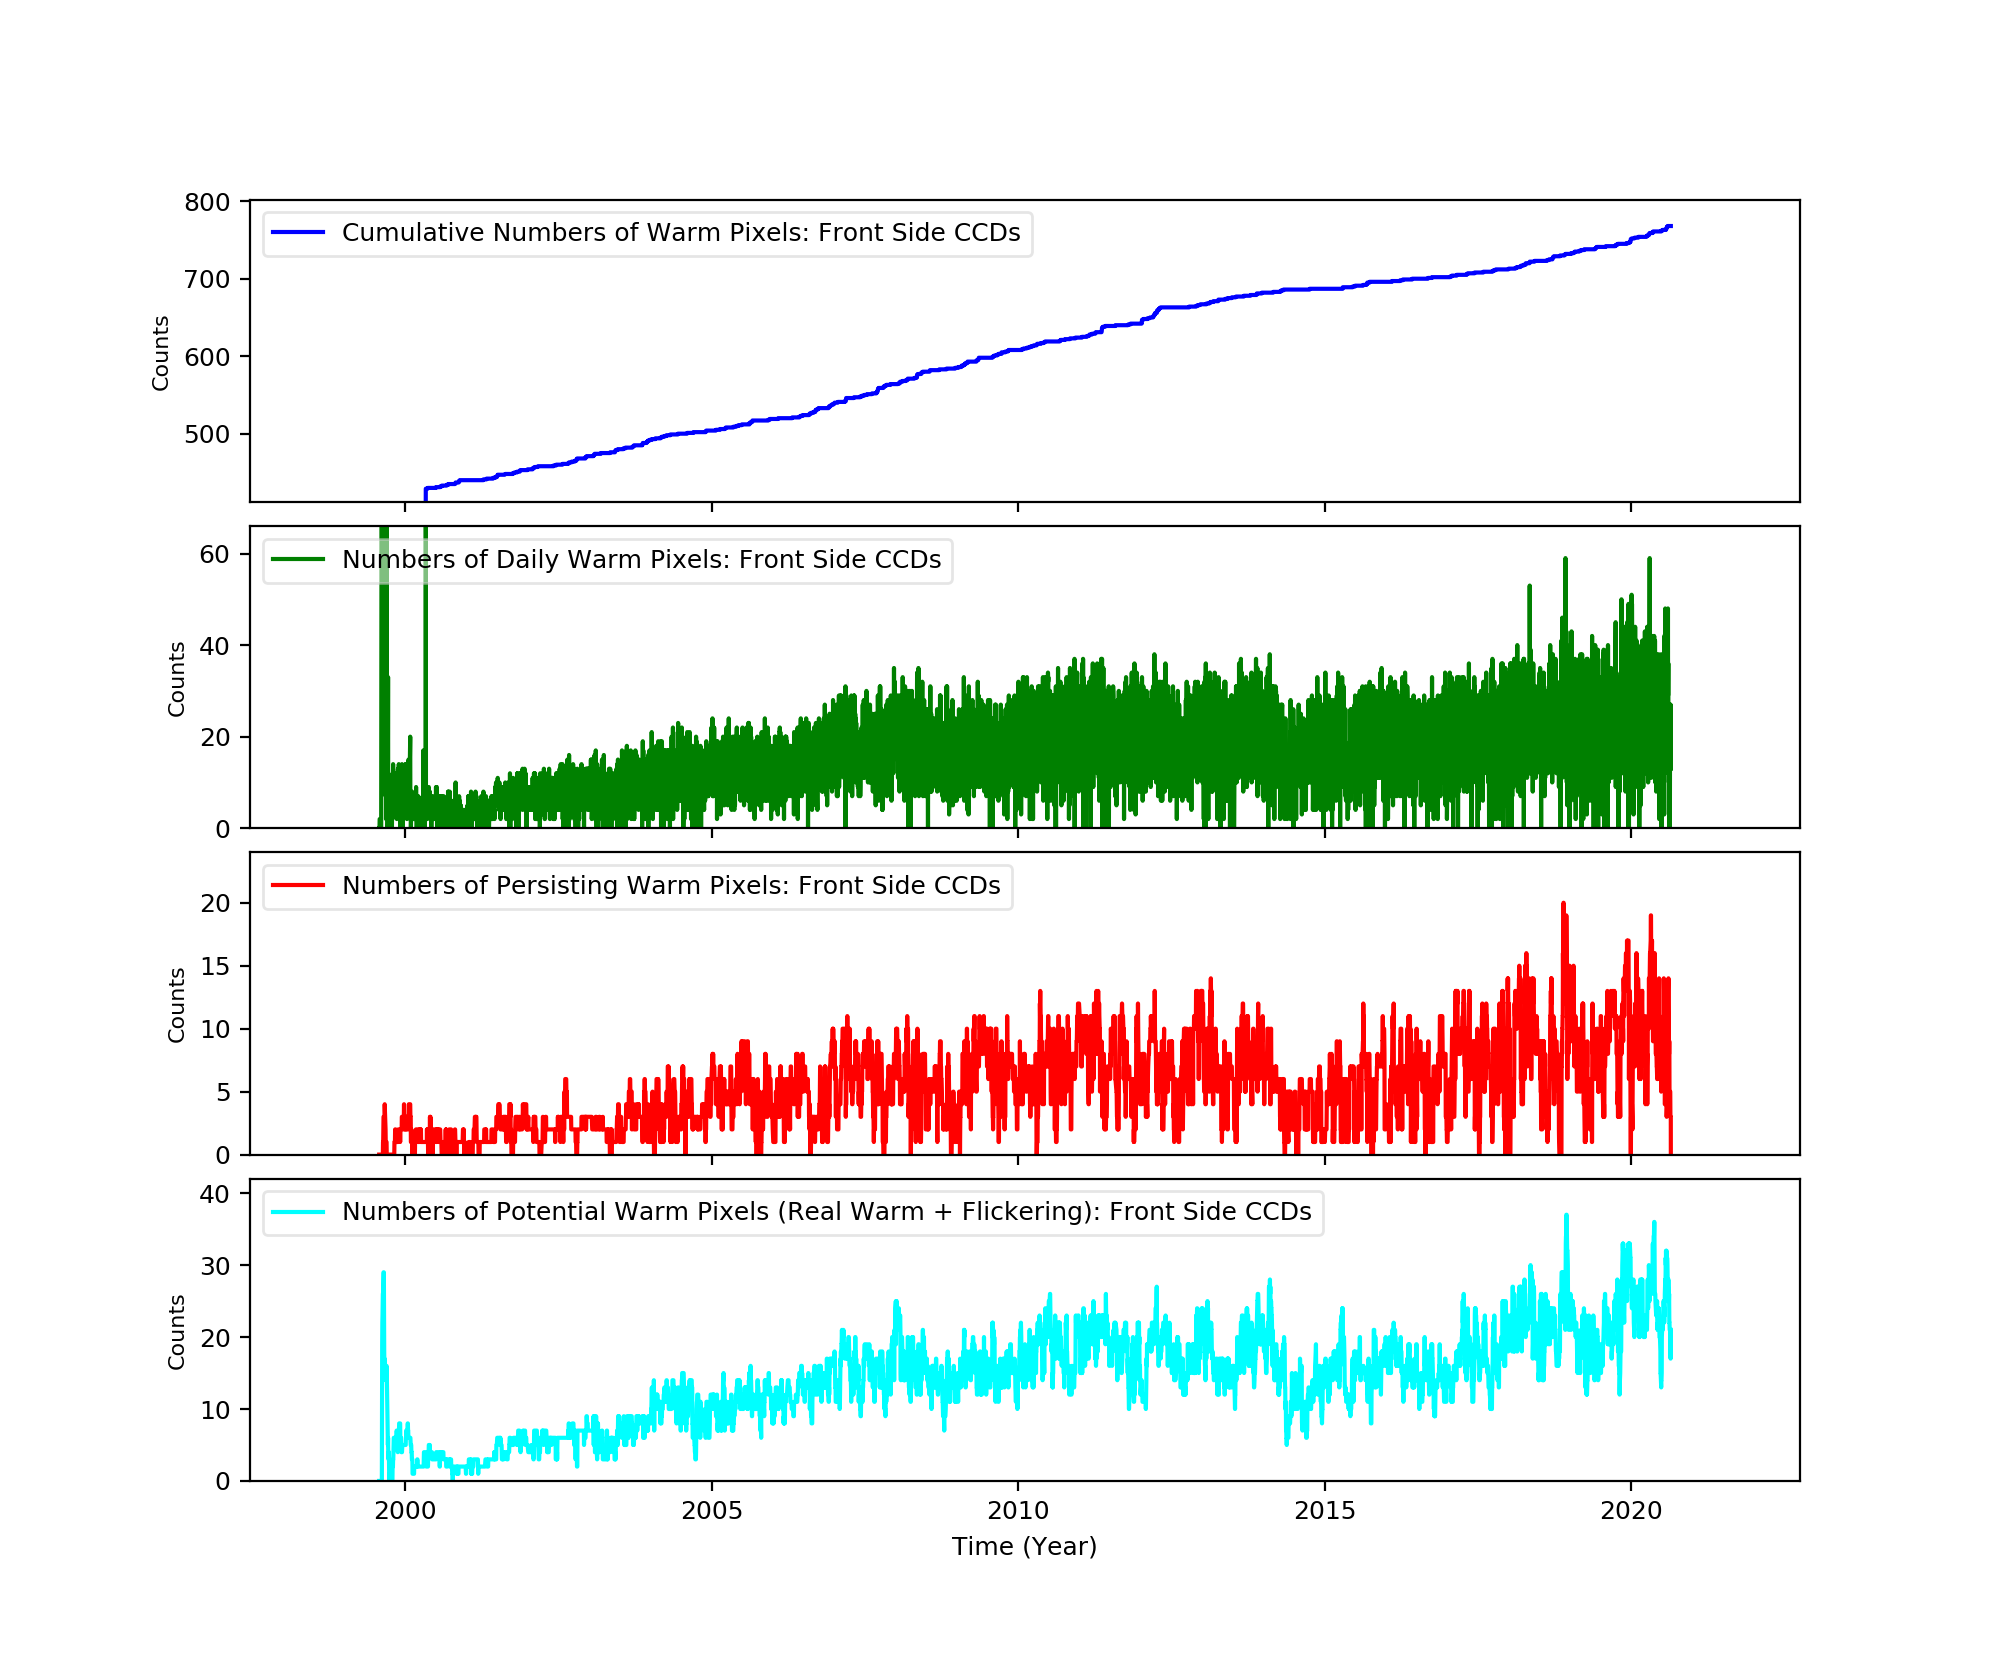
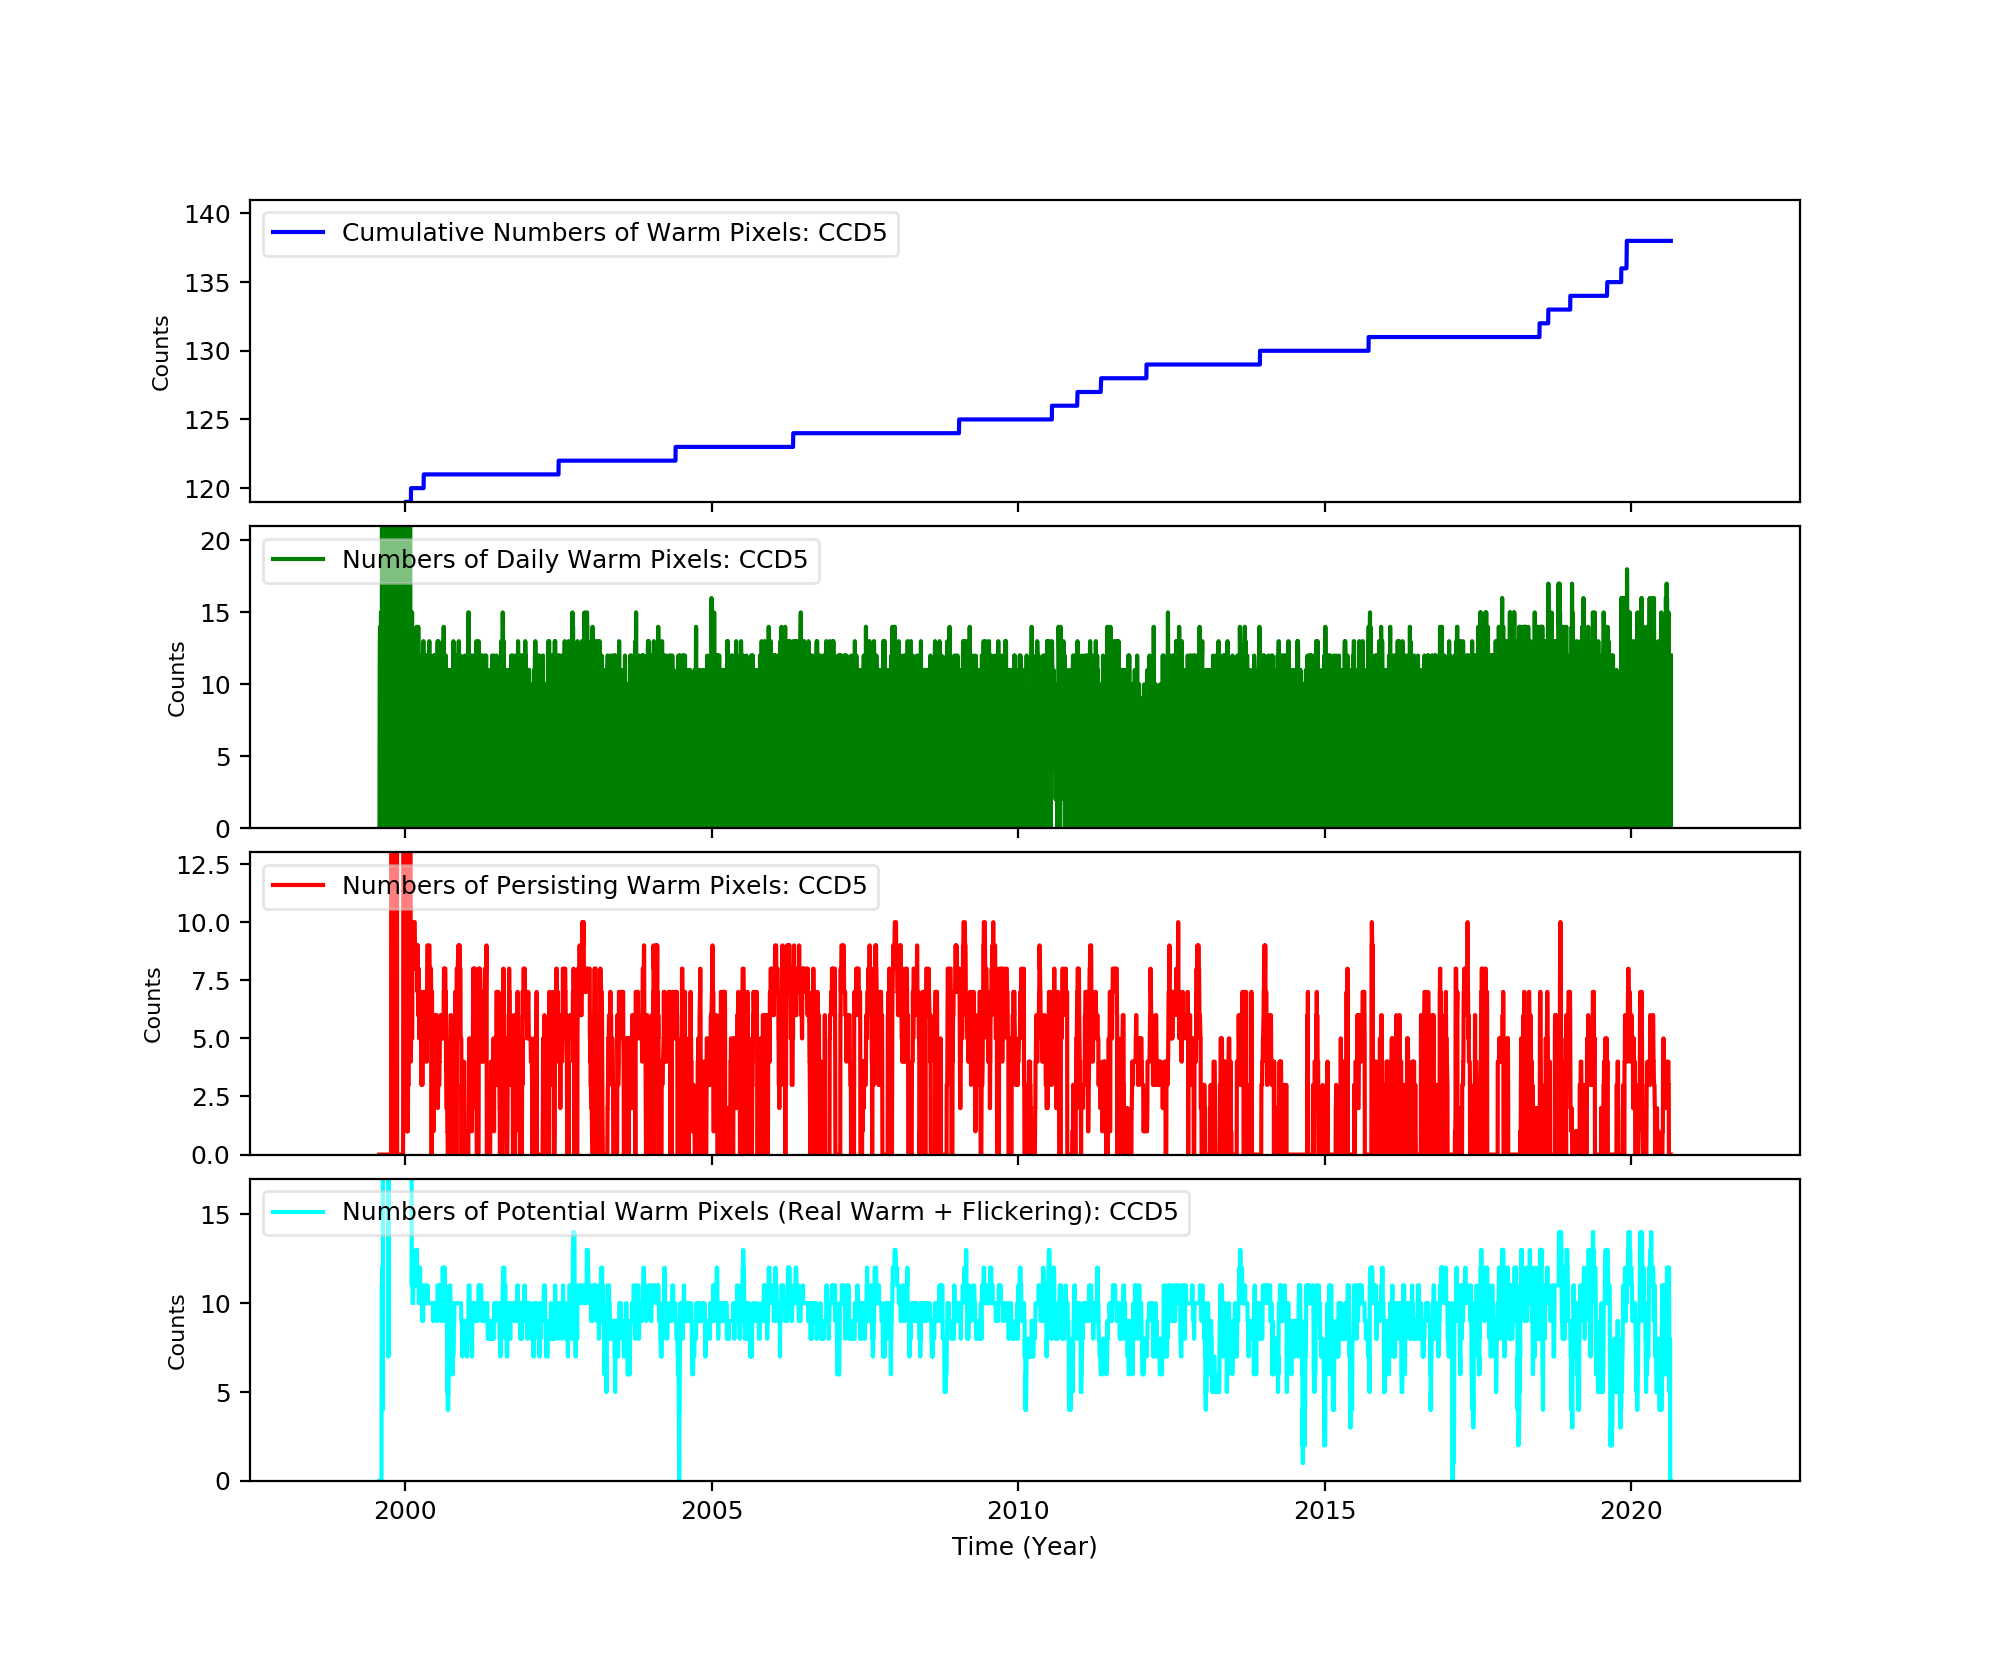
Bad Pixels
The plots below were generated with a new warm pixel finding script. Please see Acis Bad Pixel Page for details.
Front Side CCDs
Back Side CCD (CCD5)
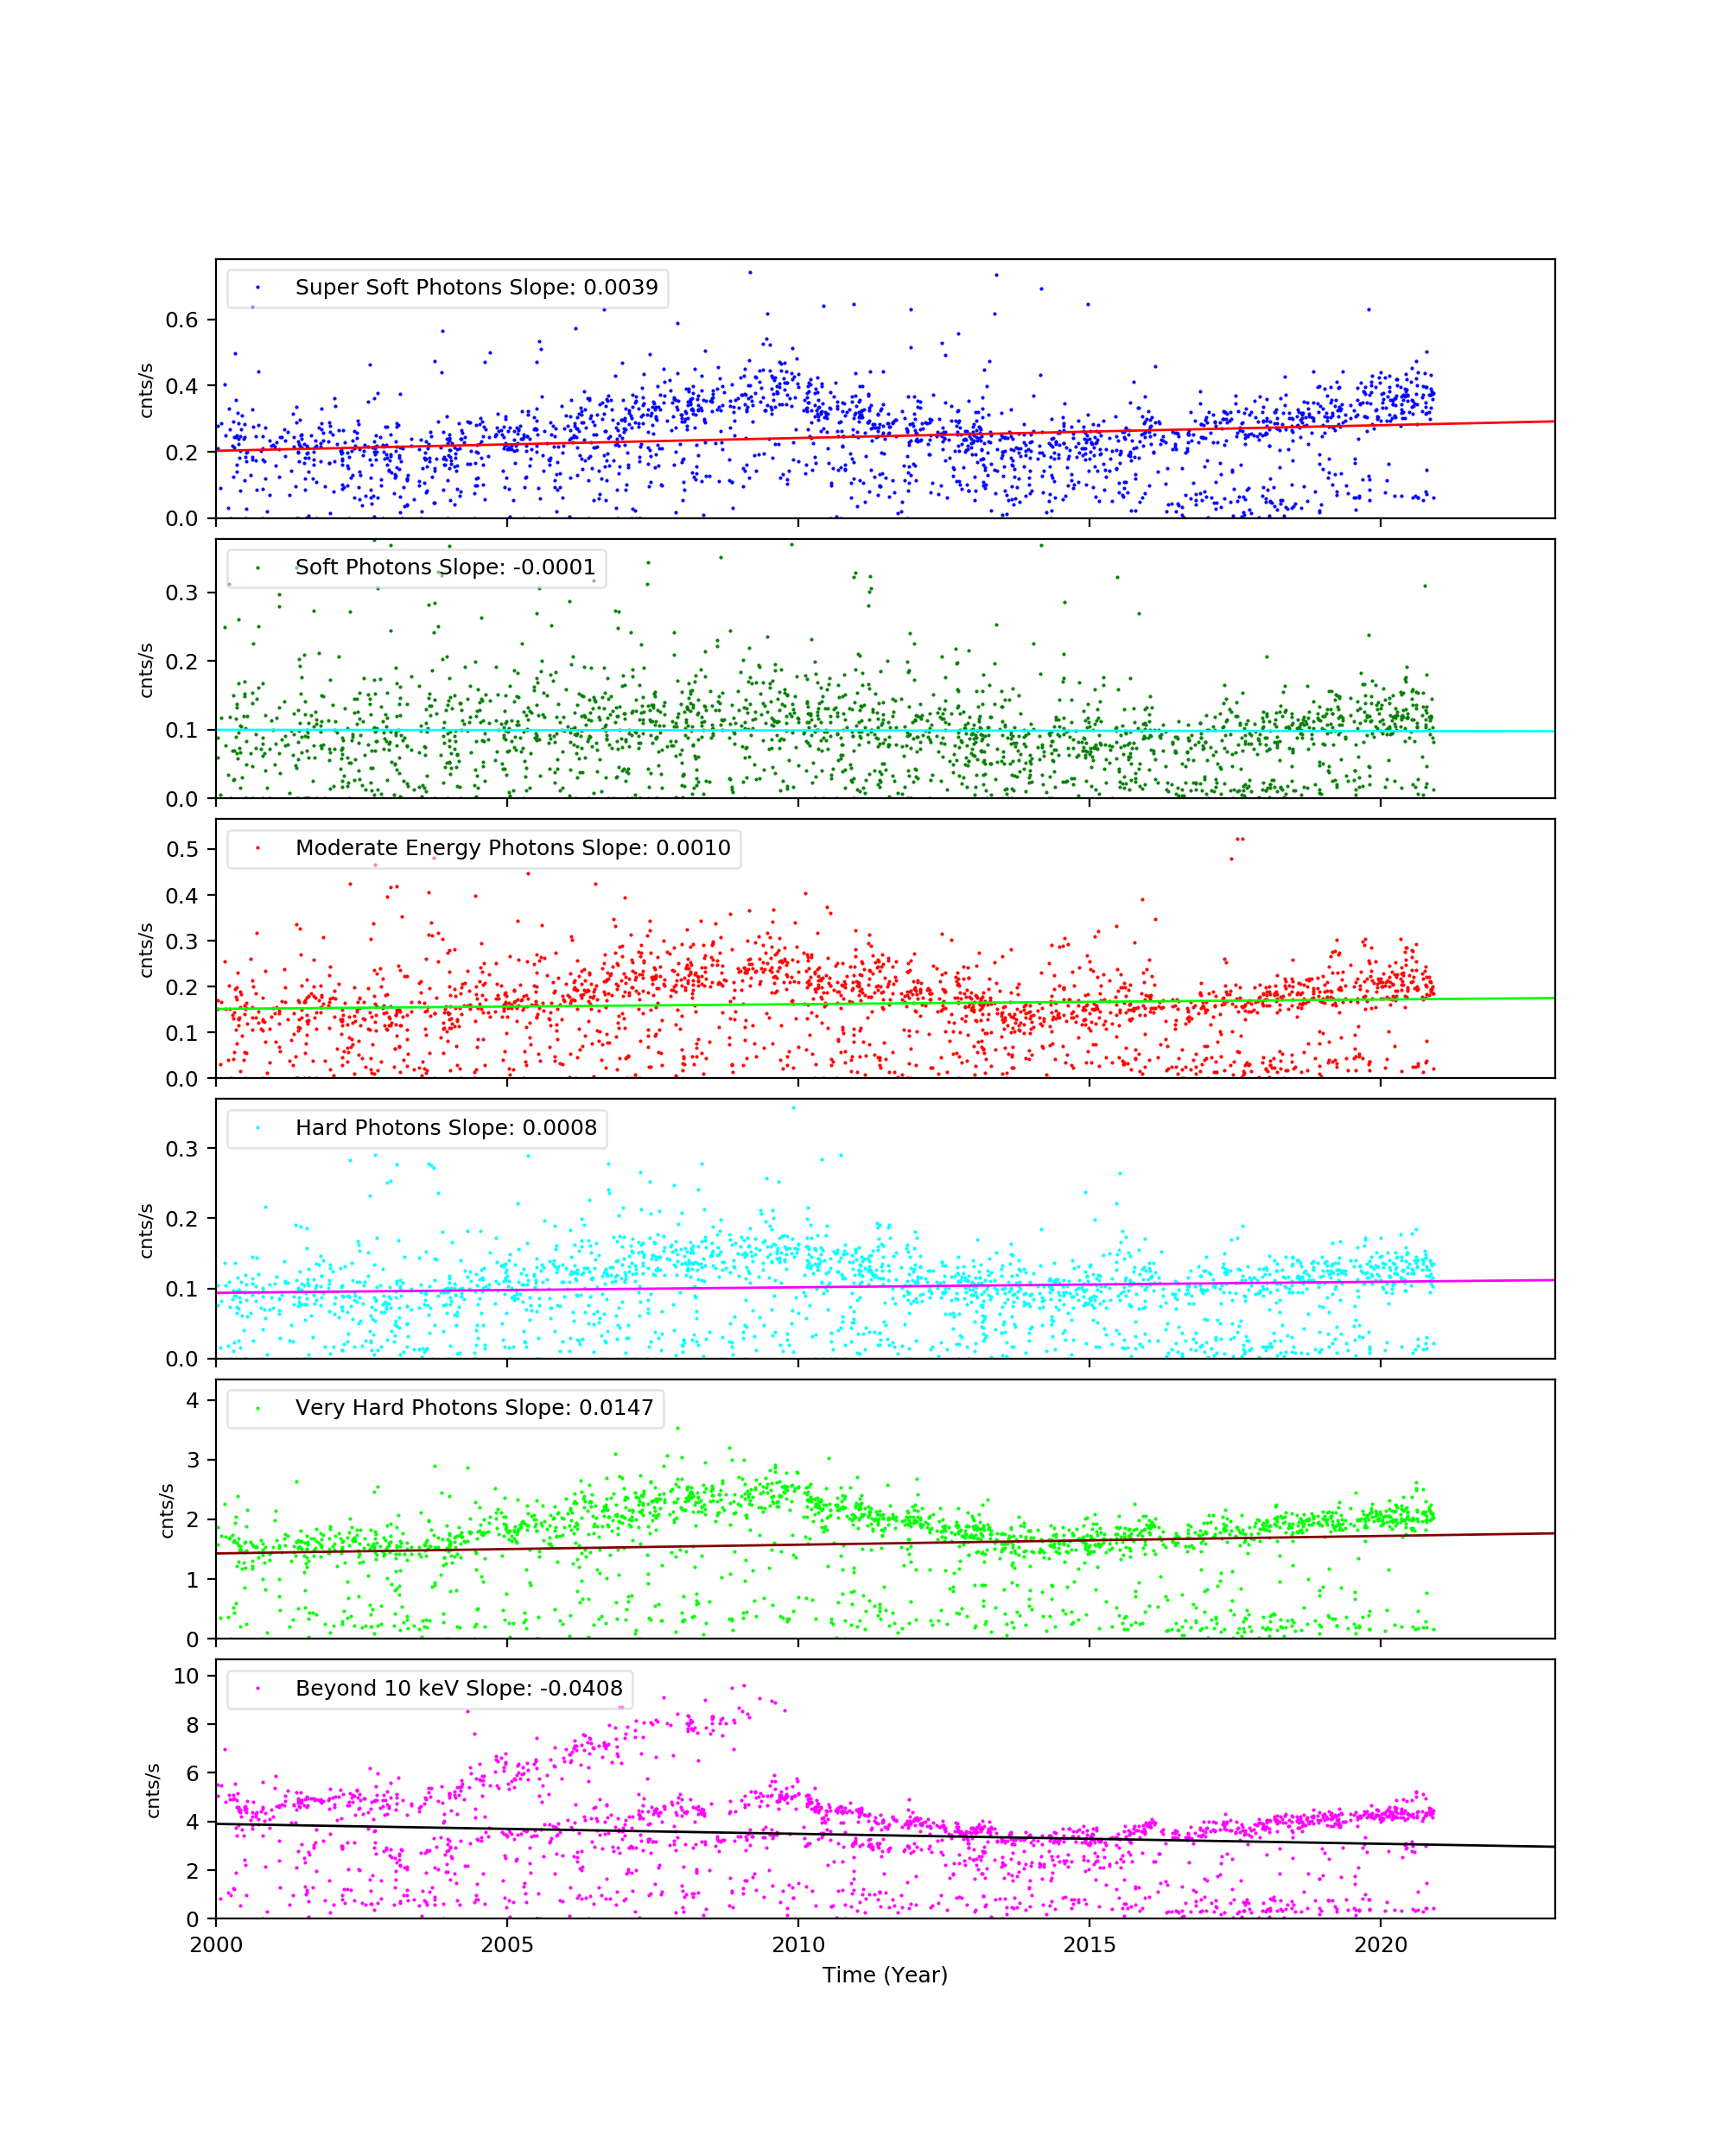
Science Instrument Background Rates
| Name | Low (keV) | High(KeV) | Description |
|---|---|---|---|
| SSoft | 0.00 | 0.50 | Super soft photons |
| Soft | 0.50 | 1.00 | Soft photons |
| Med | 1.00 | 3.00 | Moderate energy photons |
| Hard | 3.00 | 5.00 | Hard Photons |
| Harder | 5.00 | 10.00 | Very Hard photons |
| Hardest | 10.00 | Beyond 10 keV |
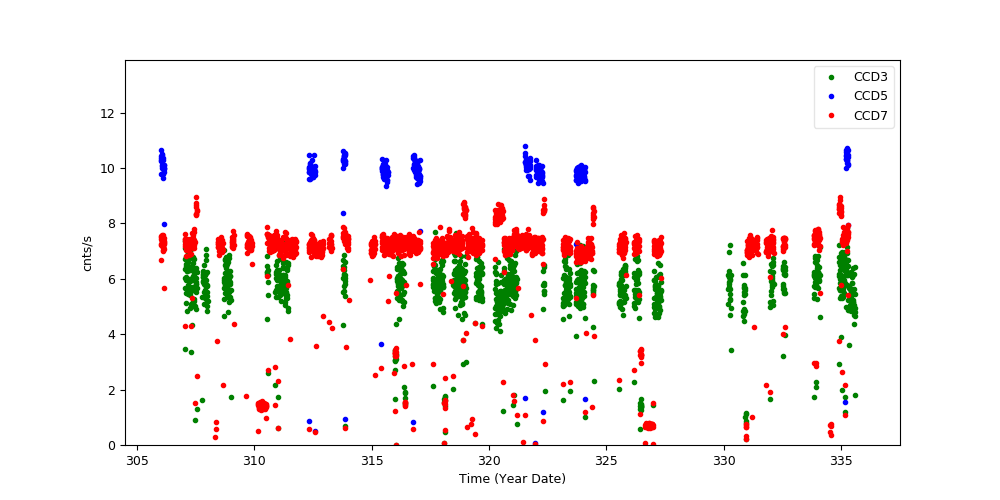
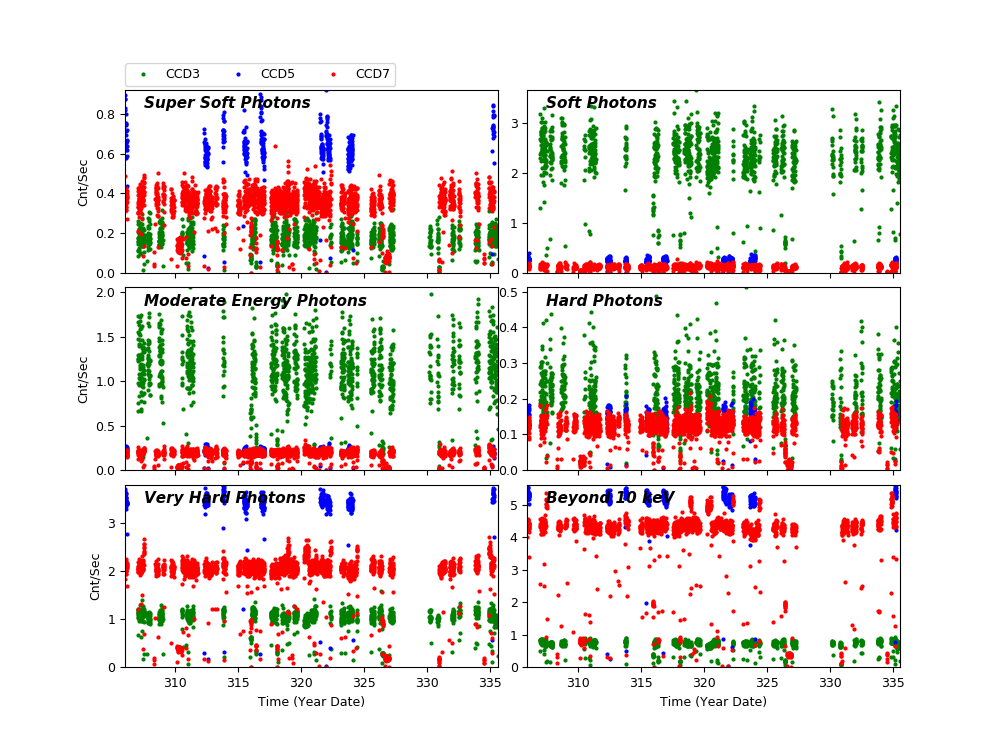
The following three plots show trends of SIB from year 2000. CCDs shown here are CCD3, CCD5, and CCD7. Fitted lines are linear fit after eliminating extreme outliers. For >10 keV plots, 2 lines are fit. One is with a 13 keV filter, and another without.
CCD 3
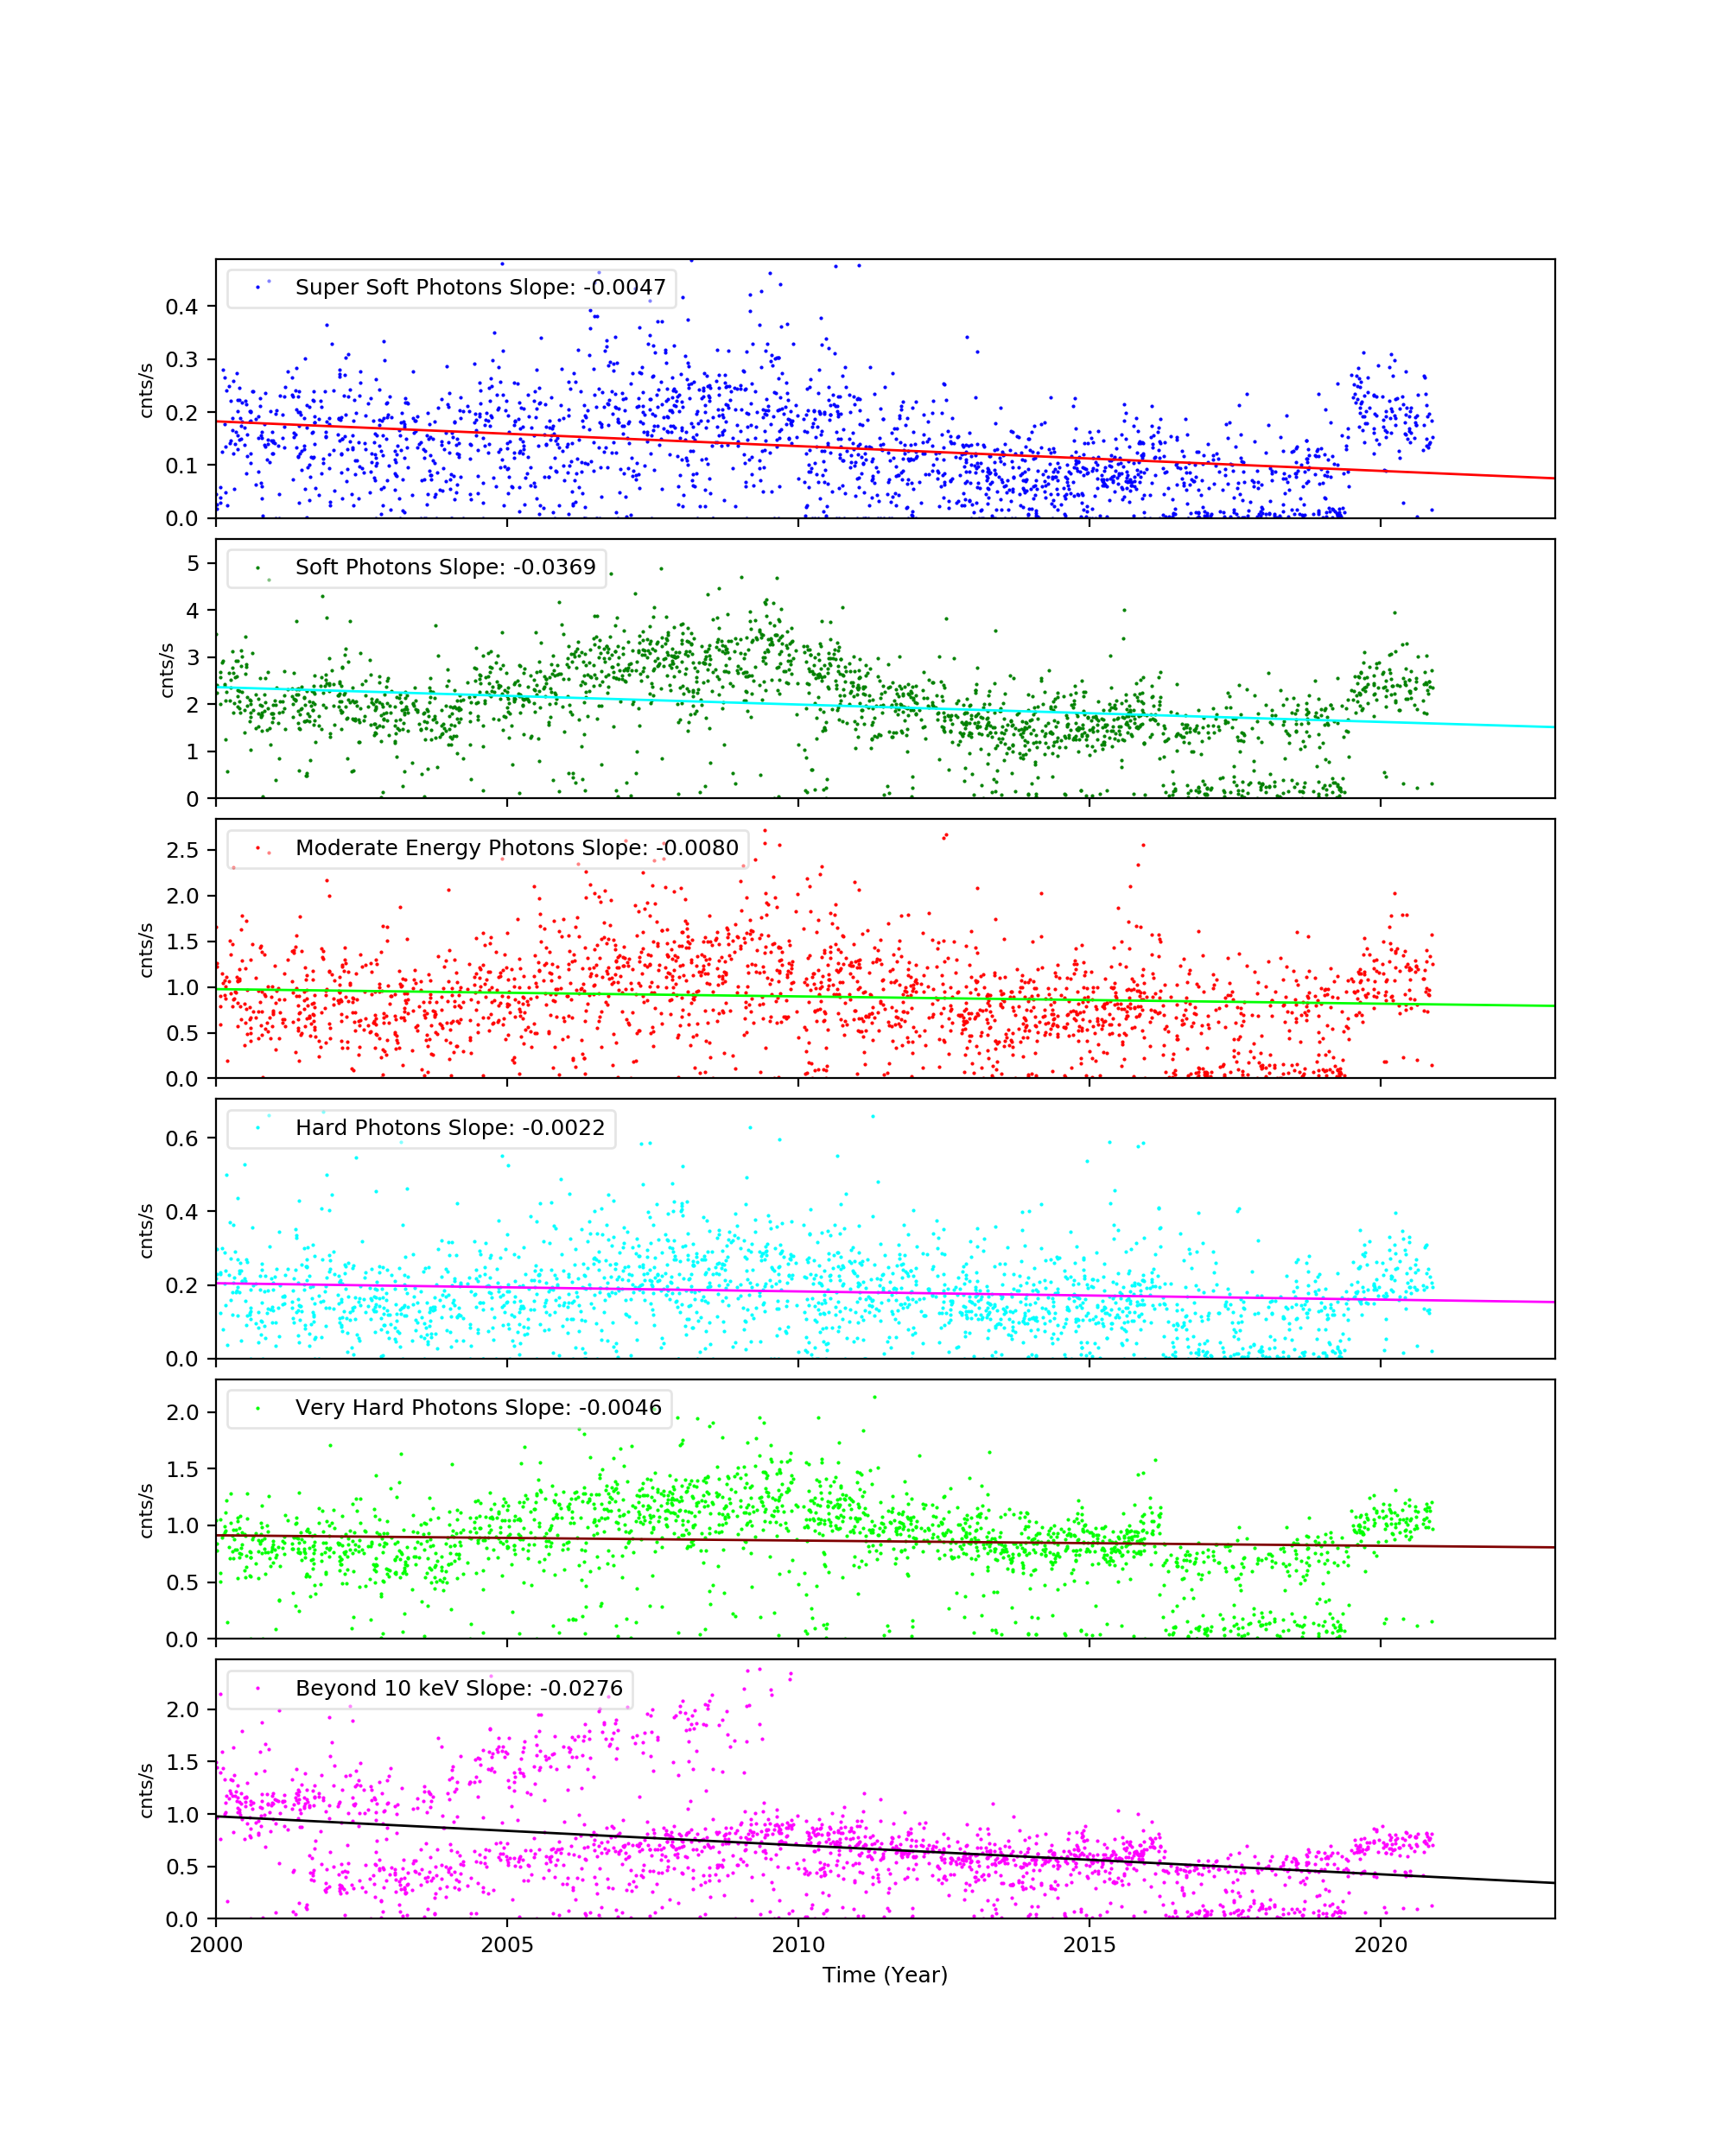
CCD 5
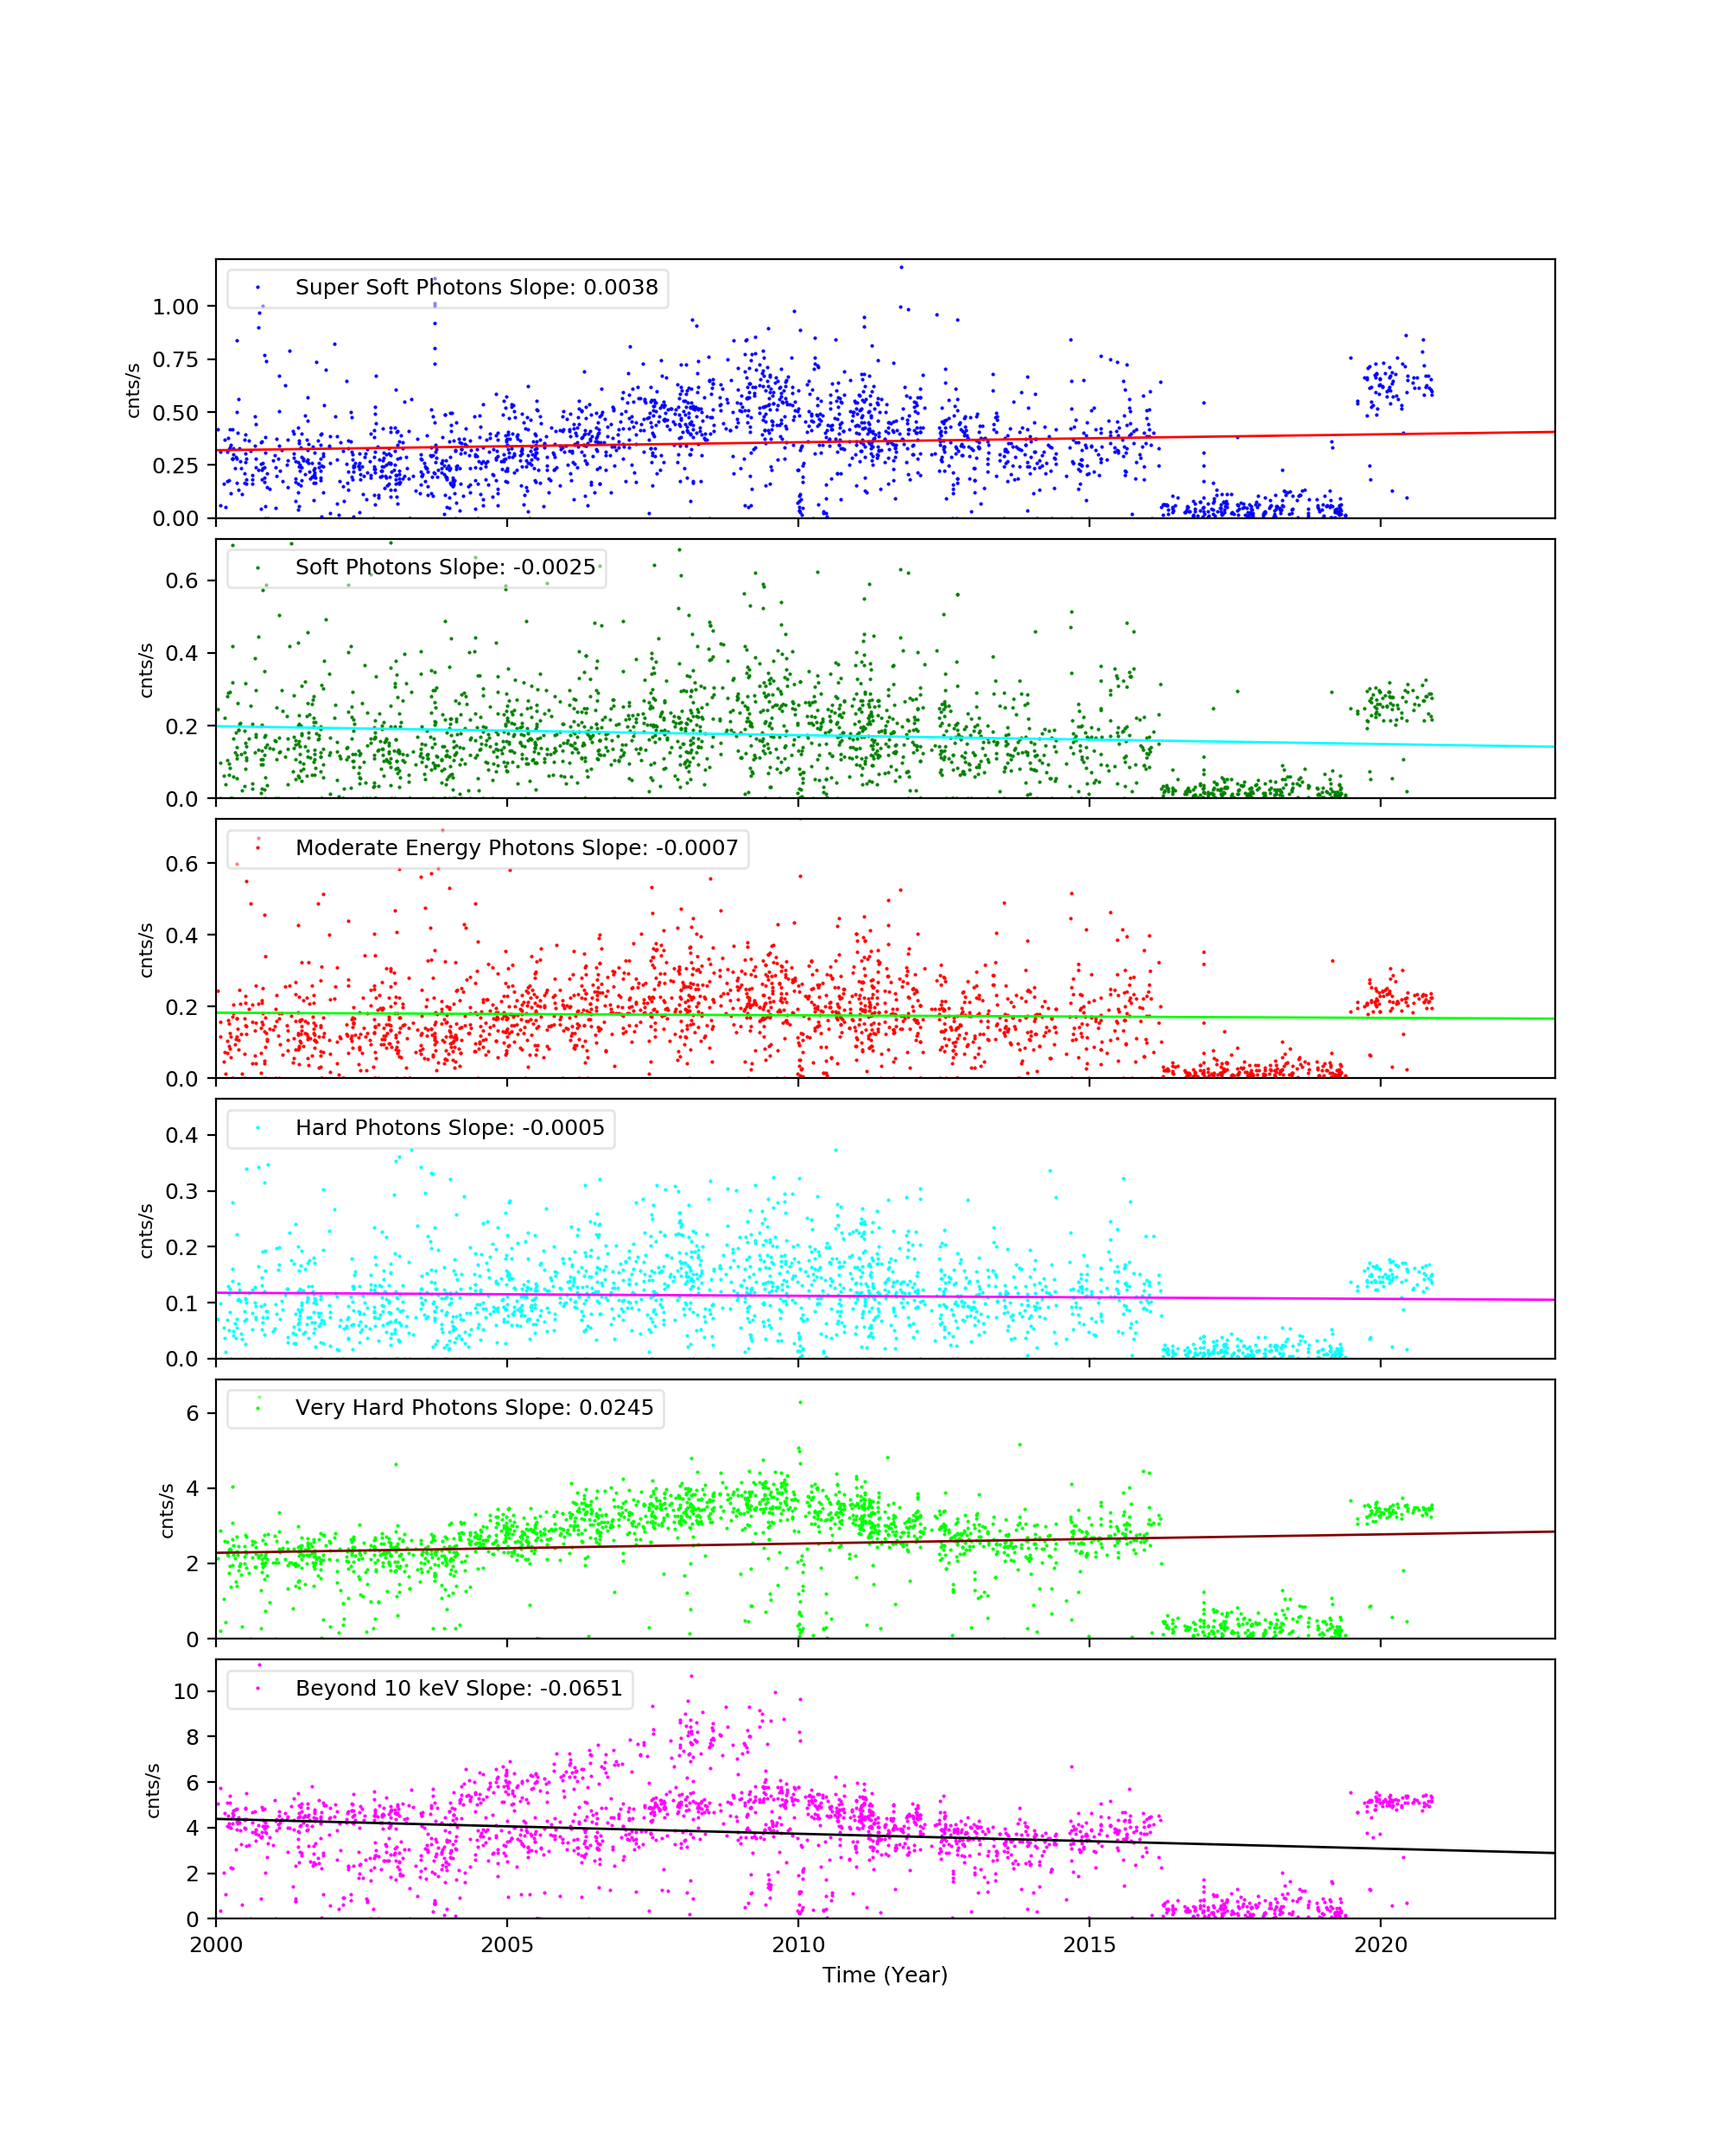
CCD 7
ACIS Histogram Mode Trends
We collected data from acis histogram mode data, and created trend plots of peak portions and peak widths against time (DOM). The peaks were estimated by fitting a simple Gaussian on three peaks (Al, Ti, and Mn), and the widths were estimated by a width at the half max from the peak.
All histogram data are taken under TIMED and GRADED_HIST mode, SIM position is at an external calibration source position, the focal temperature is around -119.7 C, and parameter settings in aciselec, acistemp are set to about same for all.
CCD 3, Peak Position
CCD 3, Peak Widths
CCD 3, Count Rates
HRC
DOSE of Central 4K Pore-Pairs
Please refer to Maximum Dose Trends for more details.
)
|
|---|
IMAGE                NPIX      MEAN    STDDEV      MIN       MAX
HRCI_11_2020.fits  16777216	0.069 	0.273 	0.000 	18.000
)
IMAGE                       NPIX      MEAN    STDDEV      MIN       MAX
HRCI_08_1999_11_2020.fits  16777216	6.678 	6.156 	0.000 	310.000
)
|
|---|
IMAGE                NPIX      MEAN    STDDEV      MIN       MAX
HRCS_11_2020.fits  16777216	0.034 	0.248 	0.000 	20.000
)
IMAGE                       NPIX      MEAN    STDDEV      MIN       MAX
HRCS_08_1999_11_2020.fits  16777216	19.124 	34.518 	0.000 	1751.000
|
|
Max dose trend plots corrected for events that "pile-up"
in the center of the taps due to bad position information.
|
)
|
)
|
)
|
)
|
| Aug 2020 | May 2020 | Feb 2020 | Nov 2019 |
|---|
)
|
)
|
)
|
)
|
| Aug 2020 | May 2020 | Feb 2020 | Nov 2019 |
|---|
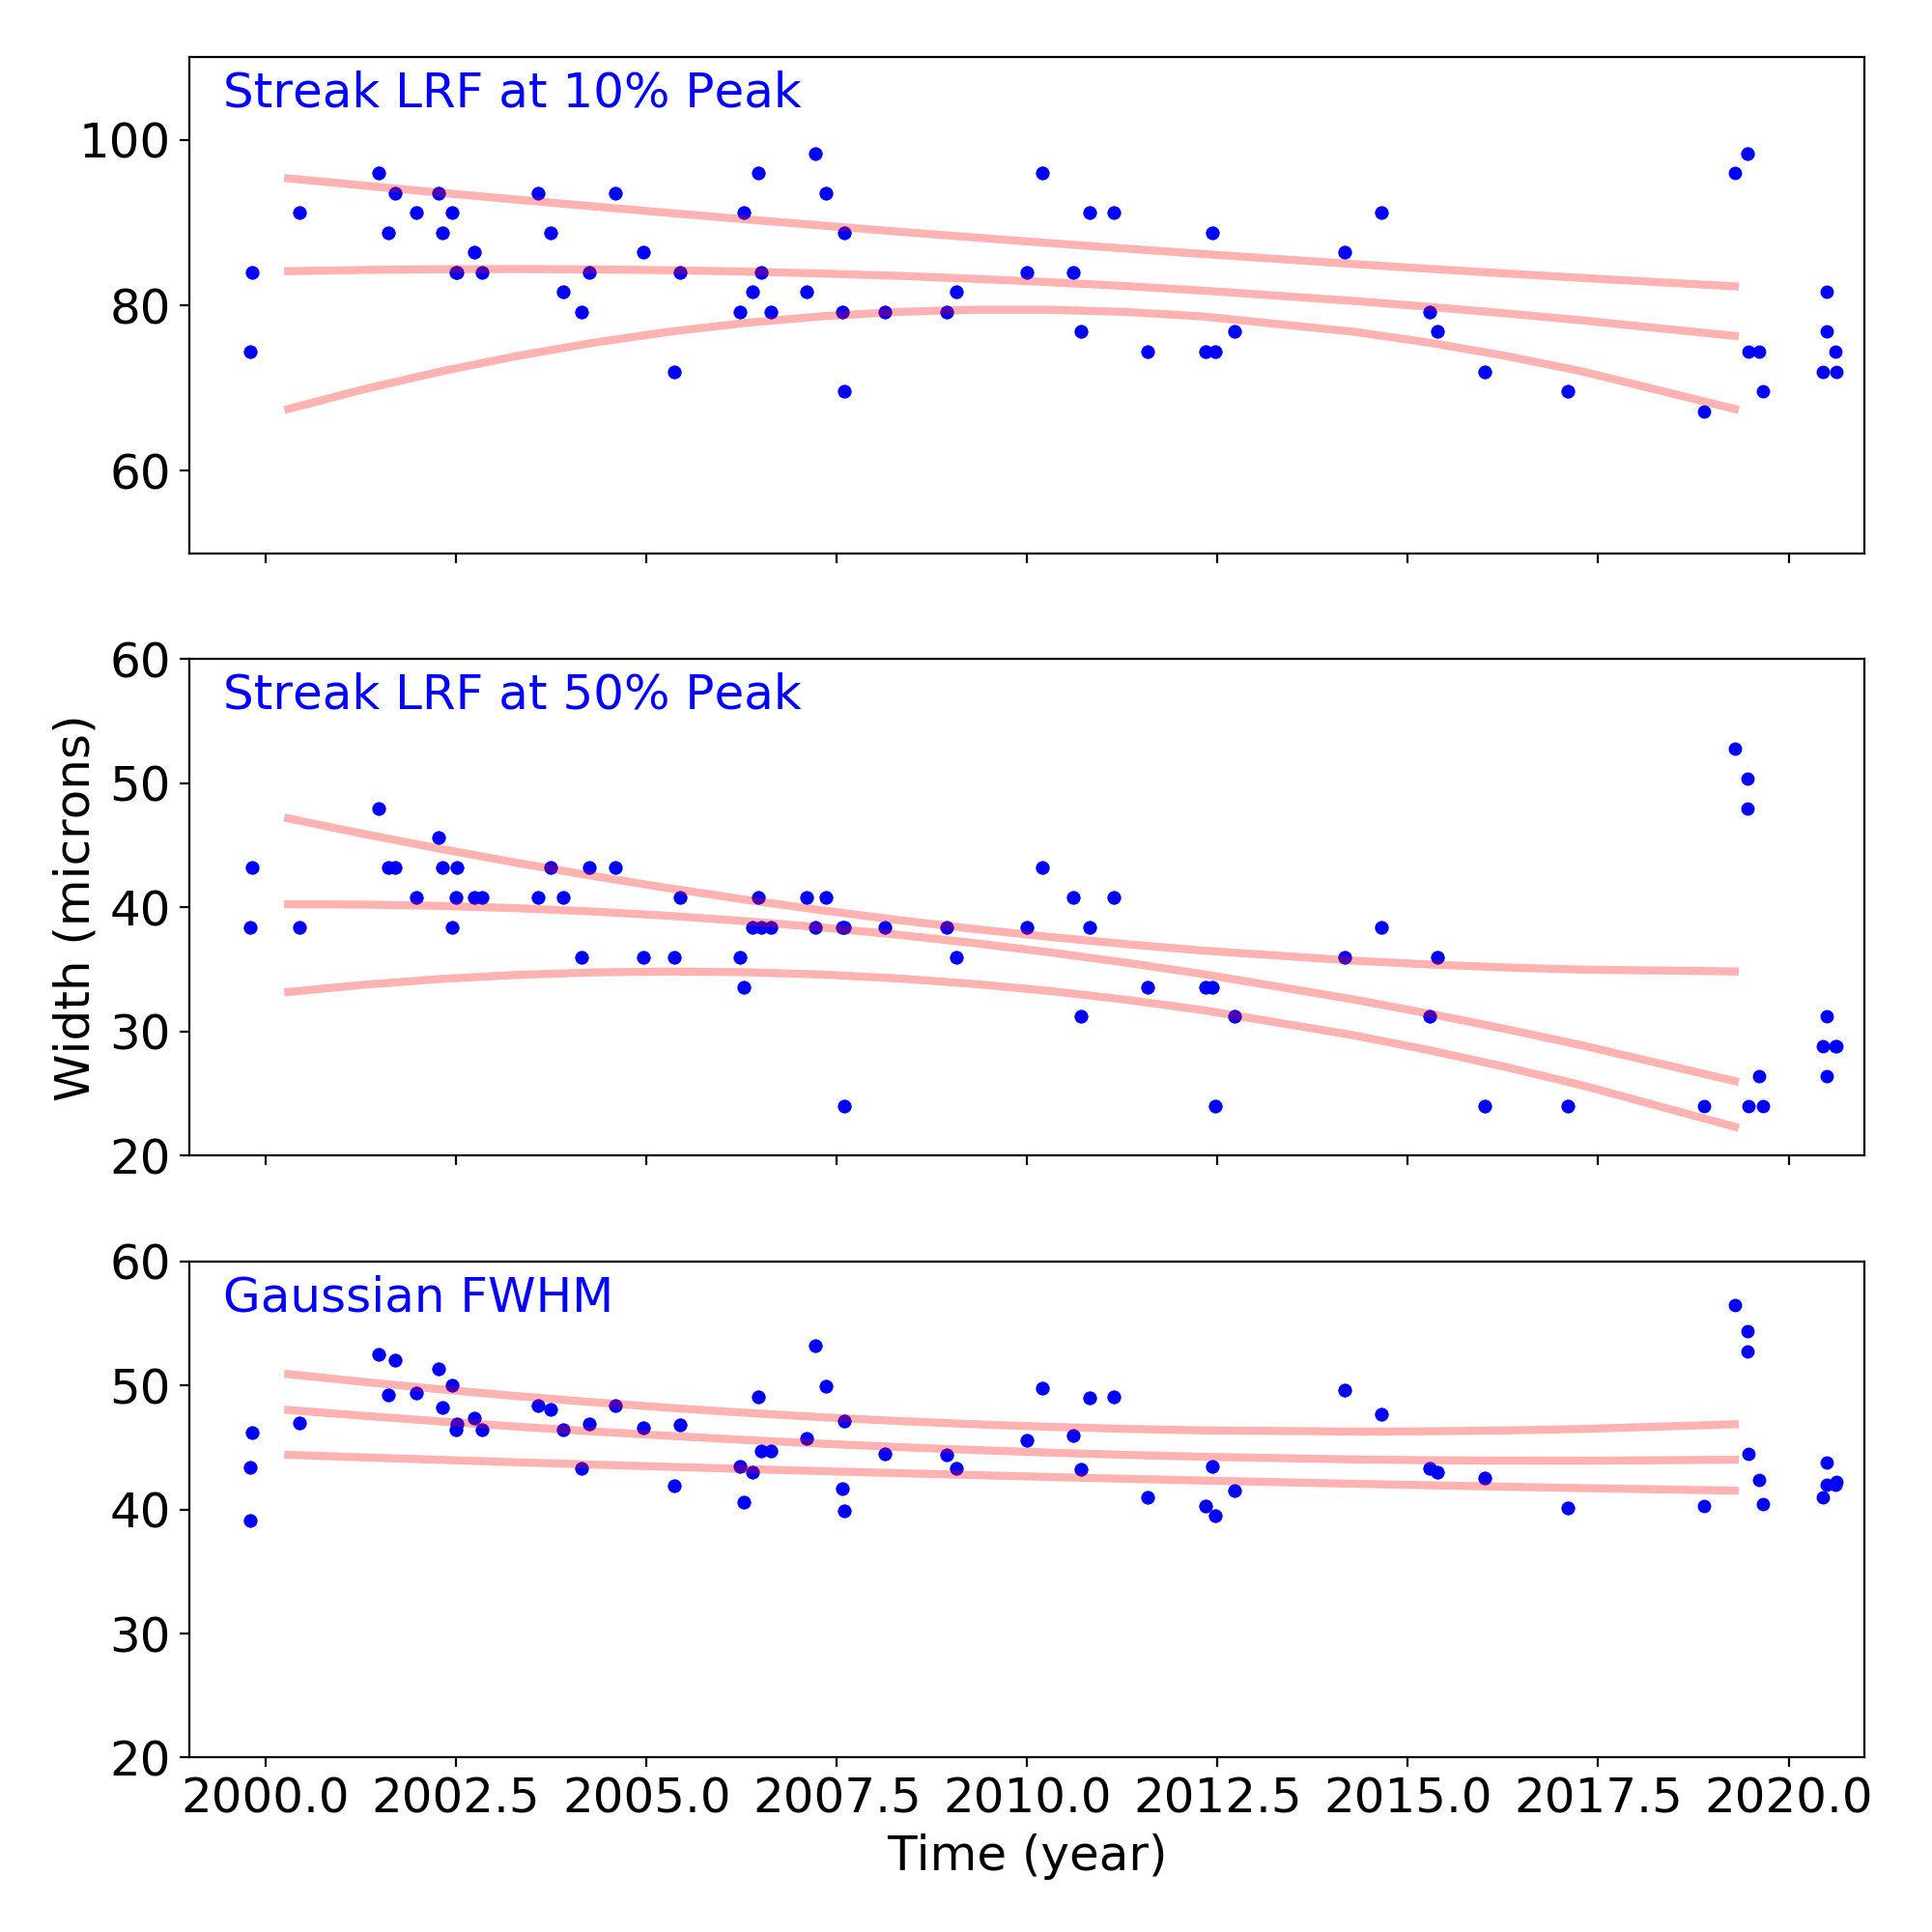
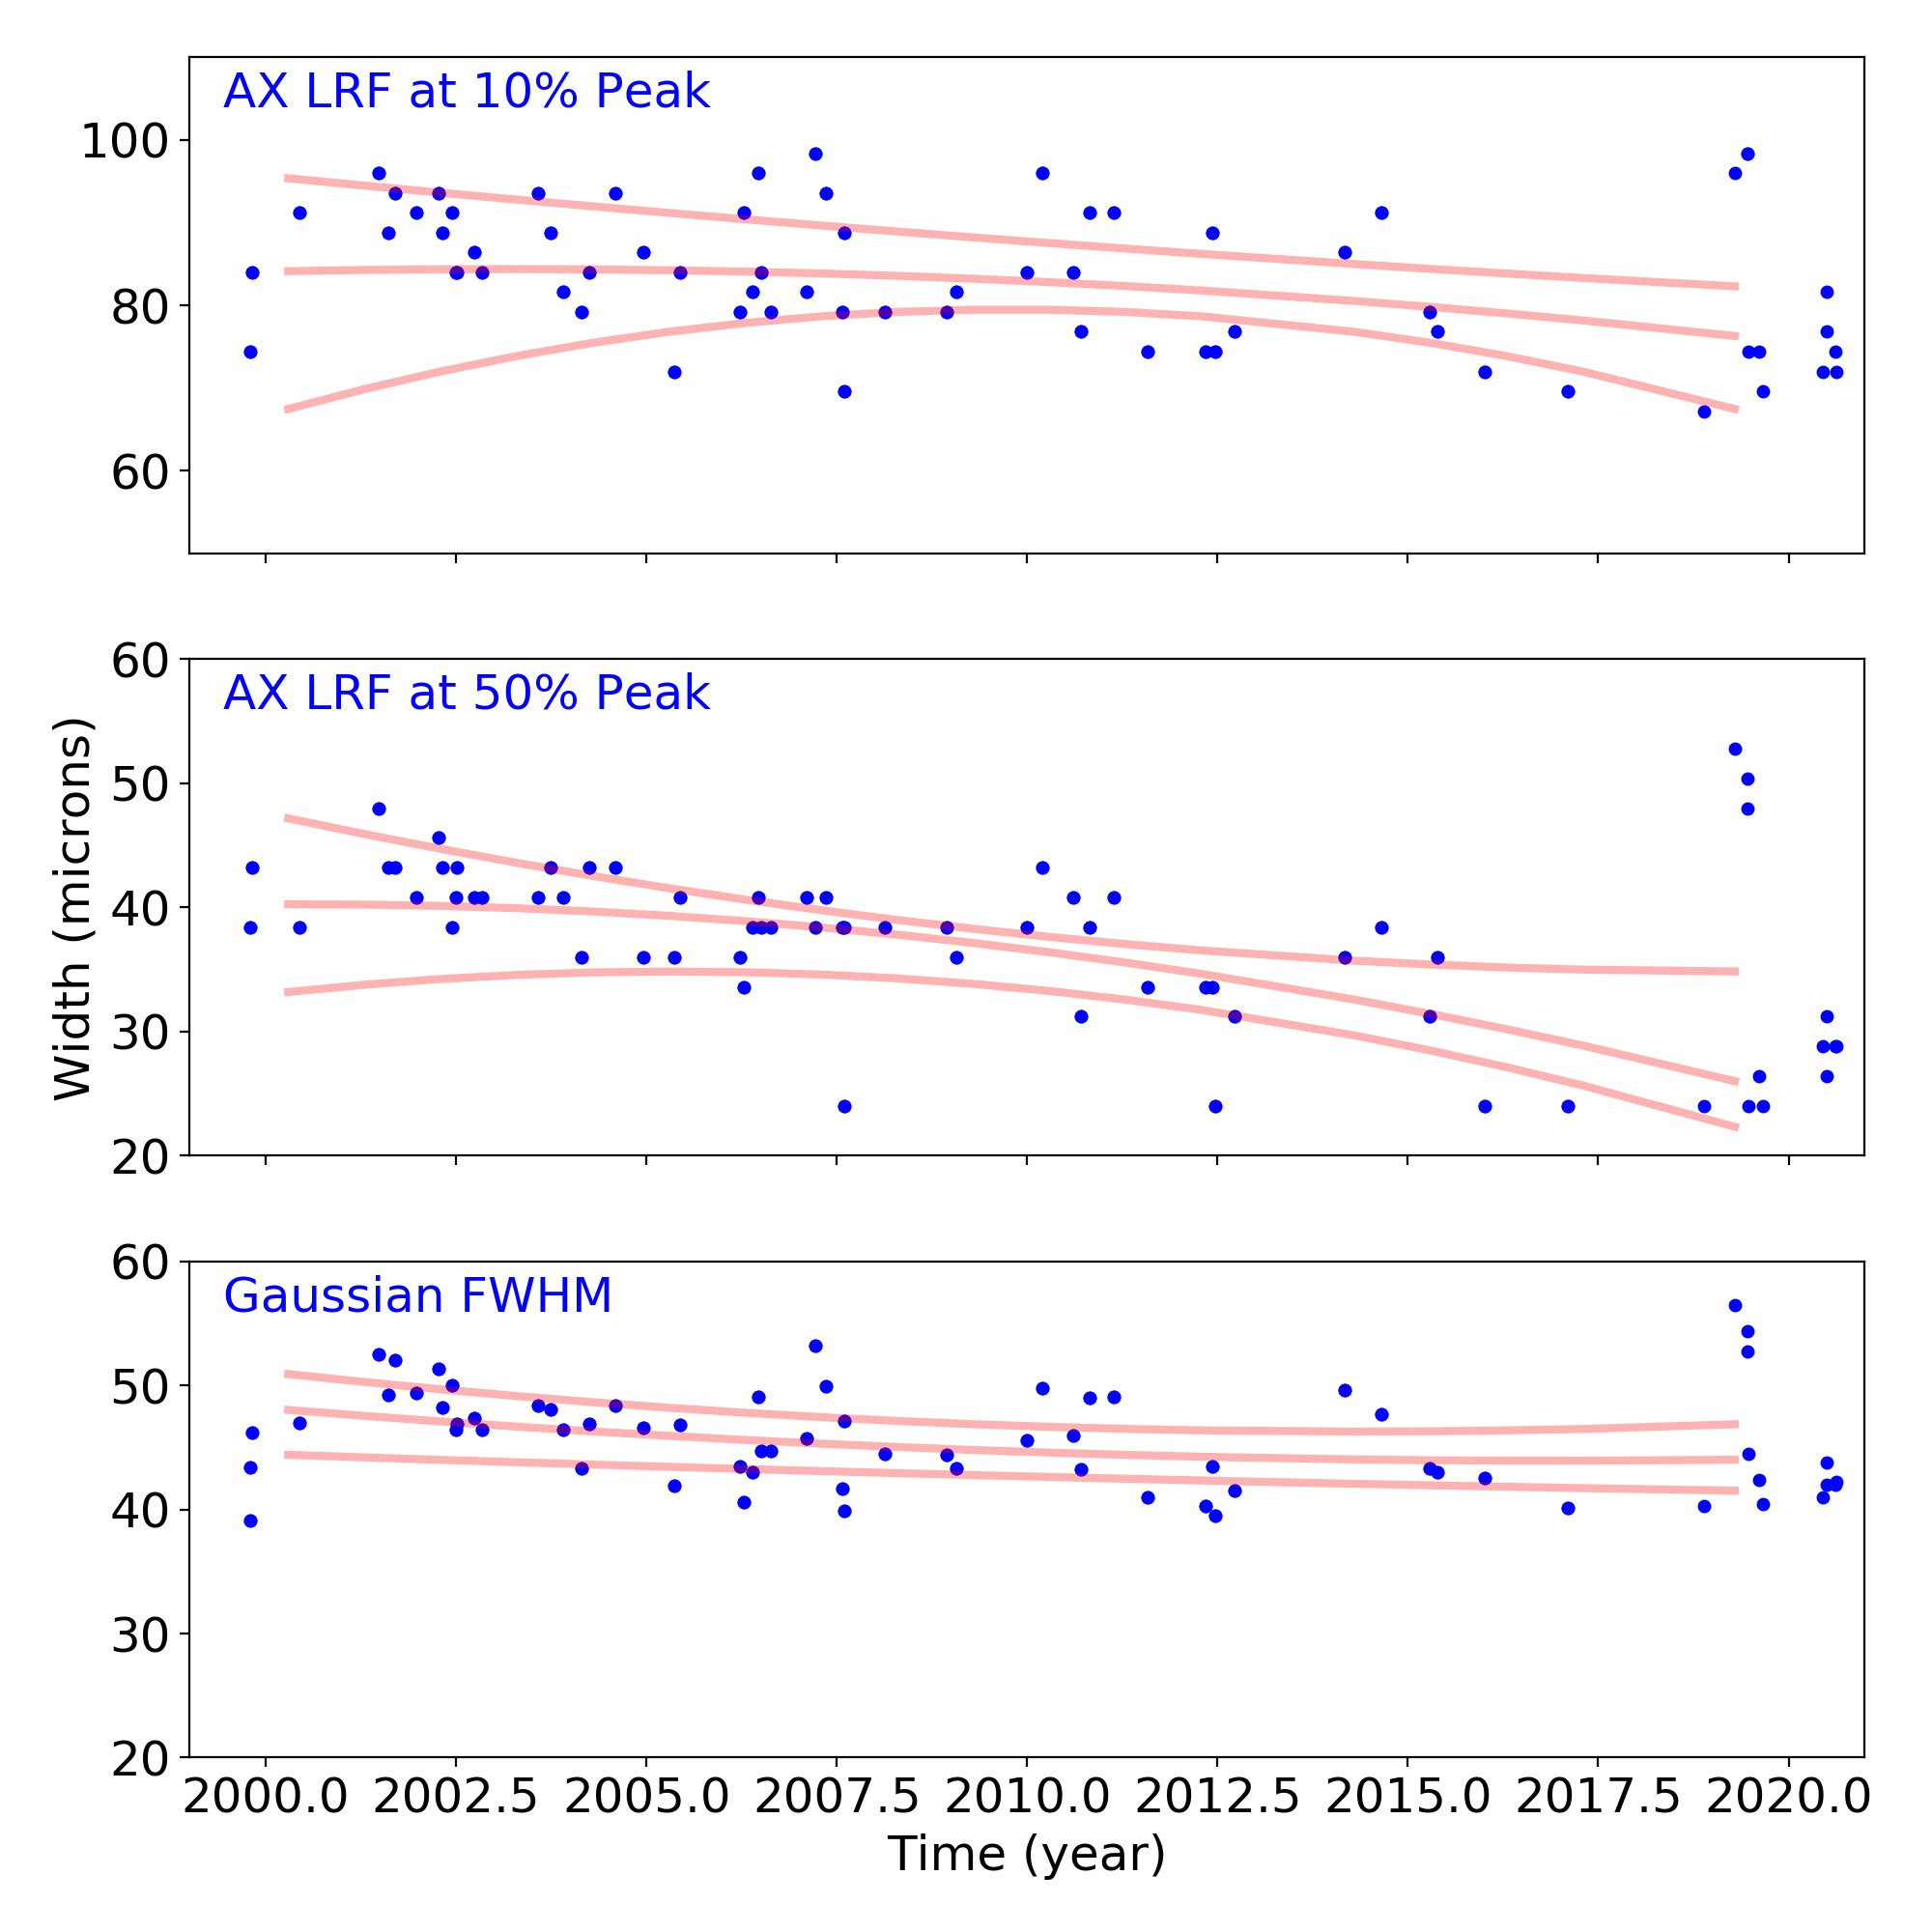
Gratings
Grating Trends/Focus
We plot the width of the zero order streak of ACIS/HETG observations and the width of the zero order image for HRC/LETG observations of point sources. No significant defocusing trend is seen at this time. See Gratings Trends pages.
PCAD
ACA Trending
| ACIS |
)
|
)
|
)
|
|
|---|---|---|---|---|
)
|
)
|
)
| ||
| HRCI |
)
|
)
|
)
|
)
|
| HRCI |
)
|
)
|
)
|
)
|
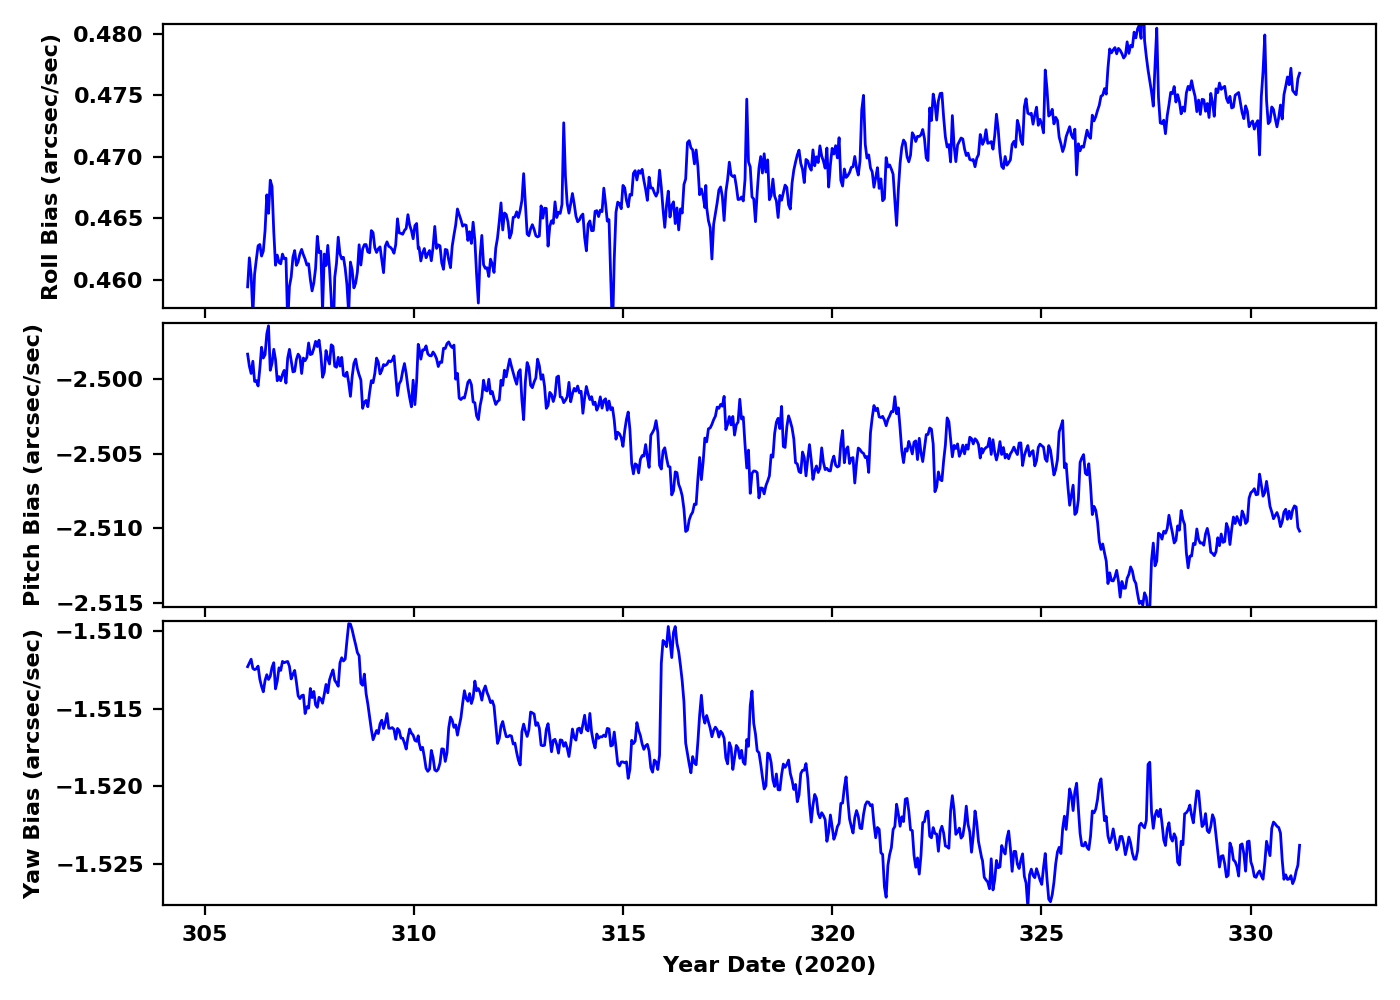
Gyro Bias Drift
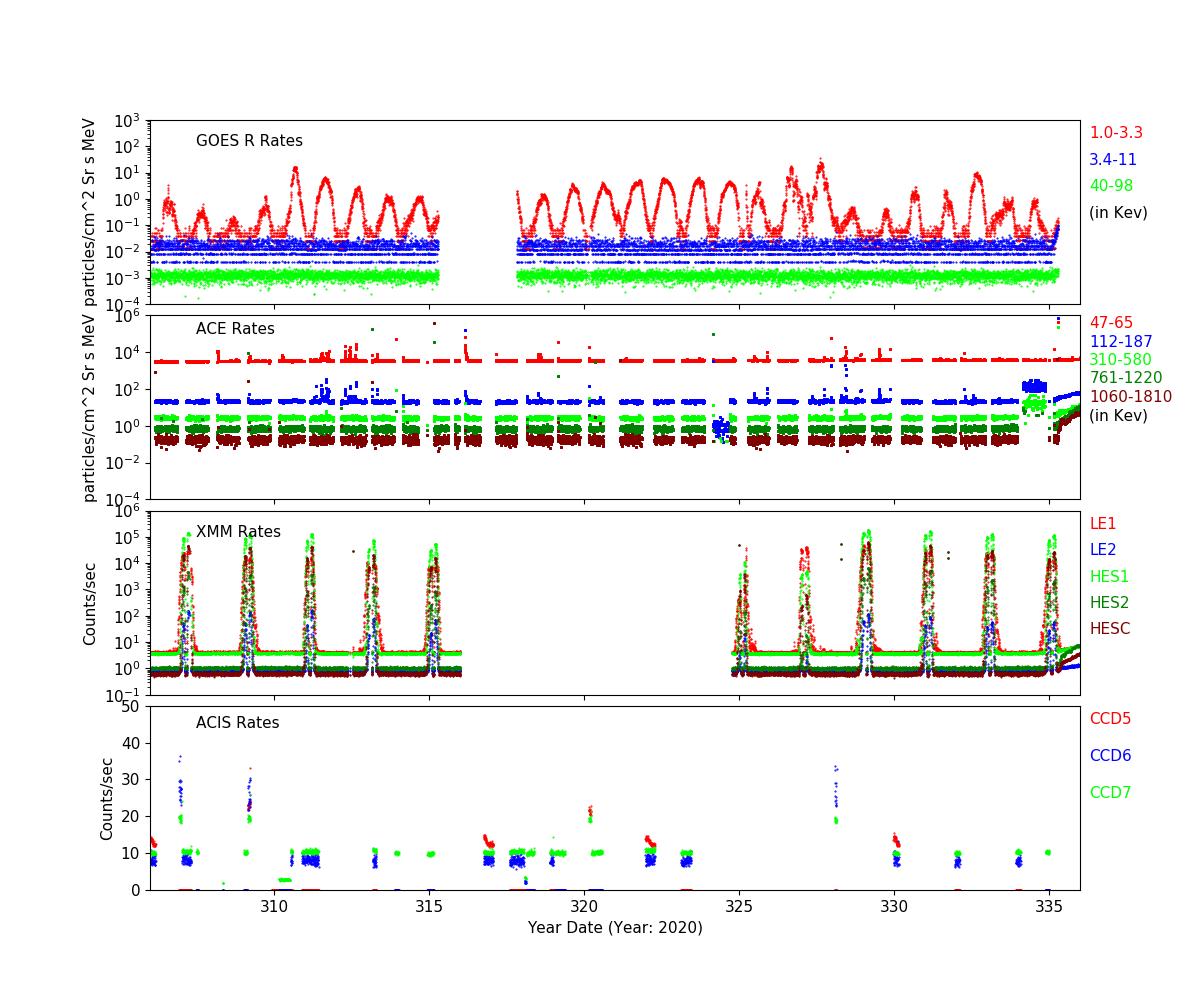
Radiation History
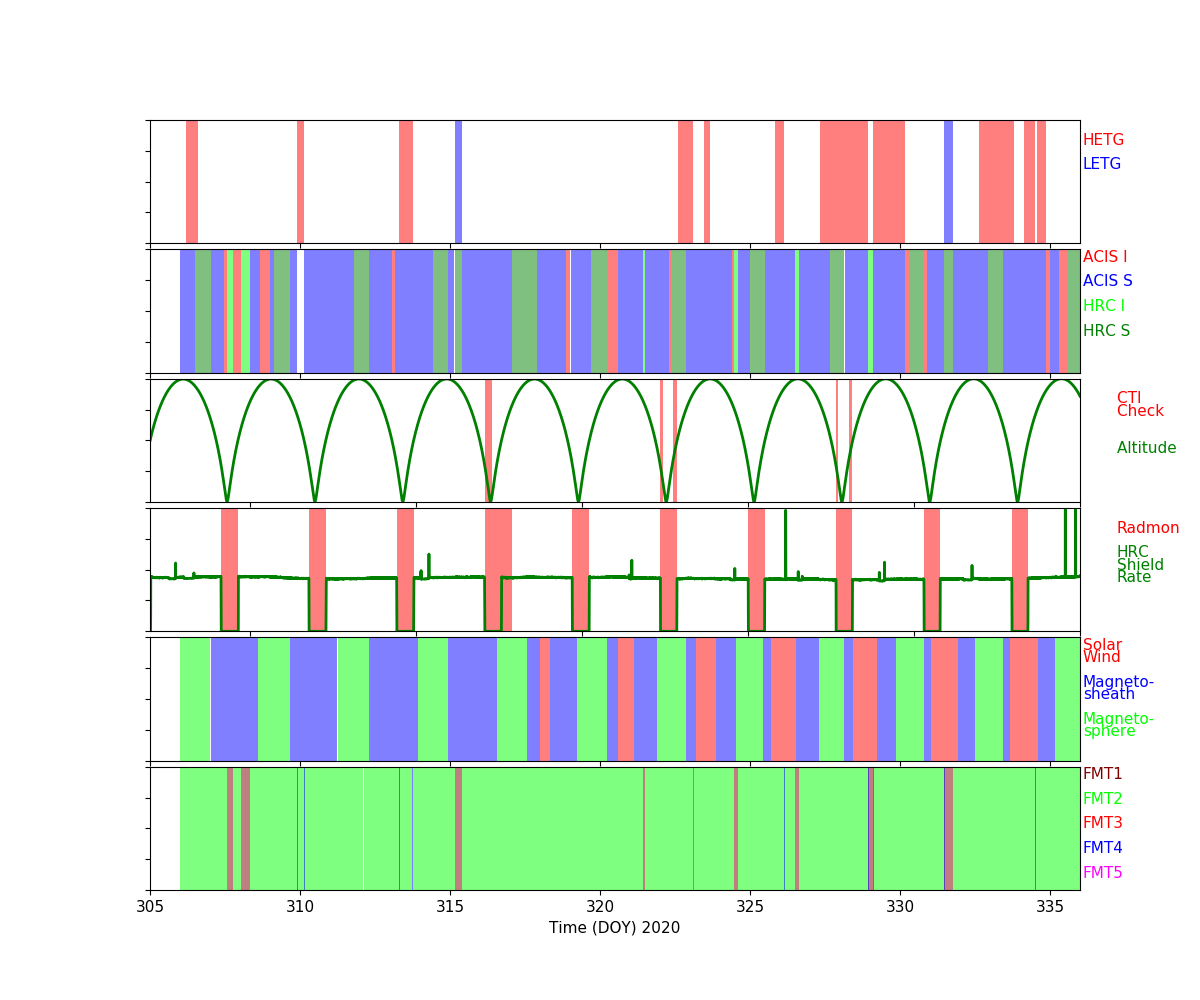
Radiation Count Rates of Nov 2020
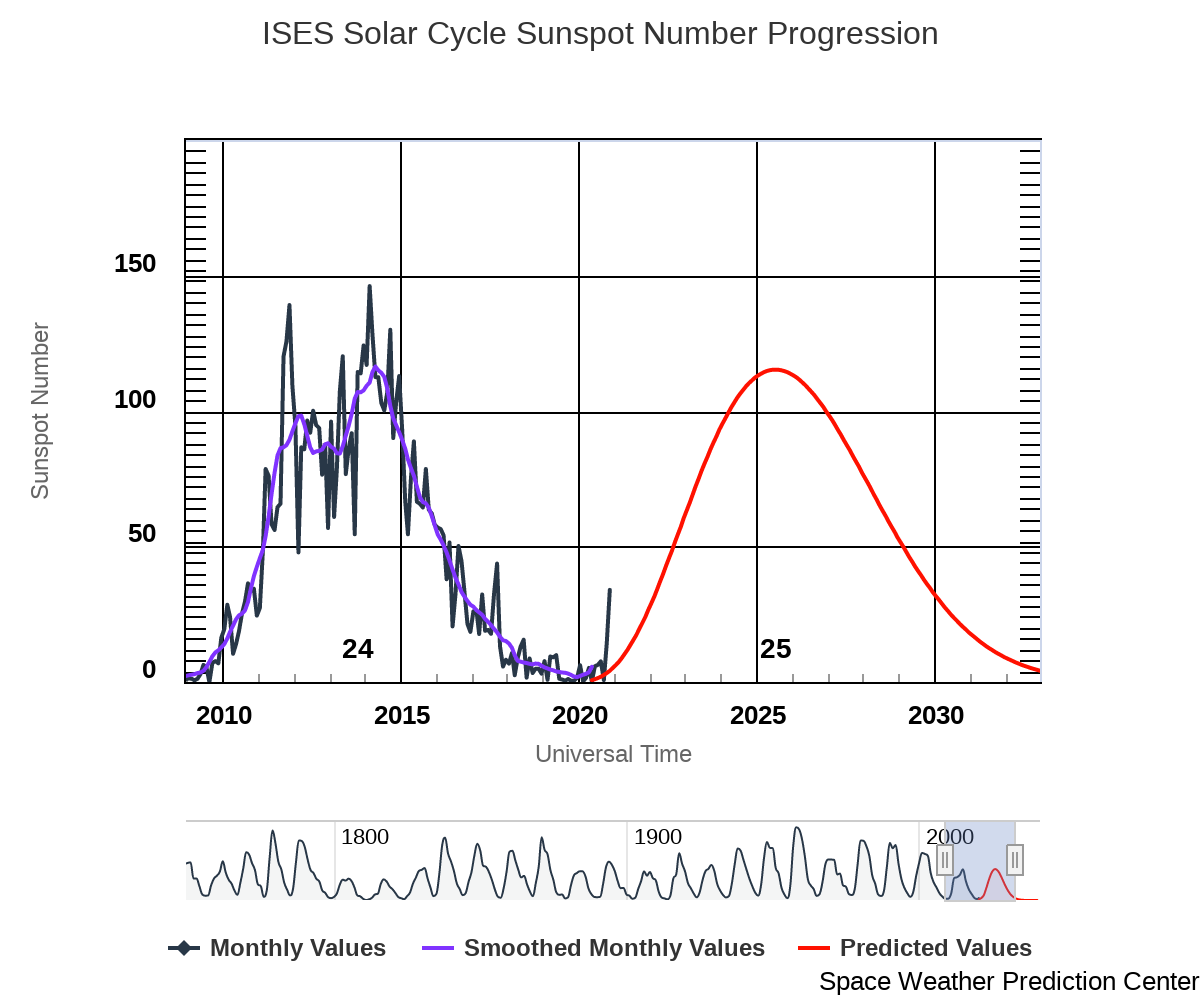
Sun Spot History (See:NOAA Page)
Trending
Quarterly Trends
- HRMA Heater
| Previous Quarter | |||||||
| MSID | MEAN | RMS | DELTA/YR | DELTA/YR/YR | UNITS | DESCRIPTION | |
| ohrthr03 | -7.054e-05 | 5.285e-06 | (2.95+/-0.00)e2 | -0.01 +/- 0.00 | K | RT 5: HRMA FORWARD APERTURE PLATE | |
|---|---|---|---|---|---|---|---|
| ohrthr09 | -0.002 | 1.452e-04 | (2.95+/-0.00)e2 | -0.01 +/- 0.04 | K | RT 105: HRMA CAP | |
| ohrthr17 | -0.002 | 1.651e-04 | (2.95+/-0.00)e2 | -0.03 +/- 0.04 | K | RT 125: HSA OUTER CYNLINDER | |
| ohrthr24 | -0.003 | 2.721e-04 | (2.96+/-0.01)e2 | -0.29 +/- 0.12 | K | RT 12: HRMA AFT HEATER PLATE | |
| ohrthr38 | -0.003 | 8.290e-04 | (2.99+/-0.02)e2 | -0.15 +/- 0.47 | K | RT 120: HRMA AFT COLLIMATOR OUTER CYLINDER | |
| ohrthr52 | -0.002 | 1.505e-04 | (2.95+/-0.00)e2 | -0.02 +/- 0.04 | K | RT 100: HRMA CAP | |
- HRMA Thermal
| Previous Quarter | |||||||
| MSID | MEAN | RMS | DELTA/YR | DELTA/YR/YR | UNITS | DESCRIPTION | |
| 4rt568t | -0.004 | 8.457e-04 | (2.98+/-0.02)e2 | 0.04 +/- 0.50 | K | RT 568 - HRMA TEMP | |
|---|---|---|---|---|---|---|---|
| 4rt569t | -0.002 | 2.247e-04 | (2.96+/-0.01)e2 | -0.15 +/- 0.10 | K | RT 569 - HRMA TEMP | |
| 4rt570t | -0.001 | 1.182e-04 | (2.95+/-0.00)e2 | -0.05 +/- 0.04 | K | RT 570 - HRMA TEMP | |
| 4rt575t | -0.003 | 0.001 | (3.02+/-0.02)e2 | -0.30 +/- 0.68 | K | RT 575 - OB CONE TEMP | |
| 4rt576t | -0.005 | 7.744e-04 | (2.94+/-0.02)e2 | 0.01 +/- 0.47 | K | RT 576 - OB CONE TEMP | |
| 4rt578t | -0.003 | 0.001 | (3.01+/-0.03)e2 | 0.64 +/- 0.80 | K | RT 578 - OB CONE TEMP | |
- MUPS
| Previous Quarter | |||||||
| MSID | MEAN | RMS | DELTA/YR | DELTA/YR/YR | UNITS | DESCRIPTION | |
| pm1thv1t | 0.004 | 0.007 | (3.48+/-0.15)e2 | -0.05 +/- 3.66 | K | MUPS 1 THRUSTER VALVE 01 TEMP | |
|---|---|---|---|---|---|---|---|
| pline02t | 0.005 | 0.006 | (3.29+/-0.14)e2 | 5.65 +/- 3.40 | K | PROP LINE TEMP 02 | |
| pline03t | 0.012 | 0.007 | (3.24+/-0.17)e2 | 6.93 +/- 3.28 | K | PROP LINE TEMP 03 | |
| pline04t | 0.013 | 0.006 | (3.11+/-0.13)e2 | 6.06 +/- 3.13 | K | PROP LINE TEMP 04 | |
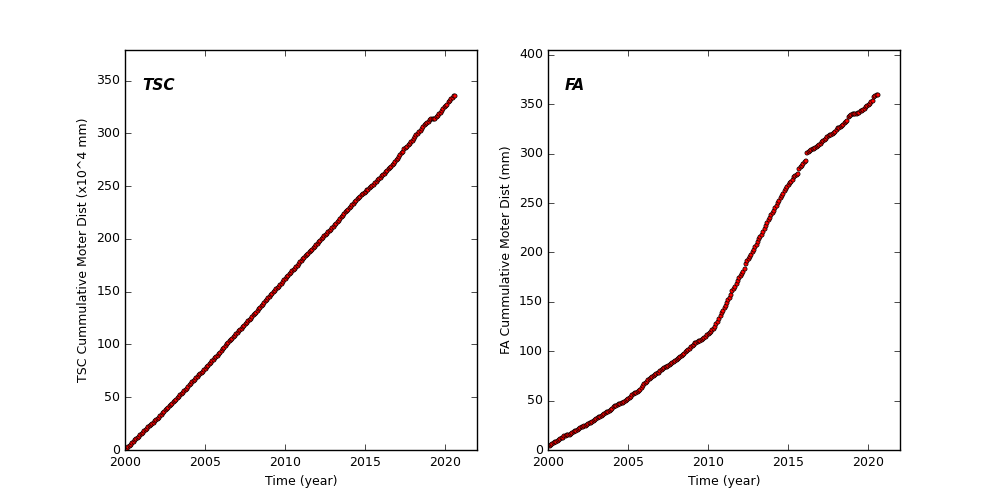
Spacecraft Motions
TSC and FA Cummulative Moter Distance
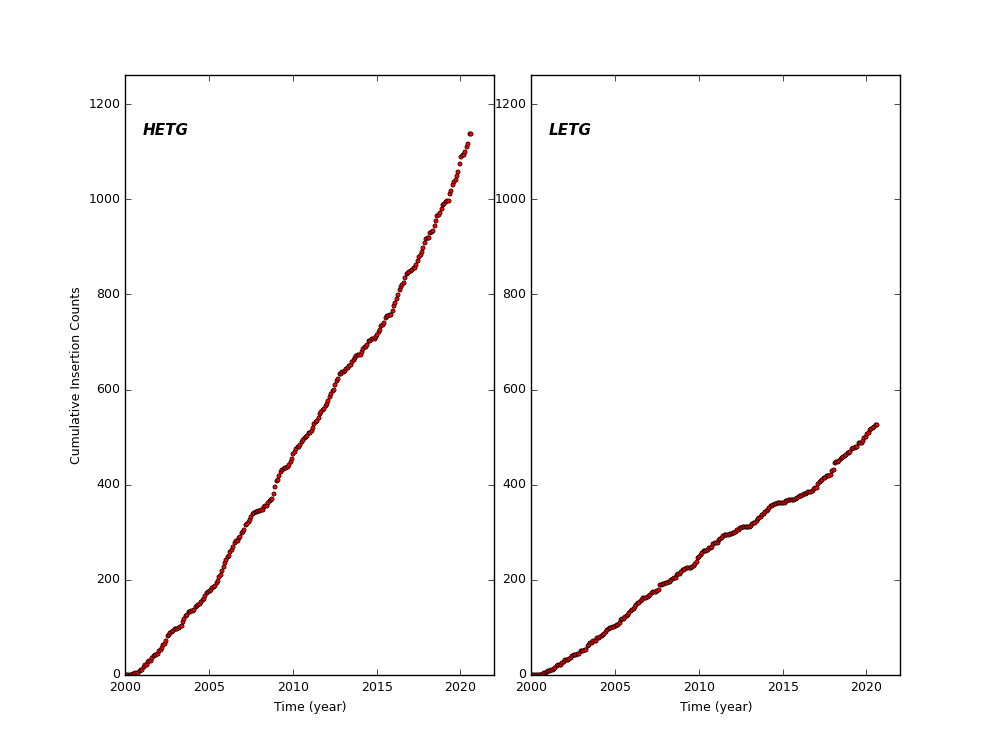
HETG and LETG Cummulative Insertion Counts
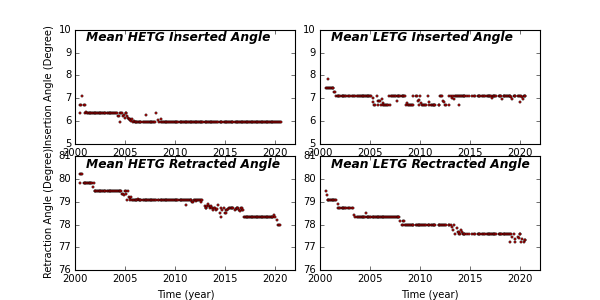
HETG/LETG Insertion/Retraction Angle
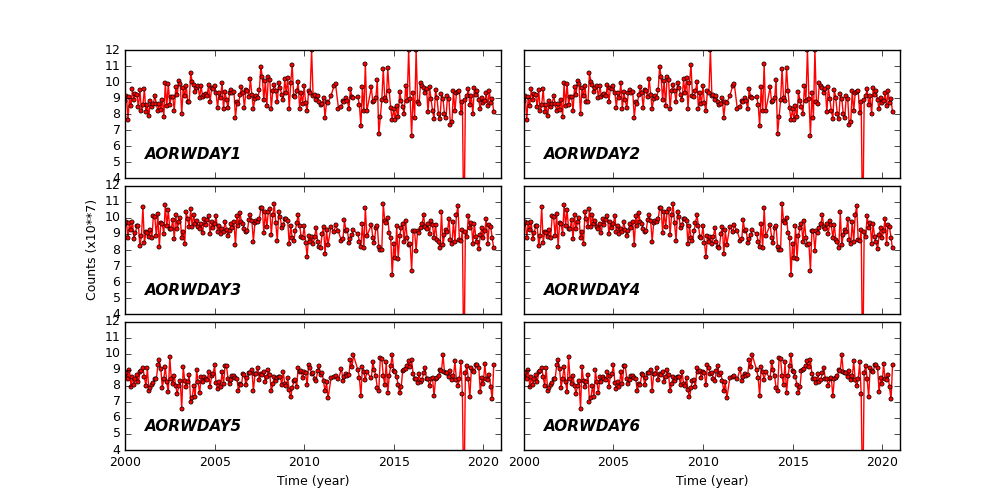
Reaction Wheel Rotations