ACIS
ACIS DOSE Registered-Photon-Map
The steps we took to compute the dose map are;
- Level 1 Event files for a specified month are obtained from archive.
- Image data including I2, I3, S2, S3 CCDs are extracted from all event files.
- All the extracted image data were merged to create a month long exposure map for the month.
- The exposure map is opened with ds9, and check a distribution of count rates against energy. From this, estimate the upper threshold value. Any events beyond this upper threshold are assumed erroneous events such as bad pixels.
- Using this upper threshold, the data is filtered, and create a cleaned exposure map for the month.
- The exposure map from each month from the Sep 1999 is added up to create a cumulative exposure map for each month.
- Using fimgstatistic, we compute count rate statistics for each CCDs.
- For observations with high data drop rates (e.g., Crab nebula, Cas A), we corrected the observations by adding events.
Please check more detail plots at Telemetered Photon Dose Trend page.
)
)
)
Statistics:
# IMAGE     NPIX     MEAN        RMS        MIN     MAX
ACIS_feb21 6004901       5.215         6.819           0.0     1935


I2 node 0  262654	4.260198	2.426206	0.0	 41.0
I2 node 1  262654	4.471675	3.373998	0.0	946.0
I2 node 2  262654	4.348077	2.428532	0.0	 52.0
I2 node 3  262654	4.396301	2.527335	0.0	182.0

I3 node 0  262654	5.786526	2.974727	0.0	105.0
I3 node 1  262654	5.557994	4.100241	0.0	1535.0
I3 node 2  262654	5.428478	2.703734	0.0	 60.0
I3 node 3  262654	5.483454	3.355560	0.0	972.0

S2 node 0  262654	6.477436	3.512002	0.0	681.0
S2 node 1  262654	6.638146	3.262833	0.0	215.0
S2 node 2  262654	6.906078	5.091107	0.0	1935.0
S2 node 3  262654	7.391571	3.594887	0.0	515.0

S3 node 0  262654	10.831572	5.837357	0.0	187.0
S3 node 1  262654	11.610352	5.112917	0.0	204.0
S3 node 2  262654	10.711539	4.233041	0.0	202.0
S3 node 3  262654	9.495693	3.944561	0.0	185.0
)
)
)
Statistics:
 IMAGE     NPIX      MEAN        RMS           MIN      MAX
ACIS_total   6004901       2466.247         3168.109           0.0   137341


I2 node 0  262654	2132.025475	426.969554	455.0	12602.0
I2 node 1  262654	2242.385014	603.748360	469.0	115815.0
I2 node 2  262654	2268.951061	479.820543	481.0	13078.0
I2 node 3  262654	2274.155379	586.569930	457.0	28740.0

I3 node 0  262654	2439.973651	600.211921	449.0	12683.0
I3 node 1  262654	2517.625604	1715.416394	486.0	55570.0
I3 node 2  262654	2236.506709	417.914435	452.0	13136.0
I3 node 3  262654	2229.070790	449.688155	422.0	33843.0

S2 node 0  262654	2879.105718	460.022711	1581.0	22198.0
S2 node 1  262654	3051.247728	685.336858	1757.0	16622.0
S2 node 2  262654	3373.717191	680.679880	2181.0	28449.0
S2 node 3  262654	3339.464870	534.853471	1927.0	67451.0

S3 node 0  262654	5095.491399	2451.939358	2228.0	37092.0
S3 node 1  262654	6321.643200	2325.820656	0.0	36614.0
S3 node 2  262654	5056.264250	1292.242515	2267.0	26190.0
S3 node 3  262654	3931.667274	688.917669	2394.0	25556.0
)
|
)
|
)
|
)
|
| Nov 2020 | Aug 2020 | May 2020 | Feb 2020 |
|---|
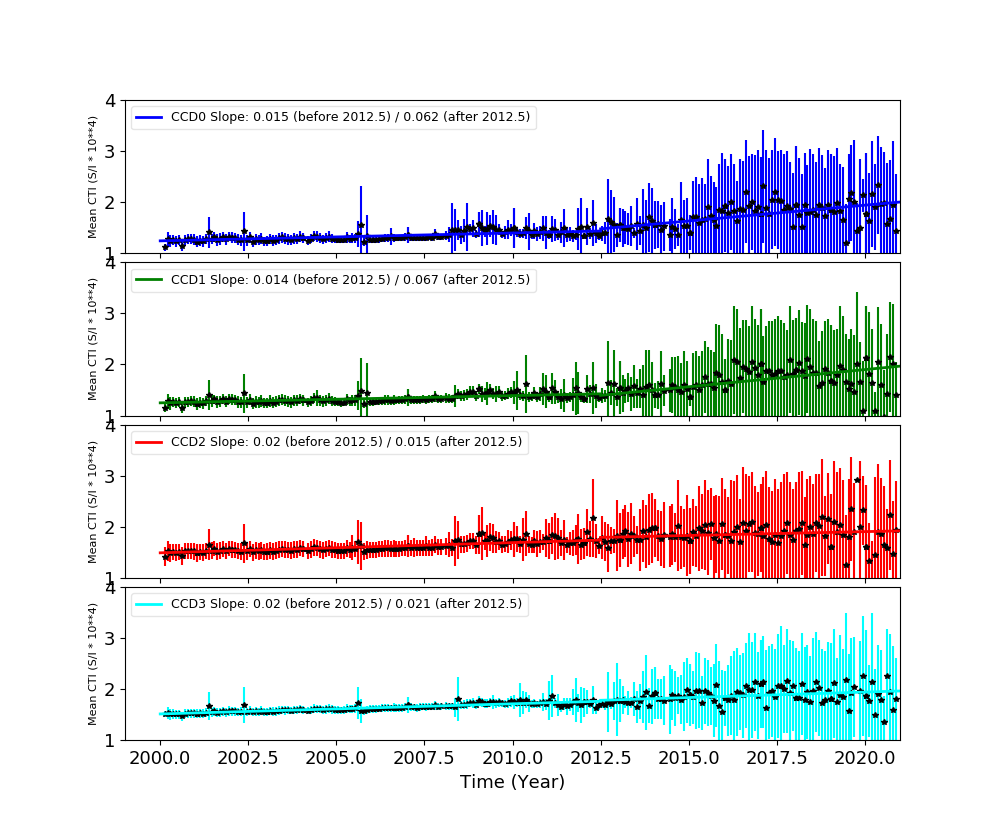
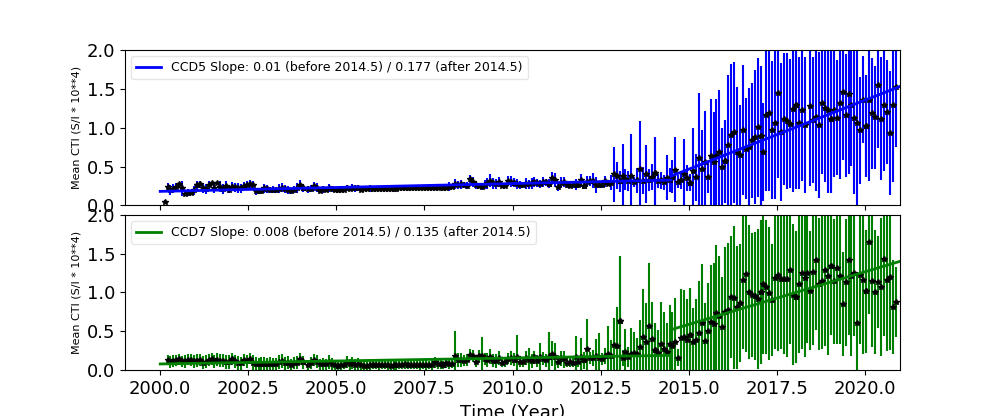
The Mean Detrended CTI
We report CTIs with a refined data definition. CTIs were computed for the temperature dependency corrected data. Please see CTI page for detailed explanation. CTI's are computed for Mn K alpha, and defined as slope/intercept x10^4 of row # vs ADU. Data file: here
Imaging CCDs
Spectral CCDs
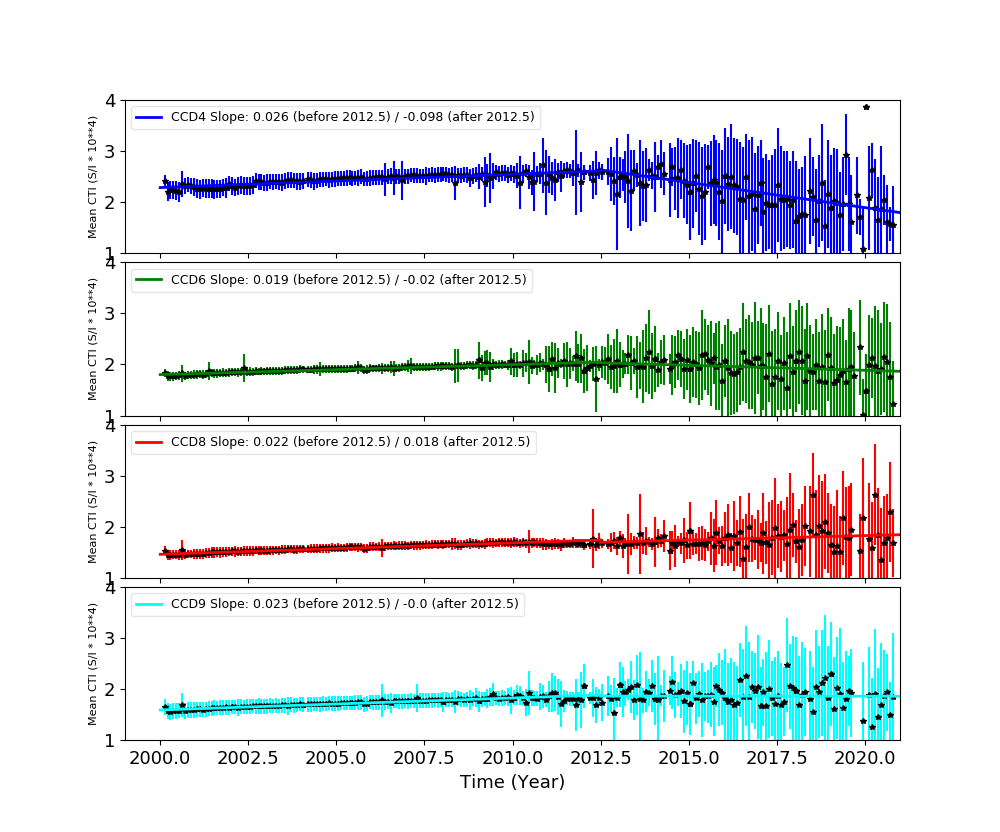
Backside CCDs
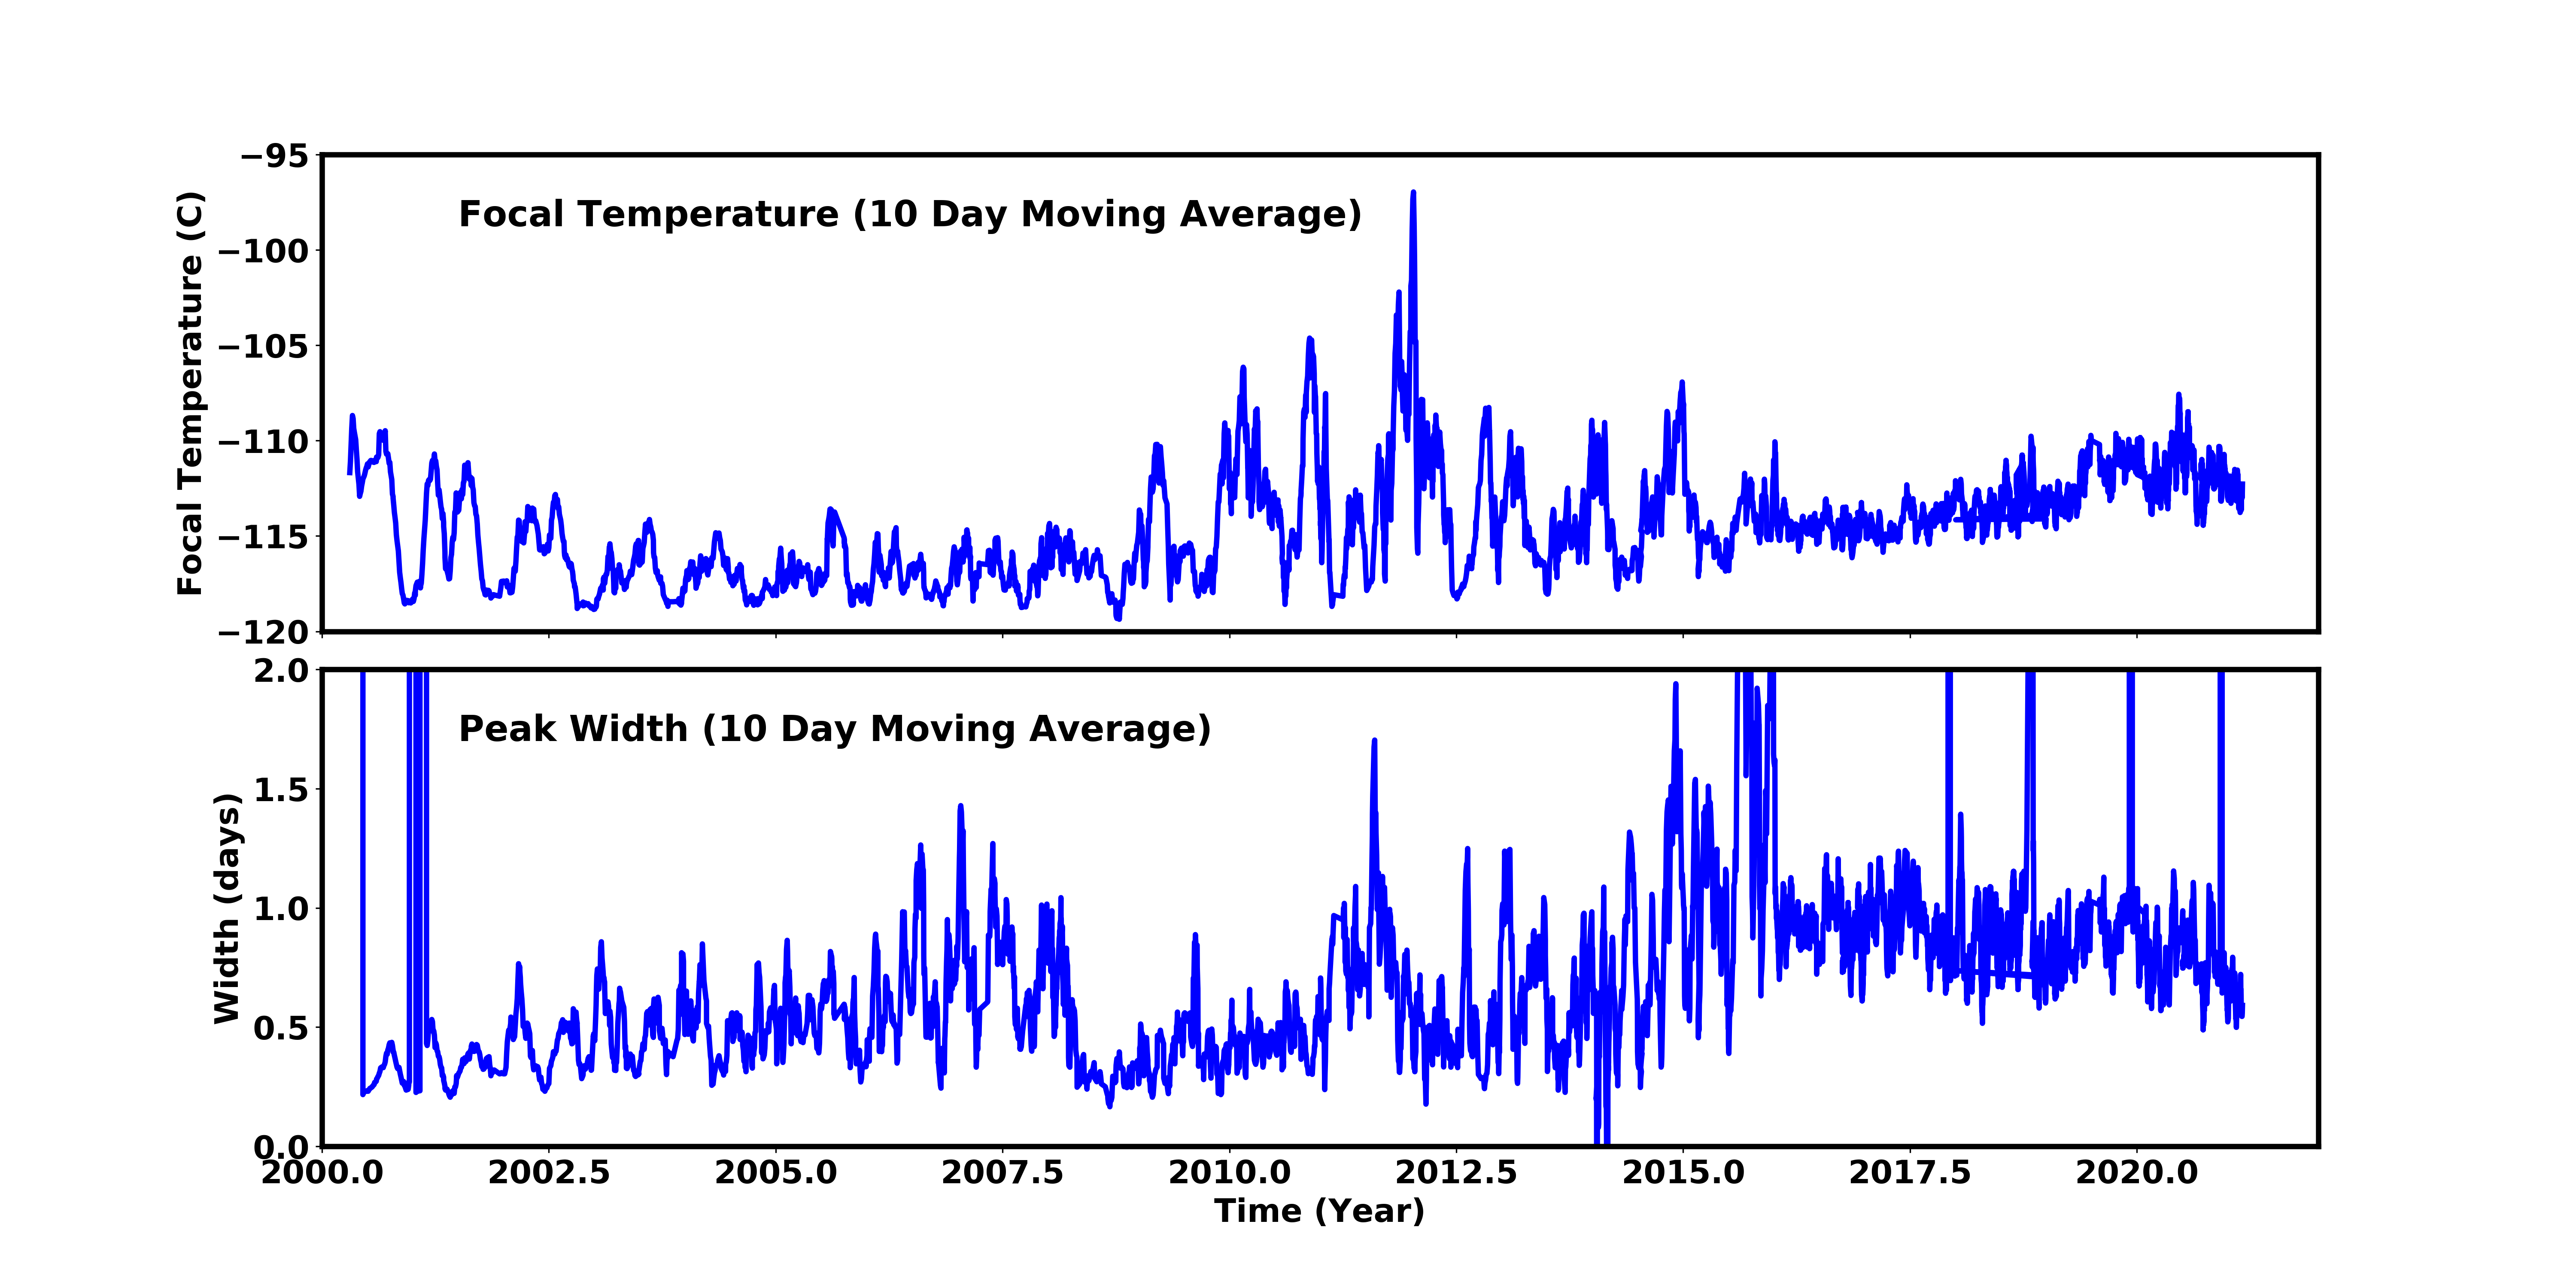
Focal Plane Temperature
Feb 2021 Focal Temperature
| The Mean (max) FPT: | |
|---|---|
| -112.57 | +/- 2.44 C |
| Mean Width: | |
| 0.62 | +/- 0.18 days |
Averaged Focal Plane Temperature
We are using 10 period moving averages to show trends of peak temperatures and peak widths. Note, the gaps in the width plot are due to missing/corrupted data.
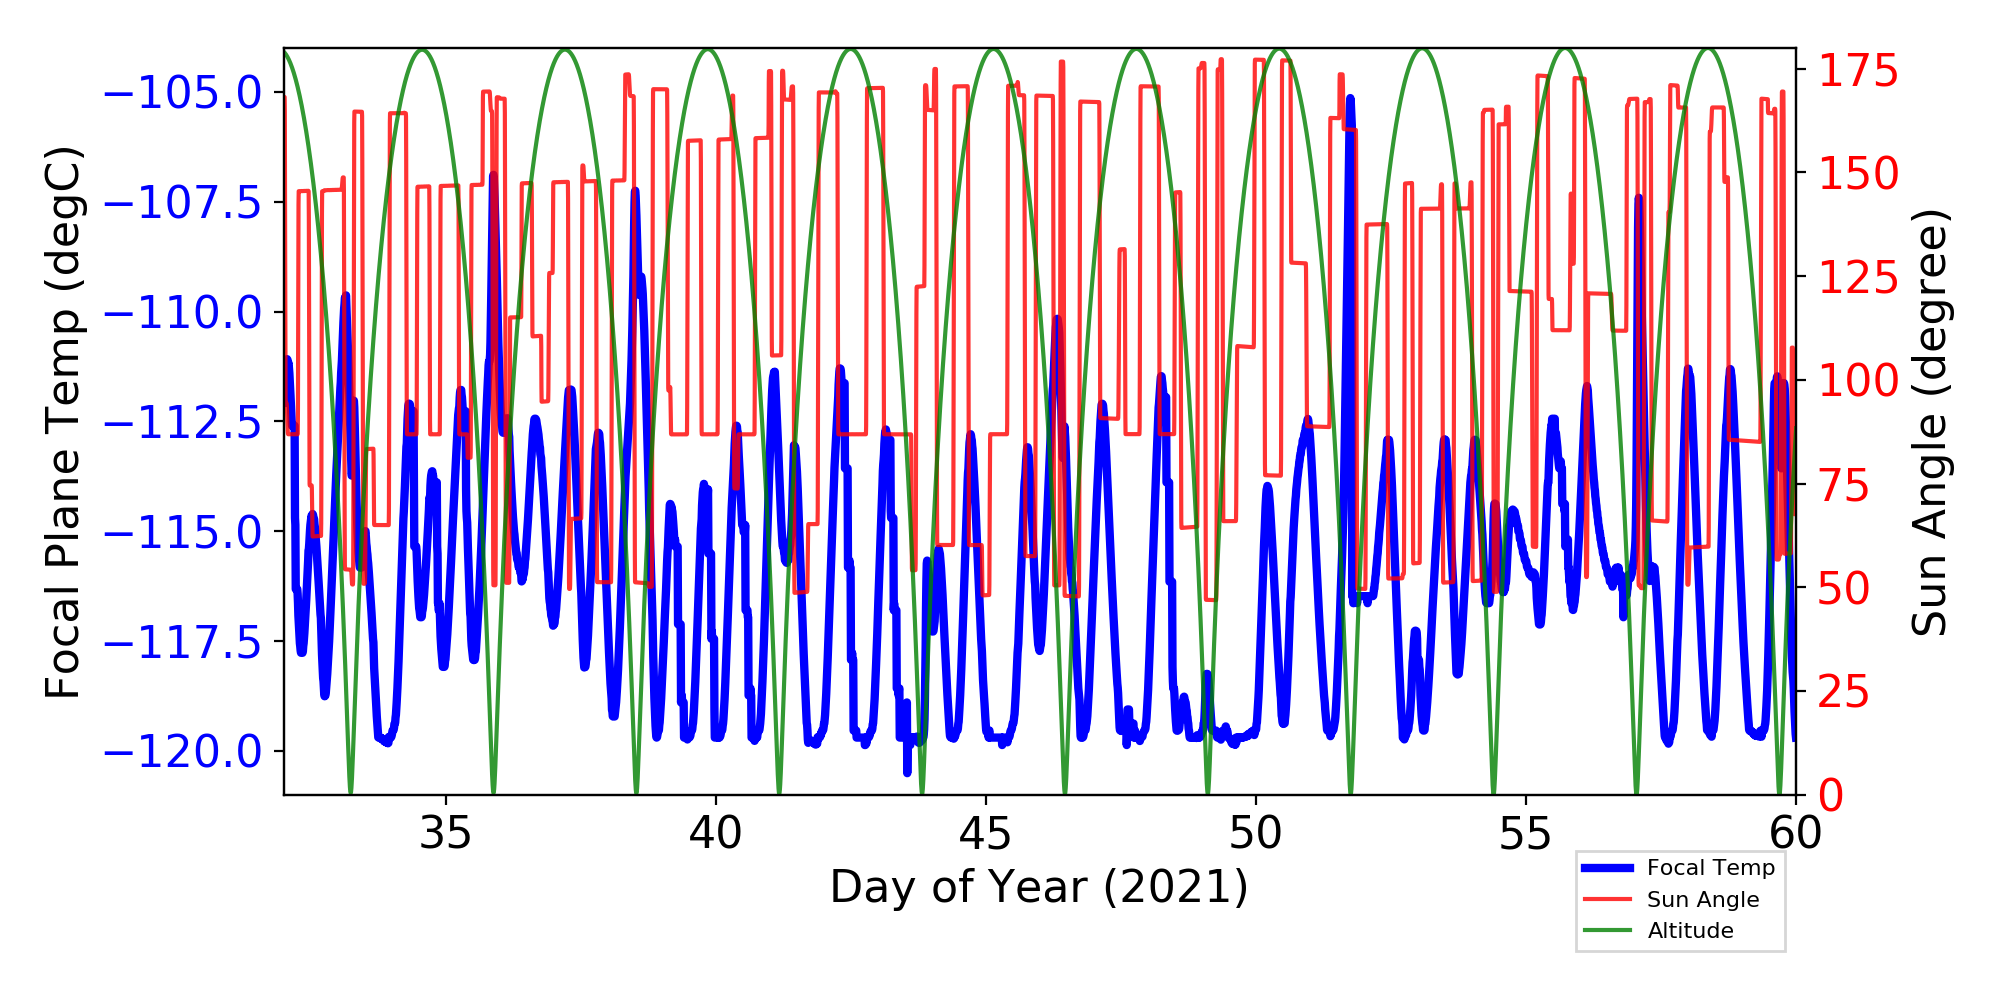
Focal Plane Temperature, Sun Angle and Altitude
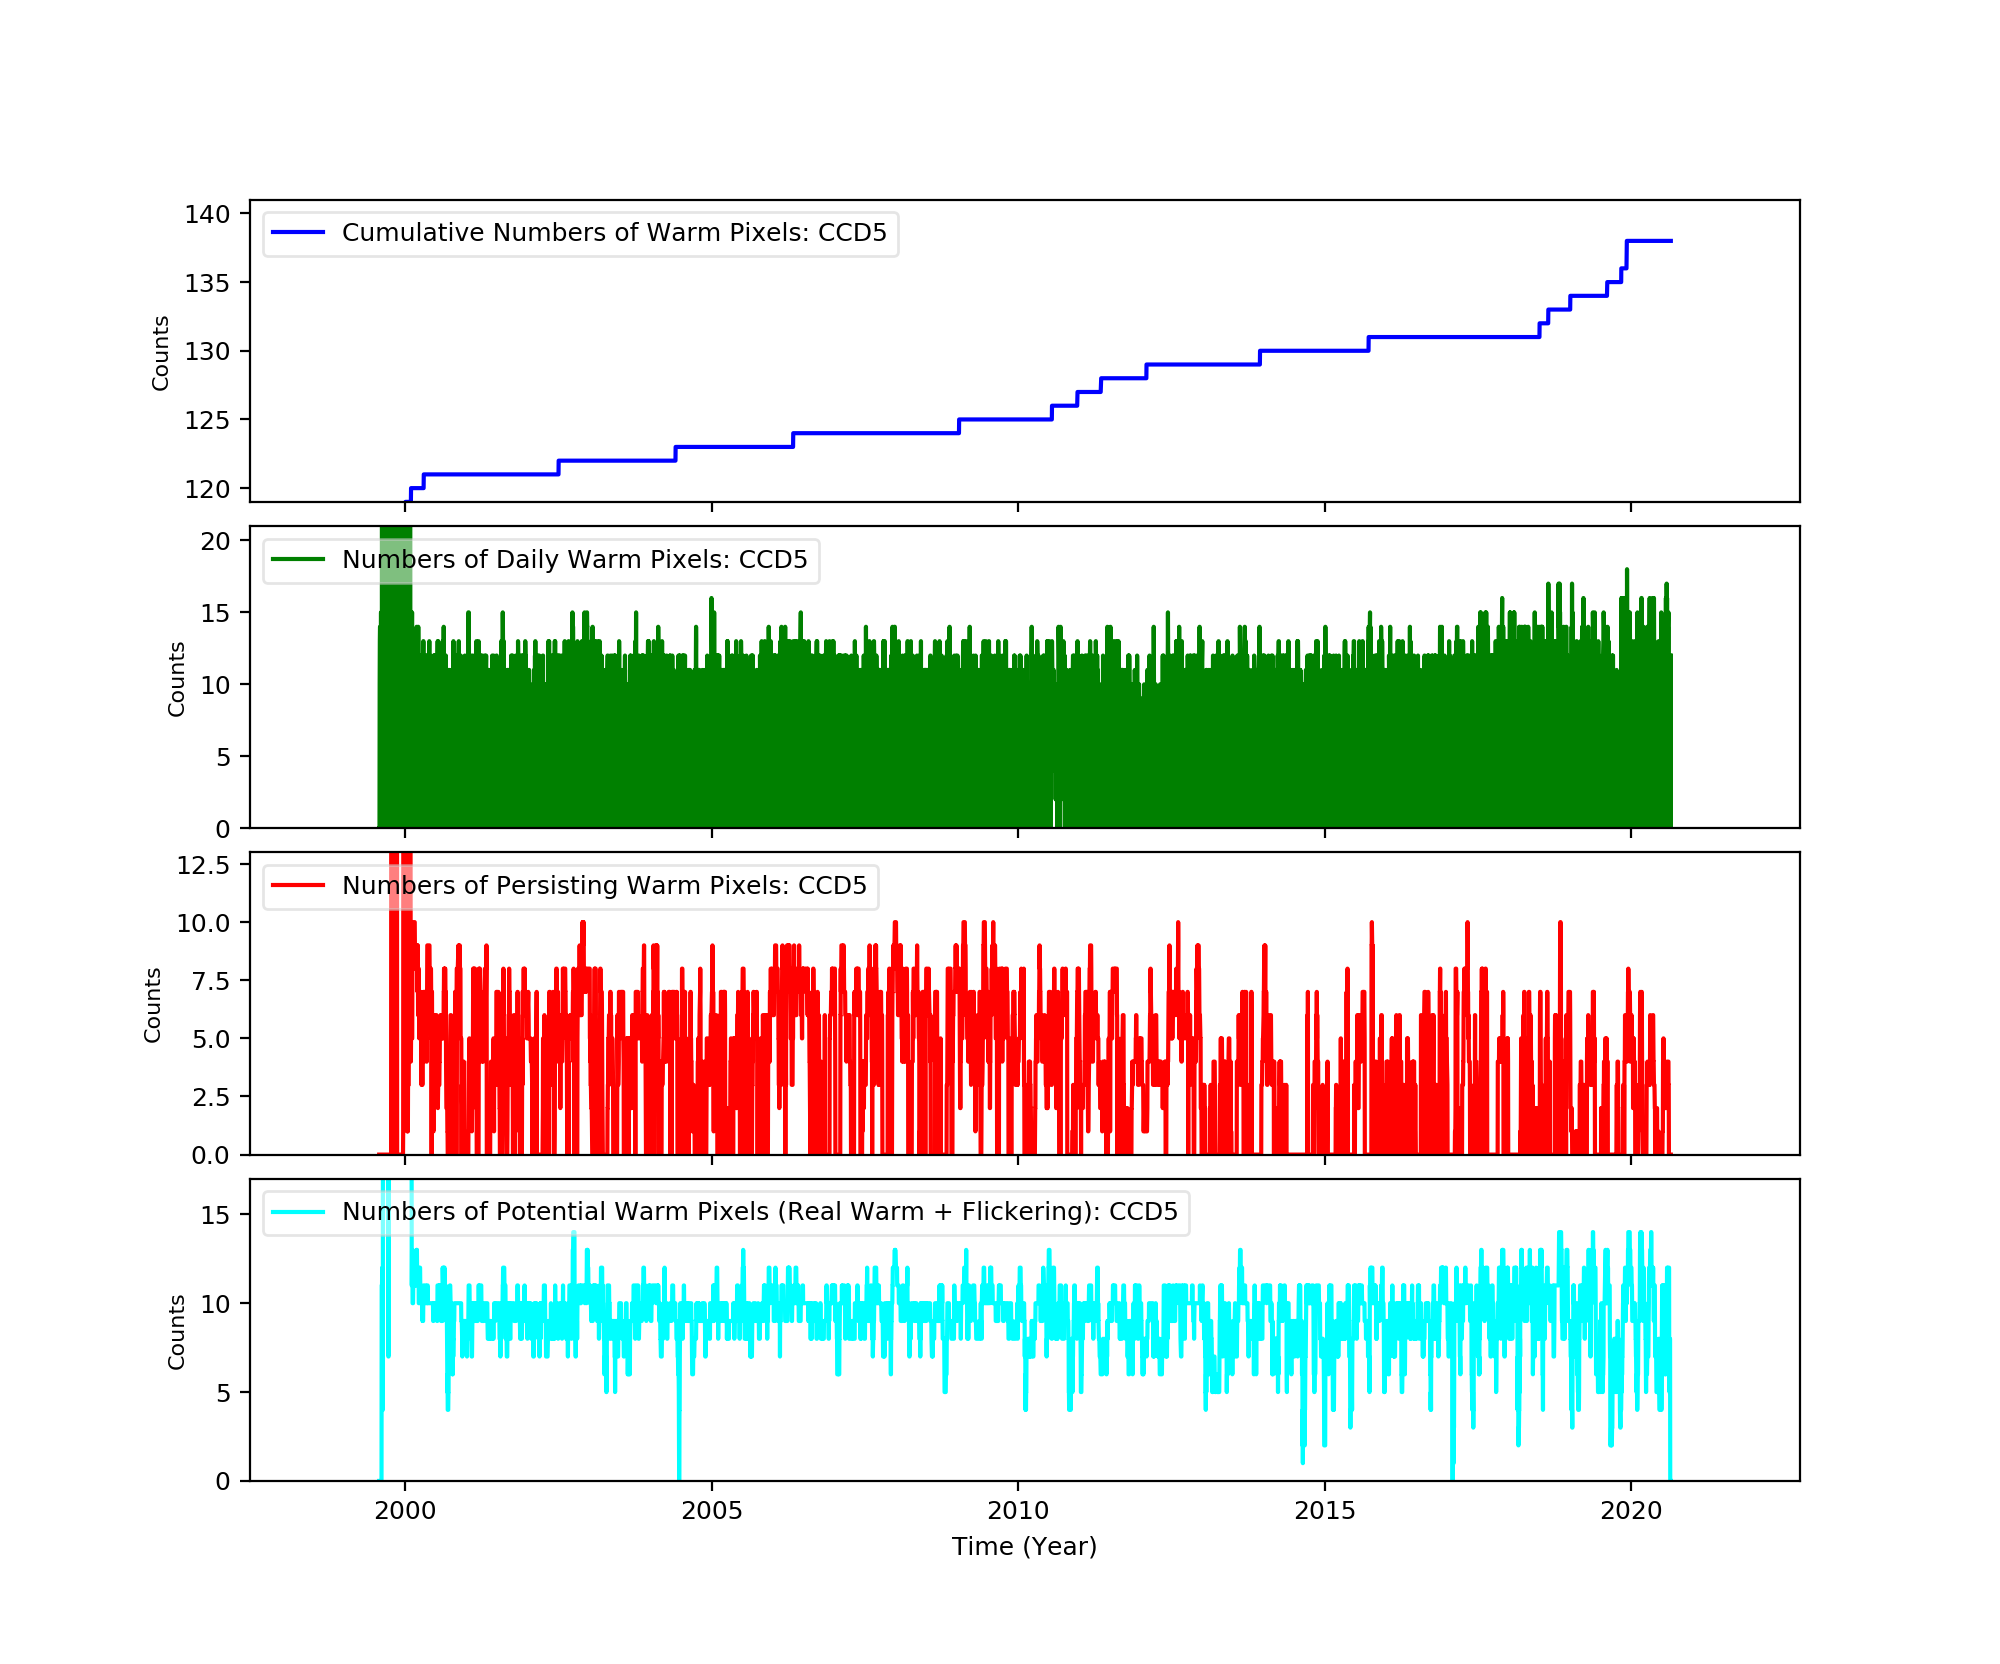
Bad Pixels
The plots below were generated with a new warm pixel finding script. Please see Acis Bad Pixel Page for details.
Front Side CCDs
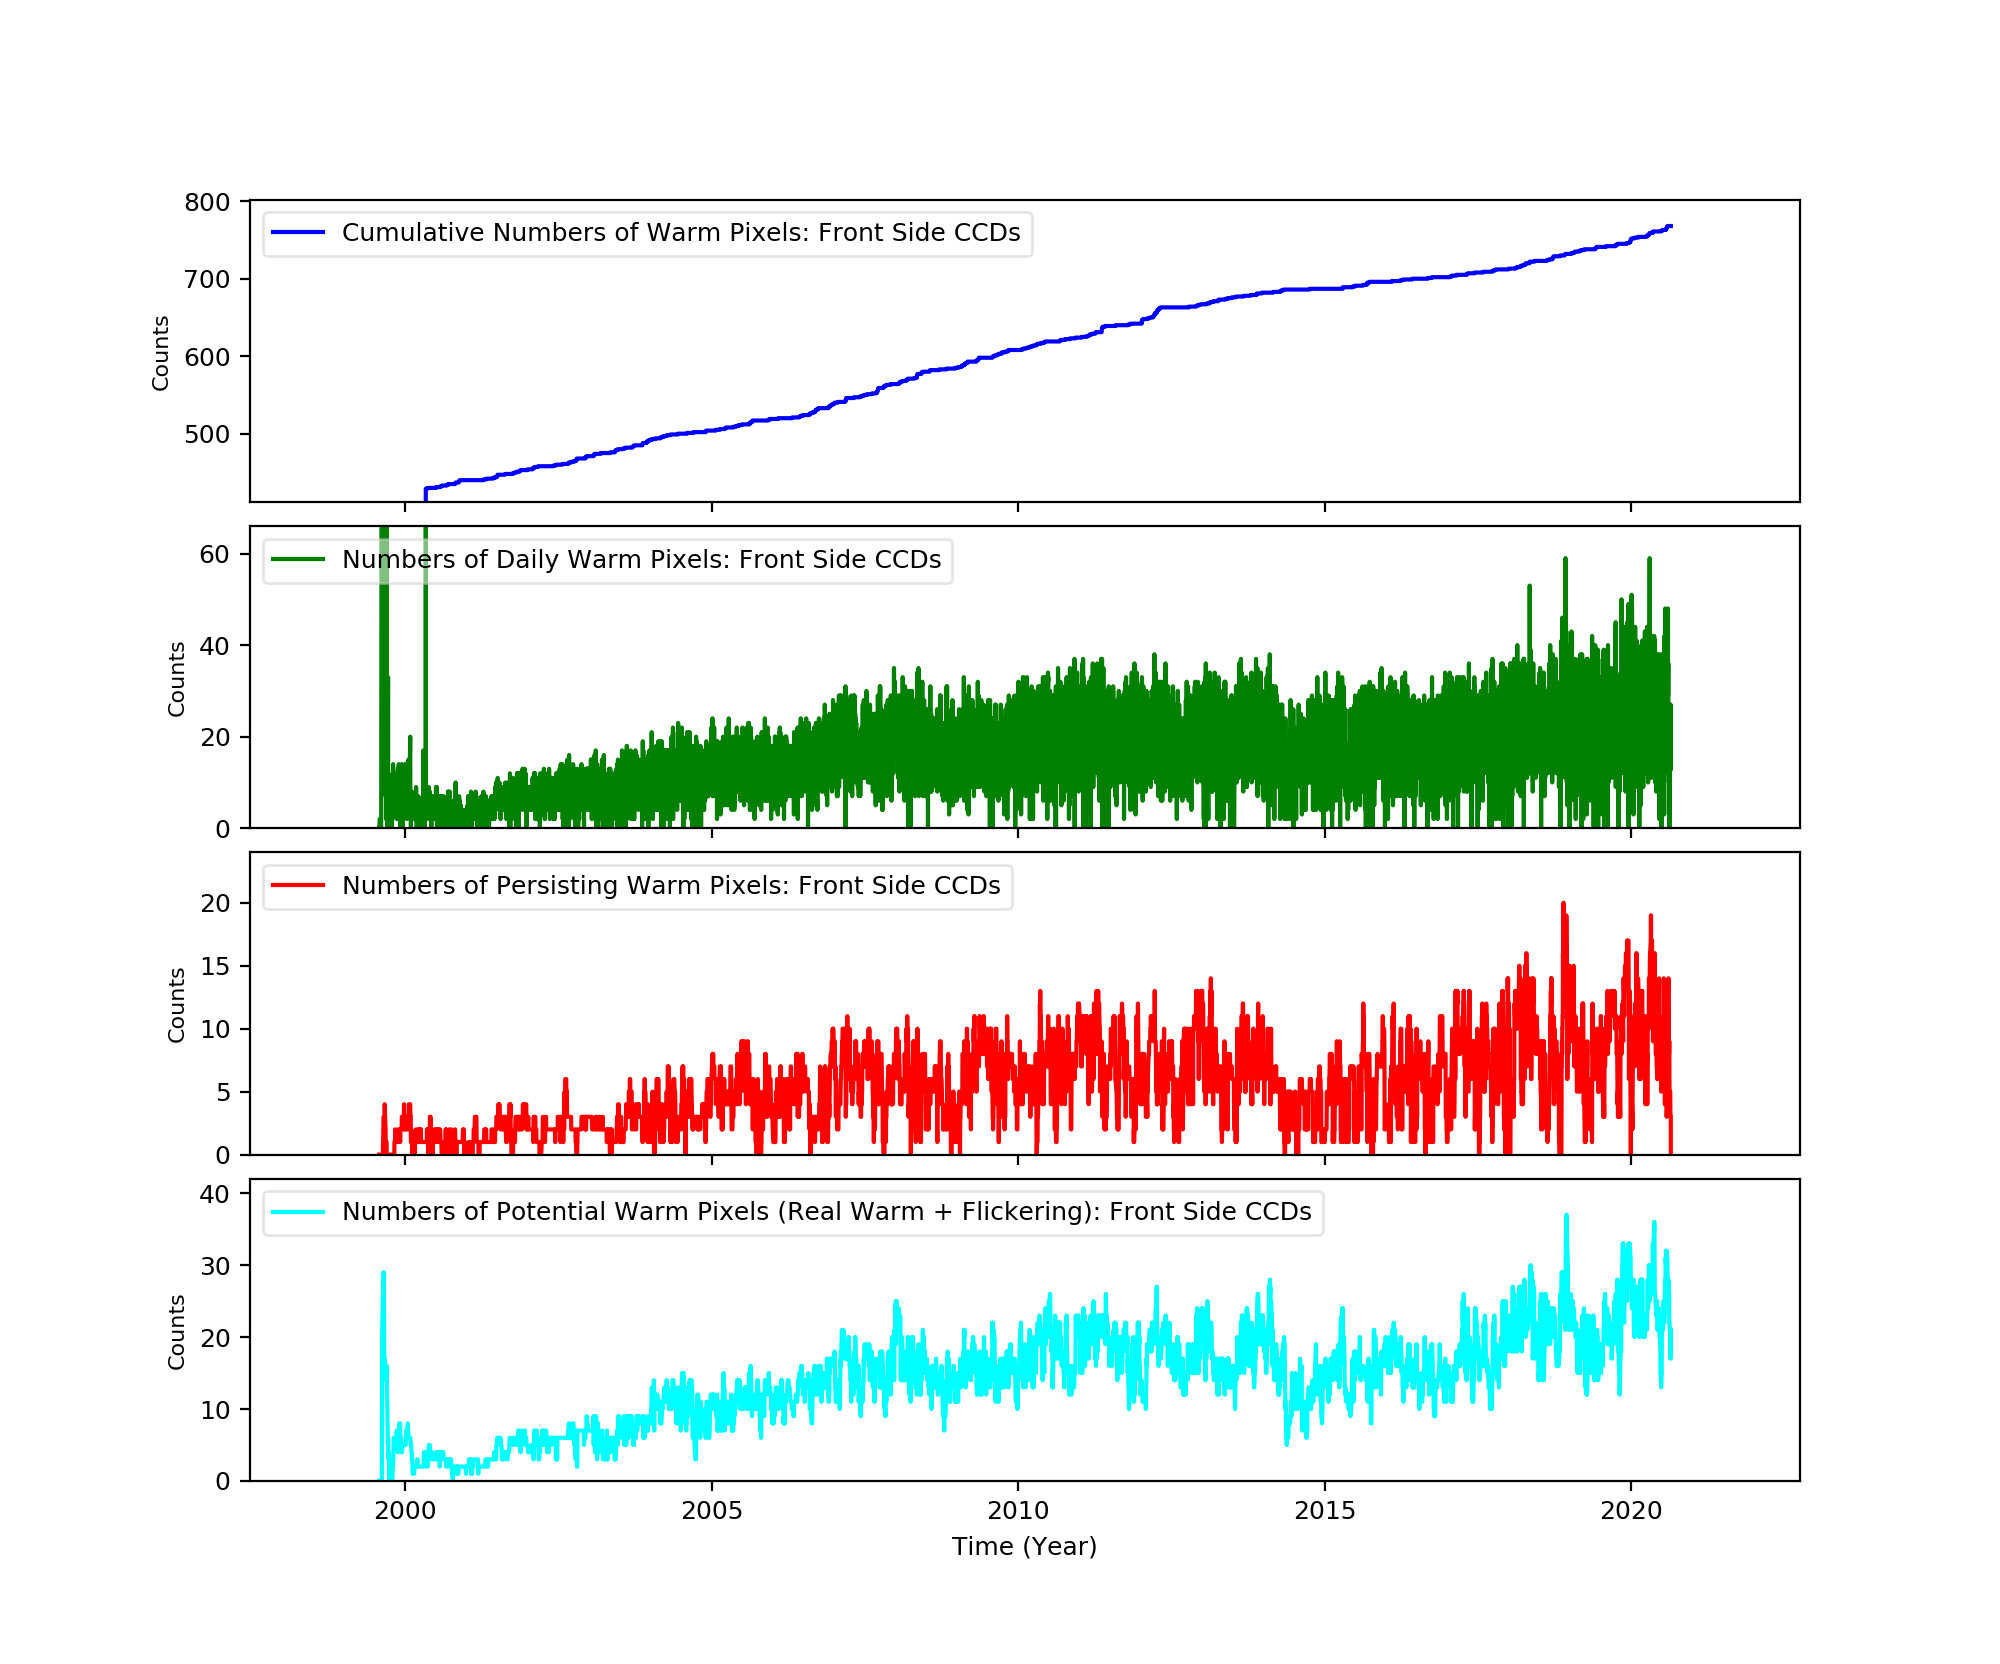
Back Side CCD (CCD5)
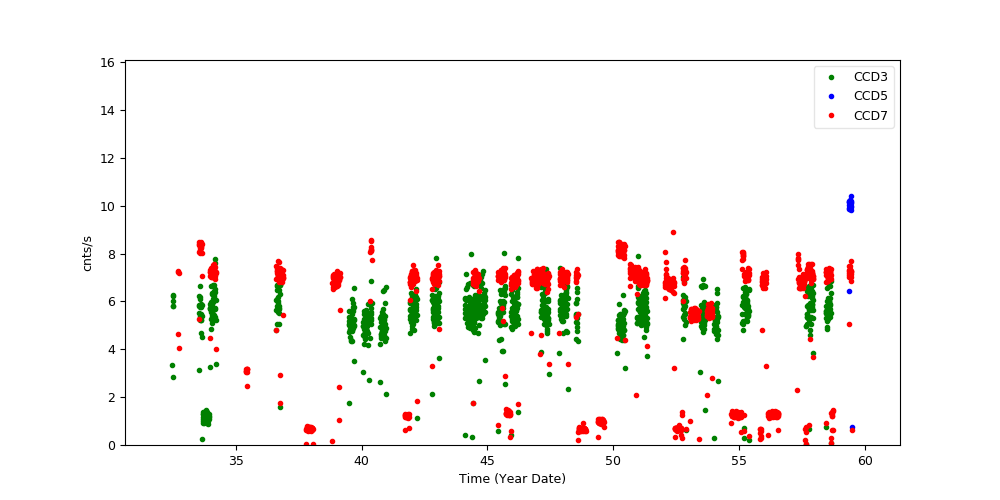
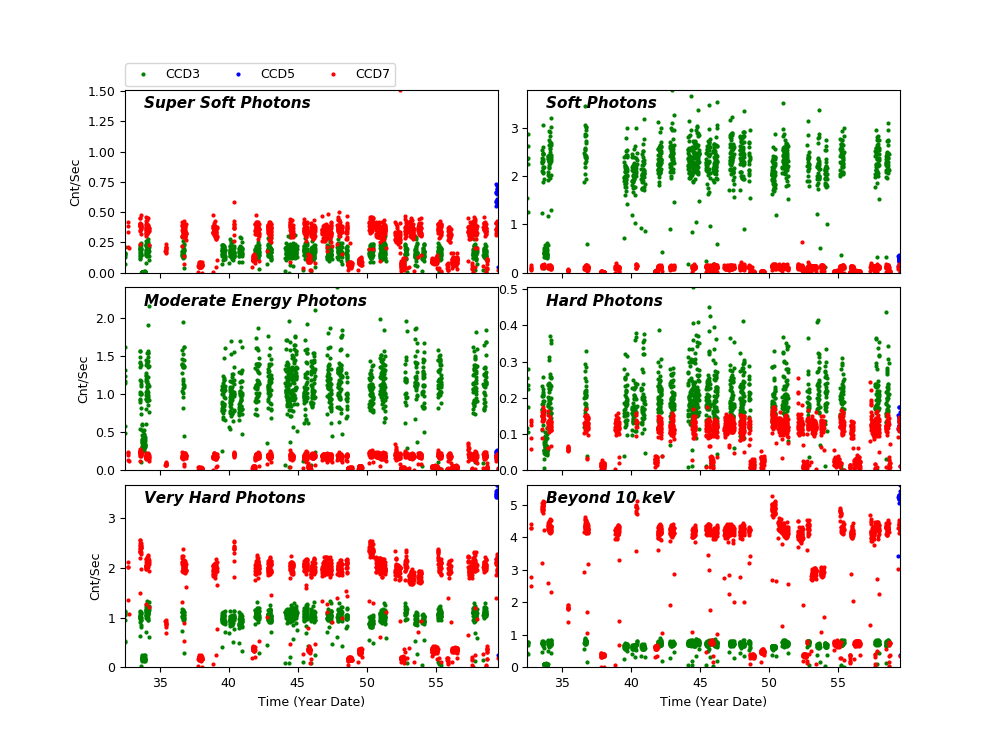
Science Instrument Background Rates
| Name | Low (keV) | High(KeV) | Description |
|---|---|---|---|
| SSoft | 0.00 | 0.50 | Super soft photons |
| Soft | 0.50 | 1.00 | Soft photons |
| Med | 1.00 | 3.00 | Moderate energy photons |
| Hard | 3.00 | 5.00 | Hard Photons |
| Harder | 5.00 | 10.00 | Very Hard photons |
| Hardest | 10.00 | Beyond 10 keV |
HRC
DOSE of Central 4K Pore-Pairs
Please refer to Maximum Dose Trends for more details.
)
|
|---|
IMAGE                NPIX      MEAN    STDDEV      MIN       MAX
HRCI_02_2021.fits  16777216	0.024 	0.158 	0.000 	9.000
)
IMAGE                       NPIX      MEAN    STDDEV      MIN       MAX
HRCI_08_1999_02_2021.fits  16777216	6.767 	6.199 	0.000 	311.000
)
|
|---|
IMAGE                NPIX      MEAN    STDDEV      MIN       MAX
HRCS_02_2021.fits  16777216	0.195 	0.519 	0.000 	9.000
)
IMAGE                       NPIX      MEAN    STDDEV      MIN       MAX
HRCS_08_1999_02_2021.fits  16777216	19.502 	34.888 	0.000 	1752.000
|
|
Max dose trend plots corrected for events that "pile-up"
in the center of the taps due to bad position information.
|
)
|
)
|
)
|
)
|
| Nov 2020 | Aug 2020 | May 2020 | Feb 2020 |
|---|
)
|
)
|
)
|
)
|
| Nov 2020 | Aug 2020 | May 2020 | Feb 2020 |
|---|
HRMA Focus
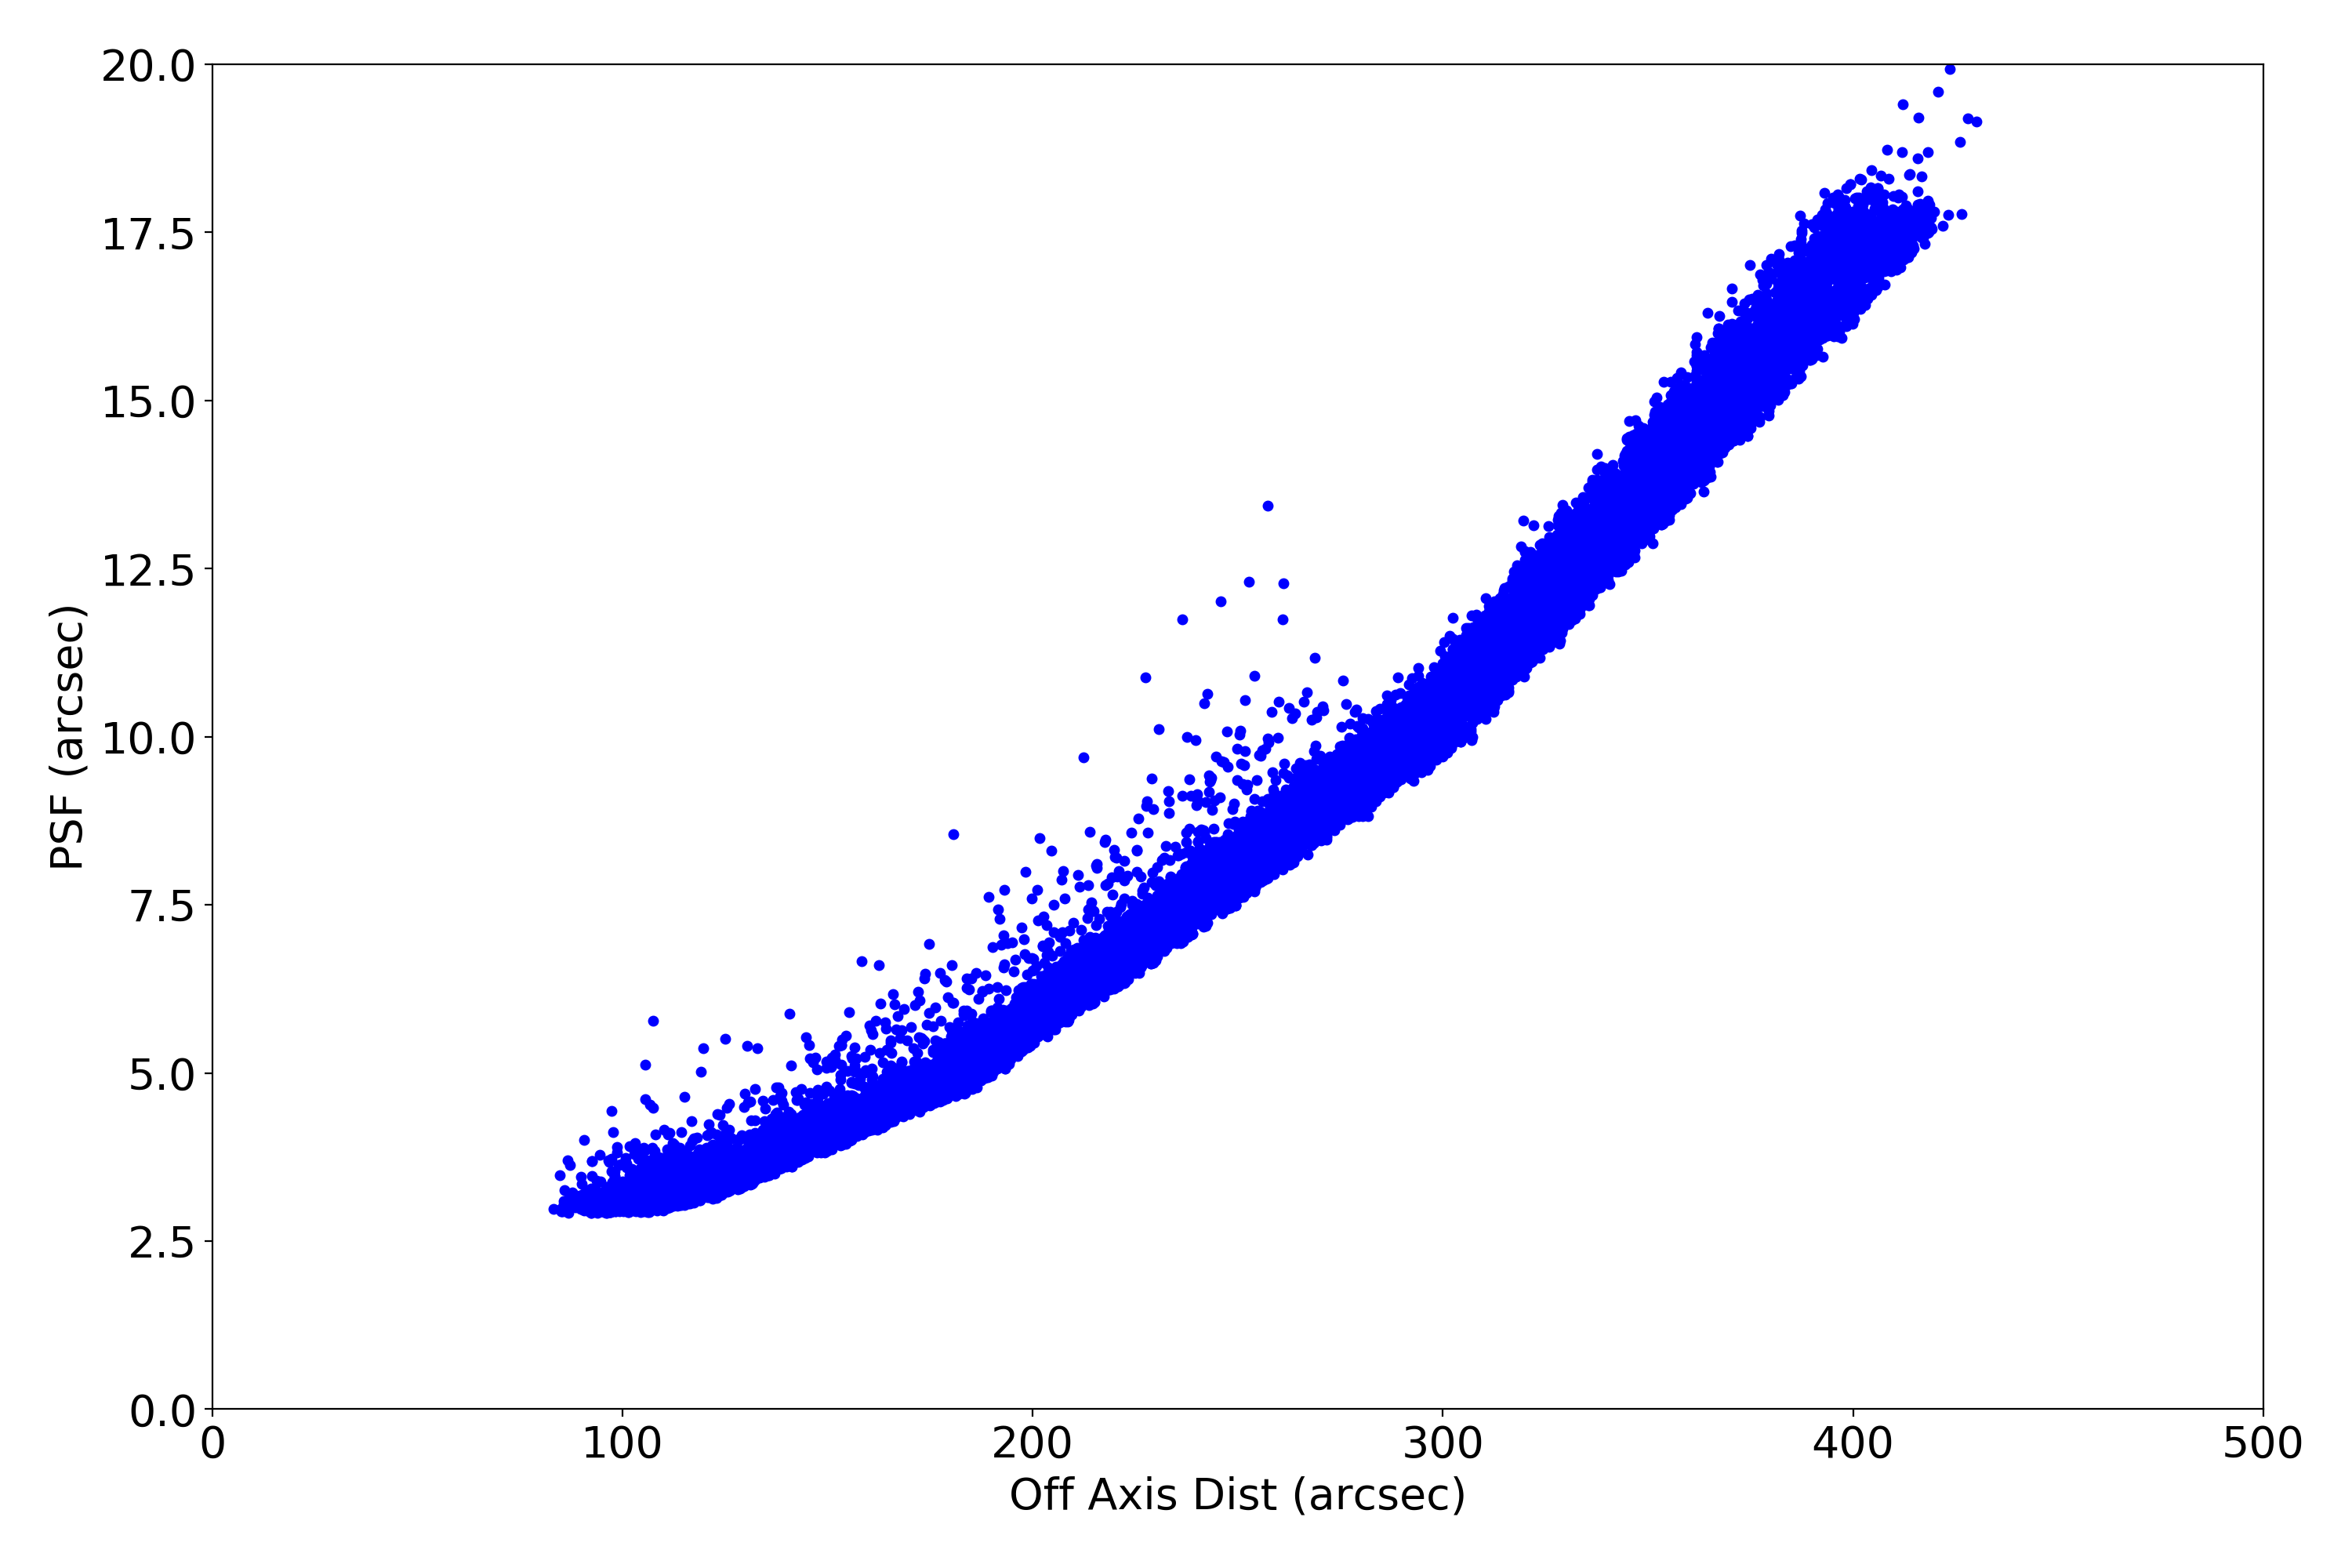
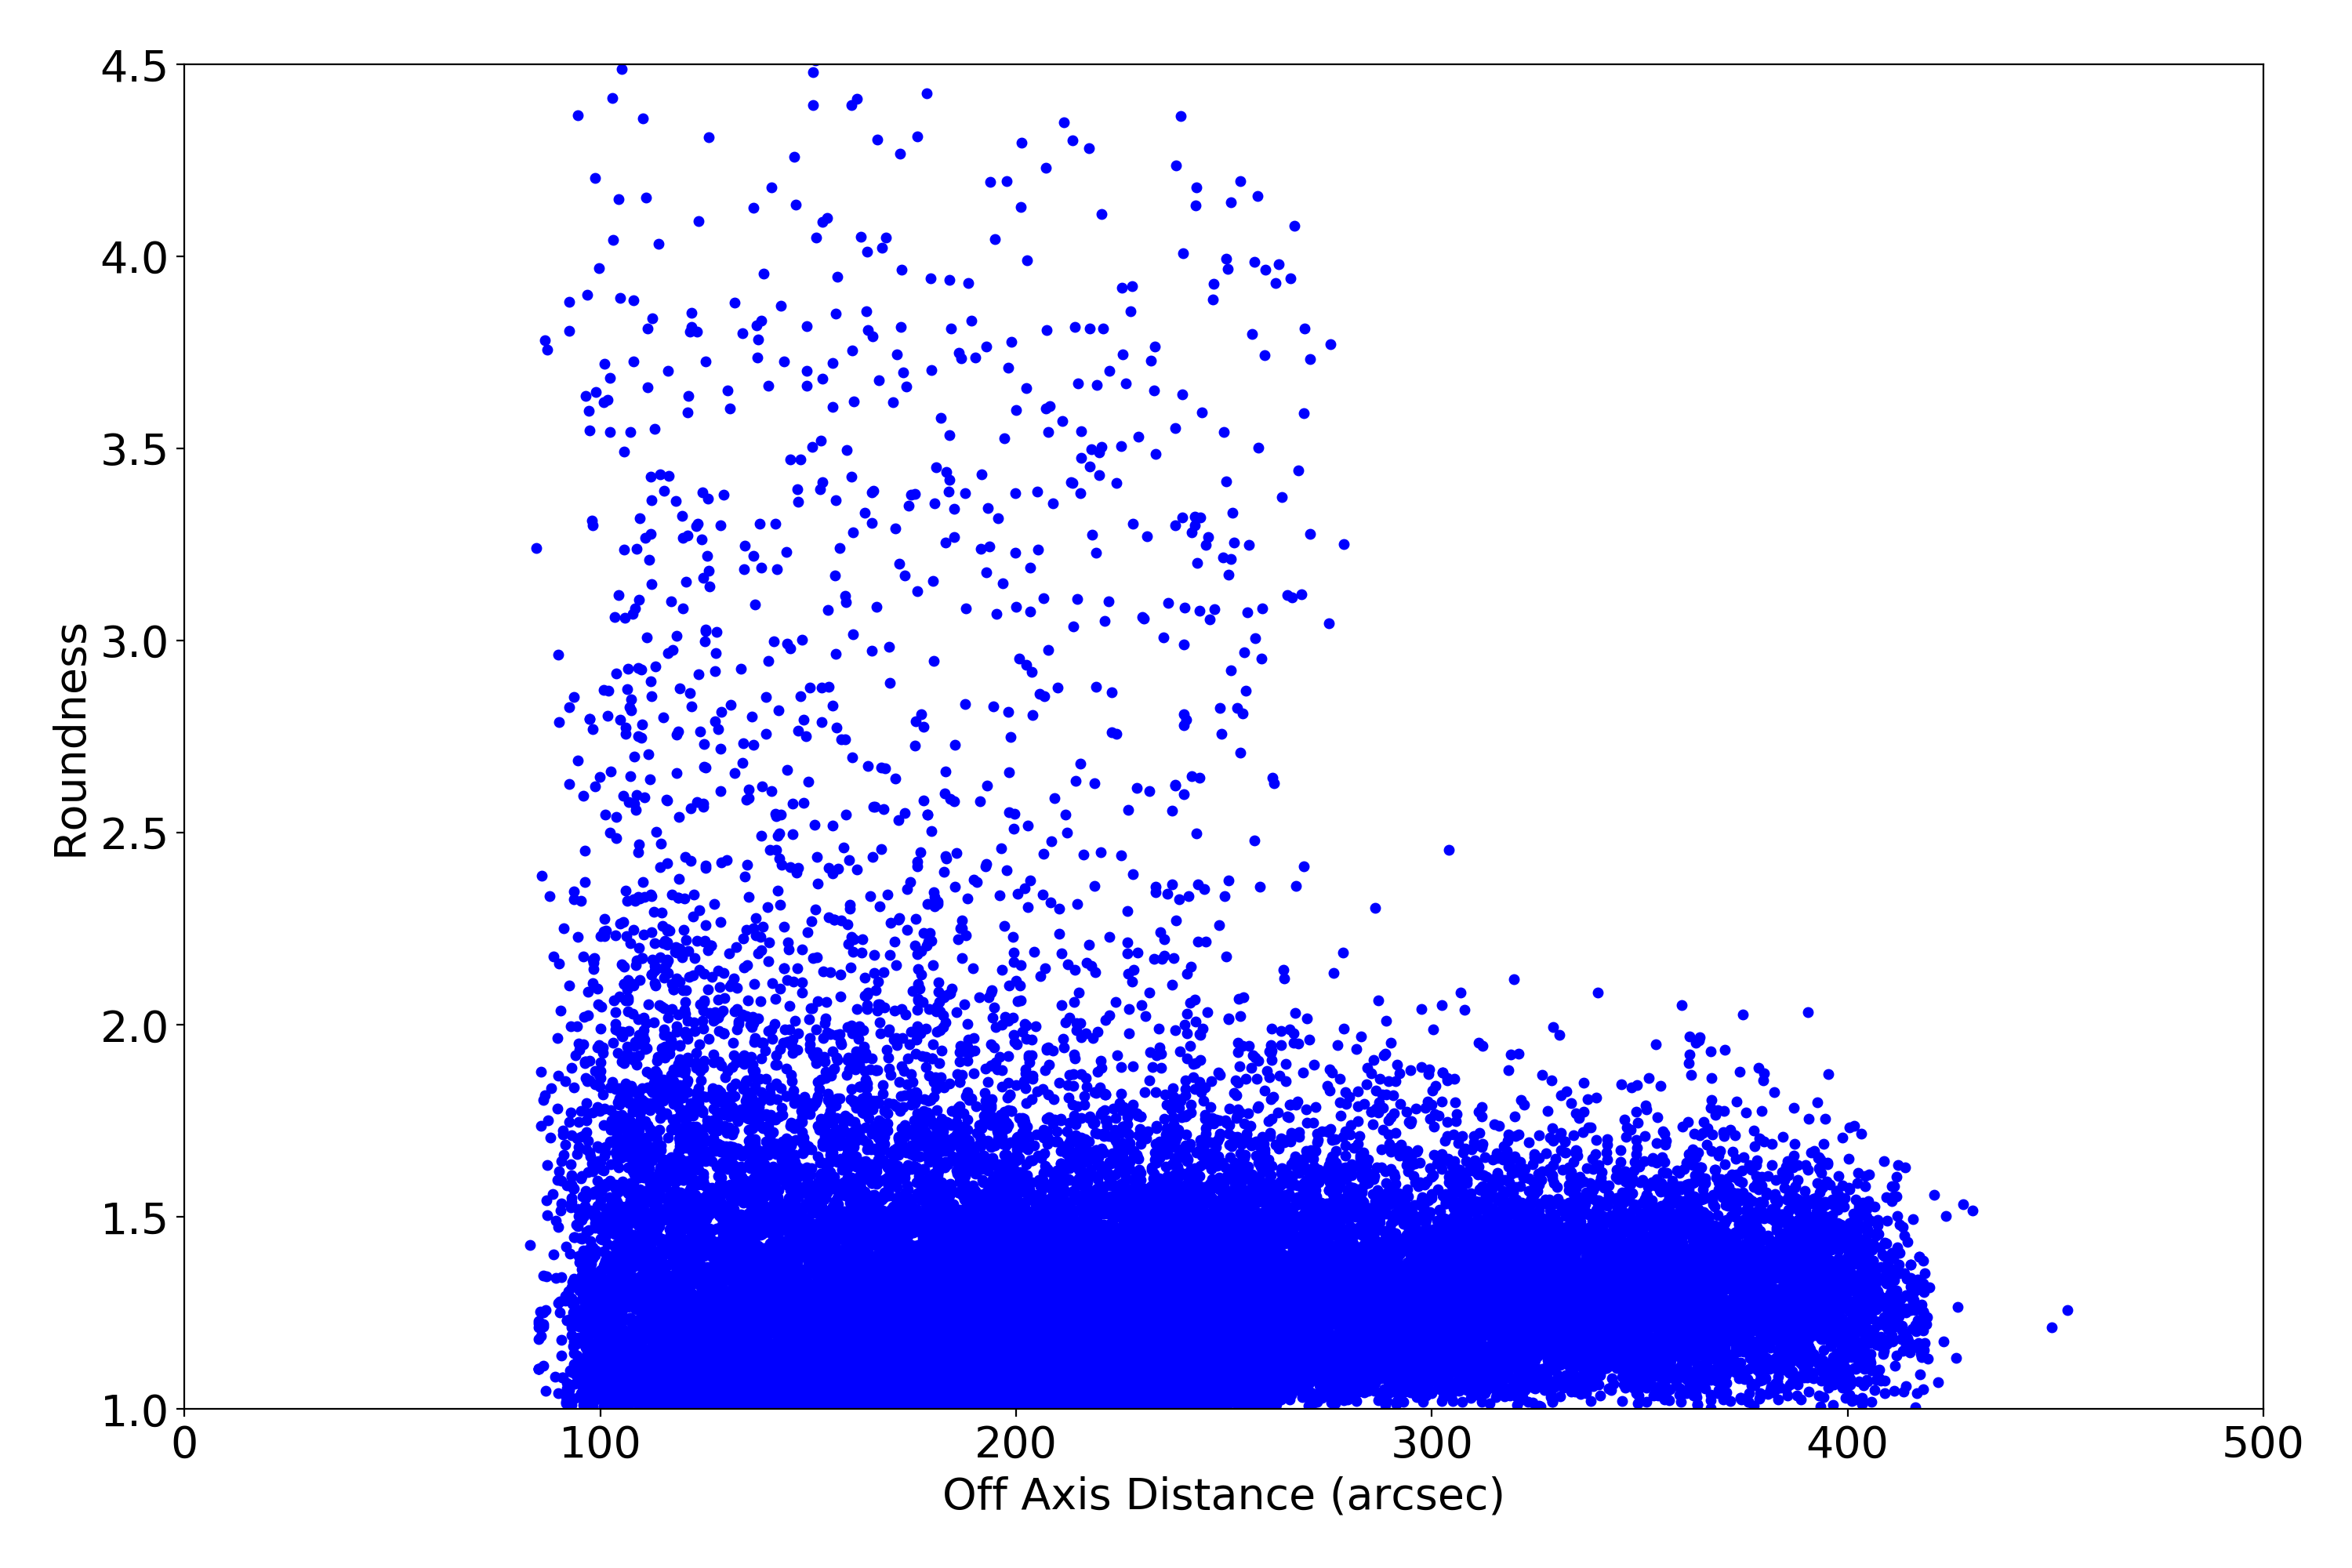
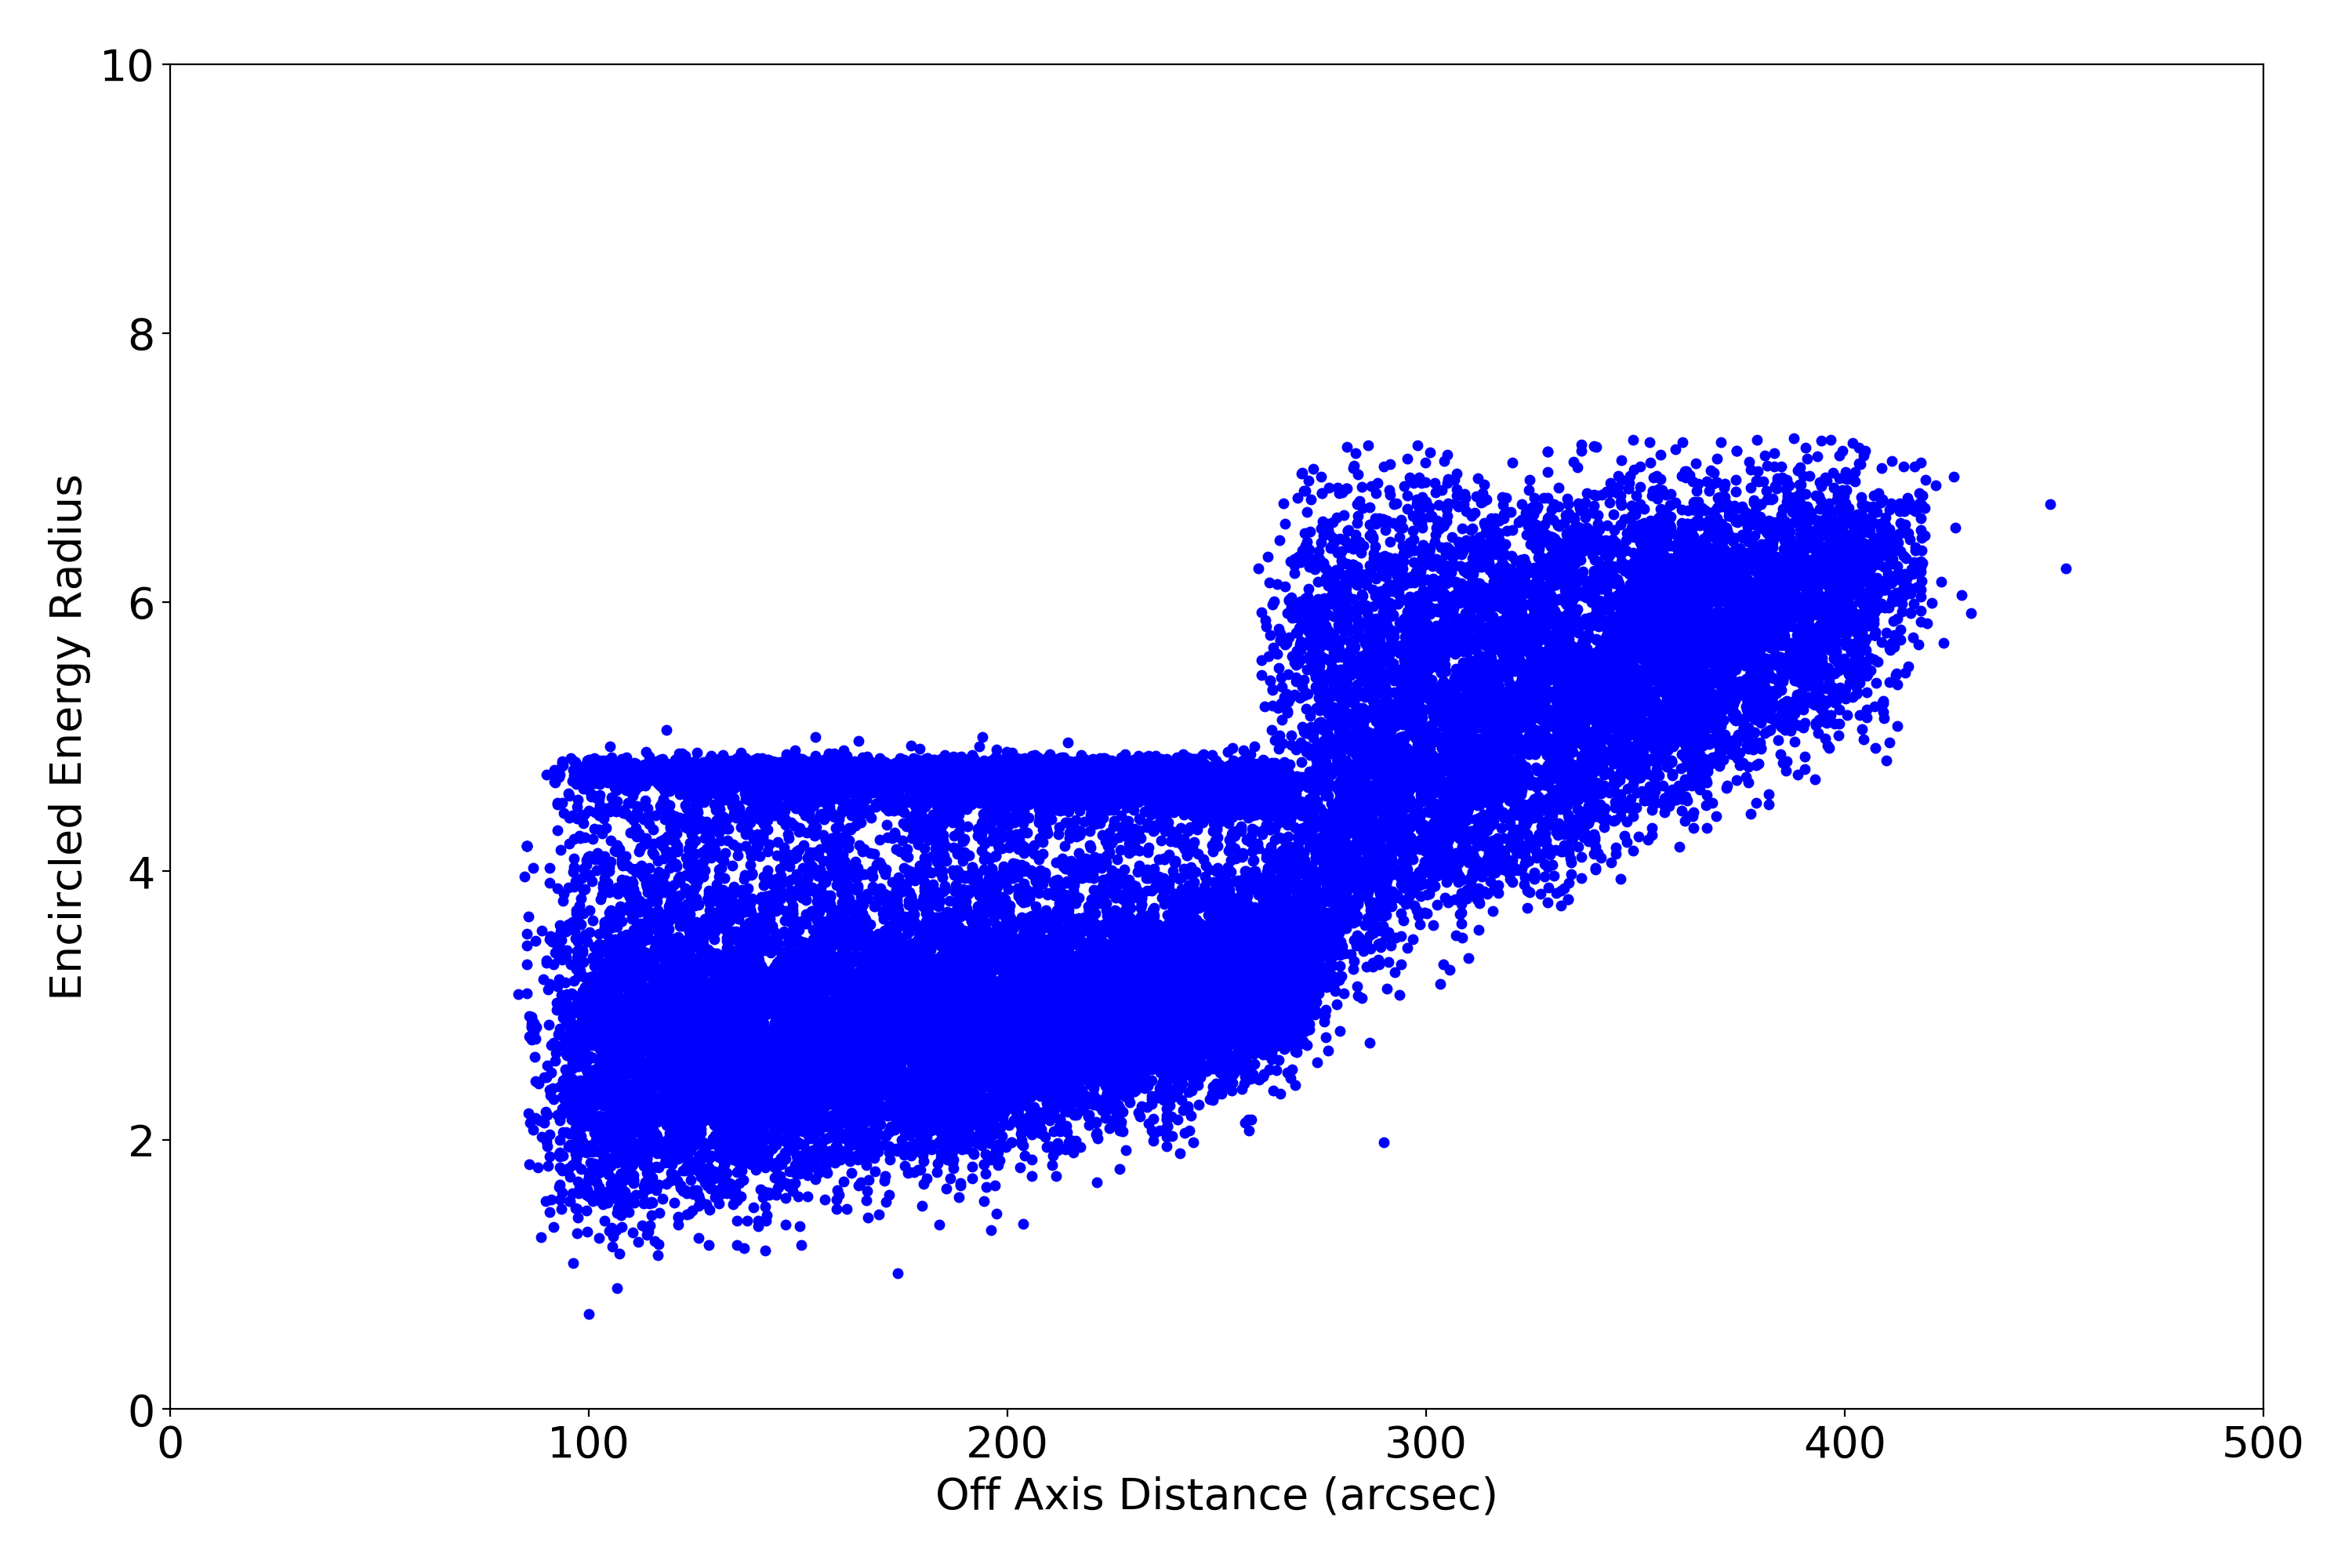
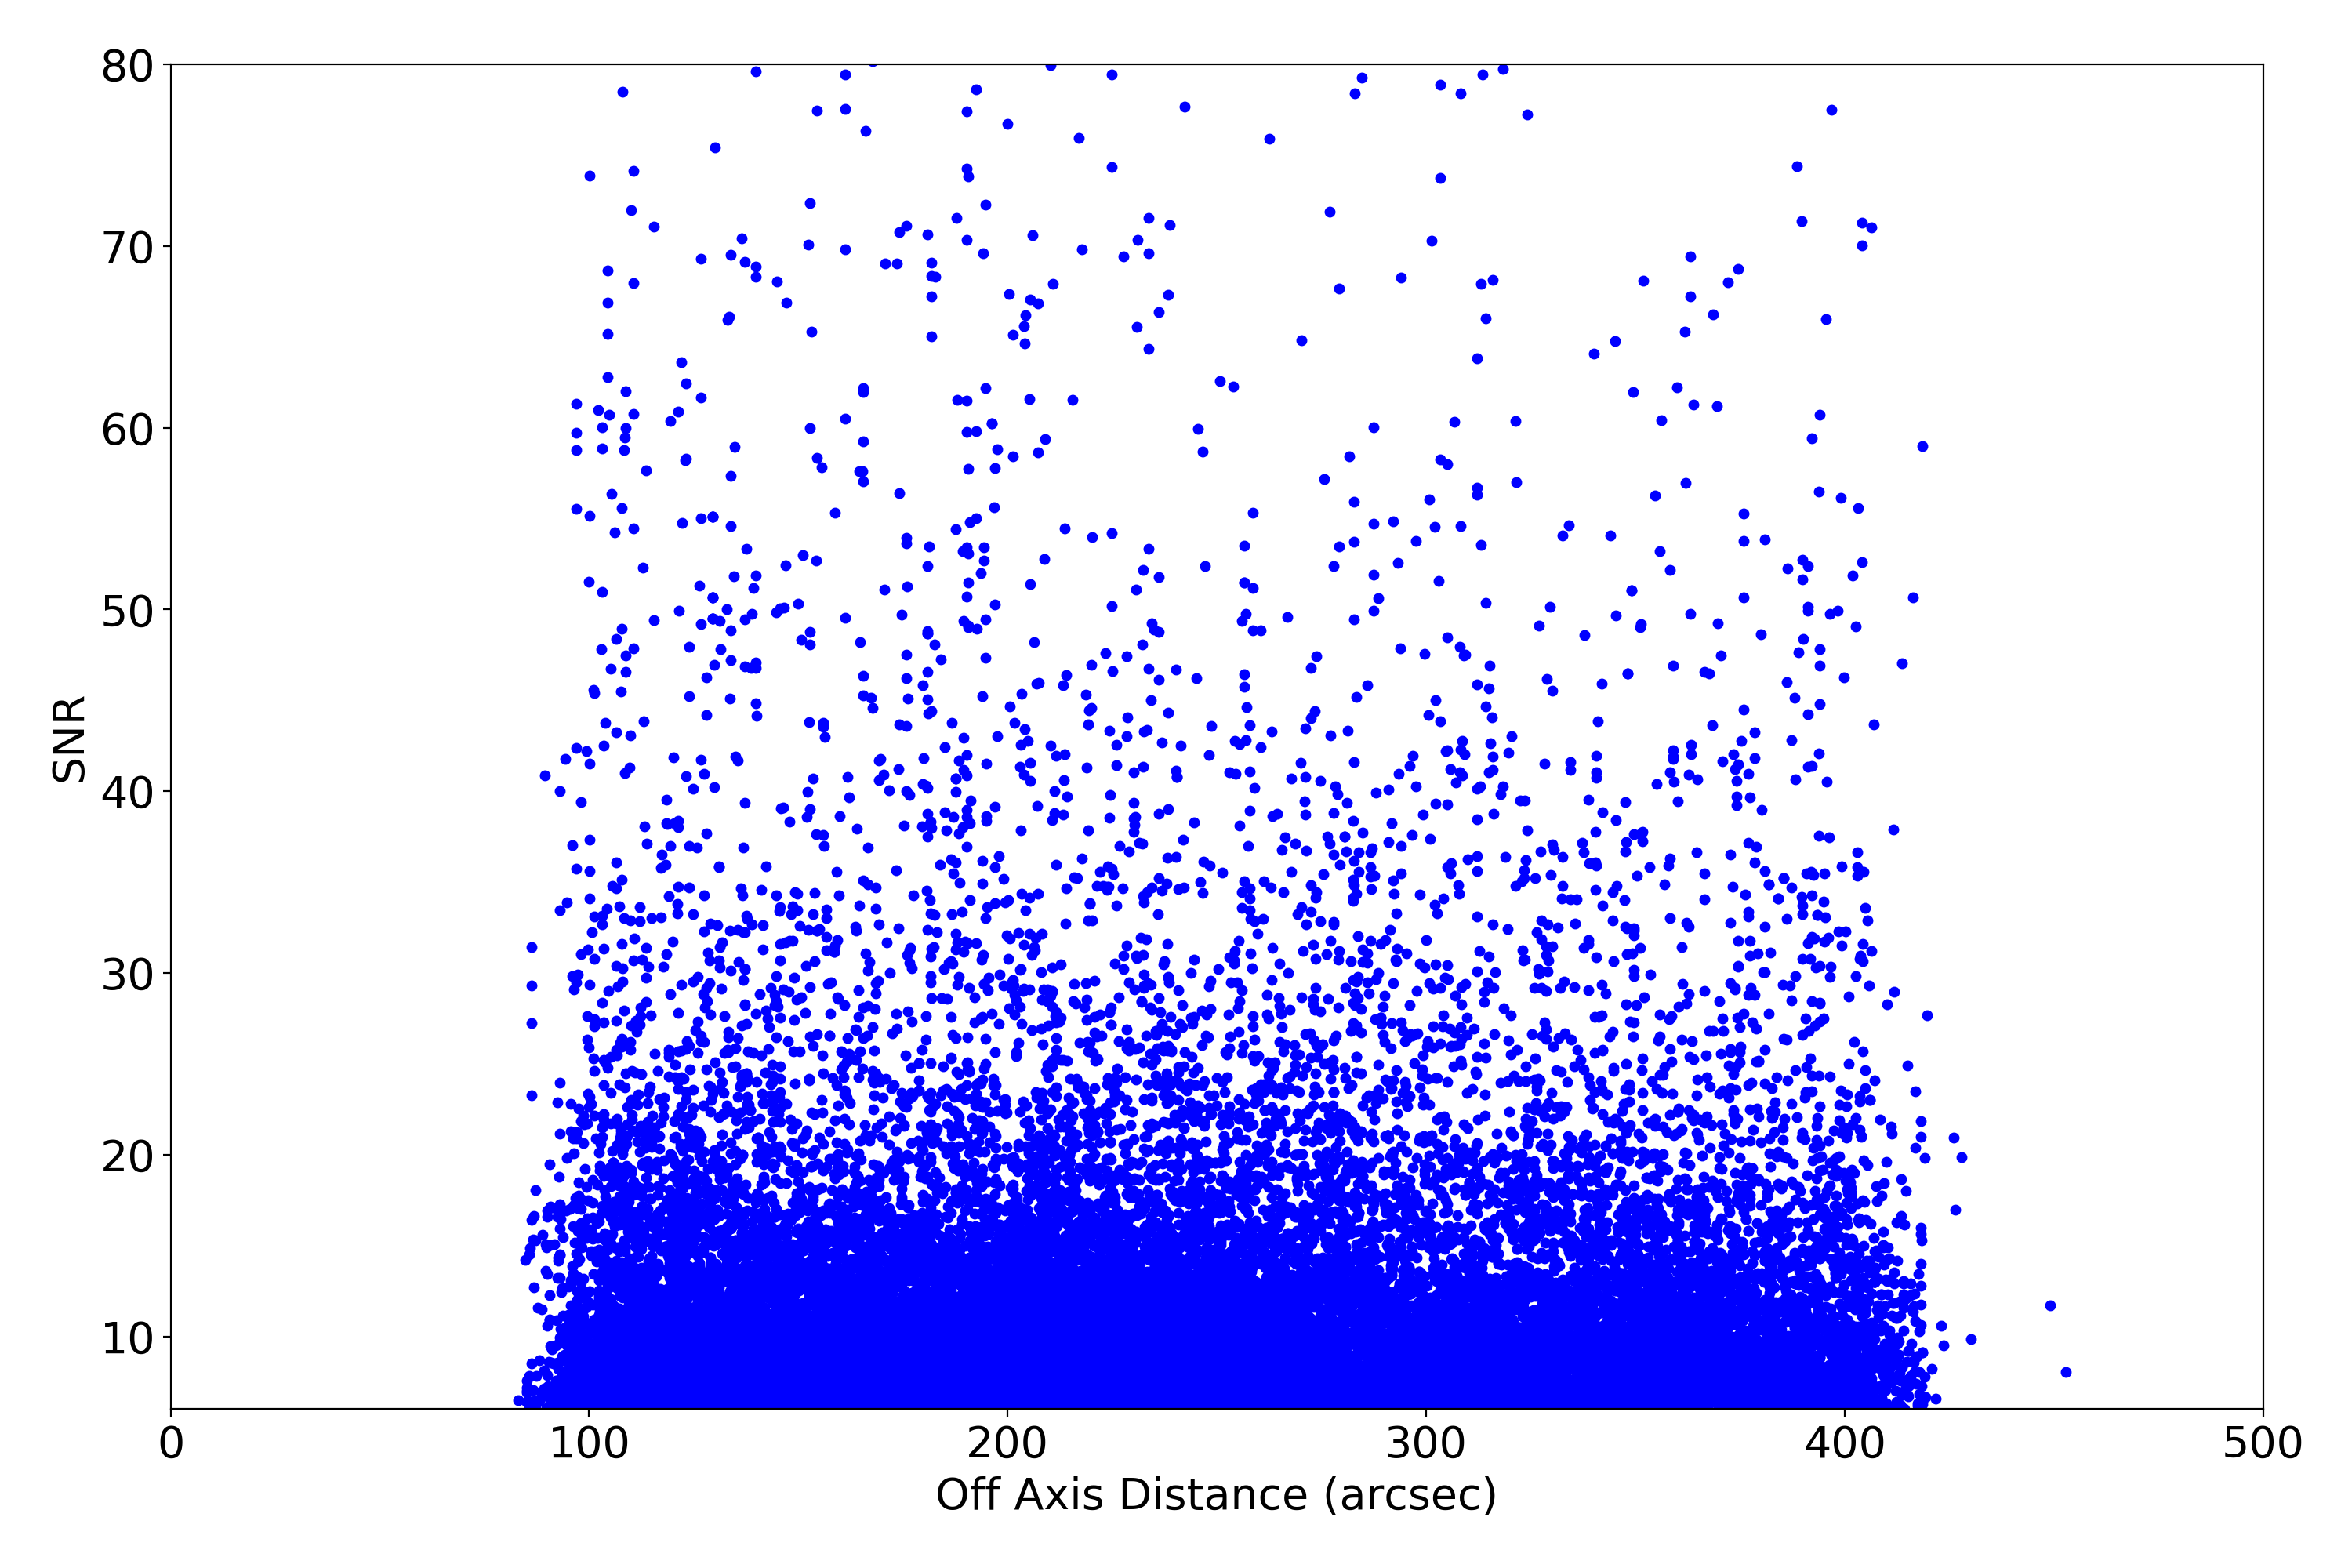
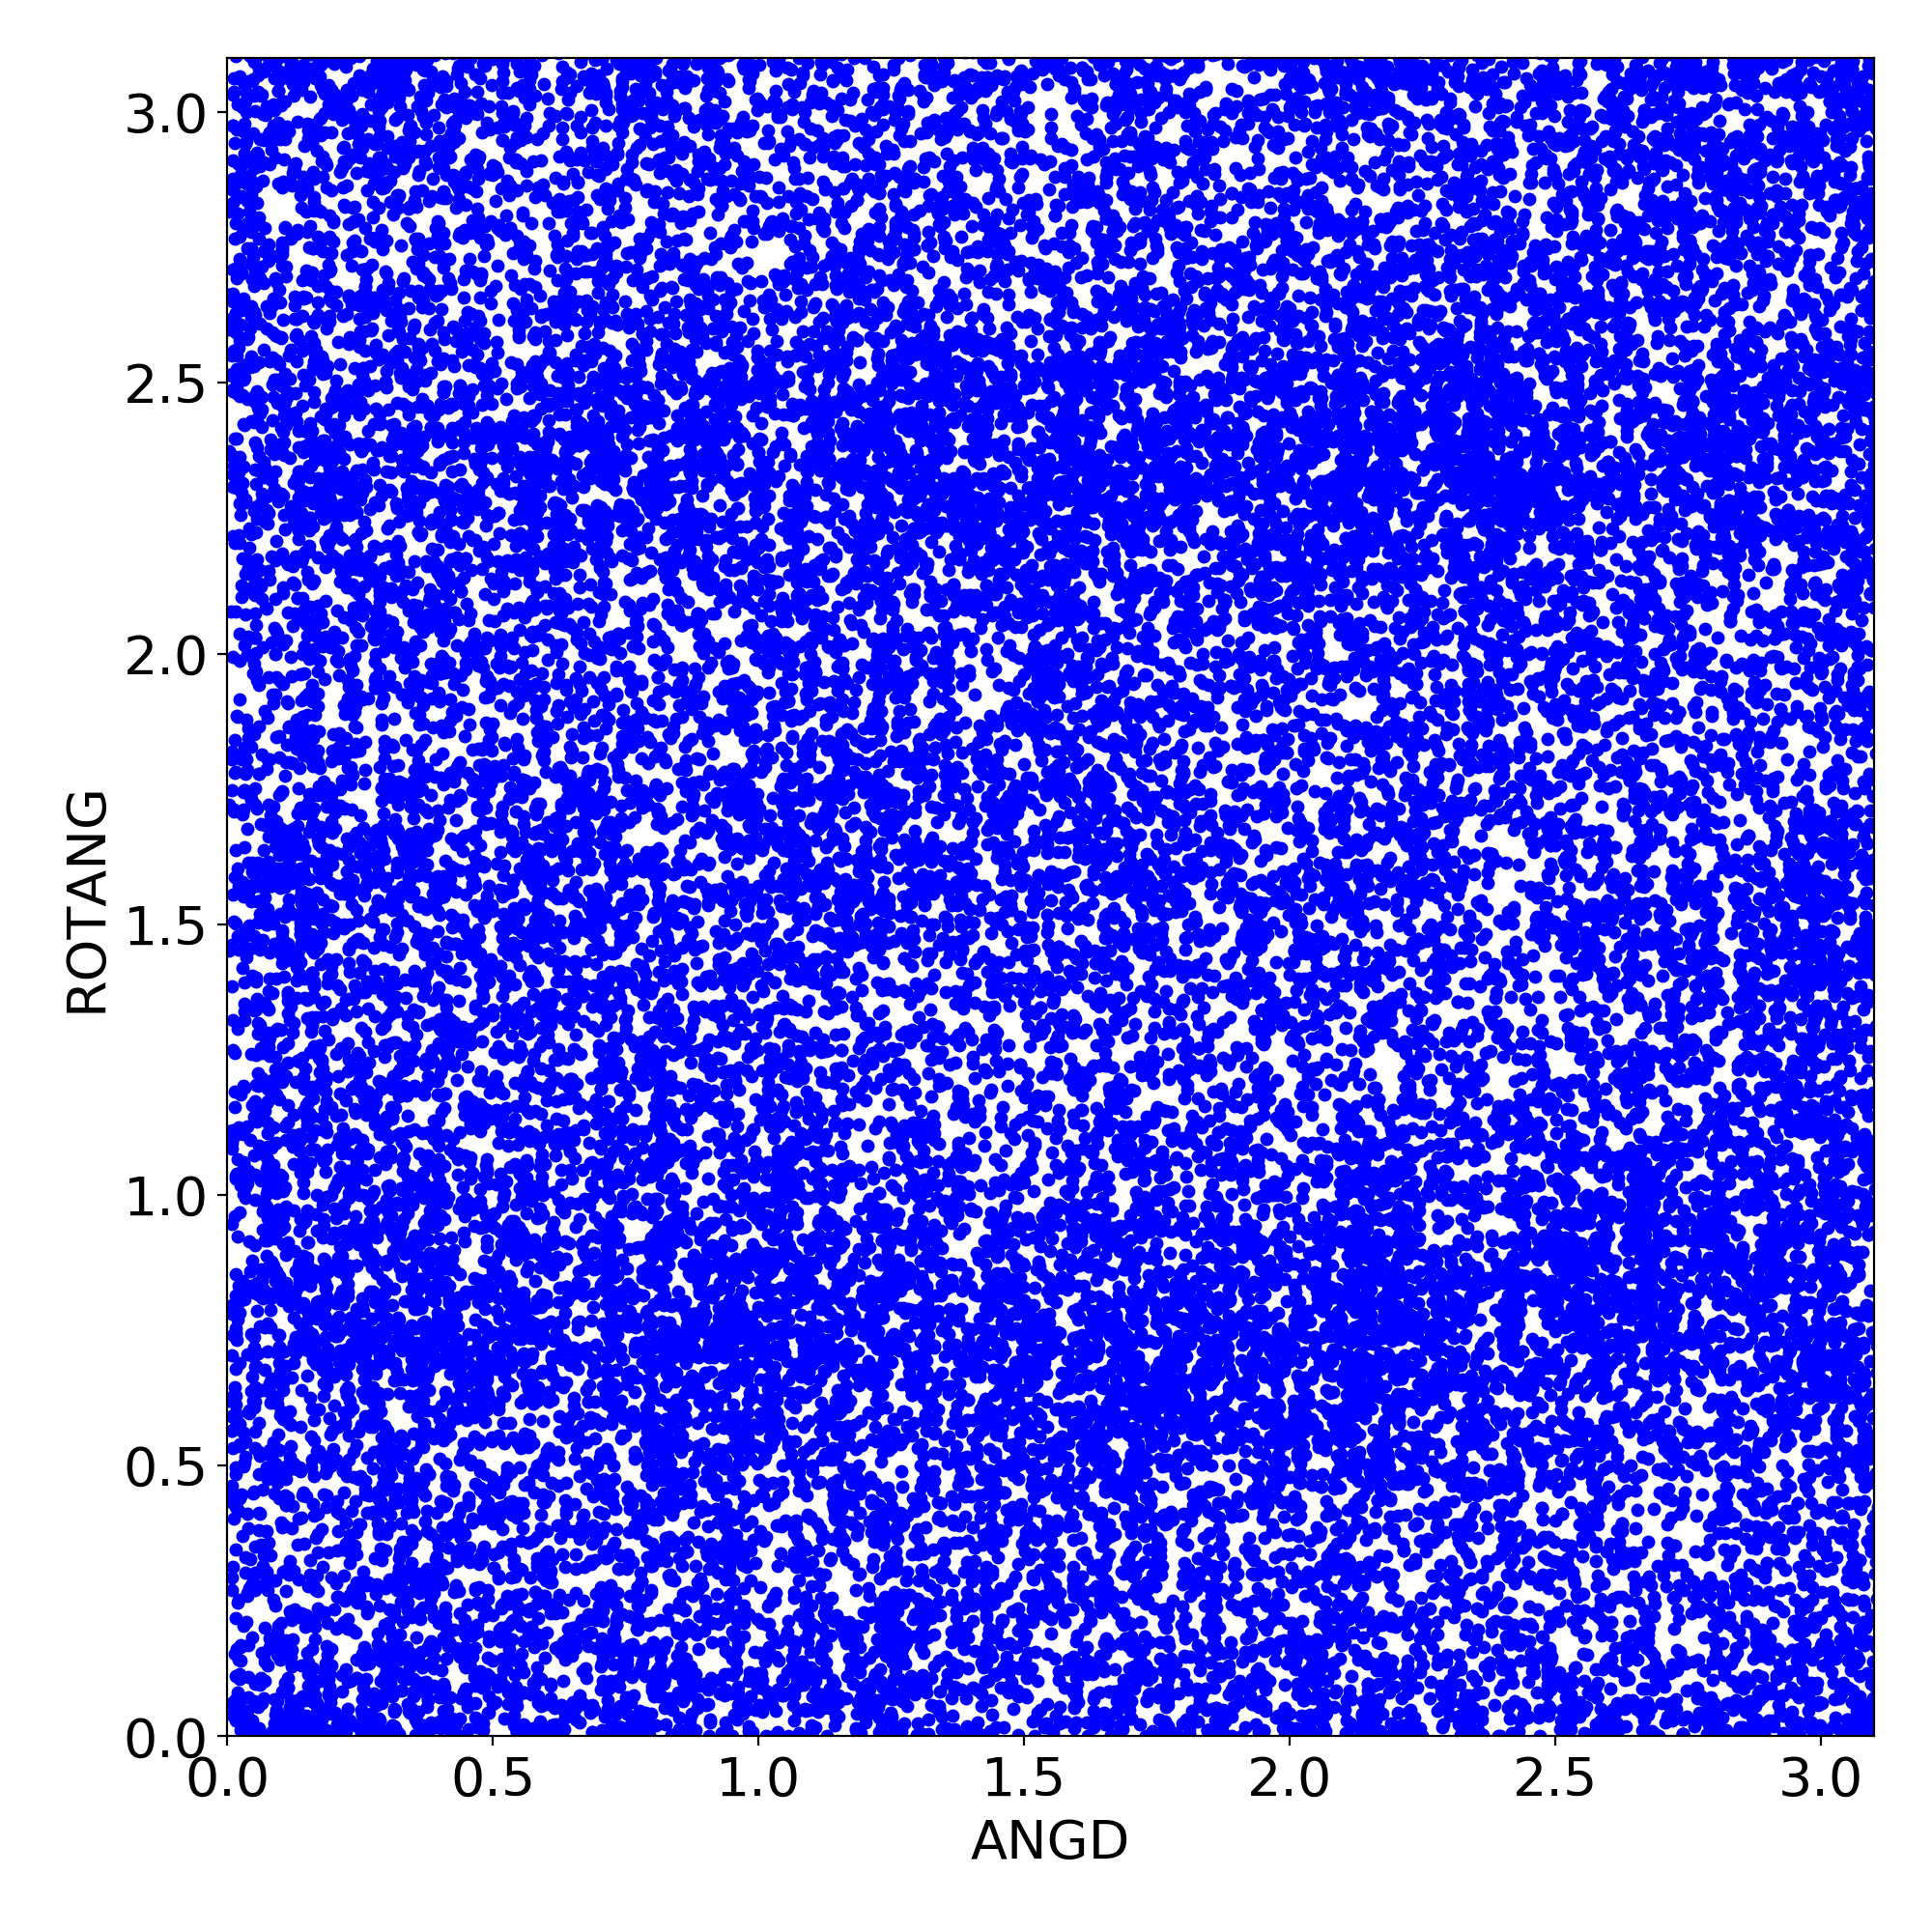
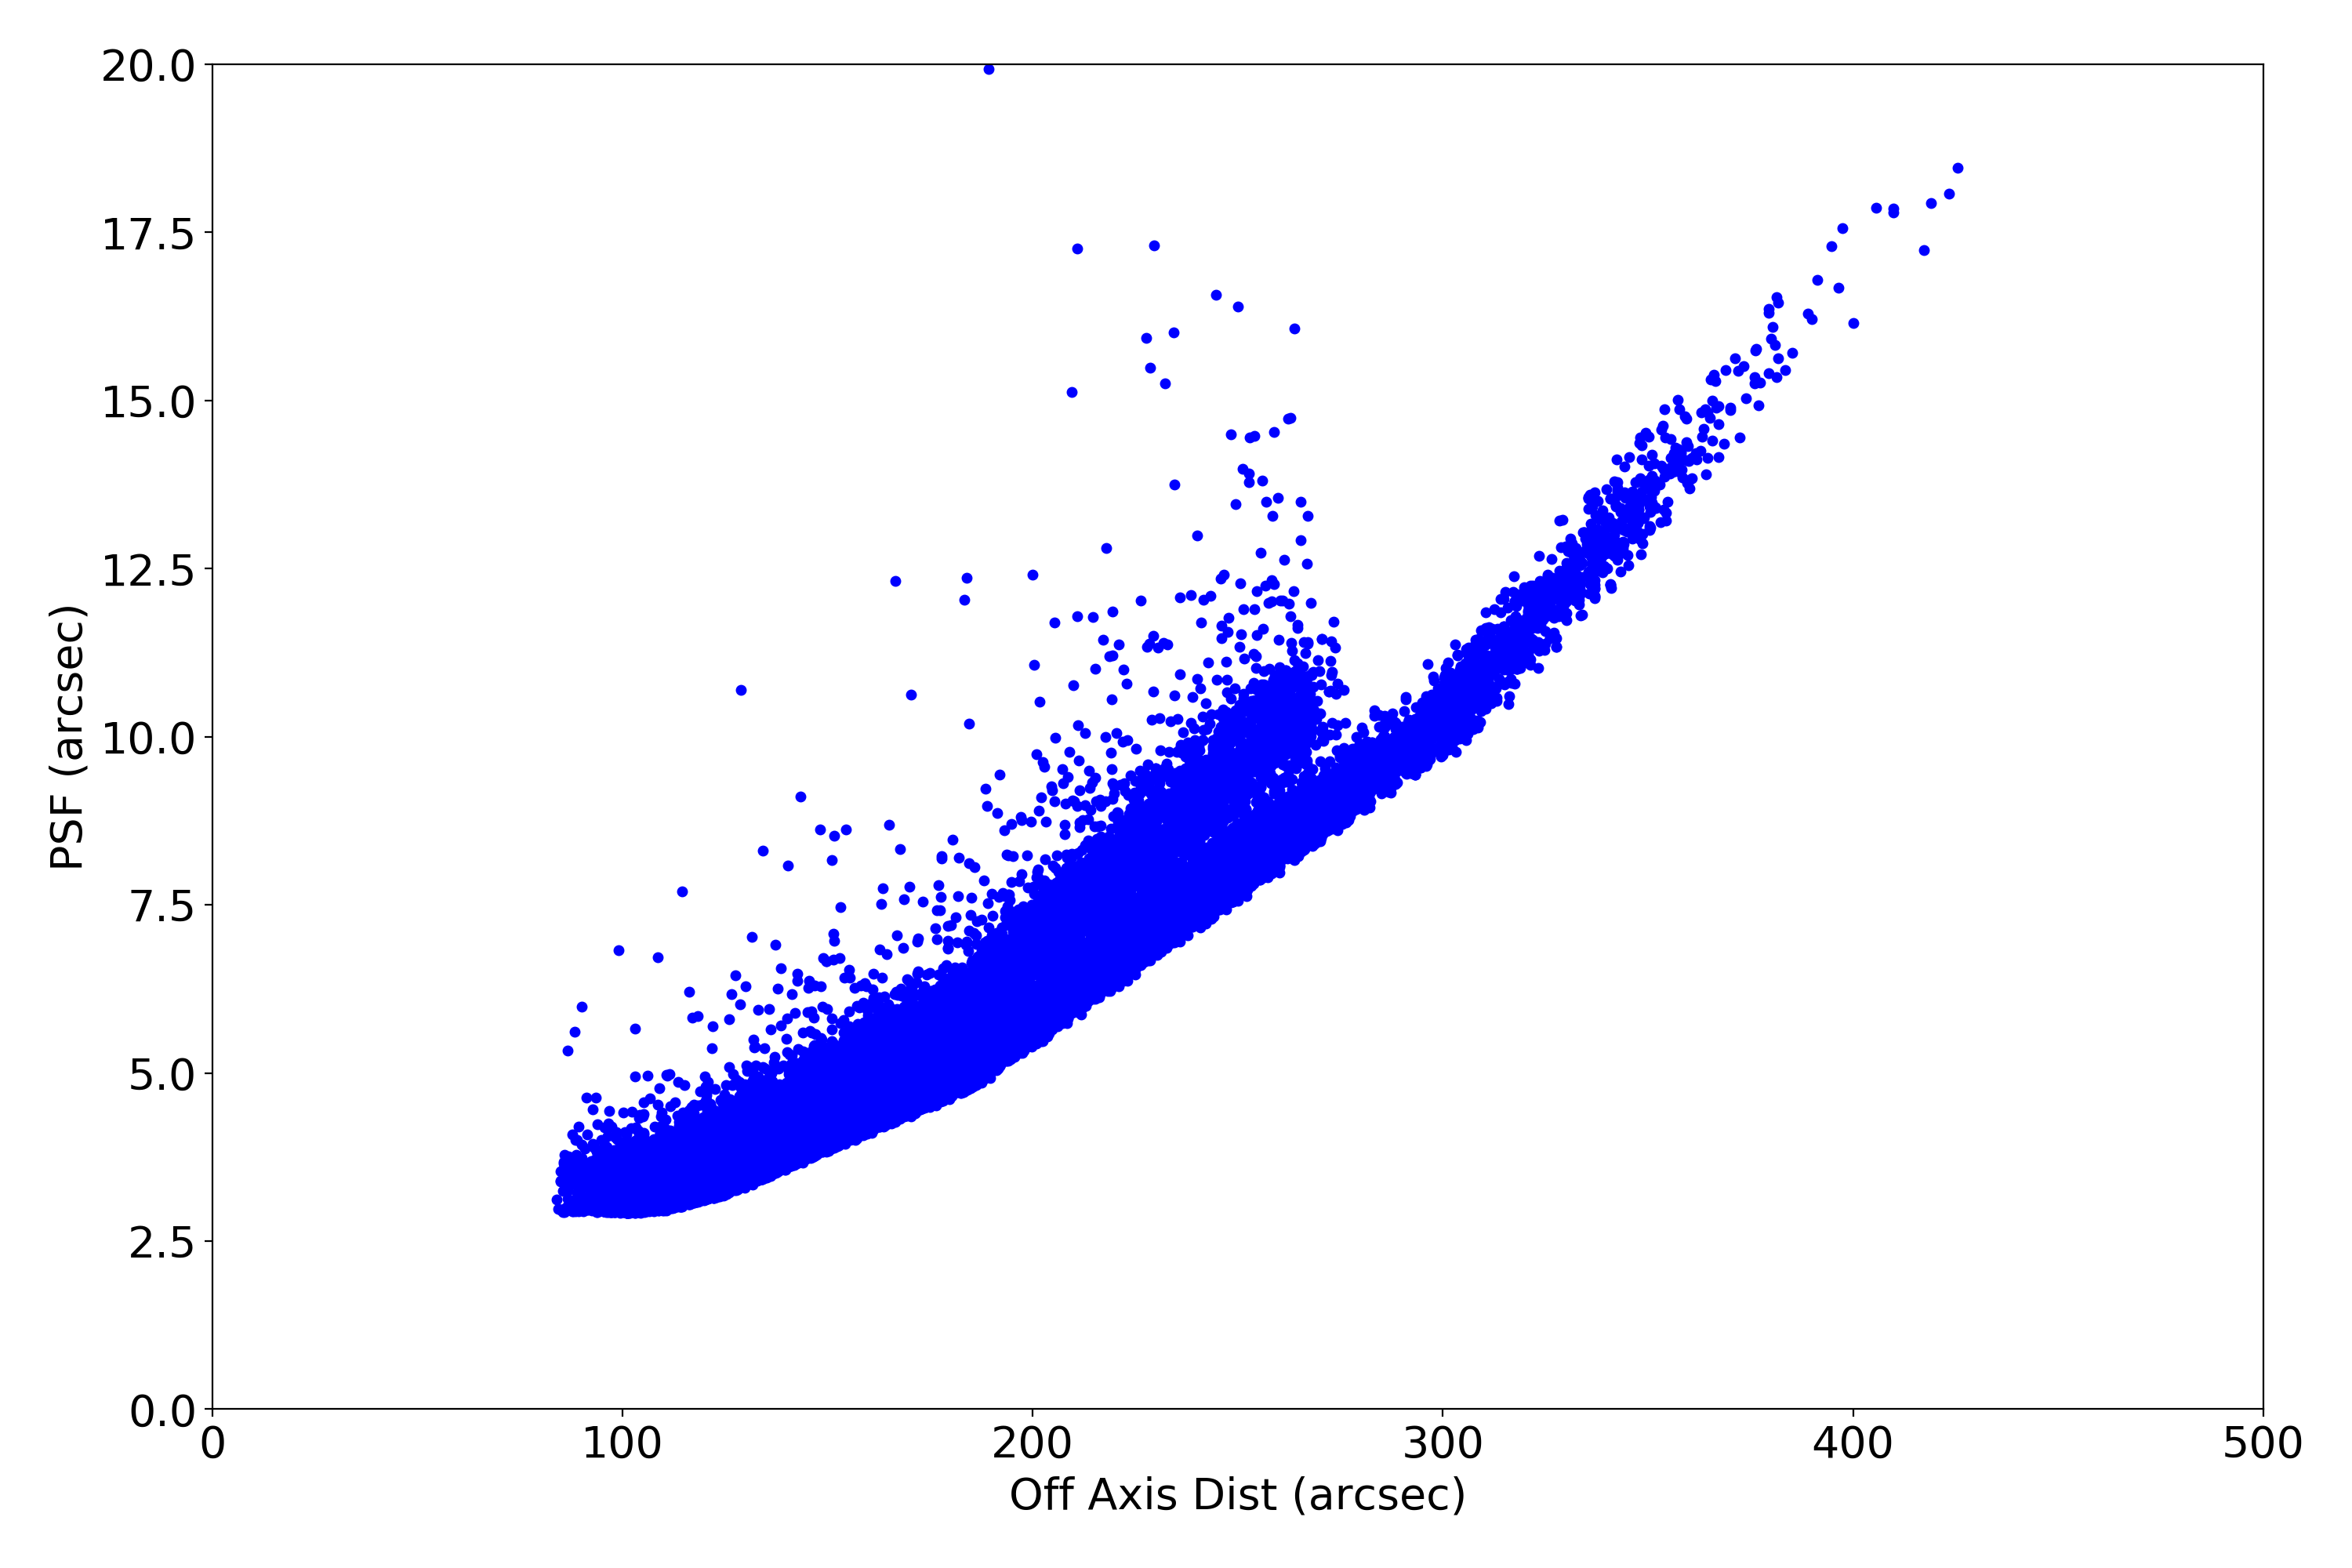
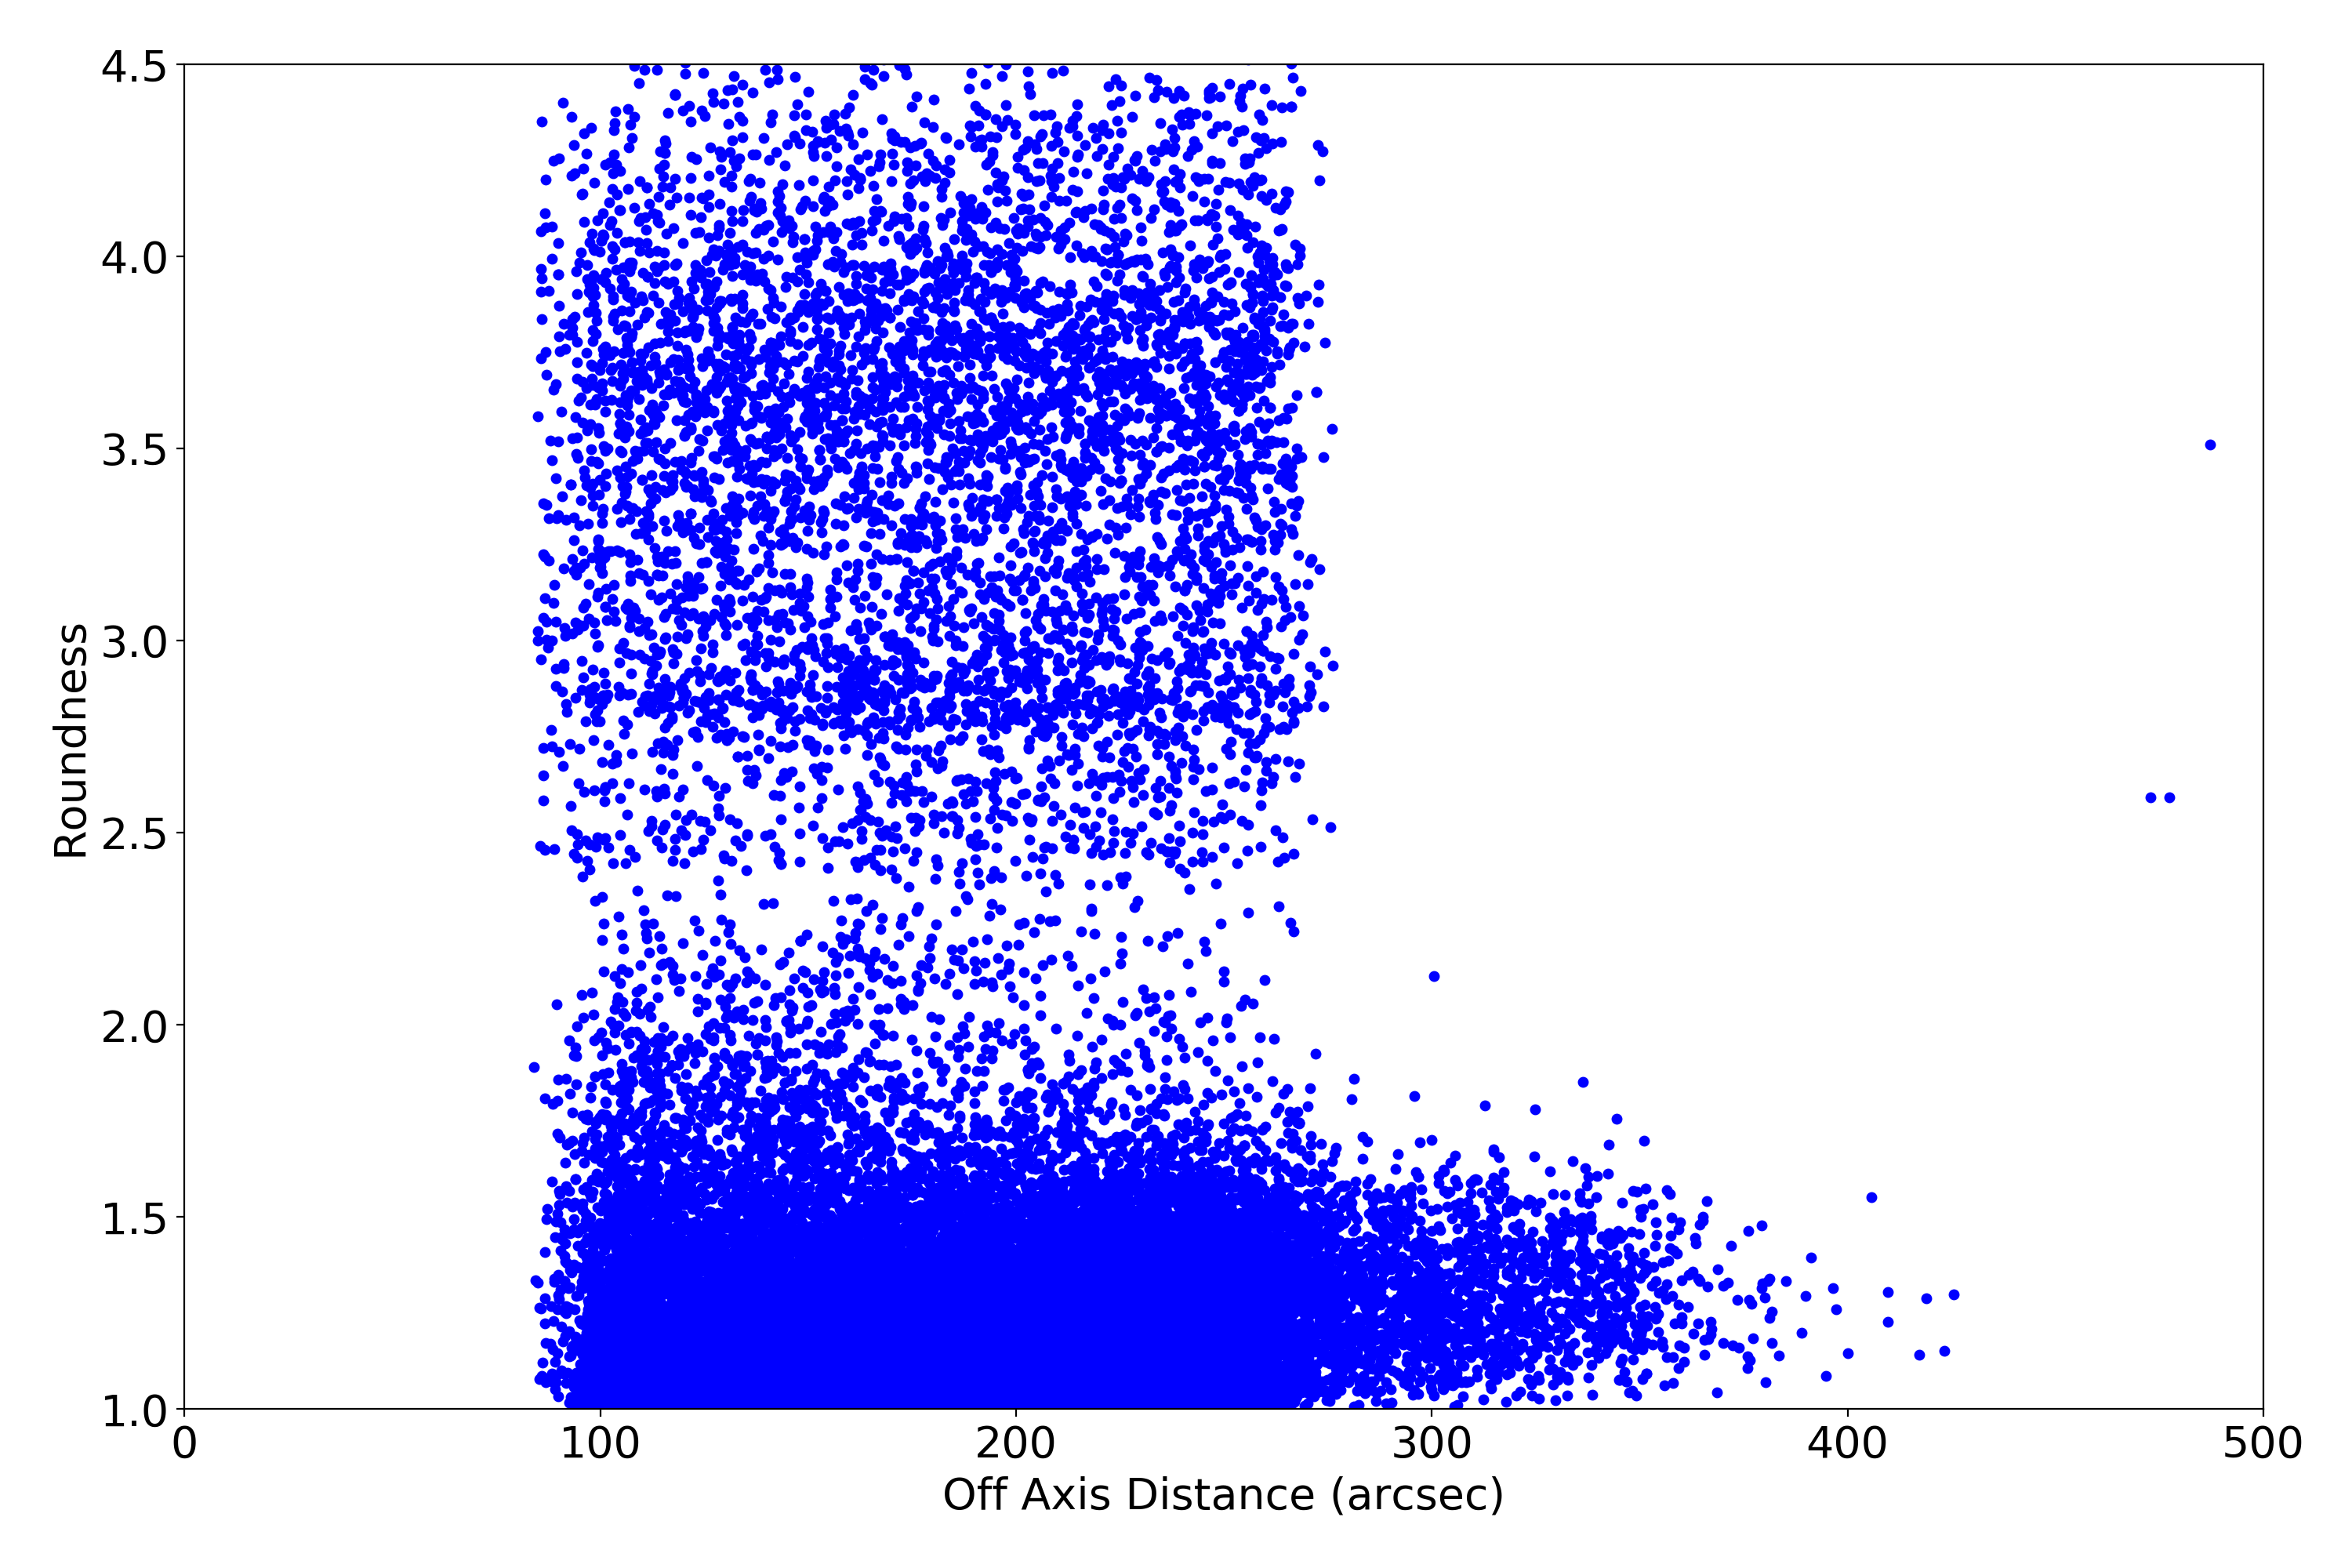
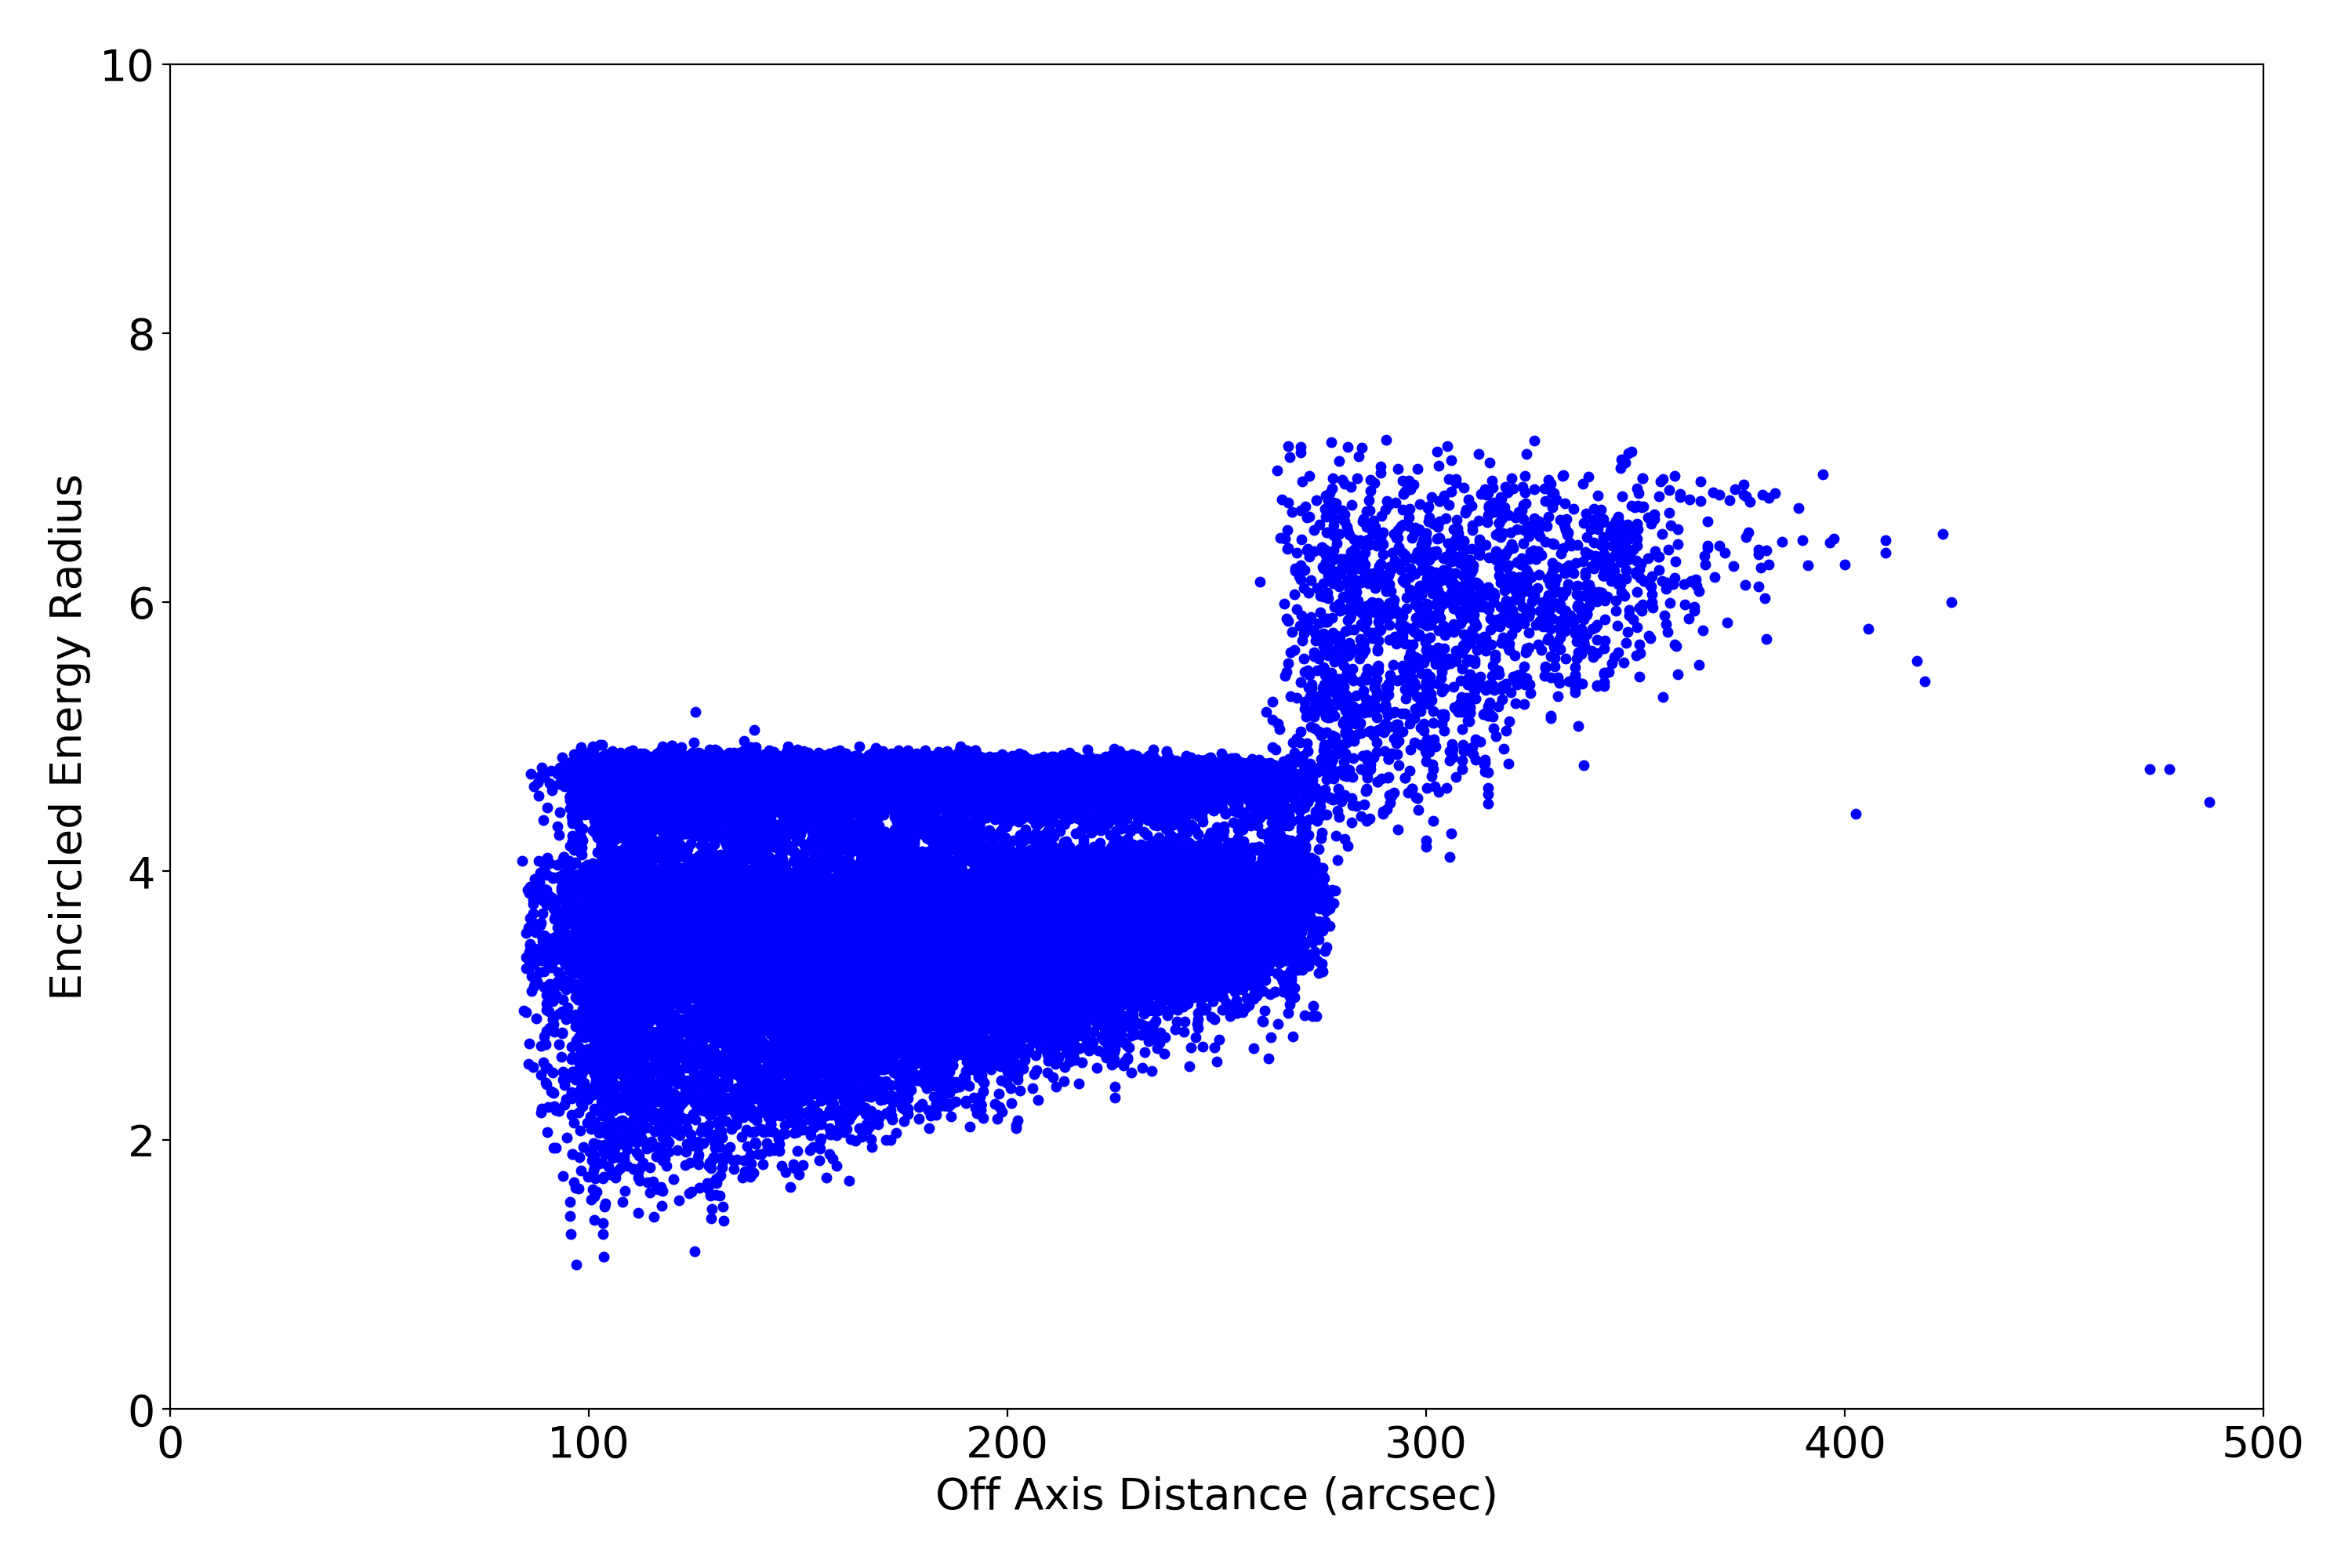
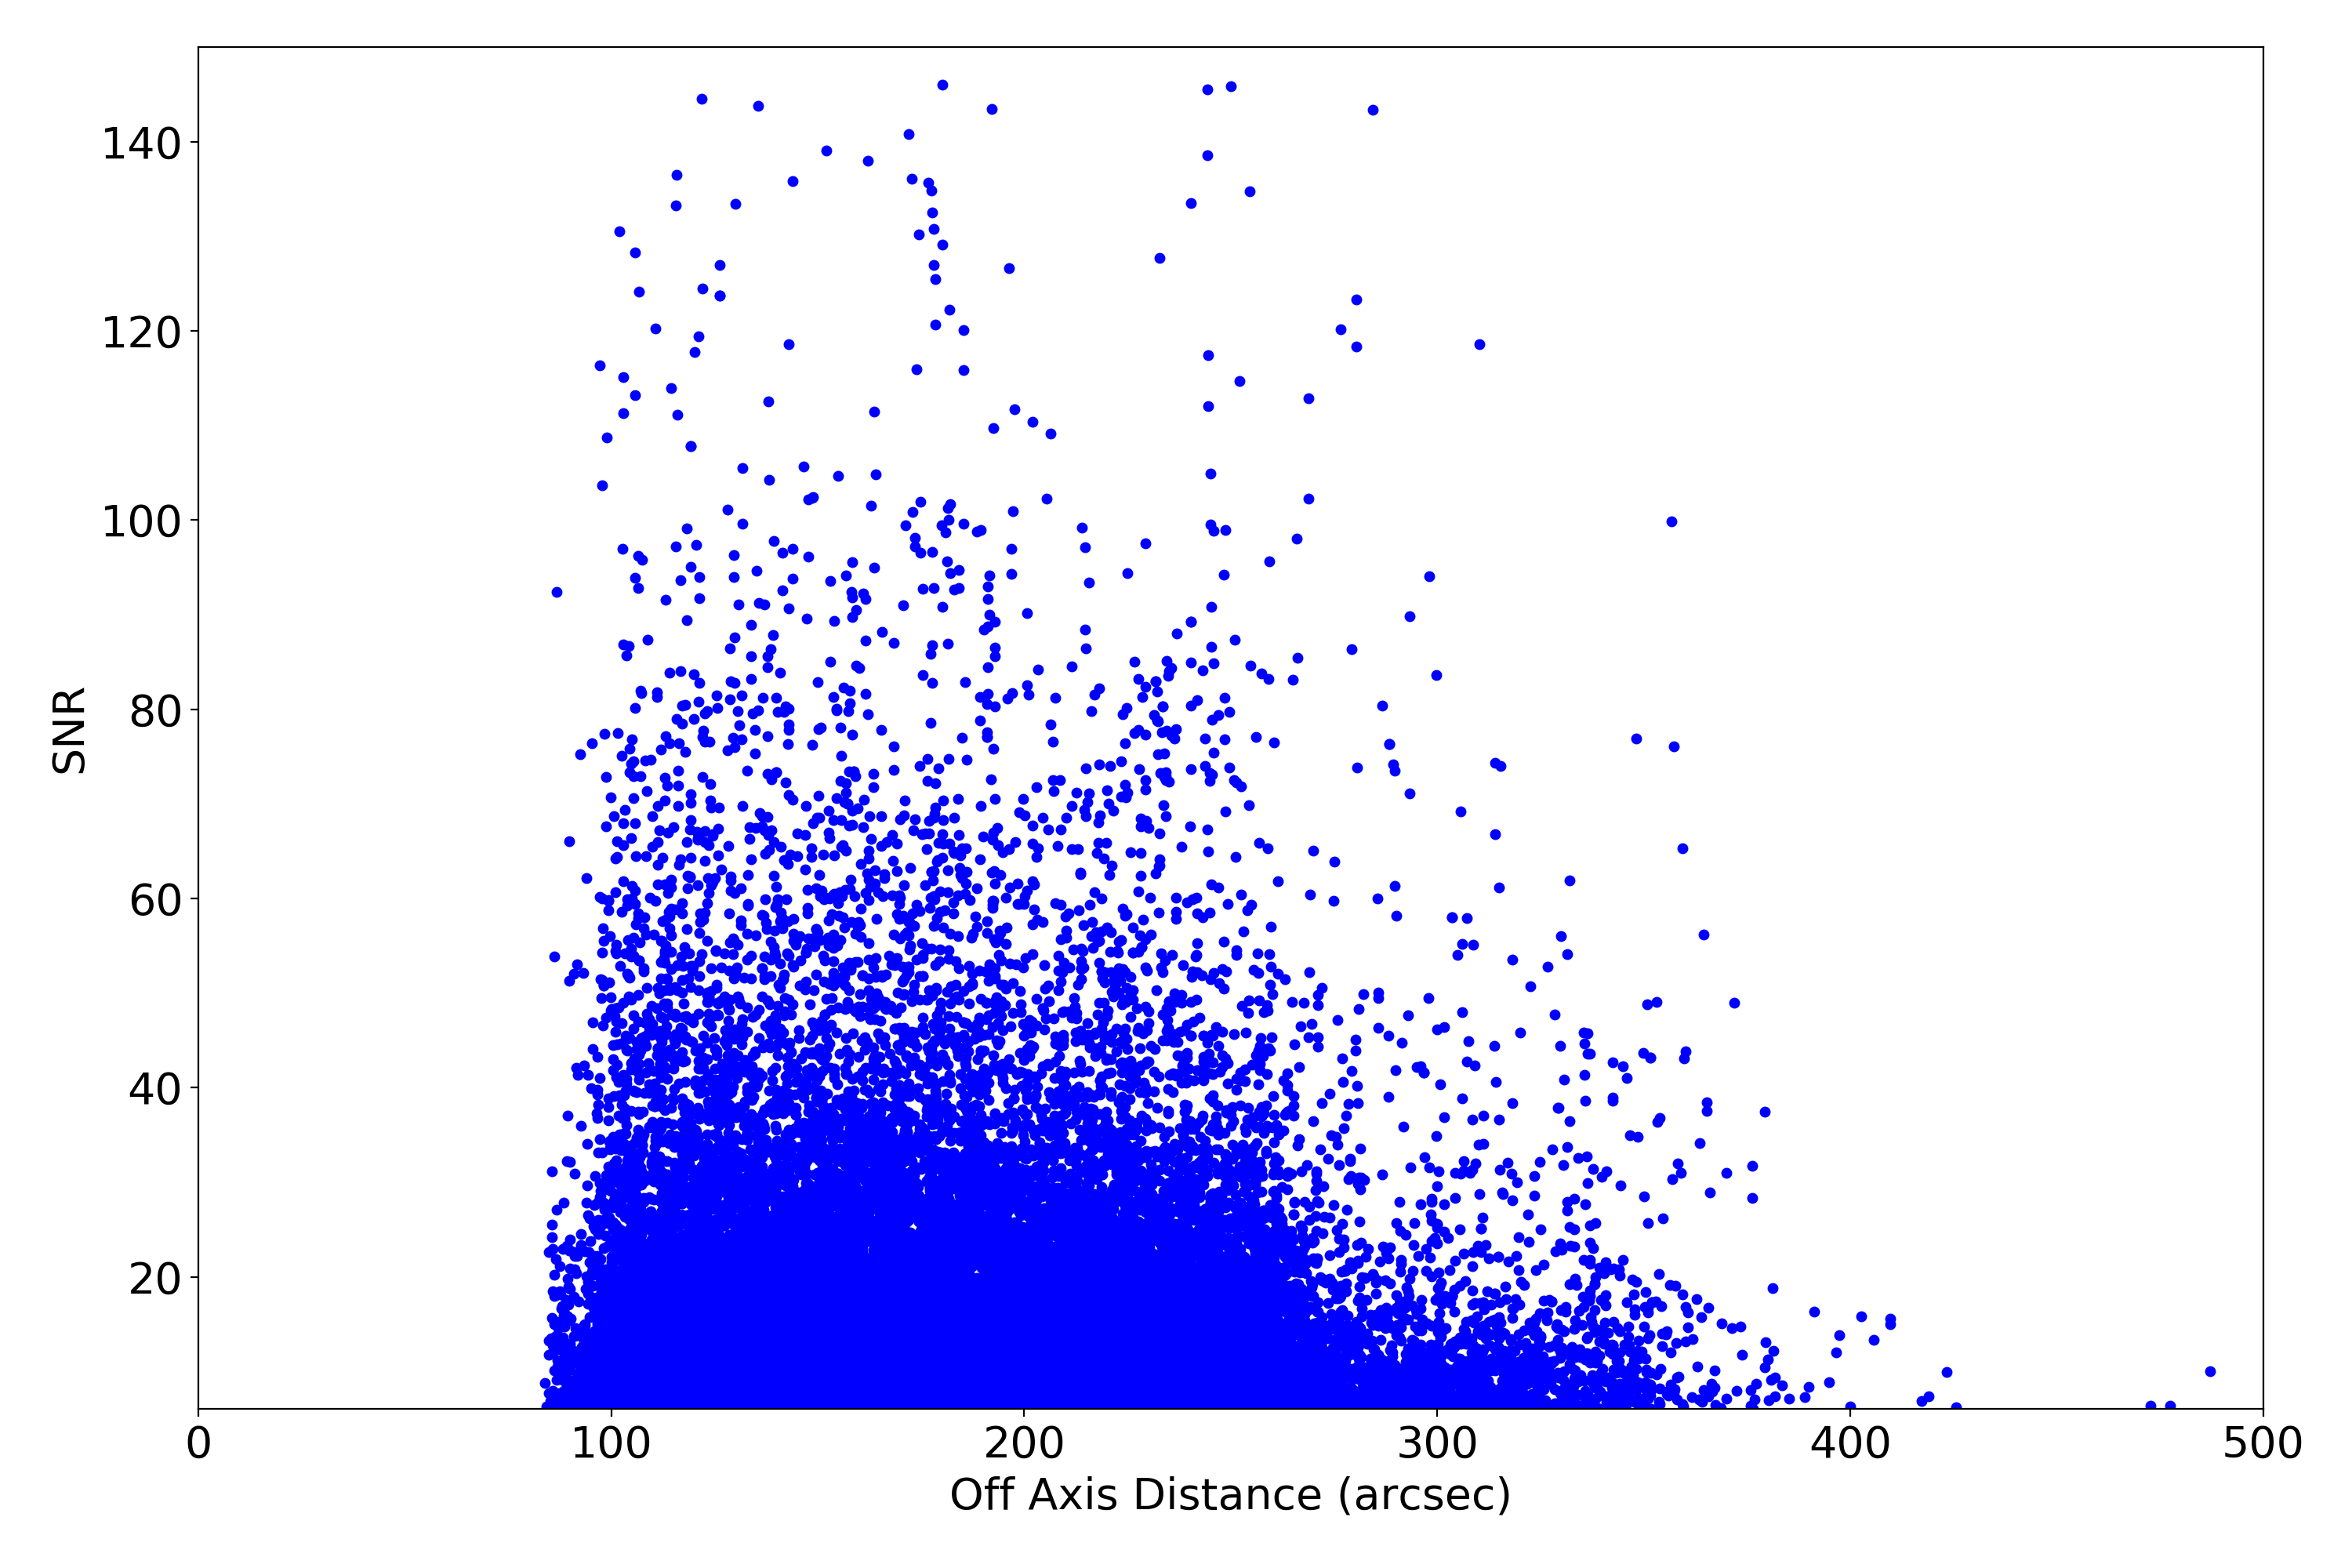
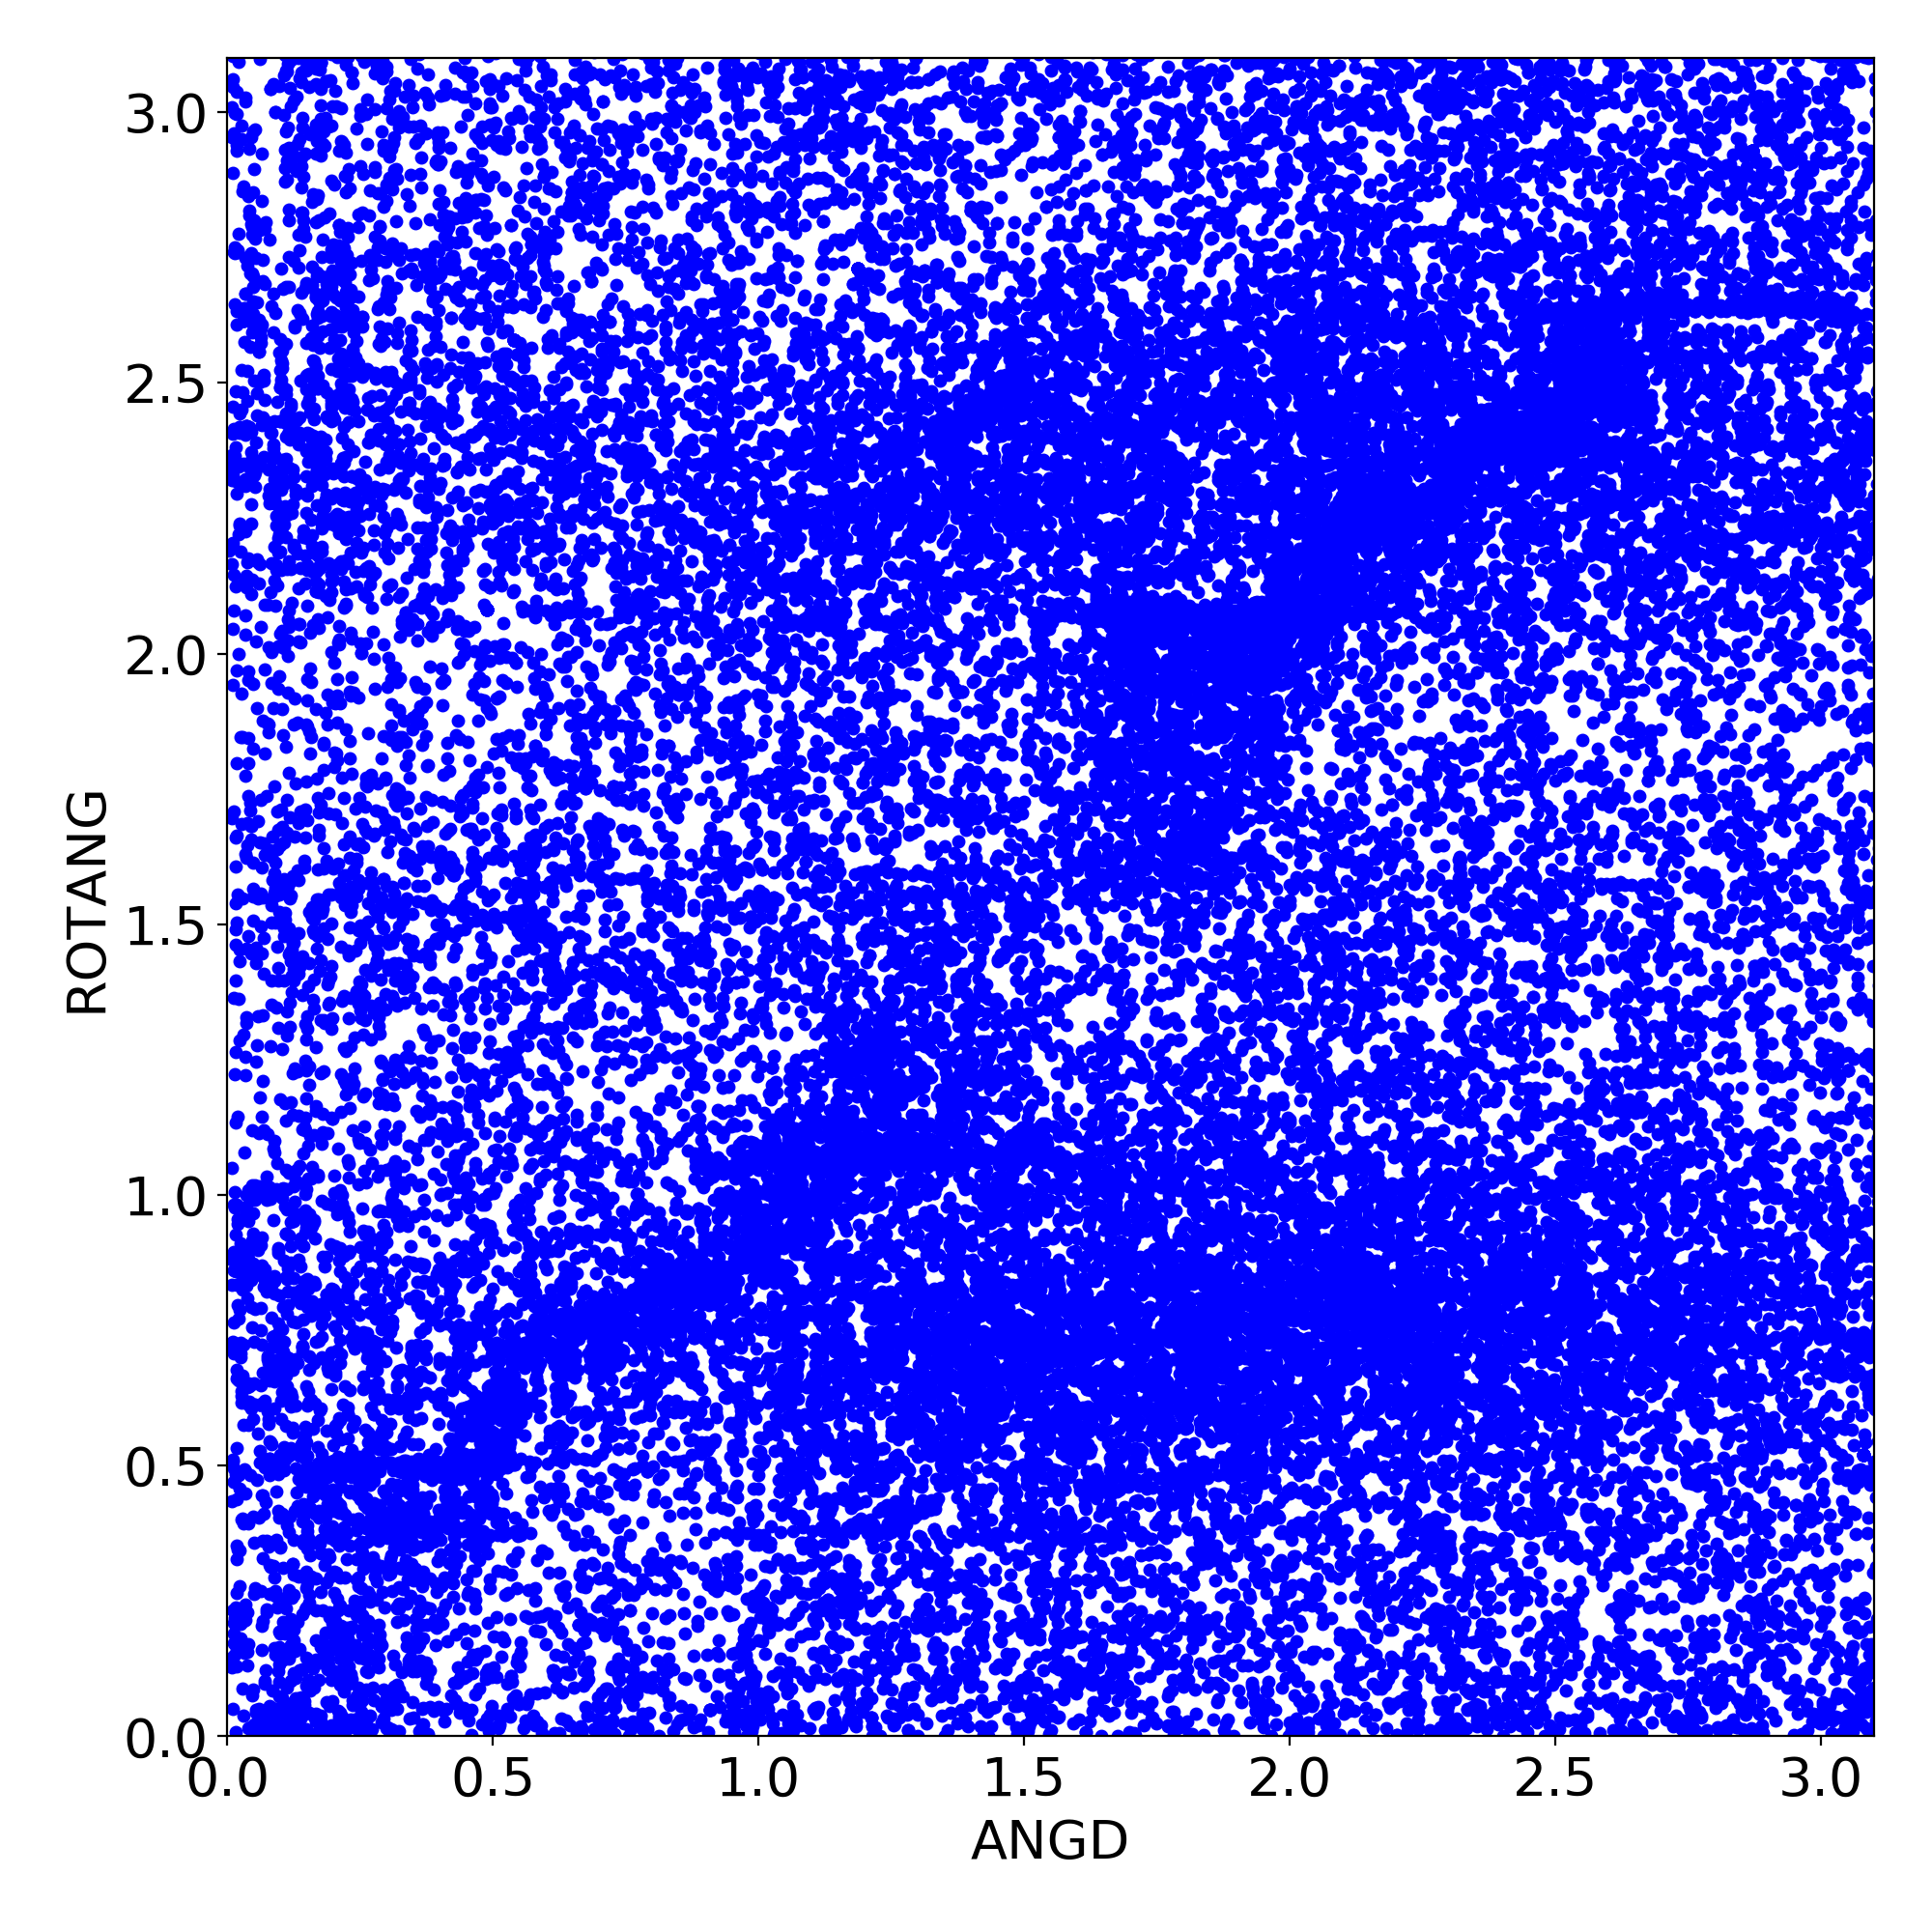
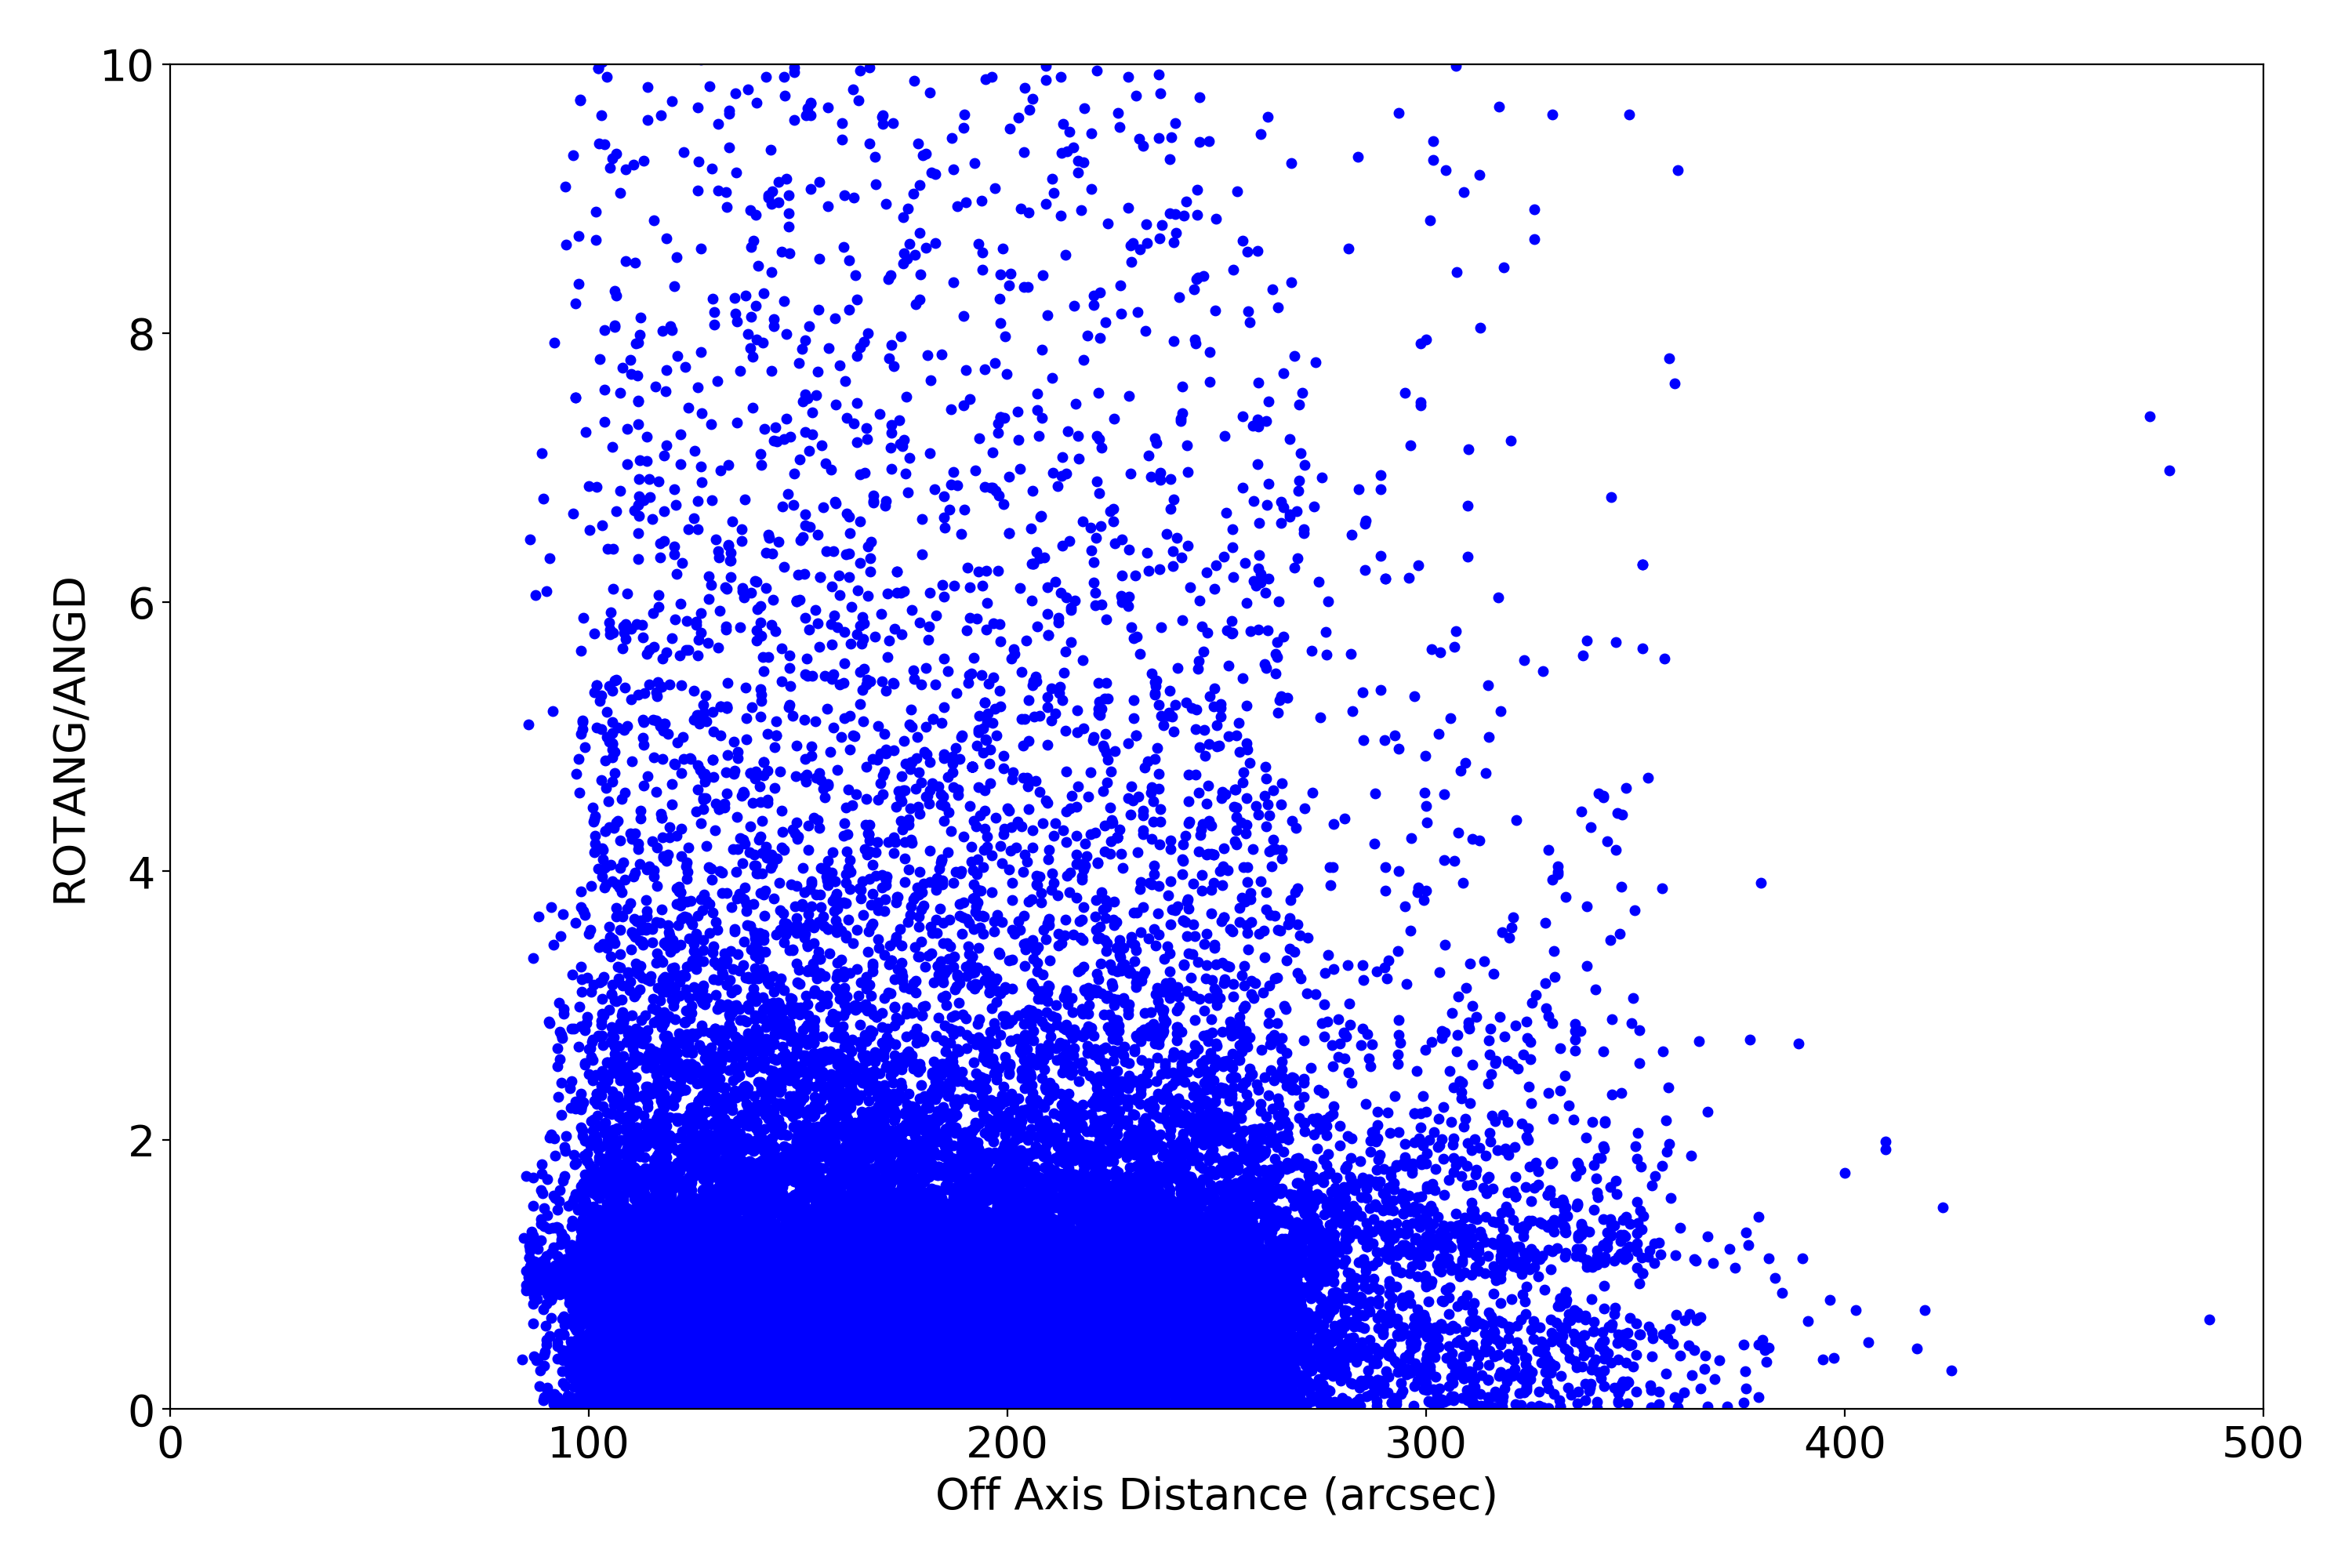
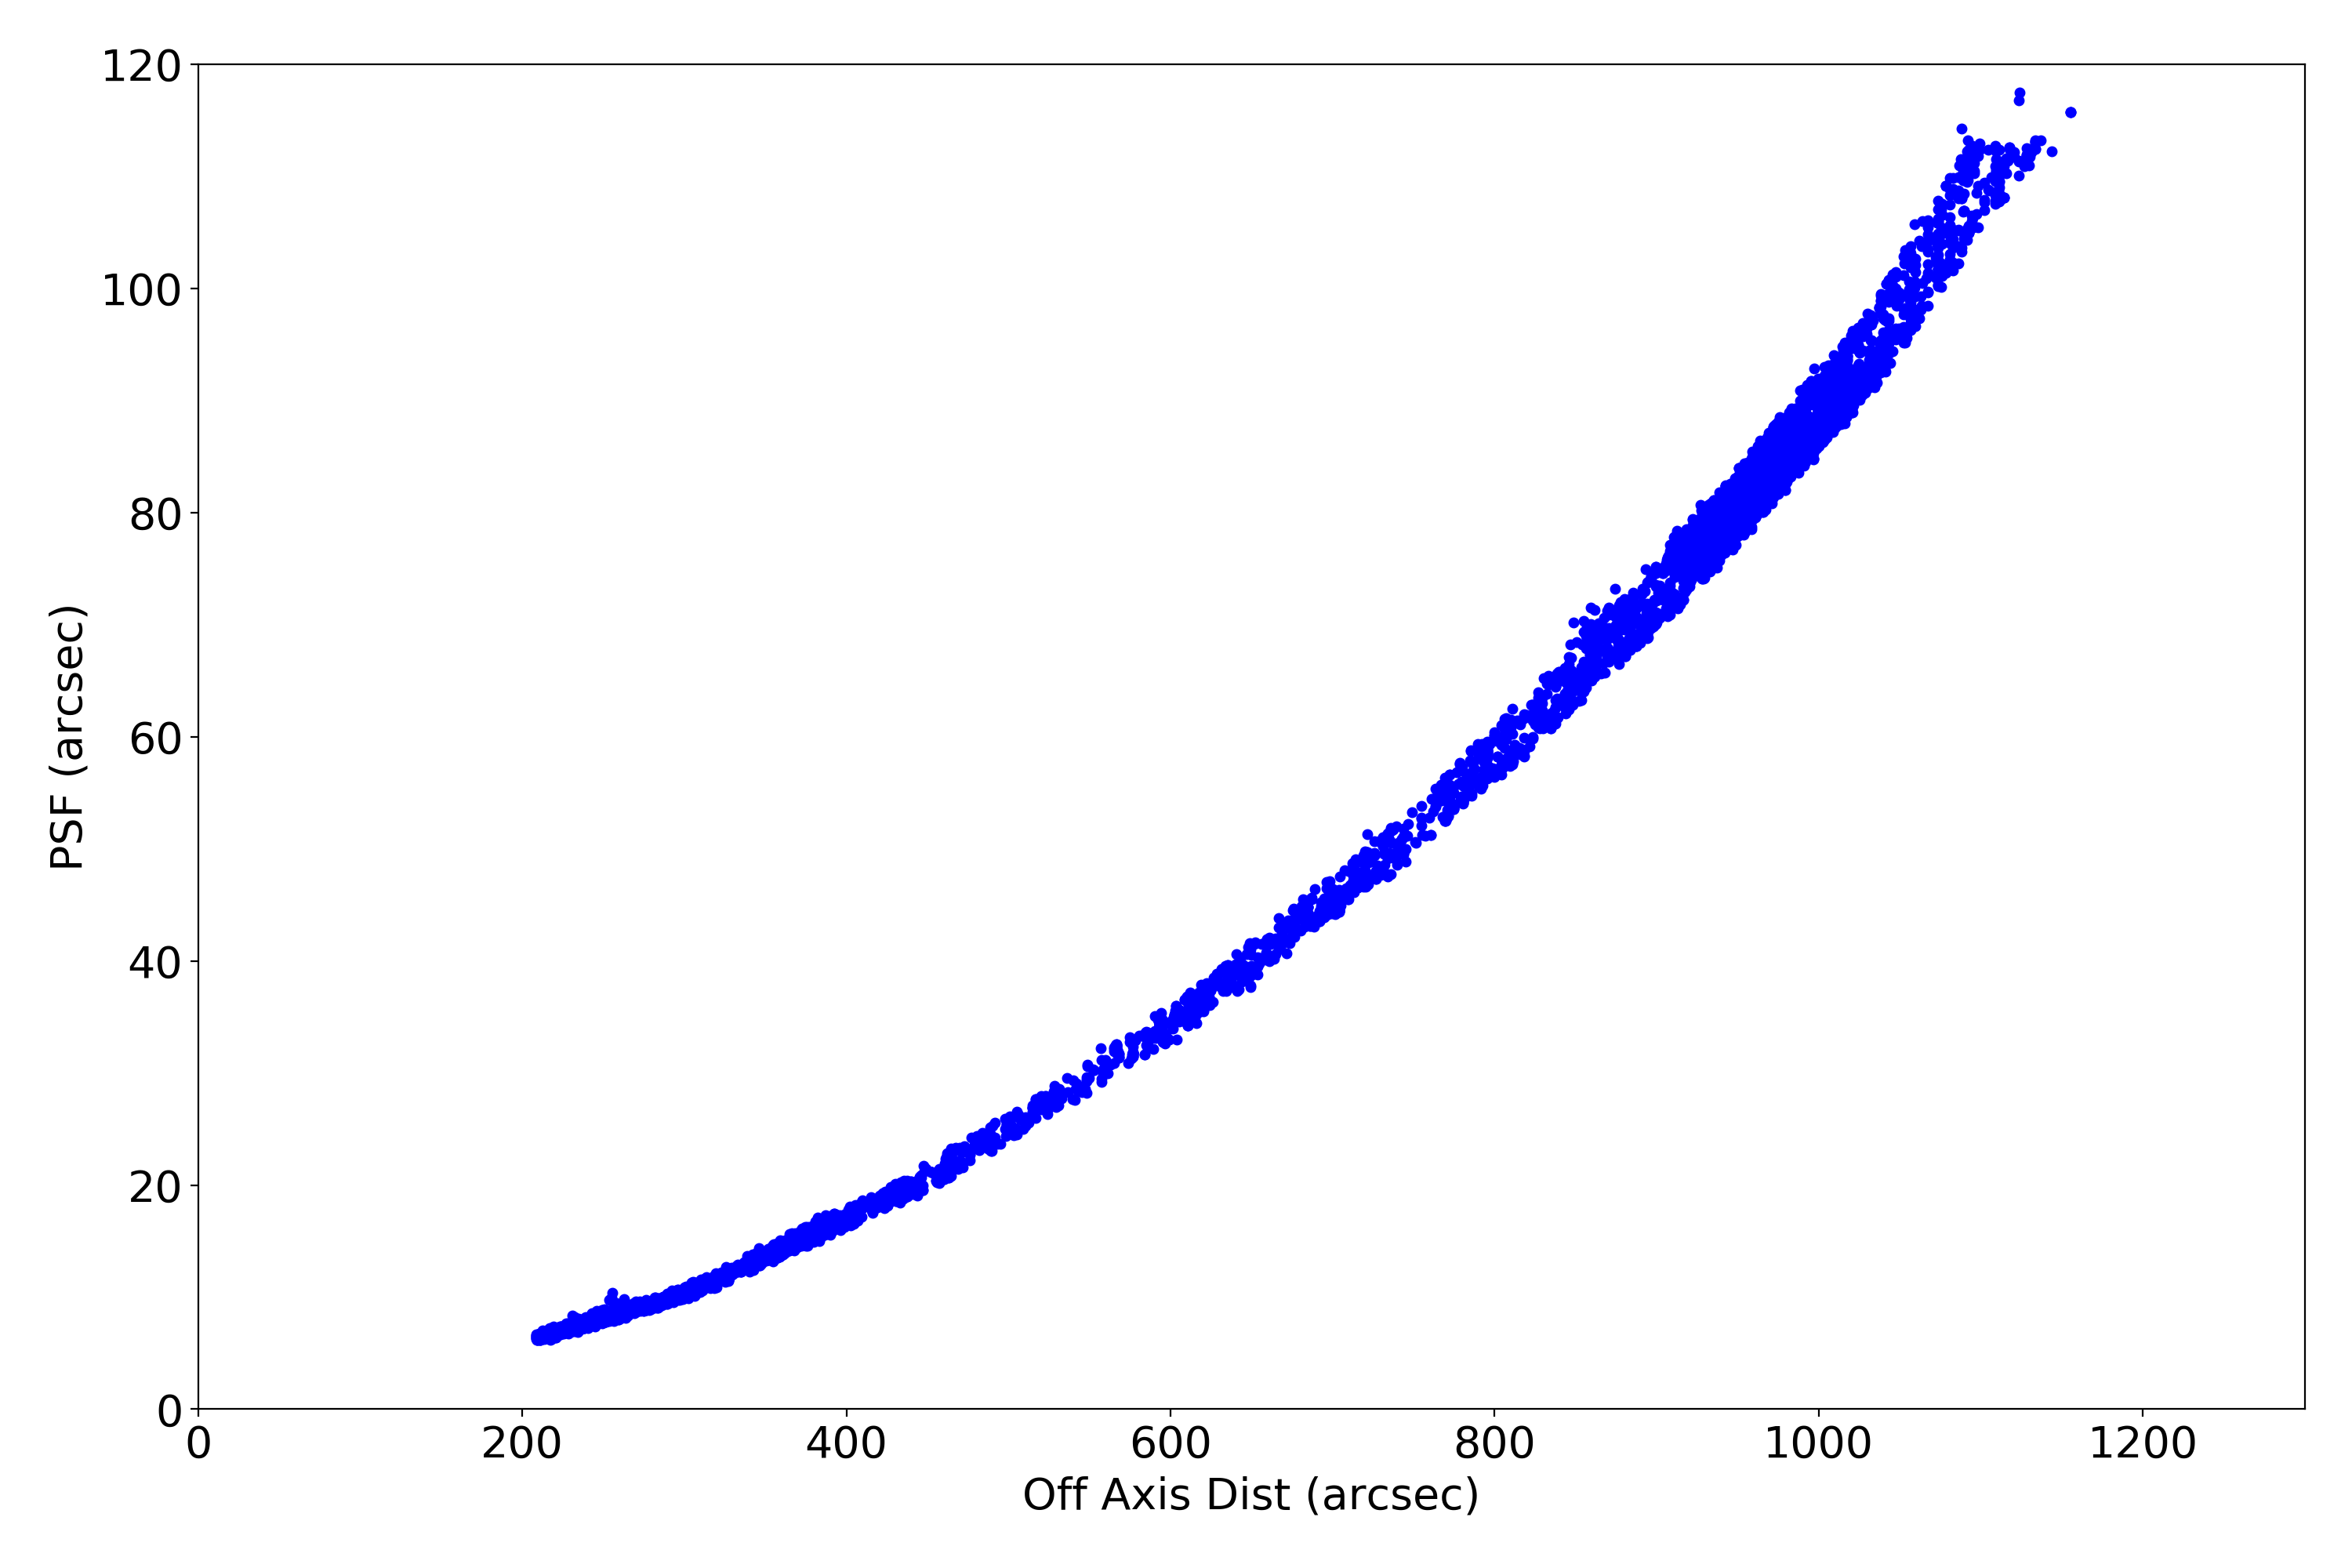
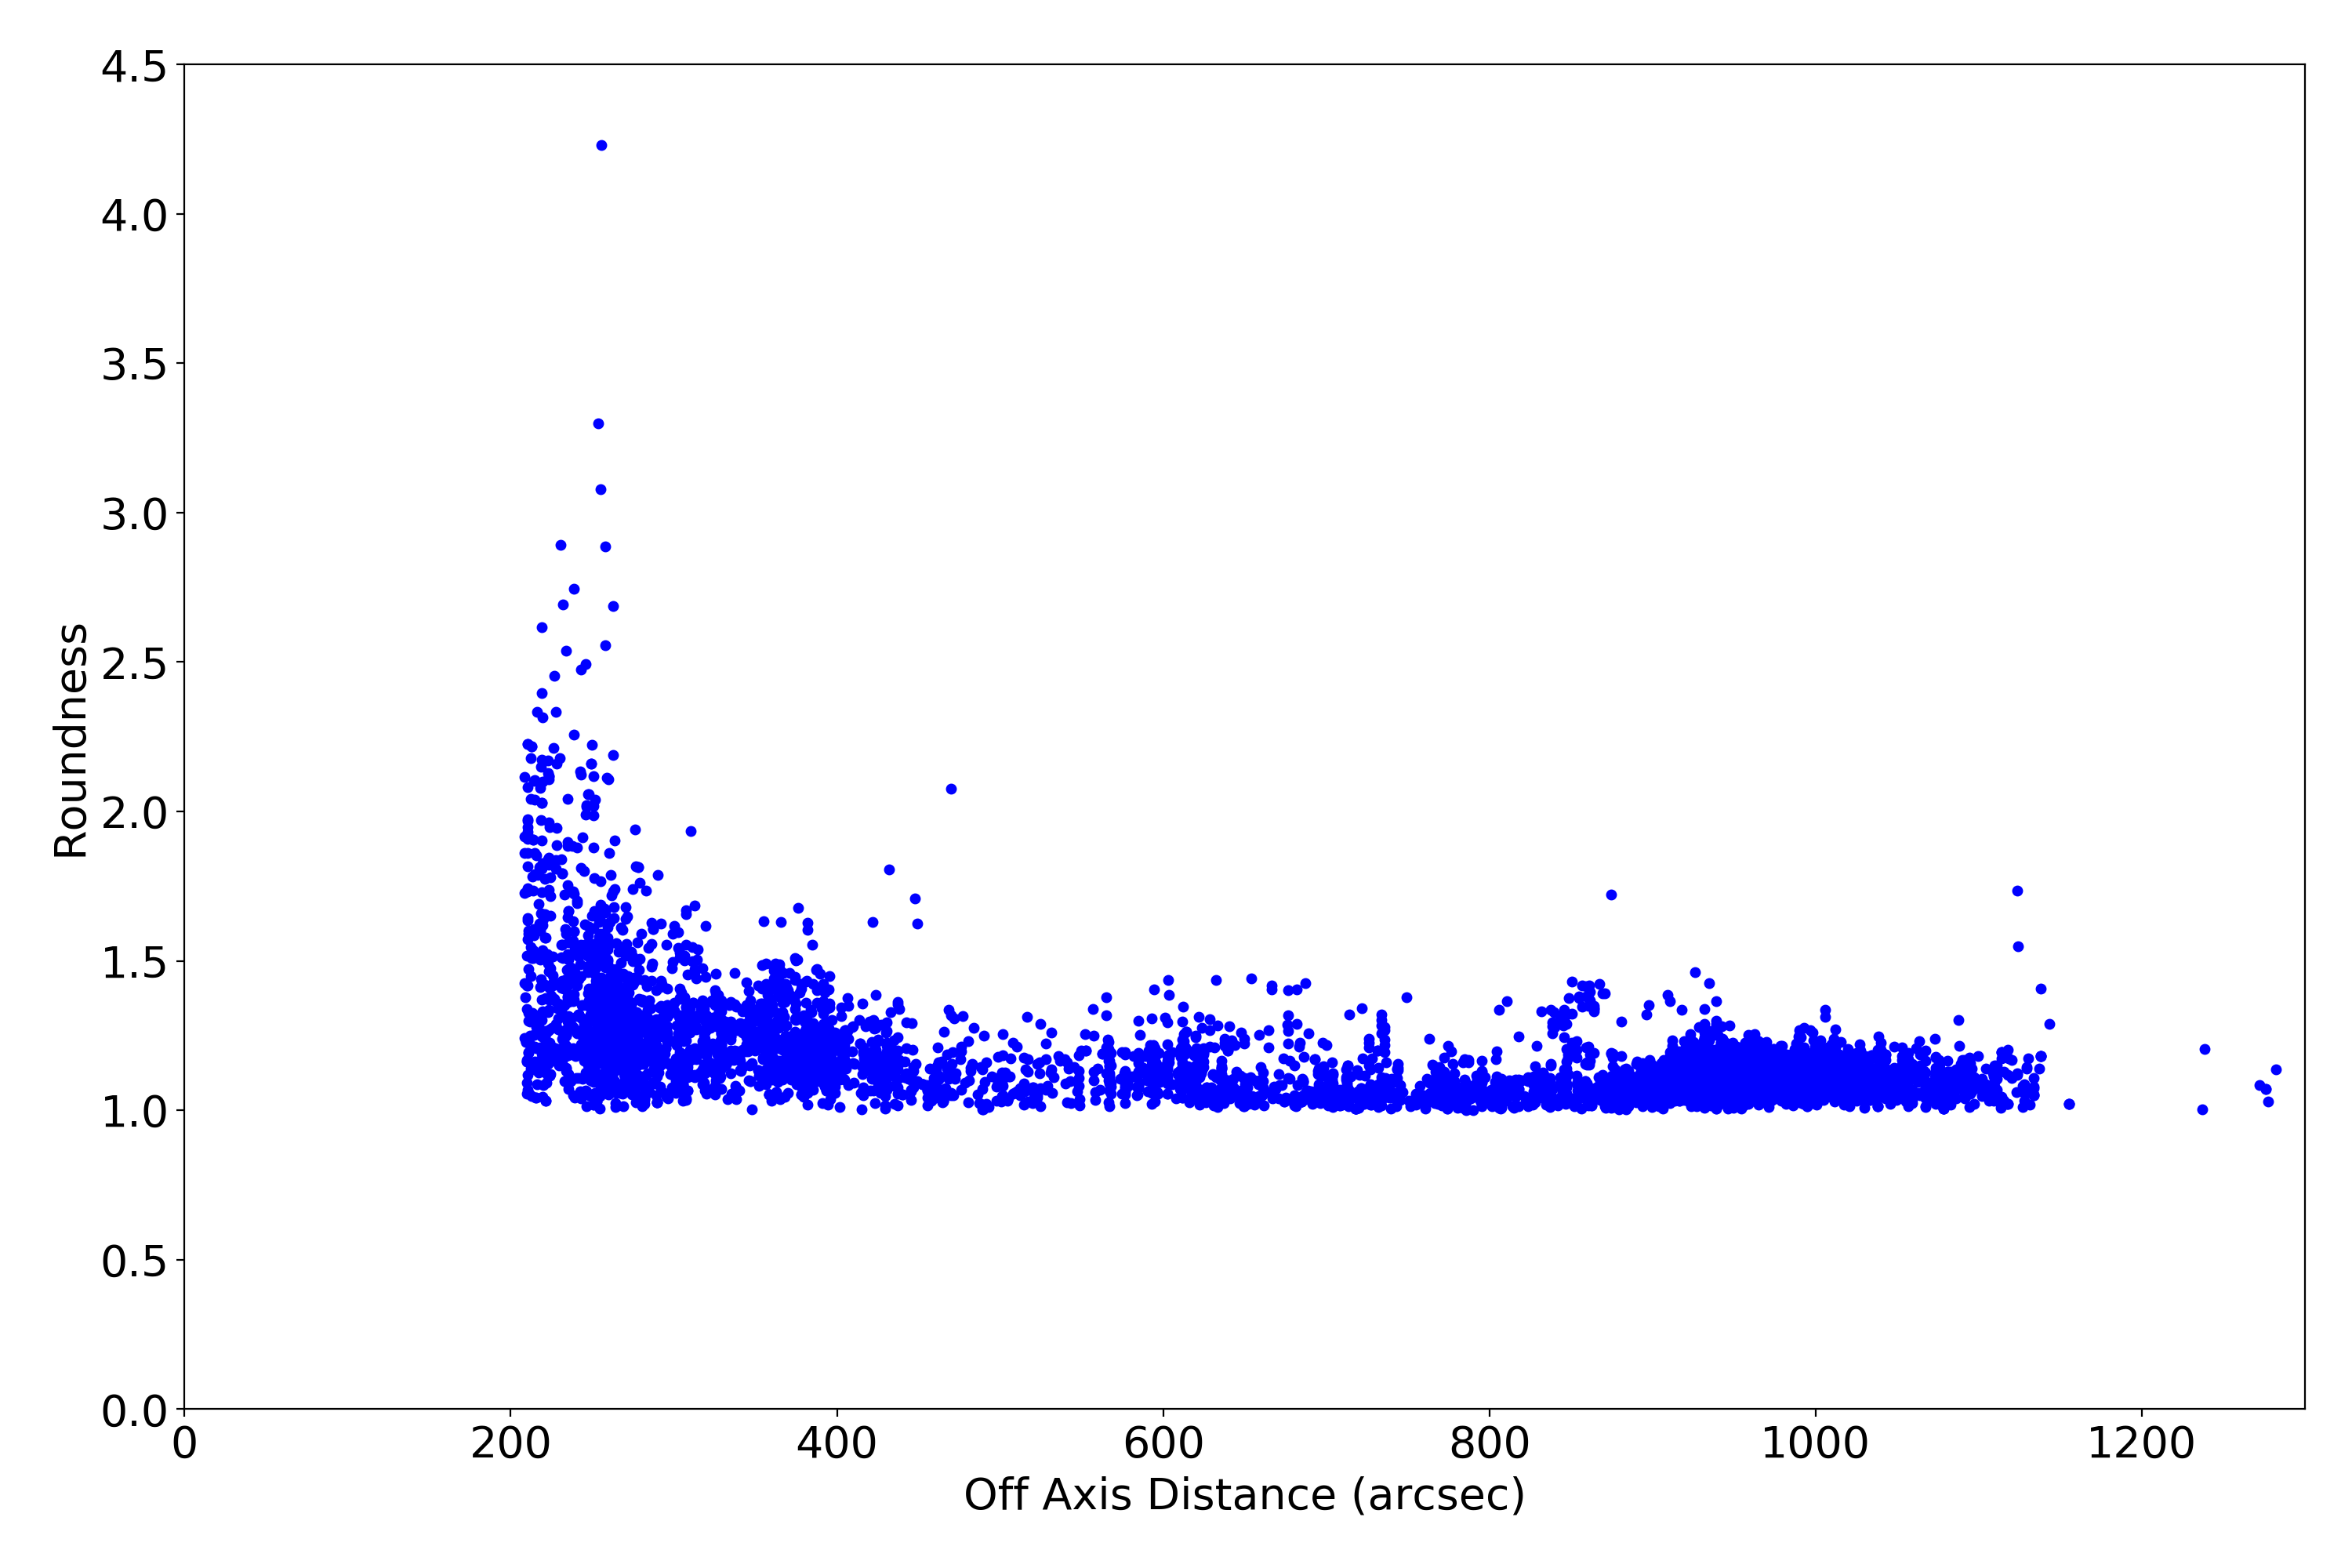
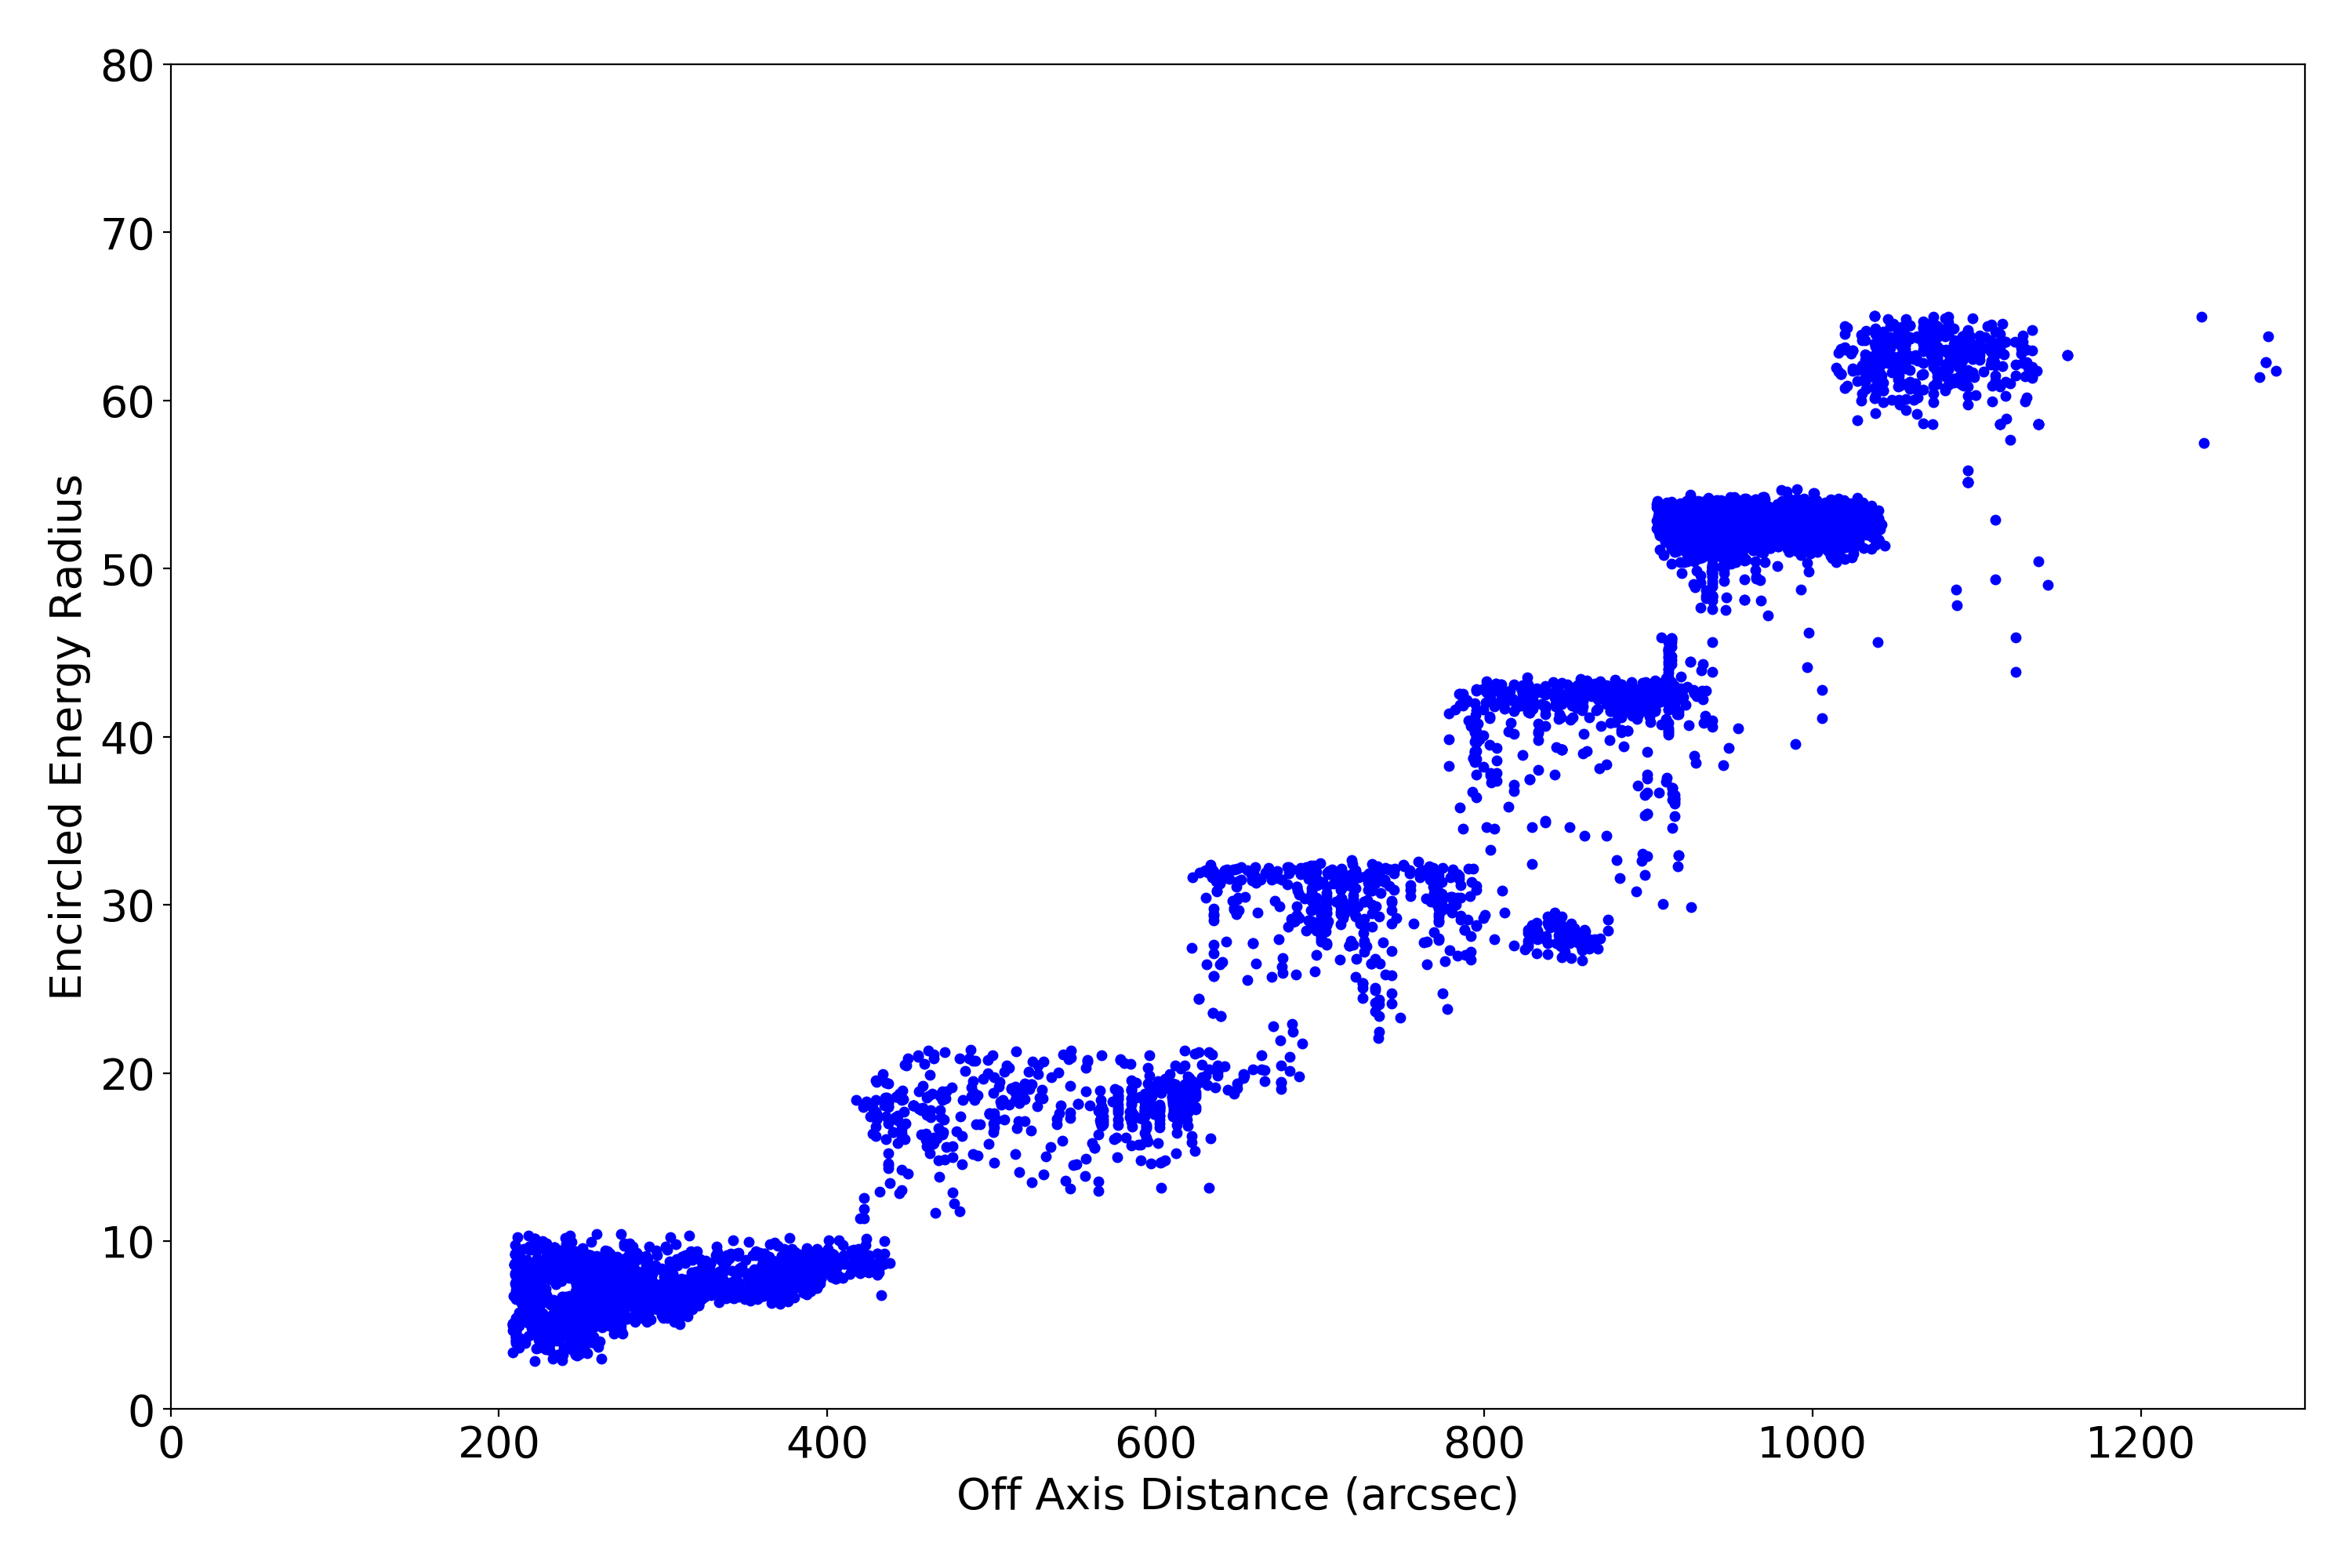
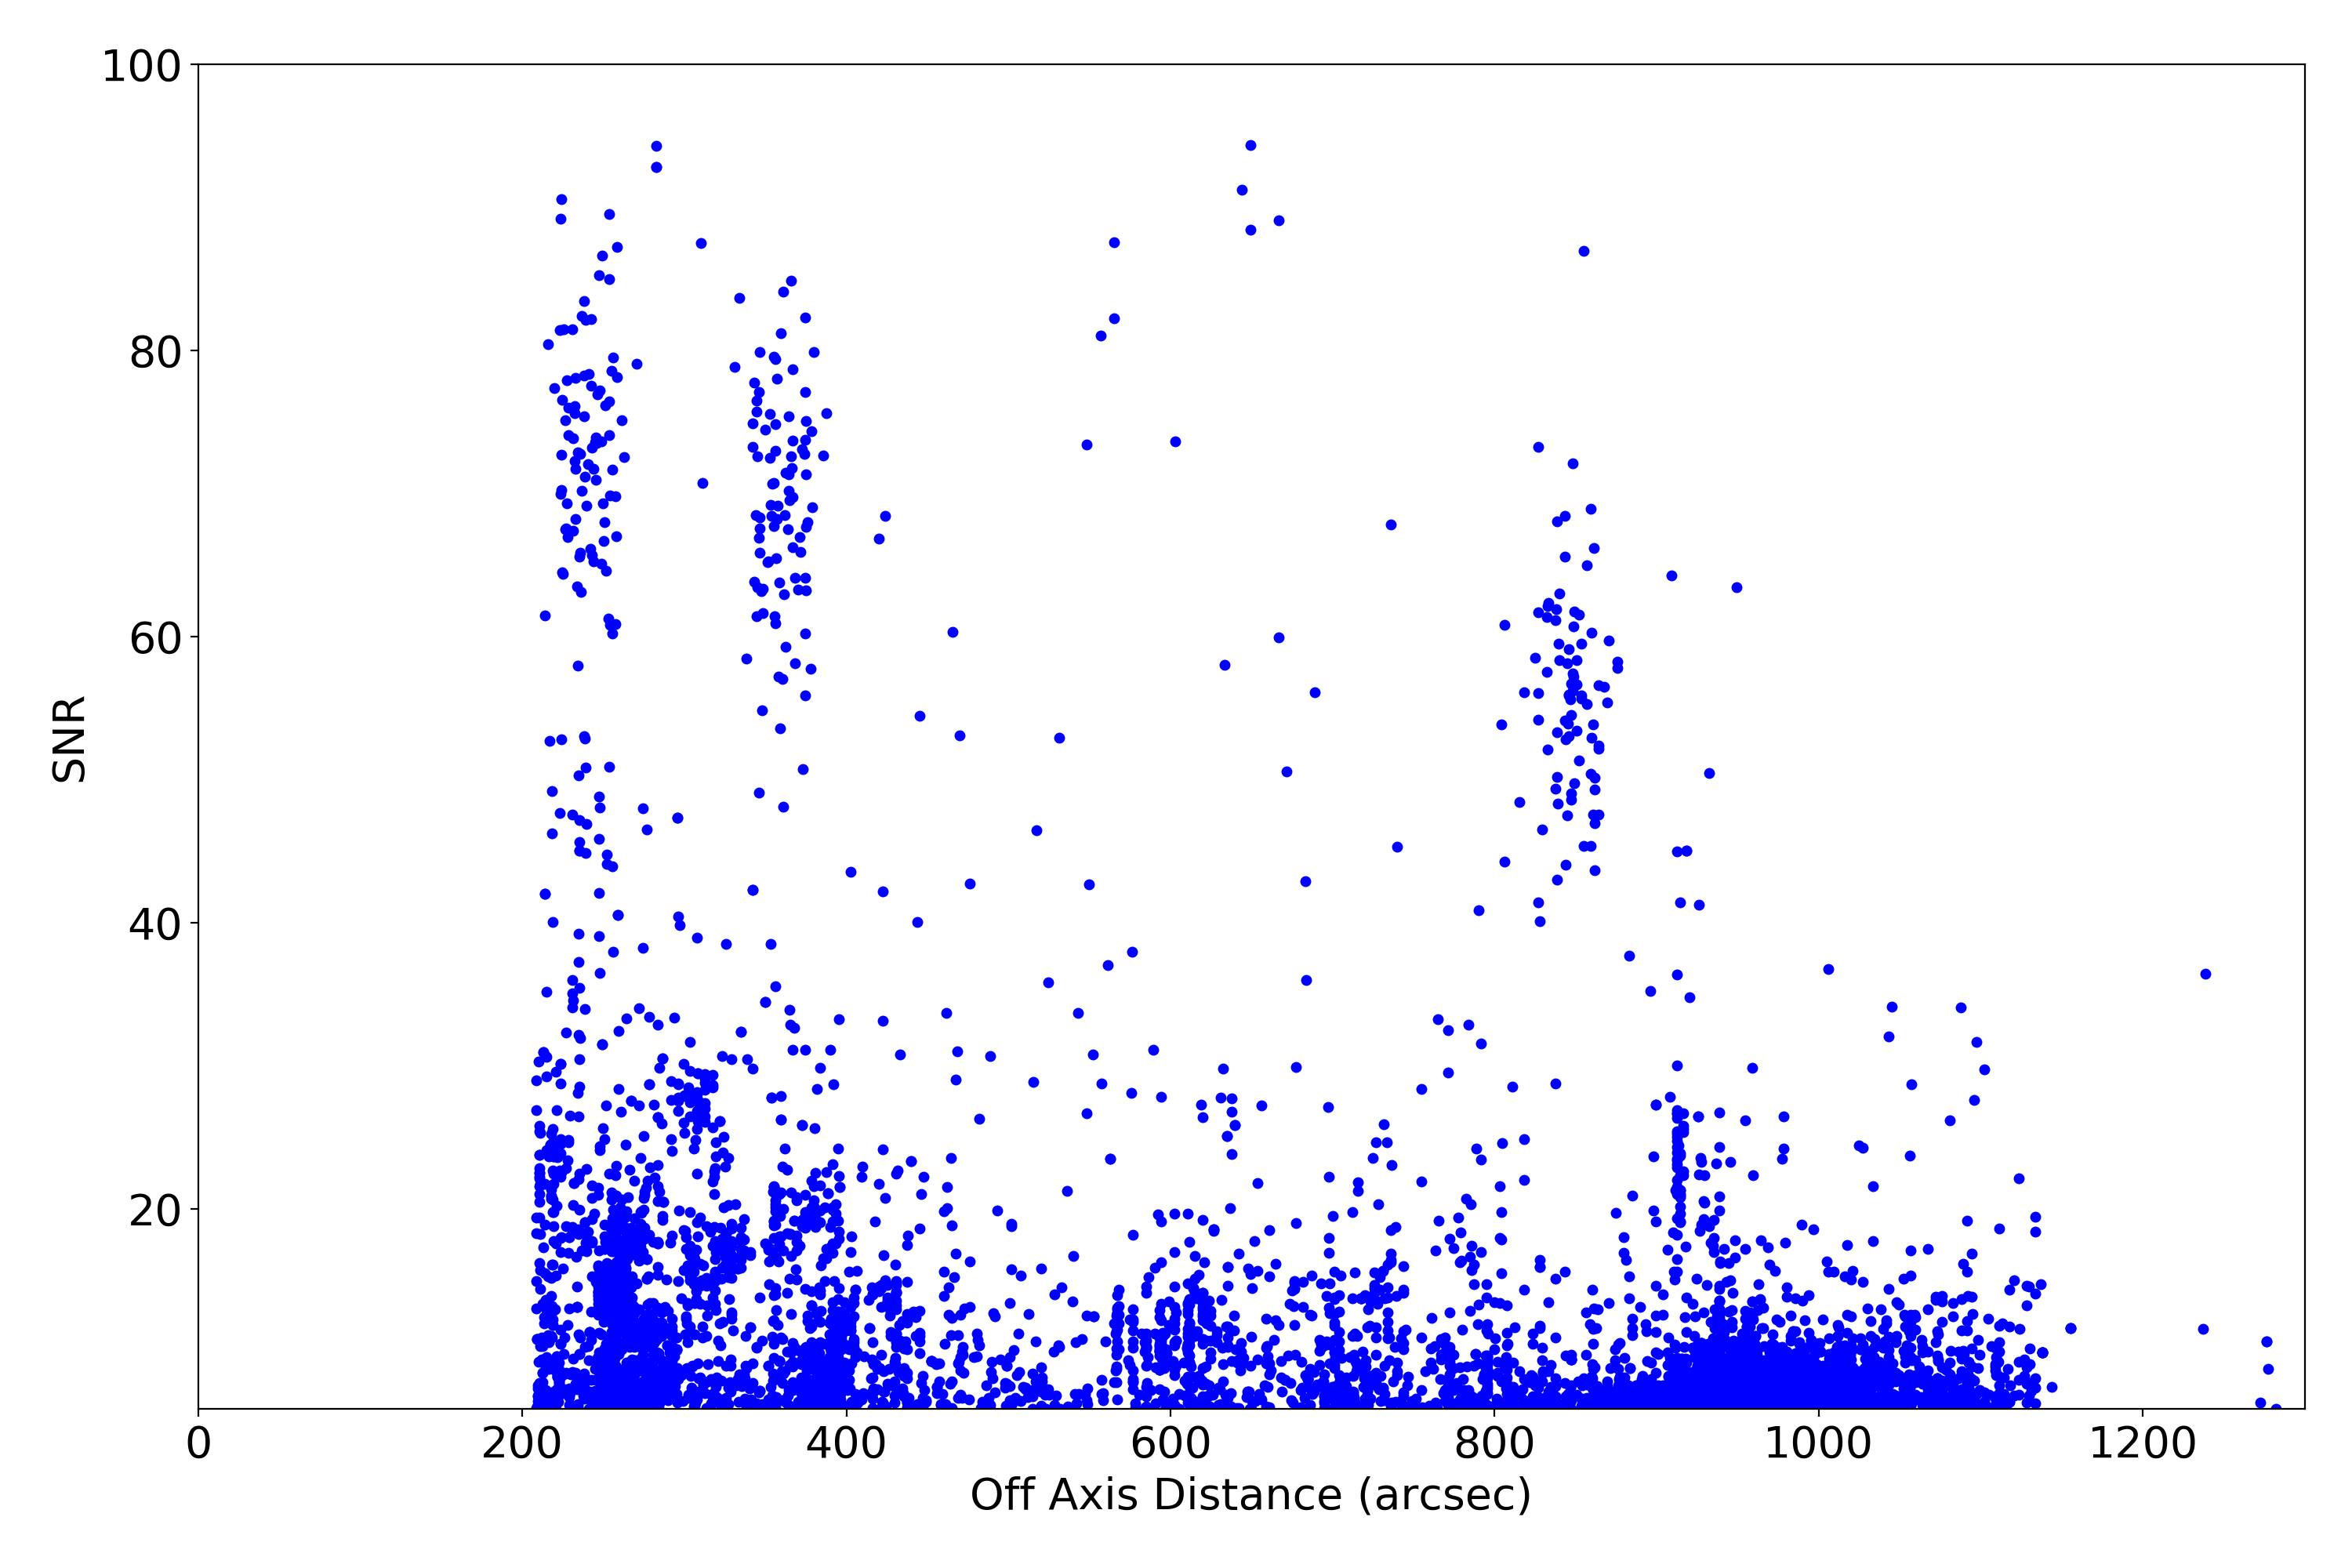
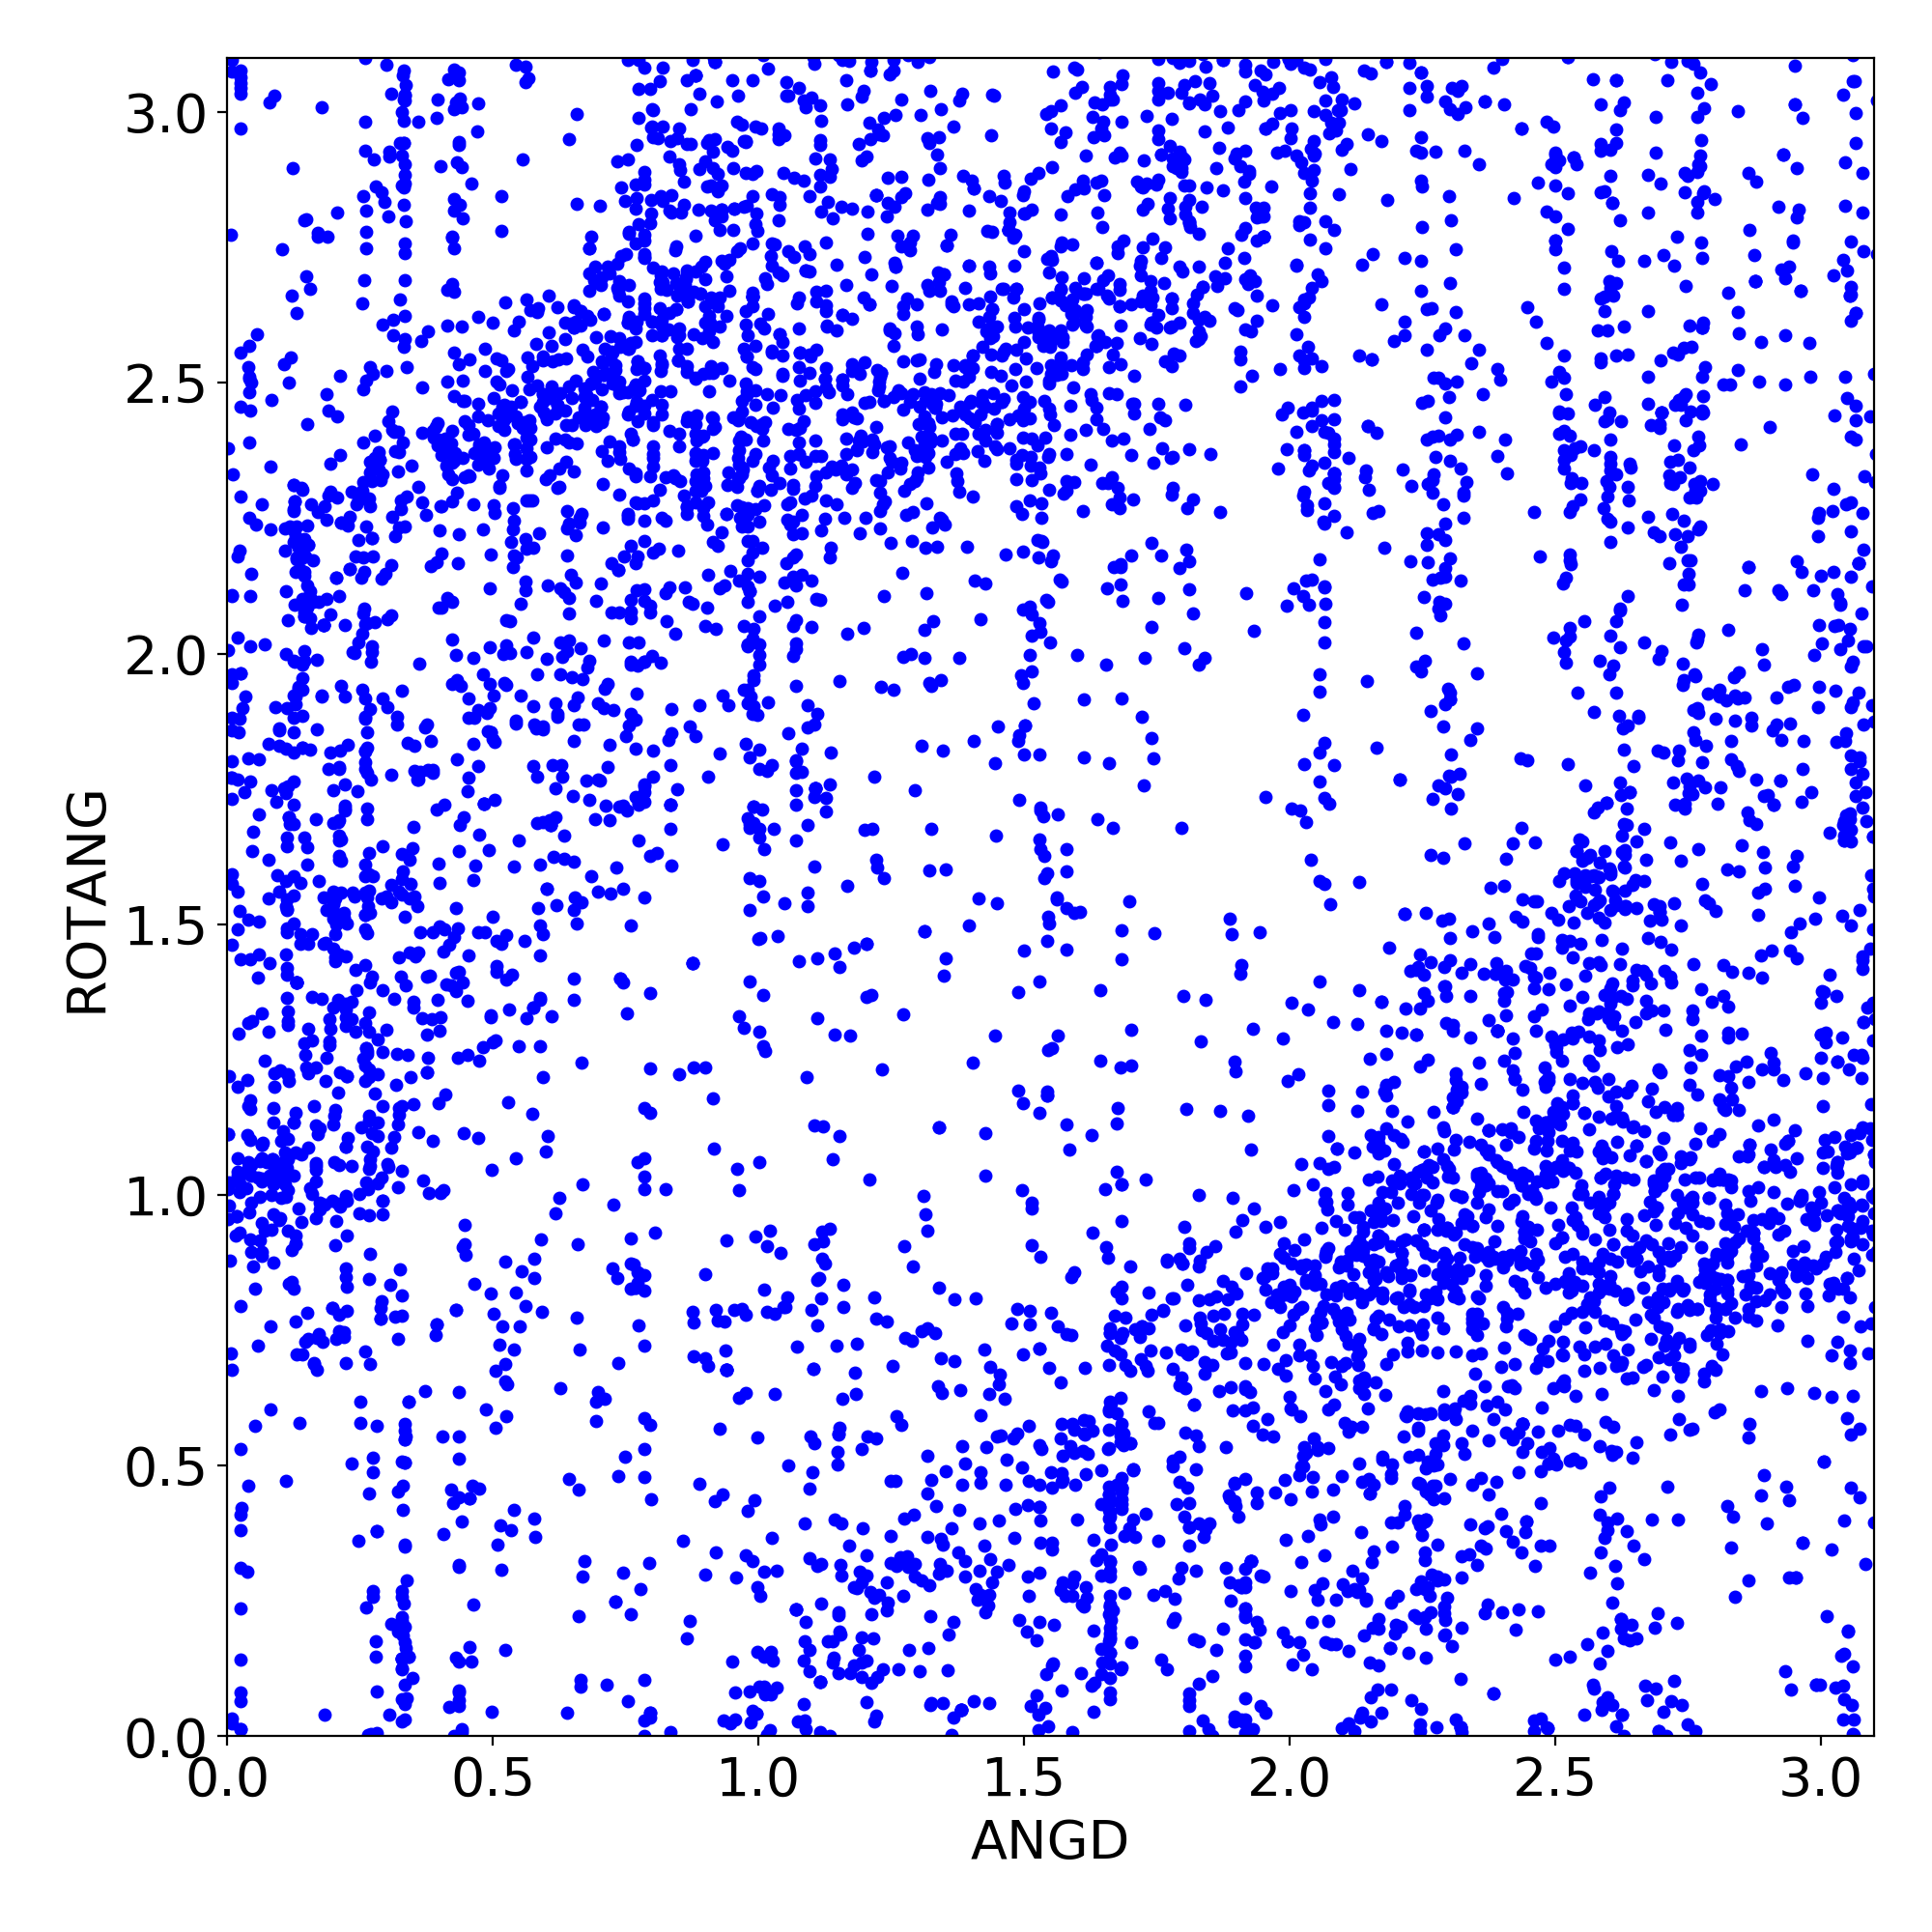
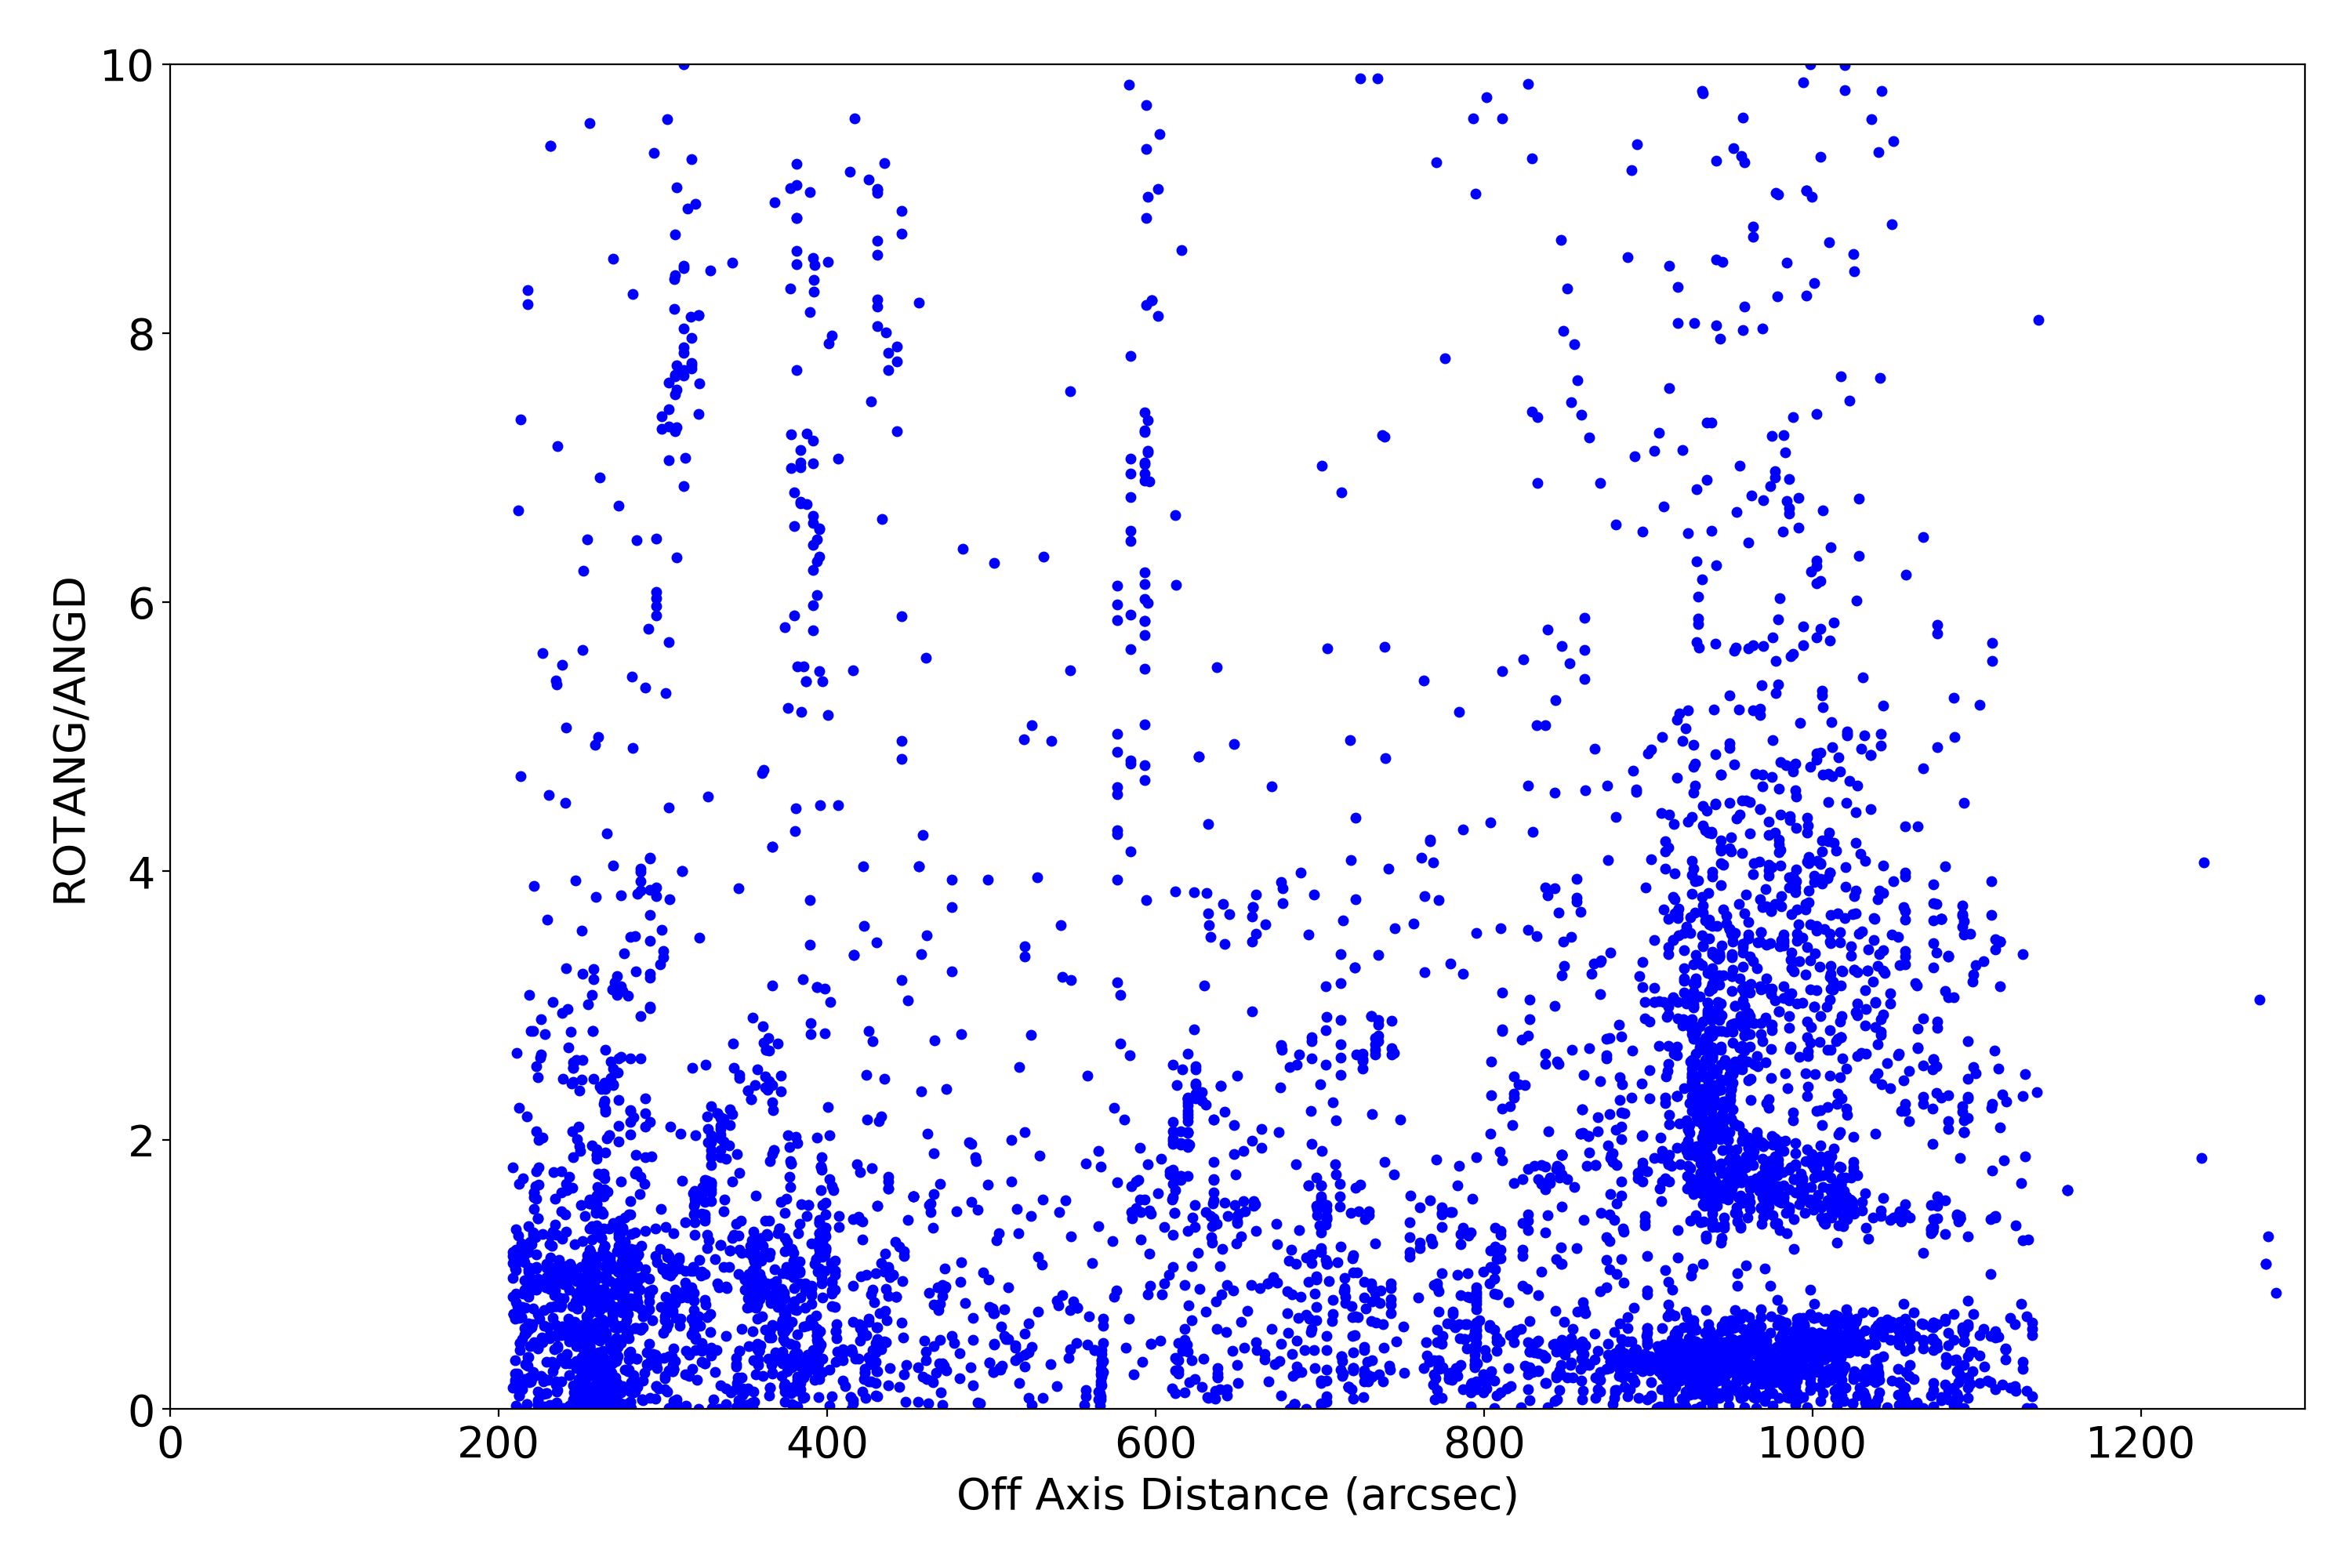
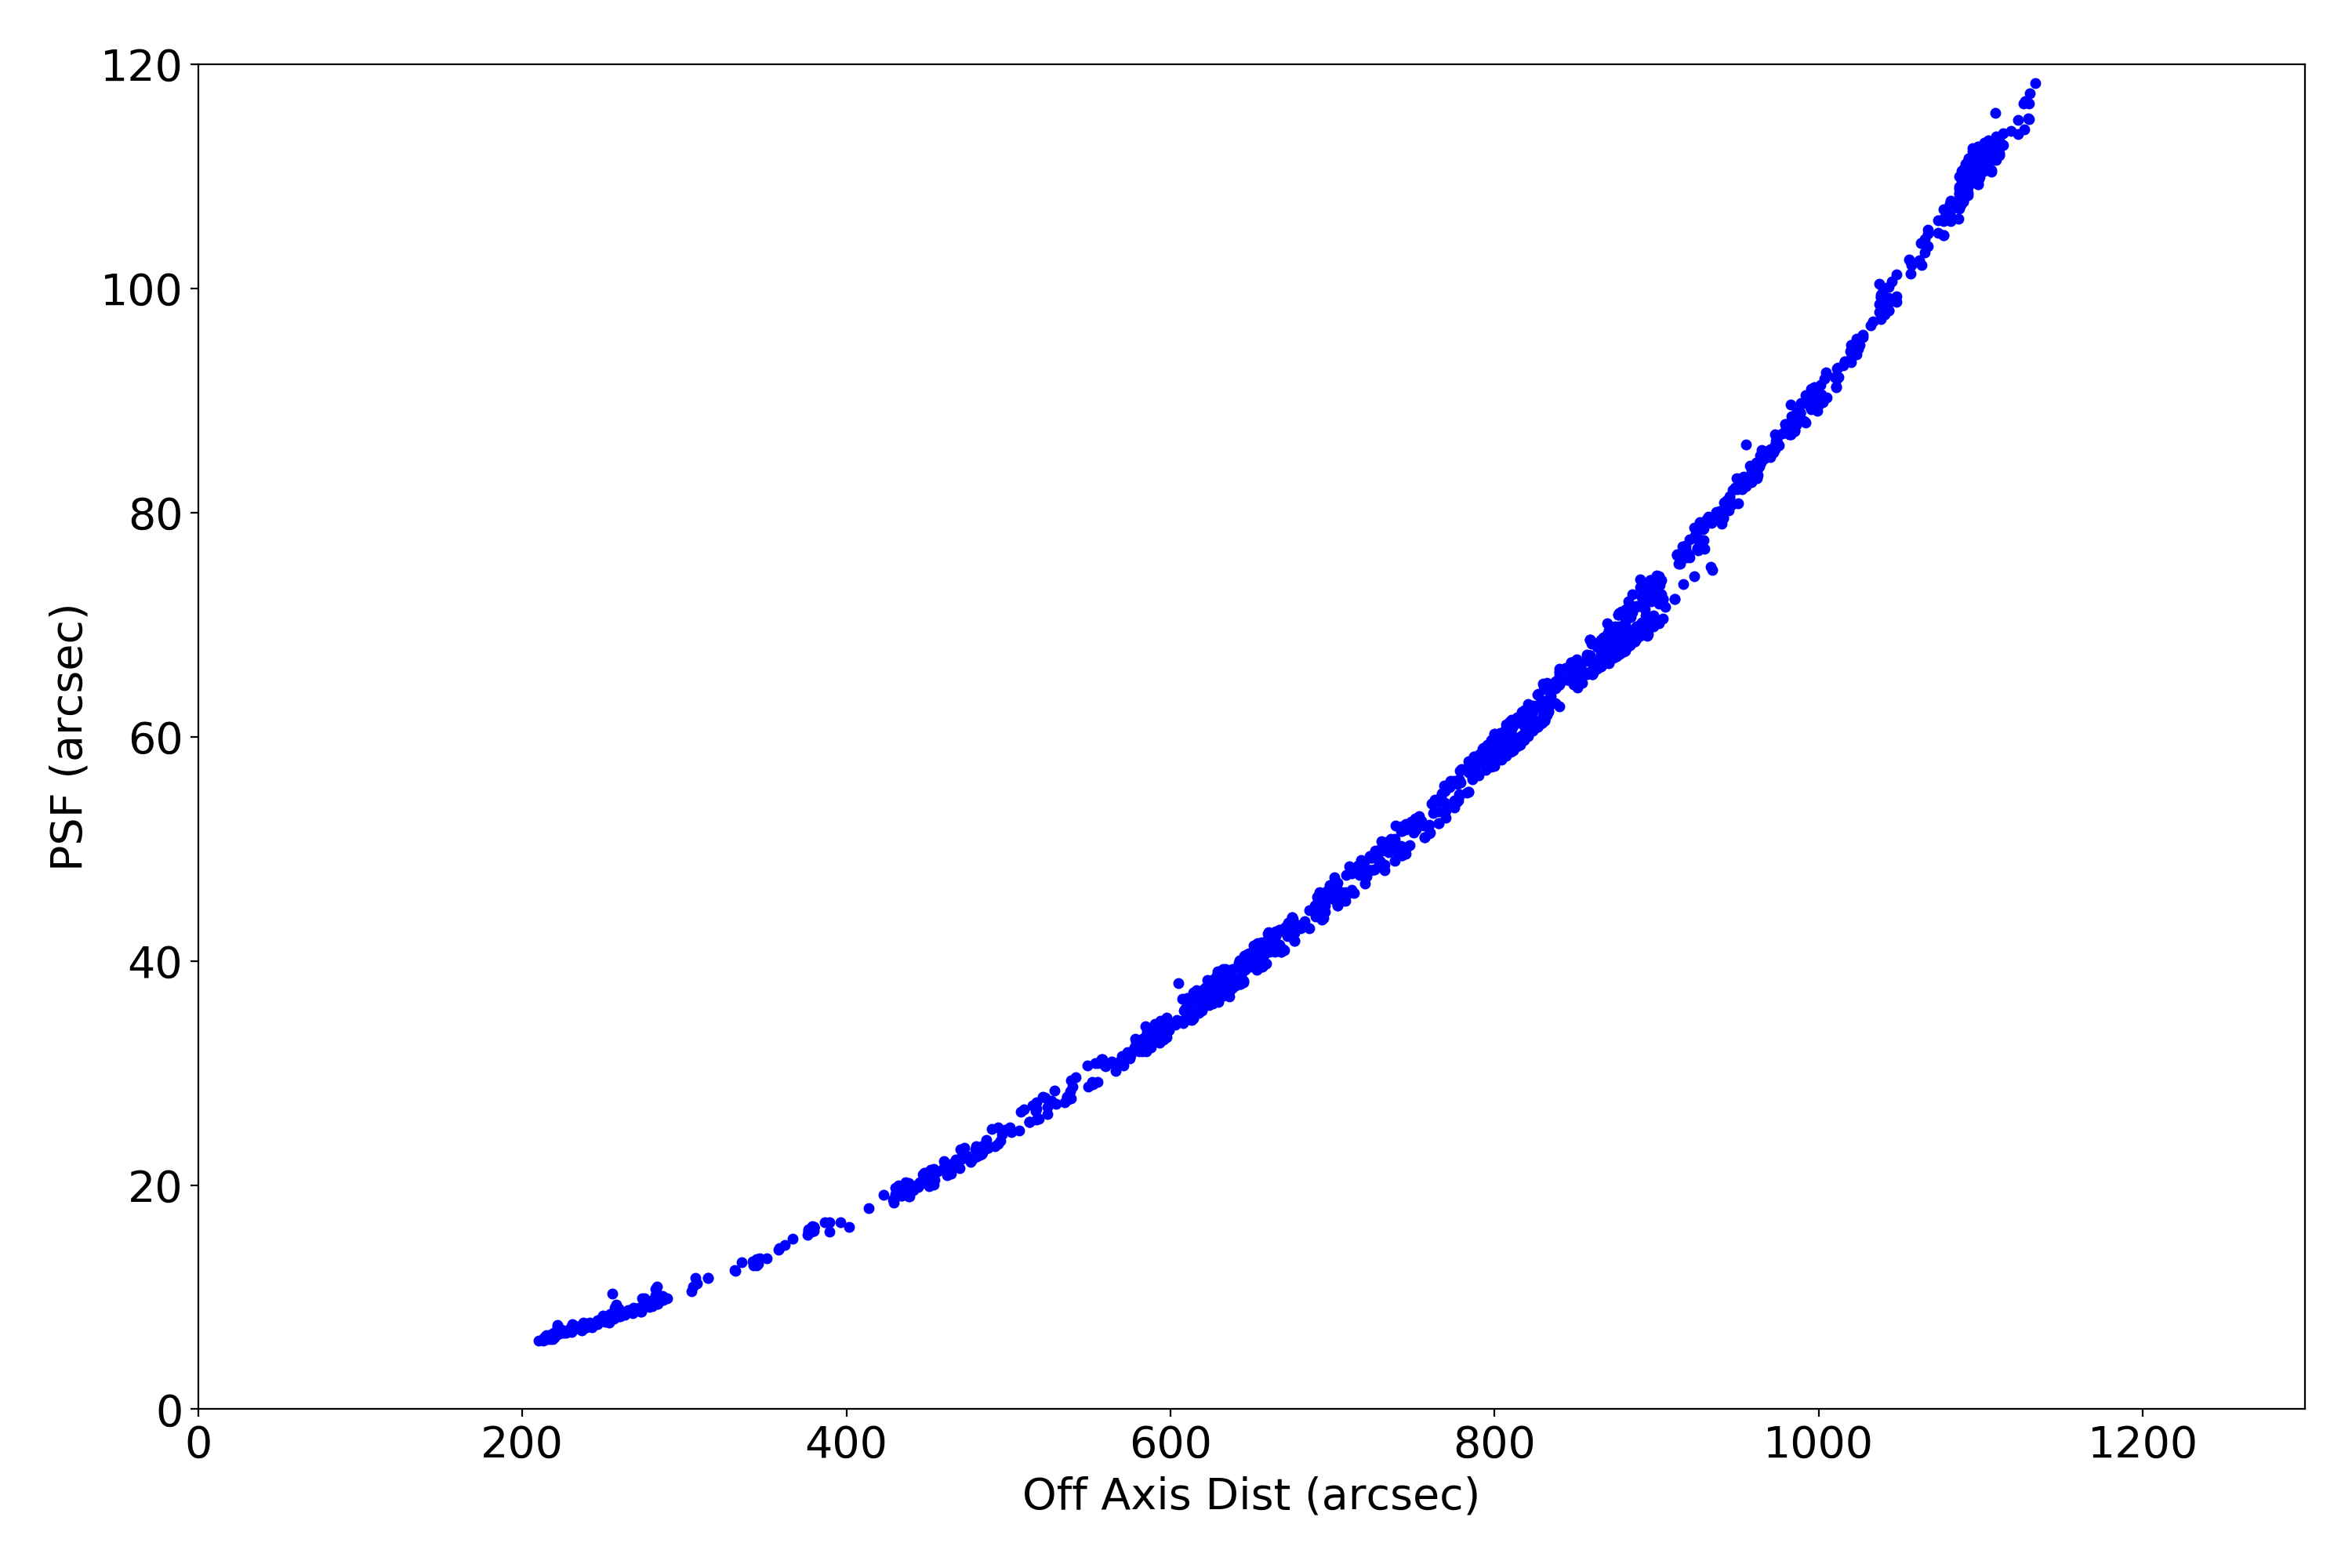
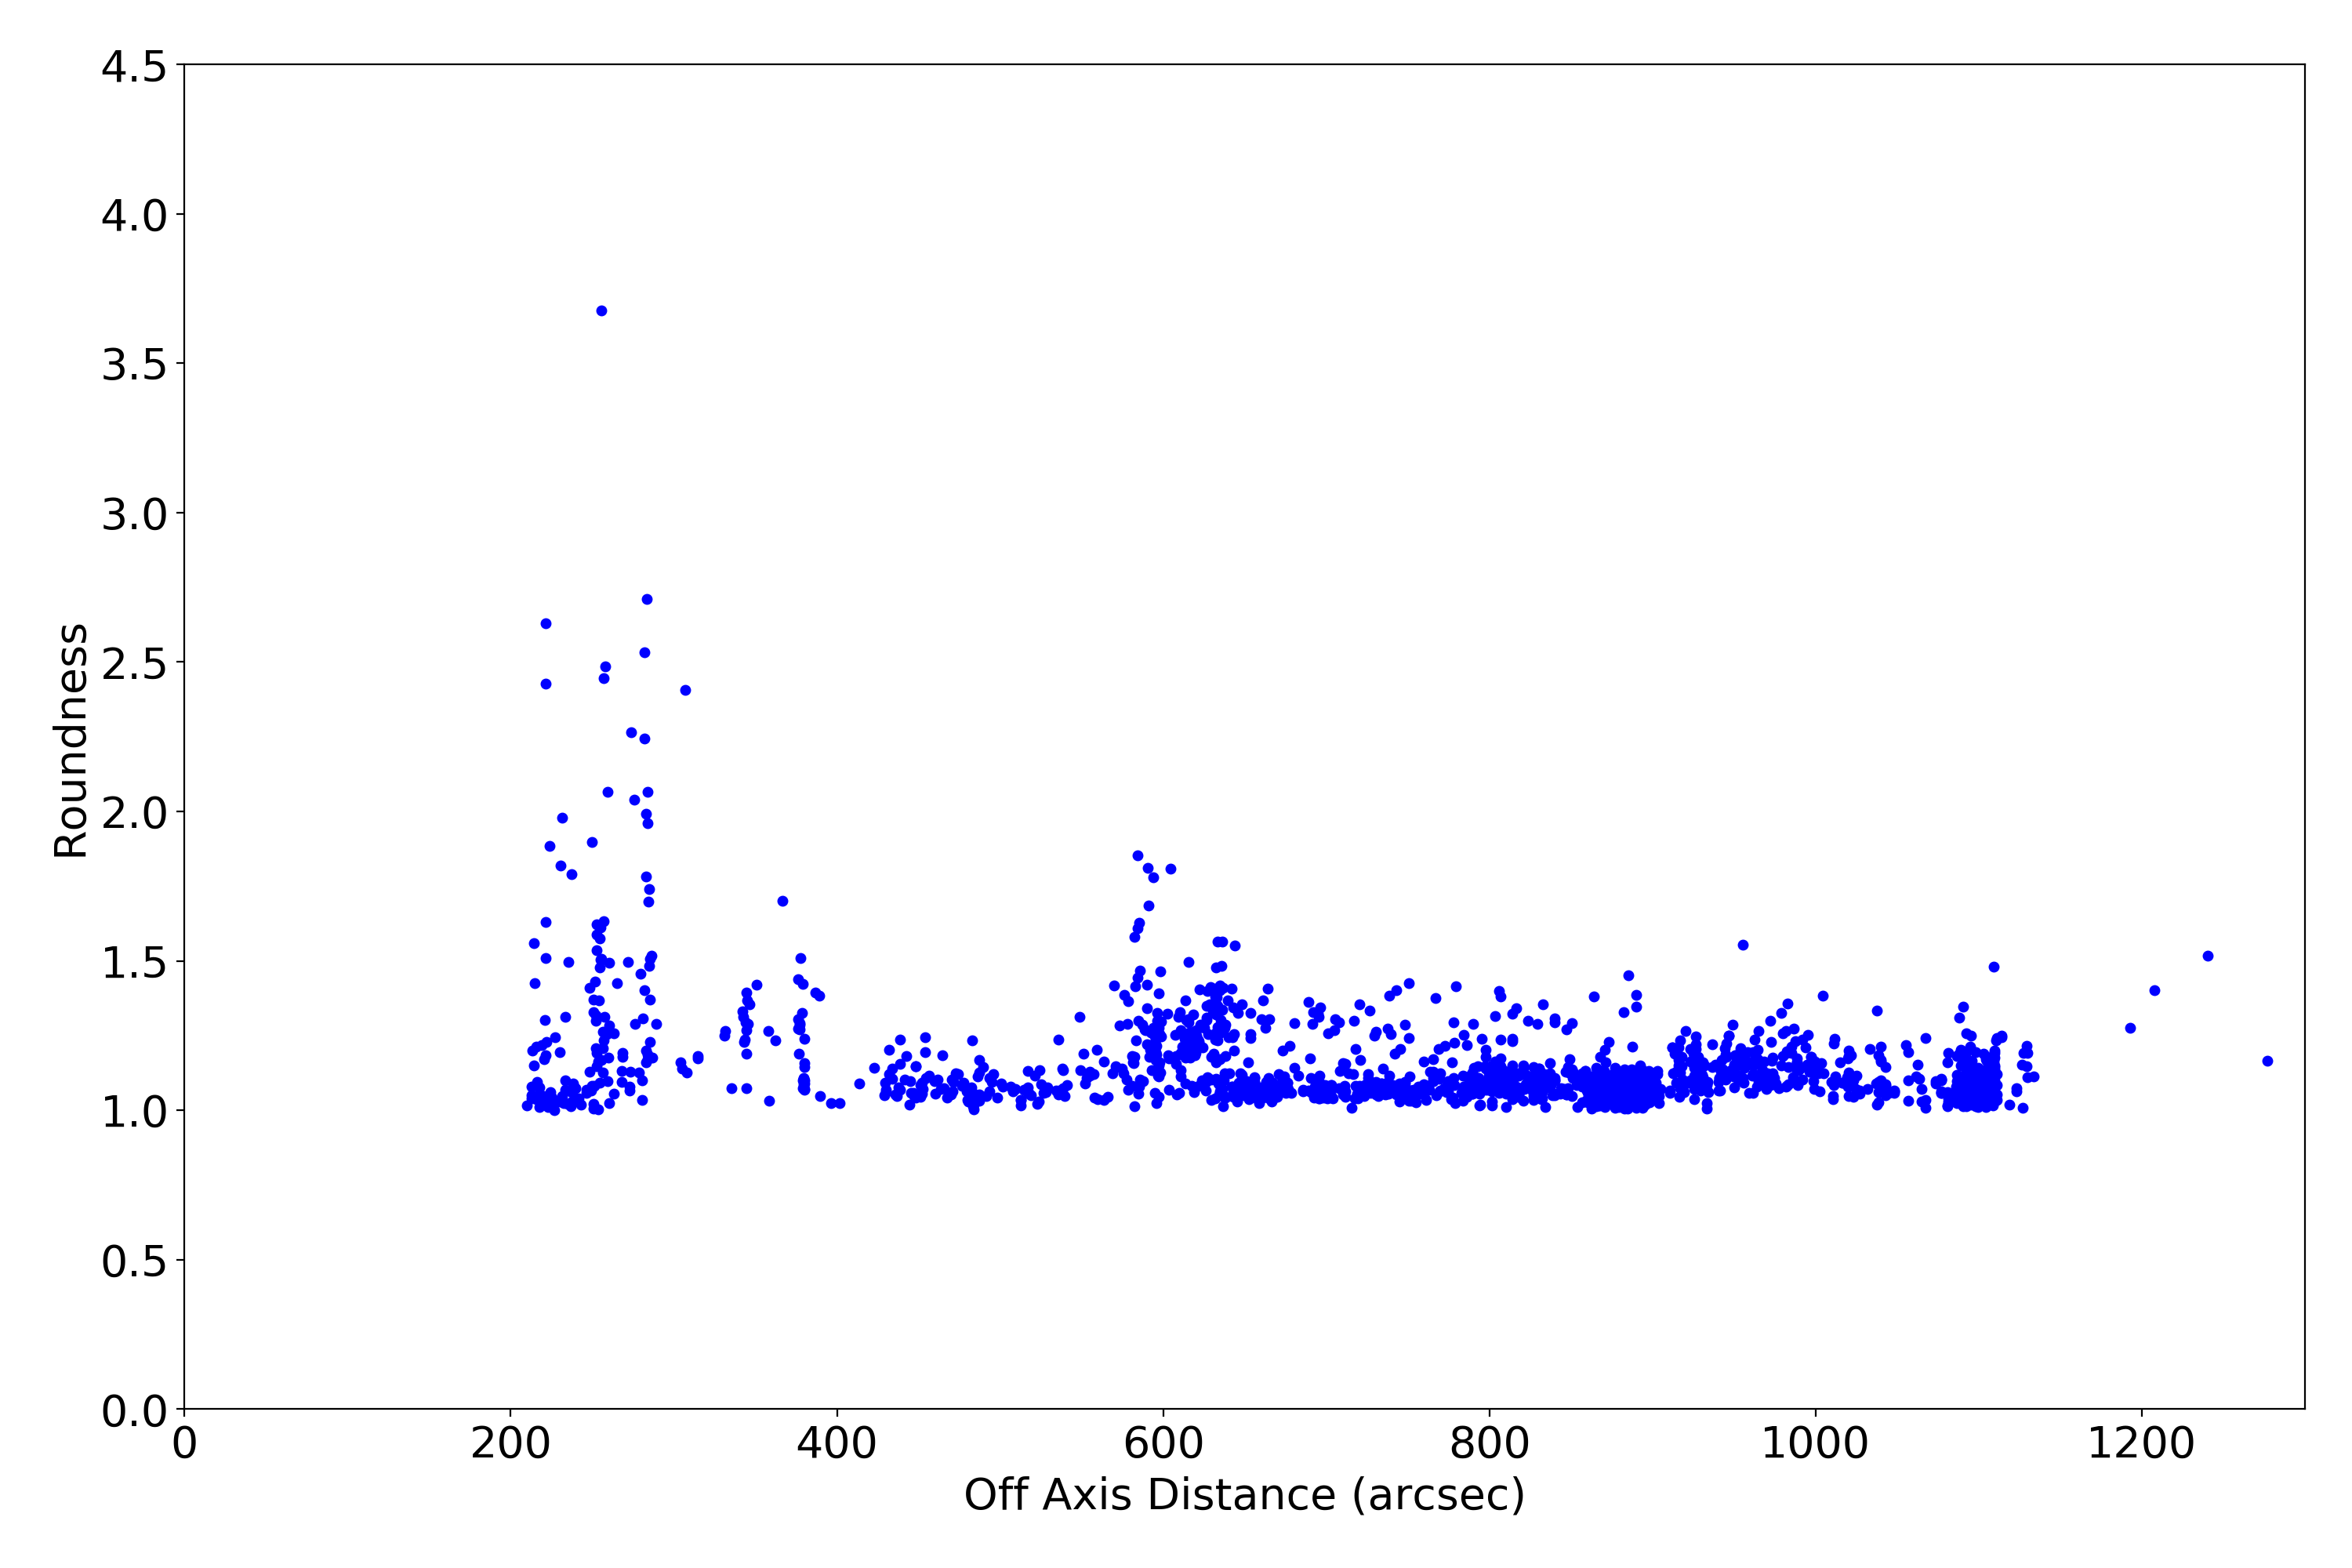
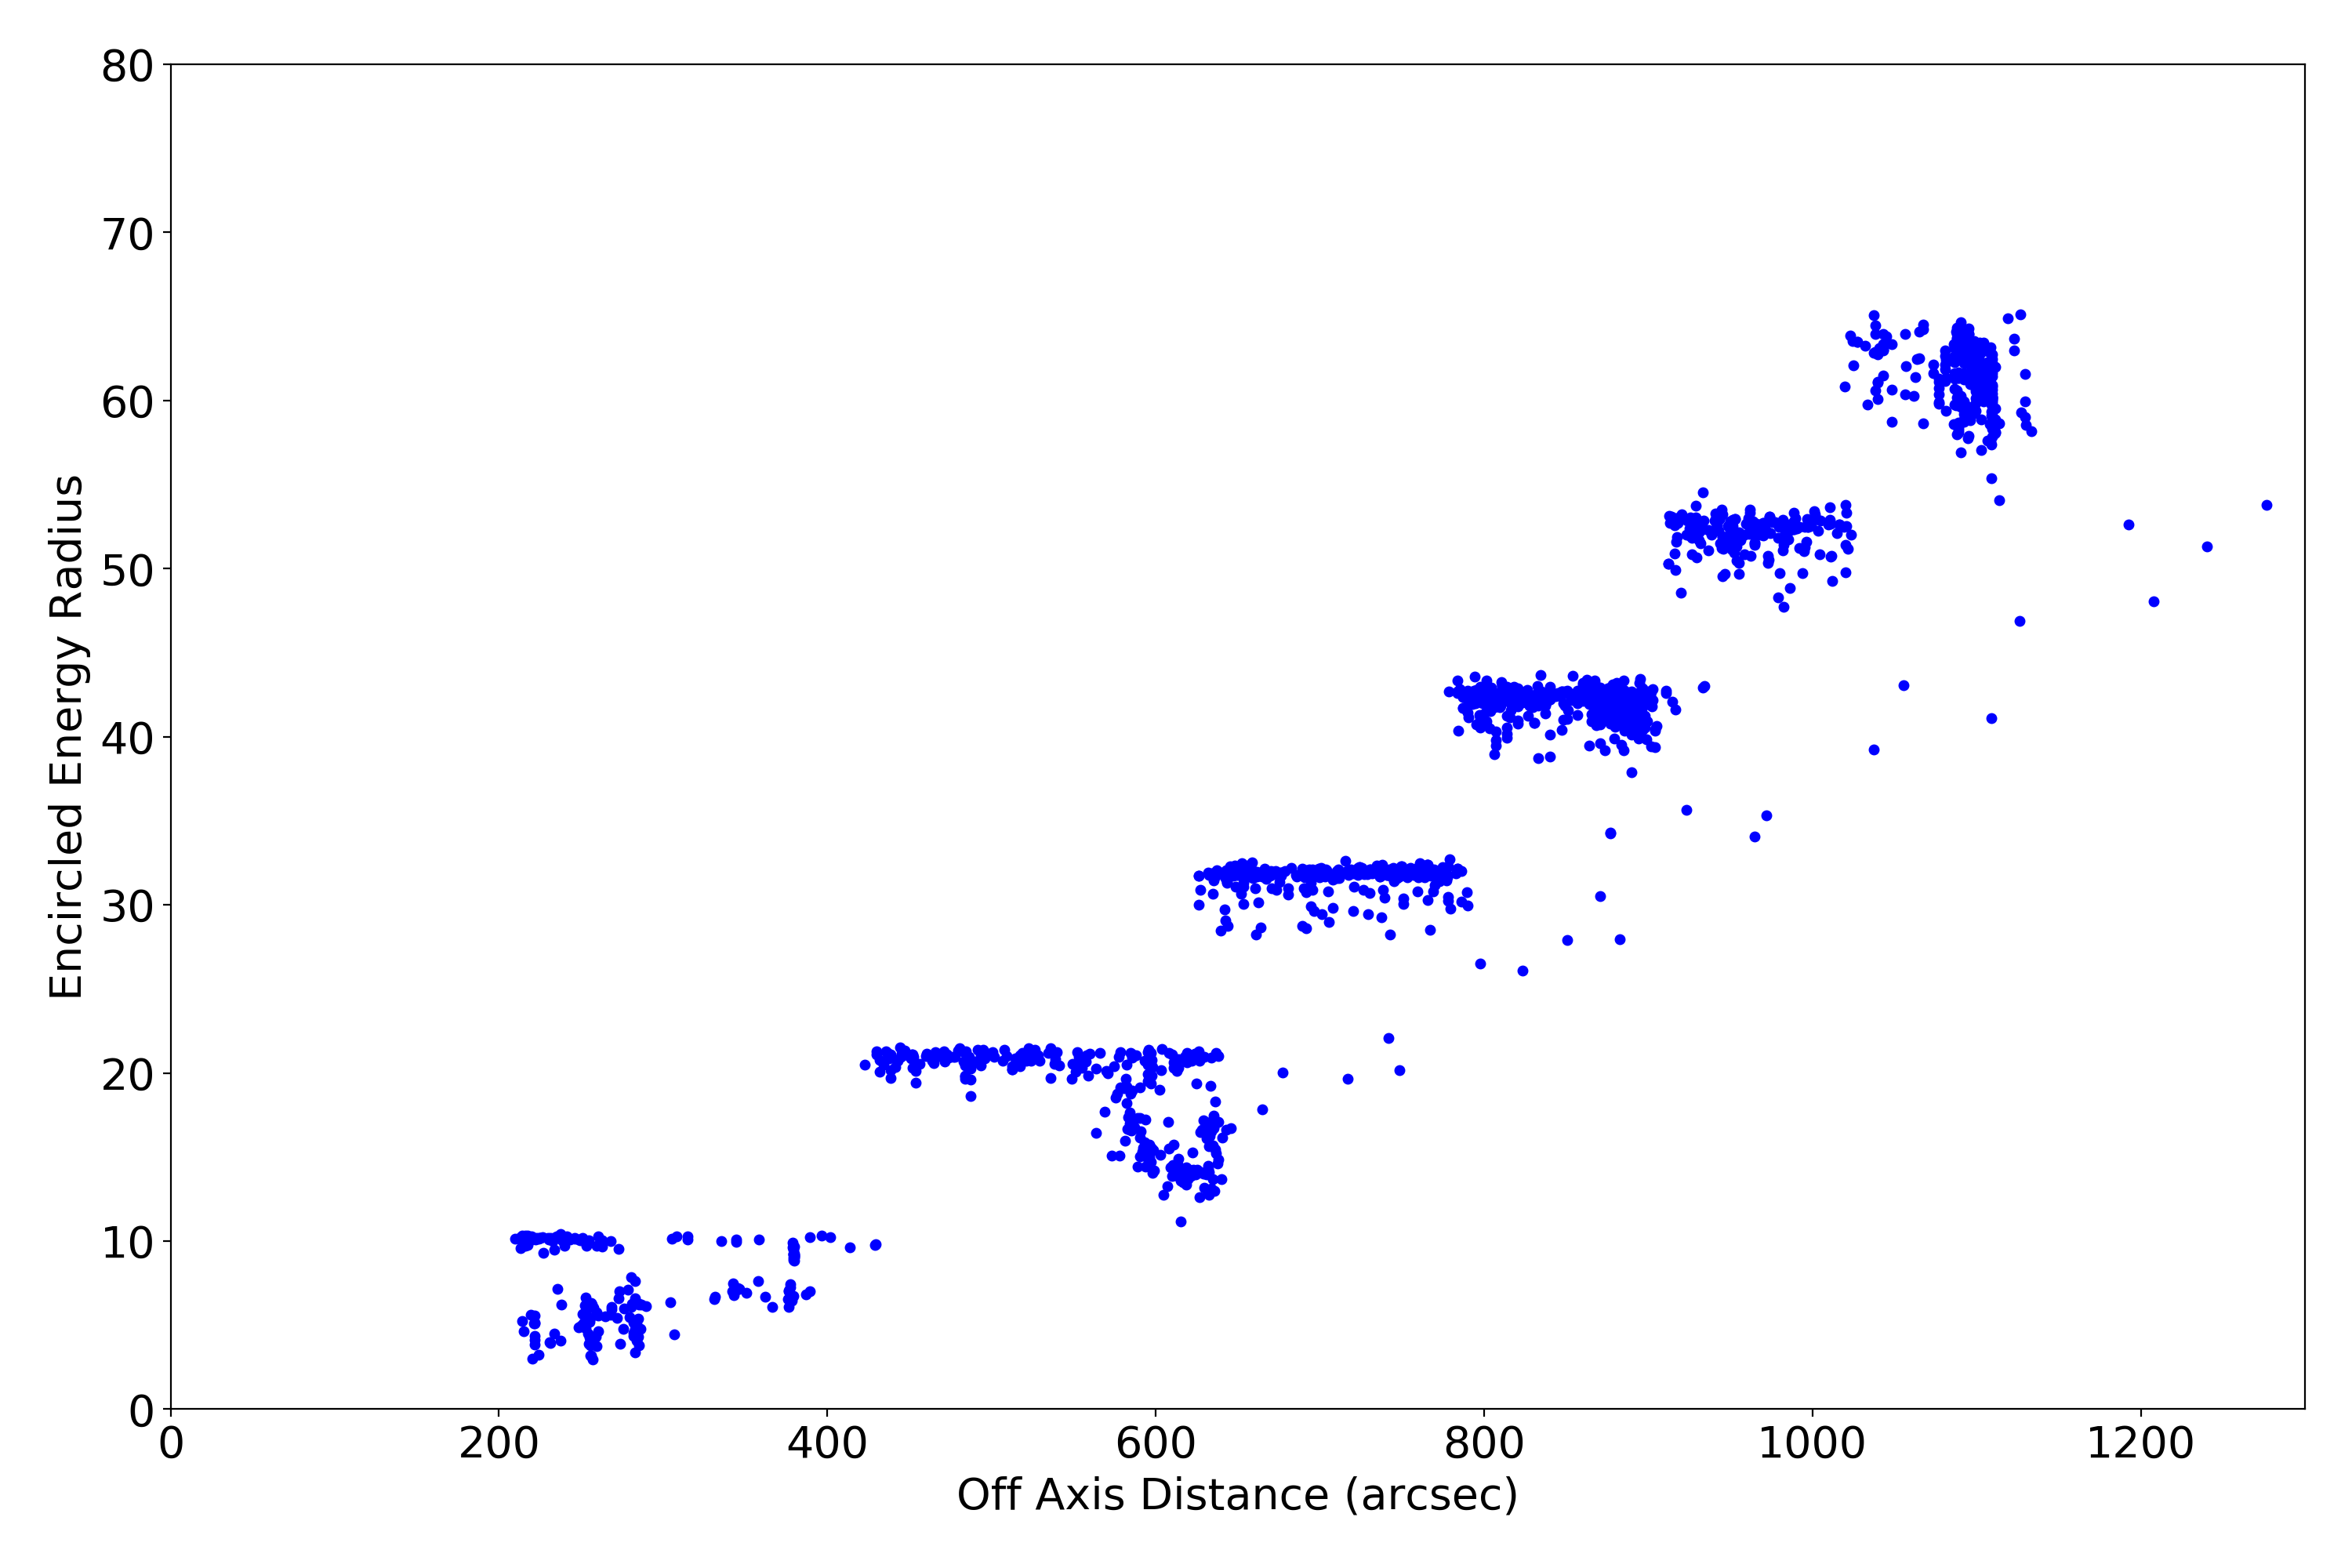
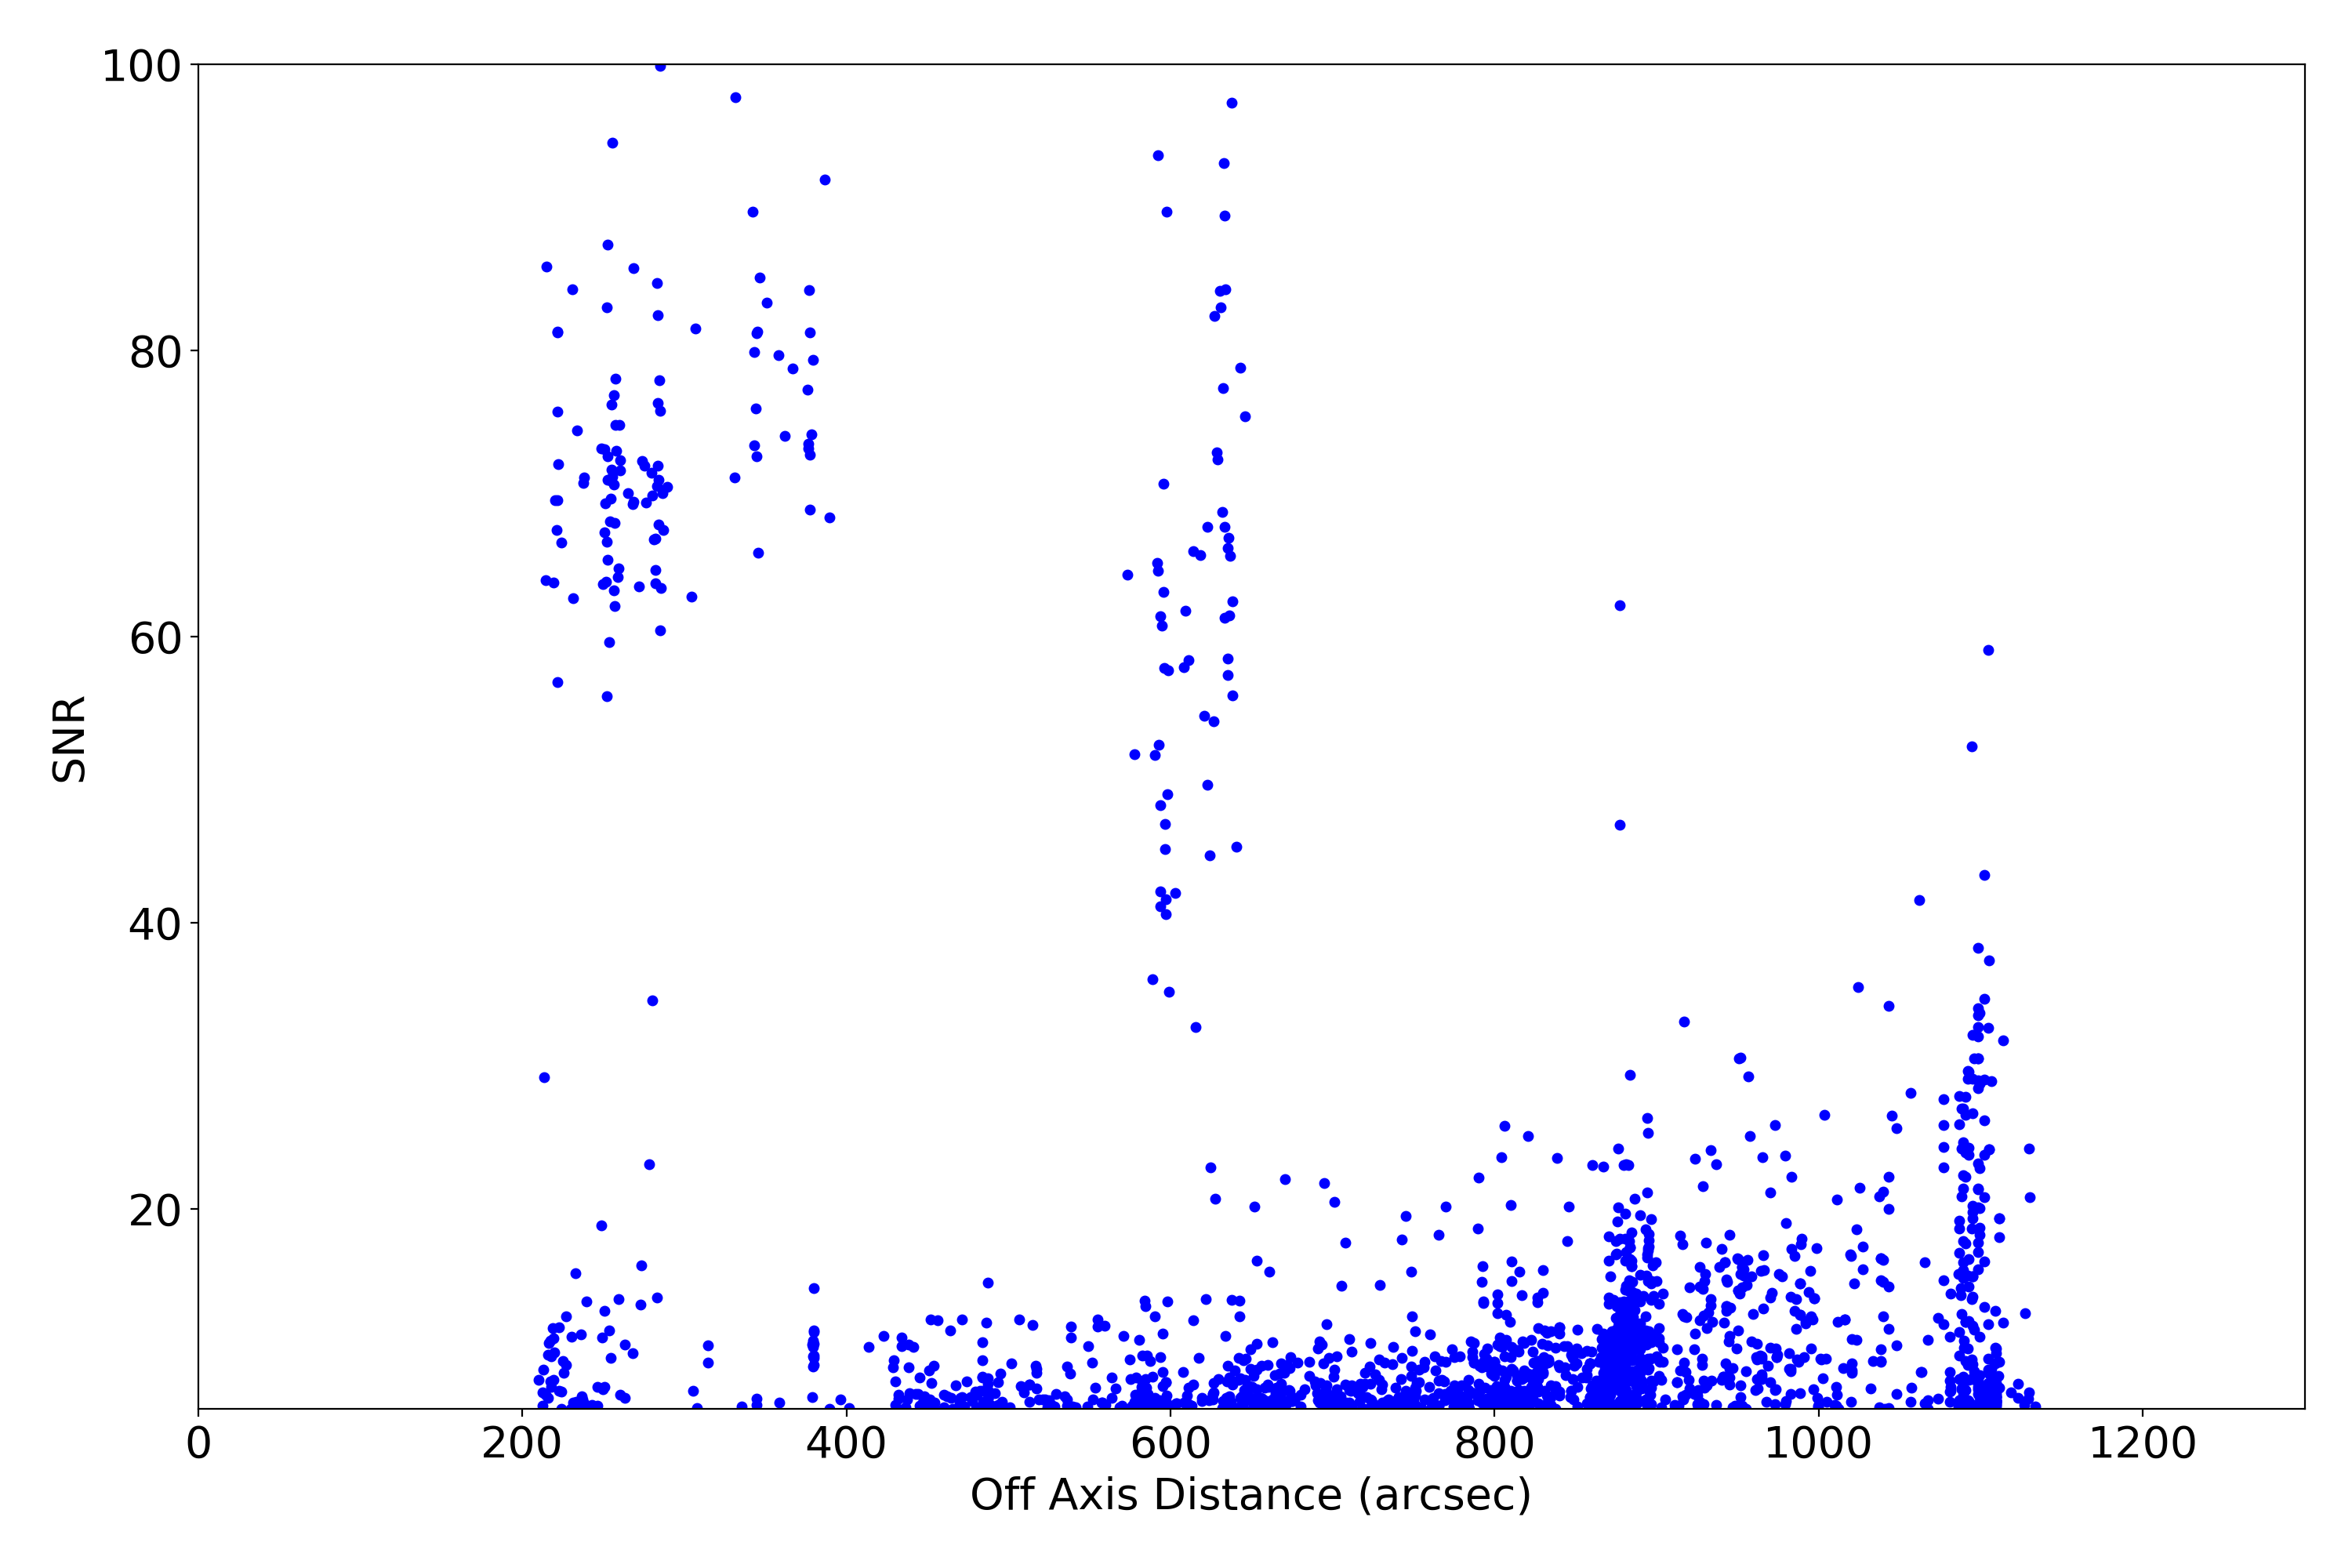
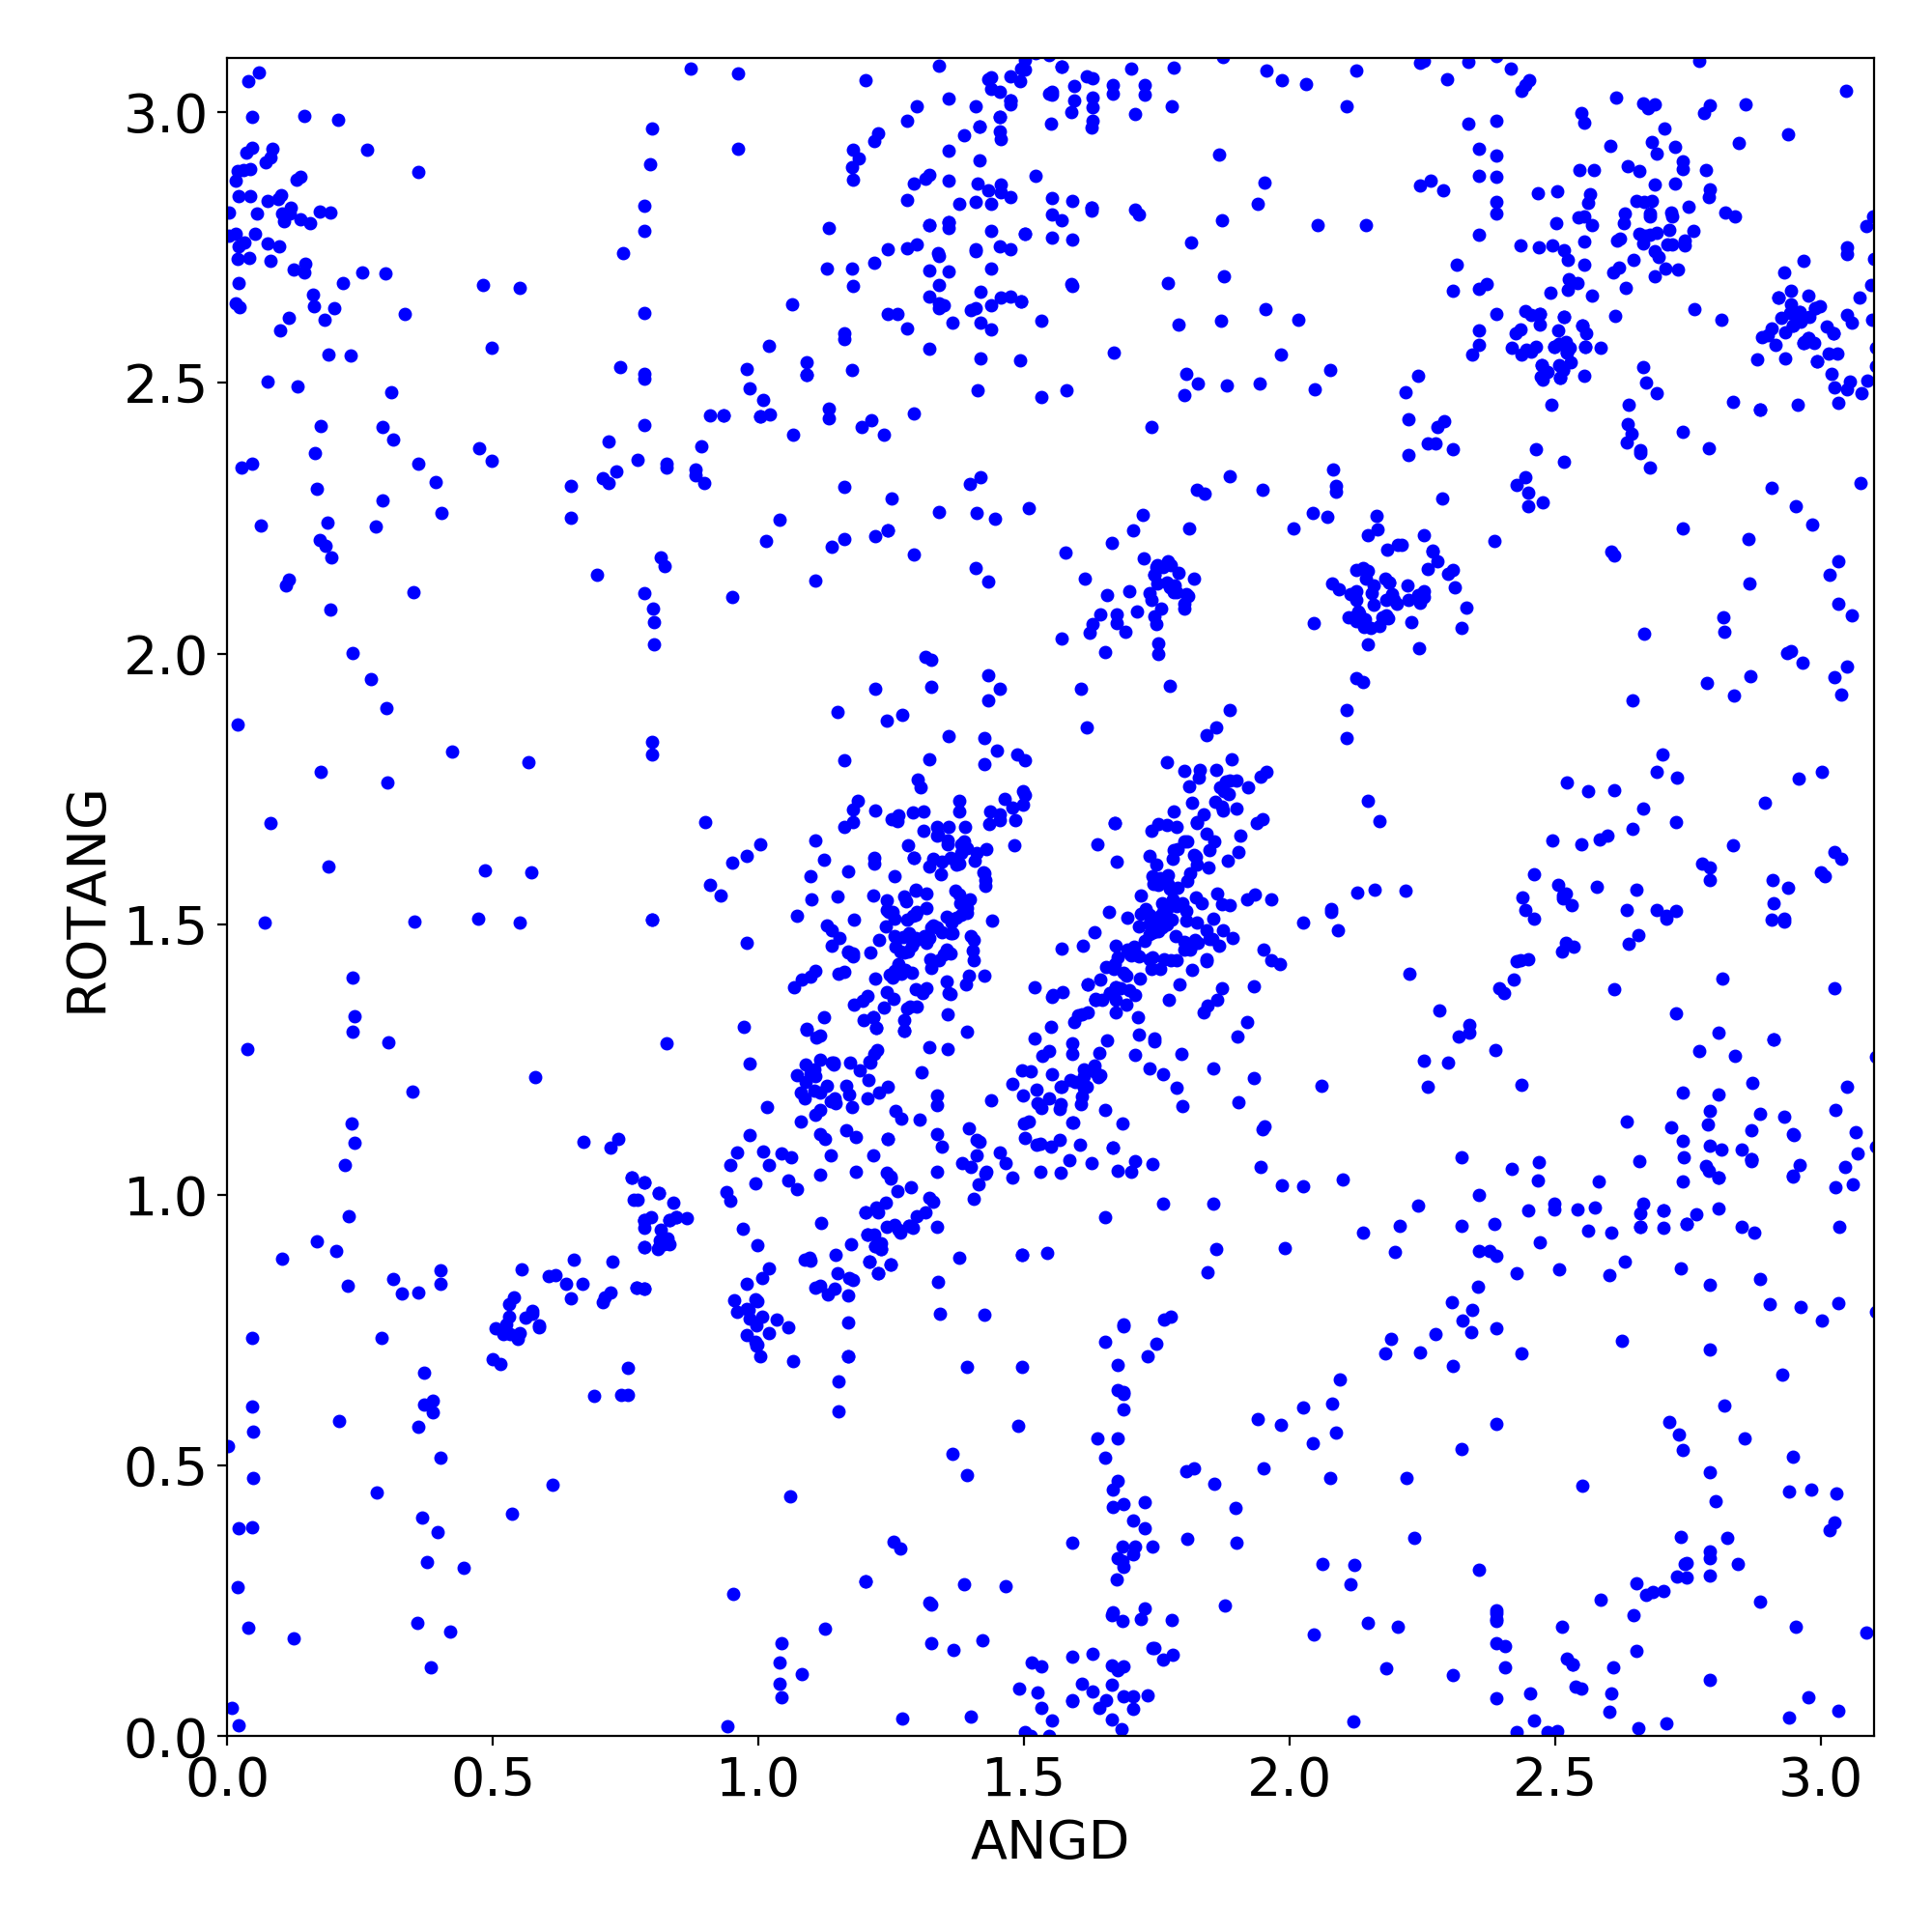
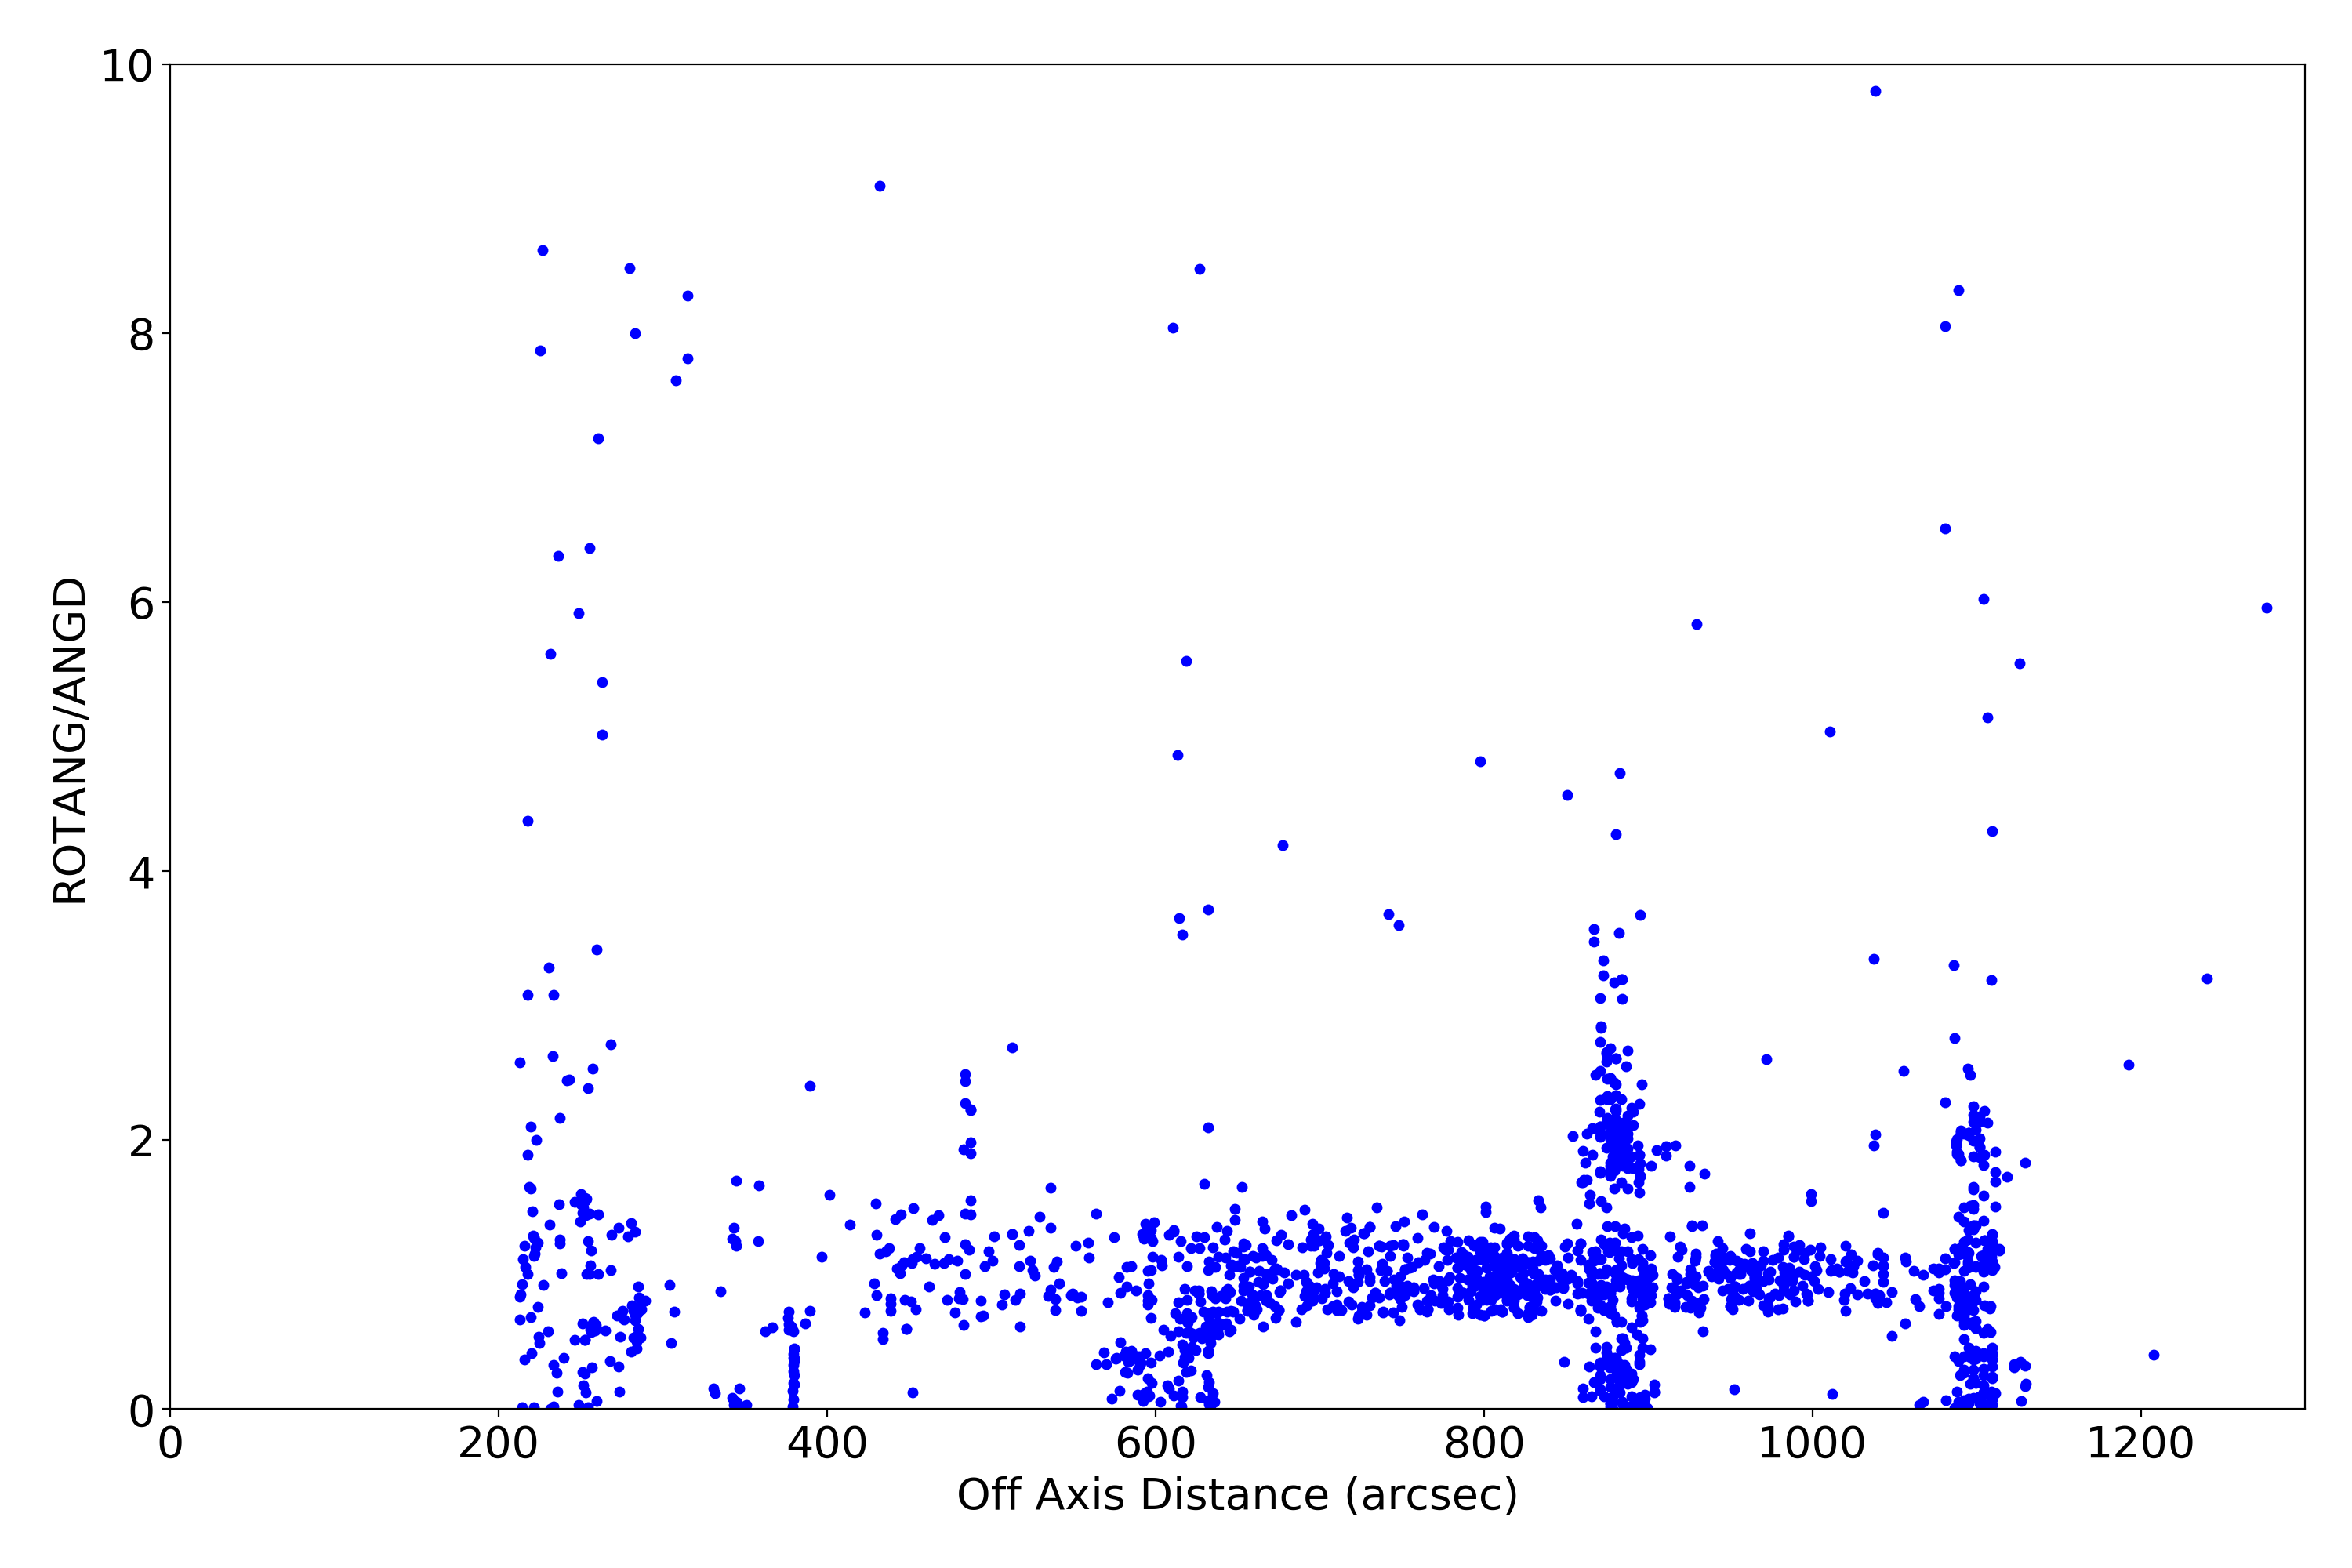
Plots below show various characteristics of detected imaging sources. Standard level 2 data products (*src2.fits) are used. Only observations with focus (sim_x) within 0.01 mm of nominal value for given SI configuration are used. Sources are also filtered for strength (SNR > 15).
| XY | PSF | Roundness | EE Radius | SNR | Rotation | Rotation2 | |
|---|---|---|---|---|---|---|---|
| ACIS I | 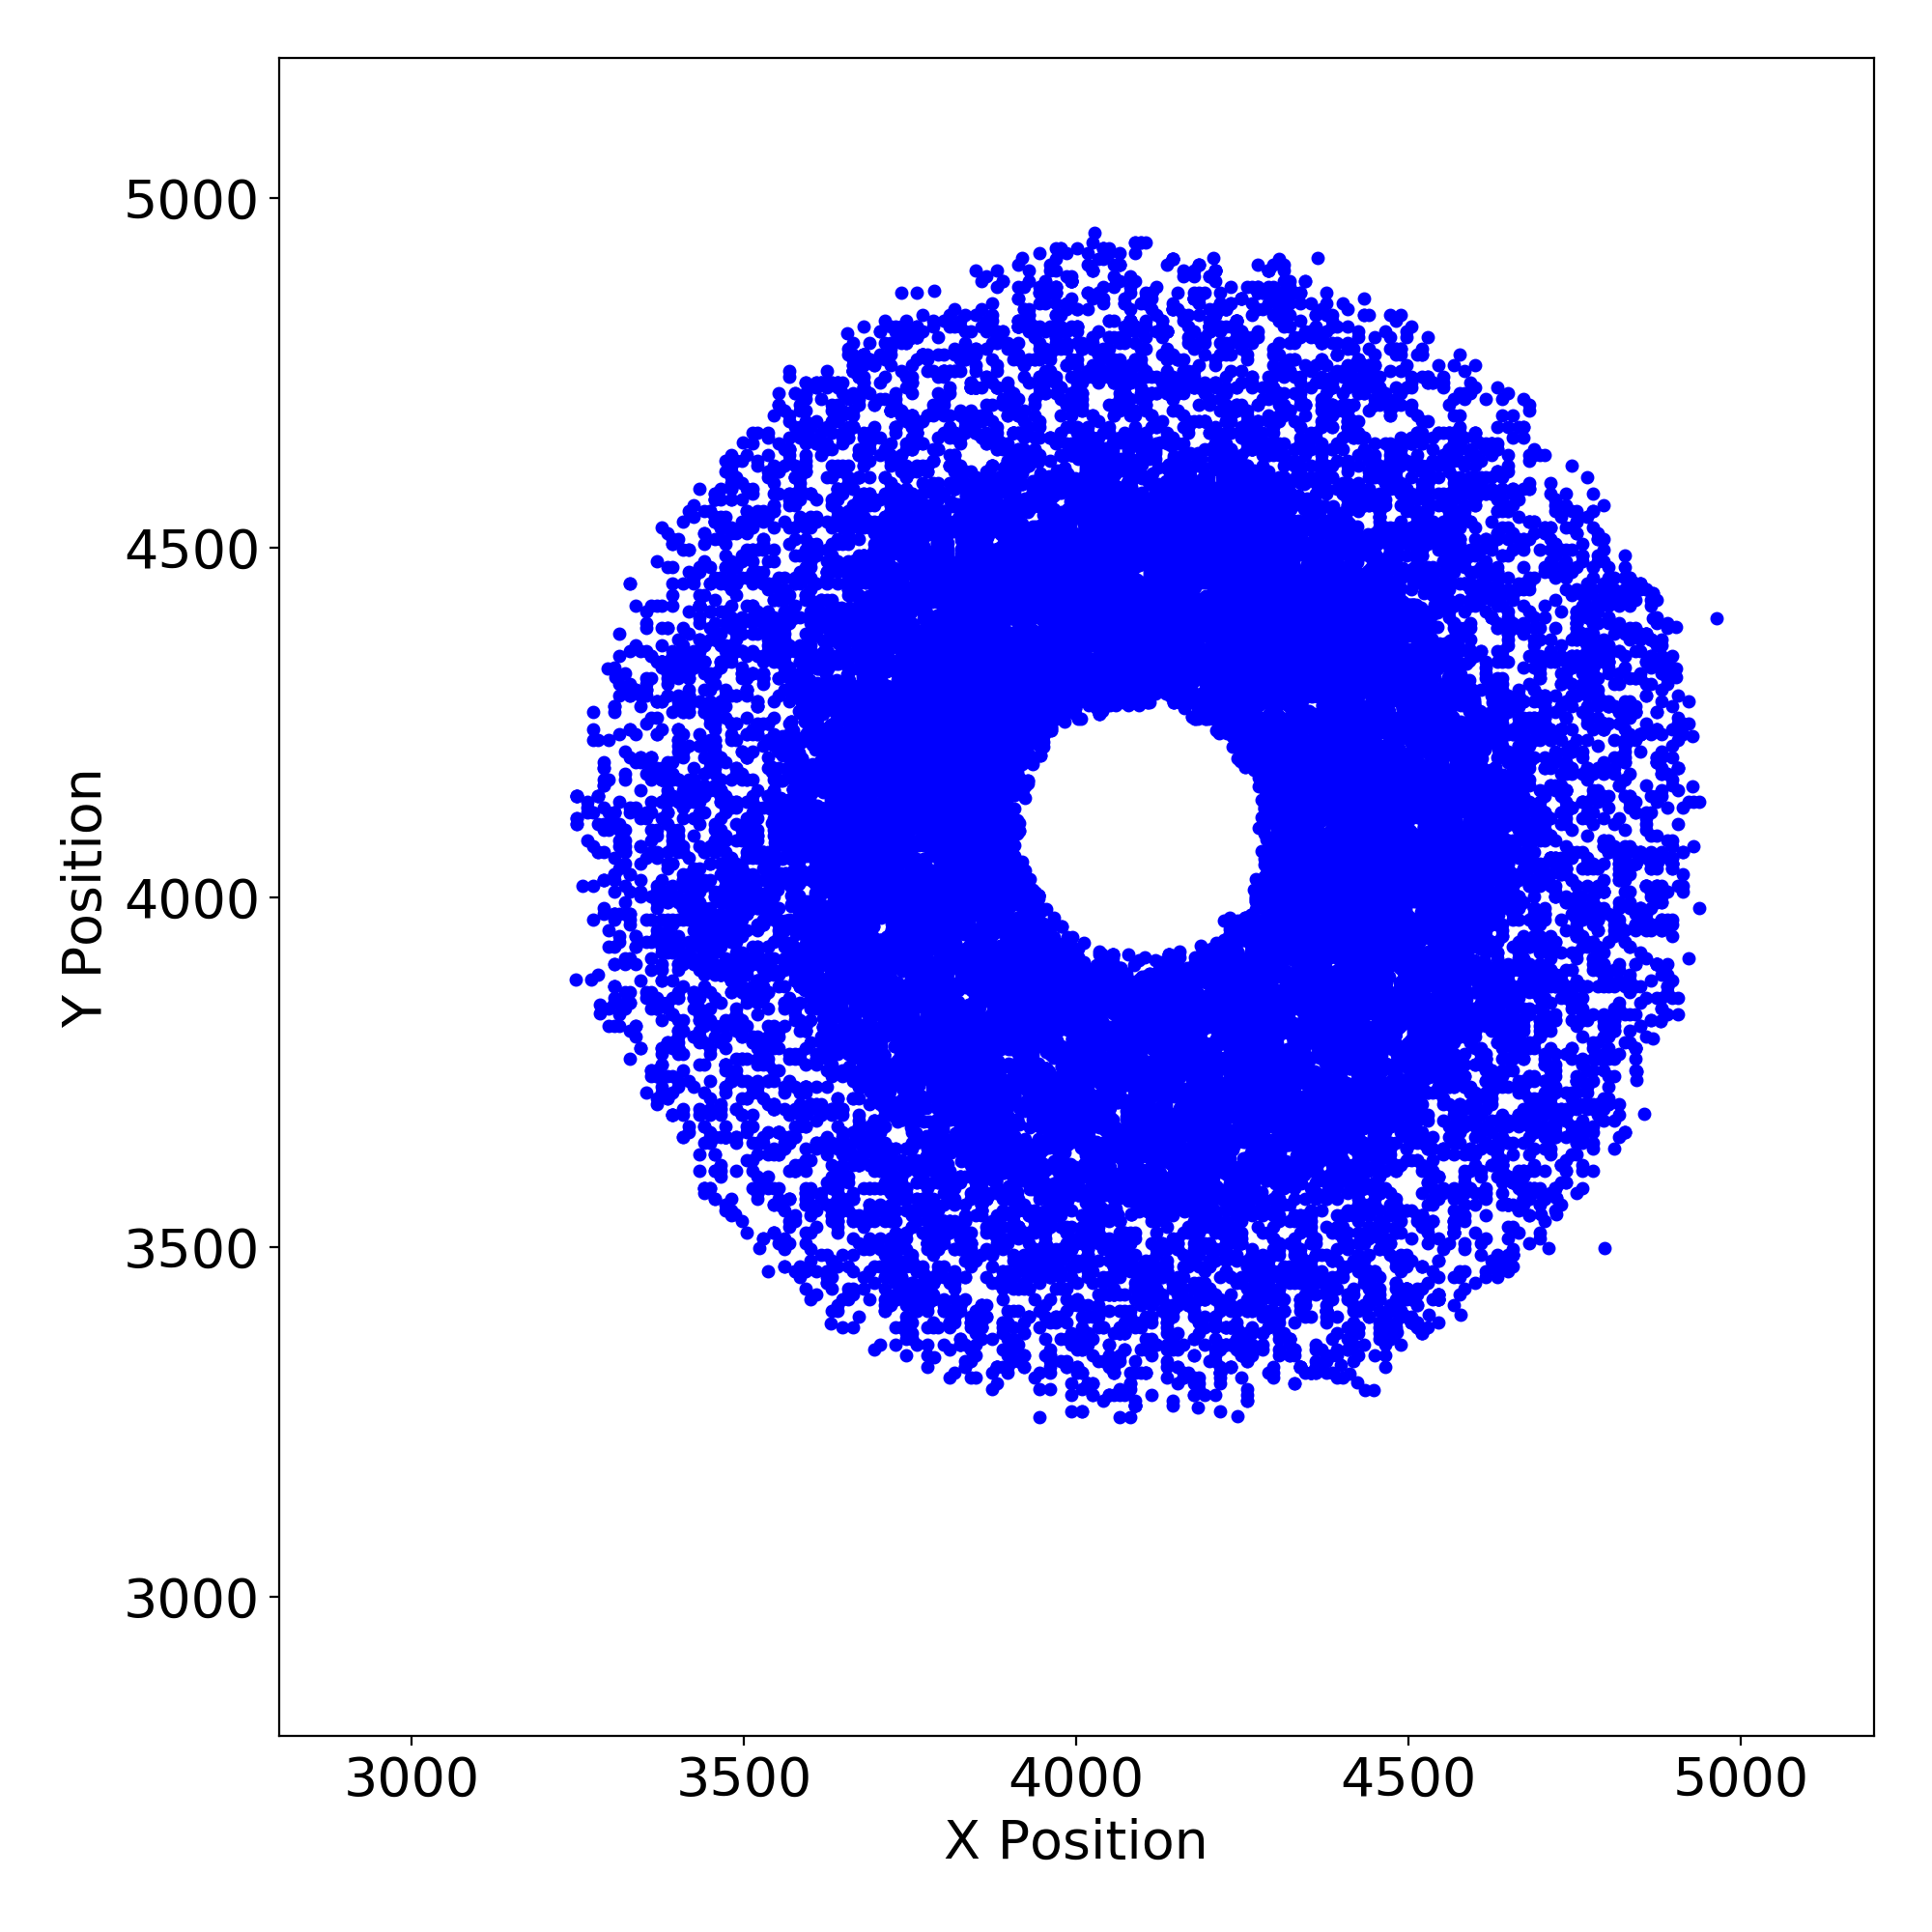 |
 |
 |
 |
 |
 |
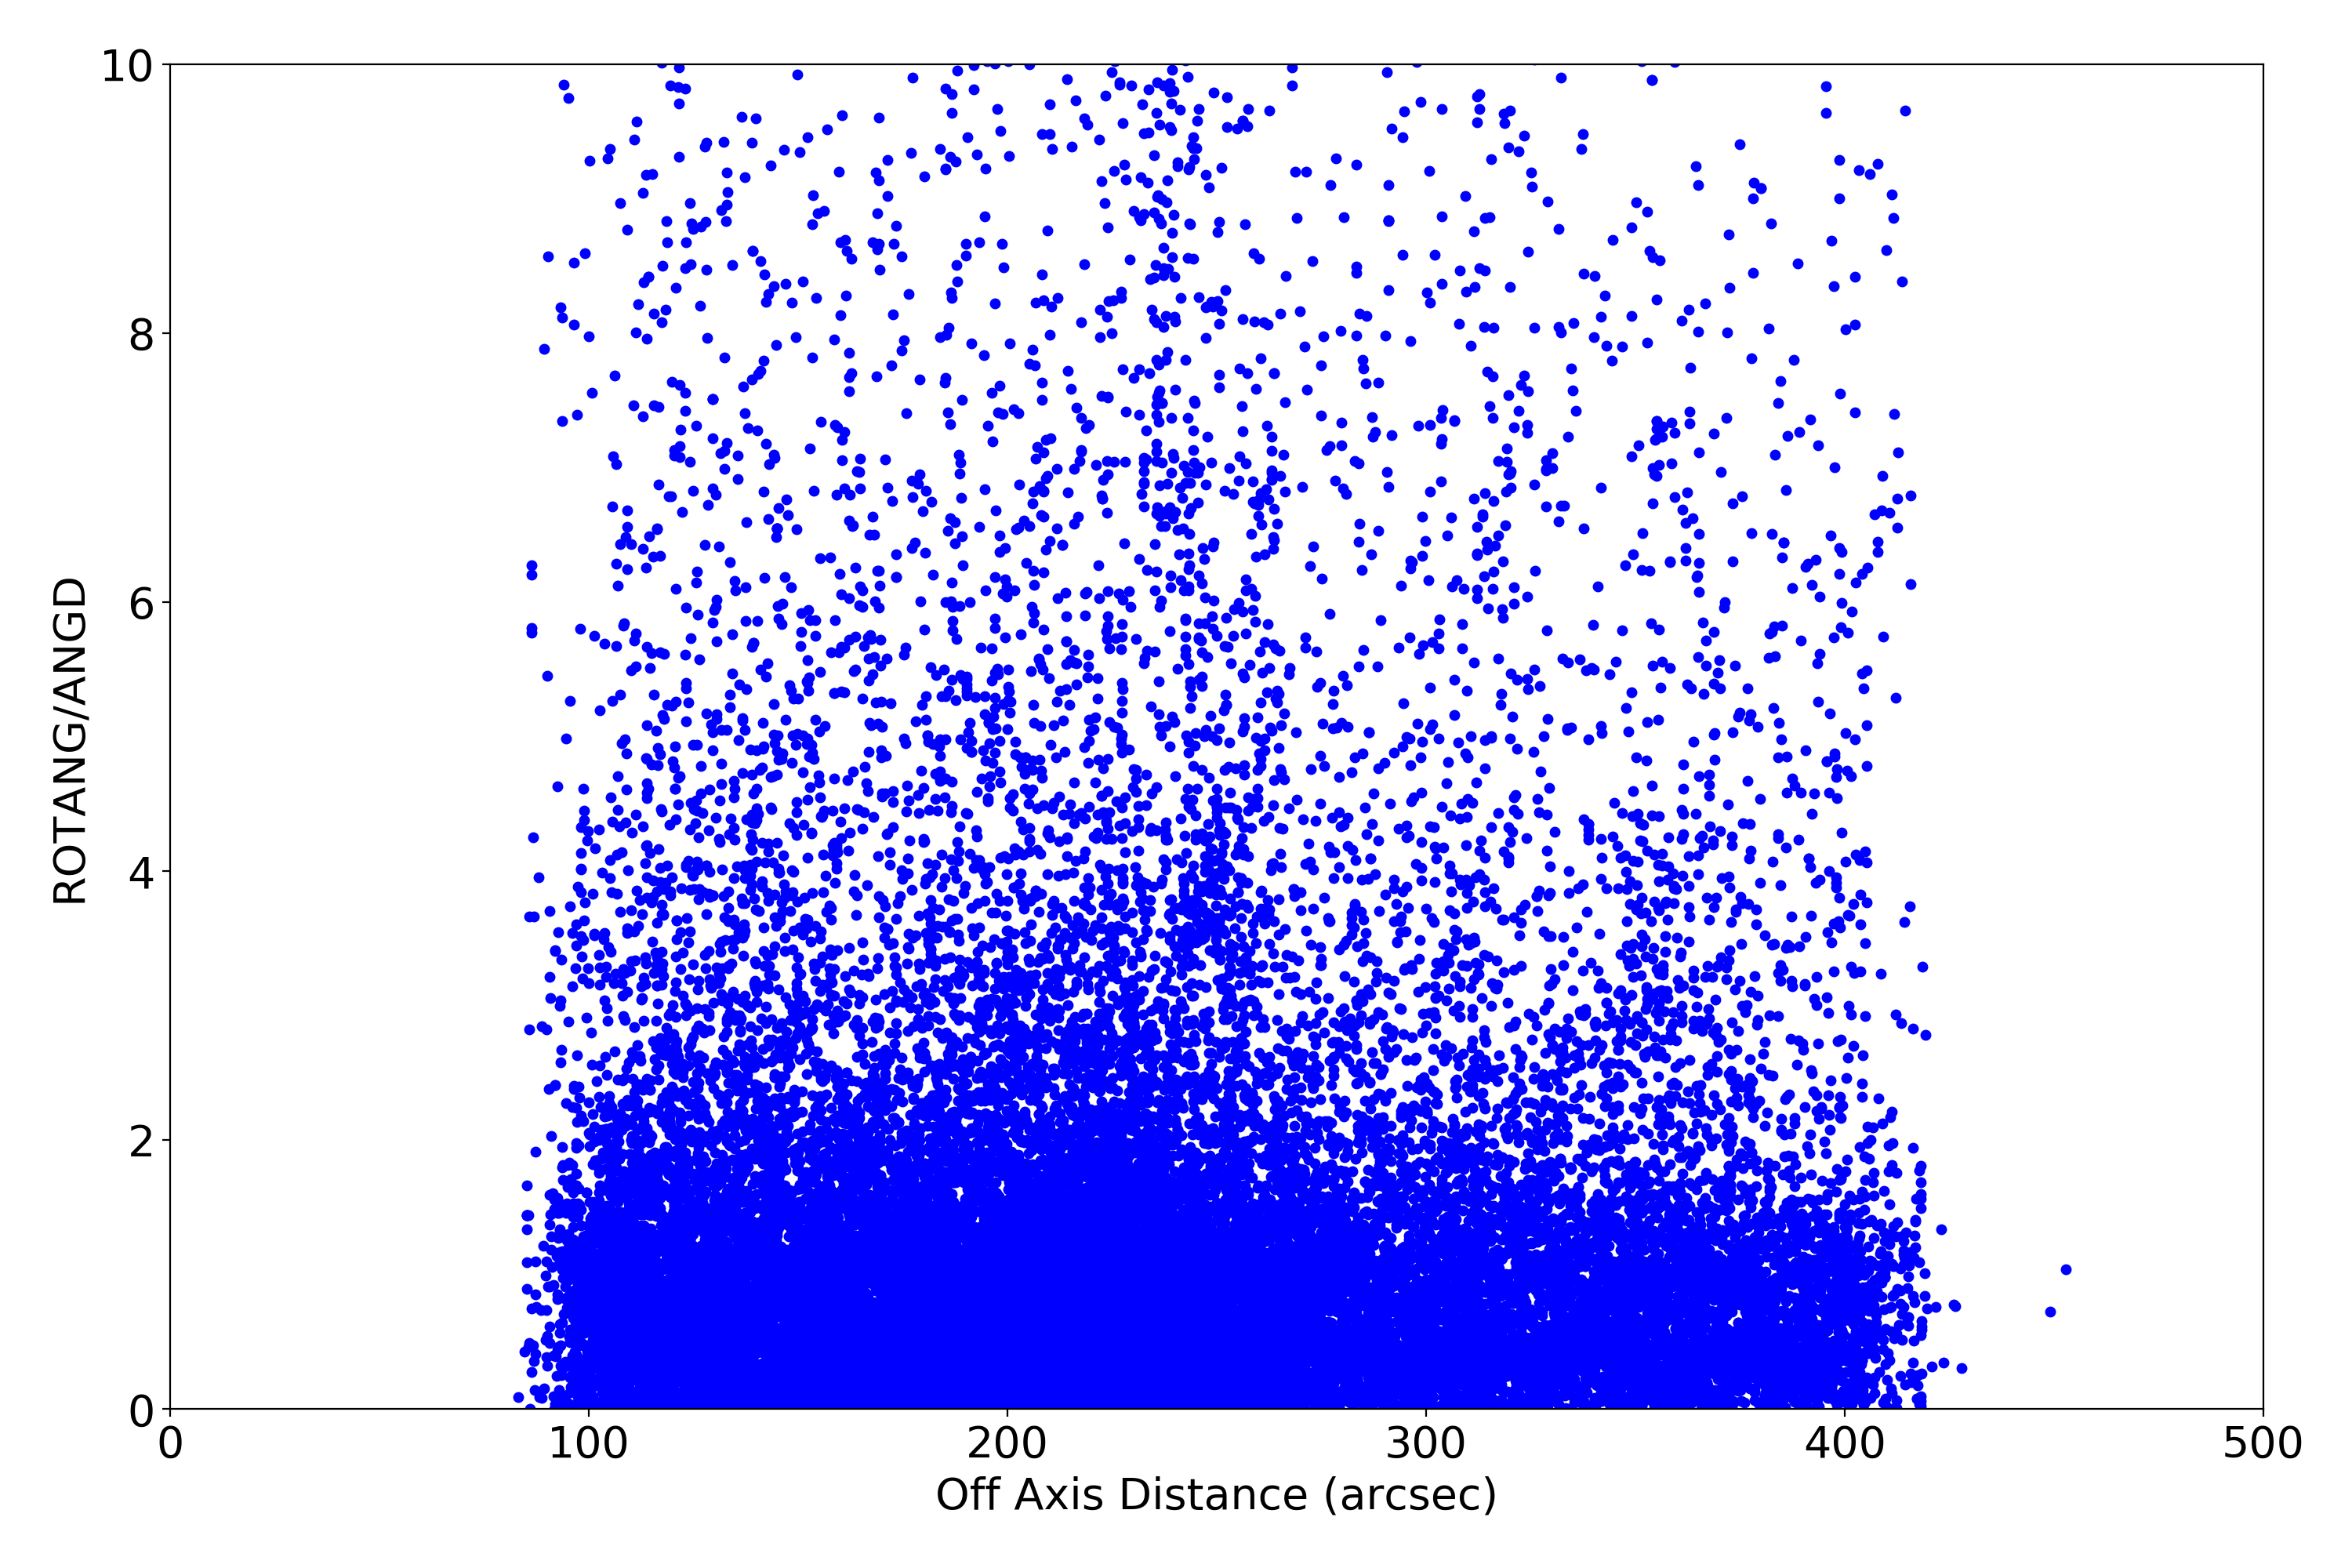 |
| ACIS S | 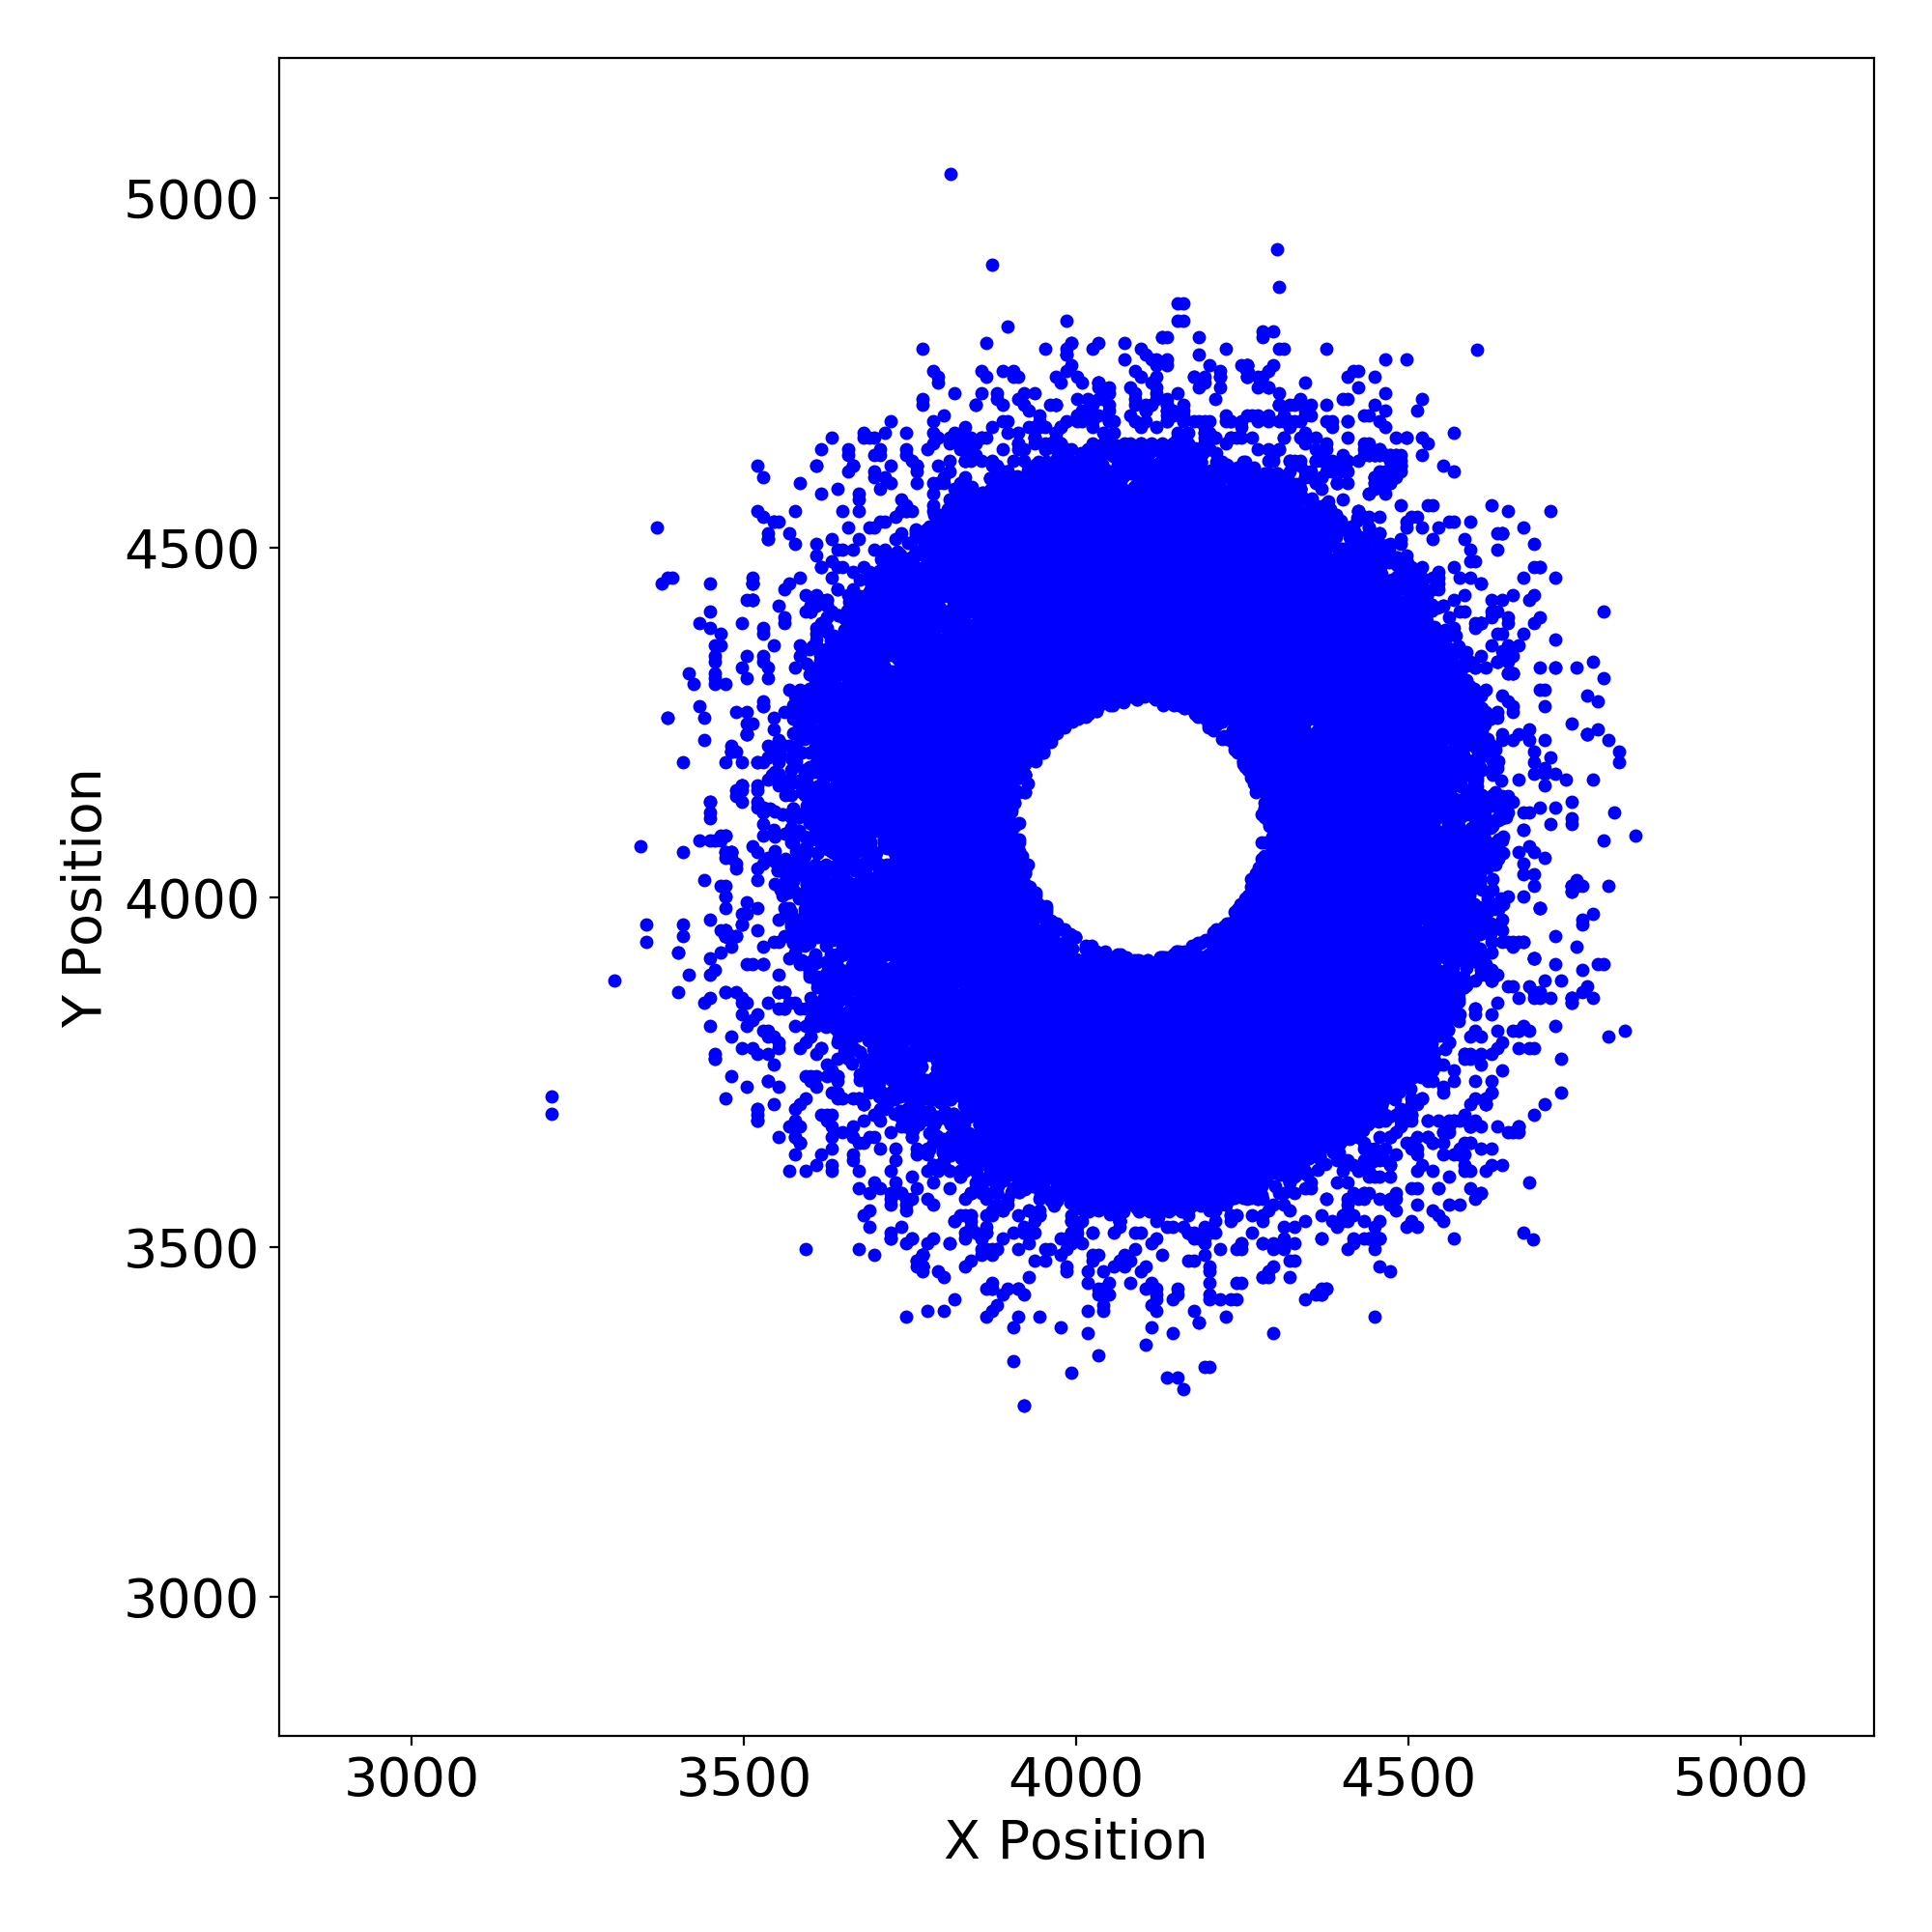 |
 |
 |
 |
 |
 |
 |
| HRC I | 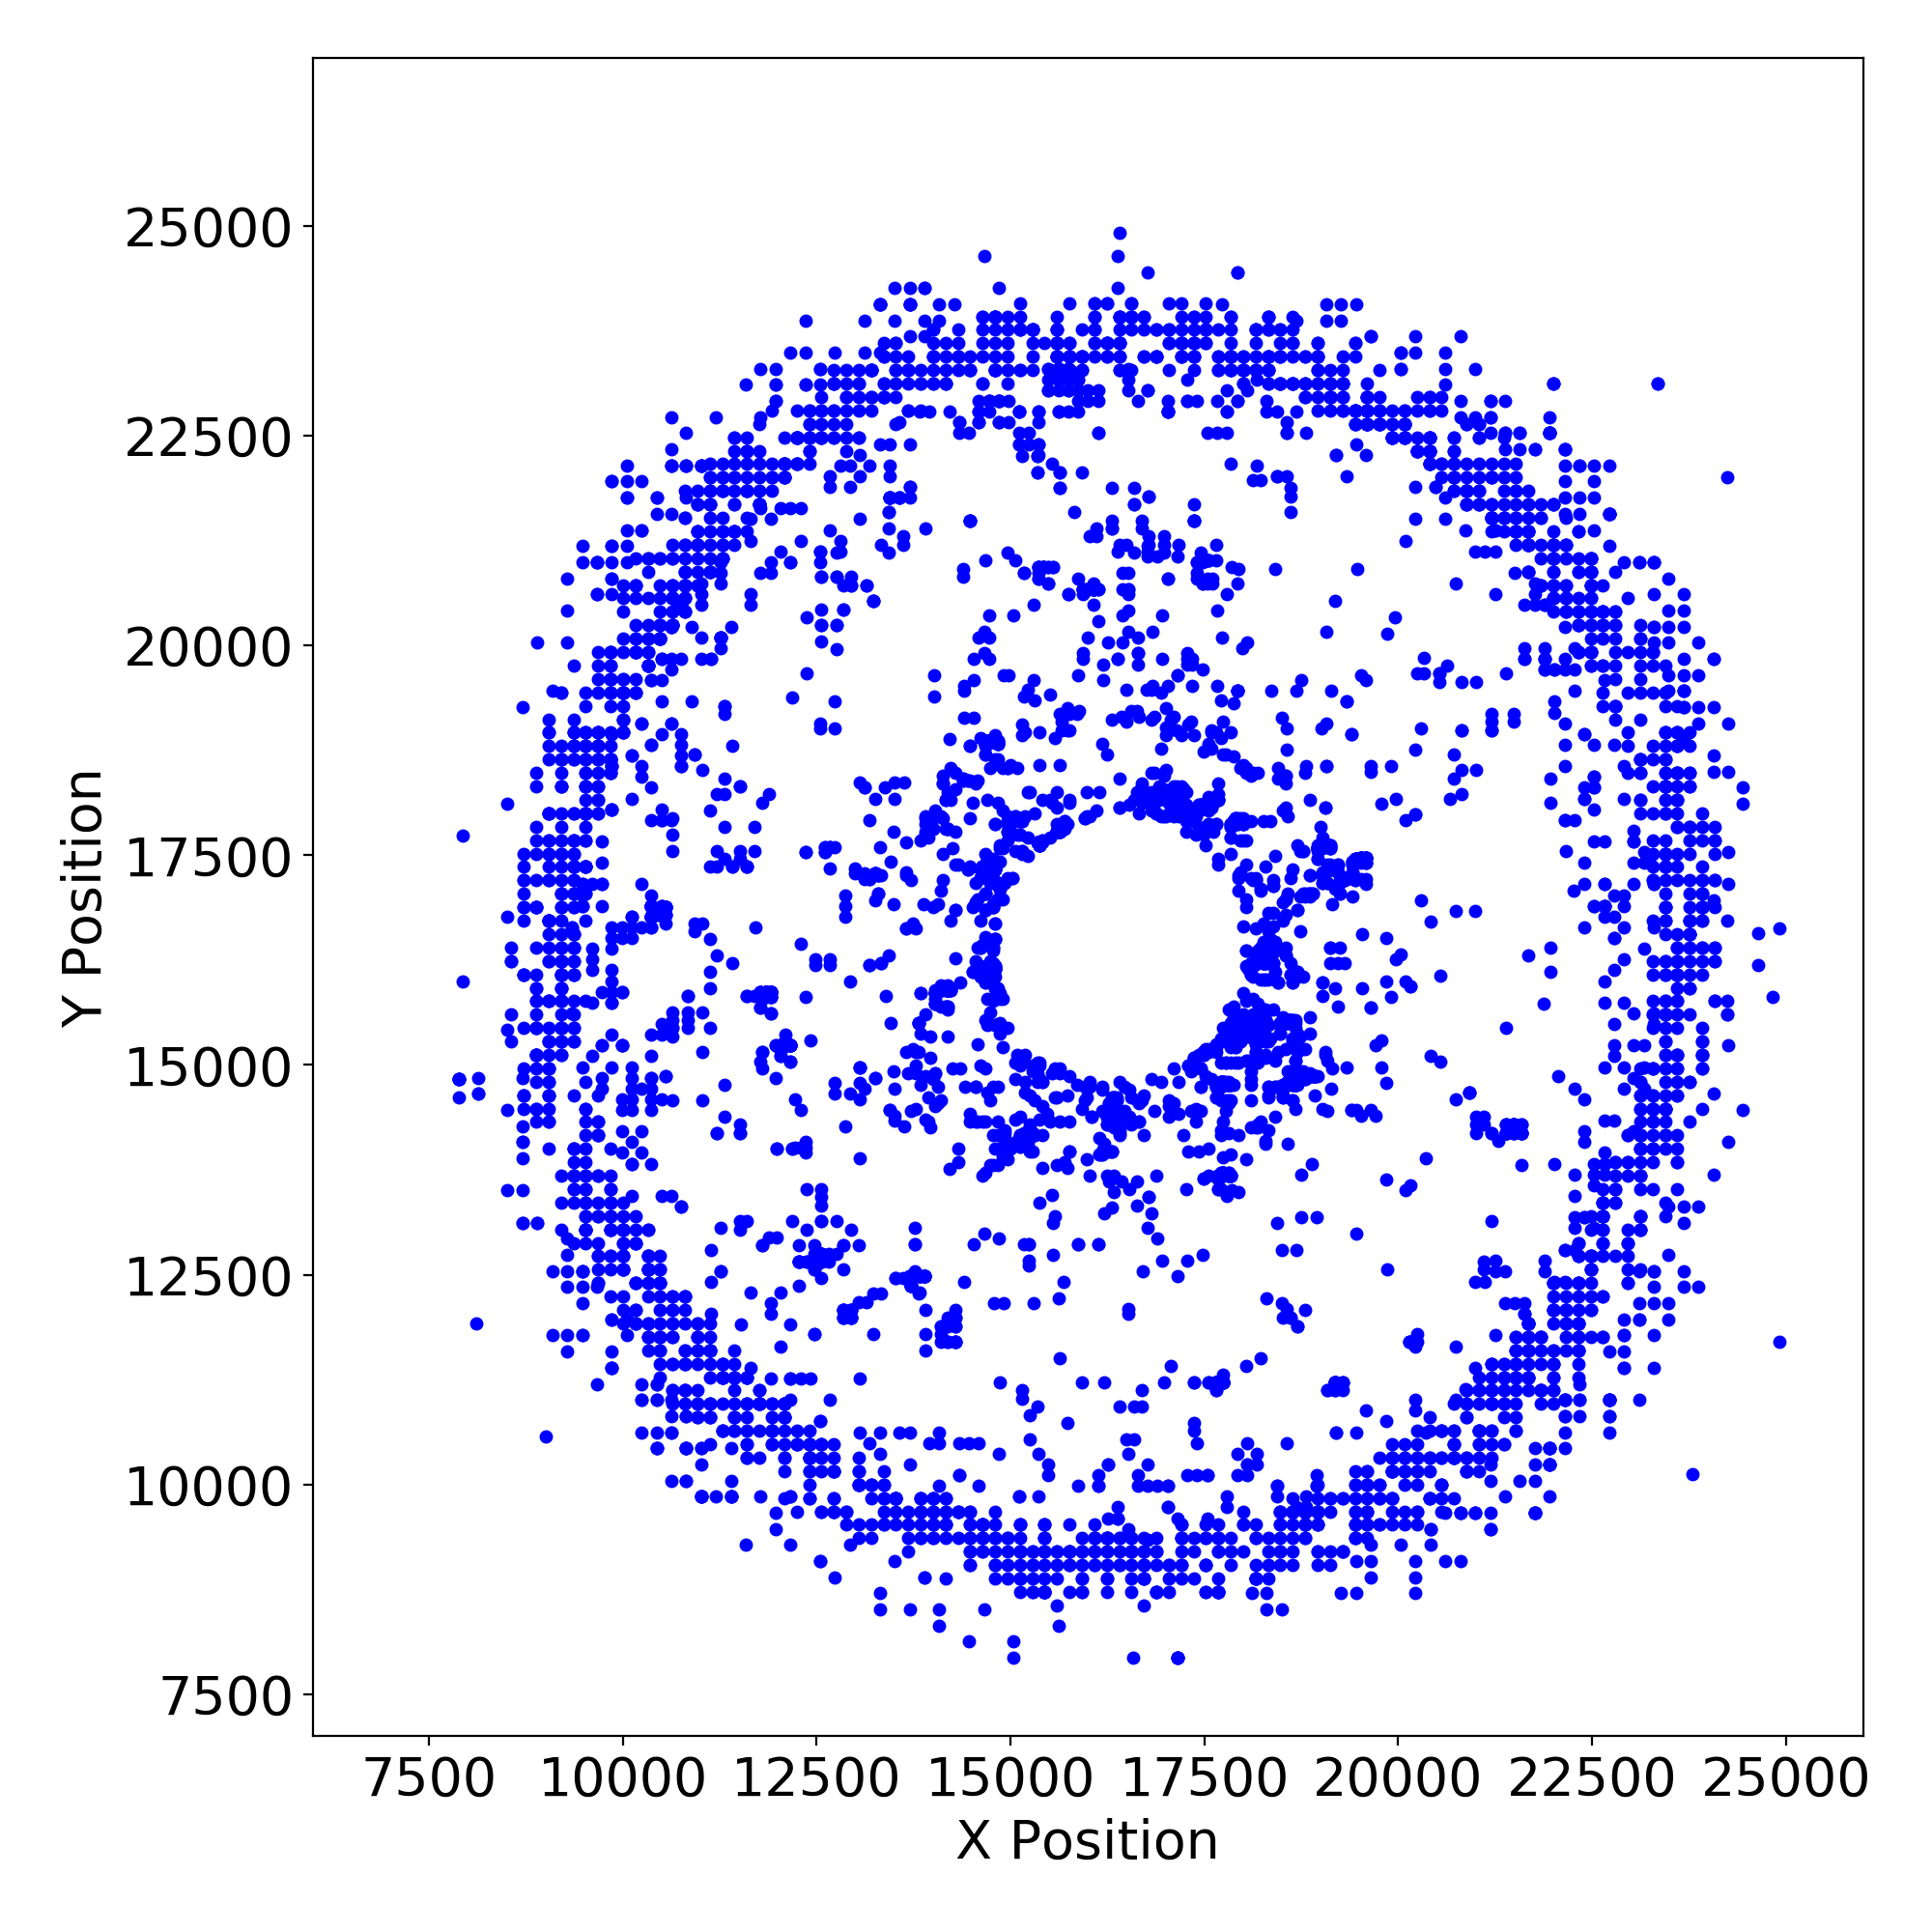 |
 |
 |
 |
 |
 |
 |
| HRC S | 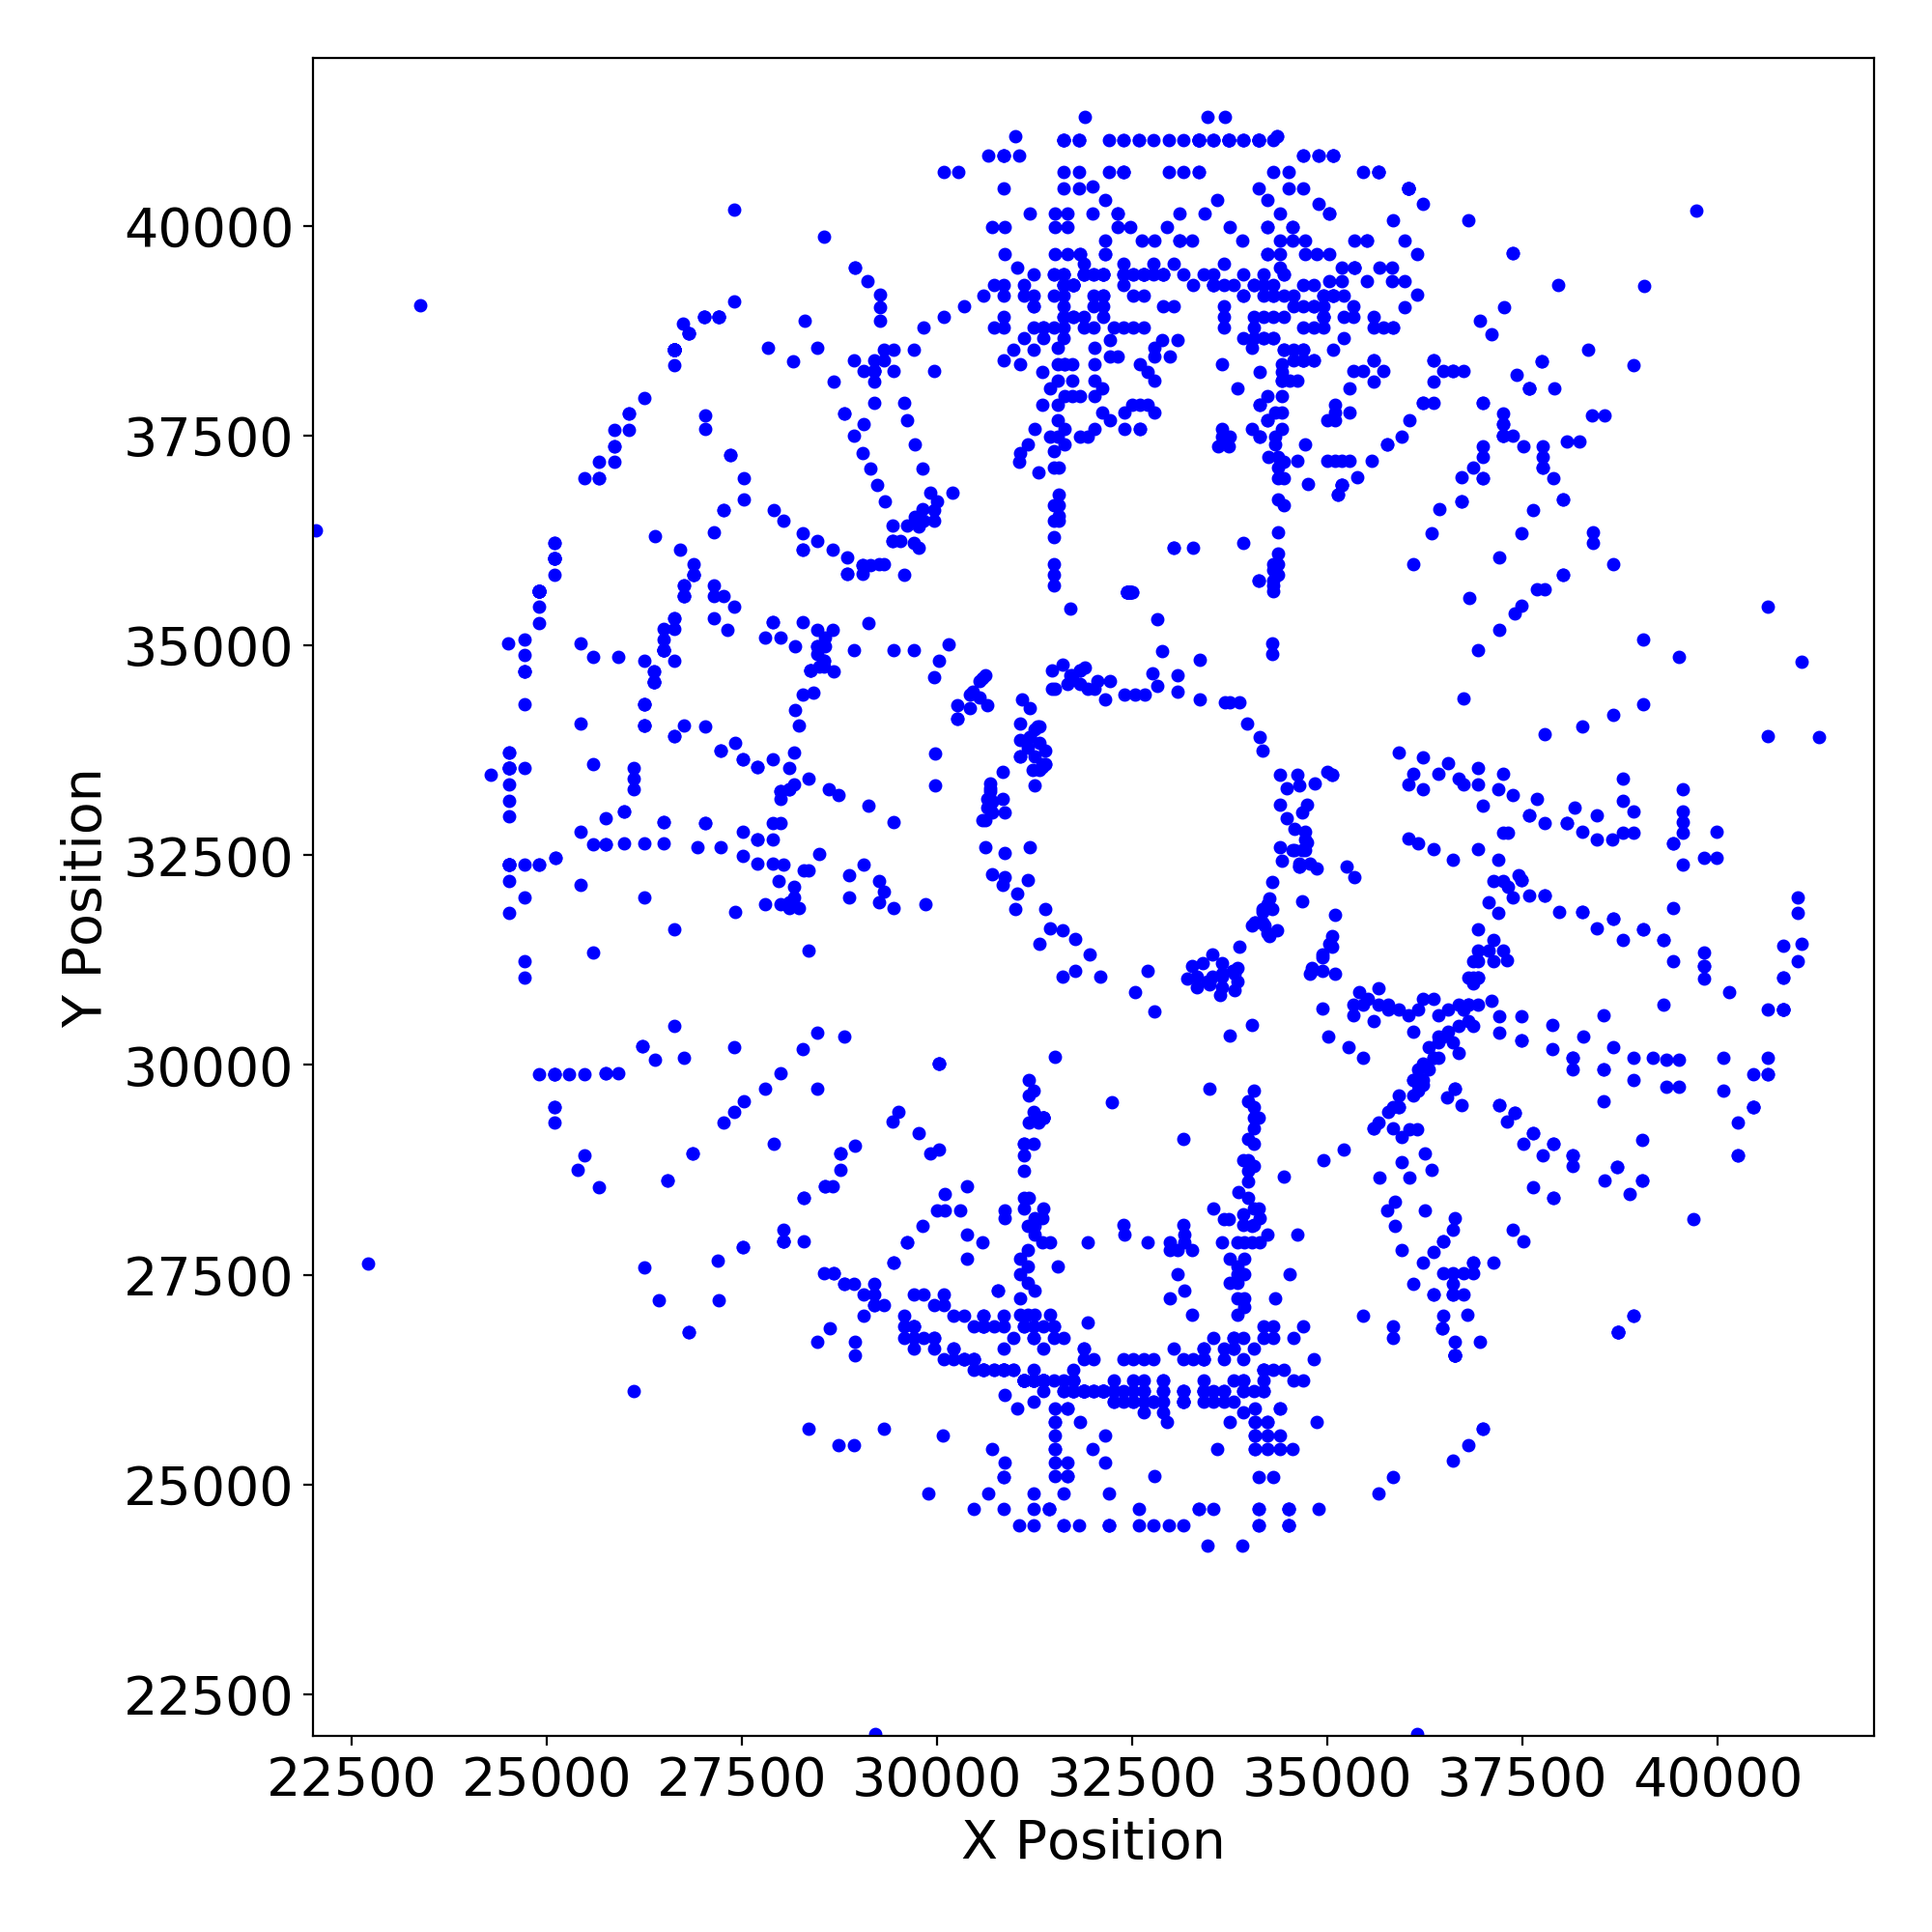 |
 |
 |
 |
 |
 |
 |
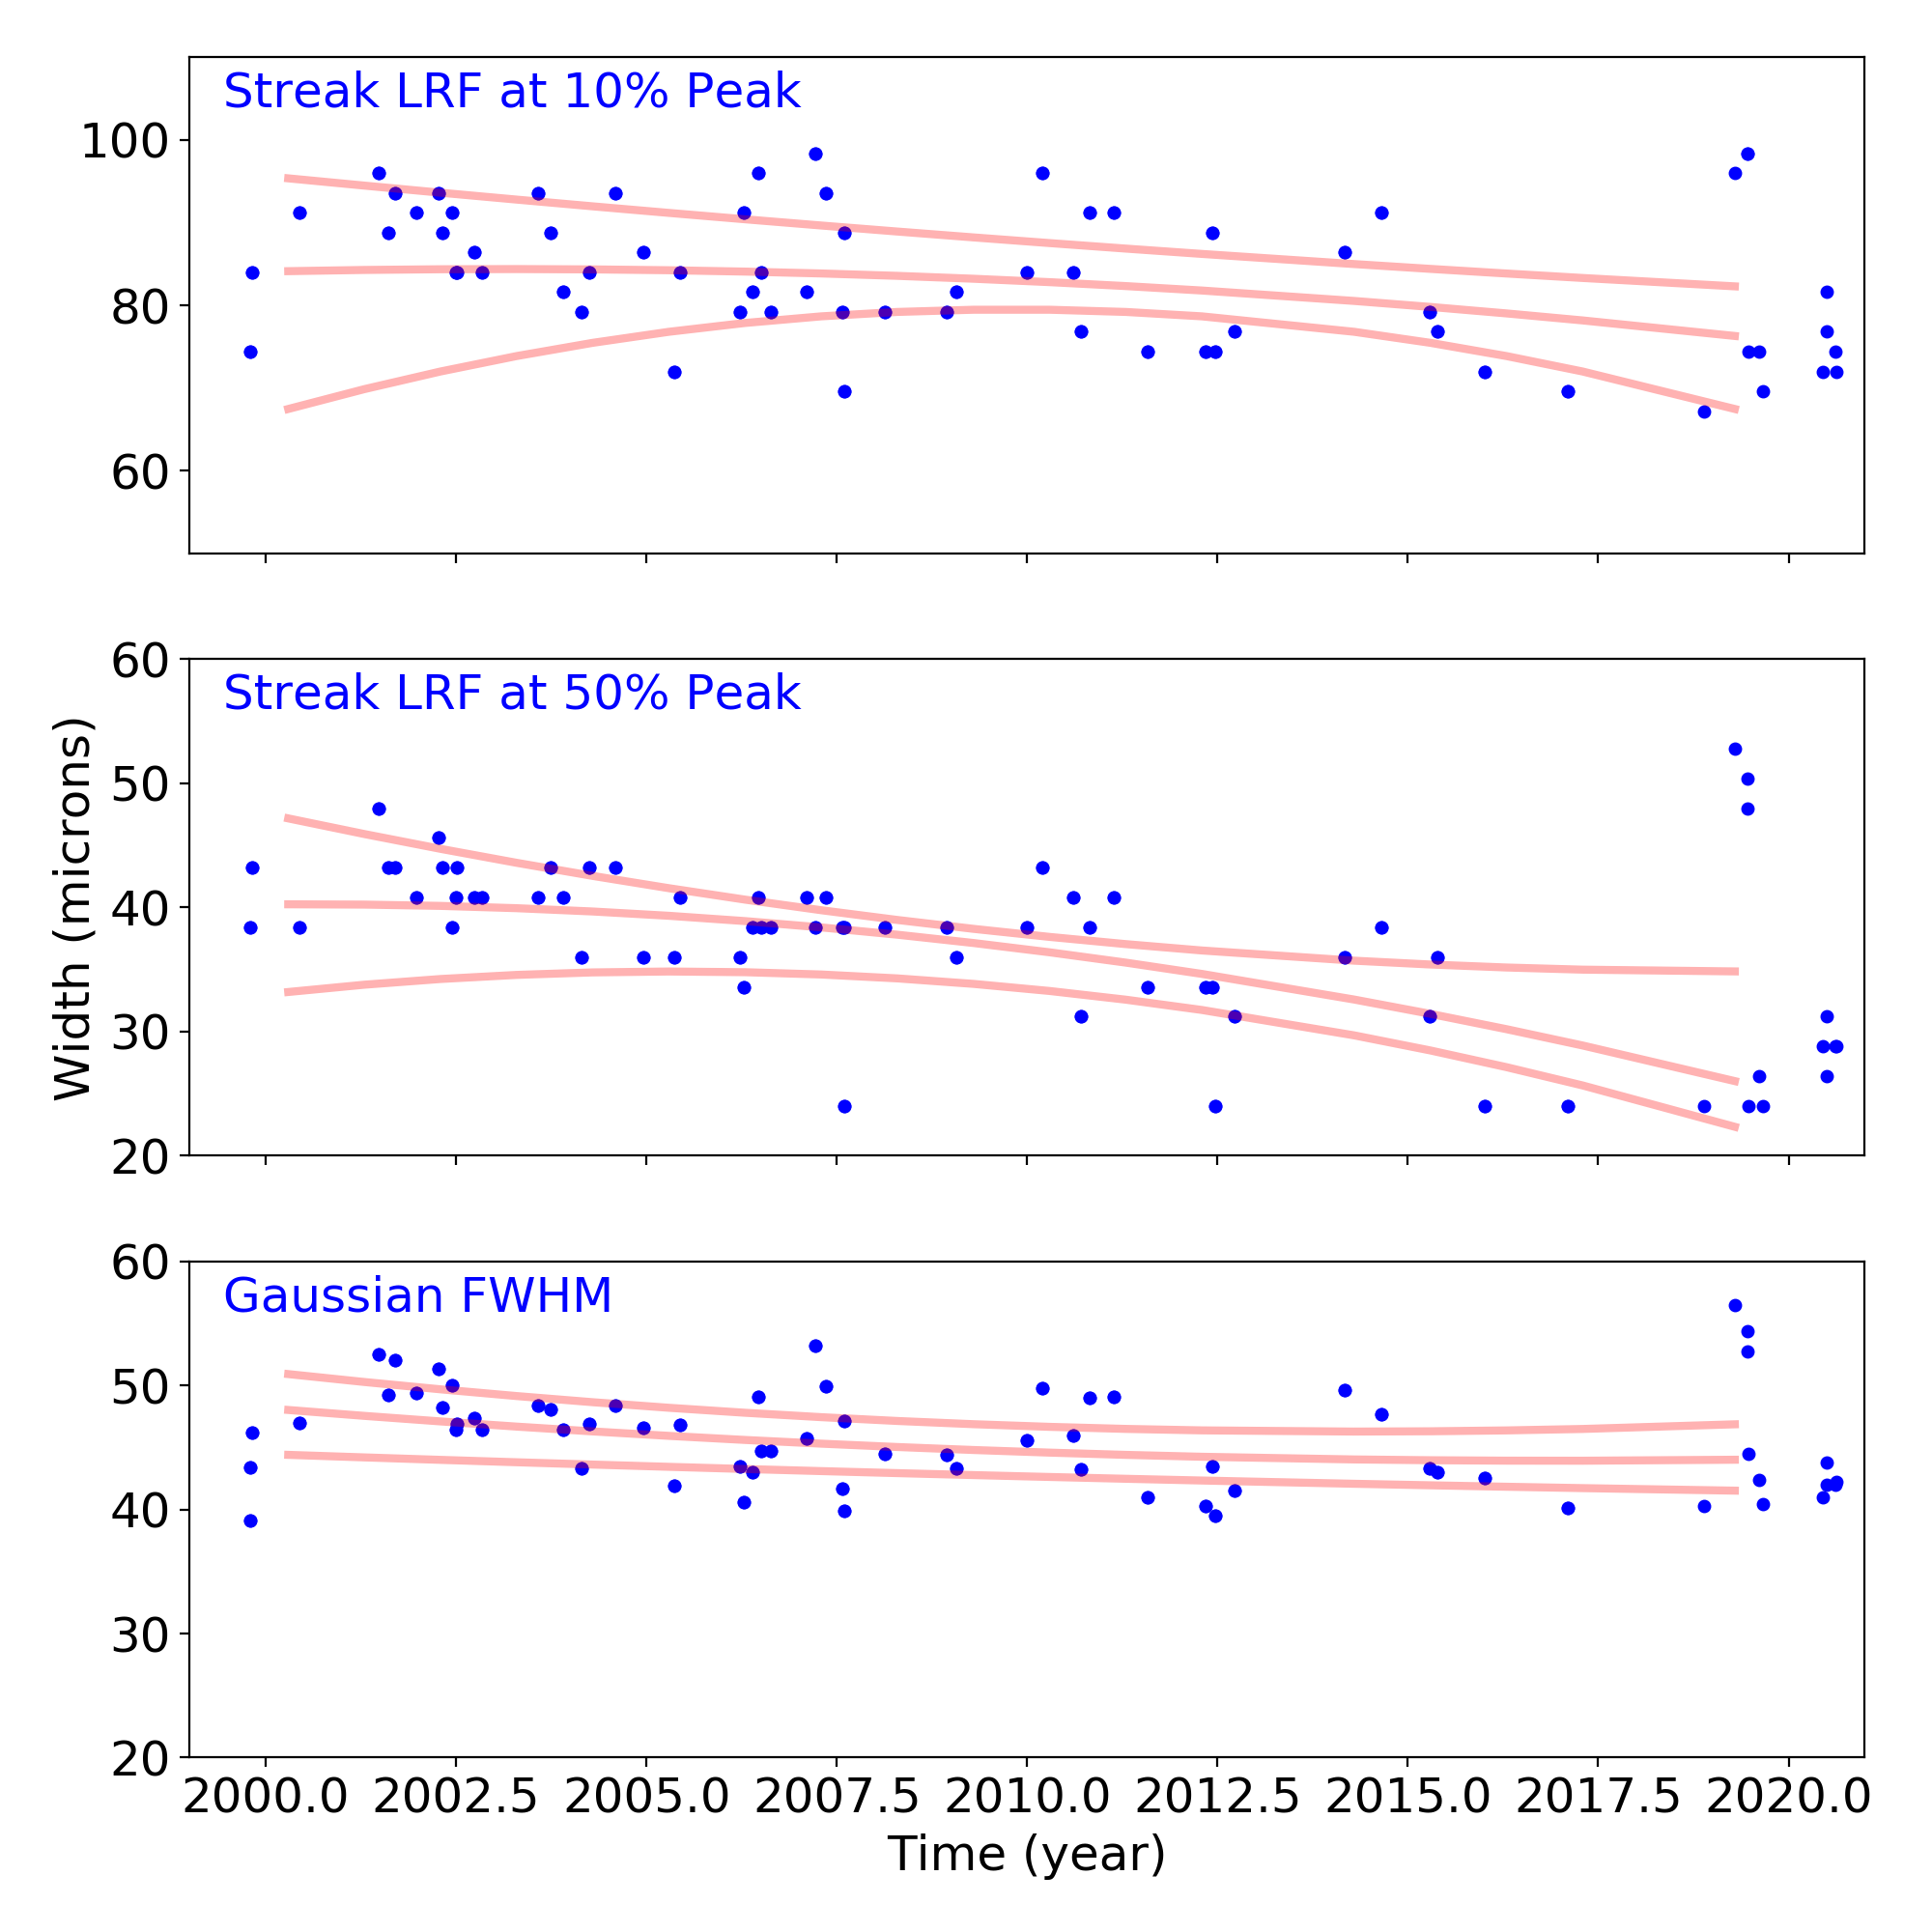
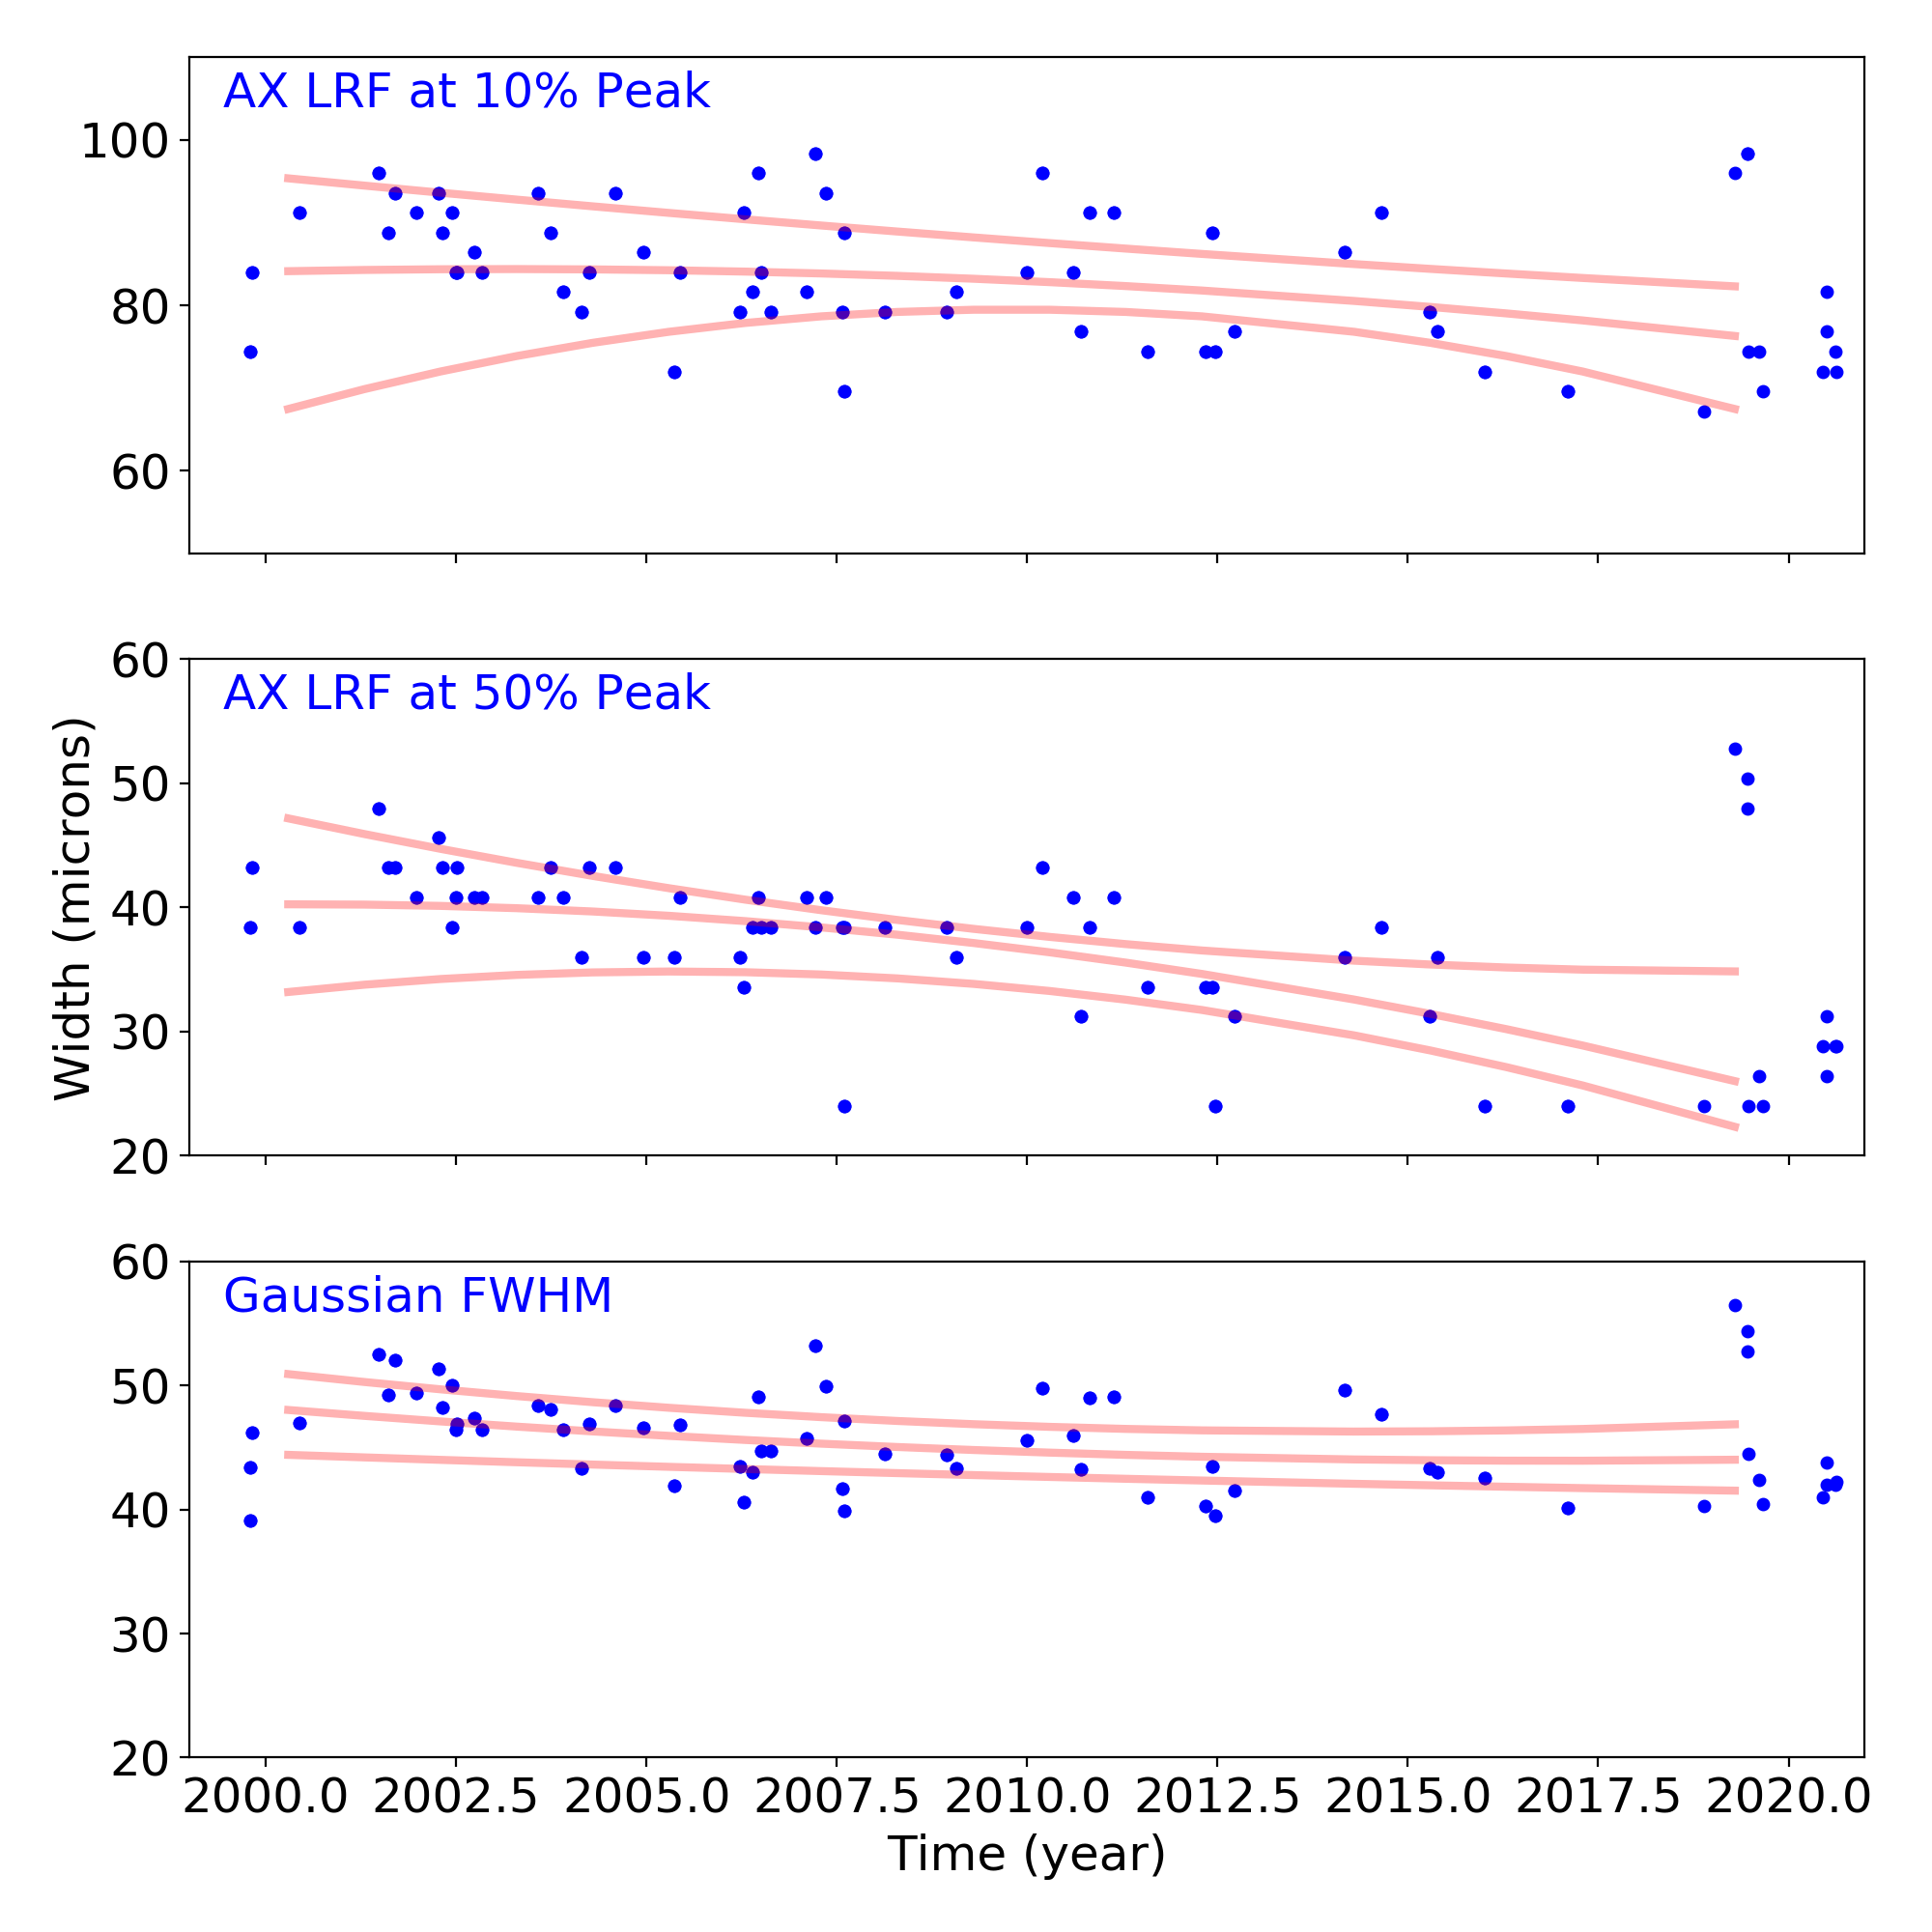
Gratings
Grating Trends/Focus
We plot the width of the zero order streak of ACIS/HETG observations and the width of the zero order image for HRC/LETG observations of point sources. No significant defocusing trend is seen at this time. See Gratings Trends pages.
PCAD
ACA Trending
| ACIS |
)
|
)
|
)
|
|
|---|---|---|---|---|
)
|
)
|
)
| ||
| HRCI |
)
|
)
|
)
|
)
|
| HRCI |
)
|
)
|
)
|
)
|
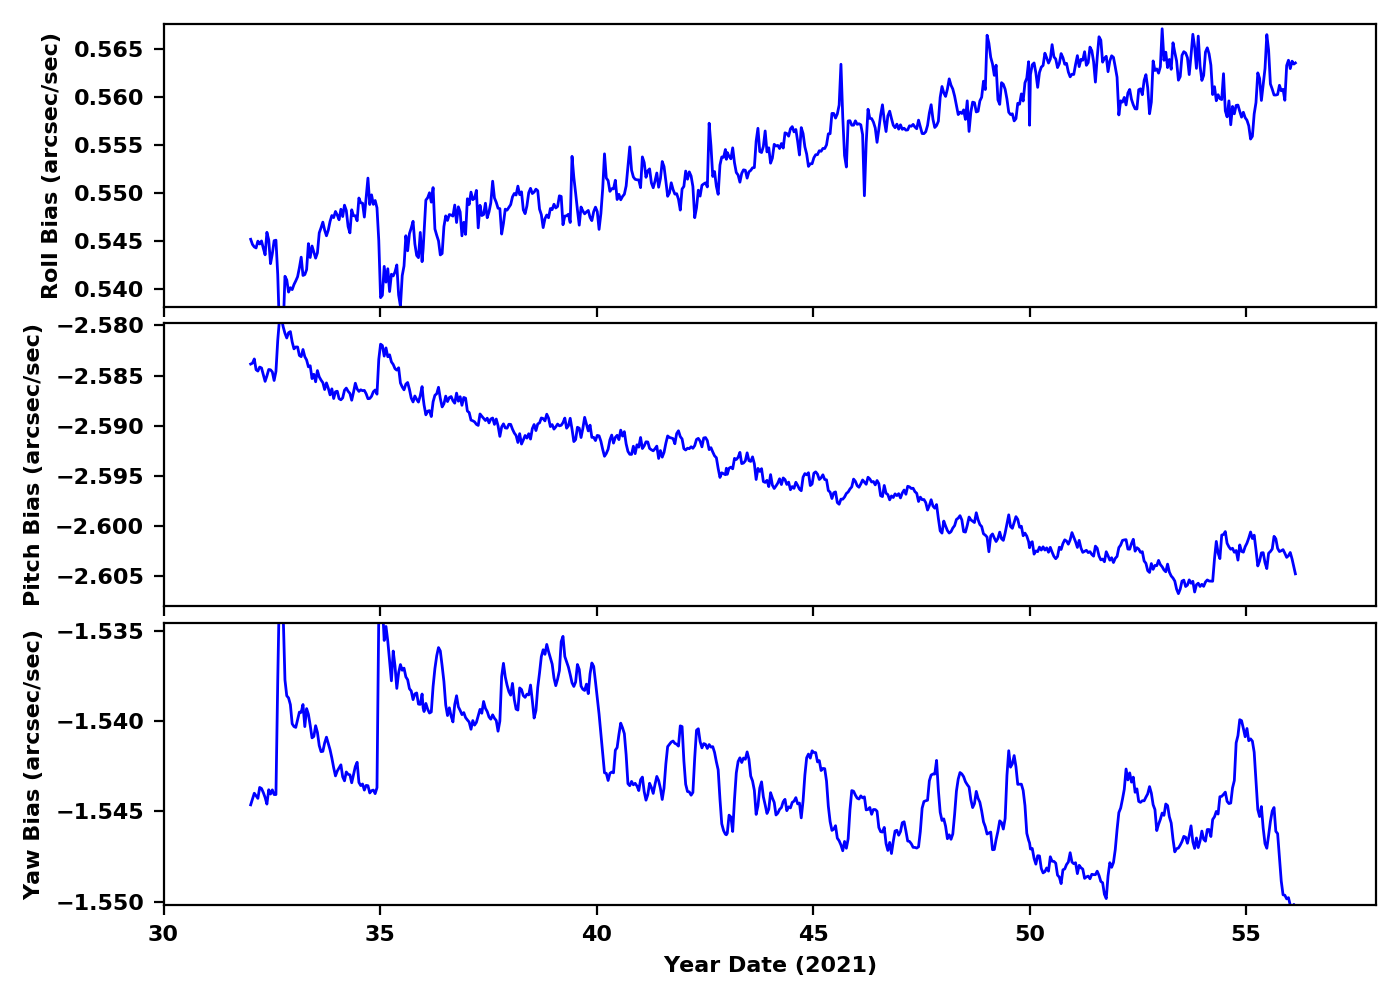
Gyro Bias Drift
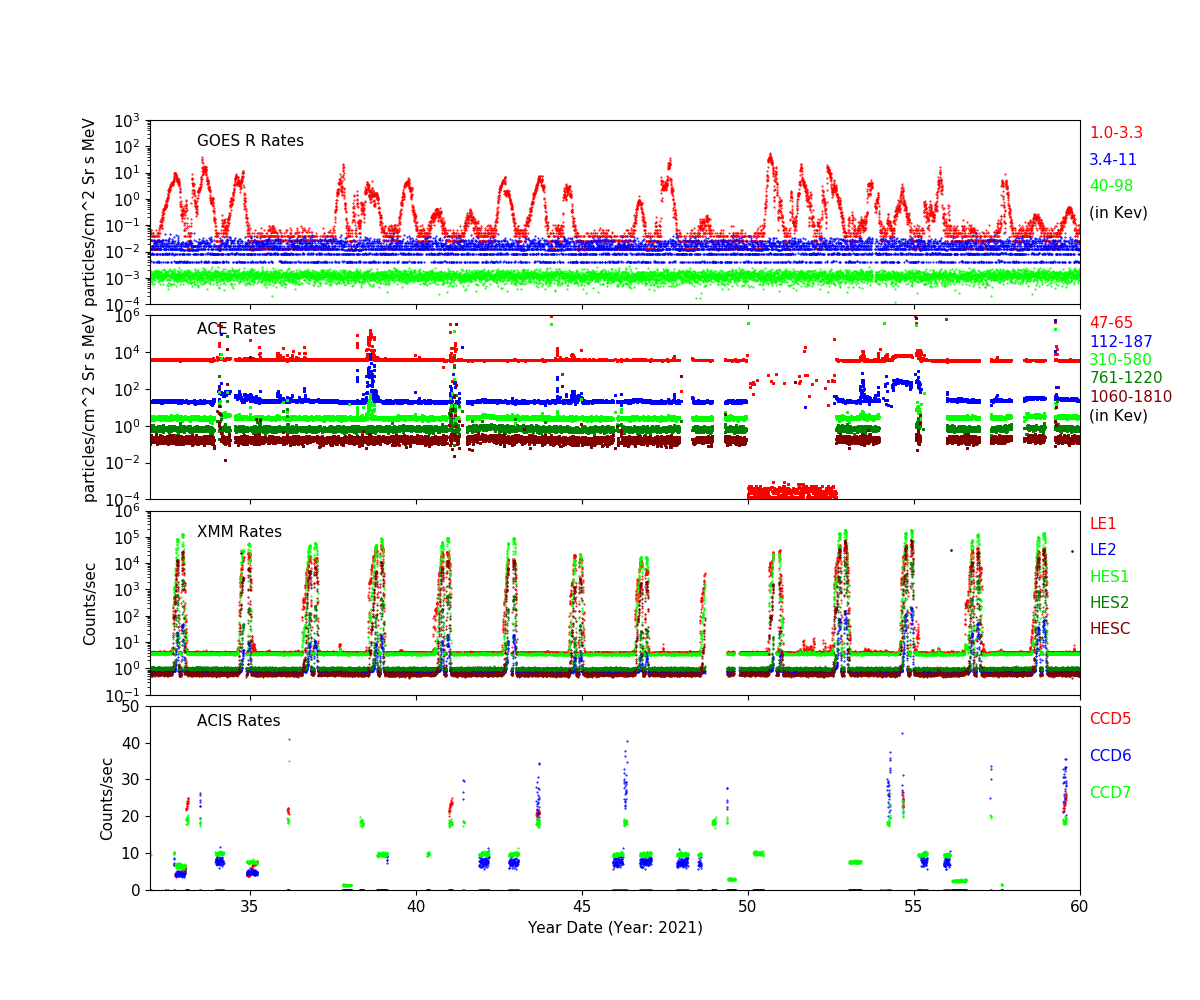
Radiation History
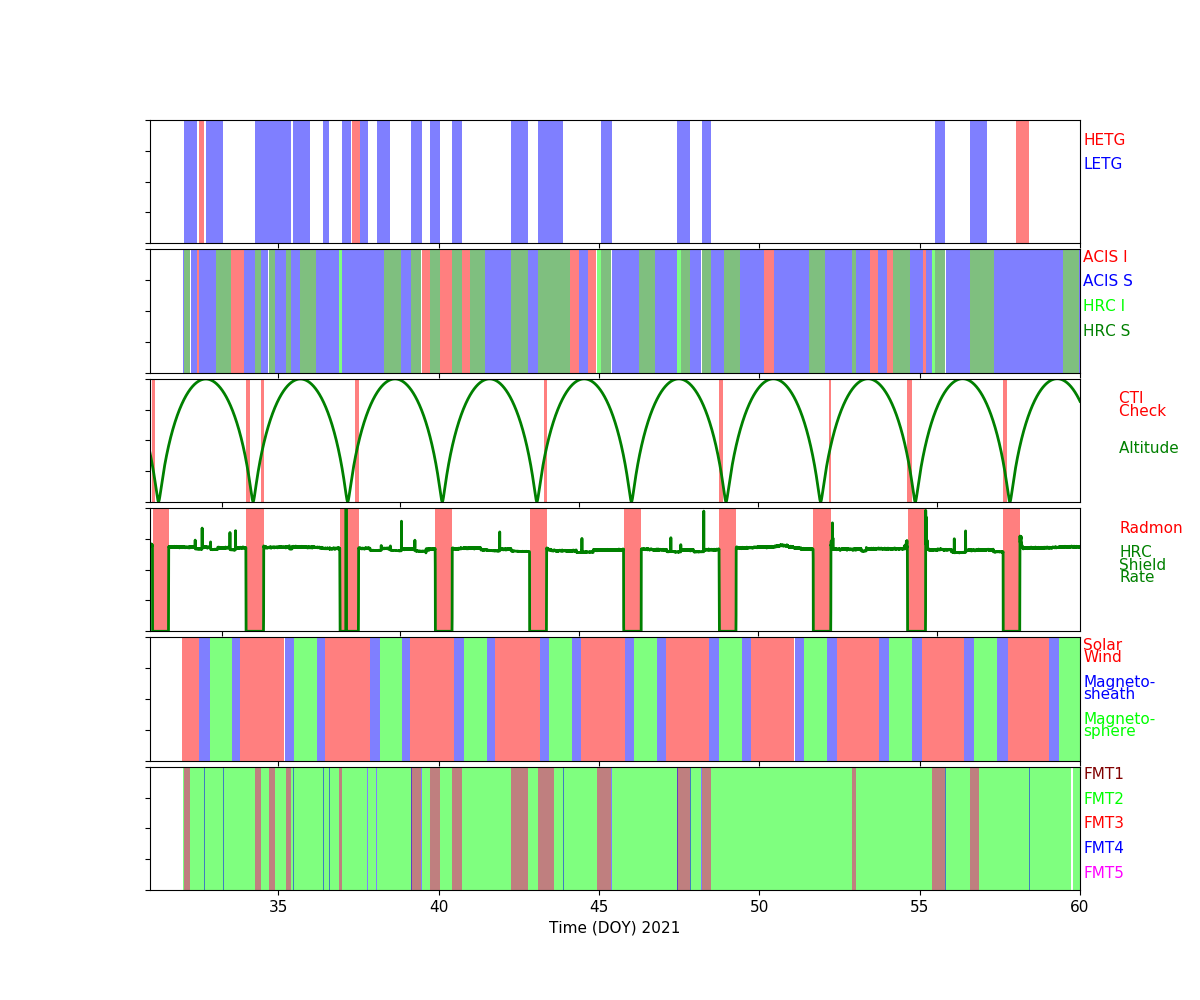
Radiation Count Rates of Feb 2021
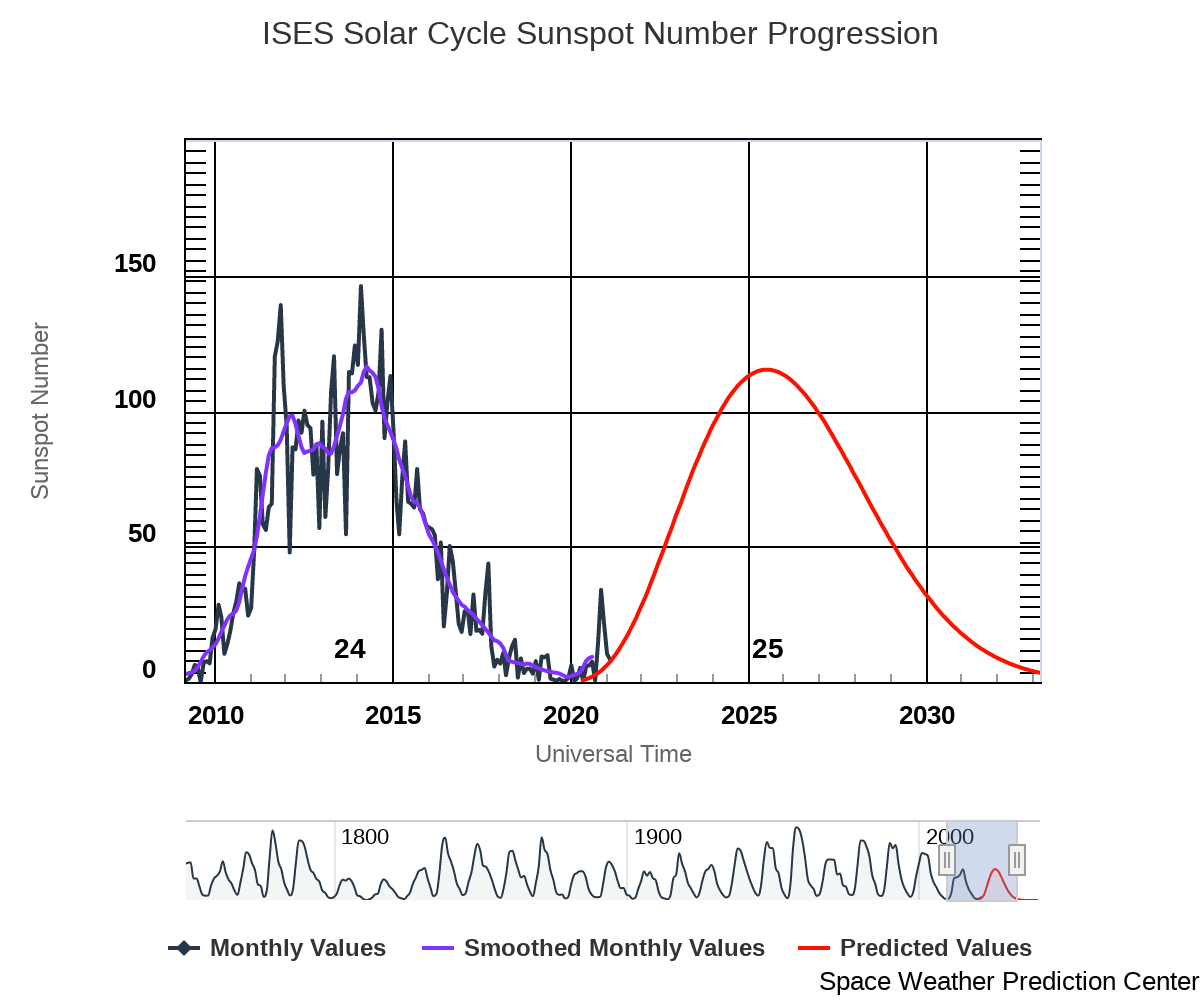
Sun Spot History (See:NOAA Page)
Trending
Quarterly Trends
- HRC Temperature
| Previous Quarter | |||||||
| MSID | MEAN | RMS | DELTA/YR | DELTA/YR/YR | UNITS | DESCRIPTION | |
| 2ceahvpt | 0.004 | 7.757e-04 | (3.01+/-0.02)e2 | -0.72 +/- 0.56 | K | CEA RADIATOR TEMPERATURE AT CENTER | |
|---|---|---|---|---|---|---|---|
| 2chtrpzt | 0.001 | 7.681e-04 | (2.97+/-0.02)e2 | -0.36 +/- 0.54 | K | CENTRAL ELECTRONICS BOX TEMP | |
| 2condmxt | -0.004 | 9.515e-04 | (2.94+/-0.02)e2 | 0.63 +/- 0.60 | K | CONDUIT -X FACE TEMPERATURE | |
| 2dcentrt | -0.002 | 7.502e-04 | (2.93+/-0.02)e2 | 0.09 +/- 0.58 | K | DETECTOR HOUSING TEMP 2 | |
| 2dtstatt | -0.005 | 8.218e-04 | (2.94+/-0.02)e2 | 0.96 +/- 0.61 | K | DETECTOR HOUSING TEMP 1 | |
| 2fhtrmzt | -0.007 | 9.576e-04 | (2.96+/-0.02)e2 | 0.89 +/- 0.68 | K | FRONT END ELECTRONICS BOX TEMPERATURE | |
| 2fradpyt | -0.008 | 0.001 | (2.92+/-0.02)e2 | 0.82 +/- 0.68 | K | FRONT END ASSEMBLY +Y AT RADIATOR CENTER TEMP | |
| 2pmt1t | -0.006 | 0.001 | (2.95+/-0.02)e2 | 0.62 +/- 0.71 | K | PMT 1 TEMPERATURE | |
| 2pmt2t | -0.006 | 0.001 | (2.97+/-0.03)e2 | 0.39 +/- 0.80 | K | PMT 2 TEMPERATURE | |
| 2uvlspxt | -3.048e-04 | 8.464e-04 | (2.89+/-0.02)e2 | -1.04 +/- 0.66 | K | UV LIGHT SHIELD NEXT TO SNOUT TEMP | |
- HRC HK
| Previous Quarter | |||||||
| MSID | MEAN | RMS | DELTA/YR | DELTA/YR/YR | UNITS | DESCRIPTION | |
| 2fe00atm | -0.006 | 7.503e-04 | 22.82 +/- 1.77 | 0.75 +/- 0.53 | C | Front end temperature | |
|---|---|---|---|---|---|---|---|
| 2fepratm | on | -0.002 | 0.004 | 24.55 +/- 1.78 | (0.00+/-0.00)e0 | C | FE temp card temperature | off | -0.006 | 8.382e-04 | 24.71 +/- 1.98 | 0.91 +/- 0.59 |
| 2imhvatm | on | 0.011 | 0.003 | 31.27 +/- 1.23 | (0.00+/-0.00)e0 | C | Imaging det HVPS temperature | off | -0.003 | 6.073e-04 | 31.88 +/- 1.43 | -0.50 +/- 0.43 |
| 2iminatm | on | 0.003 | 0.003 | 18.95 +/- 1.36 | (0.00+/-0.00)e0 | C | Imaging det temperature | off | -0.004 | 7.328e-04 | 20.35 +/- 1.72 | 0.94 +/- 0.56 |
| 2lvplatm | on | 1.231e-04 | 0.003 | 28.04 +/- 1.31 | (0.00+/-0.00)e0 | C | LVPS plate temperature | off | 9.292e-04 | 5.968e-04 | 28.15 +/- 1.40 | -0.16 +/- 0.41 |
| 2prbscr | on | -3.901e-04 | 6.770e-05 | 1.56 +/- 0.03 | (0.00+/-0.00)e0 | AMP | Primary bus current | off | 2.186e-04 | 2.559e-05 | 1.75 +/- 0.06 | -0.01 +/- 0.02 |
| 2prbsvl | -0.002 | 5.946e-05 | 27.07 +/- 0.15 | 0.06 +/- 0.01 | V | Primary bus voltage | |
| 2smtratm | on | 1.449e-13 | 2.019e-09 | 5.66 +/- 0.00 | (0.00+/-0.00)e0 | C | Selected motor temperature | off | 7.602e-08 | 2.065e-07 | 5.94 +/- 0.00 | (4.95+/-27.92)e-6 |
| 2sphvatm | on | -0.042 | 0.003 | 32.54 +/- 1.51 | (0.00+/-0.00)e0 | C | Spect det HVPS temperature | off | 0.015 | 6.789e-04 | 32.11 +/- 1.70 | 0.14 +/- 0.54 |
| 2spinatm | on | -0.001 | 0.003 | 20.37 +/- 1.45 | (0.00+/-0.00)e0 | C | Spect det temperature | off | -3.513e-04 | 7.313e-04 | 19.15 +/- 1.71 | 0.16 +/- 0.57 |
- PCAD Temperature
| Previous Quarter | |||||||
| MSID | MEAN | RMS | DELTA/YR | DELTA/YR/YR | UNITS | DESCRIPTION | |
| aacccdpt | 0.015 | 5.806e-04 | (2.64+/-0.01)e2 | -0.78 +/- 0.45 | K | AC CCD TEMP (PRI) | |
|---|---|---|---|---|---|---|---|
| aacccdrt | 0.016 | 6.230e-04 | (3.08+/-0.02)e2 | -0.84 +/- 0.49 | K | AC CCD TEMP (RDNT) | |
| aach1t | 0.016 | 6.231e-04 | (3.05+/-0.02)e2 | -0.86 +/- 0.49 | K | AC HOUSING TEMP (ACH1) | |
| aach2t | 0.016 | 6.235e-04 | (3.05+/-0.02)e2 | -0.76 +/- 0.49 | K | AC HOUSING TEMP (ACH2) | |
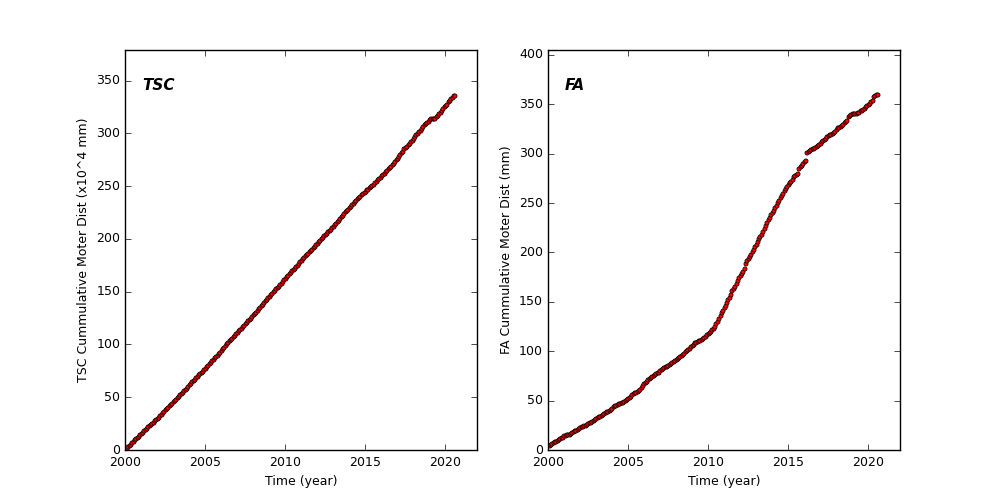
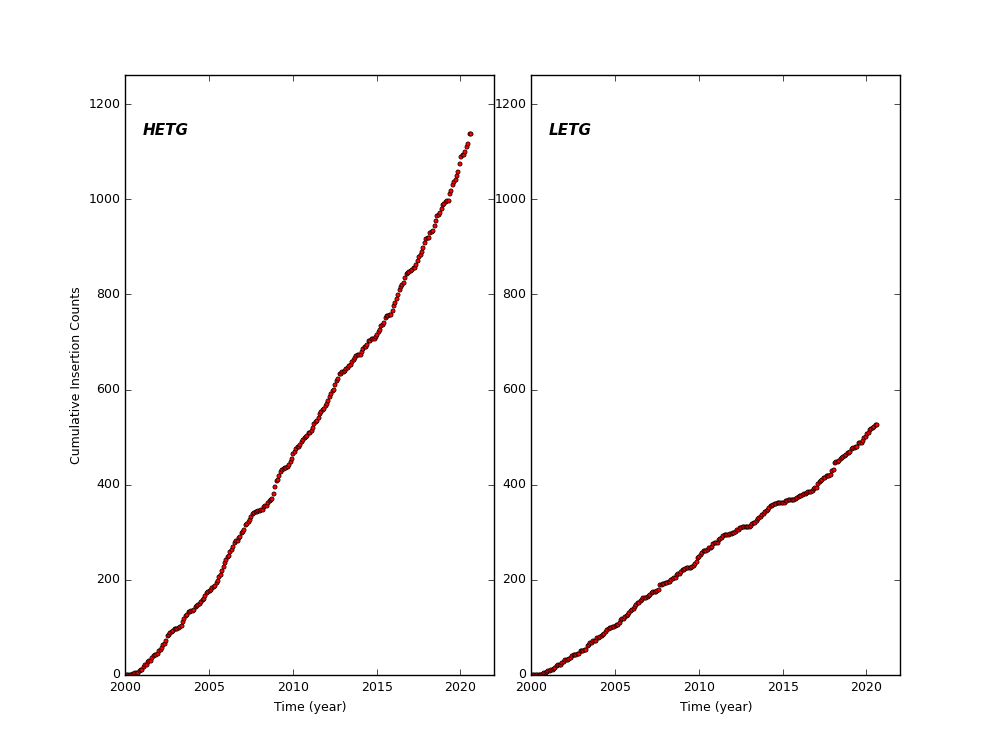
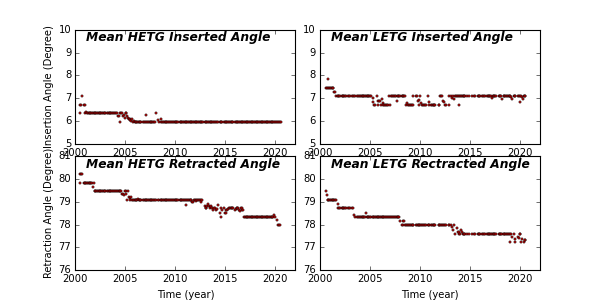
Spacecraft Motions
TSC and FA Cummulative Moter Distance
HETG and LETG Cummulative Insertion Counts
HETG/LETG Insertion/Retraction Angle
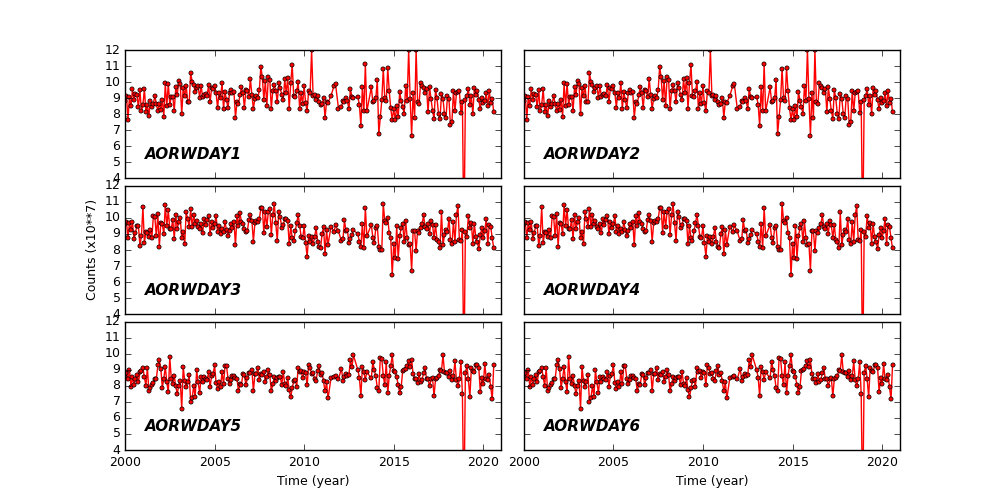
Reaction Wheel Rotations