ACIS
ACIS DOSE Registered-Photon-Map
The steps we took to compute the dose map are;
- Level 1 Event files for a specified month are obtained from archive.
- Image data including I2, I3, S2, S3 CCDs are extracted from all event files.
- All the extracted image data were merged to create a month long exposure map for the month.
- The exposure map is opened with ds9, and check a distribution of count rates against energy. From this, estimate the upper threshold value. Any events beyond this upper threshold are assumed erroneous events such as bad pixels.
- Using this upper threshold, the data is filtered, and create a cleaned exposure map for the month.
- The exposure map from each month from the Sep 1999 is added up to create a cumulative exposure map for each month.
- Using fimgstatistic, we compute count rate statistics for each CCDs.
- For observations with high data drop rates (e.g., Crab nebula, Cas A), we corrected the observations by adding events.
Please check more detail plots at Telemetered Photon Dose Trend page.
)
)
)
Statistics:
# IMAGE     NPIX     MEAN        RMS        MIN     MAX
ACIS_apr21 6004901       6.898         11.087           0.0     5889


I2 node 0  262654	7.939640	3.493425	0.0	 75.0
I2 node 1  262654	8.259404	6.837708	0.0	2917.0
I2 node 2  262654	8.163971	8.705653	0.0	4094.0
I2 node 3  262654	8.444879	27.345202	0.0	5889.0

I3 node 0  262654	8.803614	3.768564	0.0	208.0
I3 node 1  262654	8.574418	3.591024	0.0	132.0
I3 node 2  262654	8.463012	3.455073	0.0	113.0
I3 node 3  262654	8.475106	5.666915	0.0	1438.0

S2 node 0  262654	8.289618	12.038010	0.0	5869.0
S2 node 1  262654	8.372977	3.815477	0.0	217.0
S2 node 2  262654	8.444229	10.811136	0.0	4563.0
S2 node 3  262654	8.362640	3.794058	0.0	482.0

S3 node 0  262654	10.973782	4.773053	0.0	 67.0
S3 node 1  262654	12.704455	5.206985	0.0	681.0
S3 node 2  262654	11.989503	4.124197	0.0	 55.0
S3 node 3  262654	10.733279	3.803567	0.0	 60.0
)
)
)
Statistics:
 IMAGE     NPIX      MEAN        RMS           MIN      MAX
ACIS_total   6004901       2479.056         3182.501           0.0   137936


I2 node 0  262654	2147.008864	430.264686	459.0	12741.0
I2 node 1  262654	2258.027133	609.458203	471.0	118732.0
I2 node 2  262654	2284.368667	483.013597	487.0	13251.0
I2 node 3  262654	2289.771868	590.866039	462.0	28752.0

I3 node 0  262654	2456.899264	603.853216	456.0	13055.0
I3 node 1  262654	2533.862612	1716.737008	488.0	55590.0
I3 node 2  262654	2252.575222	420.825354	458.0	13295.0
I3 node 3  262654	2245.275356	452.890749	426.0	33968.0

S2 node 0  262654	2893.408395	462.697509	1586.0	22219.0
S2 node 1  262654	3065.674529	688.454537	1762.0	16700.0
S2 node 2  262654	3388.464518	682.772089	2186.0	28647.0
S2 node 3  262654	3354.100551	535.852318	1929.0	68052.0

S3 node 0  262654	5116.118539	2454.842480	2236.0	37166.0
S3 node 1  262654	6345.393172	2327.544436	0.0	37688.0
S3 node 2  262654	5079.046446	1292.931593	2283.0	26234.0
S3 node 3  262654	3952.062819	689.104581	2411.0	25582.0
)
|
)
|
)
|
)
|
| Jan 2021 | Oct 2020 | Jul 2020 | Apr 2020 |
|---|
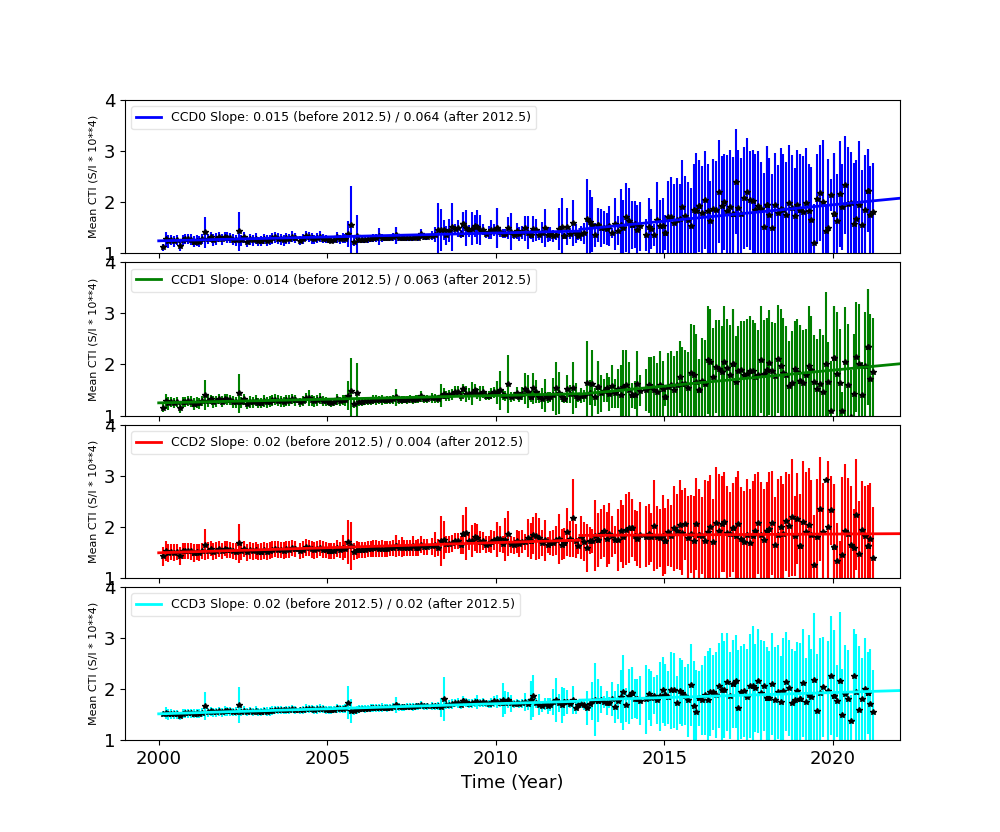
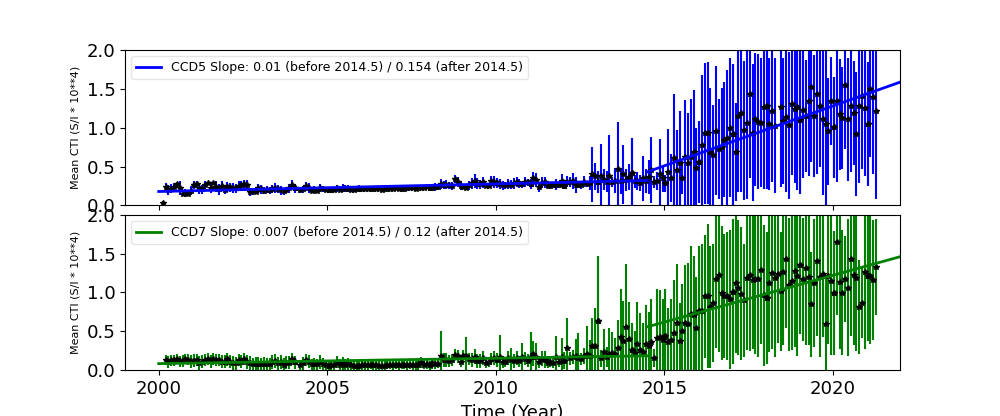
The Mean Detrended CTI
We report CTIs with a refined data definition. CTIs were computed for the temperature dependency corrected data. Please see CTI page for detailed explanation. CTI's are computed for Mn K alpha, and defined as slope/intercept x10^4 of row # vs ADU. Data file: here
Imaging CCDs
Spectral CCDs
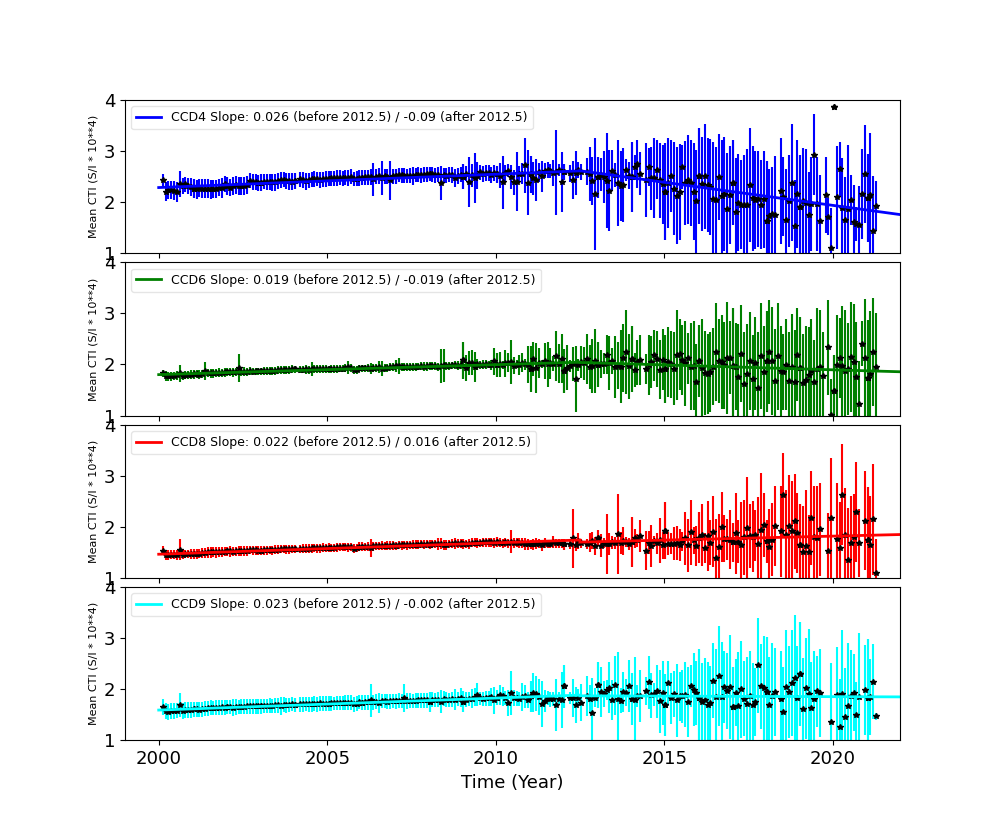
Backside CCDs
Focal Plane Temperature
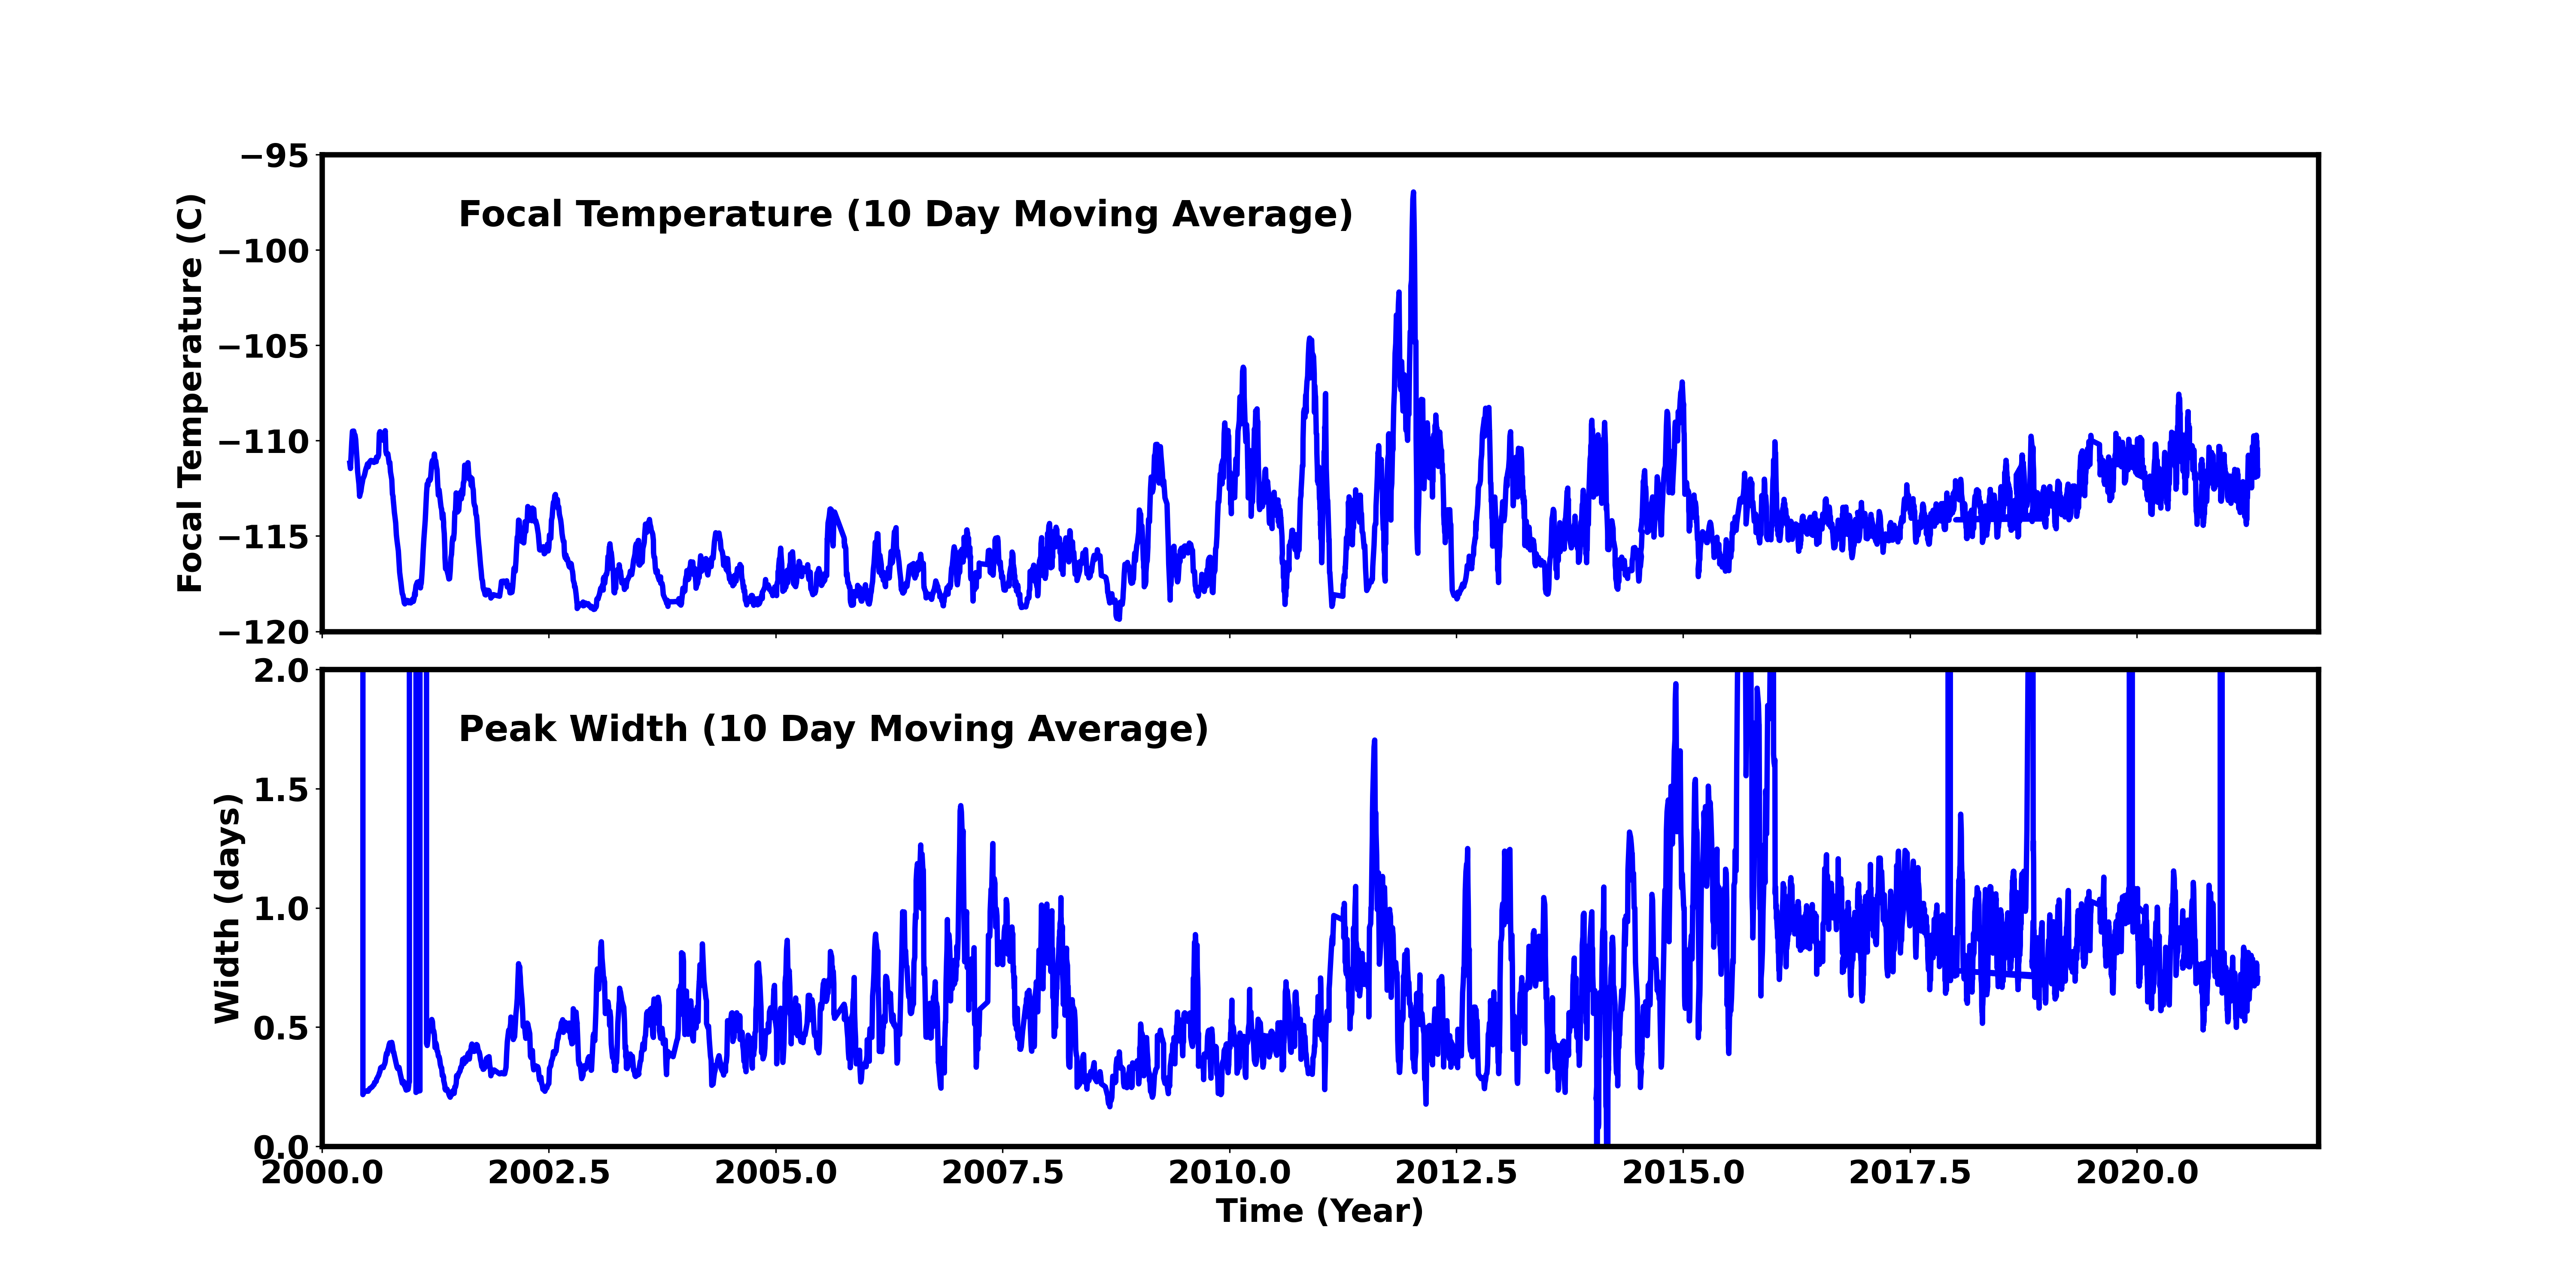
Apr 2021 Focal Temperature
| The Mean (max) FPT: | |
|---|---|
| -110.99 | +/- 4.12 C |
| Mean Width: | |
| 0.73 | +/- 0.22 days |
Averaged Focal Plane Temperature
We are using 10 period moving averages to show trends of peak temperatures and peak widths. Note, the gaps in the width plot are due to missing/corrupted data.
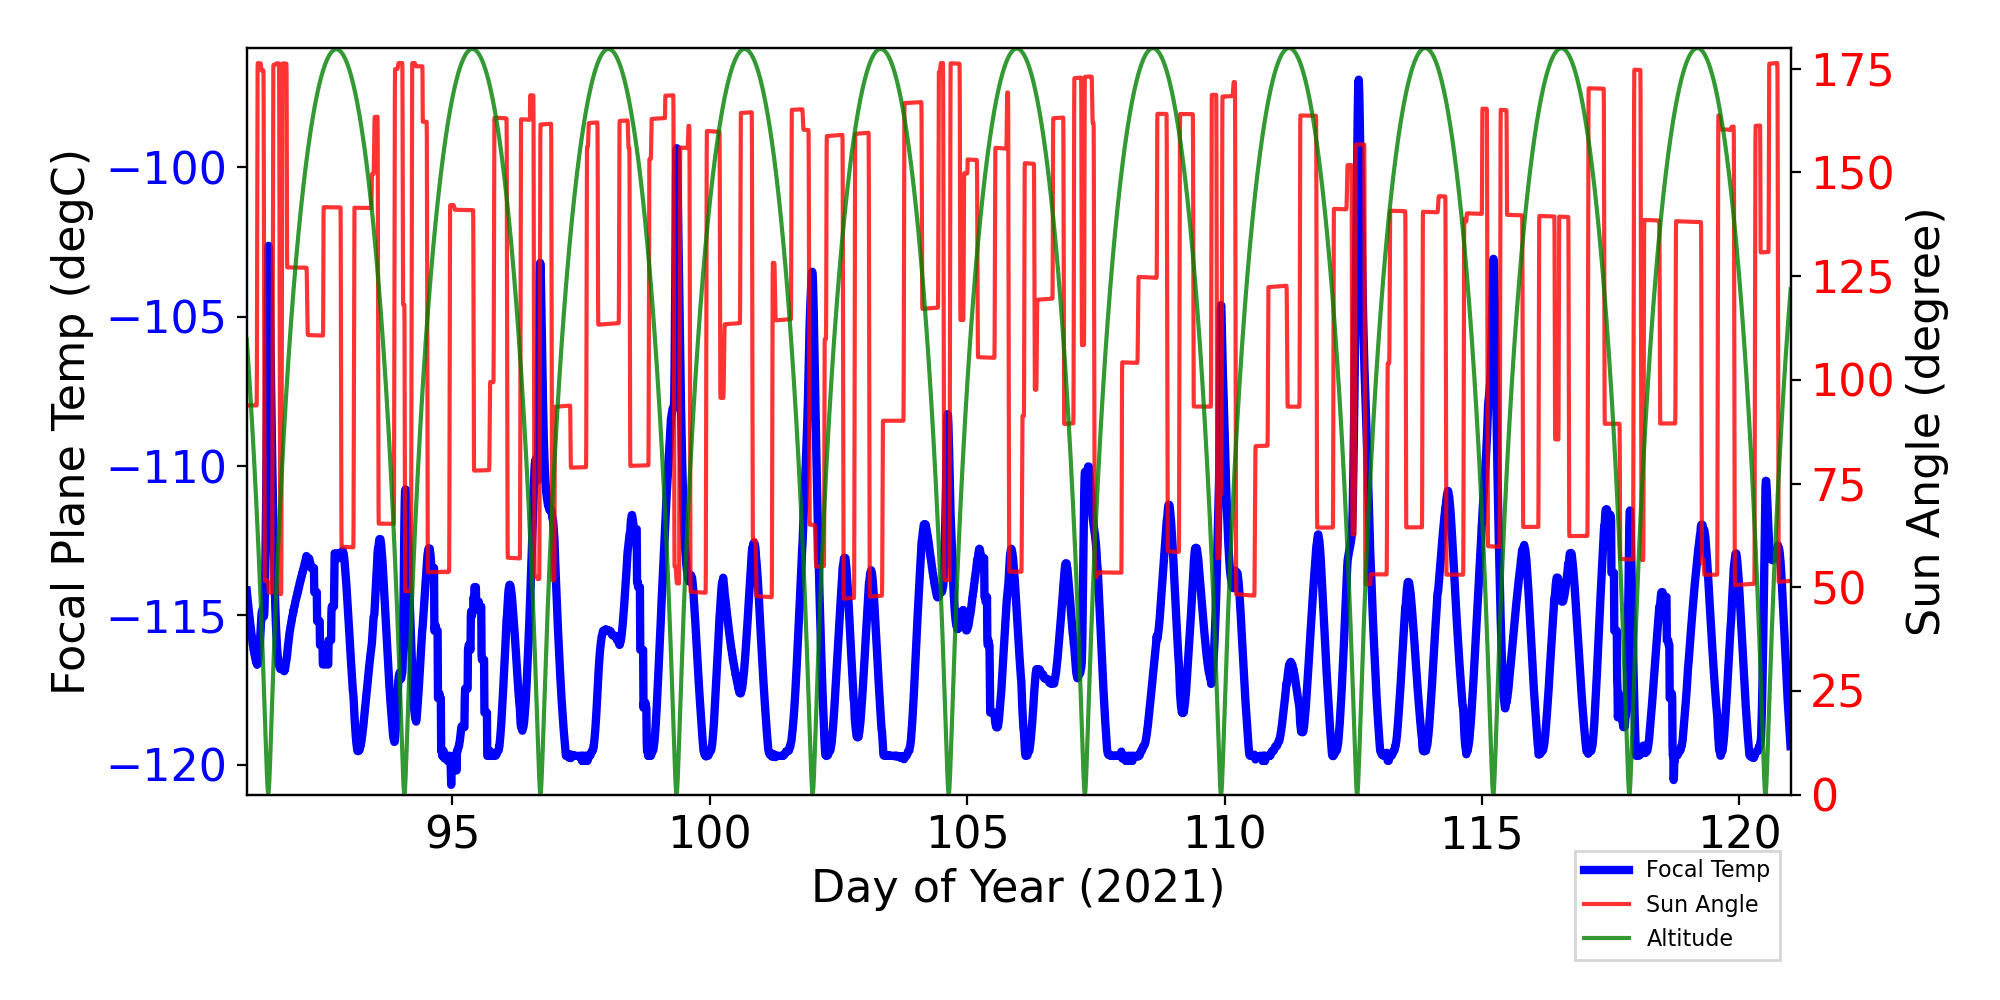
Focal Plane Temperature, Sun Angle and Altitude
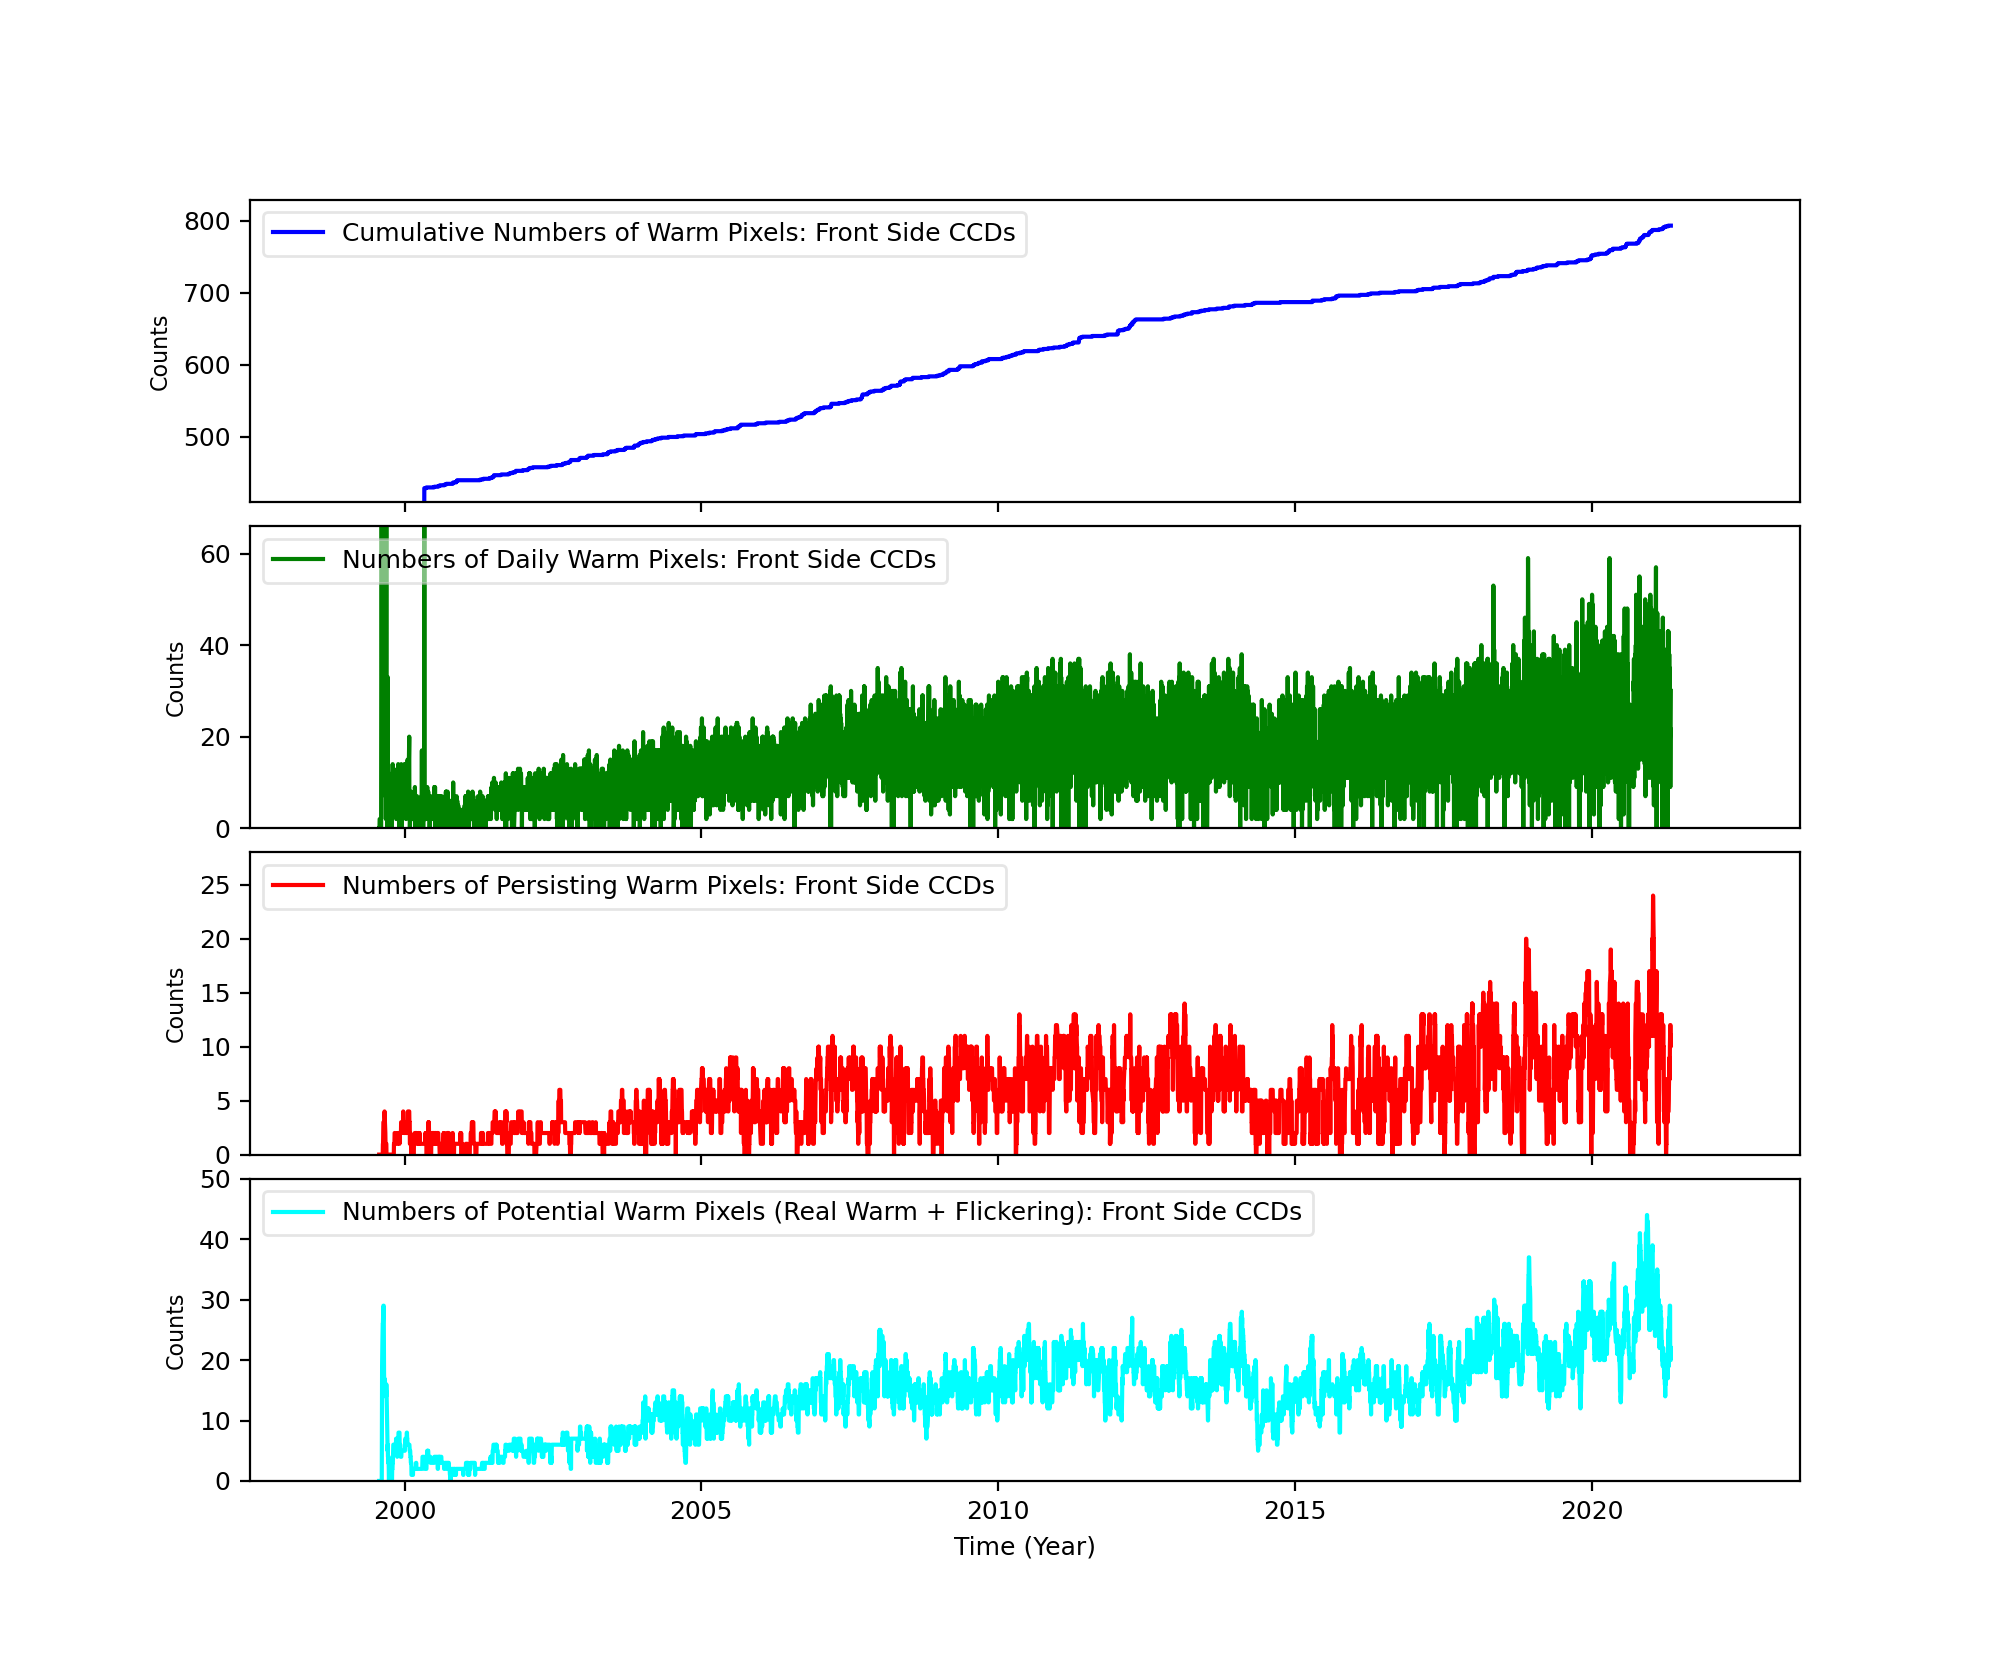
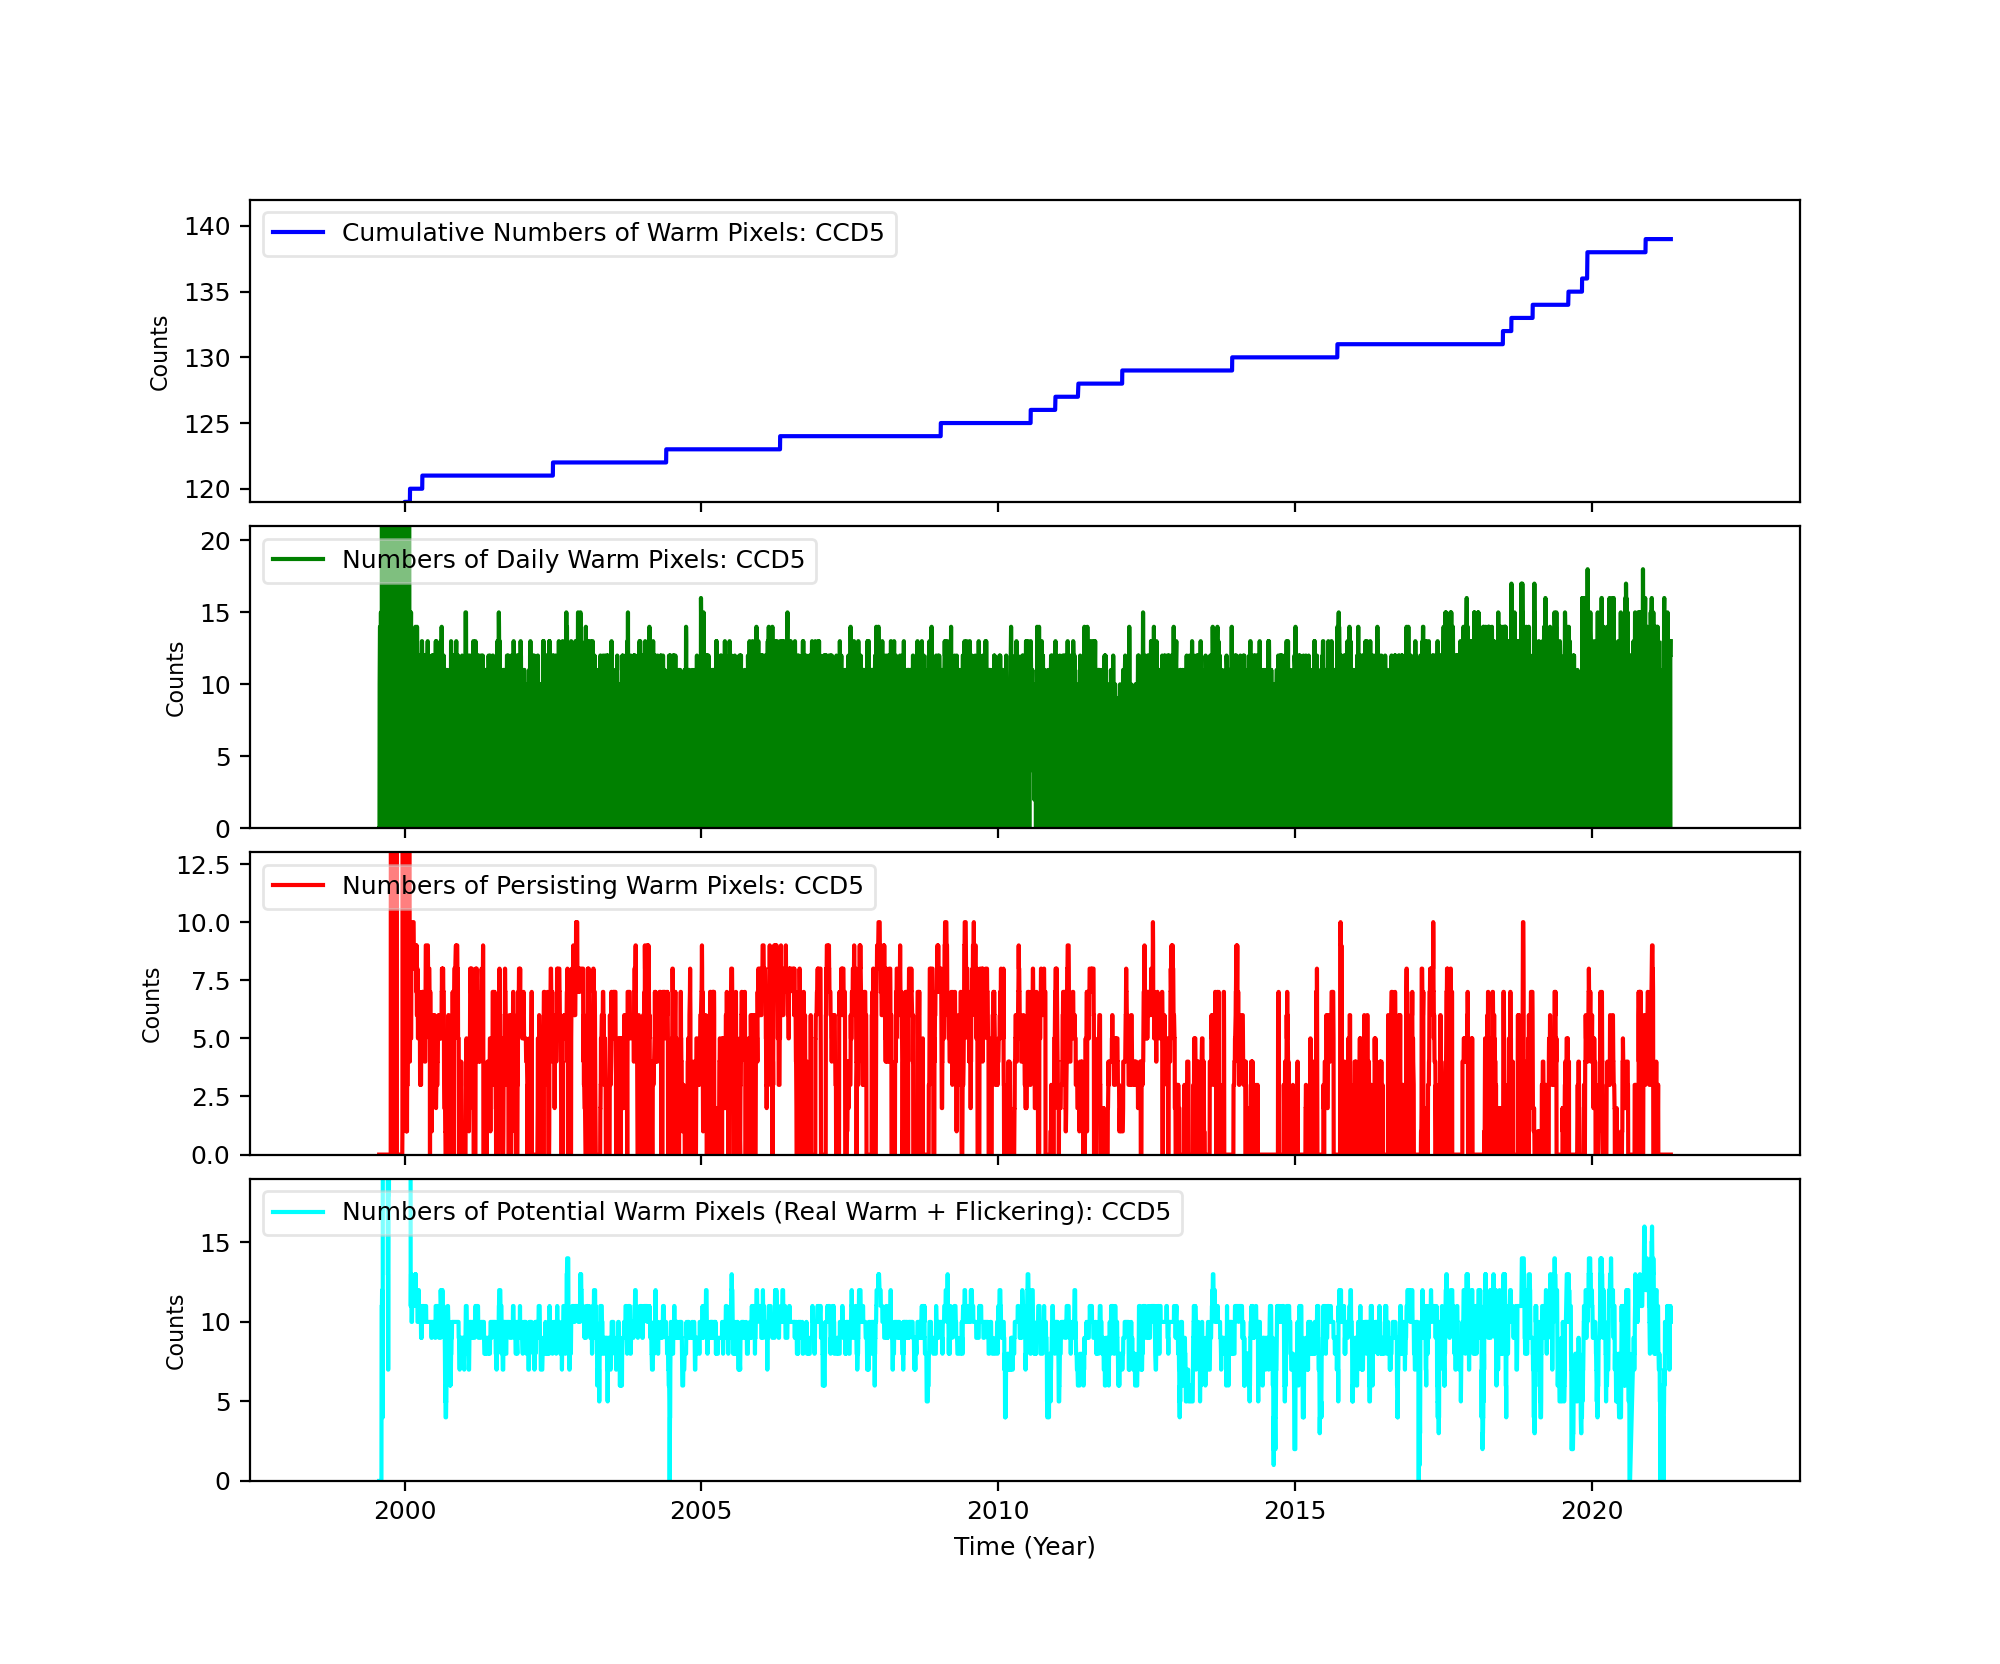
Bad Pixels
The plots below were generated with a new warm pixel finding script. Please see Acis Bad Pixel Page for details.
Front Side CCDs
Back Side CCD (CCD5)
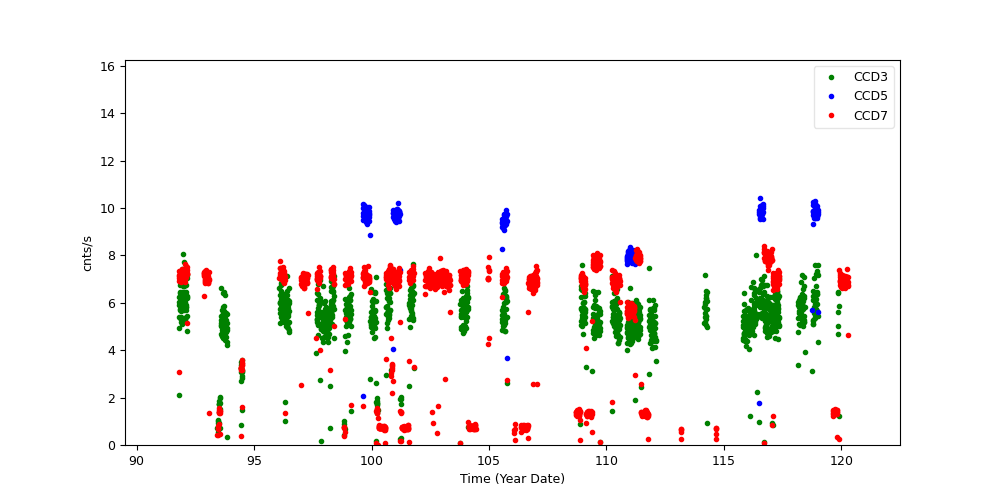
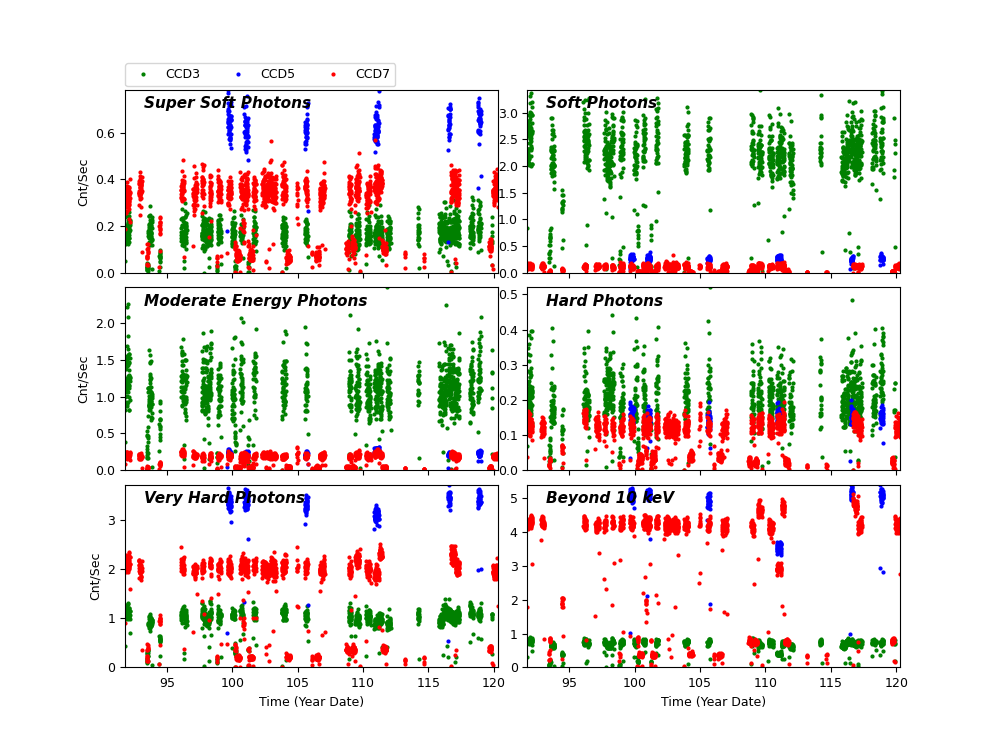
Science Instrument Background Rates
| Name | Low (keV) | High(KeV) | Description |
|---|---|---|---|
| SSoft | 0.00 | 0.50 | Super soft photons |
| Soft | 0.50 | 1.00 | Soft photons |
| Med | 1.00 | 3.00 | Moderate energy photons |
| Hard | 3.00 | 5.00 | Hard Photons |
| Harder | 5.00 | 10.00 | Very Hard photons |
| Hardest | 10.00 | Beyond 10 keV |
HRC
DOSE of Central 4K Pore-Pairs
Please refer to Maximum Dose Trends for more details.
)
|
|---|
IMAGE                NPIX      MEAN    STDDEV      MIN       MAX
HRCI_04_2021.fits  16777216	0.152 	0.440 	0.000 	14.000
)
IMAGE                       NPIX      MEAN    STDDEV      MIN       MAX
HRCI_08_1999_04_2021.fits  16777216	6.944 	6.370 	0.000 	313.000
)
|
|---|
IMAGE                NPIX      MEAN    STDDEV      MIN       MAX
HRCS_04_2021.fits  16777216	0.111 	0.370 	0.000 	7.000
)
IMAGE                       NPIX      MEAN    STDDEV      MIN       MAX
HRCS_08_1999_04_2021.fits  16777216	19.930 	35.362 	0.000 	1756.000
|
|
Max dose trend plots corrected for events that "pile-up"
in the center of the taps due to bad position information.
|
)
|
)
|
)
|
)
|
| Jan 2021 | Oct 2020 | Jul 2020 | Apr 2020 |
|---|
)
|
)
|
)
|
)
|
| Jan 2021 | Oct 2020 | Jul 2020 | Apr 2020 |
|---|
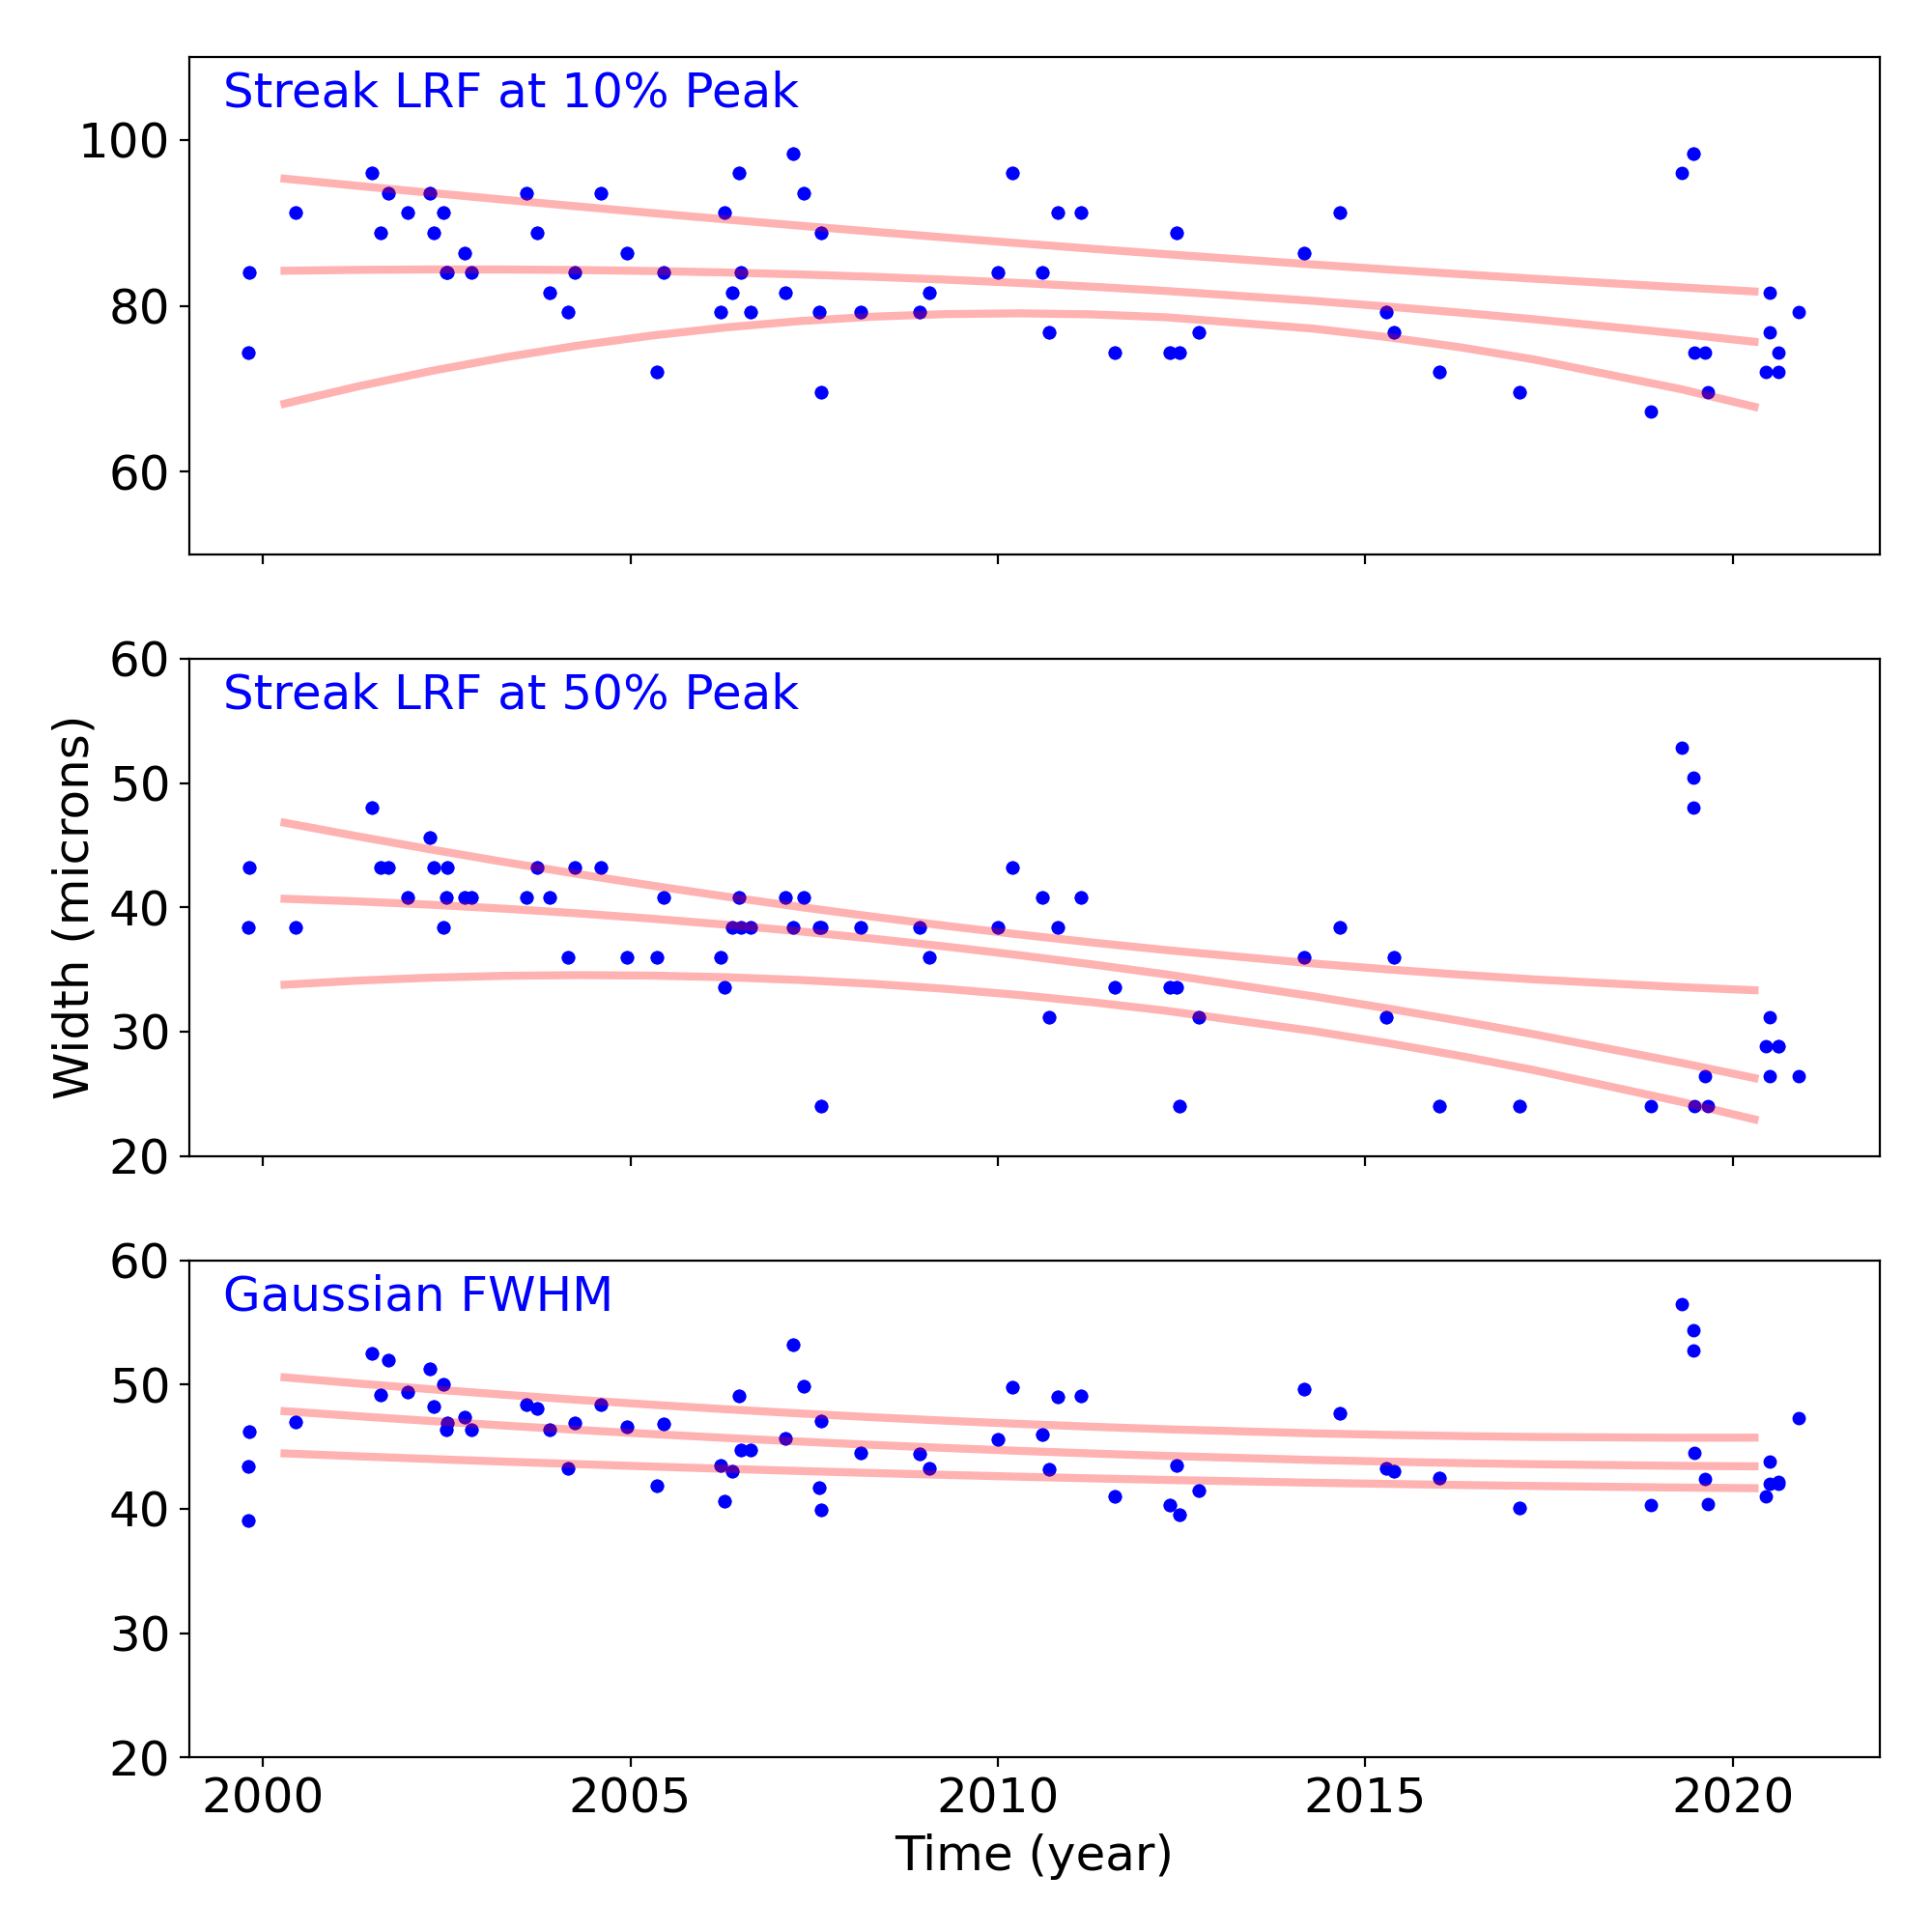
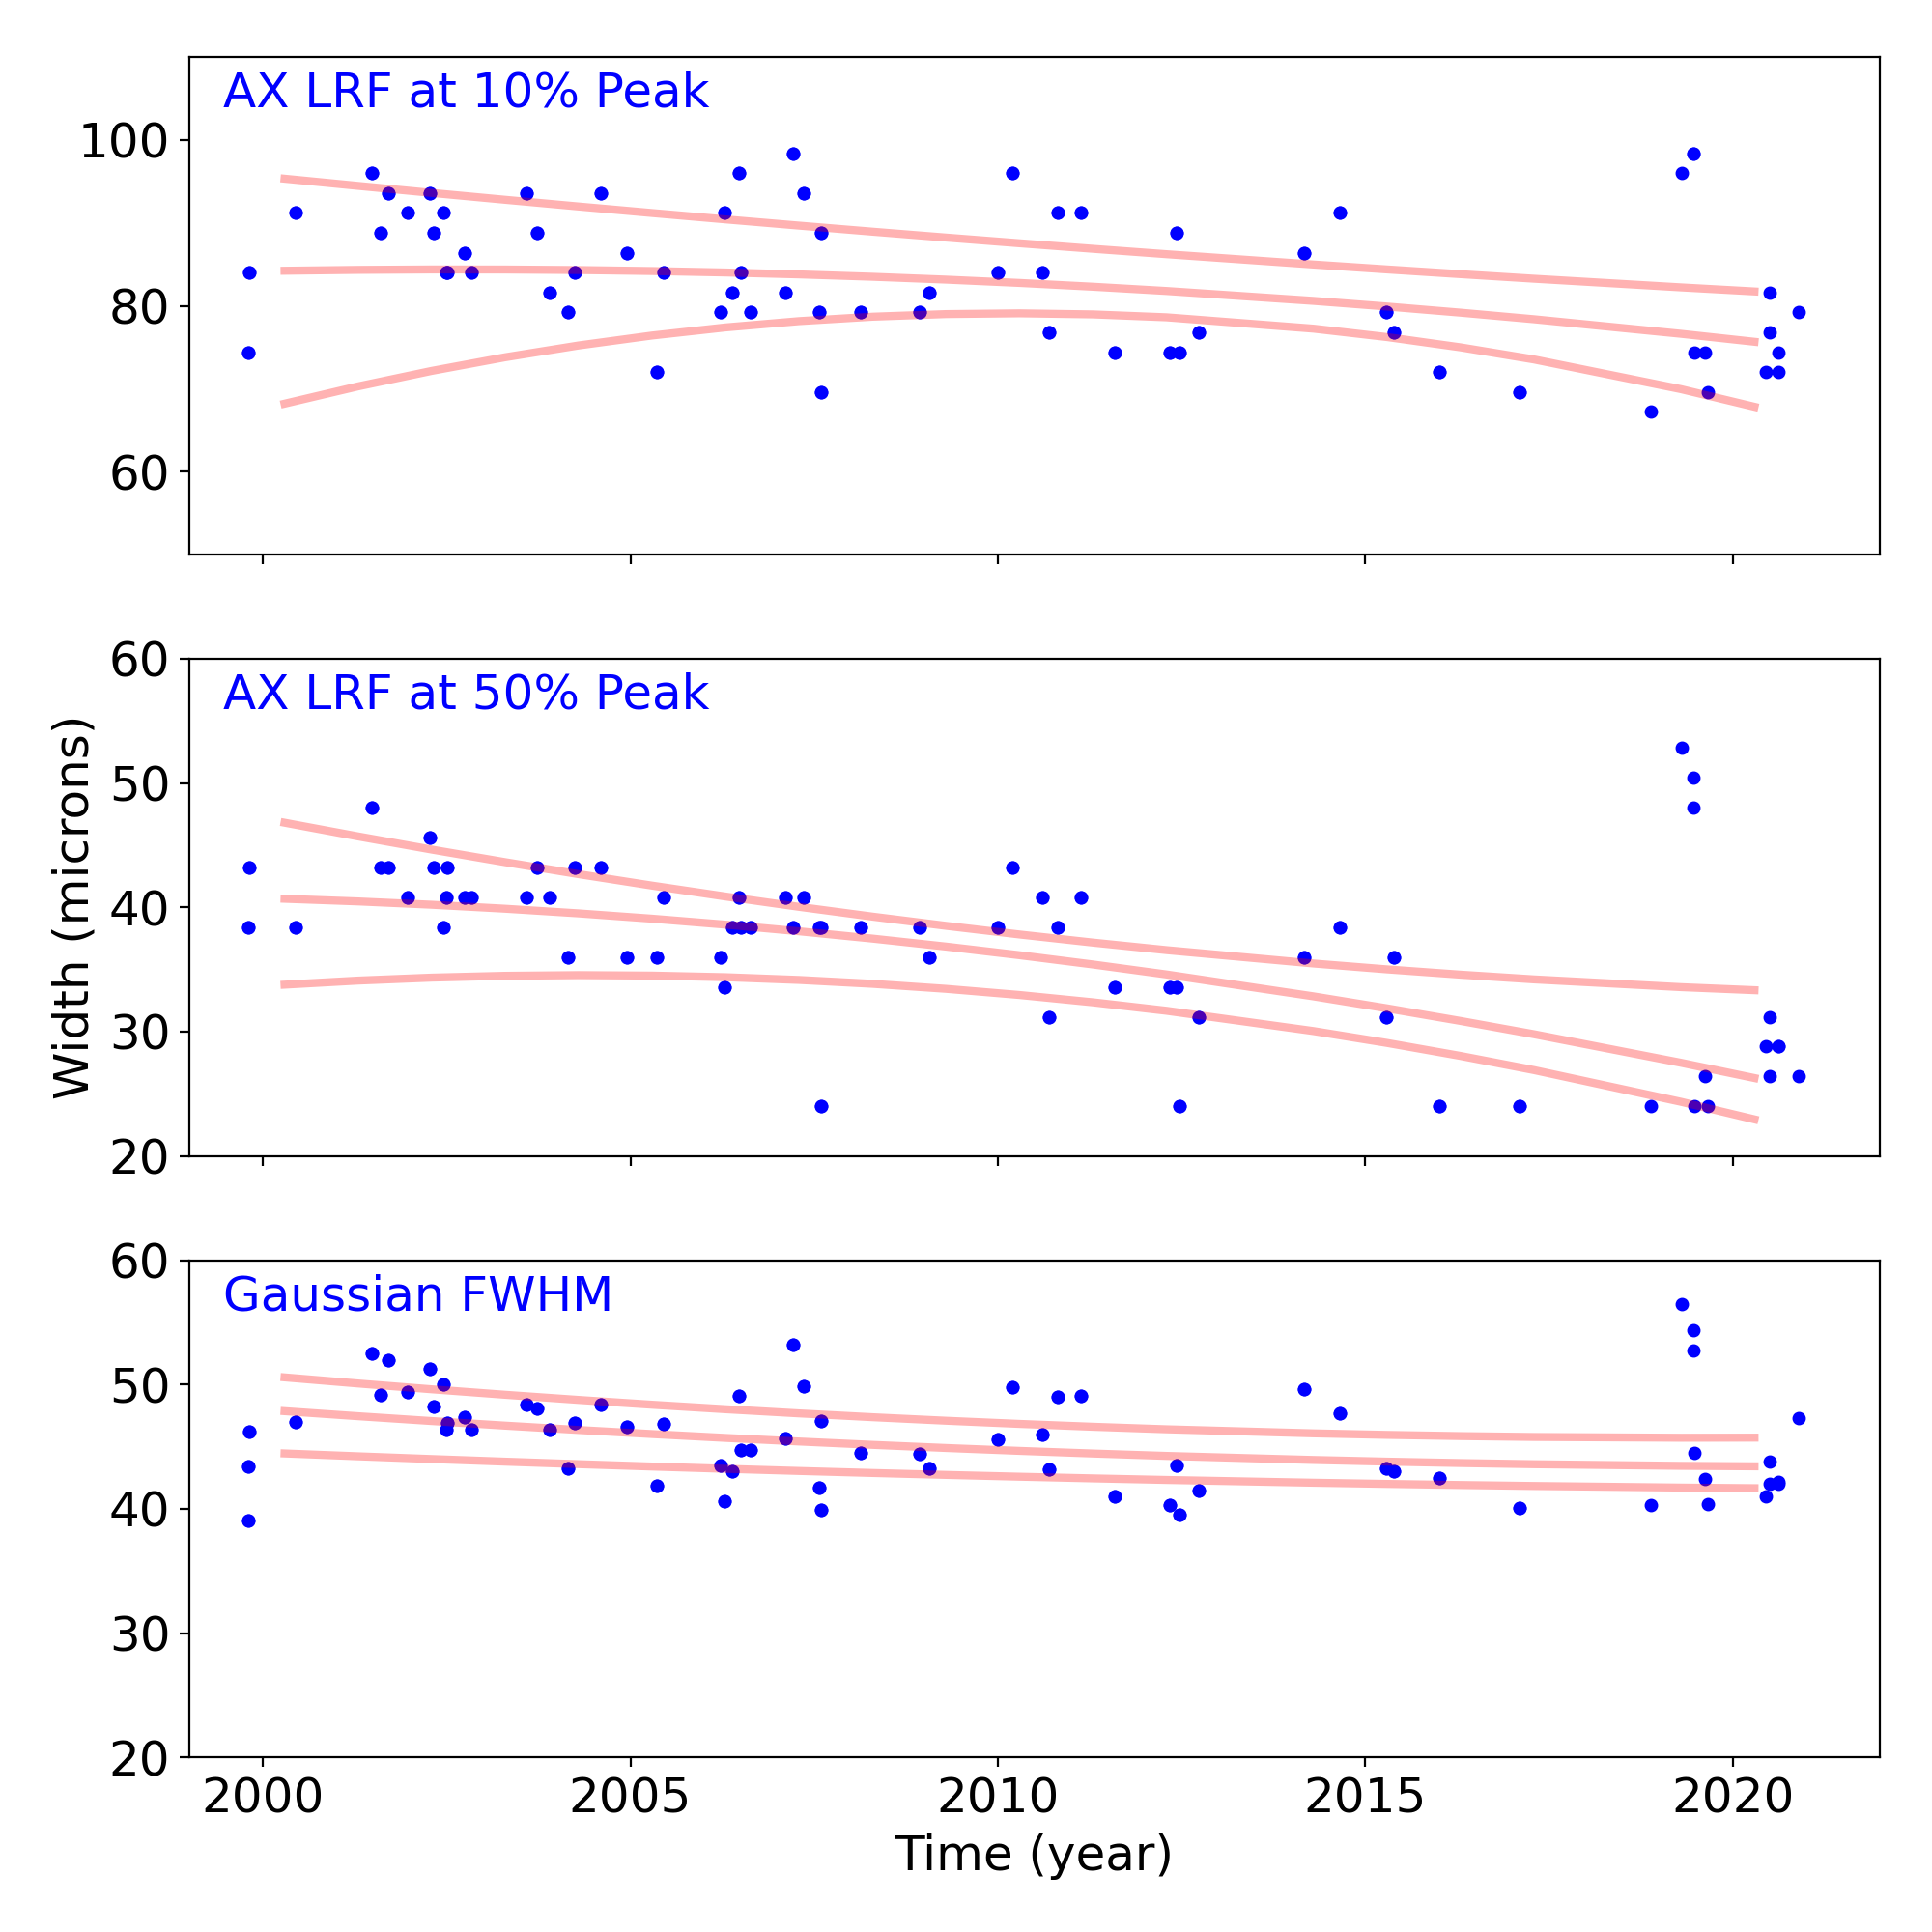
Gratings
Grating Trends/Focus
We plot the width of the zero order streak of ACIS/HETG observations and the width of the zero order image for HRC/LETG observations of point sources. No significant defocusing trend is seen at this time. See Gratings Trends pages.
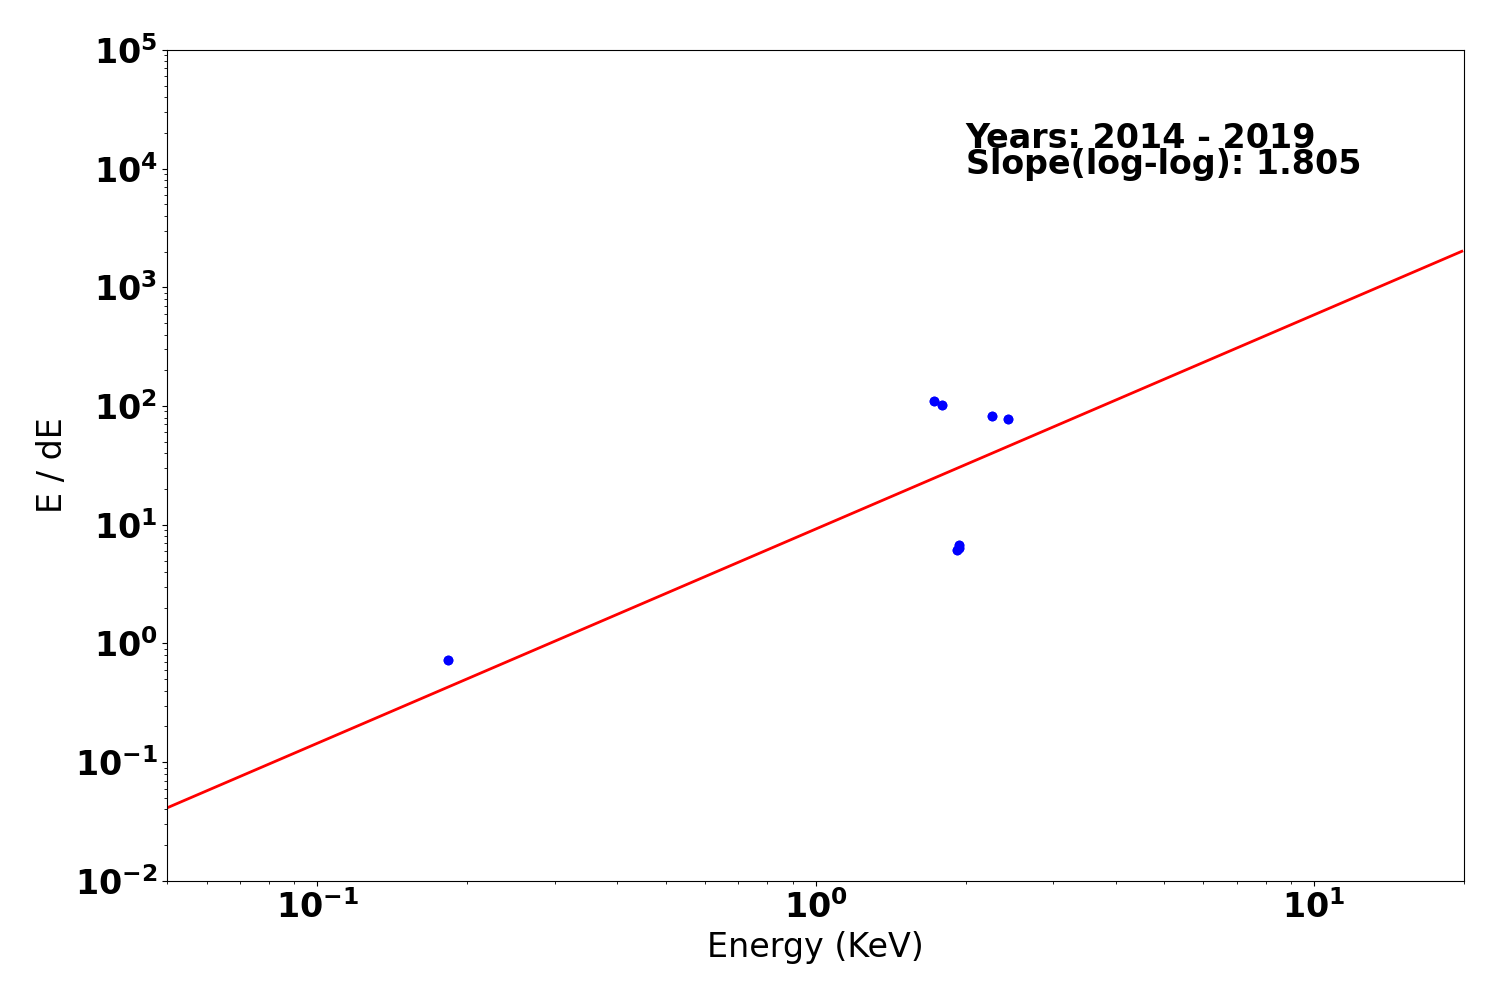
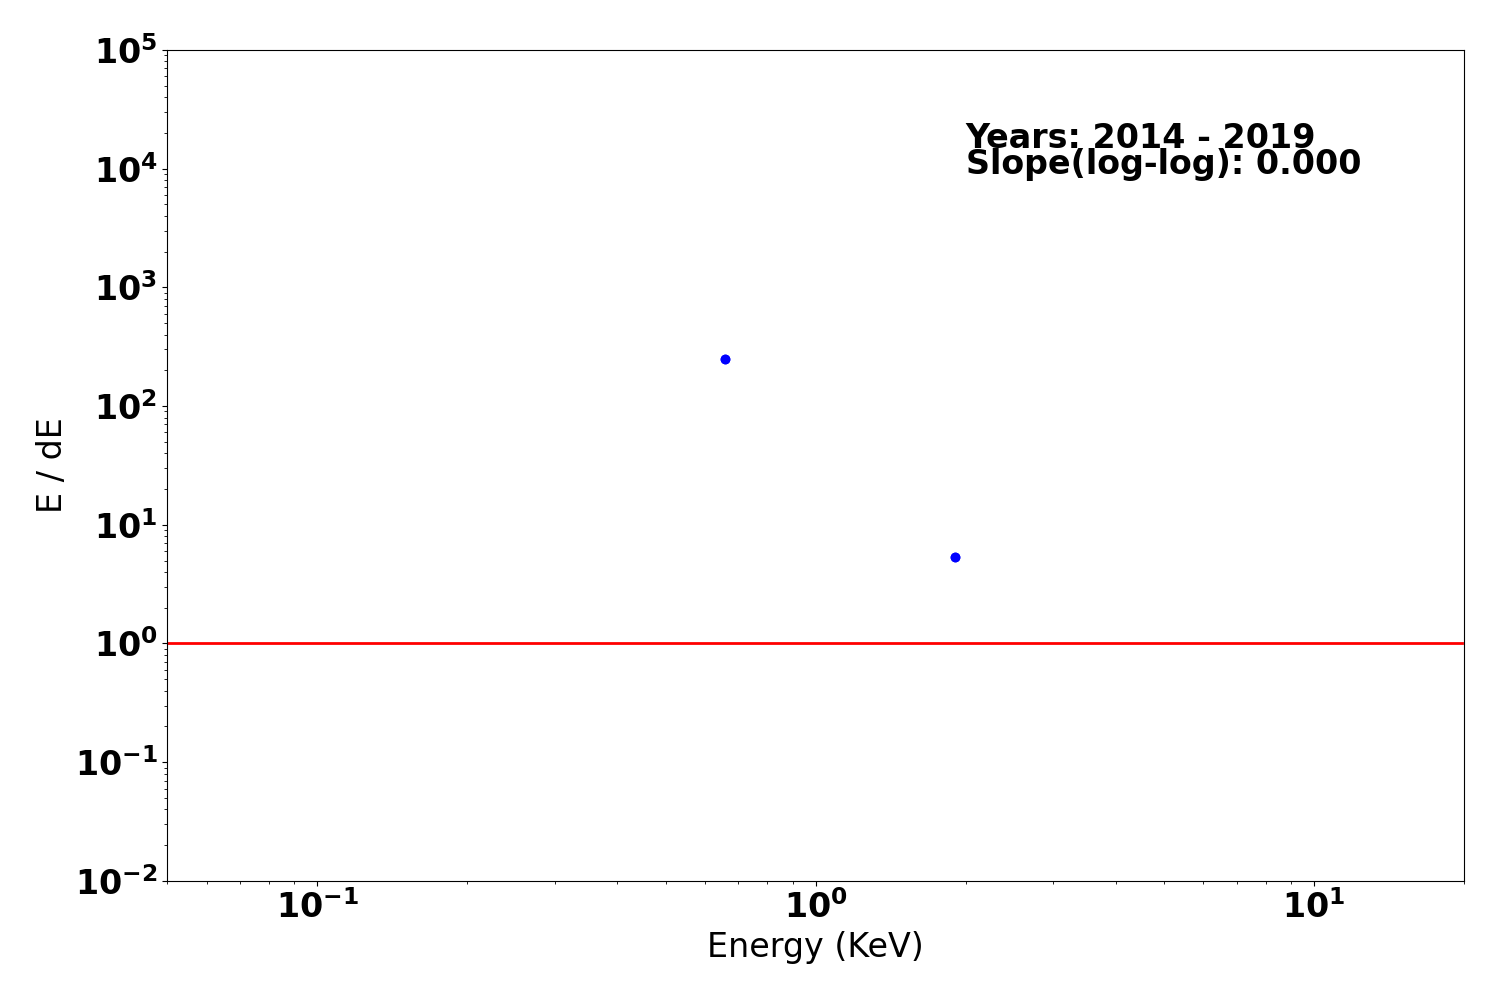
Gratings Resolving Power
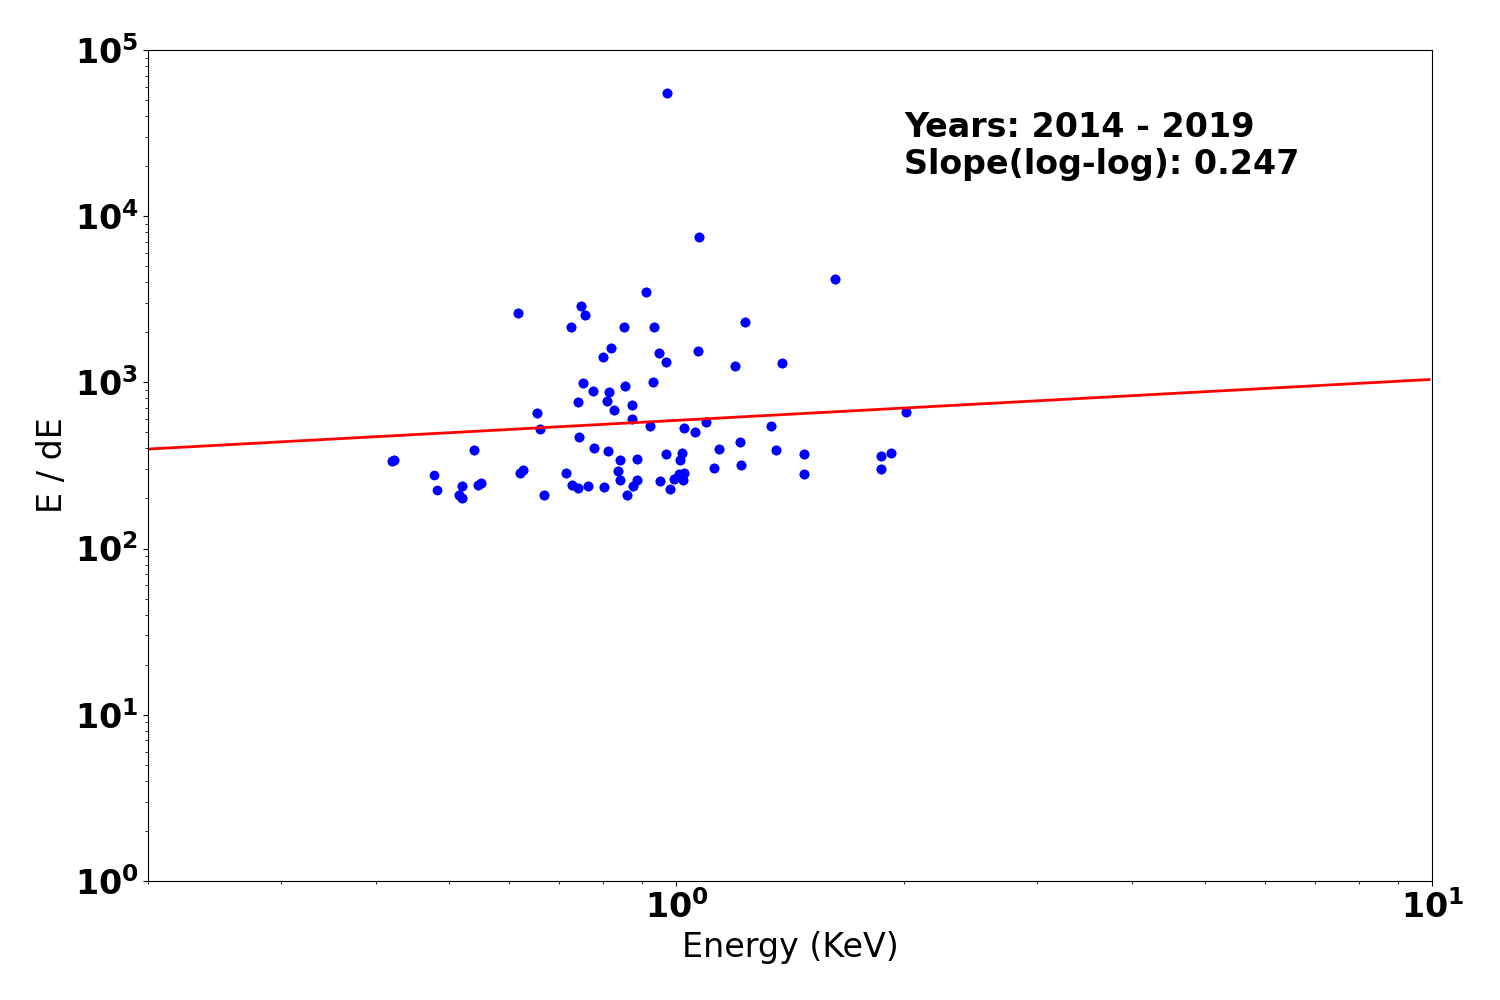
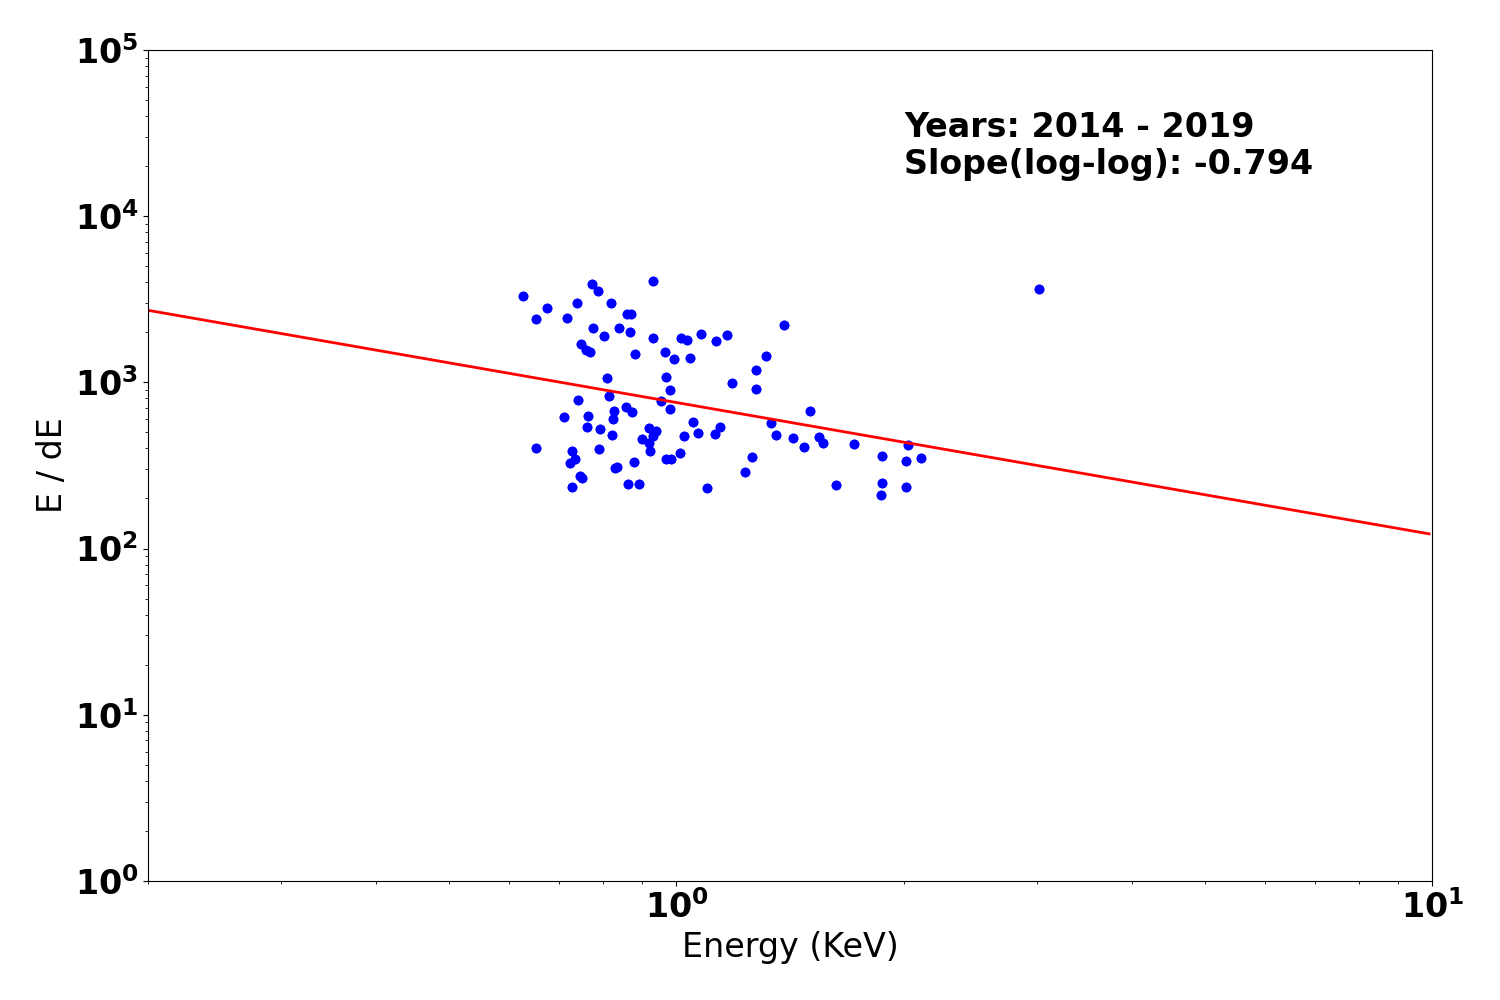
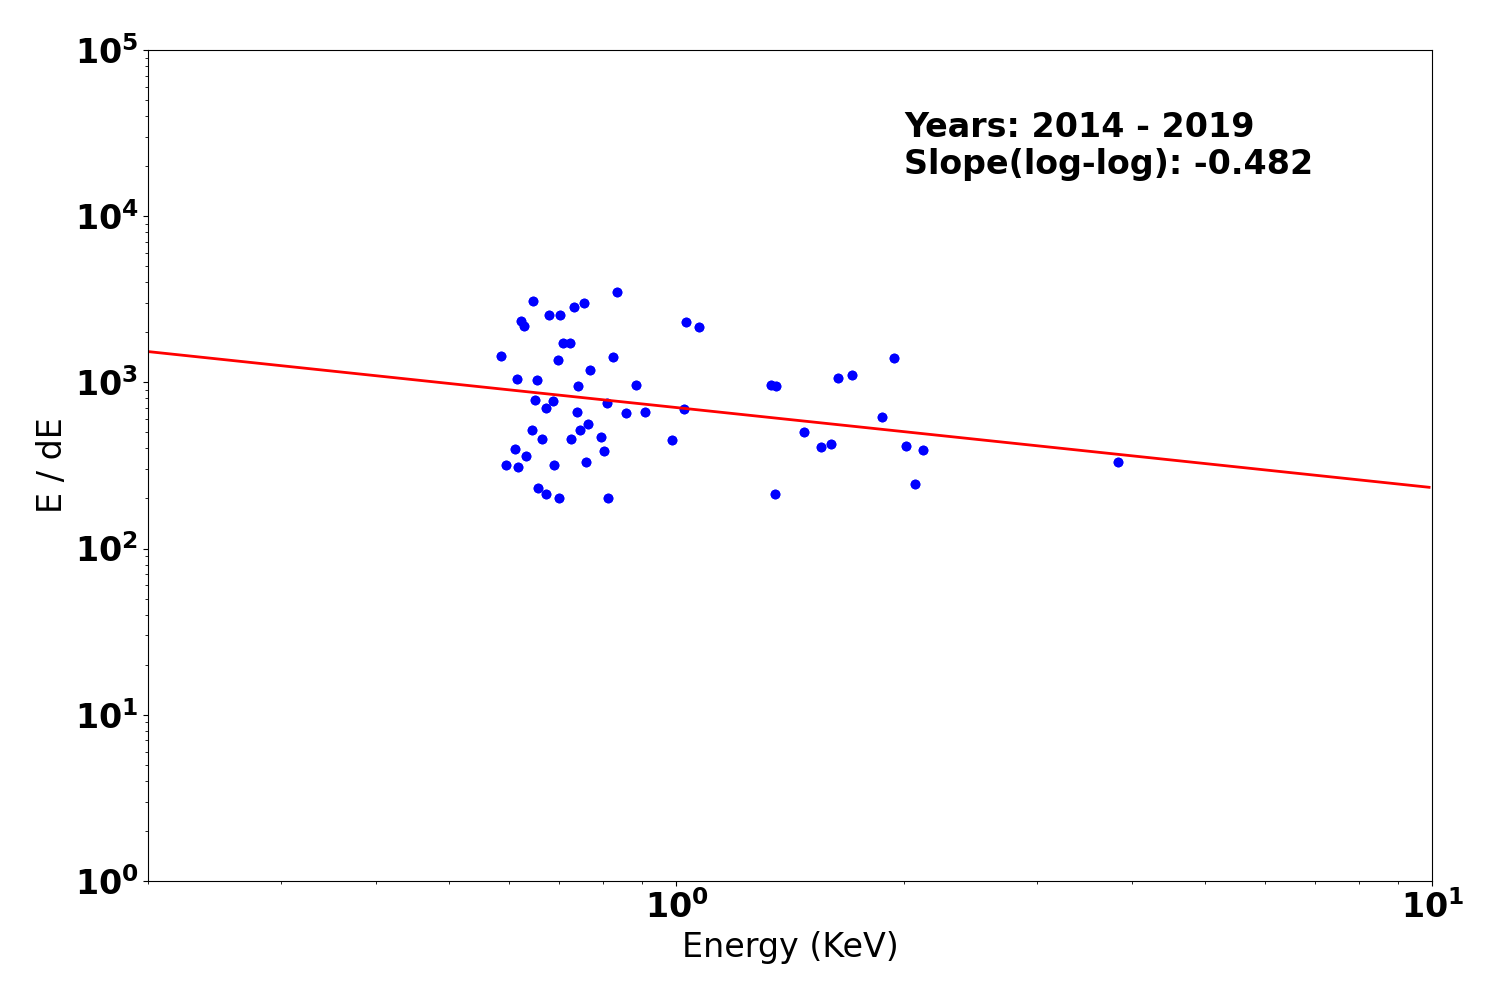
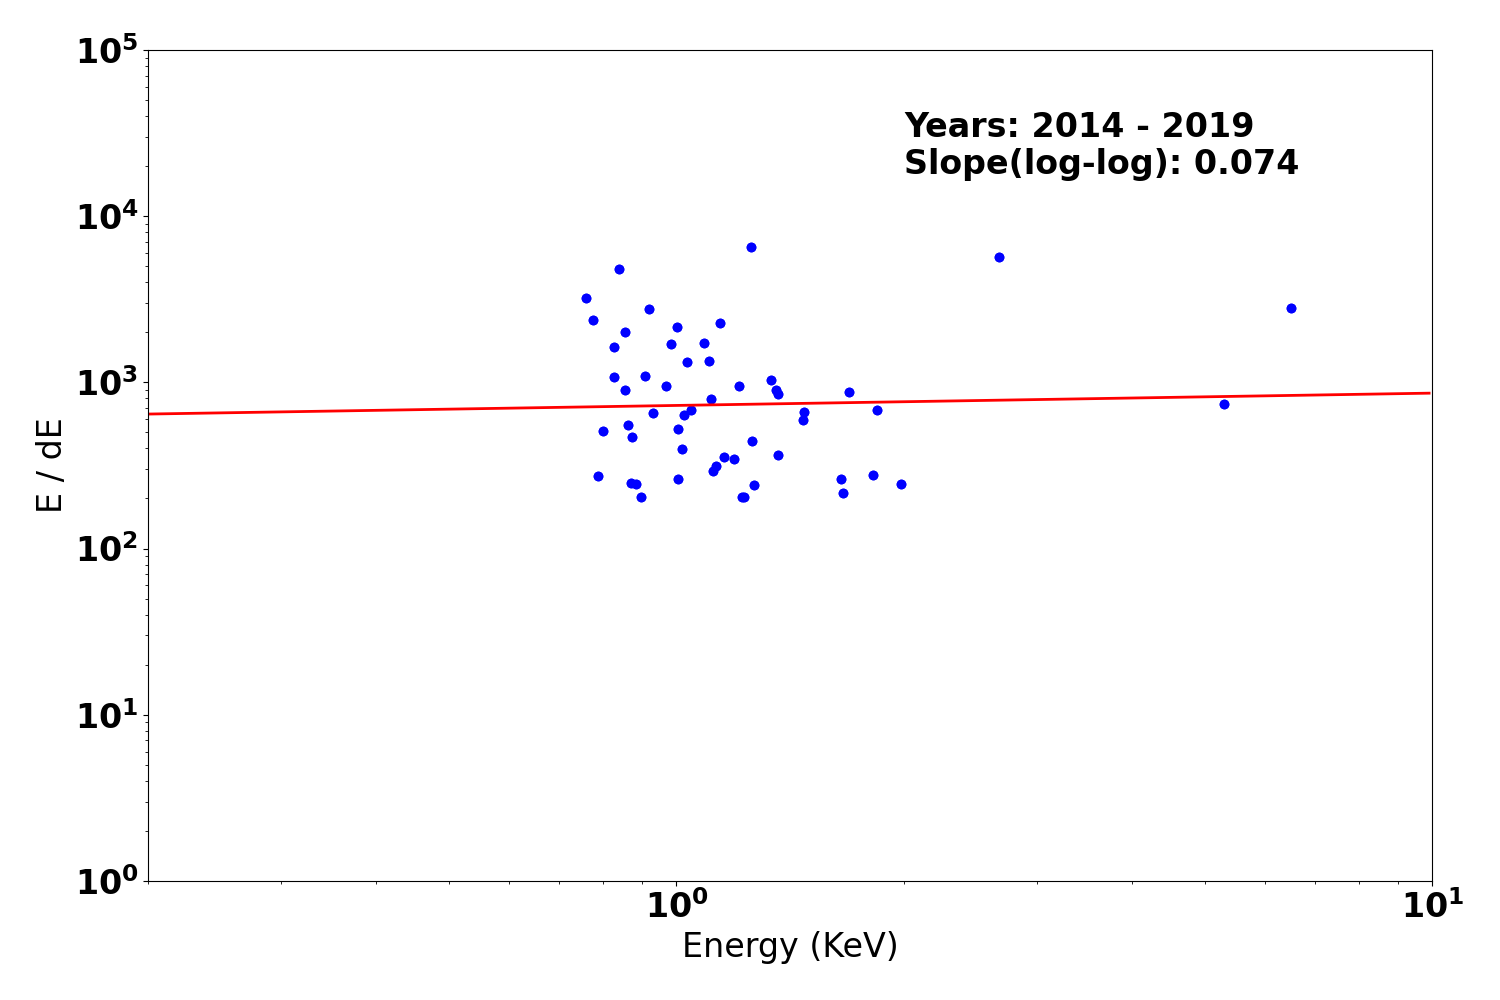
We plot E/dE vs. E for fits to detected lines with fwhm_error/fwhm less than 0.15 for the plus and minus arms of HEG, MEG, and LEG. Also shown are conservative (dotted line) and optimistic (dashed line) pre-launch resolving power expectations.
We have selected only calibration observations of Capella, HR1099, and Sigma Gem. See MIT technotes for a parallel analysis.
| Year 2014 - | |
|---|---|
| Letg minus side | Letg plus side |
 |
 |
| Metg minus side | Metg plus side |
 |
 |
| Hetg minus side | Hetg plus side |
 |
 |
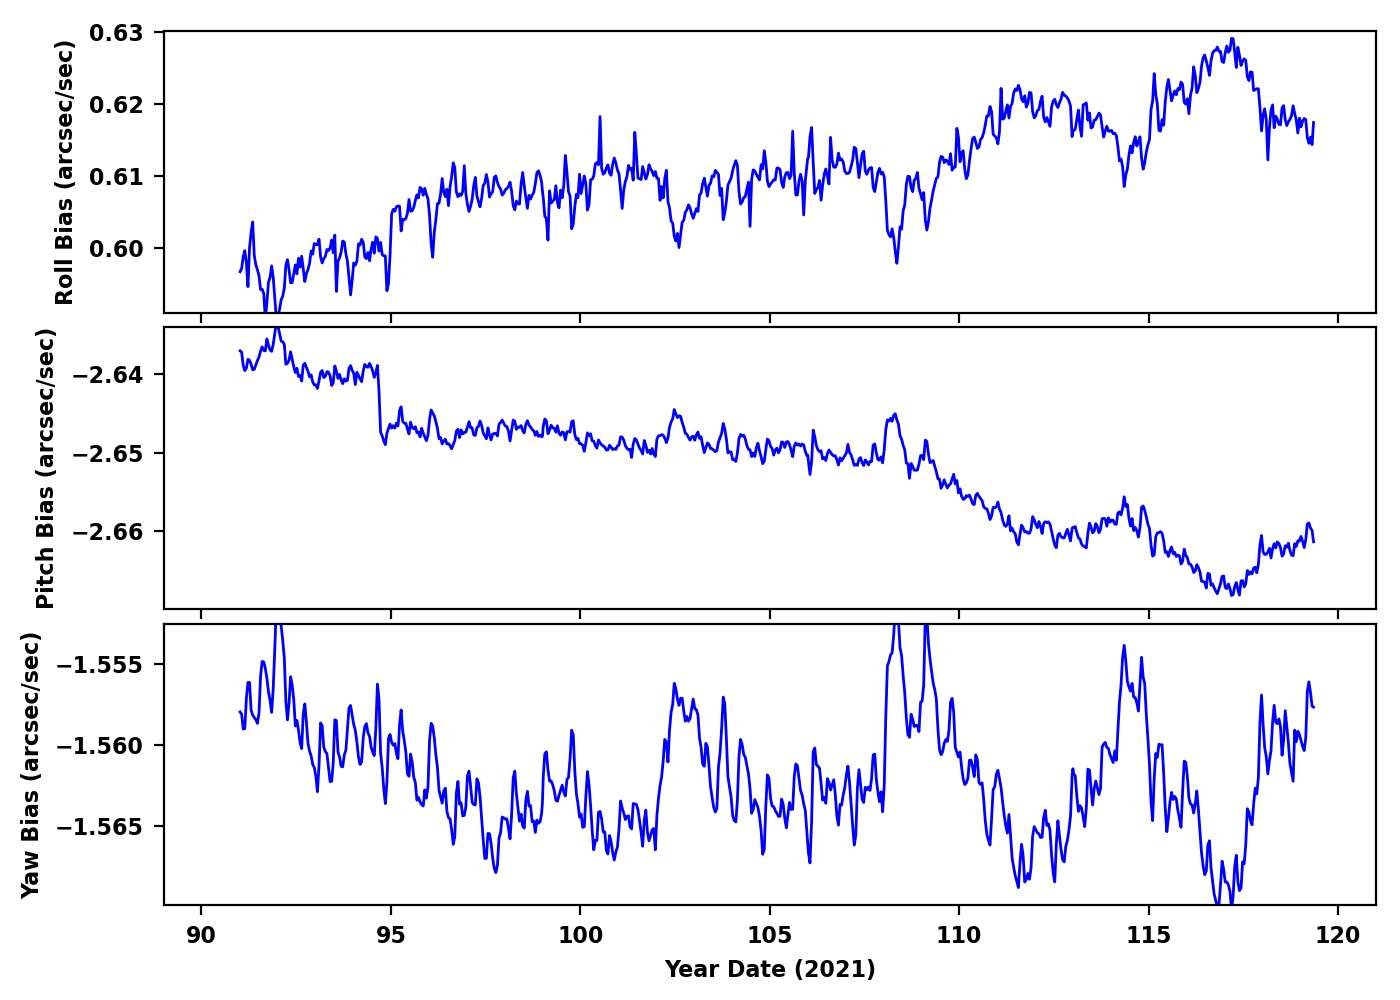
PCAD
ACA Trending
| ACIS |
)
|
)
|
)
|
|
|---|---|---|---|---|
)
|
)
|
)
| ||
| HRCI |
)
|
)
|
)
|
)
|
| HRCI |
)
|
)
|
)
|
)
|
Gyro Bias Drift
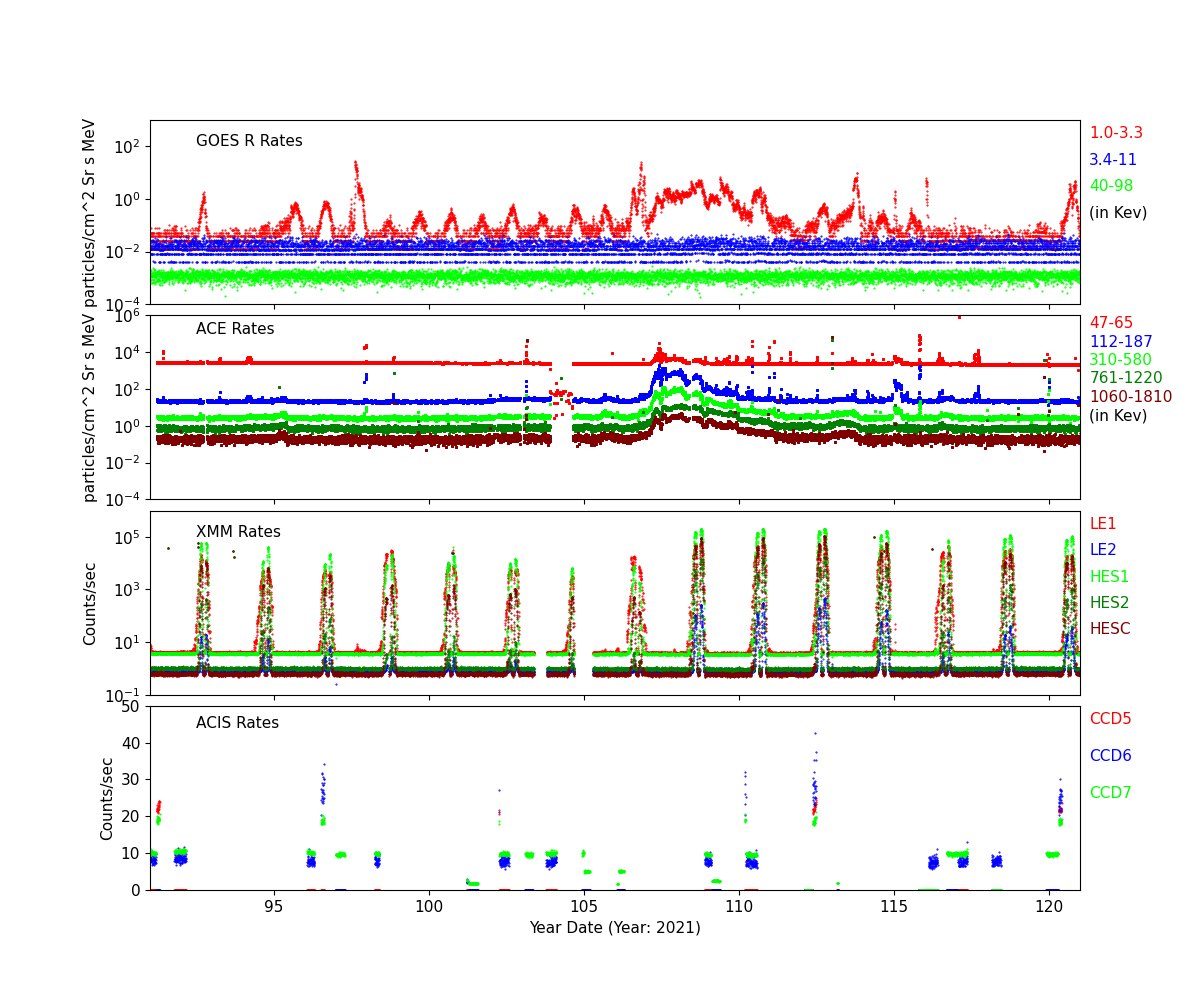
Radiation History
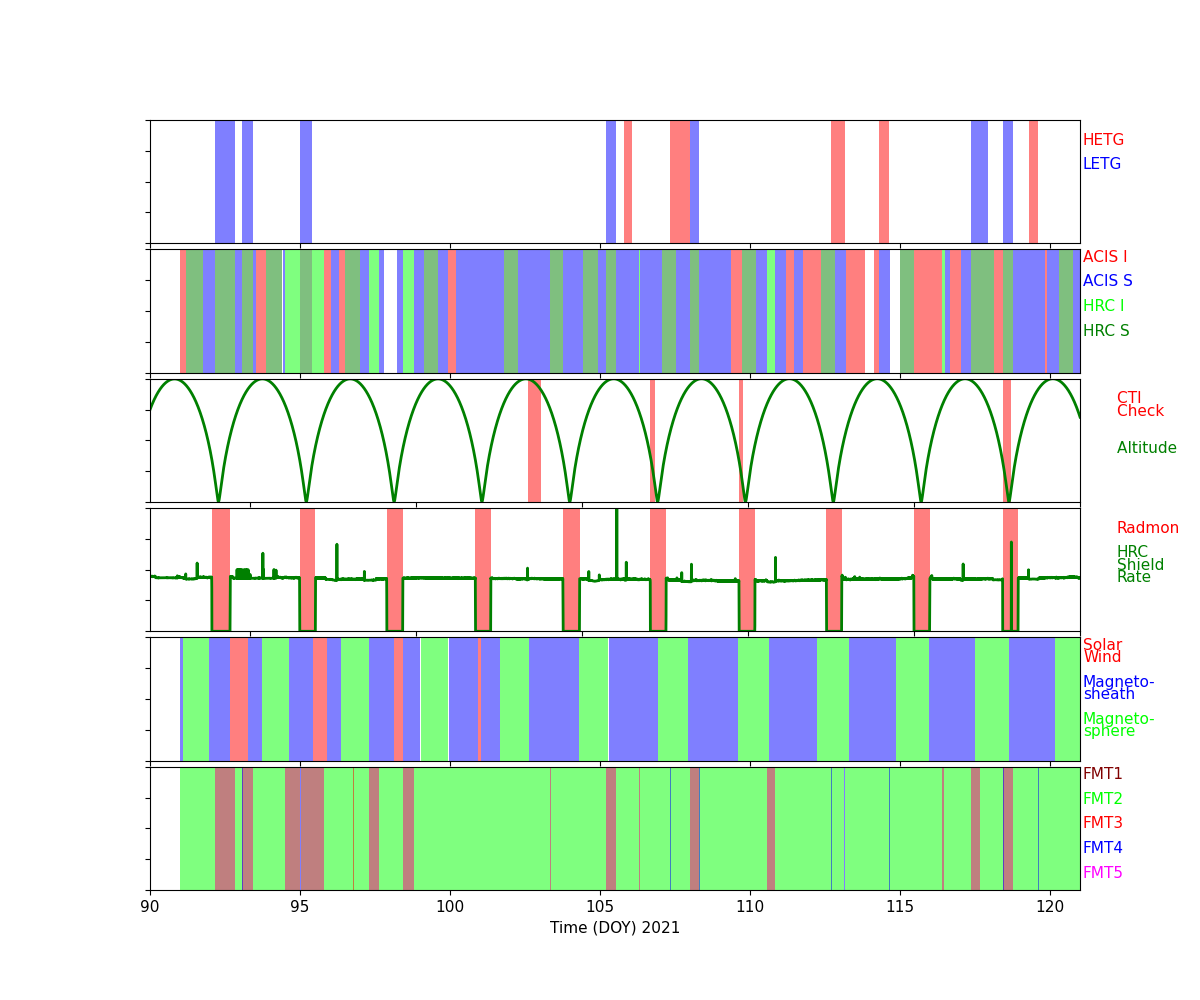
Radiation Count Rates of Apr 2021
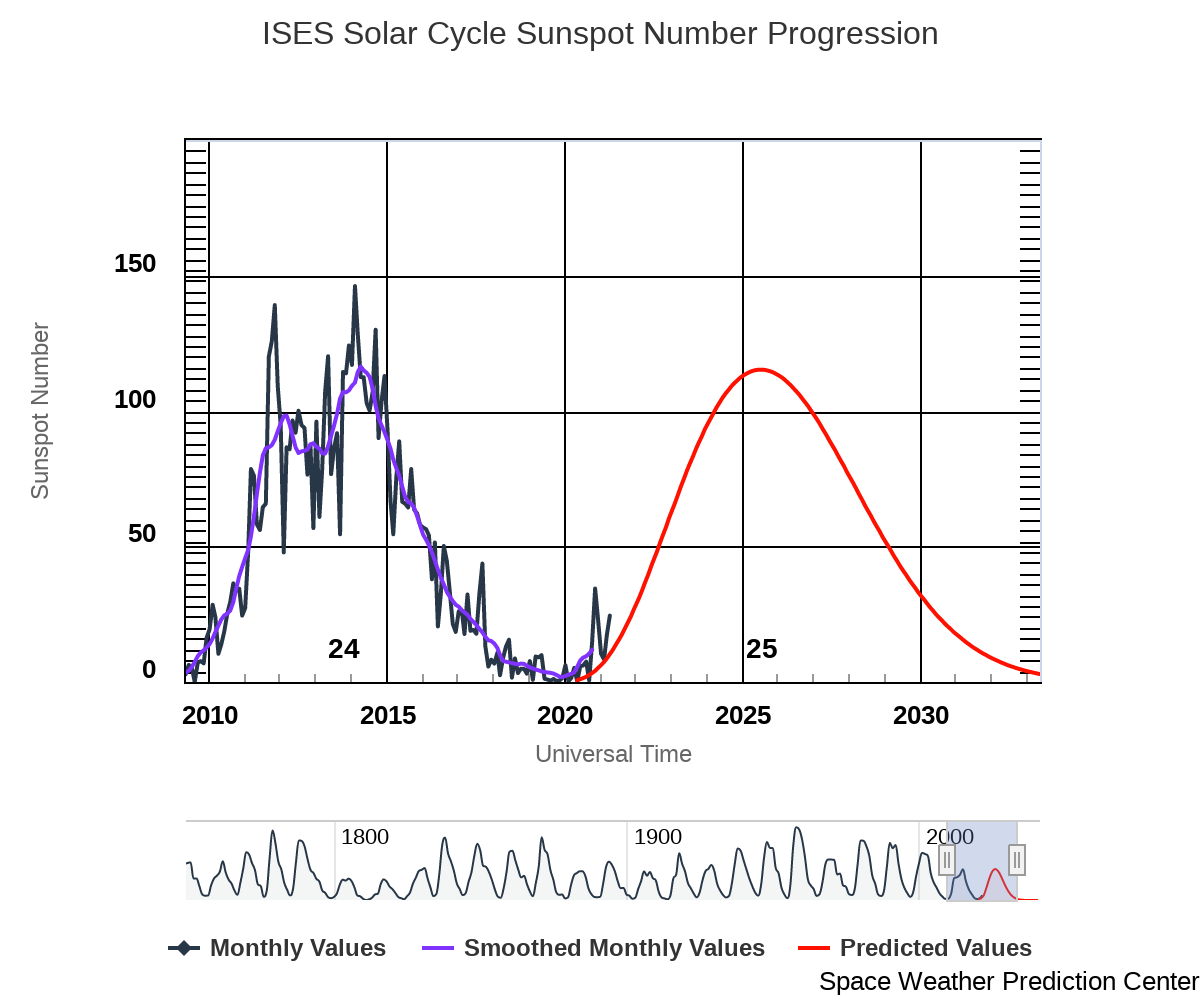
Sun Spot History (See:NOAA Page)
SIM
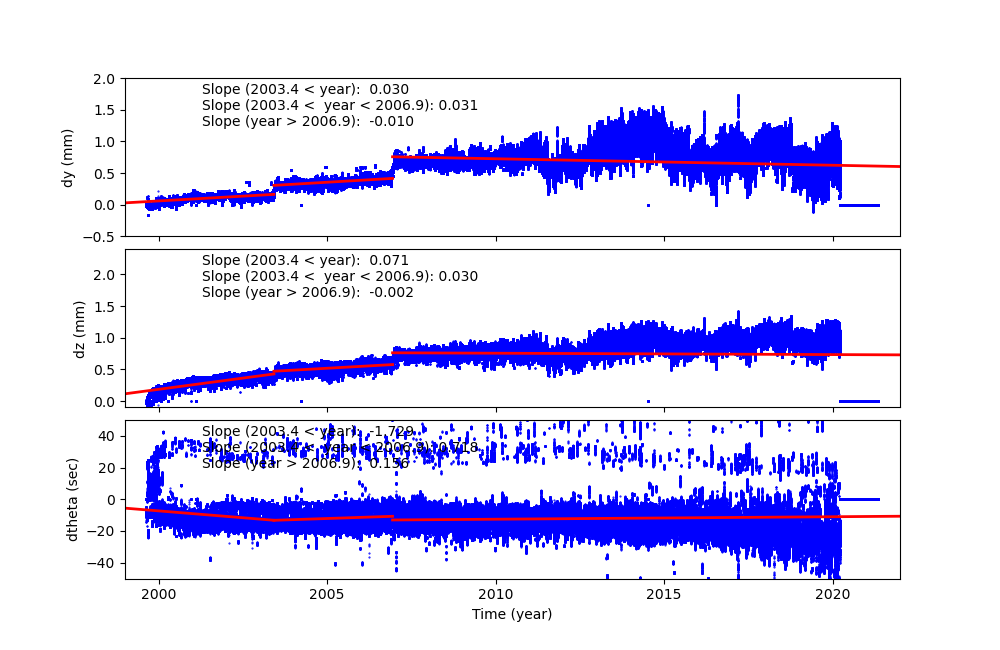
SIM Shift and Twist
SIM Shift and Twist Trend The following plots show trends of SIM shifts (dy and dz) and twist (dtheta). All quantities are directly taken from pcaf*_asol1.fits files. The units are mm for dy and dz, and degree for dtheta. We fit three lines separated before and after (Days of Mission)= 1400 (May 21, 2003), 2700 (Dec 11, 2006), and 4400 (Aug 07, 2011). The unit of slopes are mm per day or degree per day.
The sudden shift around DOM = 1400, 2700 and 4400 are due to fid light drift (see a memo by Aldcroft fiducial light drift). On the dtheta plot, two tracks are clearly observed. The track around 0.01 is due to HRC-I, and all others are clustered around -0.002. For more detail, please see SIM Shift and Twist Trend page
Trending
Quarterly Trends
- EPS Batteries
| Previous Quarter | |||||||
| MSID | MEAN | RMS | DELTA/YR | DELTA/YR/YR | UNITS | DESCRIPTION | |
| eb2ci | off | 1.359e-04 | 3.030e-05 | 0.29 +/- 0.07 | -0.00 +/- 0.00 | AMP | BATT 2 CHARGE CURRENT | on | -0.011 | 0.012 | 0.33 +/- 0.33 | (0.00+/-0.00)e0 |
|---|---|---|---|---|---|---|---|
| eb2di | off | -2.801e-04 | 7.519e-05 | 0.02 +/- 0.18 | (3.39+/-3.39)e-5 | AMP | BATT 2 DISCHARGE CURRENT | on | 0.003 | 0.059 | 0.42 +/- 1.54 | (0.00+/-0.00)e0 |
| eb2v | off | 0.001 | 3.495e-05 | 32.33 +/- 0.09 | (3.75+/-36.83)e-4 | V | BATT 2 VOLTAGE | on | 0.009 | 0.027 | 31.99 +/- 0.71 | (0.00+/-0.00)e0 |
| ecnv1v | -2.631e-06 | 2.839e-06 | 14.89 +/- 0.01 | 0.00 +/- 0.00 | V | CONV 1 +15V OUTPUT | |
| ecnv2v | -4.442e-05 | 4.247e-06 | 14.85 +/- 0.01 | 0.01 +/- 0.00 | V | CONV 2 +15V OUTPUT | |
| ecnv3v | -4.026e-06 | 1.652e-06 | 15.29 +/- 0.00 | (1.68+/-3.46)e-4 | V | CONV 3 +15V OUTPUT | |
- Spacecraft Electronics
| Previous Quarter | |||||||
| MSID | MEAN | RMS | DELTA/YR | DELTA/YR/YR | UNITS | DESCRIPTION | |
| elbi | -0.003 | 6.656e-04 | 54.05 +/- 1.56 | 0.17 +/- 0.27 | AMP | LOAD BUS CURRENT | |
|---|---|---|---|---|---|---|---|
| elbv | off | 0.004 | 4.961e-05 | 28.26 +/- 0.19 | 0.00 +/- 0.02 | V | LOAD BUS VOLTAGE | on | -0.014 | 0.006 | 28.81 +/- 0.17 | (0.00+/-0.00)e0 |
- OBA Heater
| Previous Quarter | |||||||
| MSID | MEAN | RMS | DELTA/YR | DELTA/YR/YR | UNITS | DESCRIPTION | |
| oobthr04 | -0.010 | 4.883e-04 | (3.01+/-0.01)e2 | 0.14 +/- 0.42 | K | RT 27: HRMA STRUT | |
|---|---|---|---|---|---|---|---|
| oobthr12 | -0.015 | 8.238e-04 | (3.00+/-0.02)e2 | -0.70 +/- 0.66 | K | RT 35: OBA CONE | |
| oobthr26 | -0.023 | 0.001 | (3.04+/-0.04)e2 | -1.41 +/- 0.99 | K | RT 48: OBA CONE | |
| oobthr38 | -4.008e-05 | 9.753e-06 | (2.83+/-0.00)e2 | -0.00 +/- 0.00 | K | RT 60: TFTE CONE | |
| oobthr44 | -0.012 | 8.284e-04 | (3.02+/-0.02)e2 | 0.51 +/- 0.70 | K | RT 66: TFTE COVER | |
| oobthr50 | -0.012 | 6.081e-04 | (2.97+/-0.01)e2 | 0.18 +/- 0.55 | K | RT 76: S/C STRUT | |
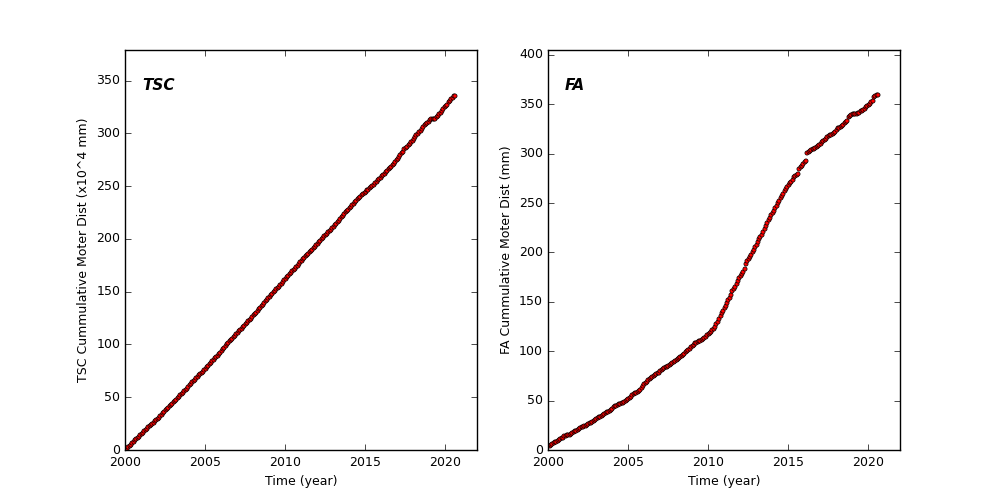
Spacecraft Motions
TSC and FA Cummulative Moter Distance
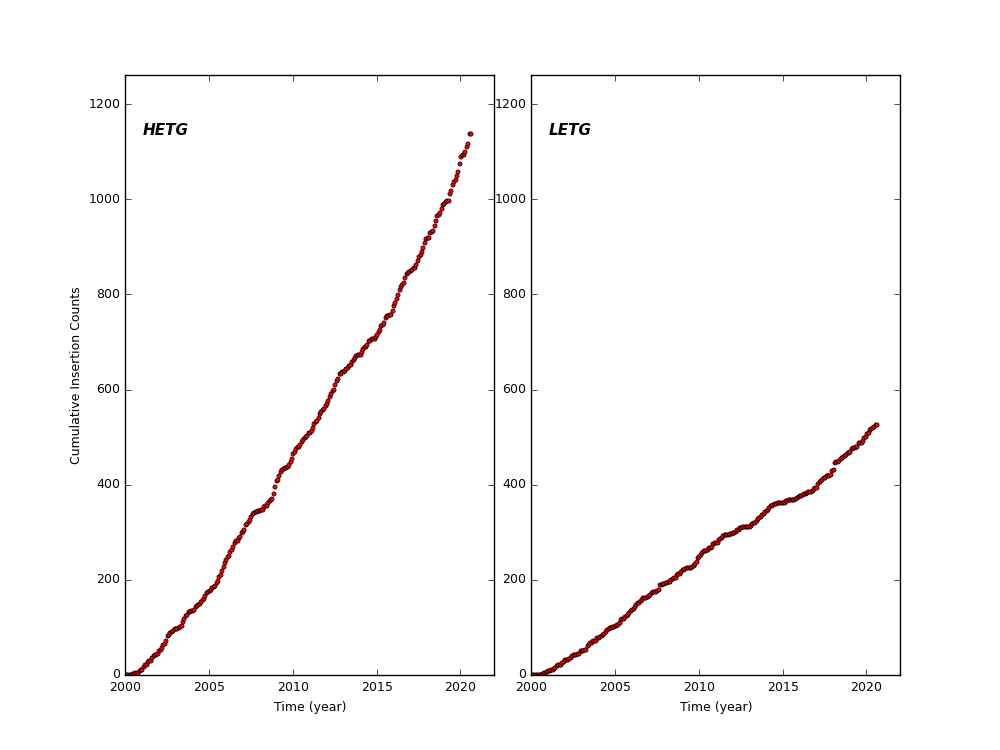
HETG and LETG Cummulative Insertion Counts
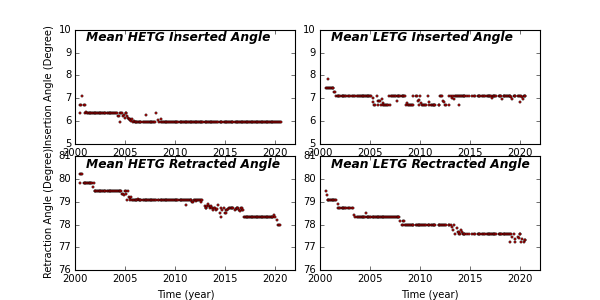
HETG/LETG Insertion/Retraction Angle
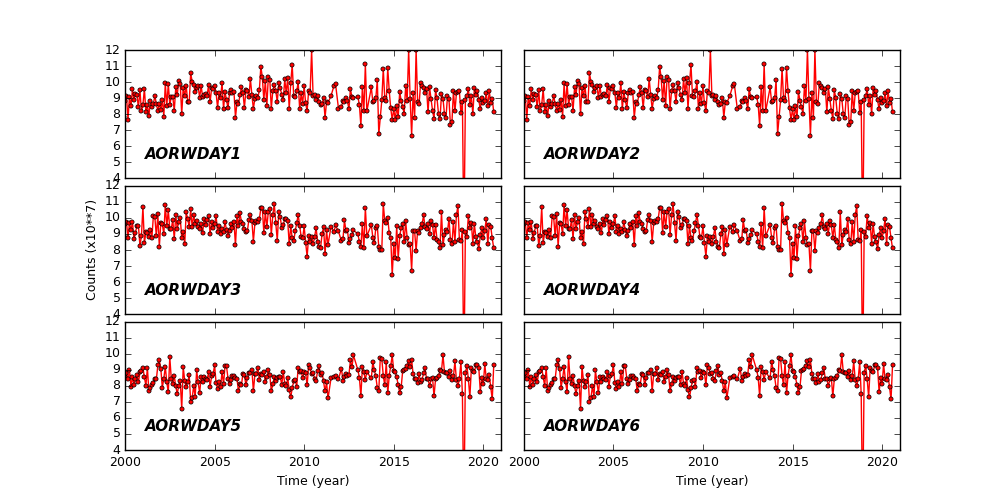
Reaction Wheel Rotations