ACIS
ACIS DOSE Registered-Photon-Map
The steps we took to compute the dose map are;
- Level 1 Event files for a specified month are obtained from archive.
- Image data including I2, I3, S2, S3 CCDs are extracted from all event files.
- All the extracted image data were merged to create a month long exposure map for the month.
- The exposure map is opened with ds9, and check a distribution of count rates against energy. From this, estimate the upper threshold value. Any events beyond this upper threshold are assumed erroneous events such as bad pixels.
- Using this upper threshold, the data is filtered, and create a cleaned exposure map for the month.
- The exposure map from each month from the Sep 1999 is added up to create a cumulative exposure map for each month.
- Using fimgstatistic, we compute count rate statistics for each CCDs.
- For observations with high data drop rates (e.g., Crab nebula, Cas A), we corrected the observations by adding events.
Please check more detail plots at Telemetered Photon Dose Trend page.
)
)
)
Statistics:
# IMAGE     NPIX     MEAN        RMS        MIN     MAX
ACIS_mar21 6004901       5.912         7.666           0.0      393


I2 node 0  262654	7.043748	3.257603	0.0	 64.0
I2 node 1  262654	7.382715	3.464615	0.0	113.0
I2 node 2  262654	7.253635	3.265505	0.0	 84.0
I2 node 3  262654	7.171610	3.453183	0.0	339.0

I3 node 0  262654	8.121999	3.572305	0.0	164.0
I3 node 1  262654	7.662591	3.316669	0.0	109.0
I3 node 2  262654	7.605500	3.250392	0.0	 87.0
I3 node 3  262654	7.729460	3.376713	0.0	119.0

S2 node 0  262654	6.013059	2.922271	0.0	 46.0
S2 node 1  262654	6.053824	3.073399	0.0	171.0
S2 node 2  262654	6.303098	3.107670	0.0	205.0
S2 node 3  262654	6.273041	3.083219	0.0	315.0

S3 node 0  262654	9.653359	4.430739	0.0	 87.0
S3 node 1  262654	11.045518	4.420815	0.0	393.0
S3 node 2  262654	10.792693	3.782250	0.0	 52.0
S3 node 3  262654	9.662267	3.508087	0.0	 37.0
)
)
)
Statistics:
 IMAGE     NPIX      MEAN        RMS           MIN      MAX
ACIS_total   6004901       2472.159         3174.735           0.0   137610


I2 node 0  262654	2139.069223	428.518226	458.0	12666.0
I2 node 1  262654	2249.767729	605.440262	470.0	115815.0
I2 node 2  262654	2276.204696	481.308617	484.0	13162.0
I2 node 3  262654	2281.326989	588.354662	460.0	28745.0

I3 node 0  262654	2448.095650	601.920277	450.0	12847.0
I3 node 1  262654	2525.288195	1715.904758	487.0	55575.0
I3 node 2  262654	2244.112210	419.310925	456.0	13197.0
I3 node 3  262654	2236.800250	451.263598	425.0	33904.0

S2 node 0  262654	2885.118777	461.137073	1582.0	22205.0
S2 node 1  262654	3057.301552	686.662741	1760.0	16663.0
S2 node 2  262654	3380.020290	681.542389	2183.0	28532.0
S2 node 3  262654	3345.737911	535.363939	1927.0	67704.0

S3 node 0  262654	5105.144757	2453.316742	2232.0	37134.0
S3 node 1  262654	6332.688718	2326.379005	0.0	37007.0
S3 node 2  262654	5067.056943	1292.374004	2275.0	26210.0
S3 node 3  262654	3941.329540	688.917905	2406.0	25568.0
)
|
)
|
)
|
)
|
| Dec 2020 | Sep 2020 | Jun 2020 | Mar 2020 |
|---|
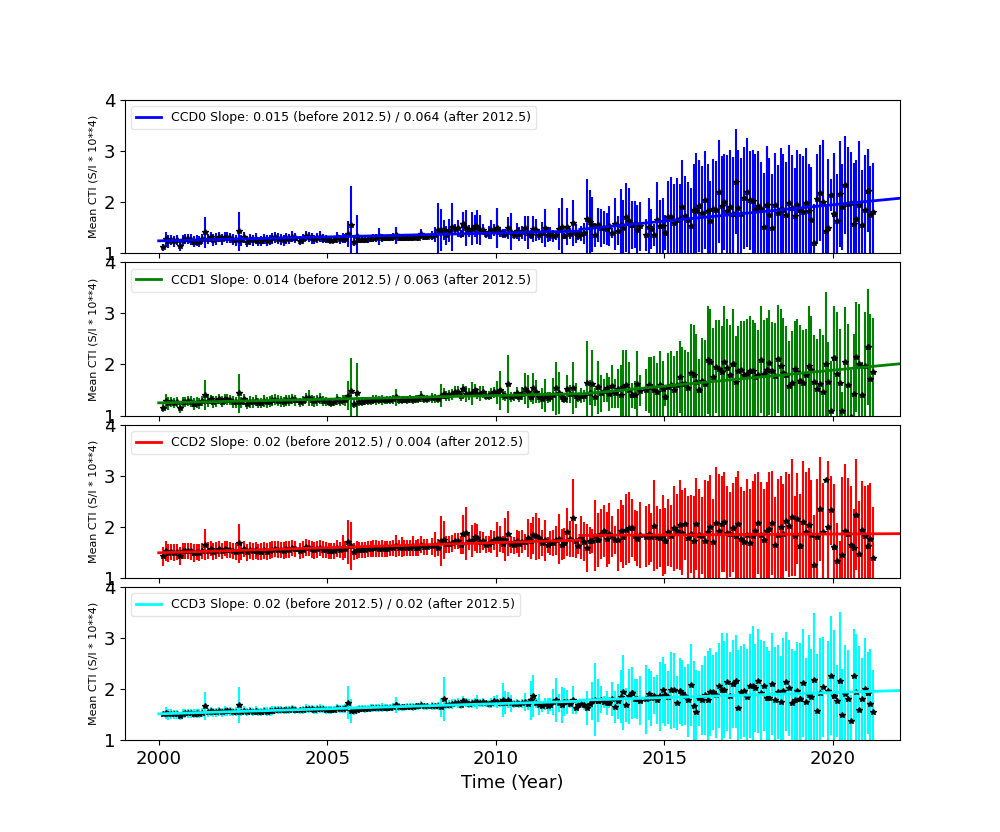
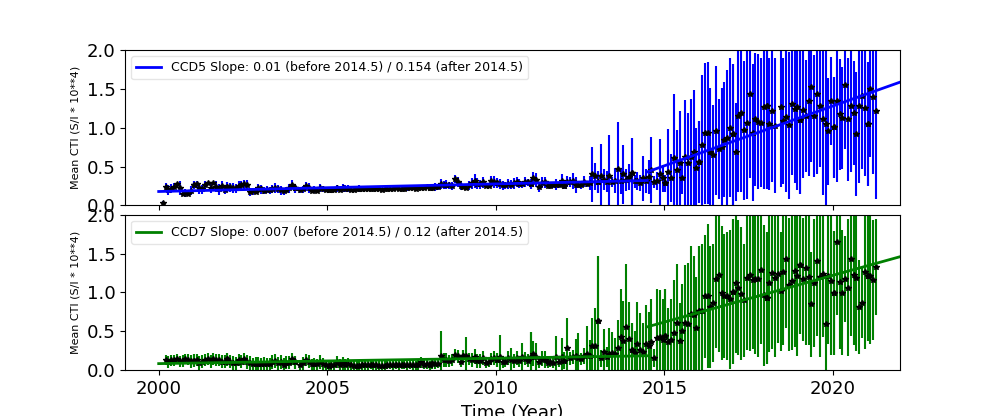
The Mean Detrended CTI
We report CTIs with a refined data definition. CTIs were computed for the temperature dependency corrected data. Please see CTI page for detailed explanation. CTI's are computed for Mn K alpha, and defined as slope/intercept x10^4 of row # vs ADU. Data file: here
Imaging CCDs
Spectral CCDs
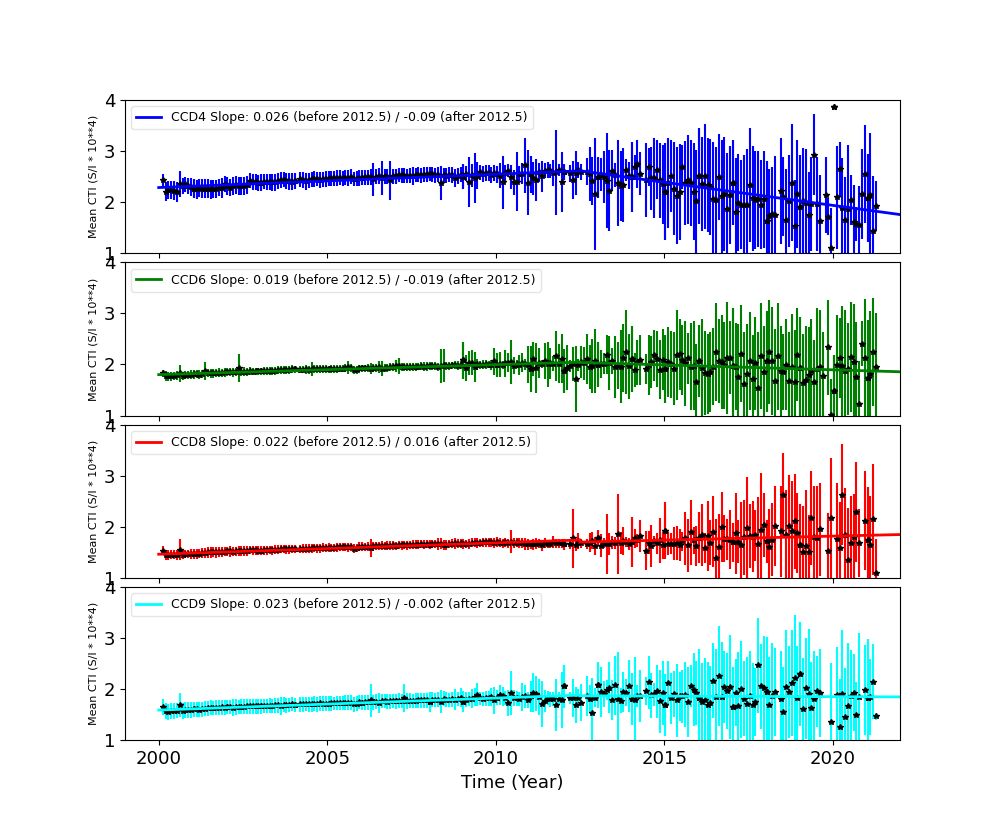
Backside CCDs
Focal Plane Temperature
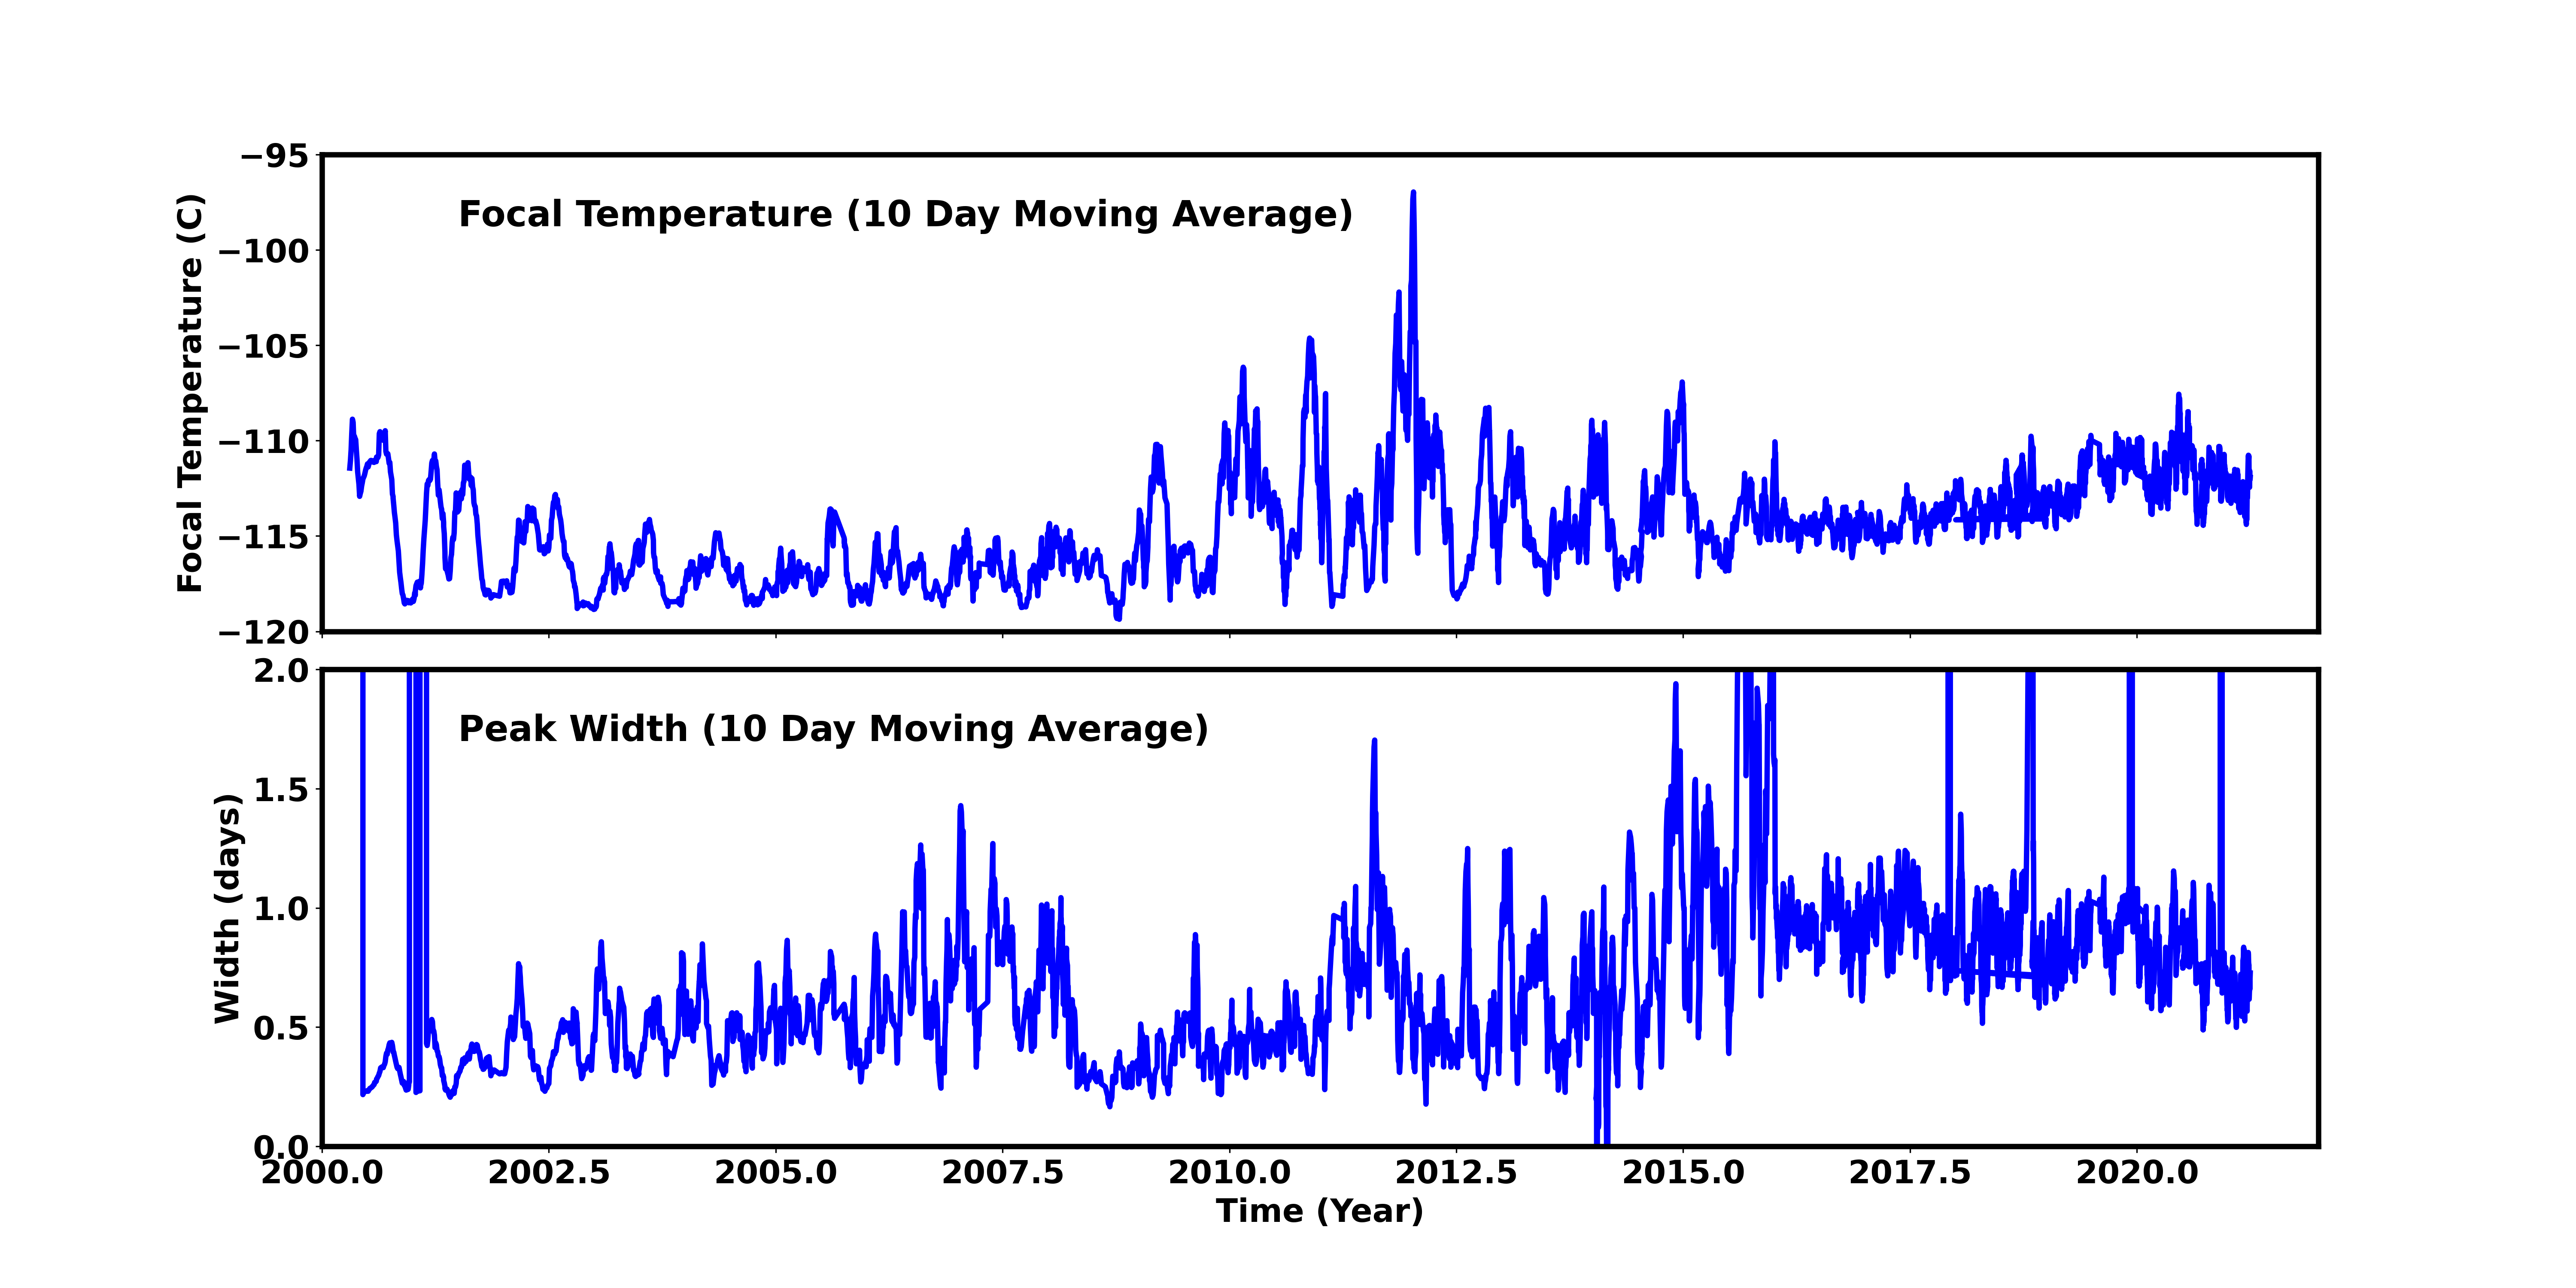
Mar 2021 Focal Temperature
| The Mean (max) FPT: | |
|---|---|
| -112.66 | +/- 3.07 C |
| Mean Width: | |
| 0.72 | +/- 0.45 days |
Averaged Focal Plane Temperature
We are using 10 period moving averages to show trends of peak temperatures and peak widths. Note, the gaps in the width plot are due to missing/corrupted data.
Focal Plane Temperature, Sun Angle and Altitude

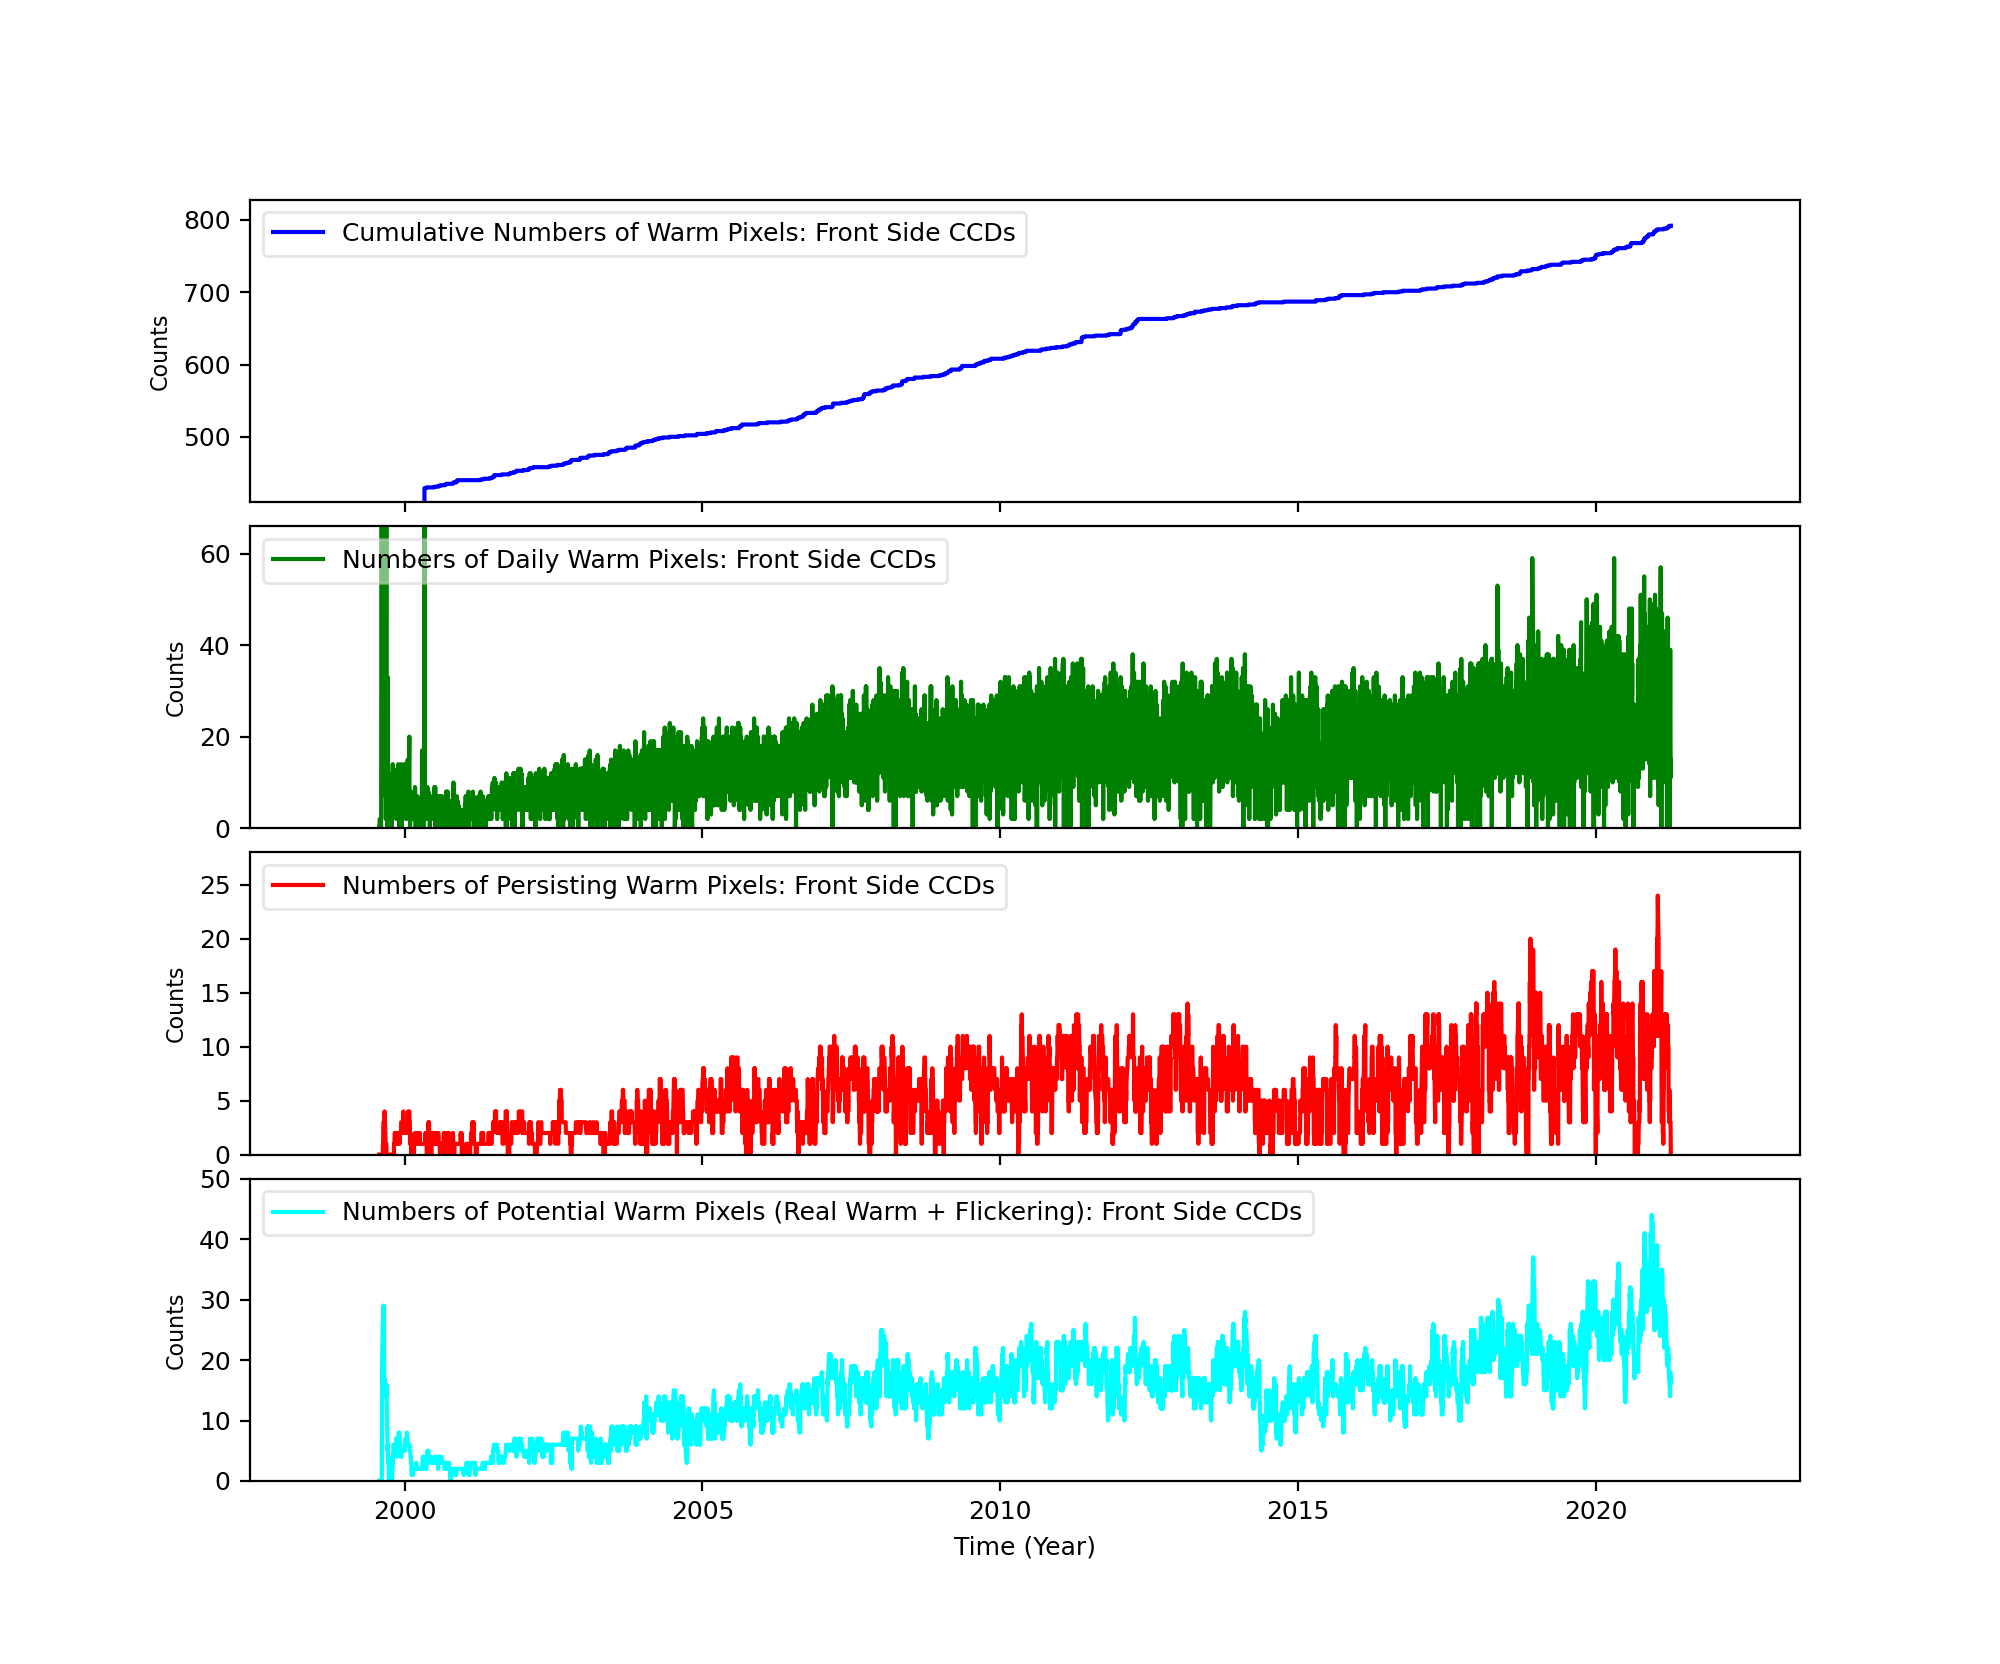
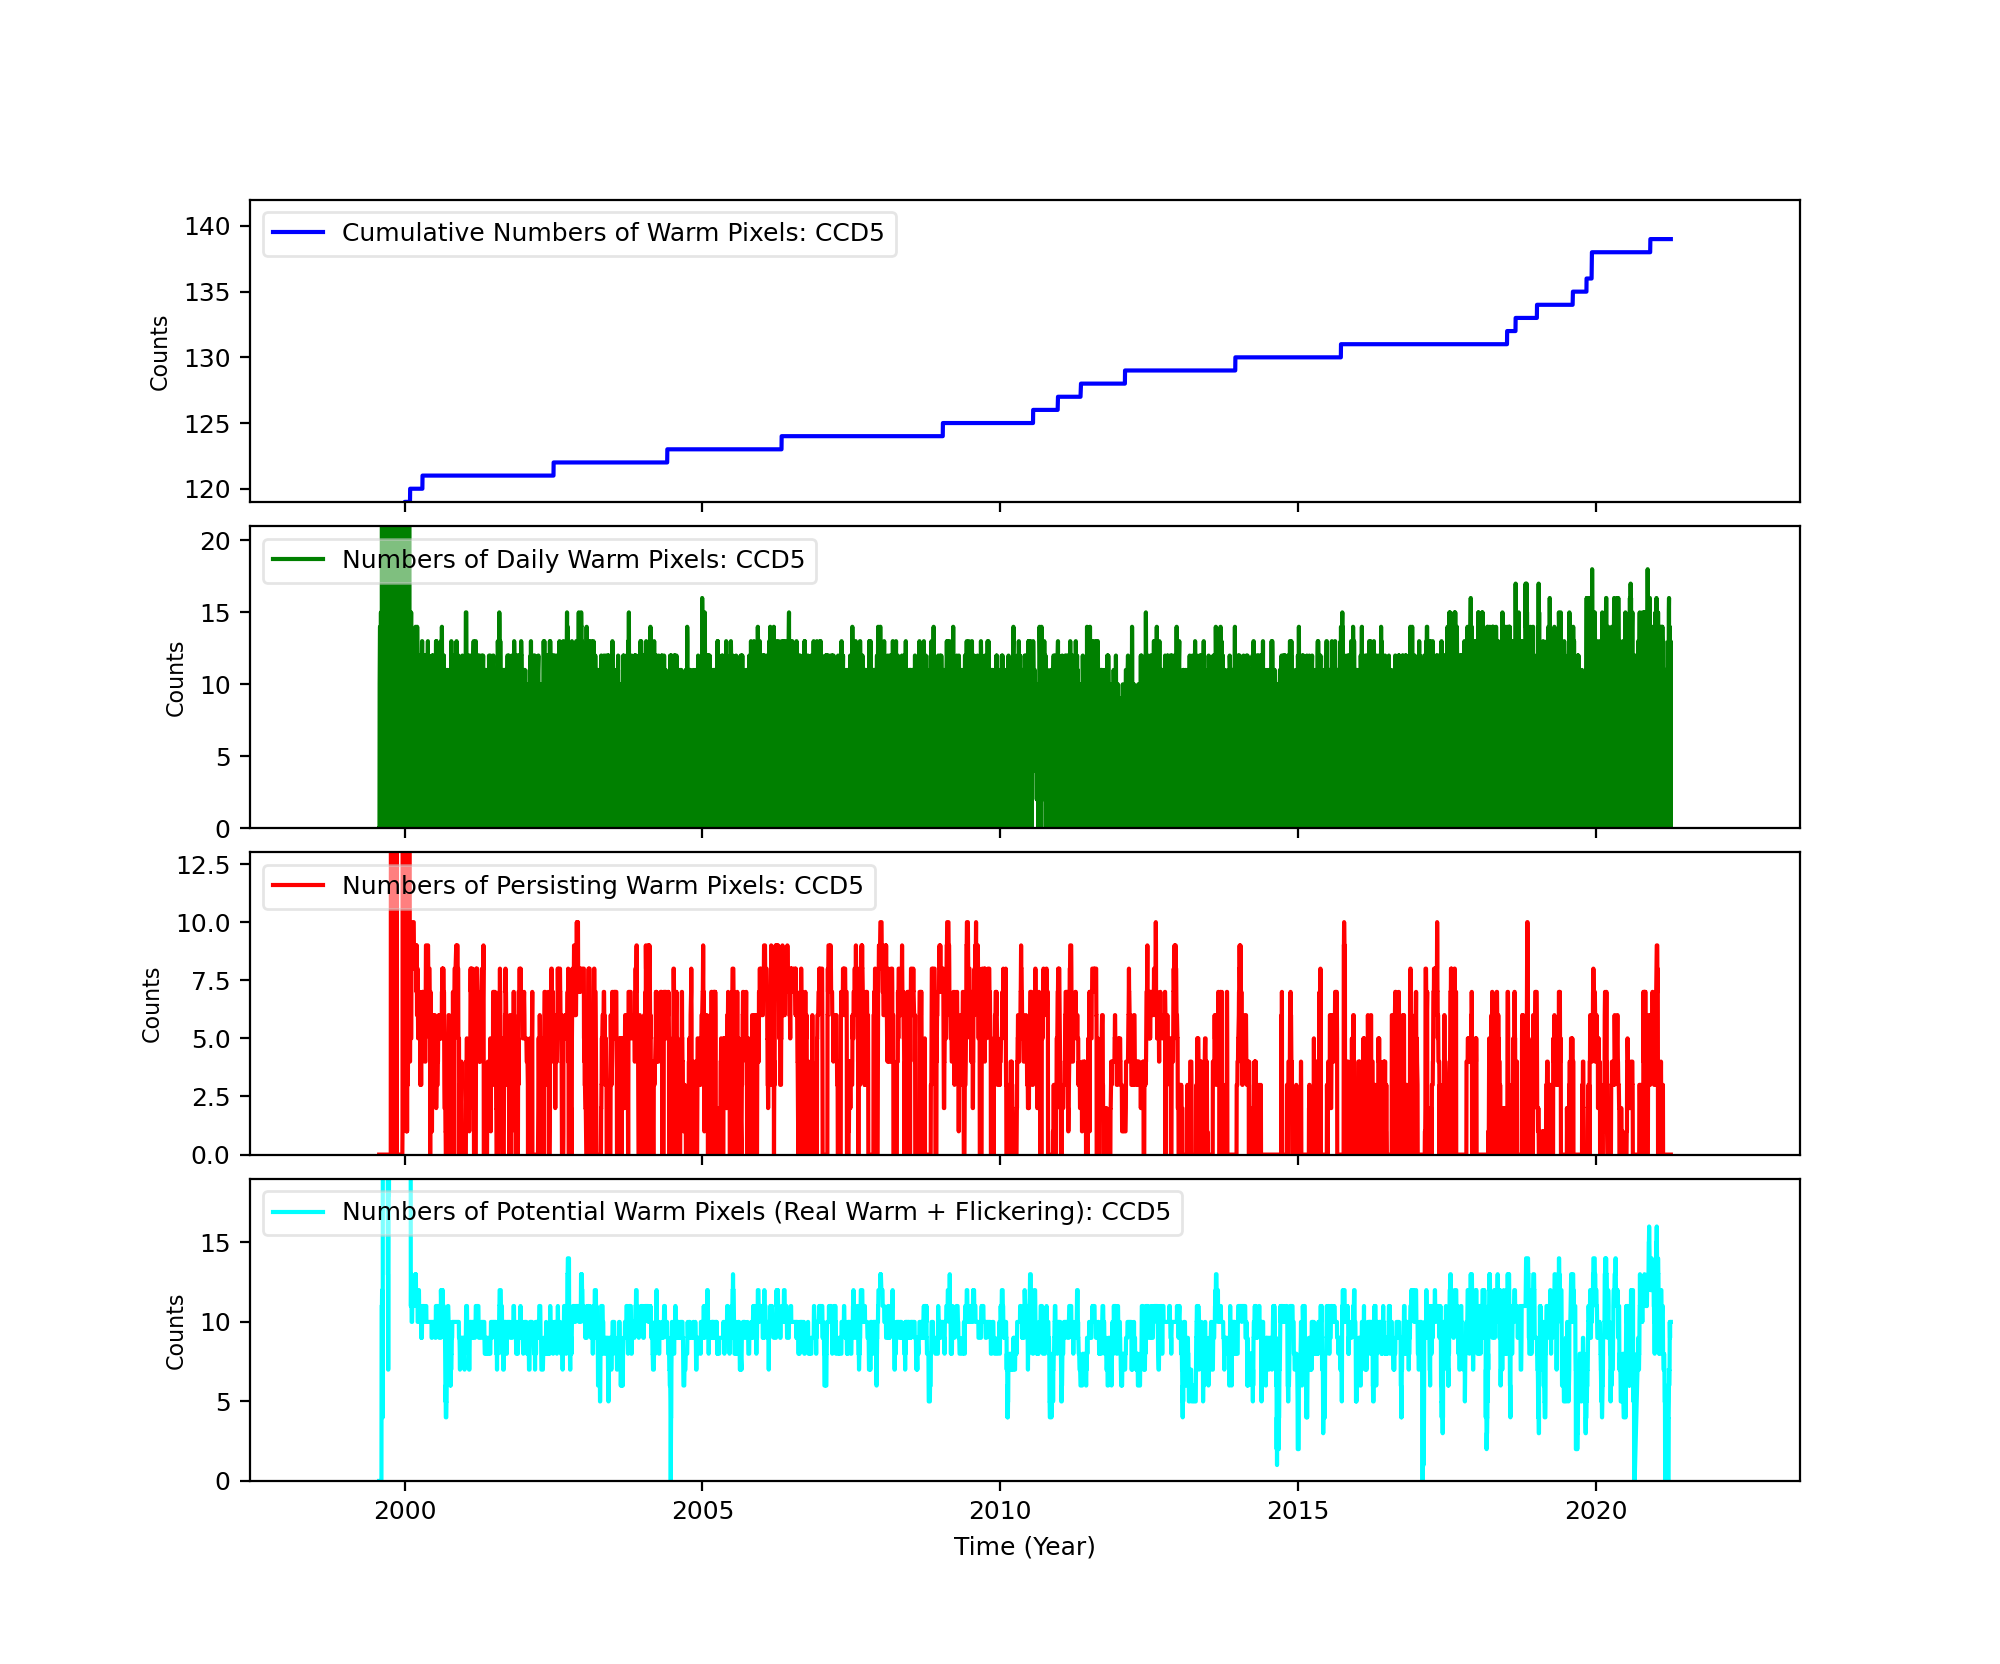
Bad Pixels
The plots below were generated with a new warm pixel finding script. Please see Acis Bad Pixel Page for details.
Front Side CCDs
Back Side CCD (CCD5)
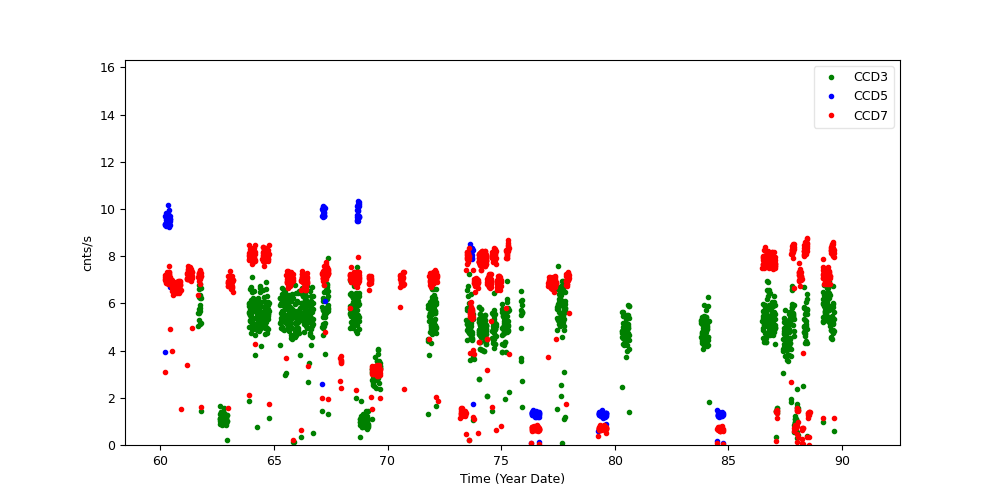
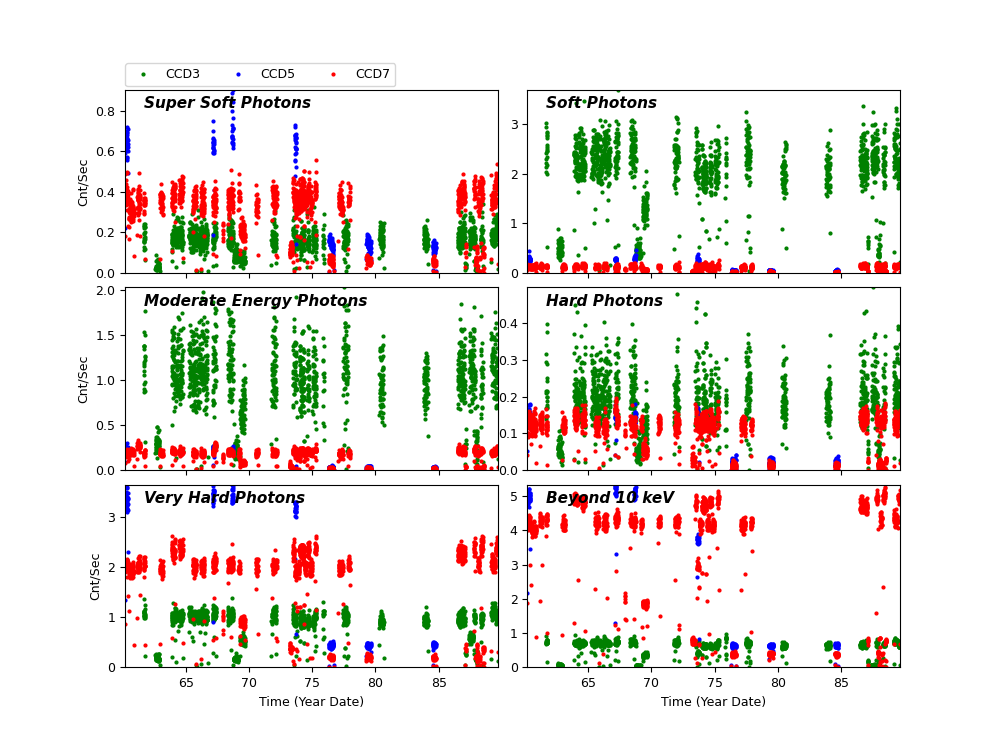
Science Instrument Background Rates
| Name | Low (keV) | High(KeV) | Description |
|---|---|---|---|
| SSoft | 0.00 | 0.50 | Super soft photons |
| Soft | 0.50 | 1.00 | Soft photons |
| Med | 1.00 | 3.00 | Moderate energy photons |
| Hard | 3.00 | 5.00 | Hard Photons |
| Harder | 5.00 | 10.00 | Very Hard photons |
| Hardest | 10.00 | Beyond 10 keV |
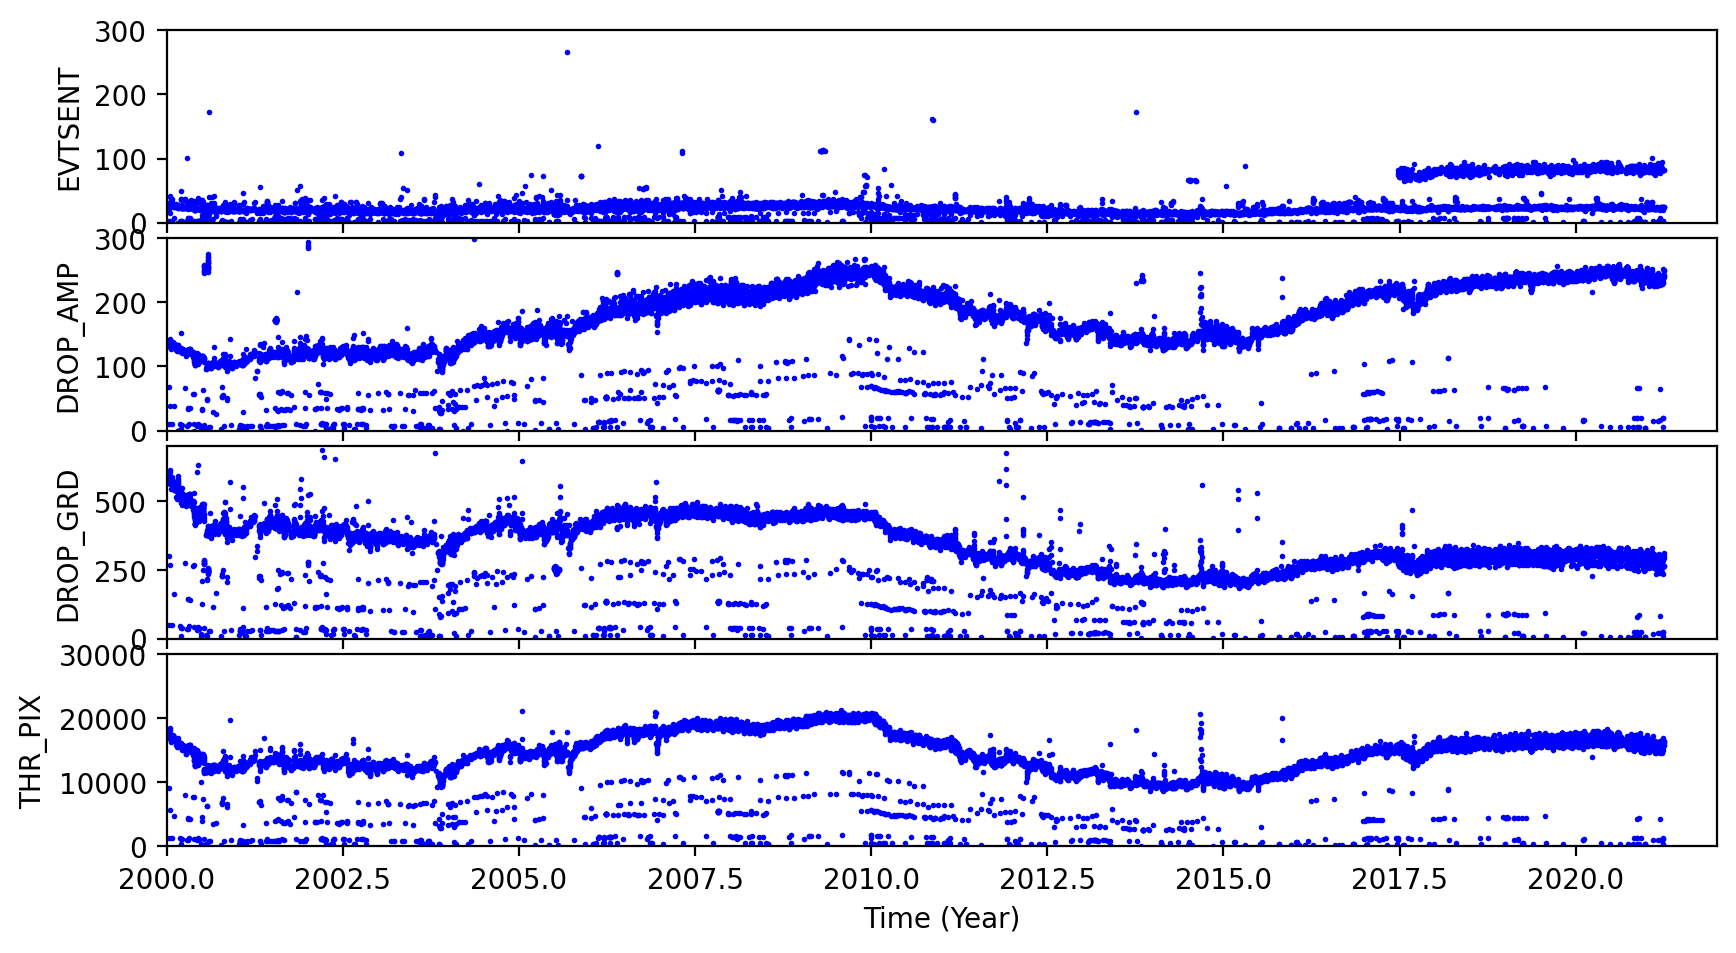
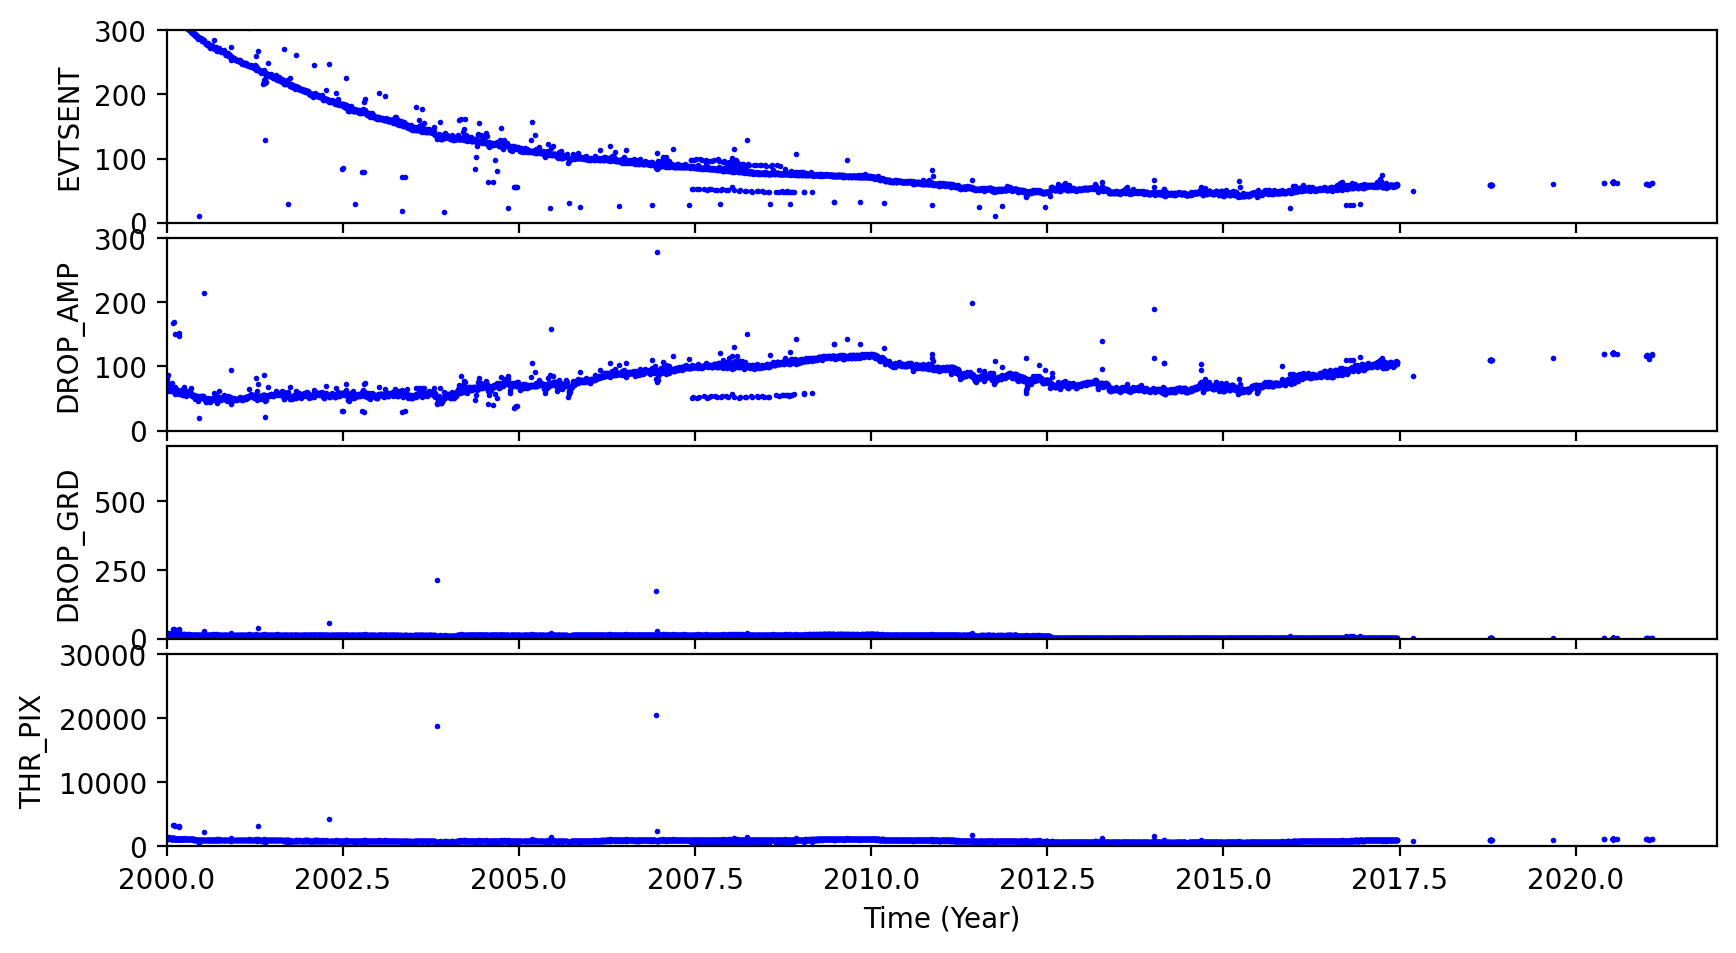
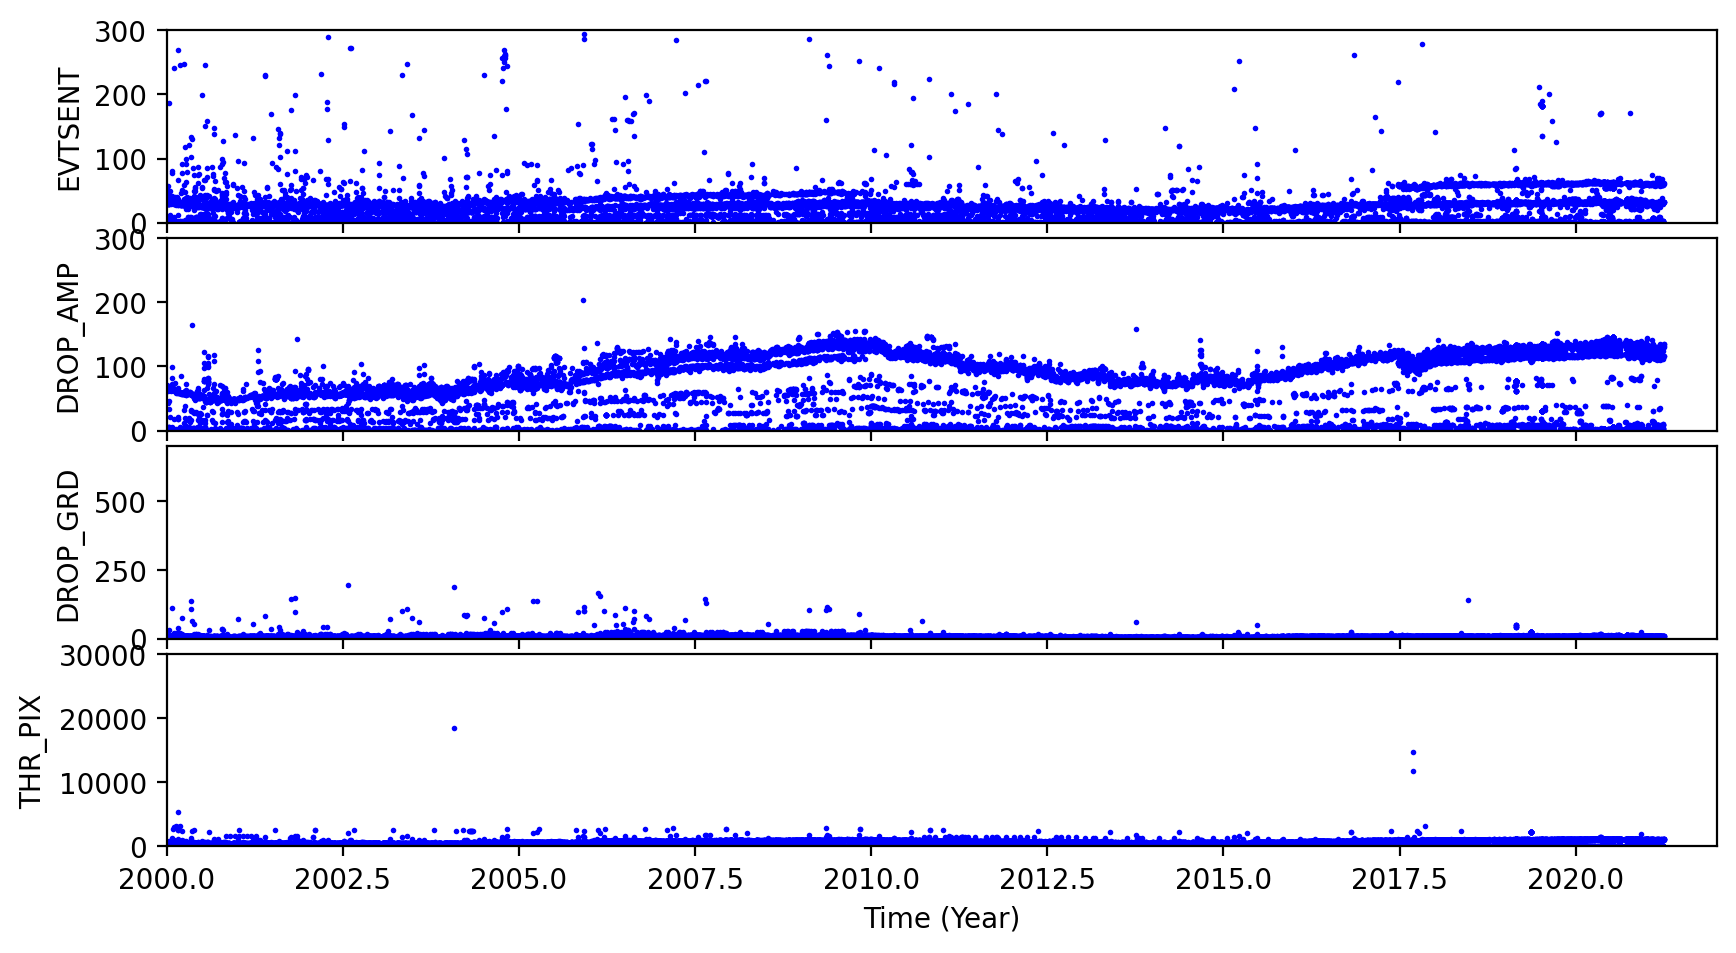
ACIS Rejected Events
The links below are plots of stat1 quantities, showing on-board rejected events. The average EVTSENT, DROP_AMP, DROP_POS, DROP_GRD, THR_PIX, and maximum BERR_SUM obtained from L1 acis*stat1.fits files are plotted for each observation. CTI observations are plotted separately from regular science observations.
Column definitions:
- EVTSENT - number of events sent in data record
- DROP_AMP - number of discarded events due to corrected amplitude
- DROP_POS - number of discarded events due to CCD position
- DROP_GRD - number of discarded events due to grade code
- THR_PIX - number of pixels above respective threshold level
- BERR_SUM - number of pixel bias errors so far in science run
Note the half-life decline of the CTI source is clearly evidenced in the steady janline of EVTSENT.
CCD3 Observations
| CTI | Science |

|
|
|---|
CCD7 Observations
| CTI | Science |
|
|
|---|
ACIS Gain Trends
We computed ACIS gain and offset from ACIS event1 files used in CTI computation, following the step described by C. Grant ACIS gain @ -120C page.
Instead computing gains and offsets from individual observations, we combined all data from each month and computed an monthly averaged gain and offset.
The following plots show CCD3 and CCD5 gains and offset trends.
| CCD 3 | |
)
|
)
|
| CCD 5 | |
)
|
)
|
[an error occurred while processing this directive]
HRC
DOSE of Central 4K Pore-Pairs
Please refer to Maximum Dose Trends for more details.
)
|
|---|
IMAGE                NPIX      MEAN    STDDEV      MIN       MAX
HRCI_03_2021.fits  16777216	0.026 	0.162 	0.000 	6.000
)
IMAGE                       NPIX      MEAN    STDDEV      MIN       MAX
HRCI_08_1999_03_2021.fits  16777216	6.793 	6.214 	0.000 	311.000
)
|
|---|
IMAGE                NPIX      MEAN    STDDEV      MIN       MAX
HRCS_03_2021.fits  16777216	0.318 	0.735 	0.000 	16.000
)
IMAGE                       NPIX      MEAN    STDDEV      MIN       MAX
HRCS_08_1999_03_2021.fits  16777216	19.820 	35.247 	0.000 	1755.000
|
|
Max dose trend plots corrected for events that "pile-up"
in the center of the taps due to bad position information.
|
)
|
)
|
)
|
)
|
| Dec 2020 | Sep 2020 | Jun 2020 | Mar 2020 |
|---|
)
|
)
|
)
|
)
|
| Dec 2020 | Sep 2020 | Jun 2020 | Mar 2020 |
|---|
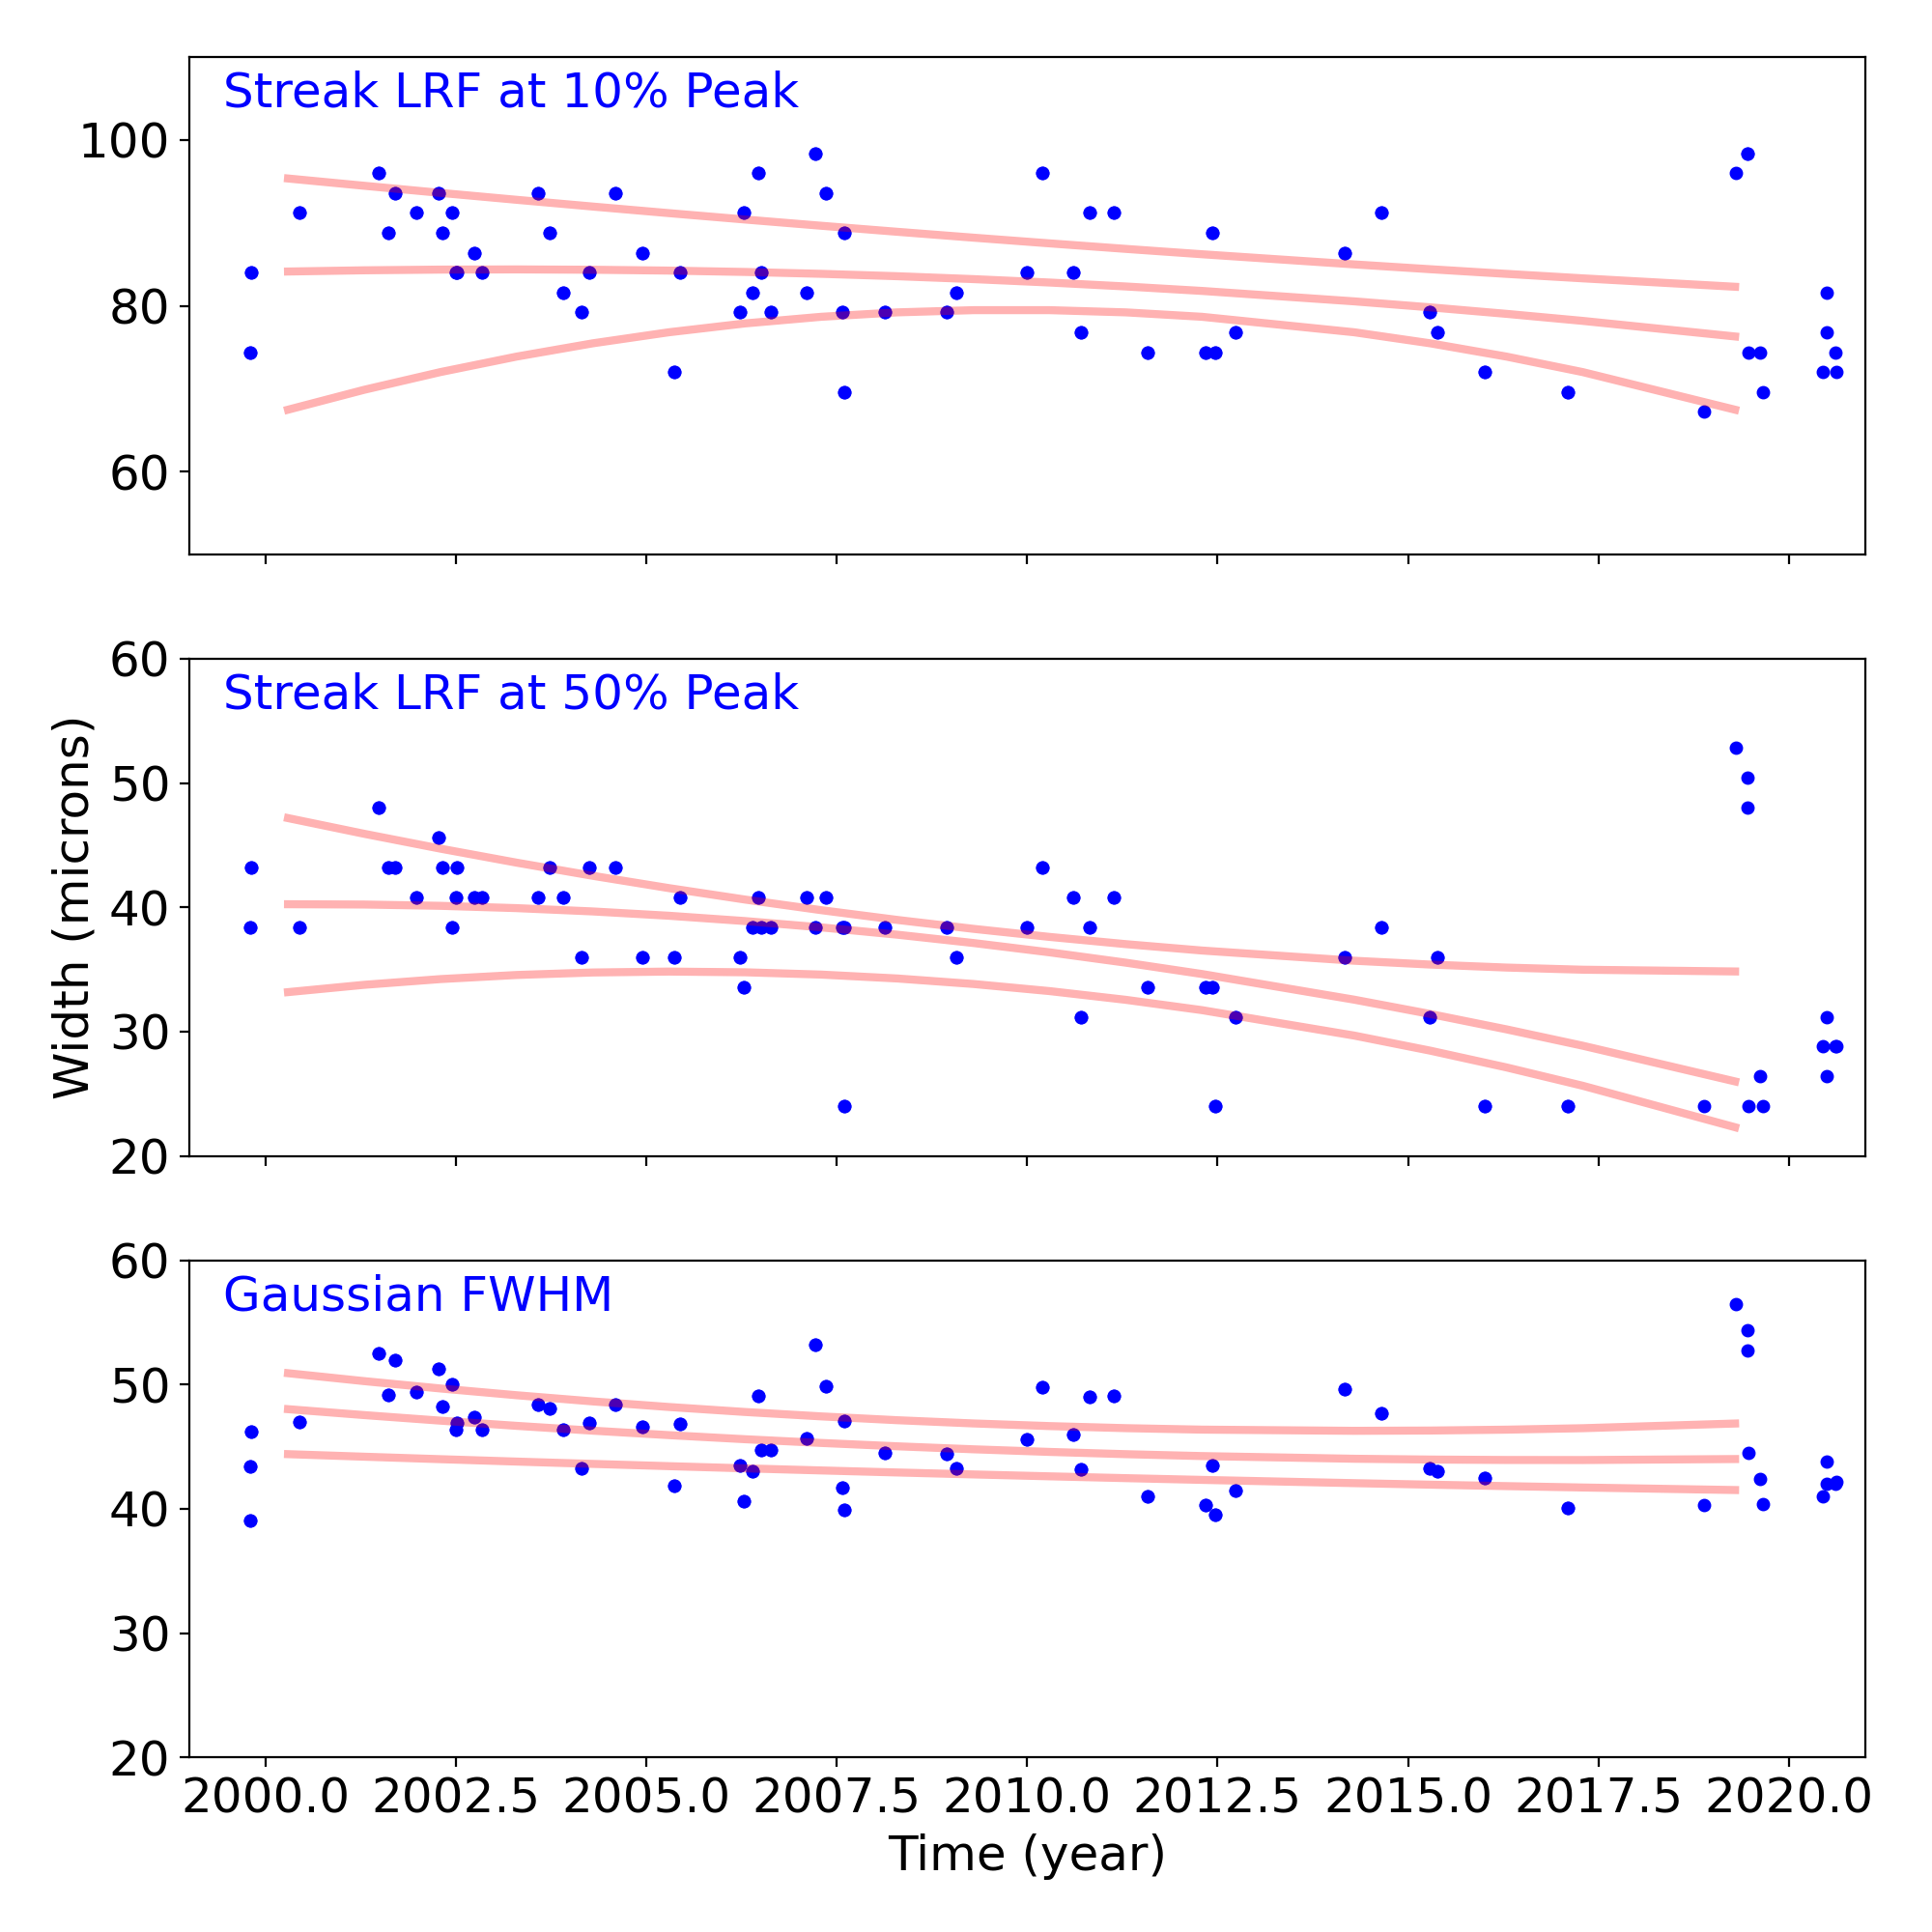
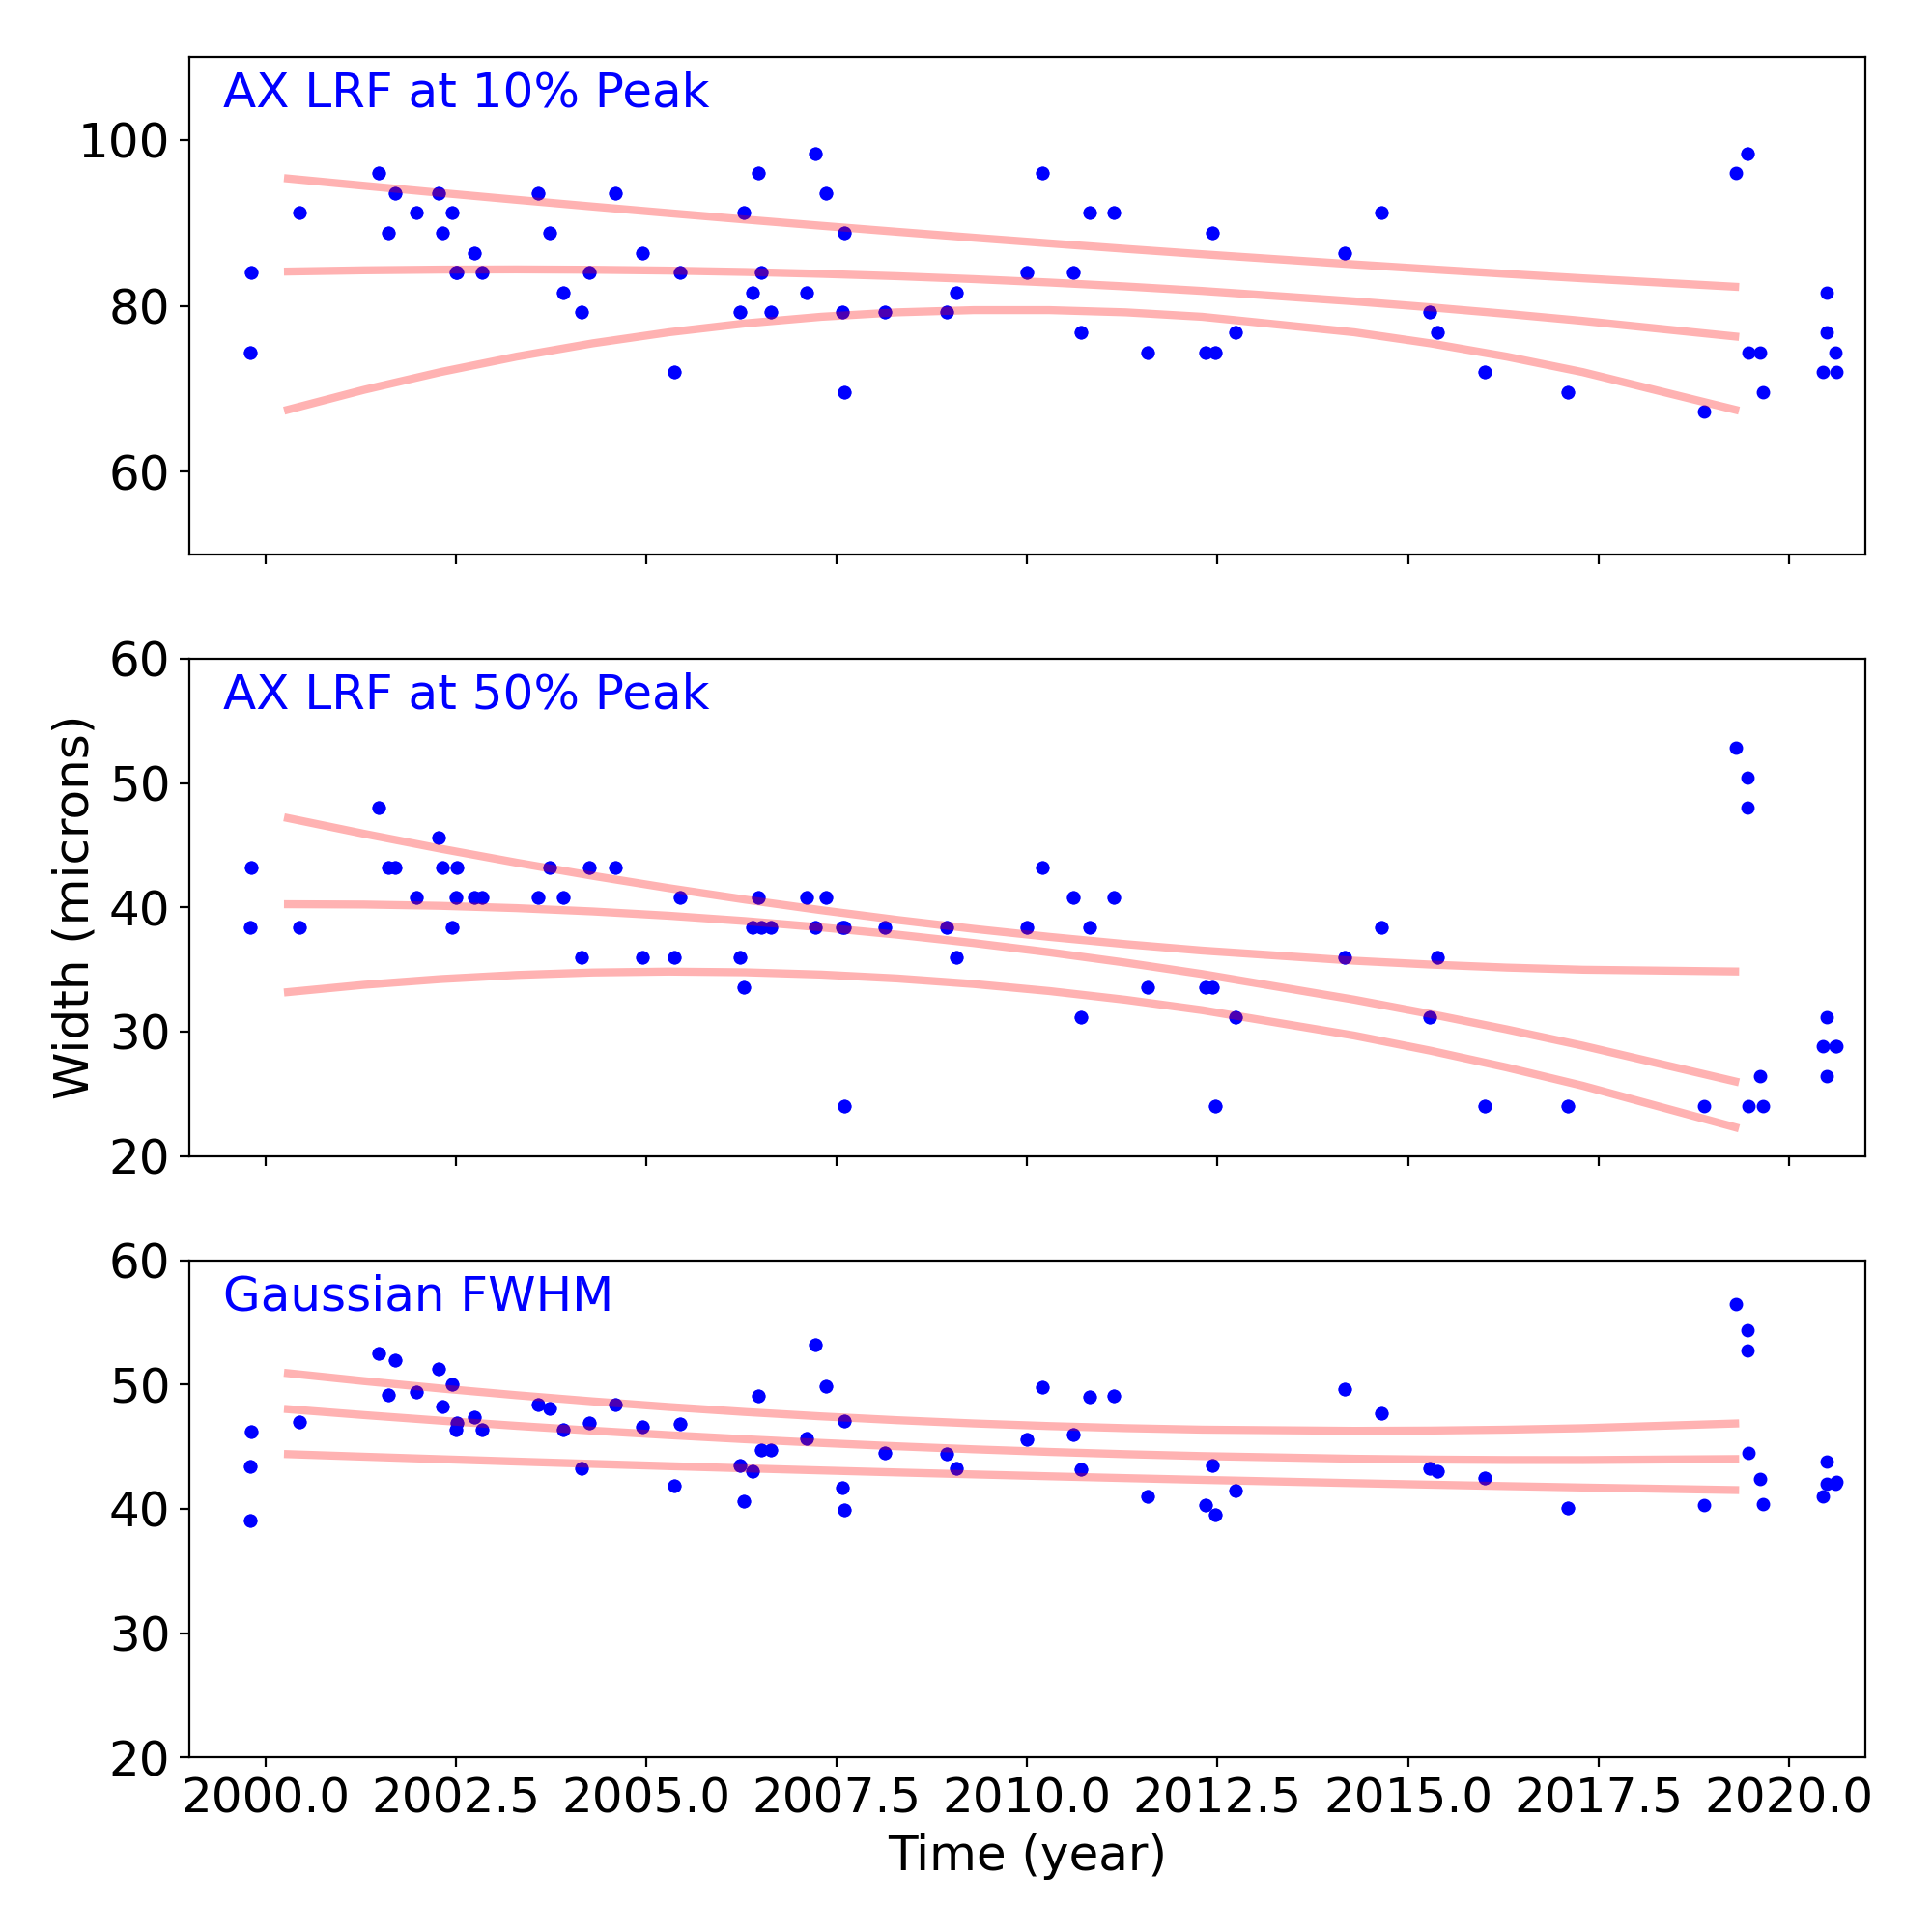
Gratings
Grating Trends/Focus
We plot the width of the zero order streak of ACIS/HETG observations and the width of the zero order image for HRC/LETG observations of point sources. No significant defocusing trend is seen at this time. See Gratings Trends pages.
PCAD
ACA Trending
| ACIS |
)
|
)
|
)
|
|
|---|---|---|---|---|
)
|
)
|
)
| ||
| HRCI |
)
|
)
|
)
|
)
|
| HRCI |
)
|
)
|
)
|
)
|
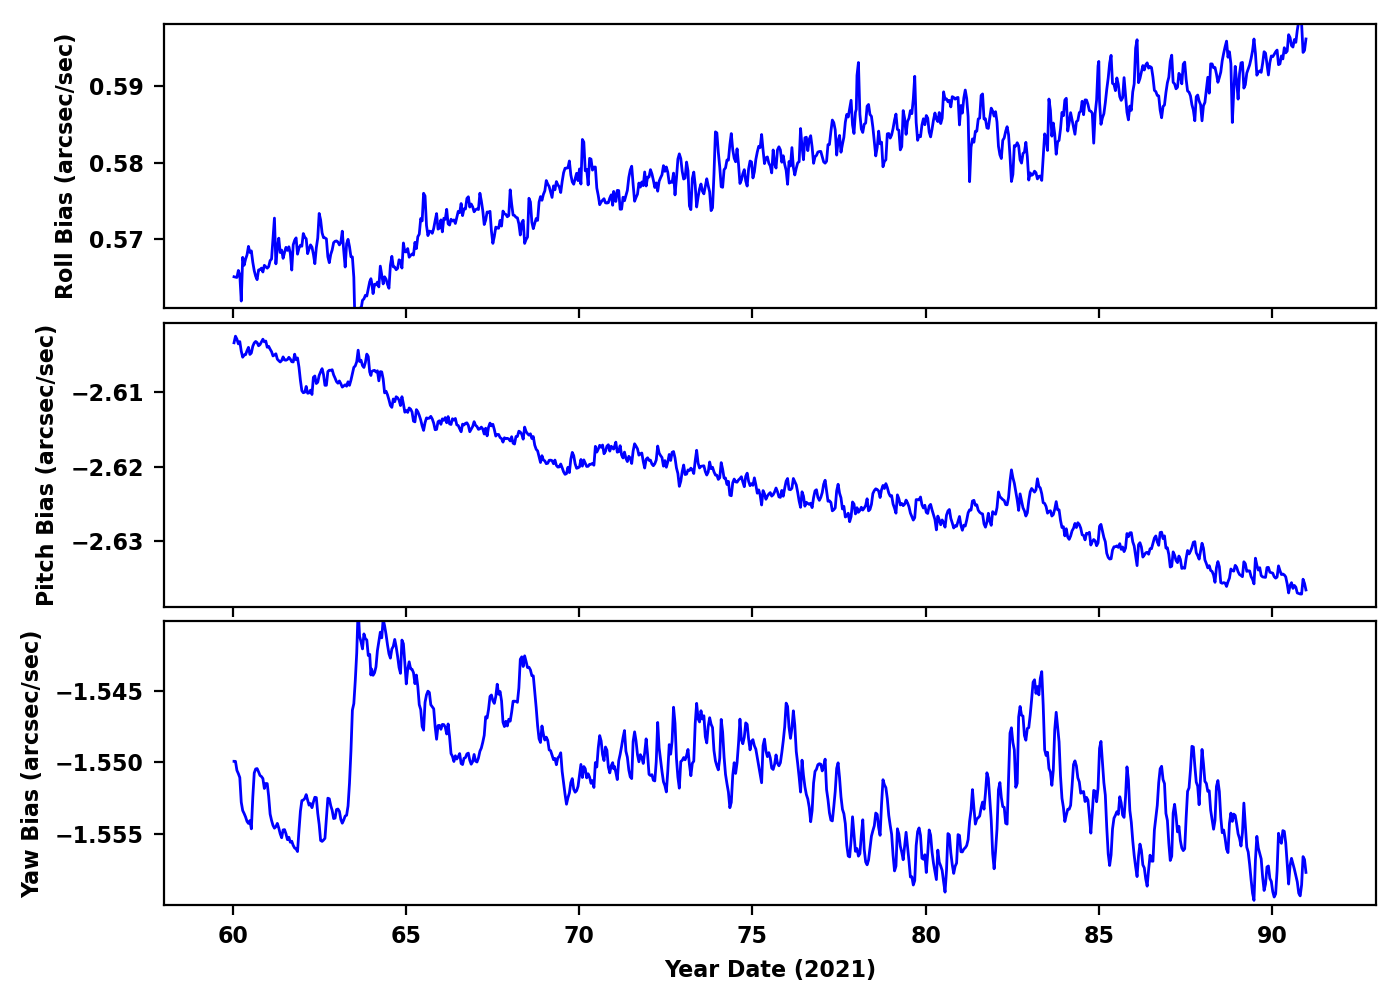
Gyro Bias Drift
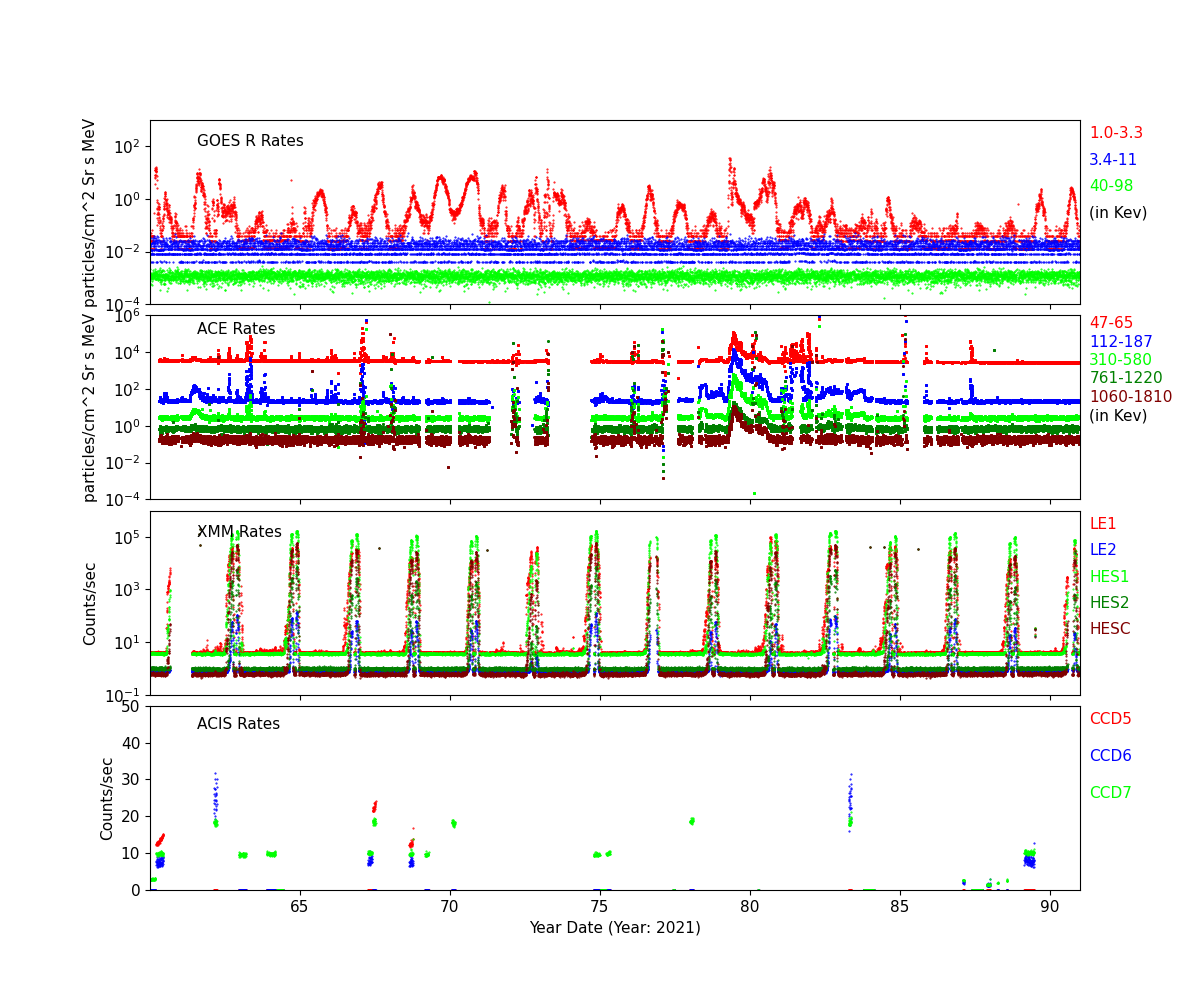
Radiation History
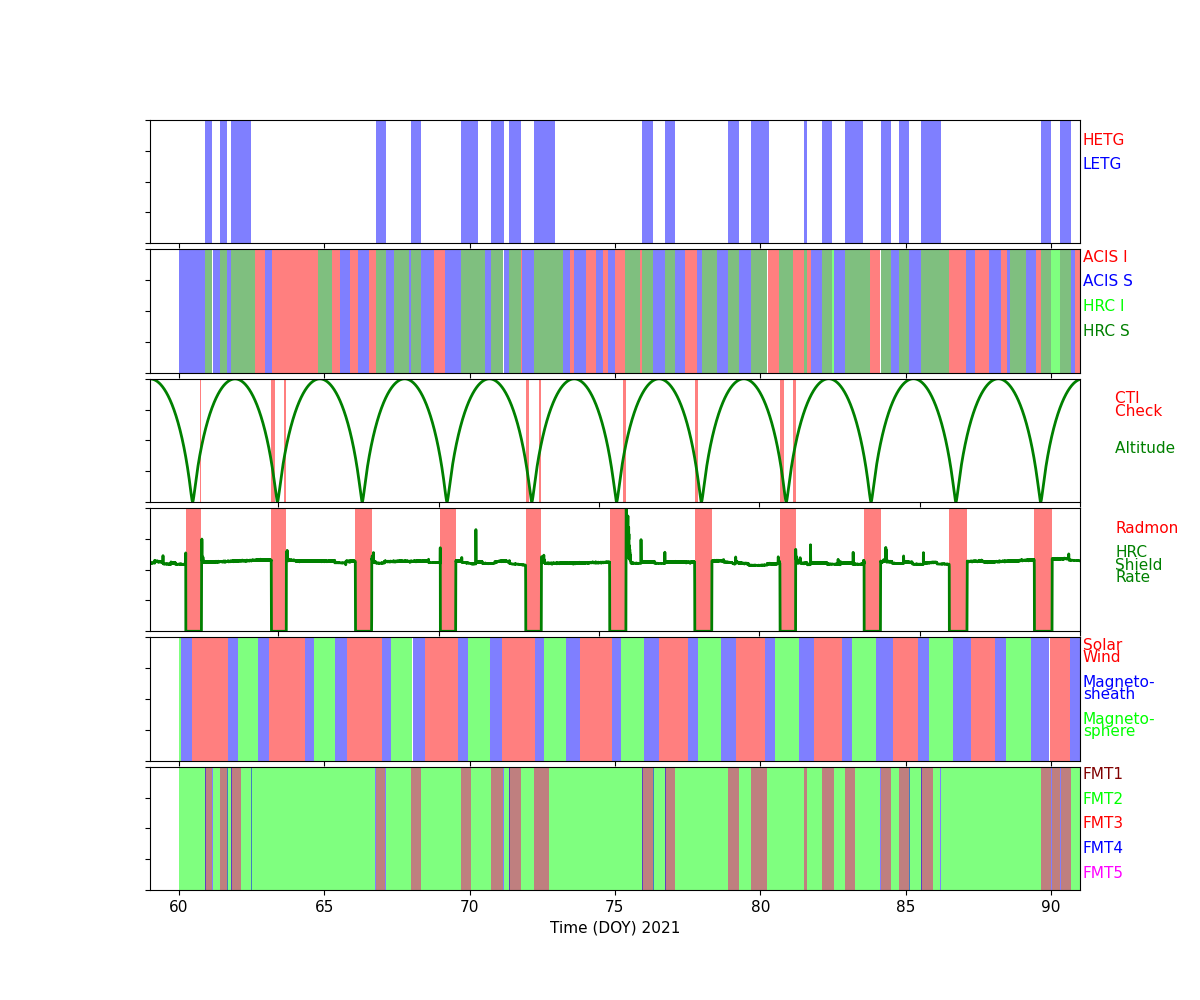
Radiation Count Rates of Mar 2021
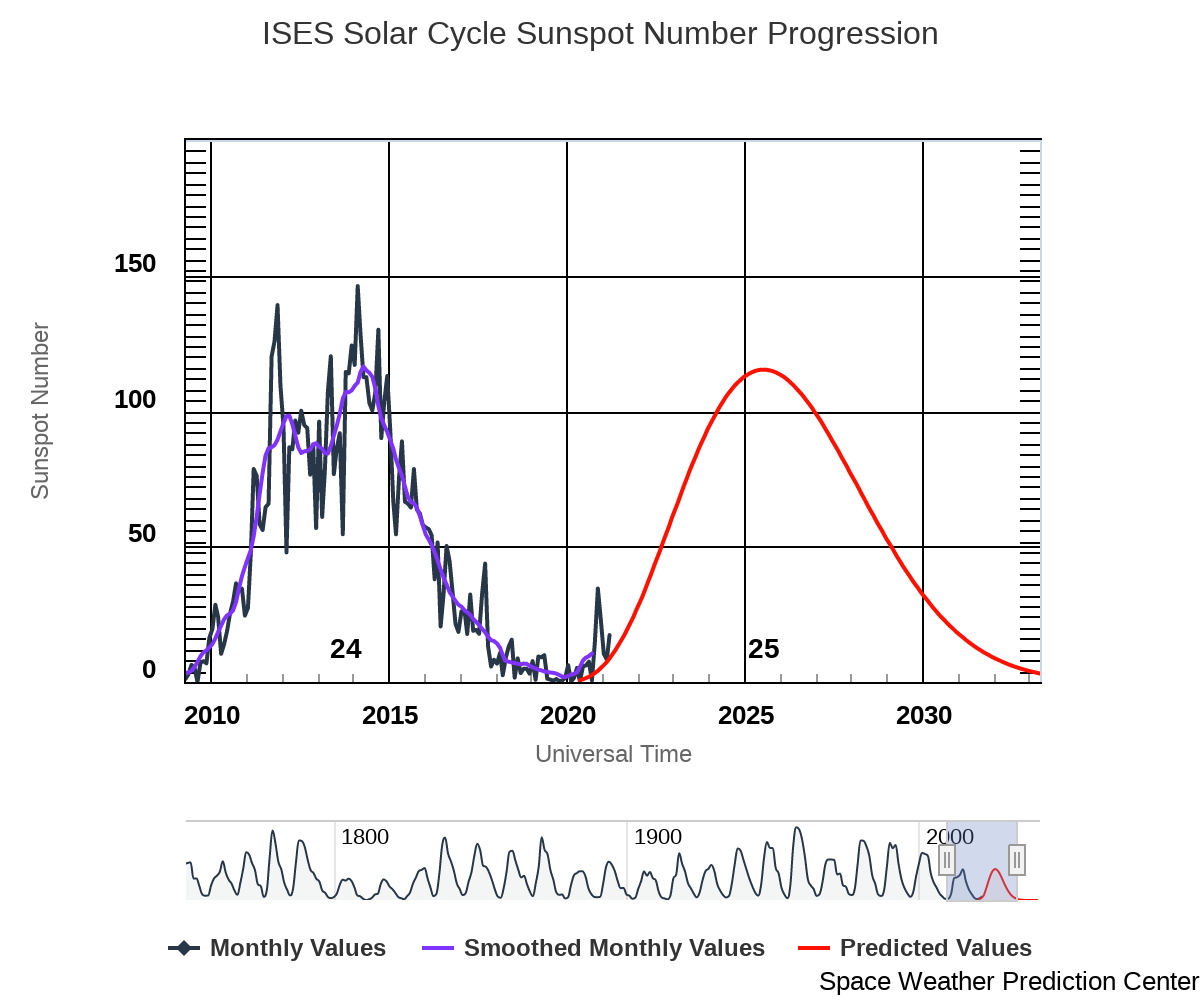
Sun Spot History (See:NOAA Page)
-->
Trending
Critical Trends
| ACIS Temperatures - Daily Maximums | |||||||
|---|---|---|---|---|---|---|---|
| MSID | MEAN | RMS | DELTA/YR | DELTA/YR/YR | UNITS | DESCRIPTION | |
| 1pdeaat | -0.005 | 0.003 | (3.04+/-0.07)e2 | -0.98 +/- 1.84 | K | PSMC DEA PS A TEMP | |
| HRMA Computed Averages - Daily Maximums | |||||||
|---|---|---|---|---|---|---|---|
| MSID | MEAN | RMS | DELTA/YR | DELTA/YR/YR | UNITS | DESCRIPTION | |
| obaavg | -5.277e-04 | 9.206e-04 | (2.99+/-0.02)e2 | 1.11 +/- 0.61 | TEMP | OBA/TFTE | |
| EPHIN Temperatures - Daily Maximums | |||||||
|---|---|---|---|---|---|---|---|
| MSID | MEAN | RMS | DELTA/YR | DELTA/YR/YR | UNITS | DESCRIPTION | |
| teio | -5.774e-04 | 0.011 | (3.25+/-0.25)e2 | 5.74 +/- 4.13 | K | EPHIN ELECTRONICS HOUSING TEMP | |
| tephin | 0.001 | 0.004 | (3.34+/-0.08)e2 | 6.49 +/- 2.71 | K | EPHIN SENSOR HOUSING TEMP | |
| S/C Main Temperatures - Daily Maximums | |||||||
|---|---|---|---|---|---|---|---|
| MSID | MEAN | RMS | DELTA/YR | DELTA/YR/YR | UNITS | DESCRIPTION | |
| tcylfmzm | -0.028 | 0.006 | (3.15+/-0.15)e2 | -3.12 +/- 3.34 | K | CNT CYL TEMP:-Z SIDE UNDER LAE-1 | |
| tcylfmzp | -0.029 | 0.006 | (3.18+/-0.14)e2 | -3.27 +/- 3.03 | K | CNT CYL TEMP:-Z SIDE UNDER LAE-2 | |
| S/C Ancillary Temperatures - Daily Maximums | |||||||
|---|---|---|---|---|---|---|---|
| MSID | MEAN | RMS | DELTA/YR | DELTA/YR/YR | UNITS | DESCRIPTION | |
| tfssbkt1 | -0.016 | 0.013 | (3.44+/-0.31)e2 | 3.39 +/- 4.65 | K | FSS BRAC | |
| tfssbkt2 | -0.021 | 0.015 | (3.41+/-0.35)e2 | 1.68 +/- 5.09 | K | FSS BRAC | |
| tsctsf1 | -0.010 | 0.002 | (3.19+/-0.05)e2 | 3.53 +/- 1.55 | K | SC-TS FITTING -1 TEMP | |
| tsctsf6 | 0.001 | 0.002 | (3.18+/-0.05)e2 | 2.79 +/- 1.63 | K | SC-TS FITTING -6 TEMP | |
| MUPS - Daily Maximums | |||||||
|---|---|---|---|---|---|---|---|
| MSID | MEAN | RMS | DELTA/YR | DELTA/YR/YR | UNITS | DESCRIPTION | |
| pm1thv1t | -0.018 | 0.008 | (3.49+/-0.18)e2 | 3.79 +/- 3.50 | K | MUPS 1 THRUSTER VALVE 01 TEMP | |
| pm2thv1t | -0.030 | 0.021 | (3.23+/-0.48)e2 | 3.62 +/- 8.49 | K | MUPS 2 THRUSTER VALVE 01 TEMP | |
| pm1thv2t | -0.018 | 0.008 | (3.51+/-0.18)e2 | 4.28 +/- 3.62 | K | MUPS 1 THRUSTER VALVE 02 TEMP | |
| pm2thv2t | -0.025 | 0.026 | (3.06+/-0.62)e2 | 10.81 +/- 9.61 | K | MUPS 2 THRUSTER VALVE 02 TEMP | |
| pline02t | -0.017 | 0.006 | (3.32+/-0.14)e2 | 5.00 +/- 3.13 | K | PROP LINE TEMP 02 | |
| pline03t | -0.023 | 0.007 | (3.28+/-0.16)e2 | 2.36 +/- 2.89 | K | PROP LINE TEMP 03 | |
| pline04t | -0.026 | 0.005 | (3.16+/-0.12)e2 | 4.85 +/- 2.77 | K | PROP LINE TEMP 04 | |
Quarterly Trends
- PCAD FTS Temperature and Gradient
| Previous Quarter | |||||||
| MSID | MEAN | RMS | DELTA/YR | DELTA/YR/YR | UNITS | DESCRIPTION | |
| ohrthr27 | 2.652e-05 | 5.002e-06 | (2.97+/-0.00)e2 | -(3.89+/-24.79)e-4 | K | RT 20 : PERISCOPE | |
|---|---|---|---|---|---|---|---|
| ohrthr42 | -1.687e-04 | 1.998e-04 | (2.97+/-0.00)e2 | 0.13 +/- 0.11 | K | RT 133: PERISCOPE | |
| ohrthr43 | -1.190e-04 | 2.223e-04 | (2.97+/-0.01)e2 | 0.25 +/- 0.14 | K | RT 134: PERISCOPE | |
| oobagrd3 | -4.390e-05 | 4.304e-05 | -0.32 +/- 0.10 | -0.09 +/- 0.04 | K | RT 505 TO RT 504: PERISCOPE GRADIENT MONITOR | |
| oobagrd6 | -6.795e-07 | 4.791e-06 | 0.12 +/- 0.01 | 0.01 +/- 0.00 | K | RT 507 TO RT 506: PERISCOPE GRADIENT MONITOR | |
- SIM Temperature
| Previous Quarter | |||||||
| MSID | MEAN | RMS | DELTA/YR | DELTA/YR/YR | UNITS | DESCRIPTION | |
| 3btu_bpt | 0.010 | 0.002 | (2.69+/-0.06)e2 | -1.89 +/- 1.90 | K | BTU BASEPLATE (+X)), ABORT HTR TSC2 | |
|---|---|---|---|---|---|---|---|
| 3tsmxcet | 0.013 | 0.019 | (2.42+/-0.44)e2 | -2.07 +/- 6.01 | K | -X TURTLE SHELL NR HRC CEA | |
| 3tsmxspt | 0.079 | 0.084 | (4.42+/-1.97)e2 | 0.86 +/- 26.70 | K | -X TURTLE SHELL NR ACIS SS | |
- SIIM Electronics
| Previous Quarter | |||||||
| MSID | MEAN | RMS | DELTA/YR | DELTA/YR/YR | UNITS | DESCRIPTION | |
| agrndadc | -2.459e-07 | 4.115e-08 | -(1.71+/-1.24)e-4 | -(4.61+/-307.60)e-7 | V | Analog fround A/D convert reading | |
|---|---|---|---|---|---|---|---|
| fatabadc | -5.744e-05 | 2.923e-05 | 4.99 +/- 0.09 | -0.00 +/- 0.01 | V | FA Tab Position Sensor A/D Converter | |
| n15vadc | 5.022e-08 | 1.080e-07 | -15.02 +/- 0.00 | -(1.50+/-1.02)e-4 | V | -15V Power Supply A/D Converter Reading | |
| p15vadc | -1.497e-06 | 1.438e-07 | 14.96 +/- 0.00 | -(3.18+/-1.57)e-4 | V | +15V Power Supply A/D Converter Reading | |
| p5vadc | -3.313e-05 | 7.373e-06 | 4.97 +/- 0.02 | -(6.63+/-103.40)e-4 | V | +5V Power Supply A/D Converter Reading | |
| tsctabadc | -1.963e-04 | 5.921e-05 | 4.97 +/- 0.18 | -0.01 +/- 0.03 | V | TSC Tab Position Sensor A/D converter | |
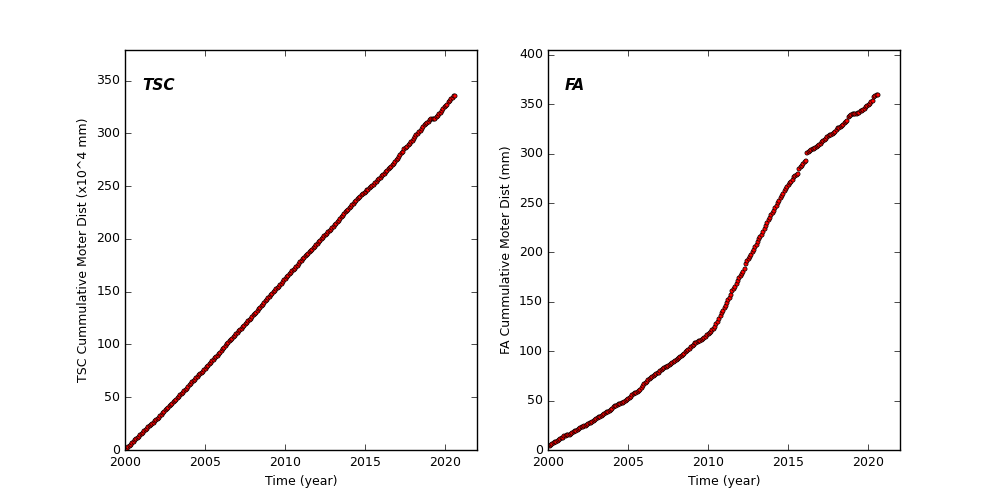
Spacecraft Motions
TSC and FA Cummulative Moter Distance
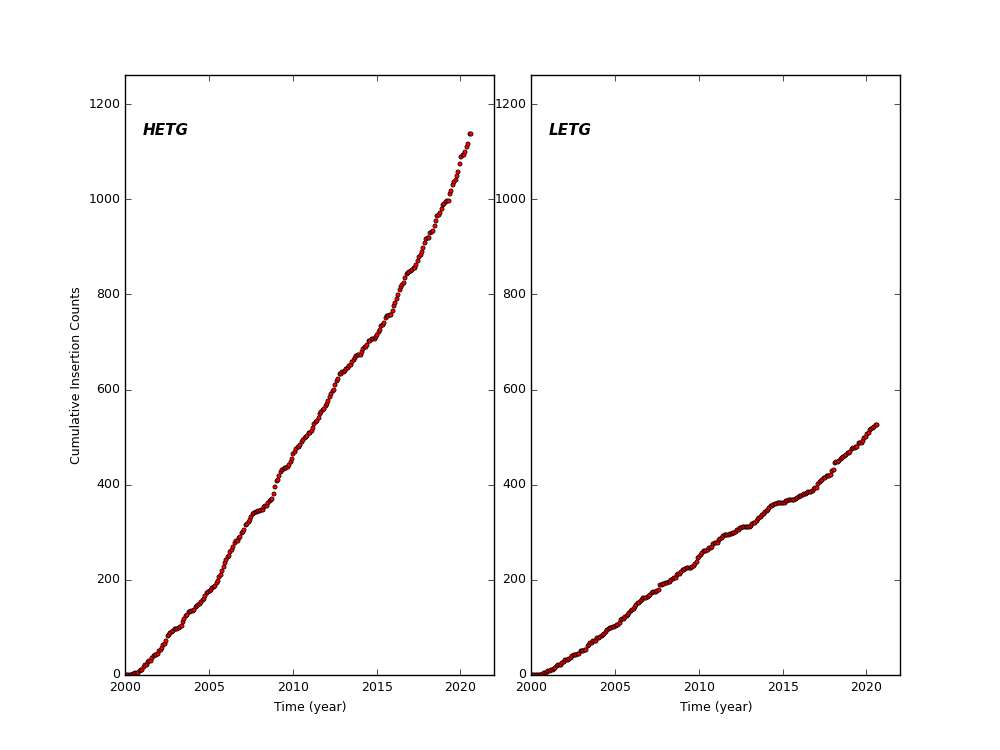
HETG and LETG Cummulative Insertion Counts
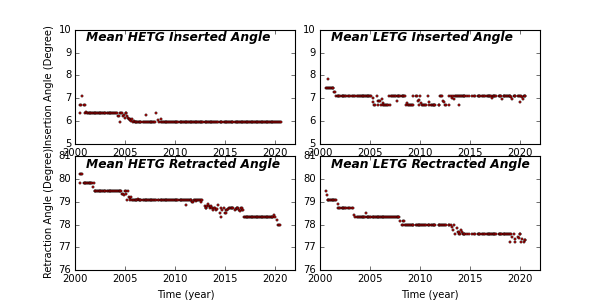
HETG/LETG Insertion/Retraction Angle
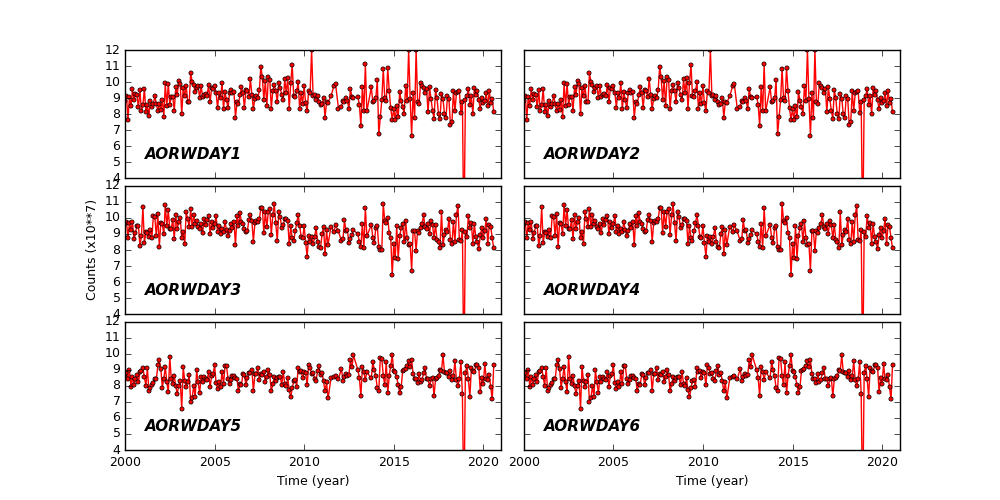
Reaction Wheel Rotations