ACIS
ACIS DOSE Registered-Photon-Map
The steps we took to compute the dose map are;
- Level 1 Event files for a specified month are obtained from archive.
- Image data including I2, I3, S2, S3 CCDs are extracted from all event files.
- All the extracted image data were merged to create a month long exposure map for the month.
- The exposure map is opened with ds9, and check a distribution of count rates against energy. From this, estimate the upper threshold value. Any events beyond this upper threshold are assumed erroneous events such as bad pixels.
- Using this upper threshold, the data is filtered, and create a cleaned exposure map for the month.
- The exposure map from each month from the Sep 1999 is added up to create a cumulative exposure map for each month.
- Using fimgstatistic, we compute count rate statistics for each CCDs.
- For observations with high data drop rates (e.g., Crab nebula, Cas A), we corrected the observations by adding events.
Please check more detail plots at Telemetered Photon Dose Trend page.
)
)
)
Statistics:
# IMAGE     NPIX     MEAN        RMS        MIN     MAX
ACIS_may21 6004901       11.159         133.275           0.0     18803


I2 node 0  262654	4.985277	2.658022	0.0	 44.0
I2 node 1  262654	5.218091	3.511191	0.0	1091.0
I2 node 2  262654	5.573802	3.154290	0.0	 60.0
I2 node 3  262654	5.755882	3.314342	0.0	283.0

I3 node 0  262654	8.326736	3.867089	0.0	127.0
I3 node 1  262654	8.452663	25.863582	0.0	10271.0
I3 node 2  262654	6.108929	2.904227	0.0	 69.0
I3 node 3  262654	6.079791	2.919332	0.0	115.0

S2 node 0  262654	10.783421	23.365660	0.0	623.0
S2 node 1  262654	12.868900	35.430122	0.0	816.0
S2 node 2  262654	17.156606	57.457180	0.0	2555.0
S2 node 3  262654	14.360261	43.437830	0.0	6487.0

S3 node 0  262654	58.977049	611.570217	0.0	18803.0
S3 node 1  262654	19.018390	47.046077	0.0	2087.0
S3 node 2  262654	24.413572	74.847645	0.0	1241.0
S3 node 3  262654	26.794798	93.768033	0.0	1166.0
)
)
)
Statistics:
 IMAGE     NPIX      MEAN        RMS           MIN      MAX
ACIS_total   6004901       2490.216         3208.363           0.0   138173


I2 node 0  262654	2151.994141	431.424937	459.0	12785.0
I2 node 1  262654	2263.245224	611.506368	472.0	119823.0
I2 node 2  262654	2289.942469	484.583409	489.0	13298.0
I2 node 3  262654	2295.527751	592.775511	465.0	28758.0

I3 node 0  262654	2465.226000	606.150179	456.0	13182.0
I3 node 1  262654	2542.315275	1718.581245	488.0	55607.0
I3 node 2  262654	2258.684151	422.103968	458.0	13358.0
I3 node 3  262654	2251.355148	454.209536	426.0	34036.0

S2 node 0  262654	2904.191816	468.545579	1586.0	22226.0
S2 node 1  262654	3078.543429	695.810690	1765.0	16726.0
S2 node 2  262654	3405.621124	697.815015	2187.0	28704.0
S2 node 3  262654	3368.460812	552.540296	1929.0	68276.0

S3 node 0  262654	5175.095588	2828.879024	2239.0	51668.0
S3 node 1  262654	6364.411562	2340.545038	0.0	37918.0
S3 node 2  262654	5103.460018	1322.089196	2290.0	26793.0
S3 node 3  262654	3978.857617	728.782866	2414.0	26078.0
)
|
)
|
)
|
)
|
| Feb 2021 | Nov 2020 | Aug 2020 | May 2020 |
|---|
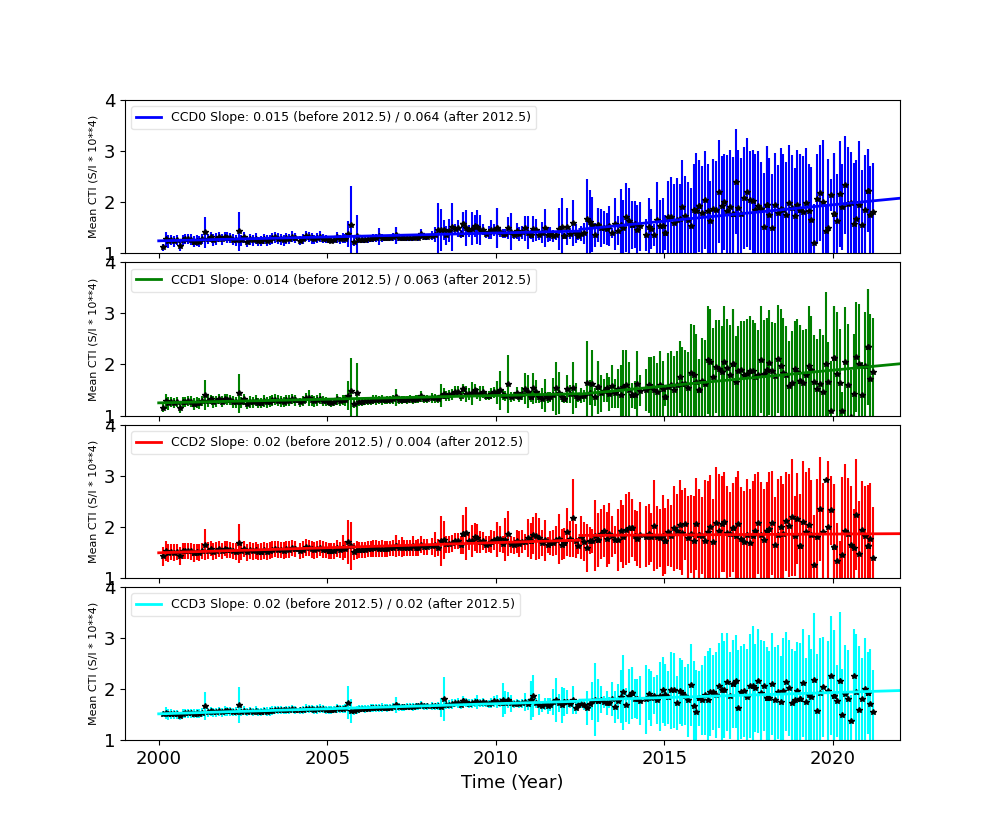
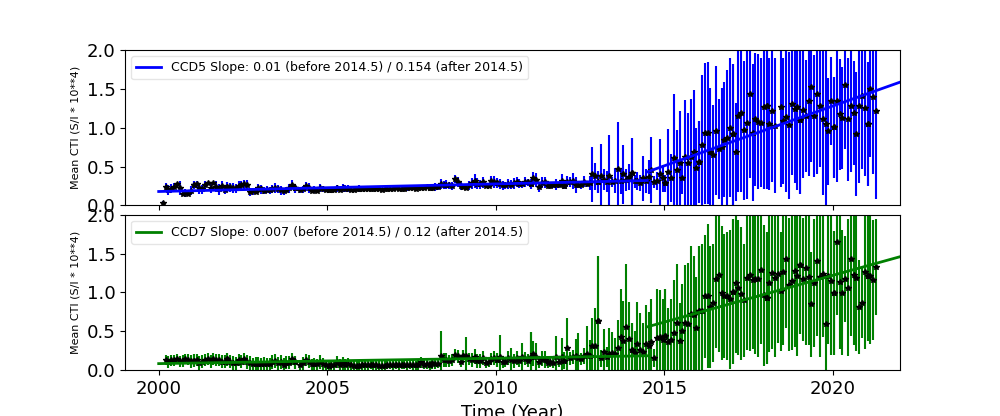
The Mean Detrended CTI
We report CTIs with a refined data definition. CTIs were computed for the temperature dependency corrected data. Please see CTI page for detailed explanation. CTI's are computed for Mn K alpha, and defined as slope/intercept x10^4 of row # vs ADU. Data file: here
Imaging CCDs
Spectral CCDs
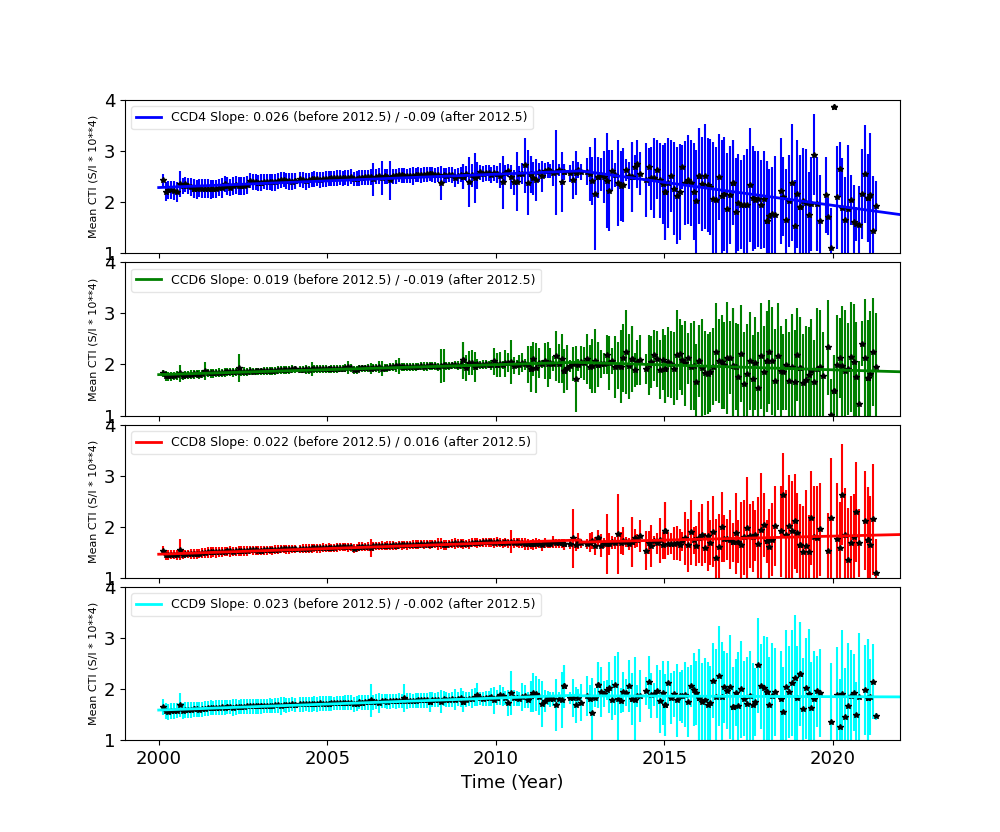
Backside CCDs
Focal Plane Temperature
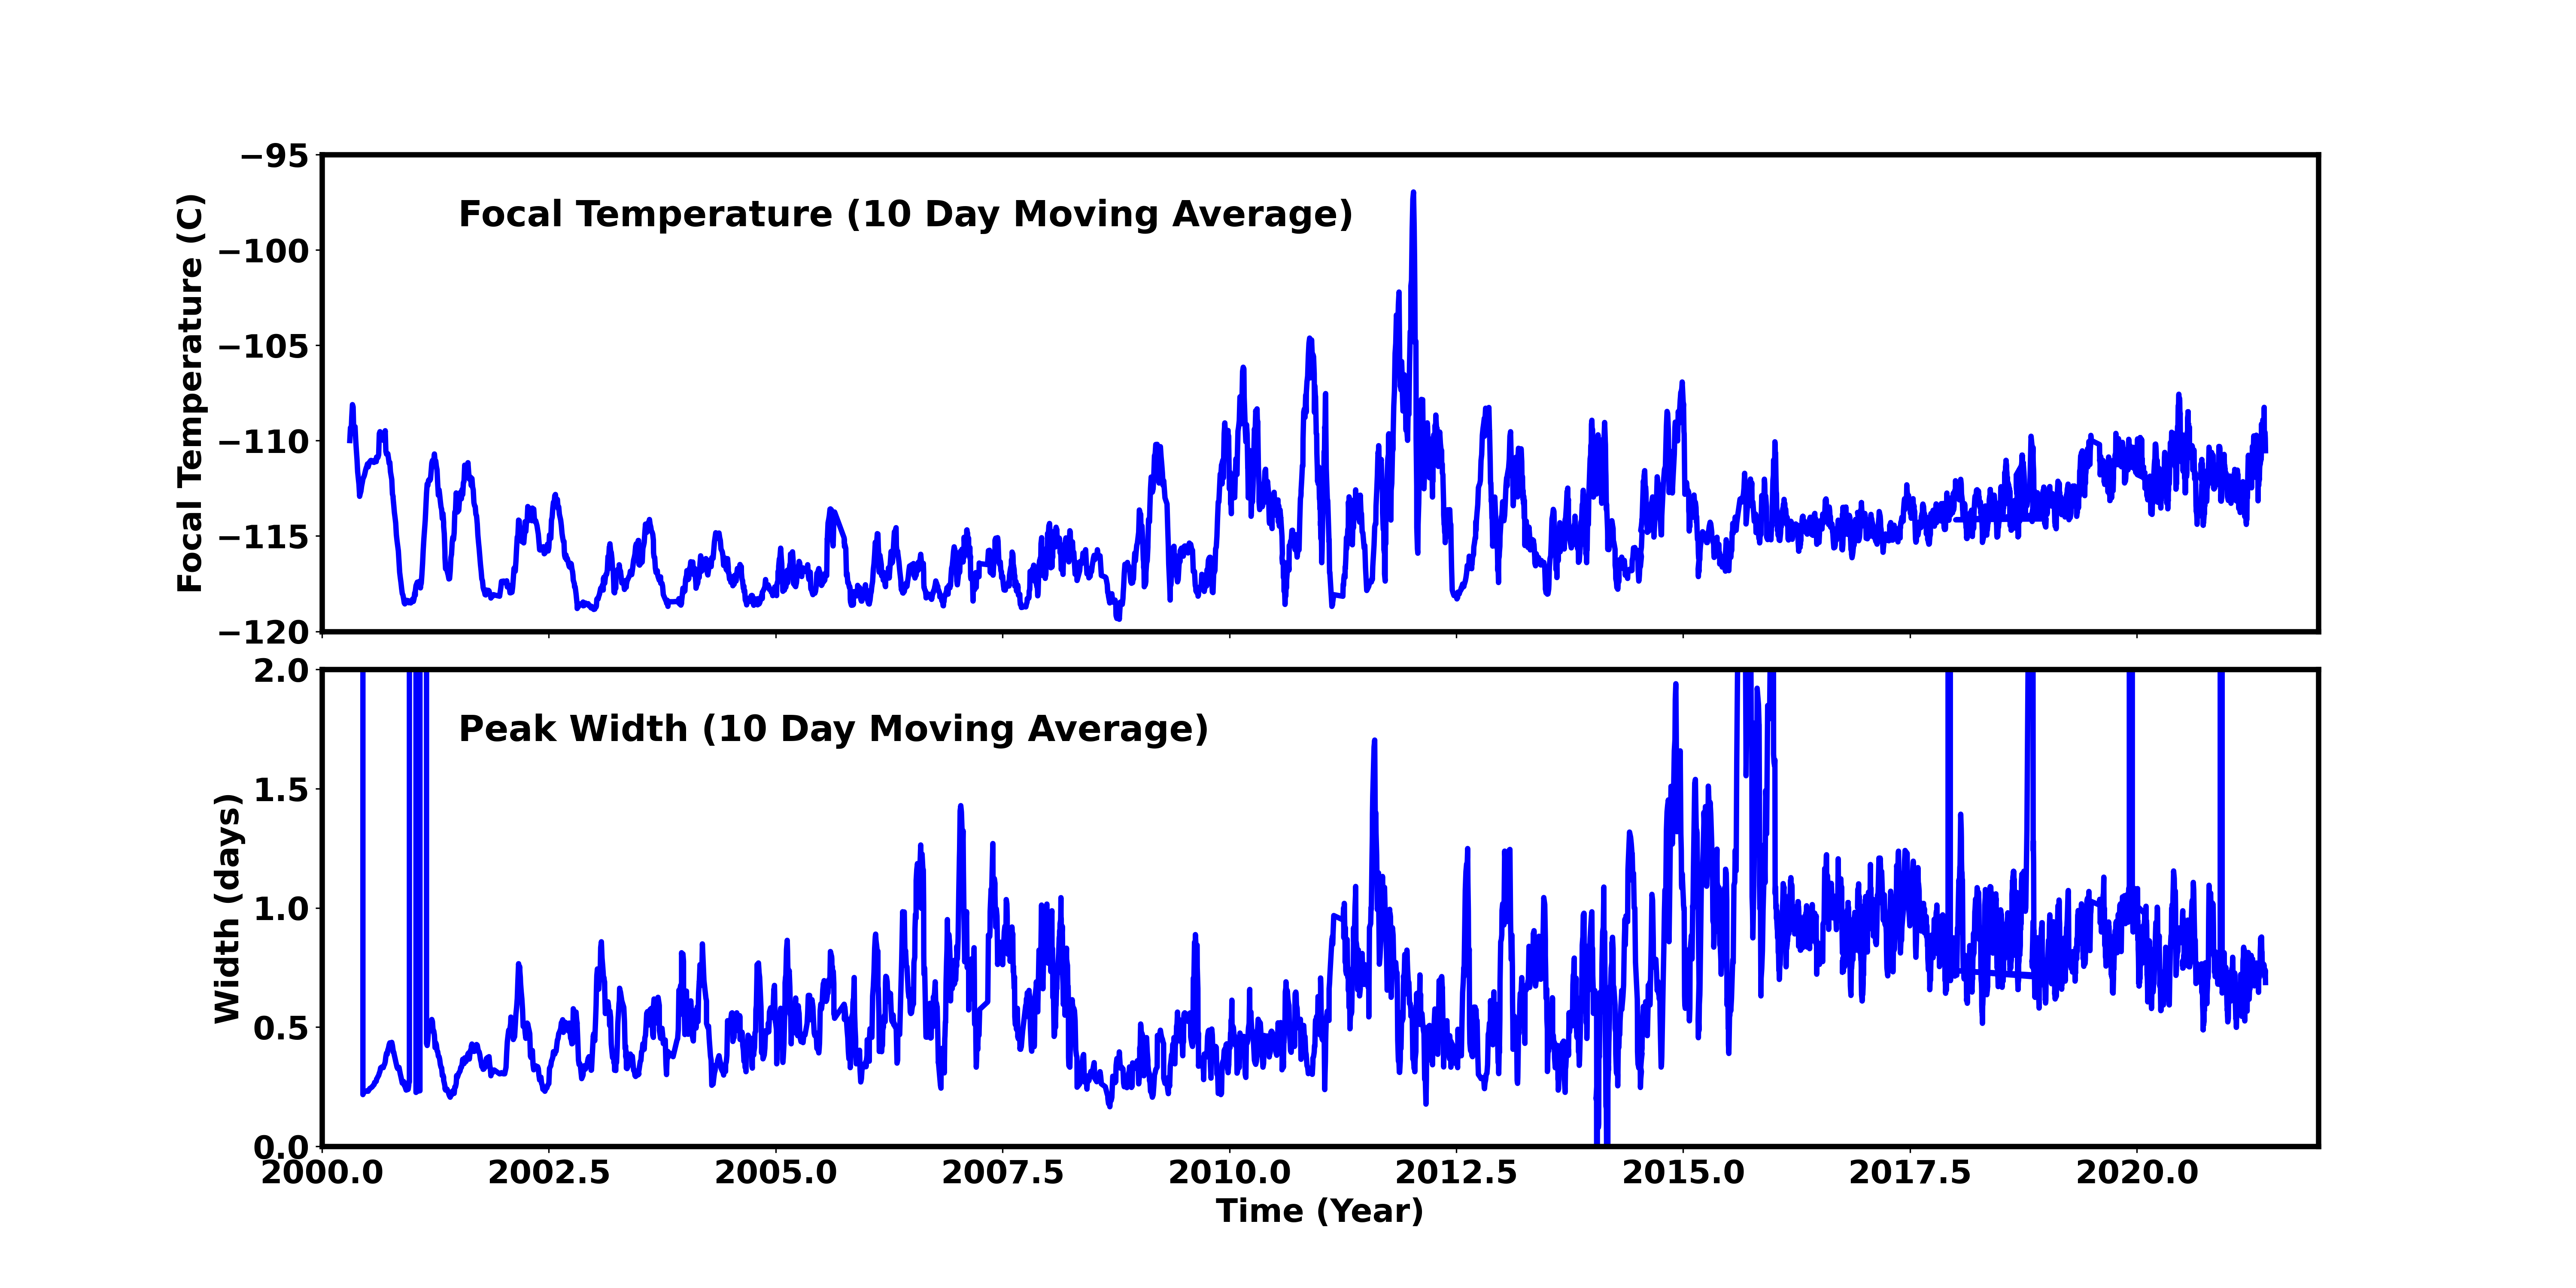
May 2021 Focal Temperature
| The Mean (max) FPT: | |
|---|---|
| -110.26 | +/- 5.47 C |
| Mean Width: | |
| 0.75 | +/- 0.22 days |
Averaged Focal Plane Temperature
We are using 10 period moving averages to show trends of peak temperatures and peak widths. Note, the gaps in the width plot are due to missing/corrupted data.
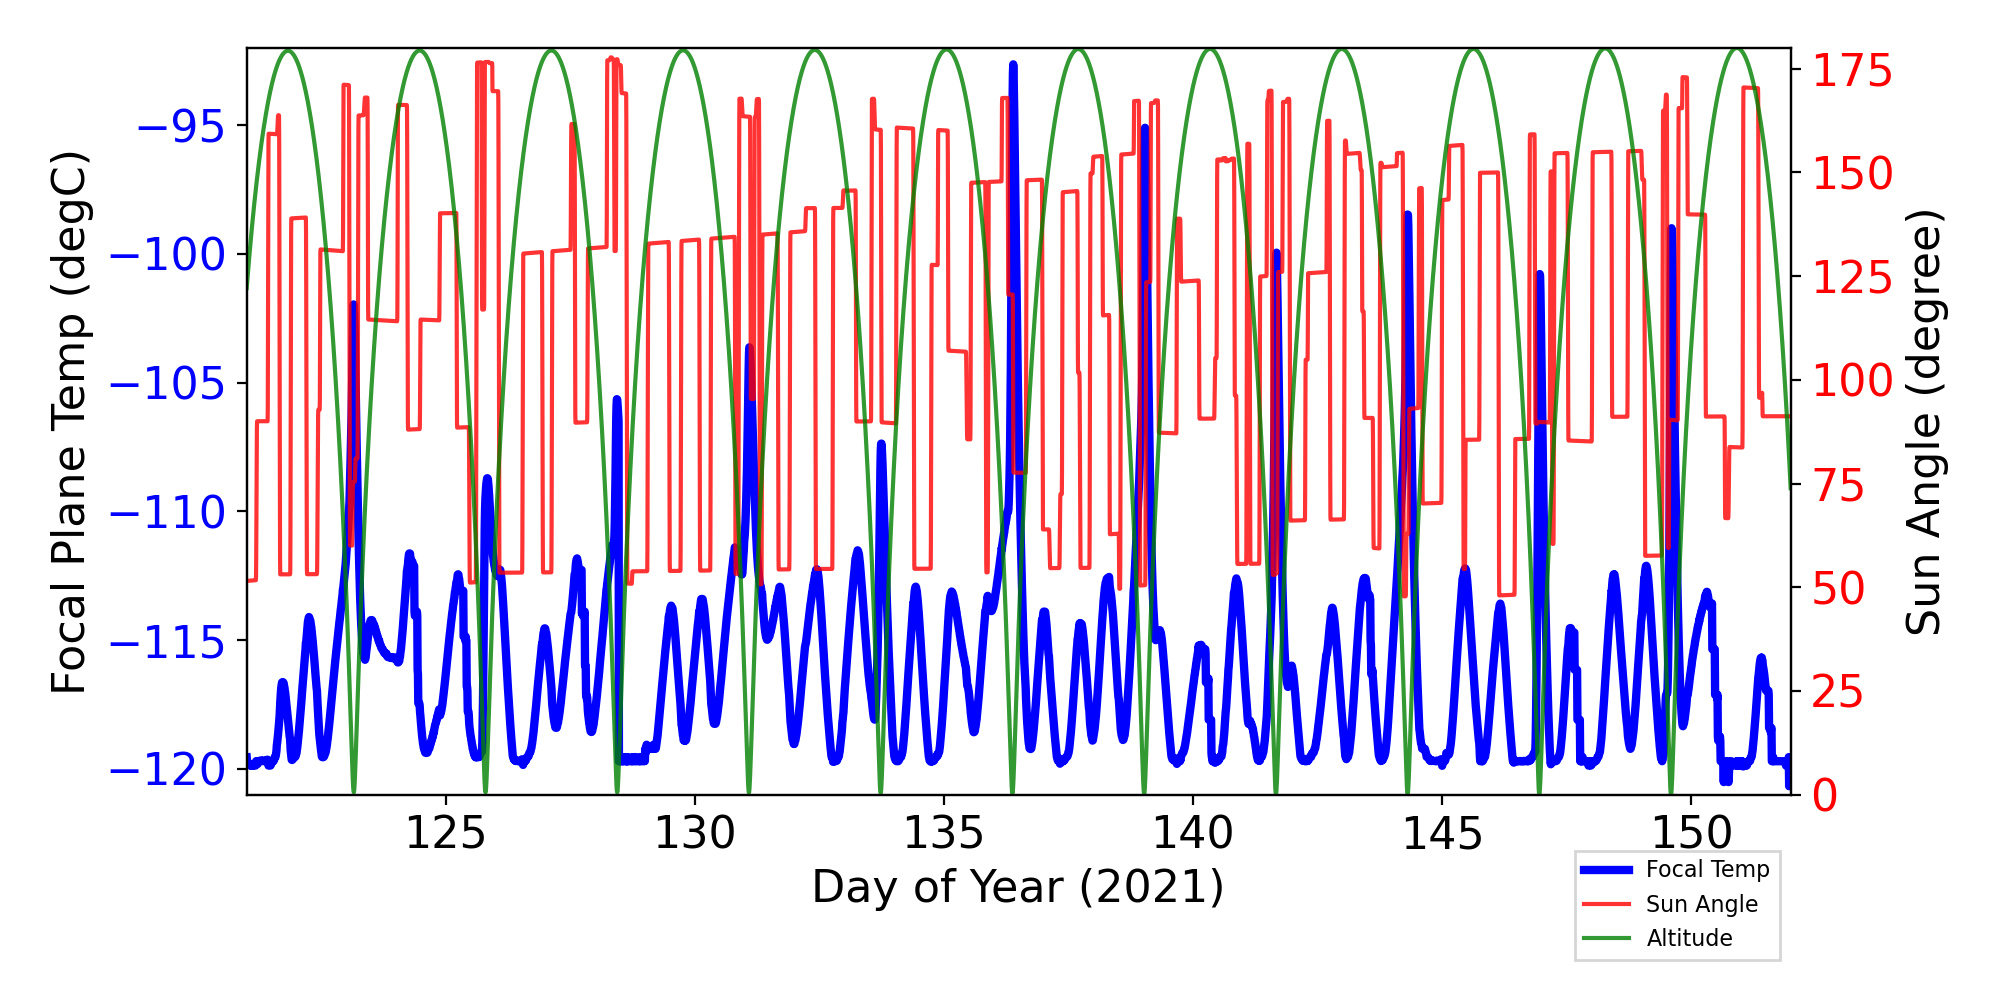
Focal Plane Temperature, Sun Angle and Altitude
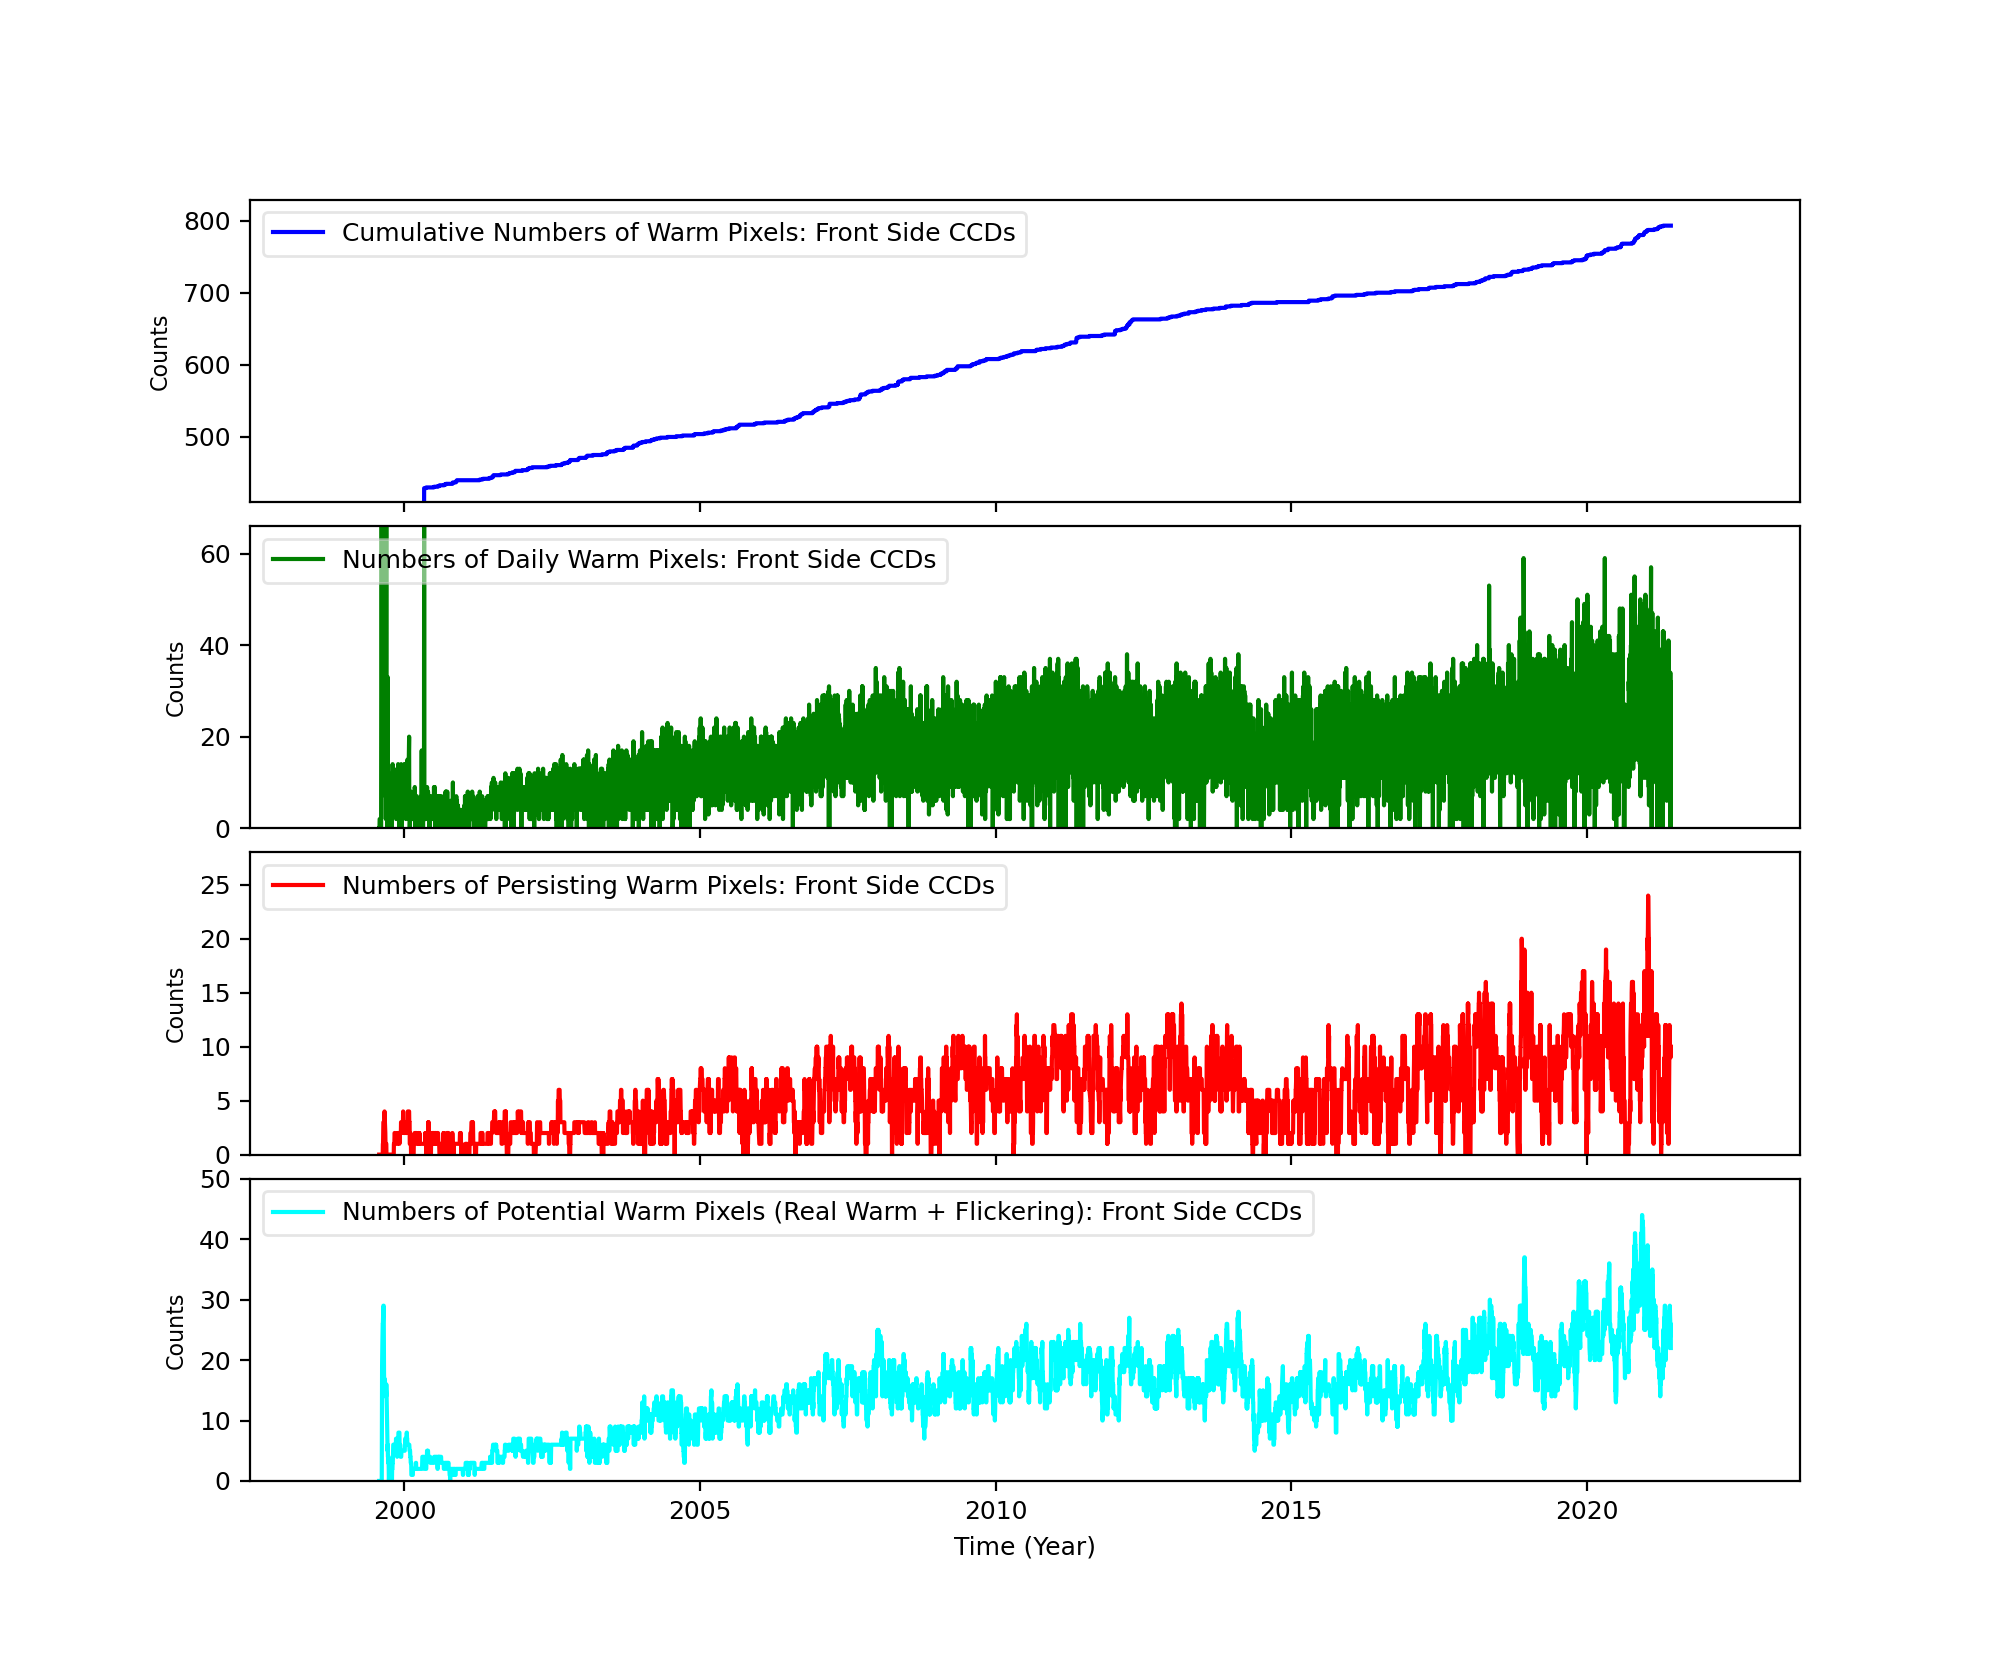
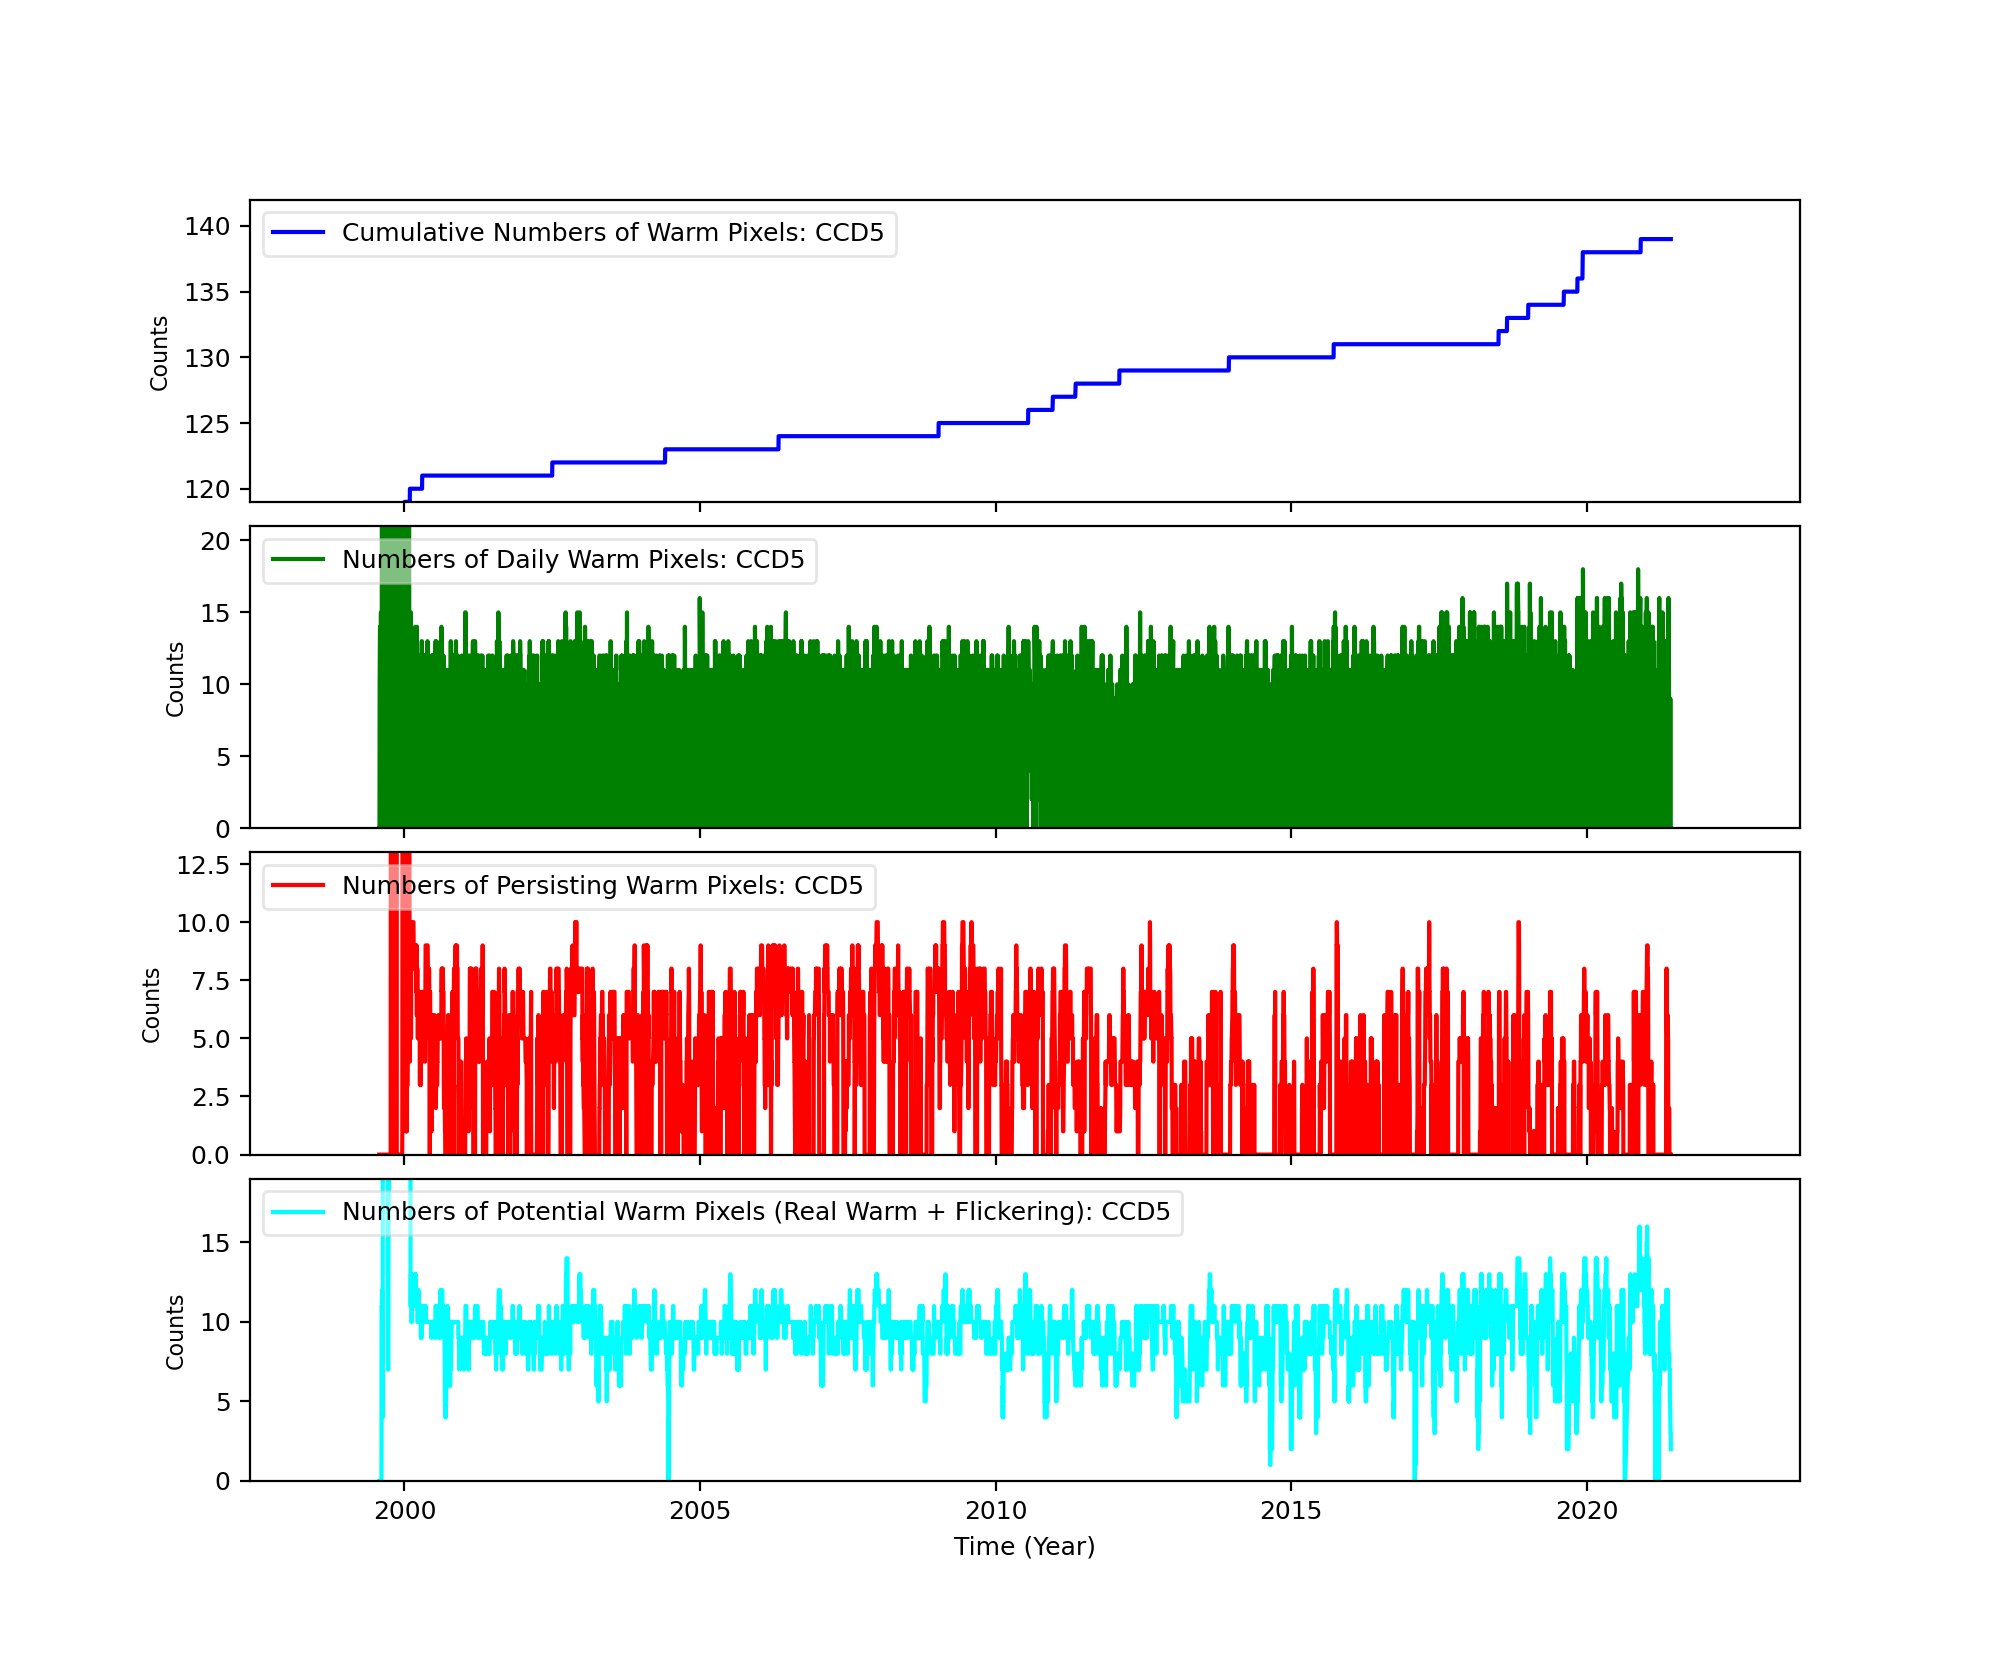
Bad Pixels
The plots below were generated with a new warm pixel finding script. Please see Acis Bad Pixel Page for details.
Front Side CCDs
Back Side CCD (CCD5)
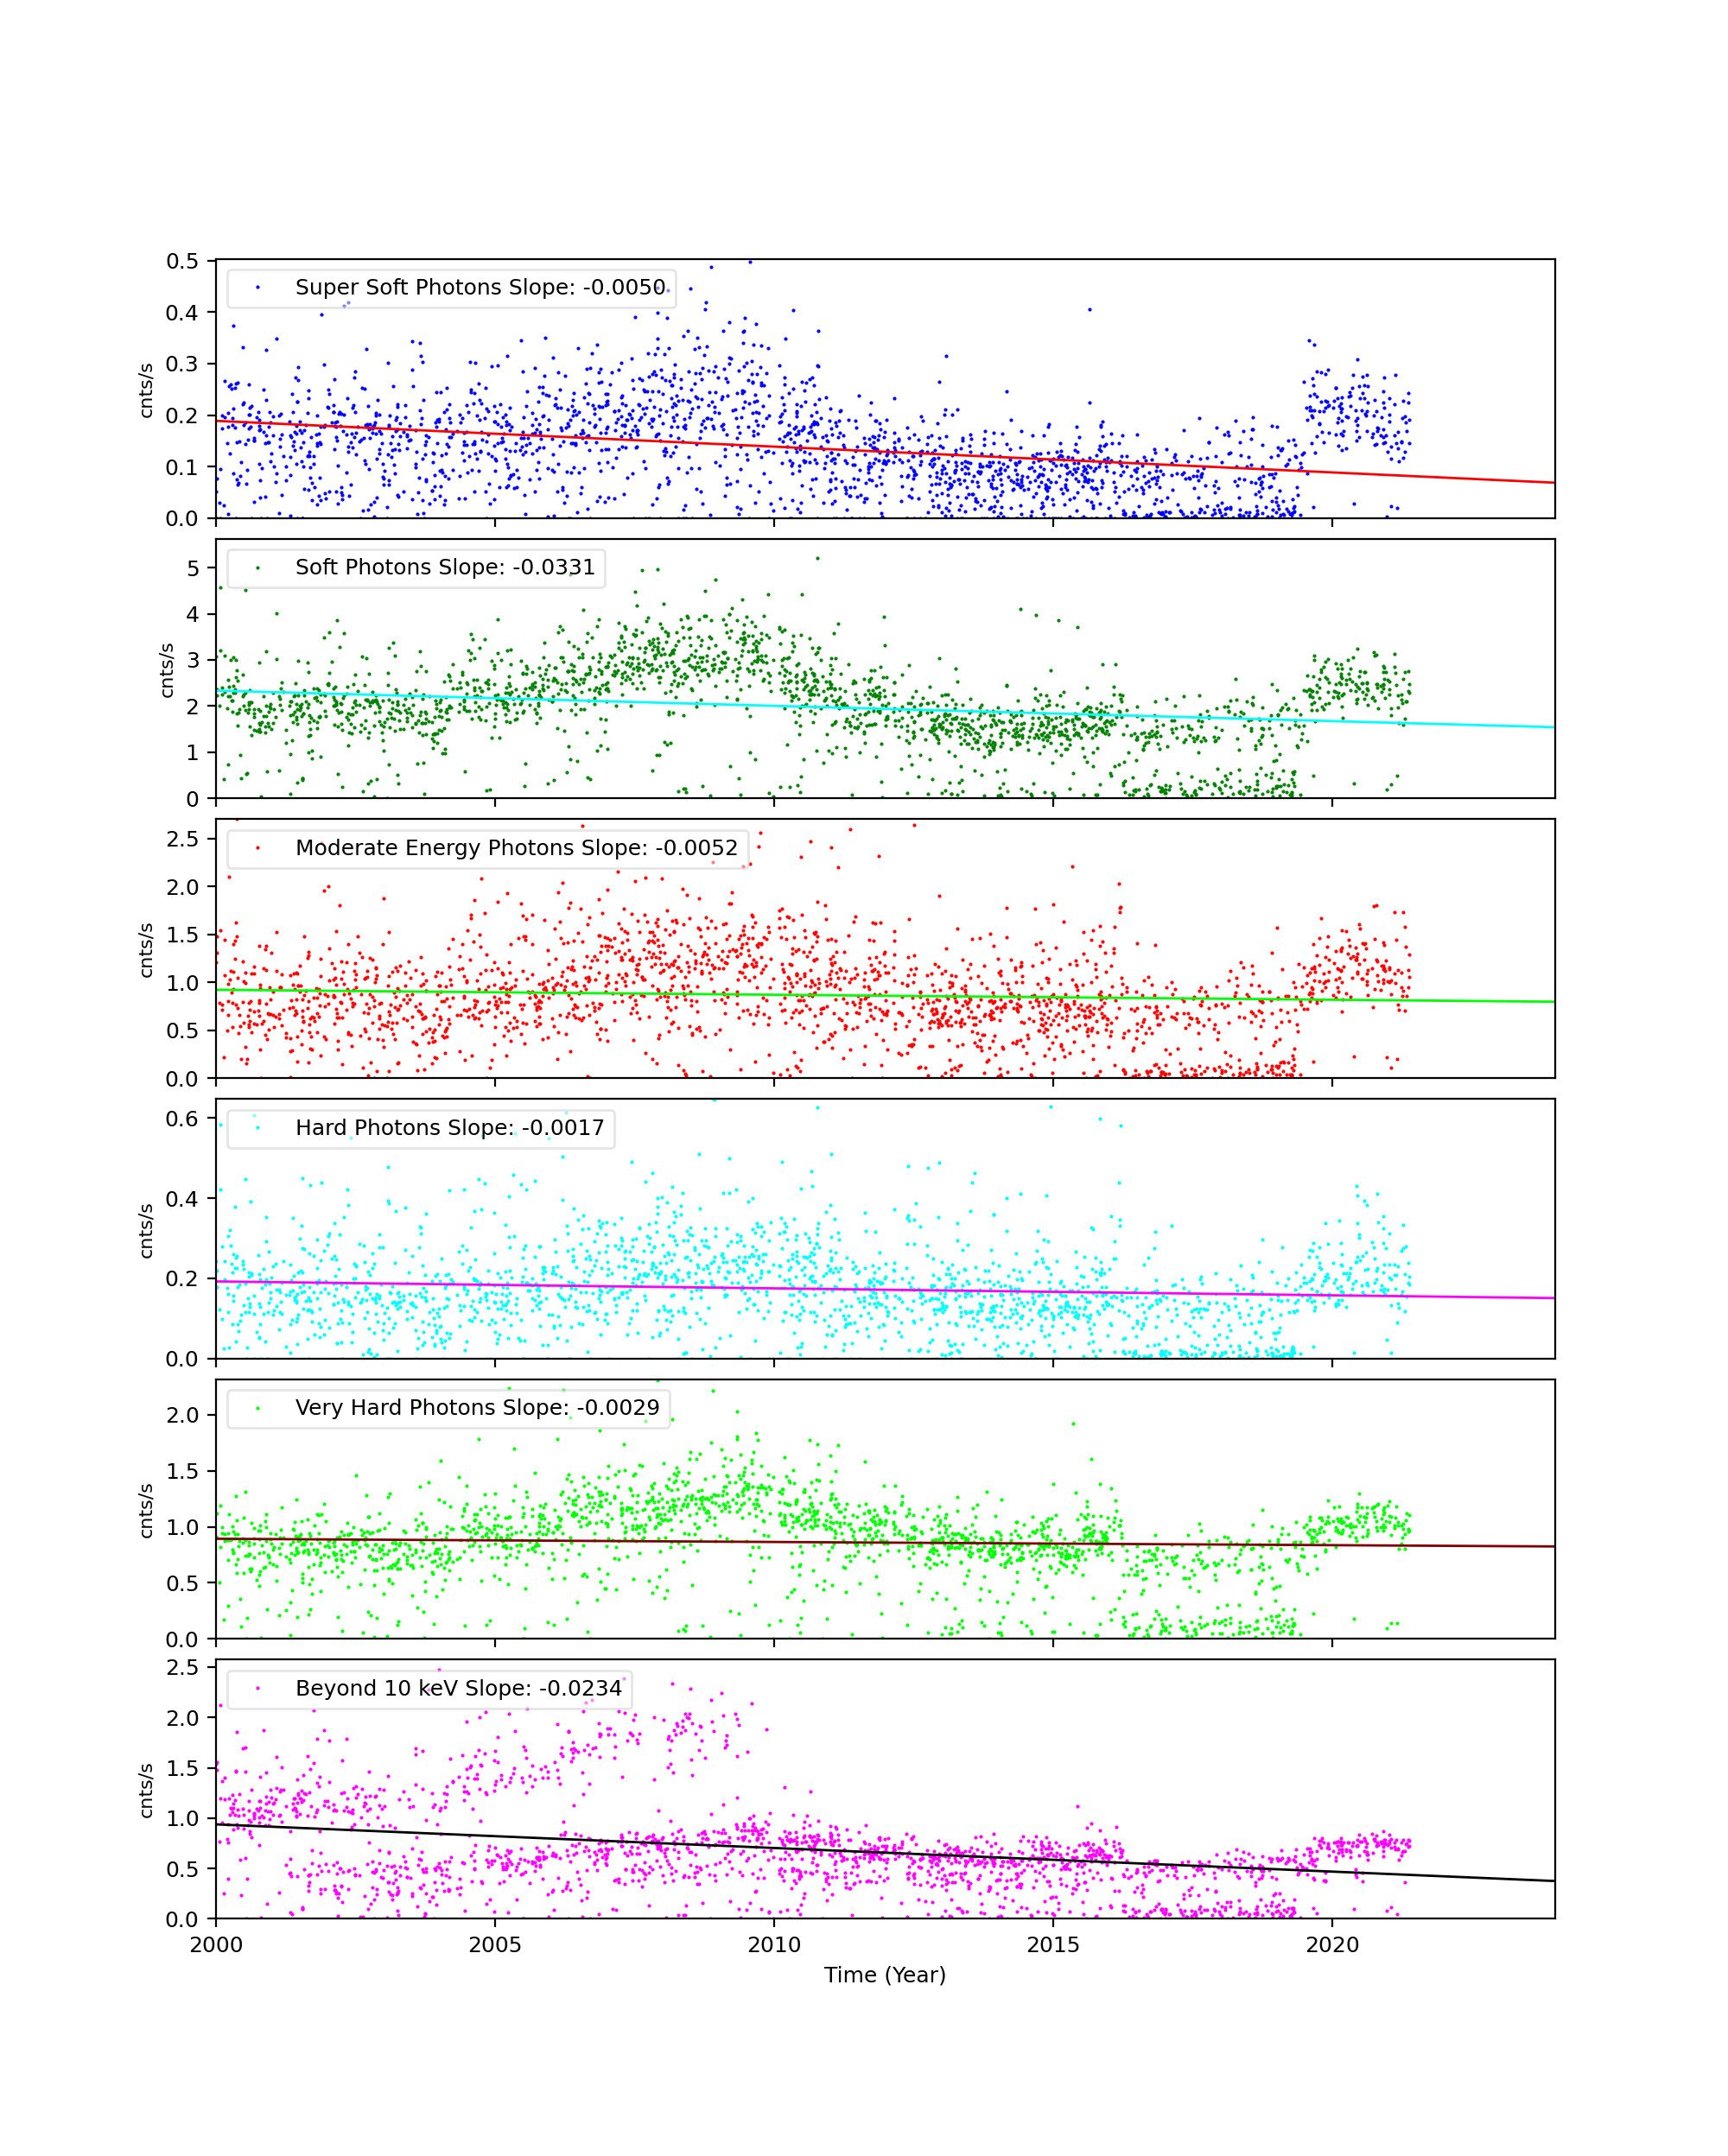
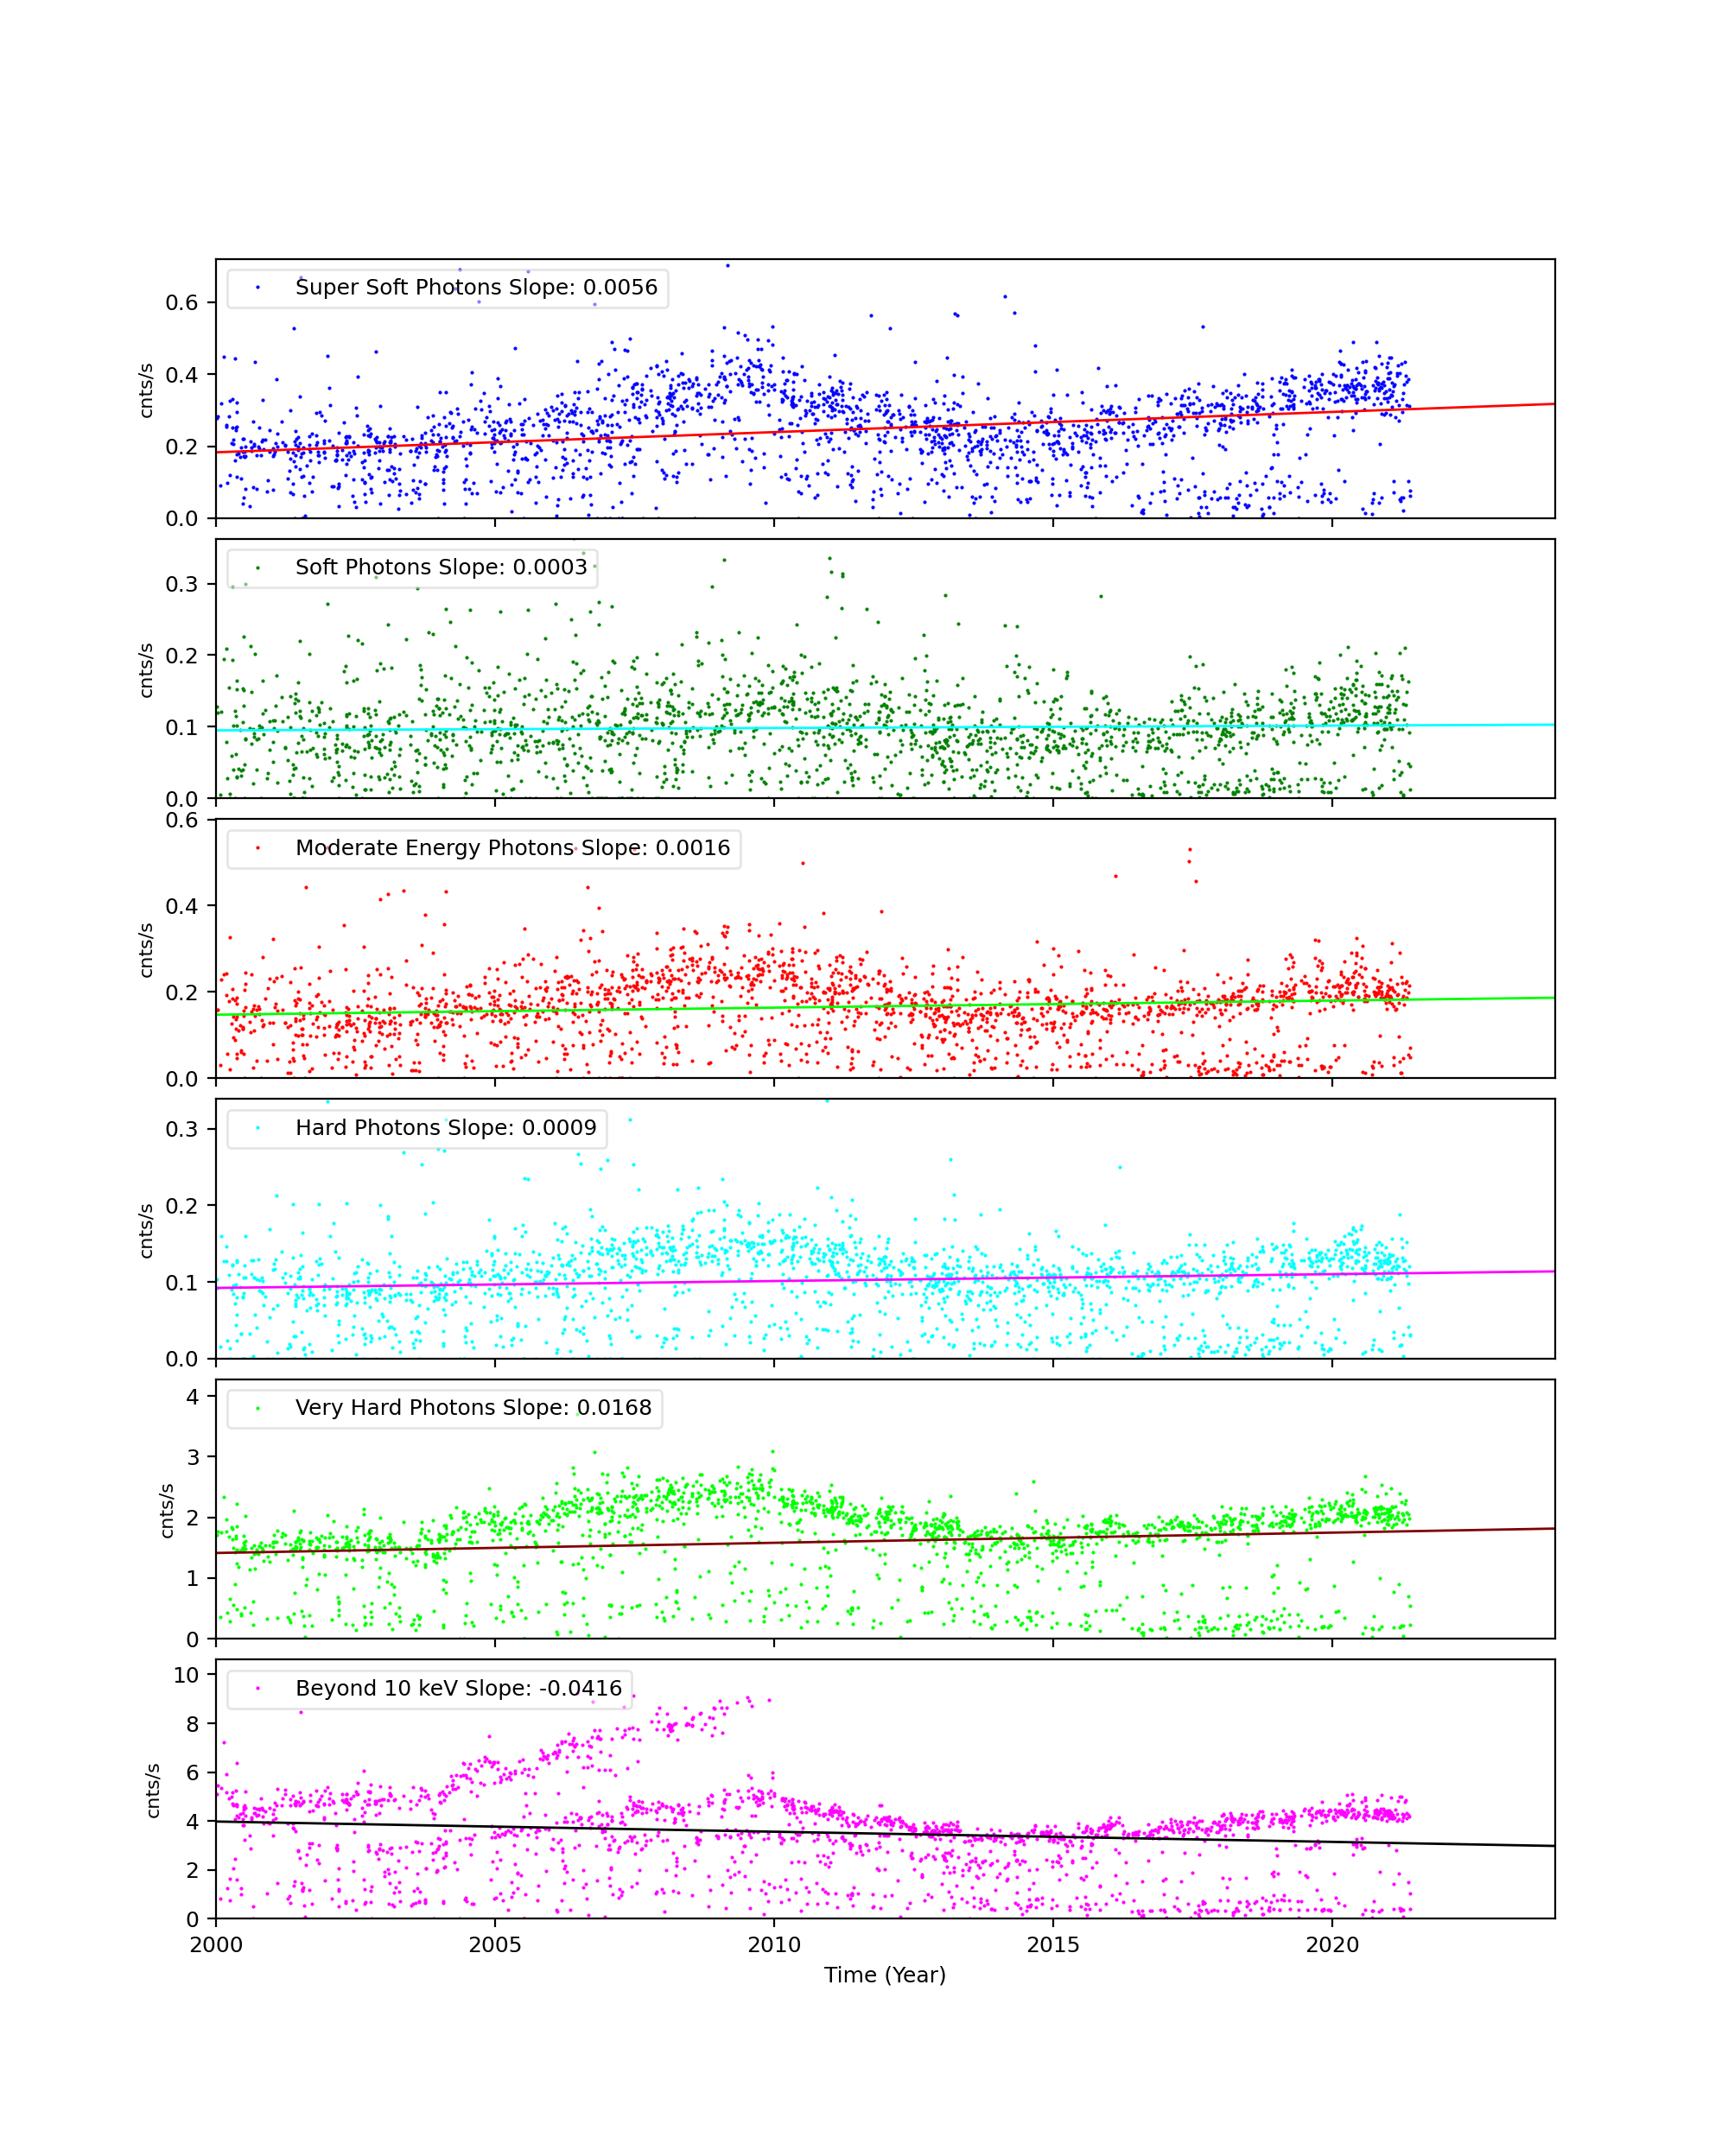
Science Instrument Background Rates
| Name | Low (keV) | High(KeV) | Description |
|---|---|---|---|
| SSoft | 0.00 | 0.50 | Super soft photons |
| Soft | 0.50 | 1.00 | Soft photons |
| Med | 1.00 | 3.00 | Moderate energy photons |
| Hard | 3.00 | 5.00 | Hard Photons |
| Harder | 5.00 | 10.00 | Very Hard photons |
| Hardest | 10.00 | Beyond 10 keV |
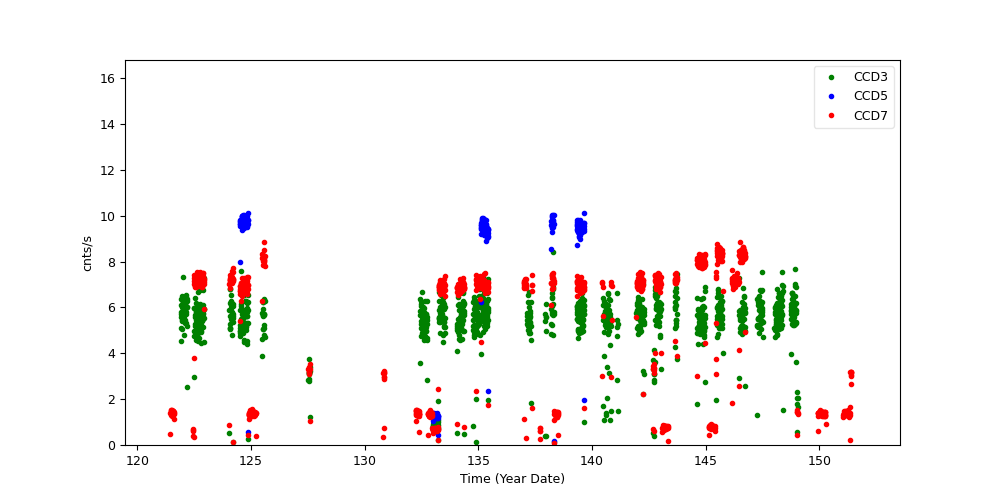
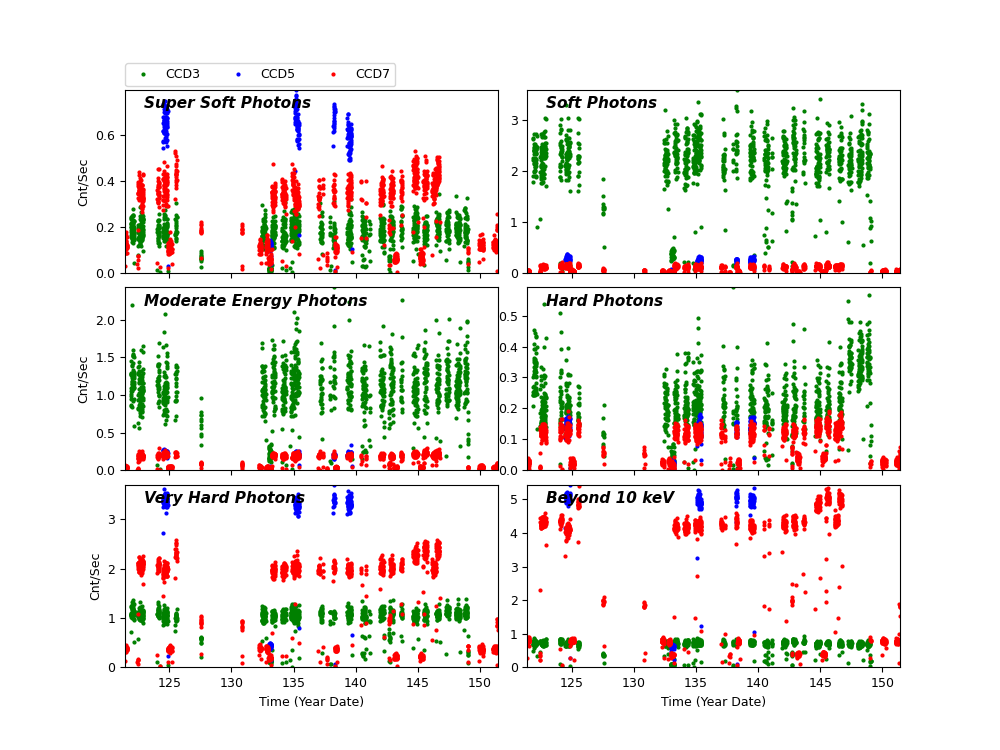
The following three plots show trends of SIB from year 2000. CCDs shown here are CCD3, CCD5, and CCD7. Fitted lines are linear fit after eliminating extreme outliers. For >10 keV plots, 2 lines are fit. One is with a 13 keV filter, and another without.
CCD 3
CCD 5
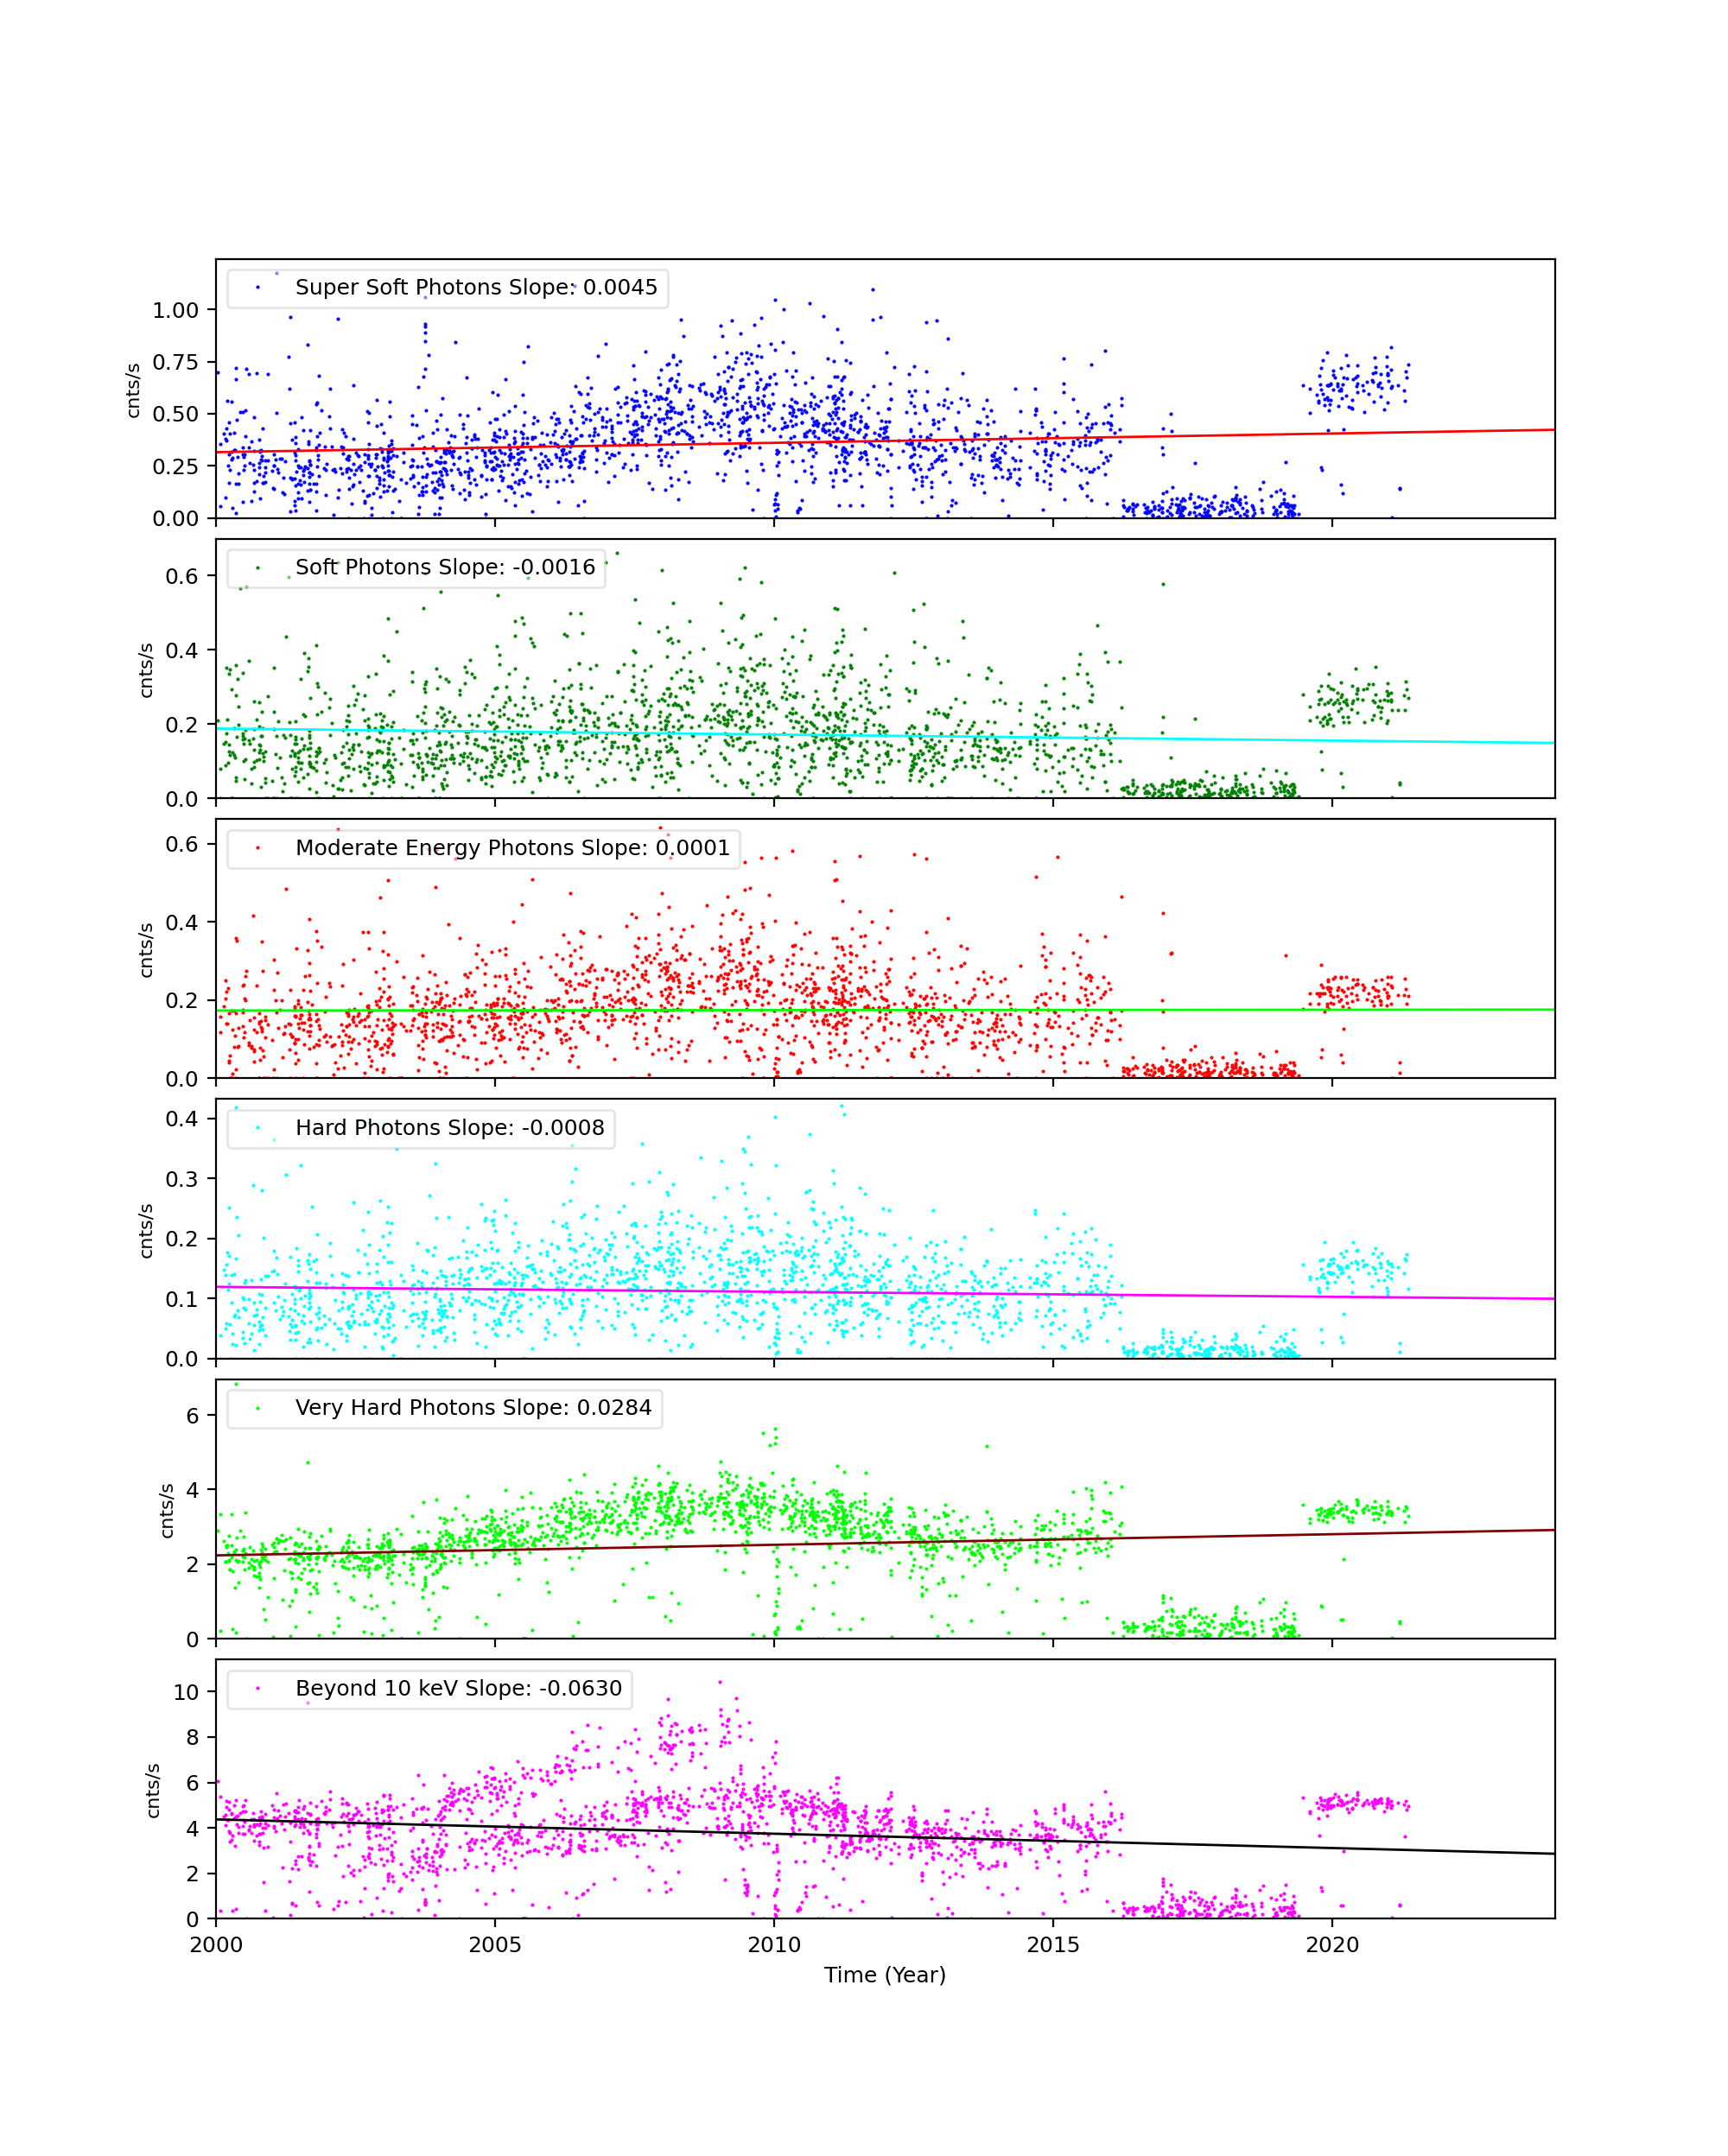
CCD 7
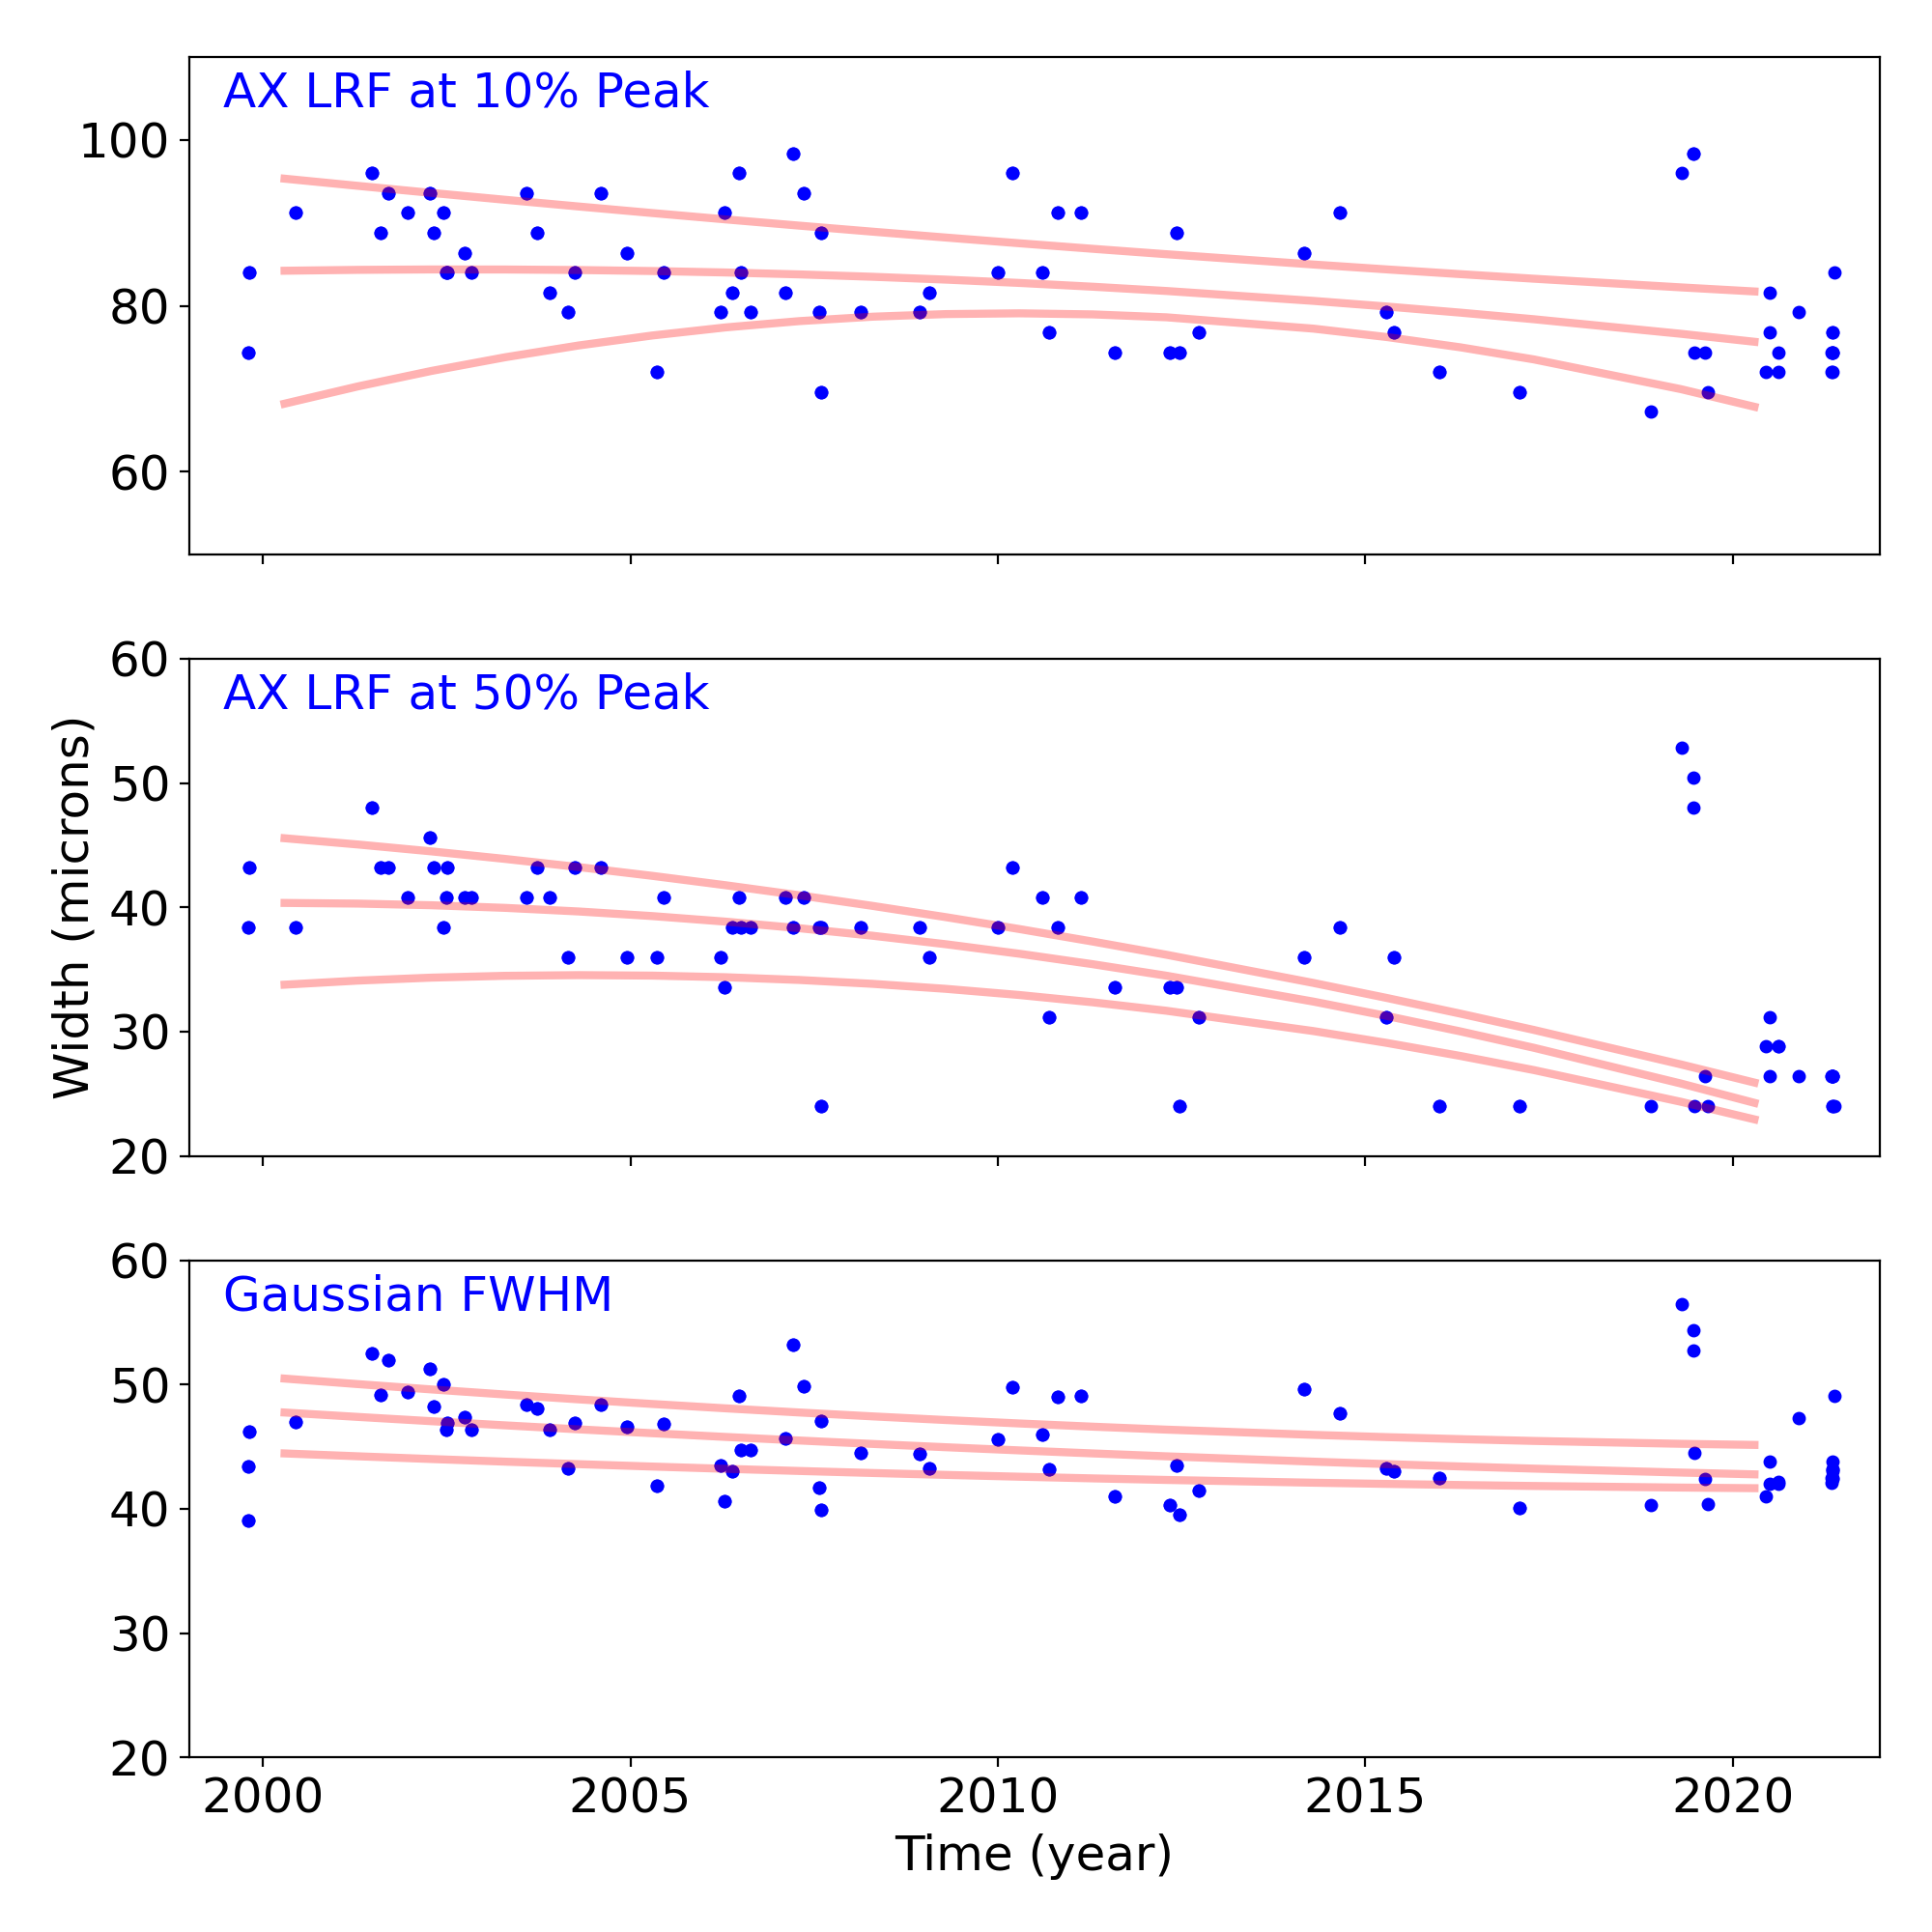
ACIS Histogram Mode Trends
We collected data from acis histogram mode data, and created trend plots of peak portions and peak widths against time (DOM). The peaks were estimated by fitting a simple Gaussian on three peaks (Al, Ti, and Mn), and the widths were estimated by a width at the half max from the peak.
All histogram data are taken under TIMED and GRADED_HIST mode, SIM position is at an external calibration source position, the focal temperature is around -119.7 C, and parameter settings in aciselec, acistemp are set to about same for all.
CCD 3, Peak Position
CCD 3, Peak Widths
CCD 3, Count Rates
HRC
DOSE of Central 4K Pore-Pairs
Please refer to Maximum Dose Trends for more details.
)
|
|---|
IMAGE                NPIX      MEAN    STDDEV      MIN       MAX
HRCI_05_2021.fits  16777216	0.079 	0.285 	0.000 	9.000
)
IMAGE                       NPIX      MEAN    STDDEV      MIN       MAX
HRCI_08_1999_05_2021.fits  16777216	7.024 	6.409 	0.000 	313.000
)
|
|---|
IMAGE                NPIX      MEAN    STDDEV      MIN       MAX
HRCS_05_2021.fits  16777216	0.111 	0.369 	0.000 	7.000
)
IMAGE                       NPIX      MEAN    STDDEV      MIN       MAX
HRCS_08_1999_05_2021.fits  16777216	20.041 	35.479 	0.000 	1759.000
|
|
Max dose trend plots corrected for events that "pile-up"
in the center of the taps due to bad position information.
|
)
|
)
|
)
|
)
|
| Feb 2021 | Nov 2020 | Aug 2020 | May 2020 |
|---|
)
|
)
|
)
|
)
|
| Feb 2021 | Nov 2020 | Aug 2020 | May 2020 |
|---|
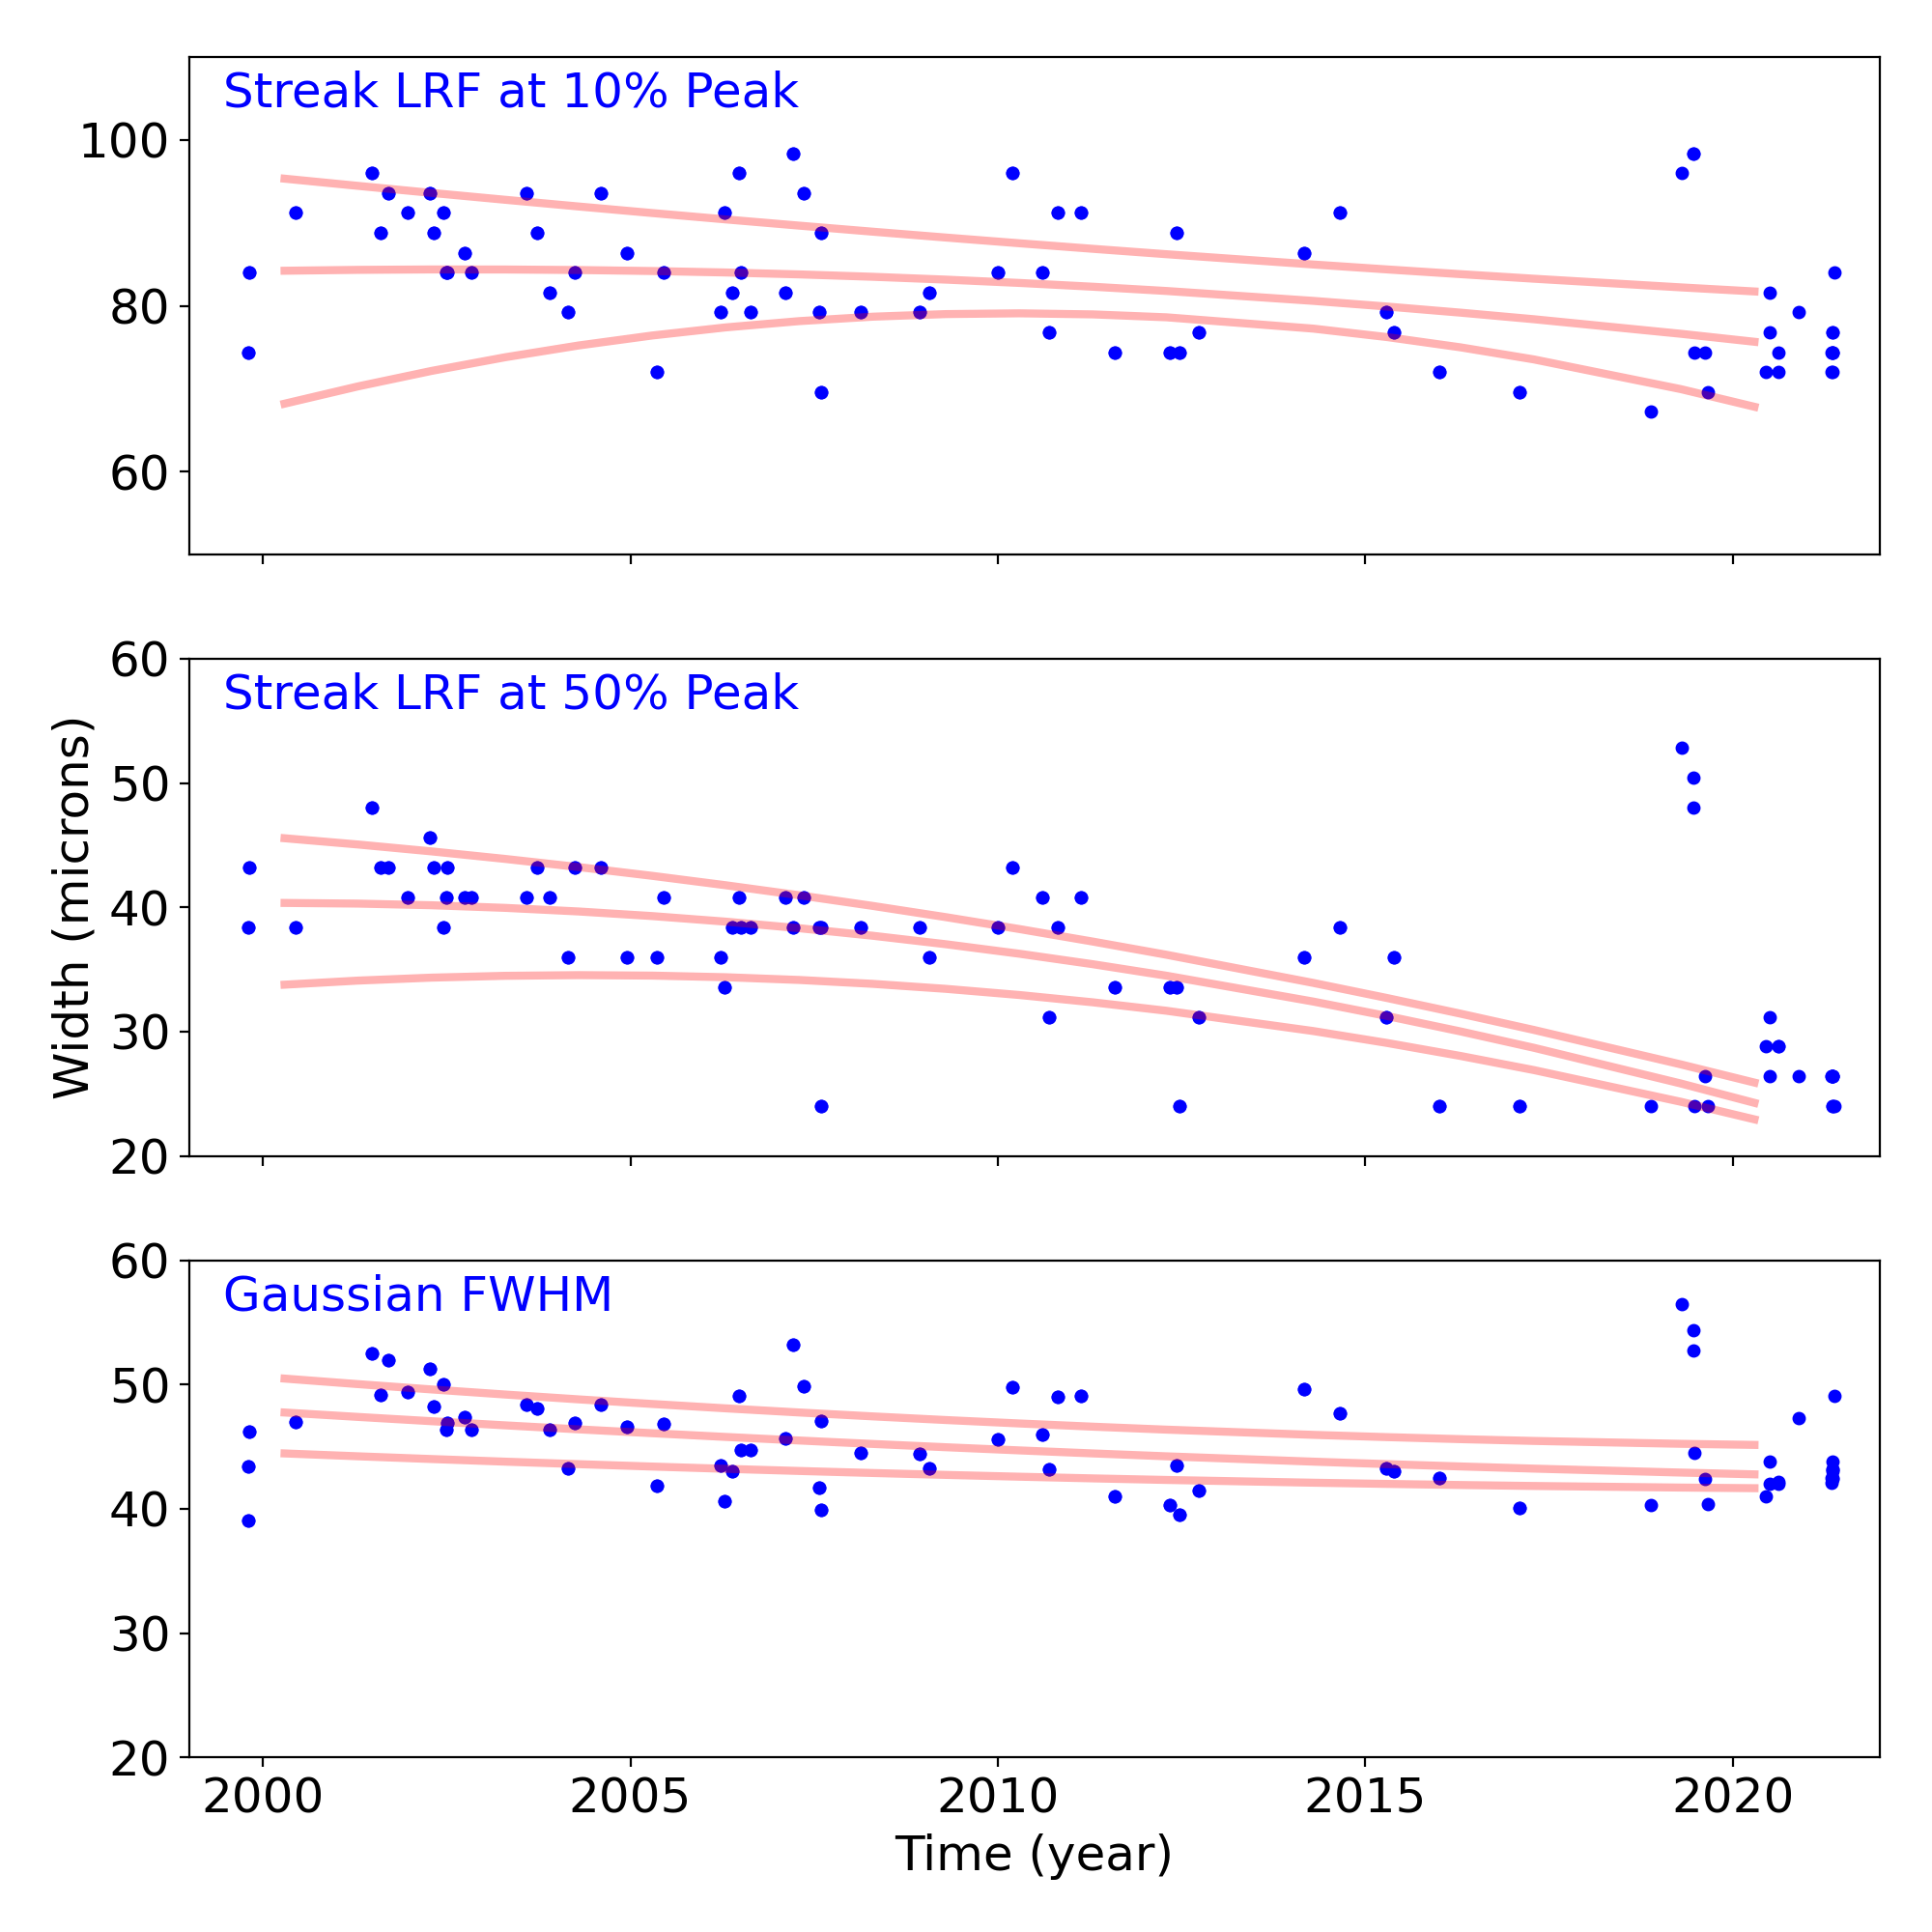
Gratings
Grating Trends/Focus
We plot the width of the zero order streak of ACIS/HETG observations and the width of the zero order image for HRC/LETG observations of point sources. No significant defocusing trend is seen at this time. See Gratings Trends pages.
PCAD
ACA Trending
| ACIS |
)
|
)
|
)
|
|
|---|---|---|---|---|
)
|
)
|
)
| ||
| HRCI |
)
|
)
|
)
|
)
|
| HRCI |
)
|
)
|
)
|
)
|
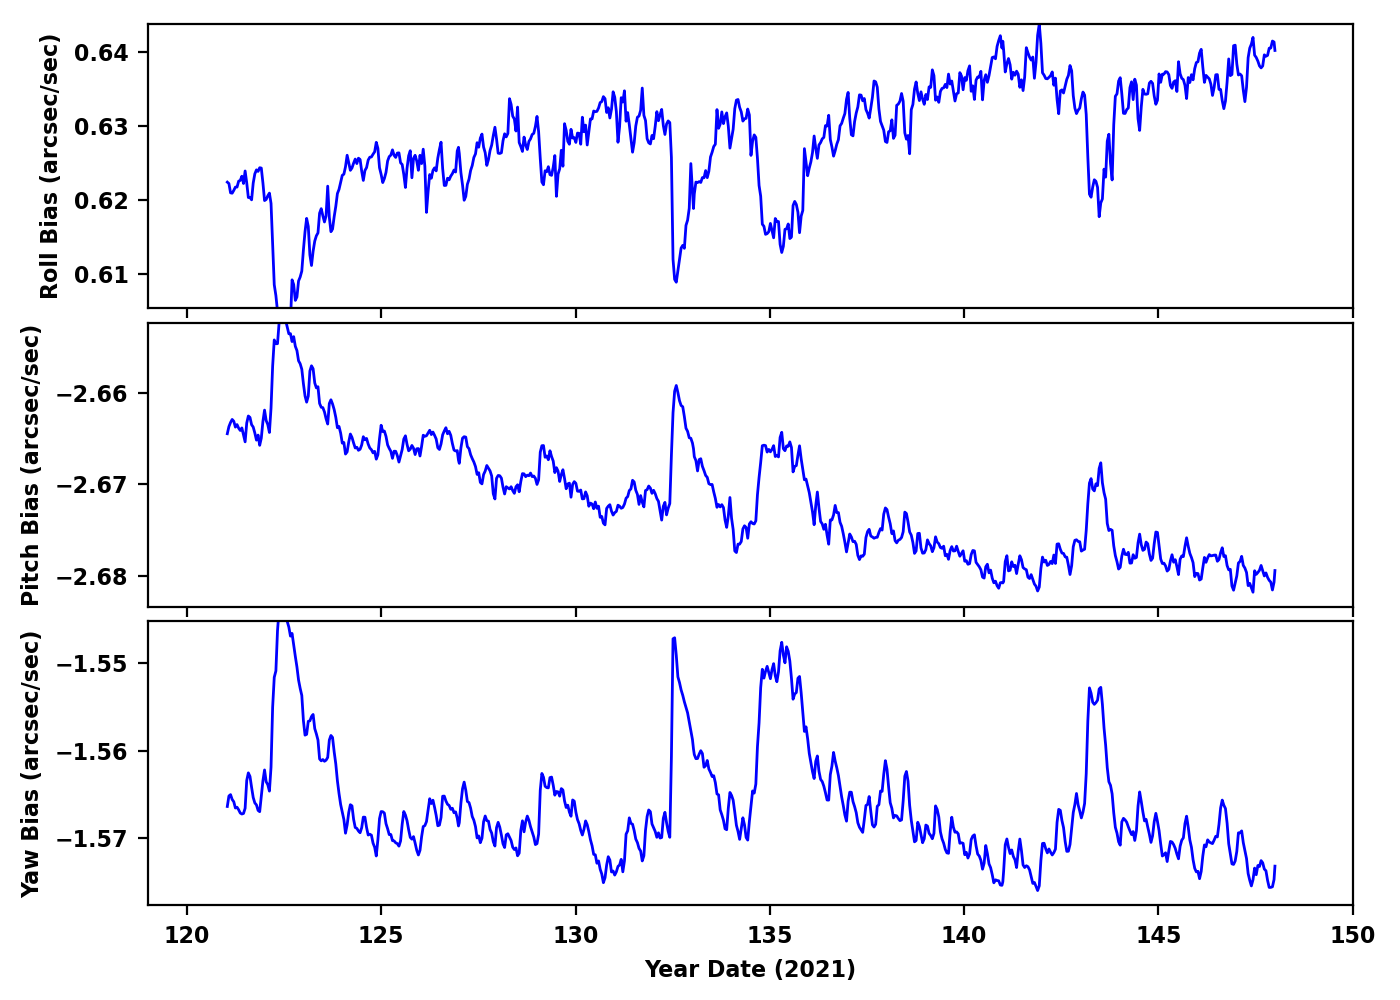
Gyro Bias Drift
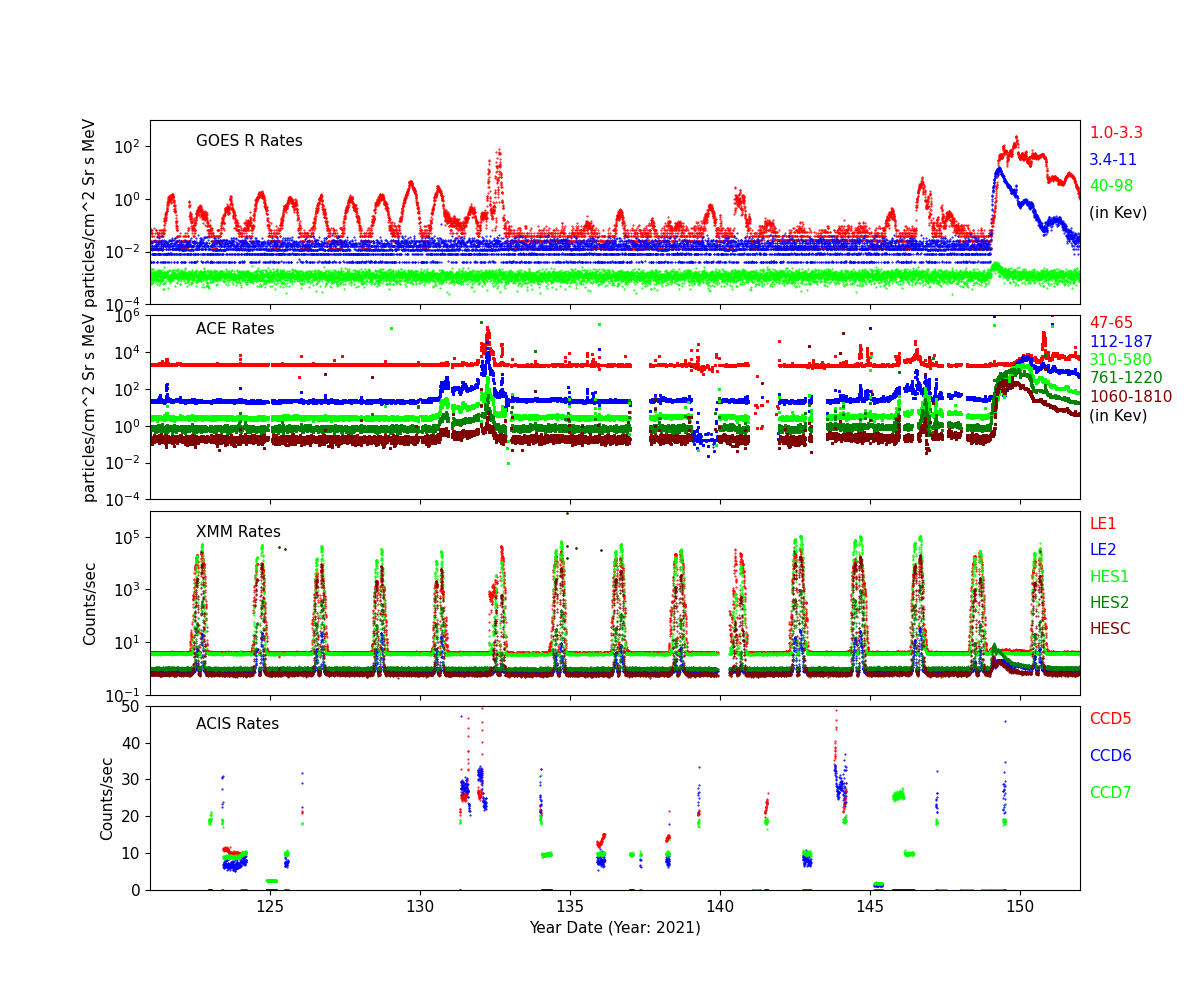
Radiation History
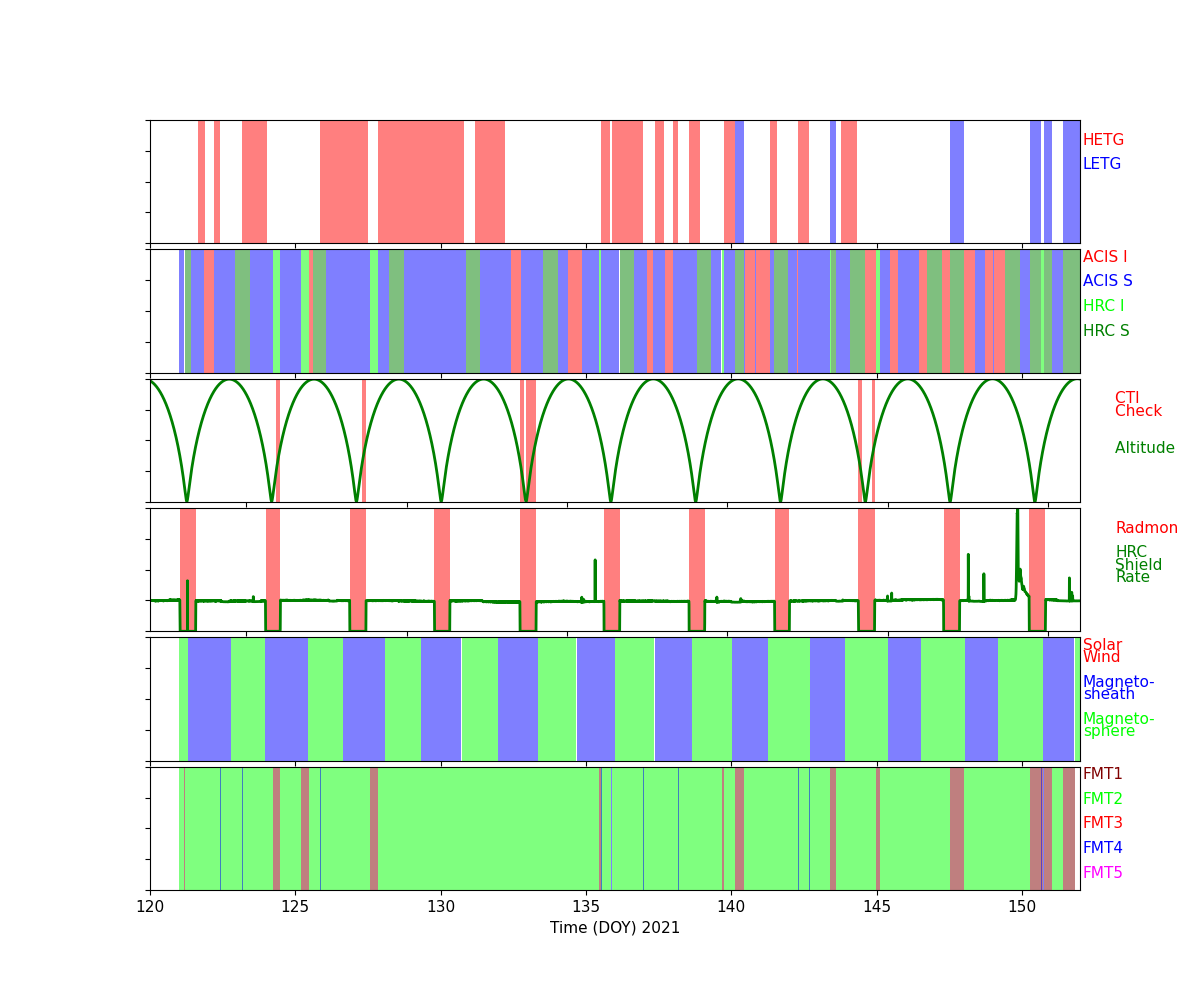
Radiation Count Rates of May 2021
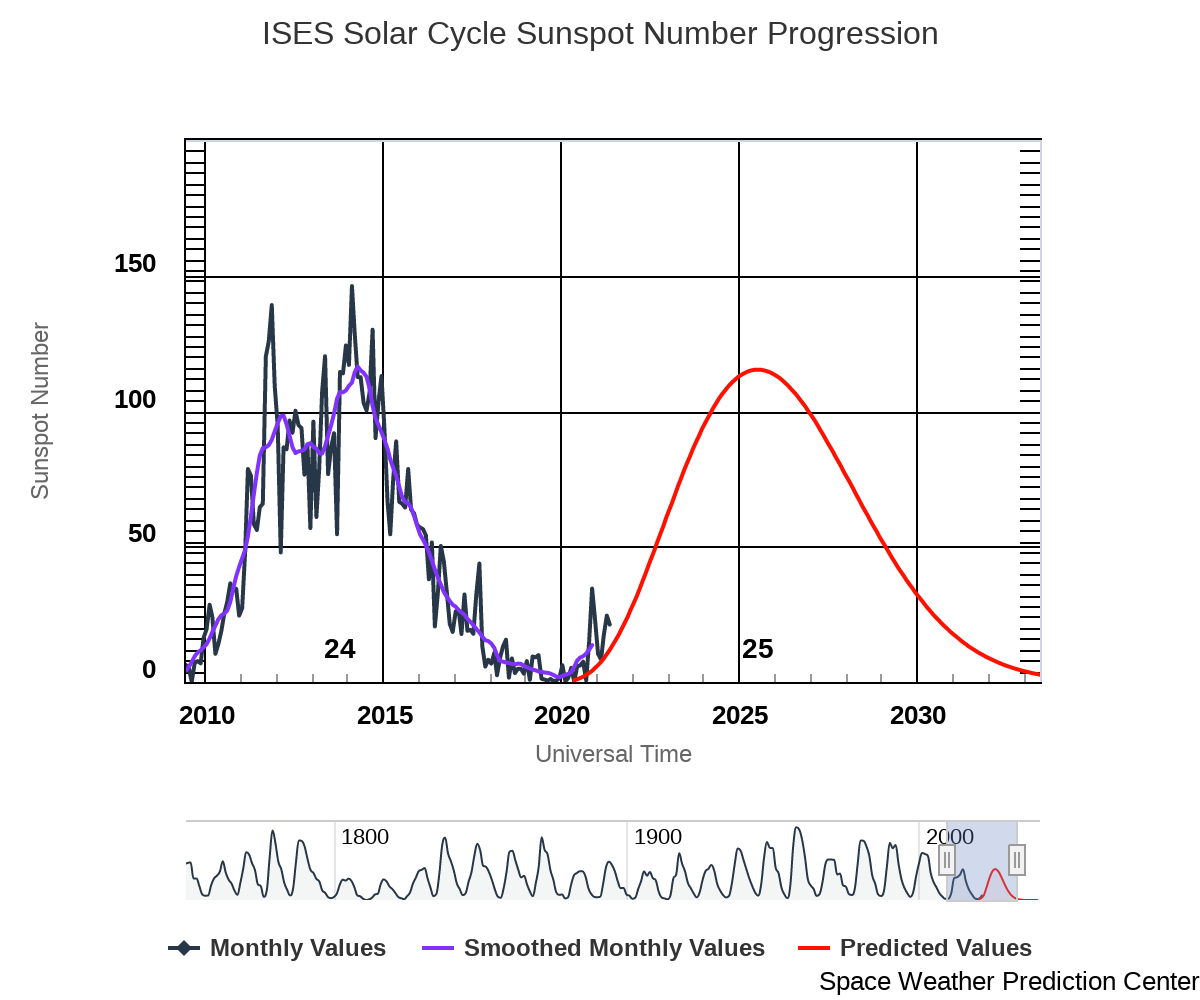
Sun Spot History (See:NOAA Page)
Trending
Quarterly Trends
- HRMA Heater
| Previous Quarter | |||||||
| MSID | MEAN | RMS | DELTA/YR | DELTA/YR/YR | UNITS | DESCRIPTION | |
| ohrthr03 | -1.732e-04 | 8.182e-06 | (2.95+/-0.00)e2 | -(9.34+/-35.28)e-4 | K | RT 5: HRMA FORWARD APERTURE PLATE | |
|---|---|---|---|---|---|---|---|
| ohrthr09 | -0.004 | 9.033e-05 | (2.96+/-0.00)e2 | 0.07 +/- 0.05 | K | RT 105: HRMA CAP | |
| ohrthr17 | -0.005 | 9.691e-05 | (2.96+/-0.00)e2 | 0.08 +/- 0.05 | K | RT 125: HSA OUTER CYNLINDER | |
| ohrthr24 | -0.008 | 2.018e-04 | (2.97+/-0.01)e2 | 0.13 +/- 0.14 | K | RT 12: HRMA AFT HEATER PLATE | |
| ohrthr38 | -0.014 | 6.484e-04 | (3.00+/-0.02)e2 | 0.15 +/- 0.53 | K | RT 120: HRMA AFT COLLIMATOR OUTER CYLINDER | |
| ohrthr52 | -0.004 | 9.411e-05 | (2.96+/-0.00)e2 | 0.08 +/- 0.05 | K | RT 100: HRMA CAP | |
- HRMA Thermal
| Previous Quarter | |||||||
| MSID | MEAN | RMS | DELTA/YR | DELTA/YR/YR | UNITS | DESCRIPTION | |
| 4rt568t | -0.016 | 6.963e-04 | (2.99+/-0.02)e2 | 0.12 +/- 0.57 | K | RT 568 - HRMA TEMP | |
|---|---|---|---|---|---|---|---|
| 4rt569t | -0.007 | 1.774e-04 | (2.96+/-0.00)e2 | 0.09 +/- 0.12 | K | RT 569 - HRMA TEMP | |
| 4rt570t | -0.004 | 8.841e-05 | (2.96+/-0.00)e2 | 0.02 +/- 0.05 | K | RT 570 - HRMA TEMP | |
| 4rt575t | -0.015 | 9.231e-04 | (3.04+/-0.02)e2 | 0.31 +/- 0.76 | K | RT 575 - OB CONE TEMP | |
| 4rt576t | -0.015 | 6.658e-04 | (2.95+/-0.02)e2 | -0.14 +/- 0.54 | K | RT 576 - OB CONE TEMP | |
| 4rt578t | -0.030 | 0.001 | (3.02+/-0.03)e2 | -0.92 +/- 0.92 | K | RT 578 - OB CONE TEMP | |
- MUPS
| Previous Quarter | |||||||
| MSID | MEAN | RMS | DELTA/YR | DELTA/YR/YR | UNITS | DESCRIPTION | |
| pm1thv1t | 0.035 | 0.007 | (3.51+/-0.17)e2 | -4.32 +/- 3.52 | K | MUPS 1 THRUSTER VALVE 01 TEMP | |
|---|---|---|---|---|---|---|---|
| pline02t | 0.021 | 0.006 | (3.33+/-0.13)e2 | -4.28 +/- 3.25 | K | PROP LINE TEMP 02 | |
| pline03t | 0.018 | 0.006 | (3.28+/-0.15)e2 | -5.33 +/- 2.90 | K | PROP LINE TEMP 03 | |
| pline04t | 0.012 | 0.005 | (3.16+/-0.11)e2 | -4.68 +/- 2.86 | K | PROP LINE TEMP 04 | |
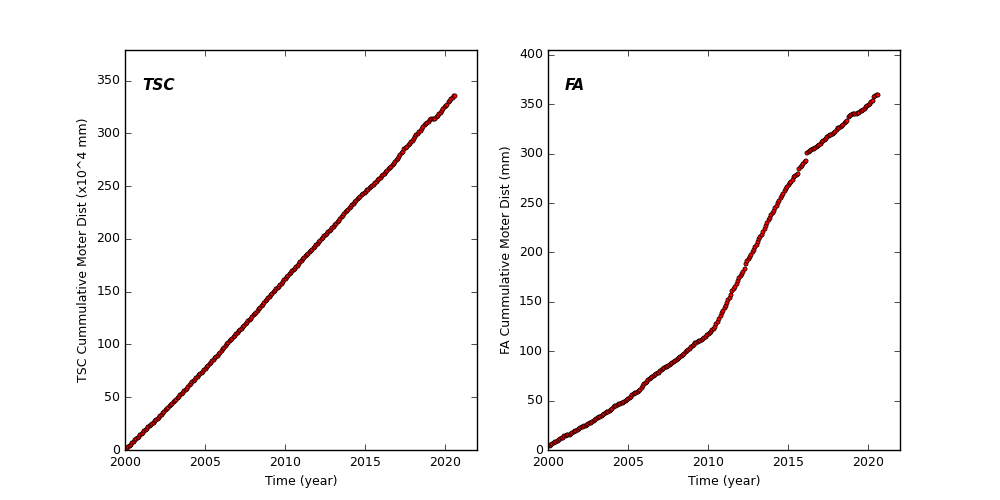
Spacecraft Motions
TSC and FA Cummulative Moter Distance
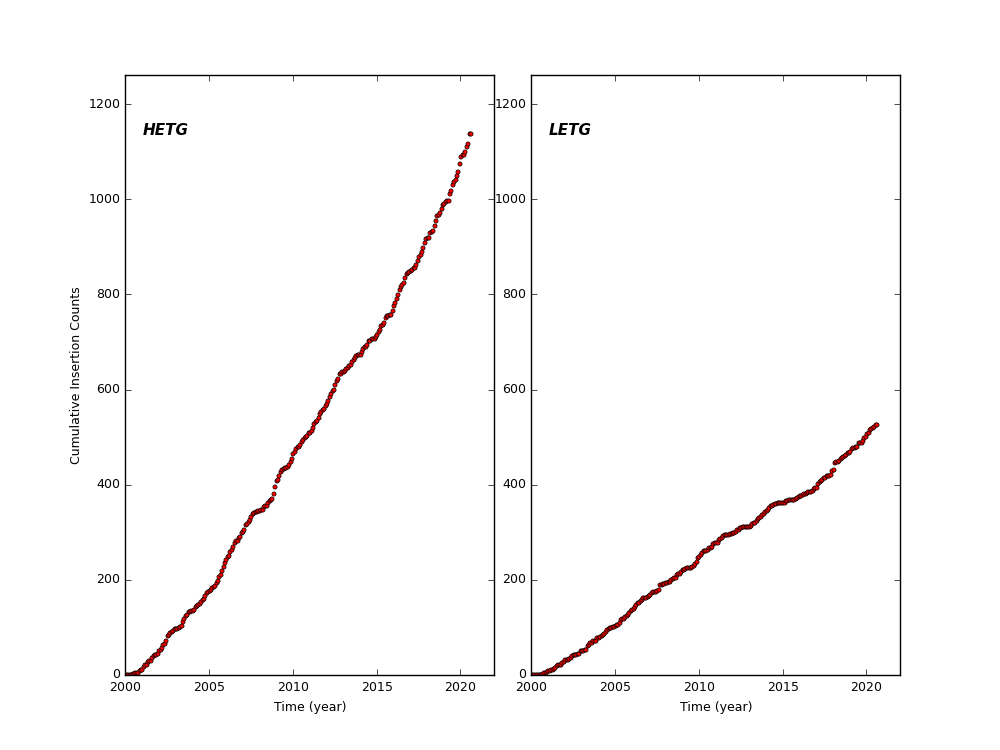
HETG and LETG Cummulative Insertion Counts
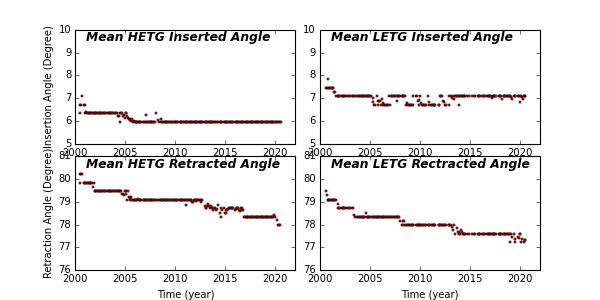
HETG/LETG Insertion/Retraction Angle
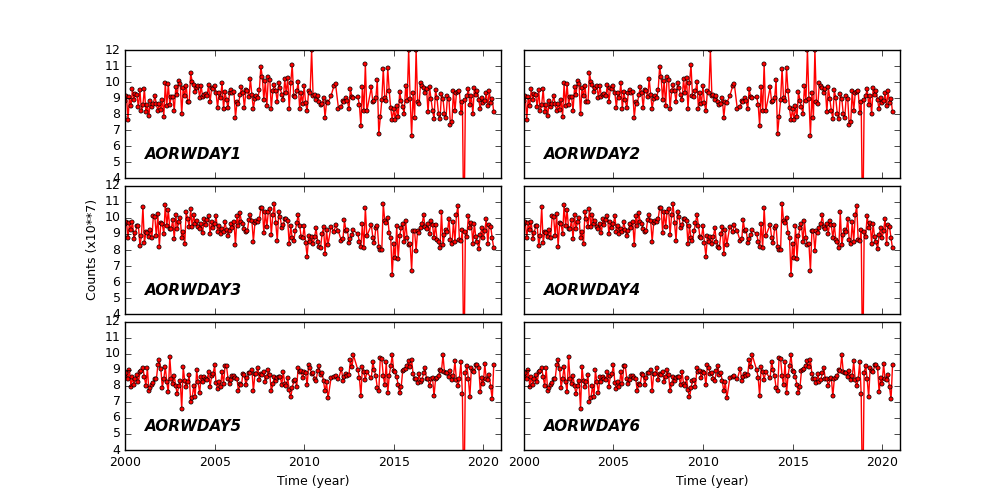
Reaction Wheel Rotations