ACIS
ACIS DOSE Registered-Photon-Map
The steps we took to compute the dose map are;
- Level 1 Event files for a specified month are obtained from archive.
- Image data including I2, I3, S2, S3 CCDs are extracted from all event files.
- All the extracted image data were merged to create a month long exposure map for the month.
- The exposure map is opened with ds9, and check a distribution of count rates against energy. From this, estimate the upper threshold value. Any events beyond this upper threshold are assumed erroneous events such as bad pixels.
- Using this upper threshold, the data is filtered, and create a cleaned exposure map for the month.
- The exposure map from each month from the Sep 1999 is added up to create a cumulative exposure map for each month.
- Using fimgstatistic, we compute count rate statistics for each CCDs.
- For observations with high data drop rates (e.g., Crab nebula, Cas A), we corrected the observations by adding events.
Please check more detail plots at Telemetered Photon Dose Trend page.
)
)
)
Statistics:
# IMAGE     NPIX     MEAN        RMS        MIN     MAX
ACIS_aug21 6004901       6.245         8.361           0.0     1264


I2 node 0  262654	4.676729	2.528409	0.0	 36.0
I2 node 1  262654	4.882762	2.813140	0.0	435.0
I2 node 2  262654	4.834271	2.700646	0.0	 44.0
I2 node 3  262654	4.841565	2.710874	0.0	235.0

I3 node 0  262654	5.595999	2.856290	0.0	 55.0
I3 node 1  262654	5.519799	3.002449	0.0	233.0
I3 node 2  262654	5.336509	2.662145	0.0	 47.0
I3 node 3  262654	5.353917	2.724131	0.0	 92.0

S2 node 0  262654	8.013951	3.288948	0.0	 83.0
S2 node 1  262654	8.401152	3.853572	0.0	202.0
S2 node 2  262654	9.114468	4.671066	0.0	271.0
S2 node 3  262654	8.789079	4.518505	0.0	440.0

S3 node 0  262654	13.306464	12.073517	0.0	332.0
S3 node 1  262654	14.153408	8.098550	0.0	620.0
S3 node 2  262654	14.286041	7.640798	0.0	239.0
S3 node 3  262654	13.058536	7.107267	0.0	228.0
)
)
)
Statistics:
 IMAGE     NPIX      MEAN        RMS           MIN      MAX
ACIS_total   6004901       2511.283         3232.404           0.0   138965


I2 node 0  262654	2168.365884	435.087146	464.0	12920.0
I2 node 1  262654	2280.320112	617.075344	478.0	121965.0
I2 node 2  262654	2306.654068	488.179721	494.0	13432.0
I2 node 3  262654	2312.268234	597.174219	470.0	28777.0

I3 node 0  262654	2484.202827	610.759599	460.0	13394.0
I3 node 1  262654	2561.524099	1723.494097	493.0	55662.0
I3 node 2  262654	2277.220359	425.959525	467.0	13489.0
I3 node 3  262654	2269.576428	458.207643	431.0	34221.0

S2 node 0  262654	2928.170029	474.039807	1597.0	22251.0
S2 node 1  262654	3104.868394	704.569168	1777.0	16839.0
S2 node 2  262654	3437.601796	710.964938	2196.0	28976.0
S2 node 3  262654	3400.060644	566.514134	1936.0	68987.0

S3 node 0  262654	5222.025280	2884.462685	2263.0	53283.0
S3 node 1  262654	6410.948148	2348.737917	0.0	38060.0
S3 node 2  262654	5150.838569	1336.457130	2315.0	27076.0
S3 node 3  262654	4022.837243	751.451981	2433.0	26328.0
)
|
)
|
)
|
)
|
| May 2021 | Feb 2021 | Nov 2020 | Aug 2020 |
|---|
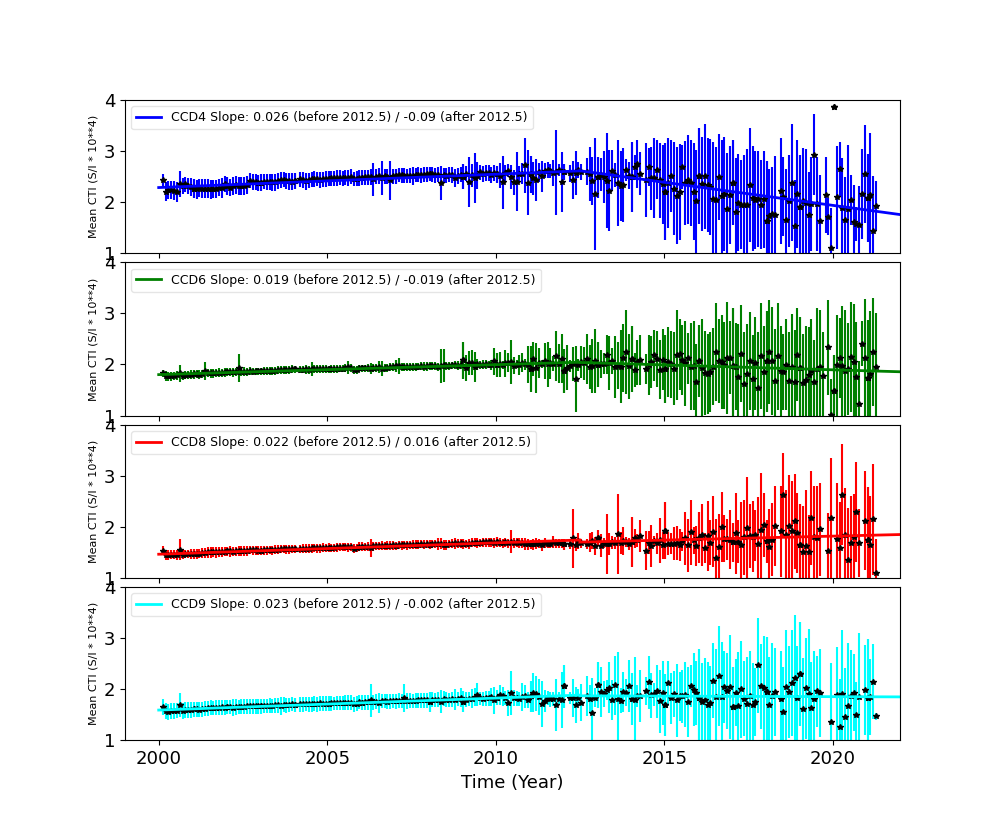
The Mean Detrended CTI
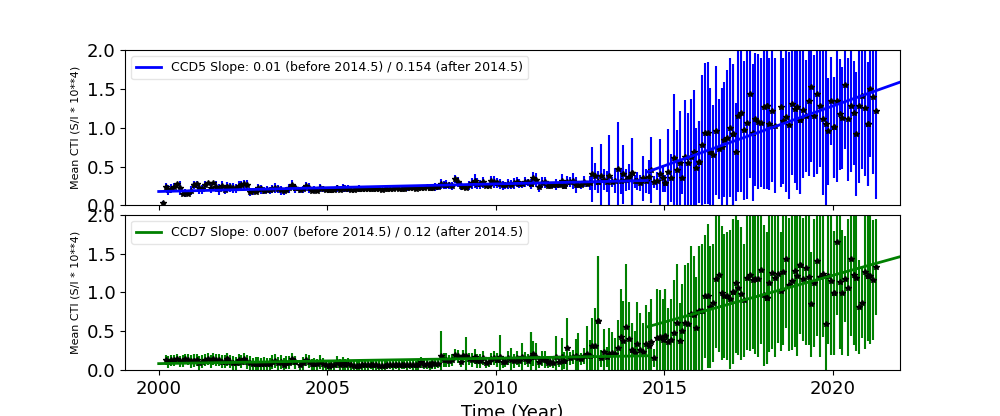
We report CTIs with a refined data definition. CTIs were computed for the temperature dependency corrected data. Please see CTI page for detailed explanation. CTI's are computed for Mn K alpha, and defined as slope/intercept x10^4 of row # vs ADU. Data file: here
Imaging CCDs

Spectral CCDs
Backside CCDs
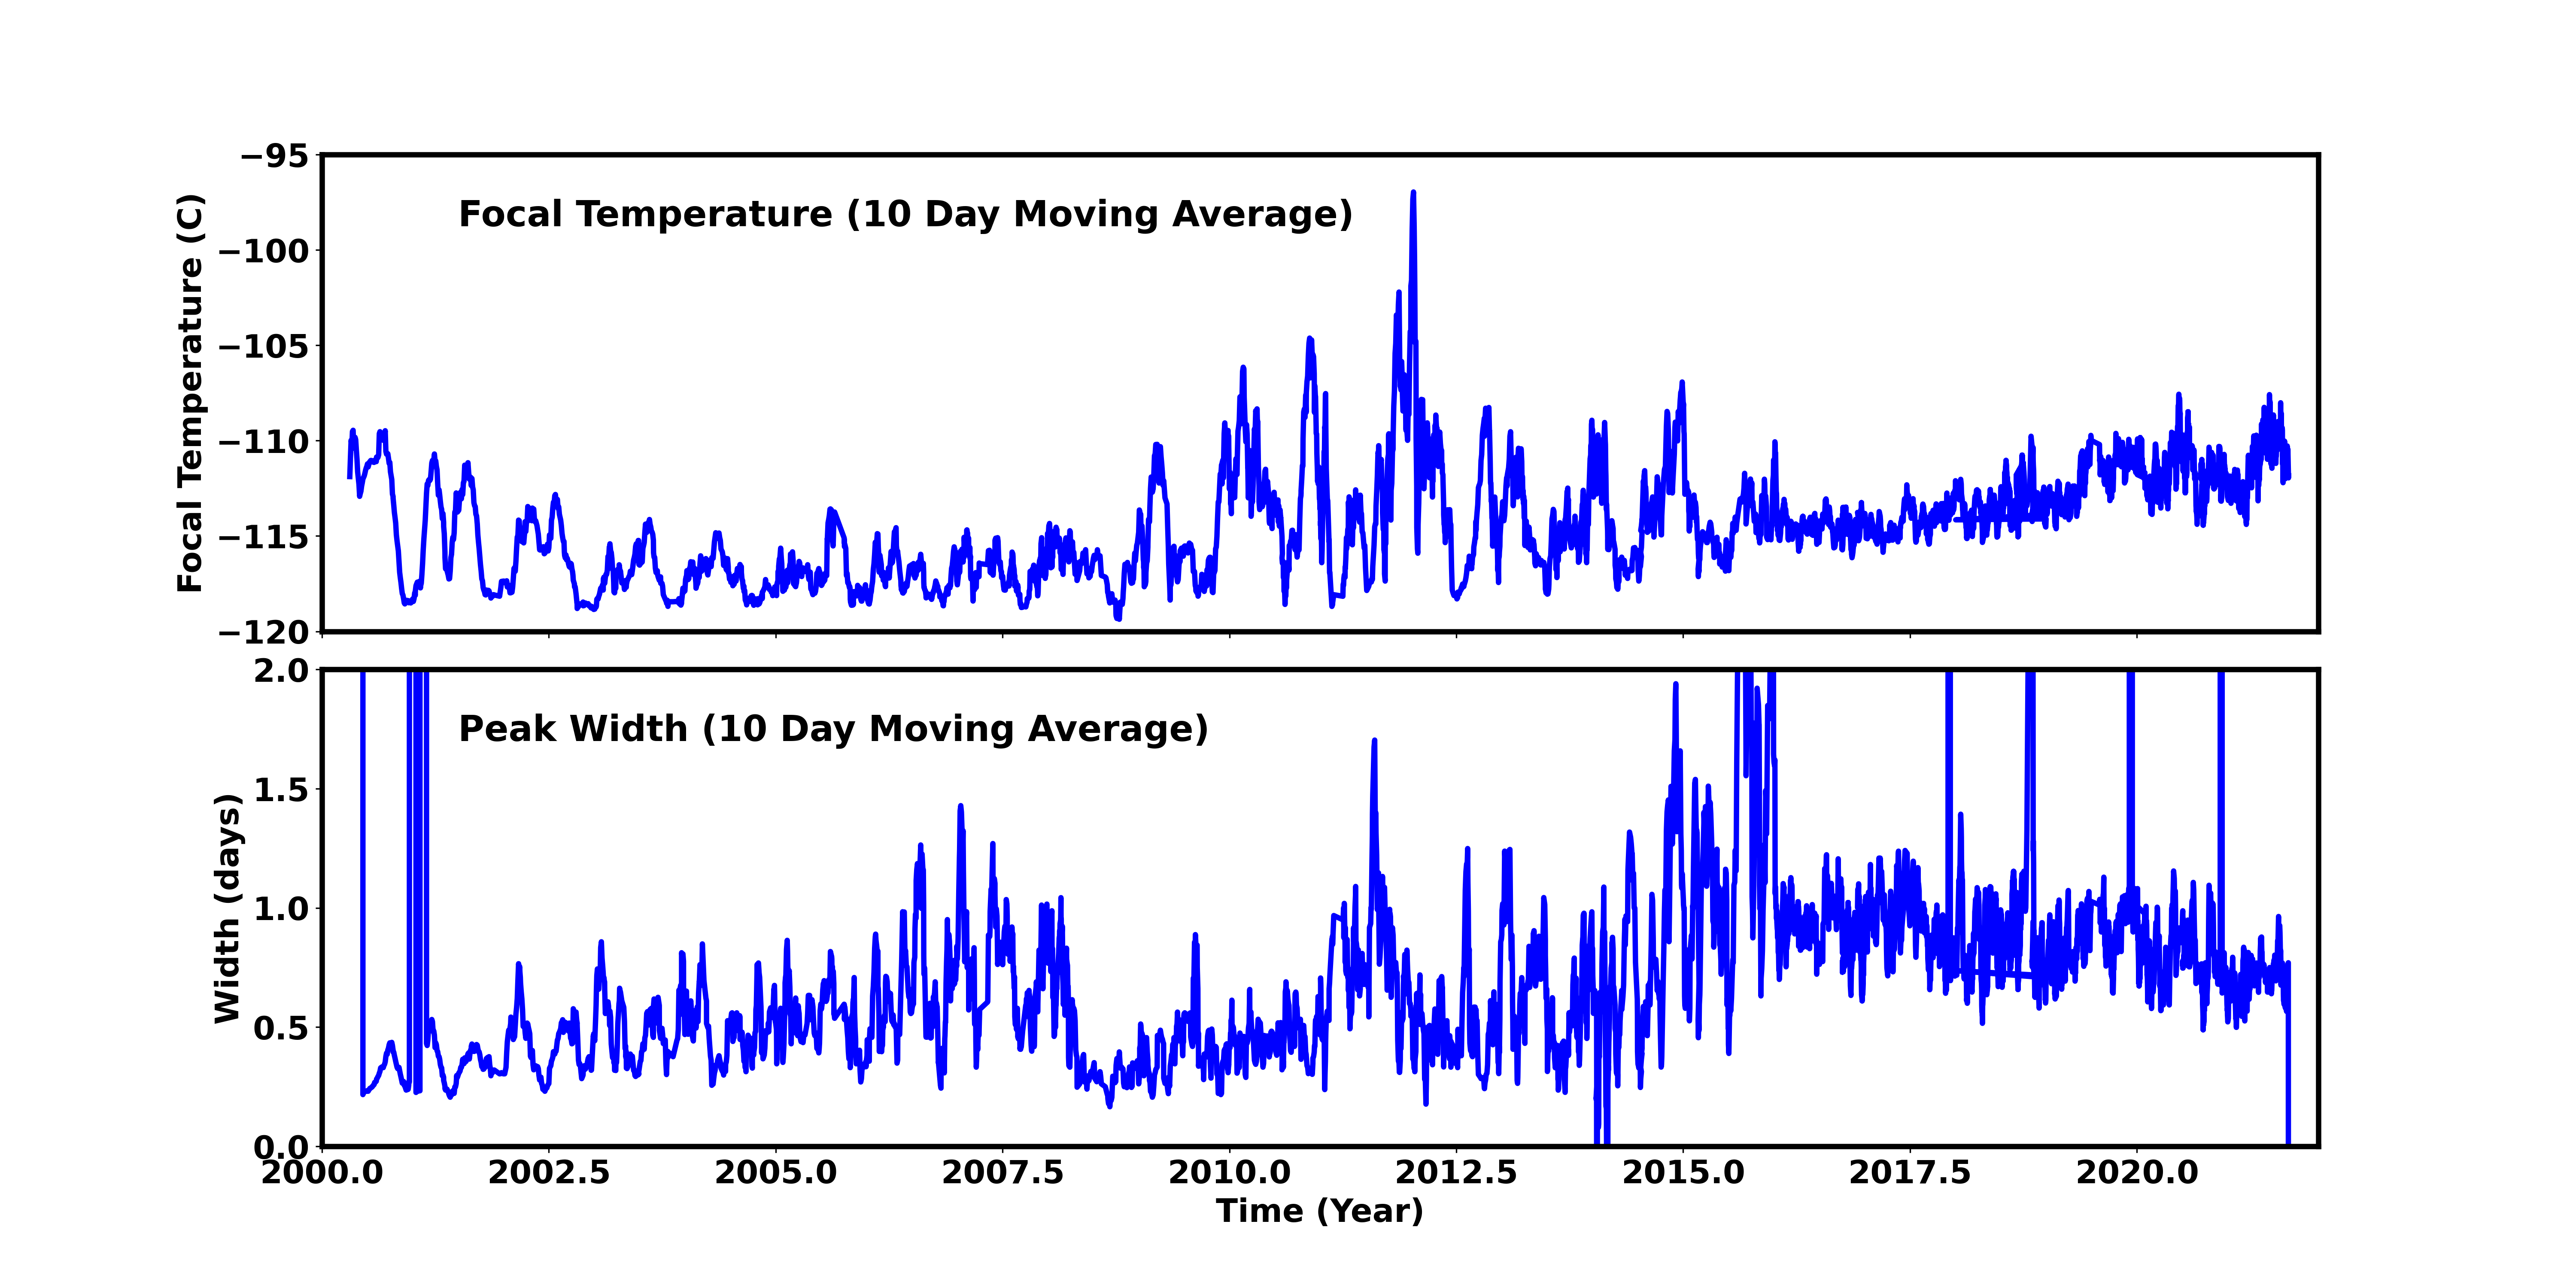
Focal Plane Temperature
Aug 2021 Focal Temperature
| The Mean (max) FPT: | |
|---|---|
| -111.3 | +/- 5.03 C |
| Mean Width: | |
| -0.08 | +/- 4.74 days |
Averaged Focal Plane Temperature
We are using 10 period moving averages to show trends of peak temperatures and peak widths. Note, the gaps in the width plot are due to missing/corrupted data.
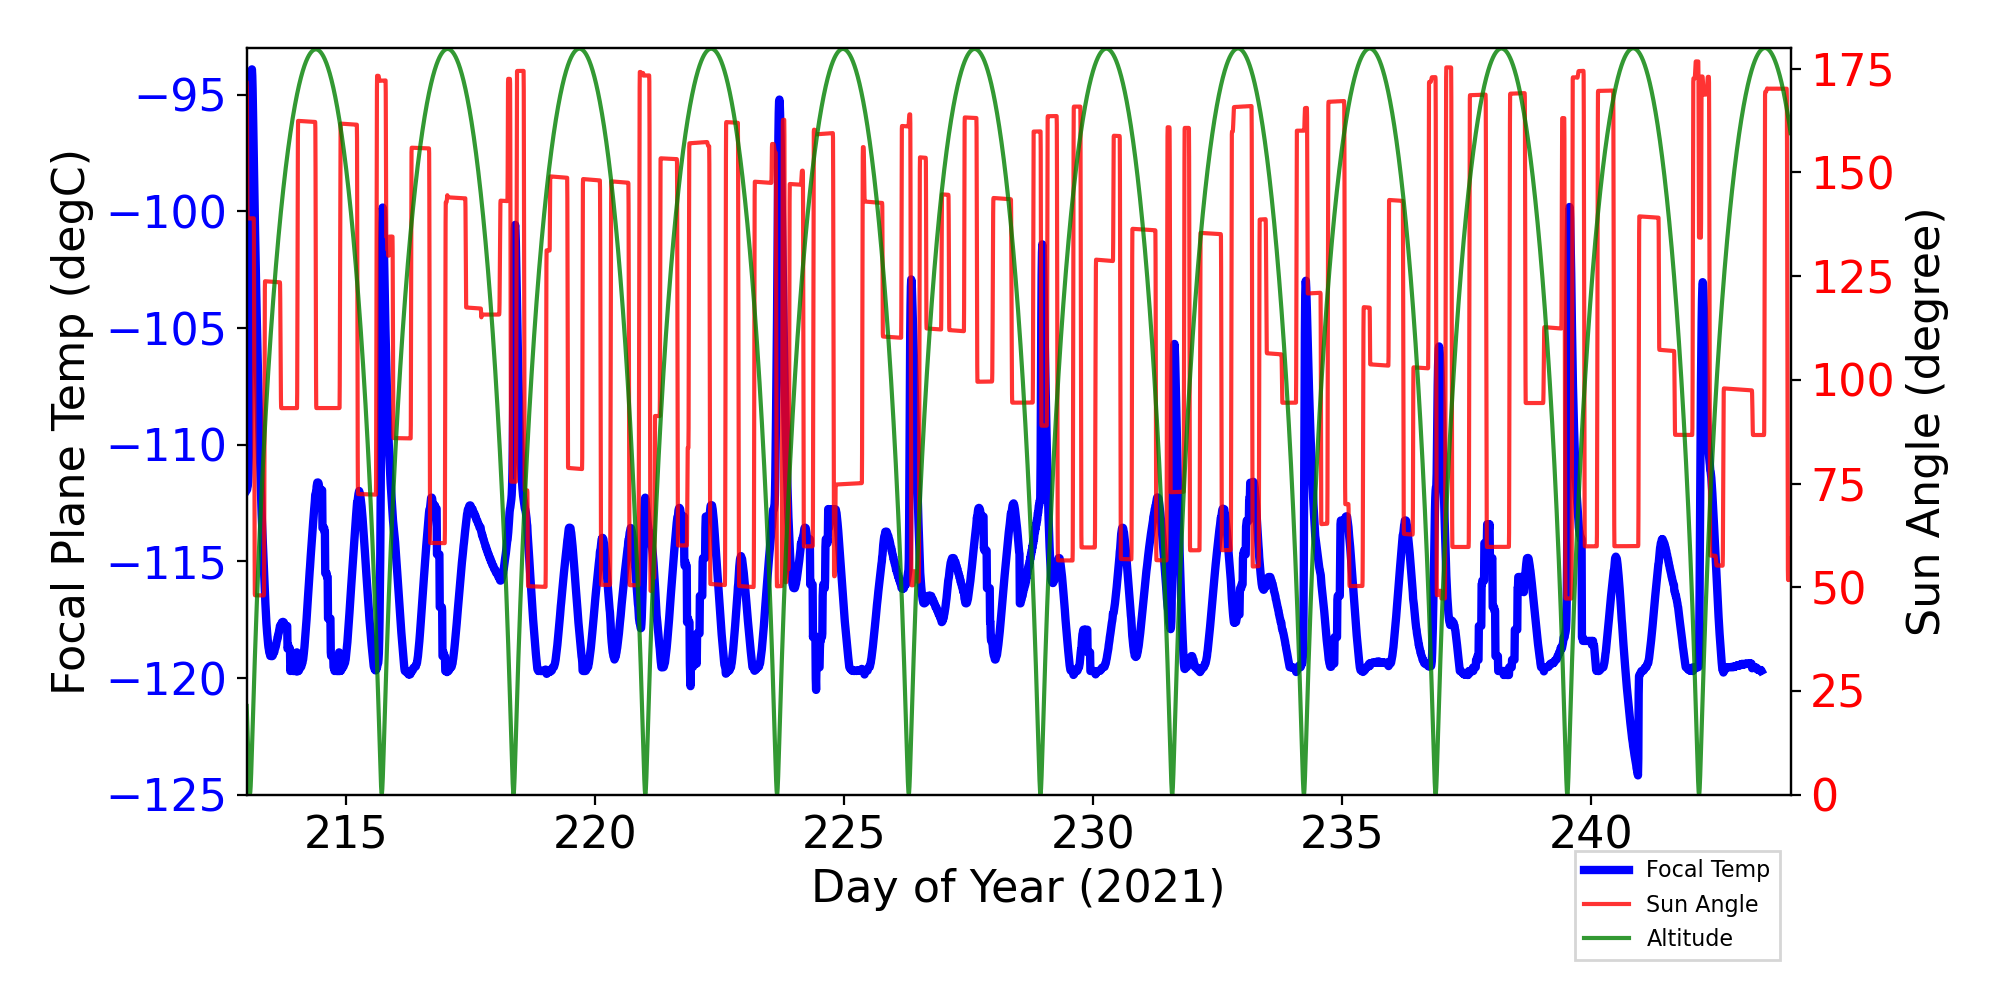
Focal Plane Temperature, Sun Angle and Altitude
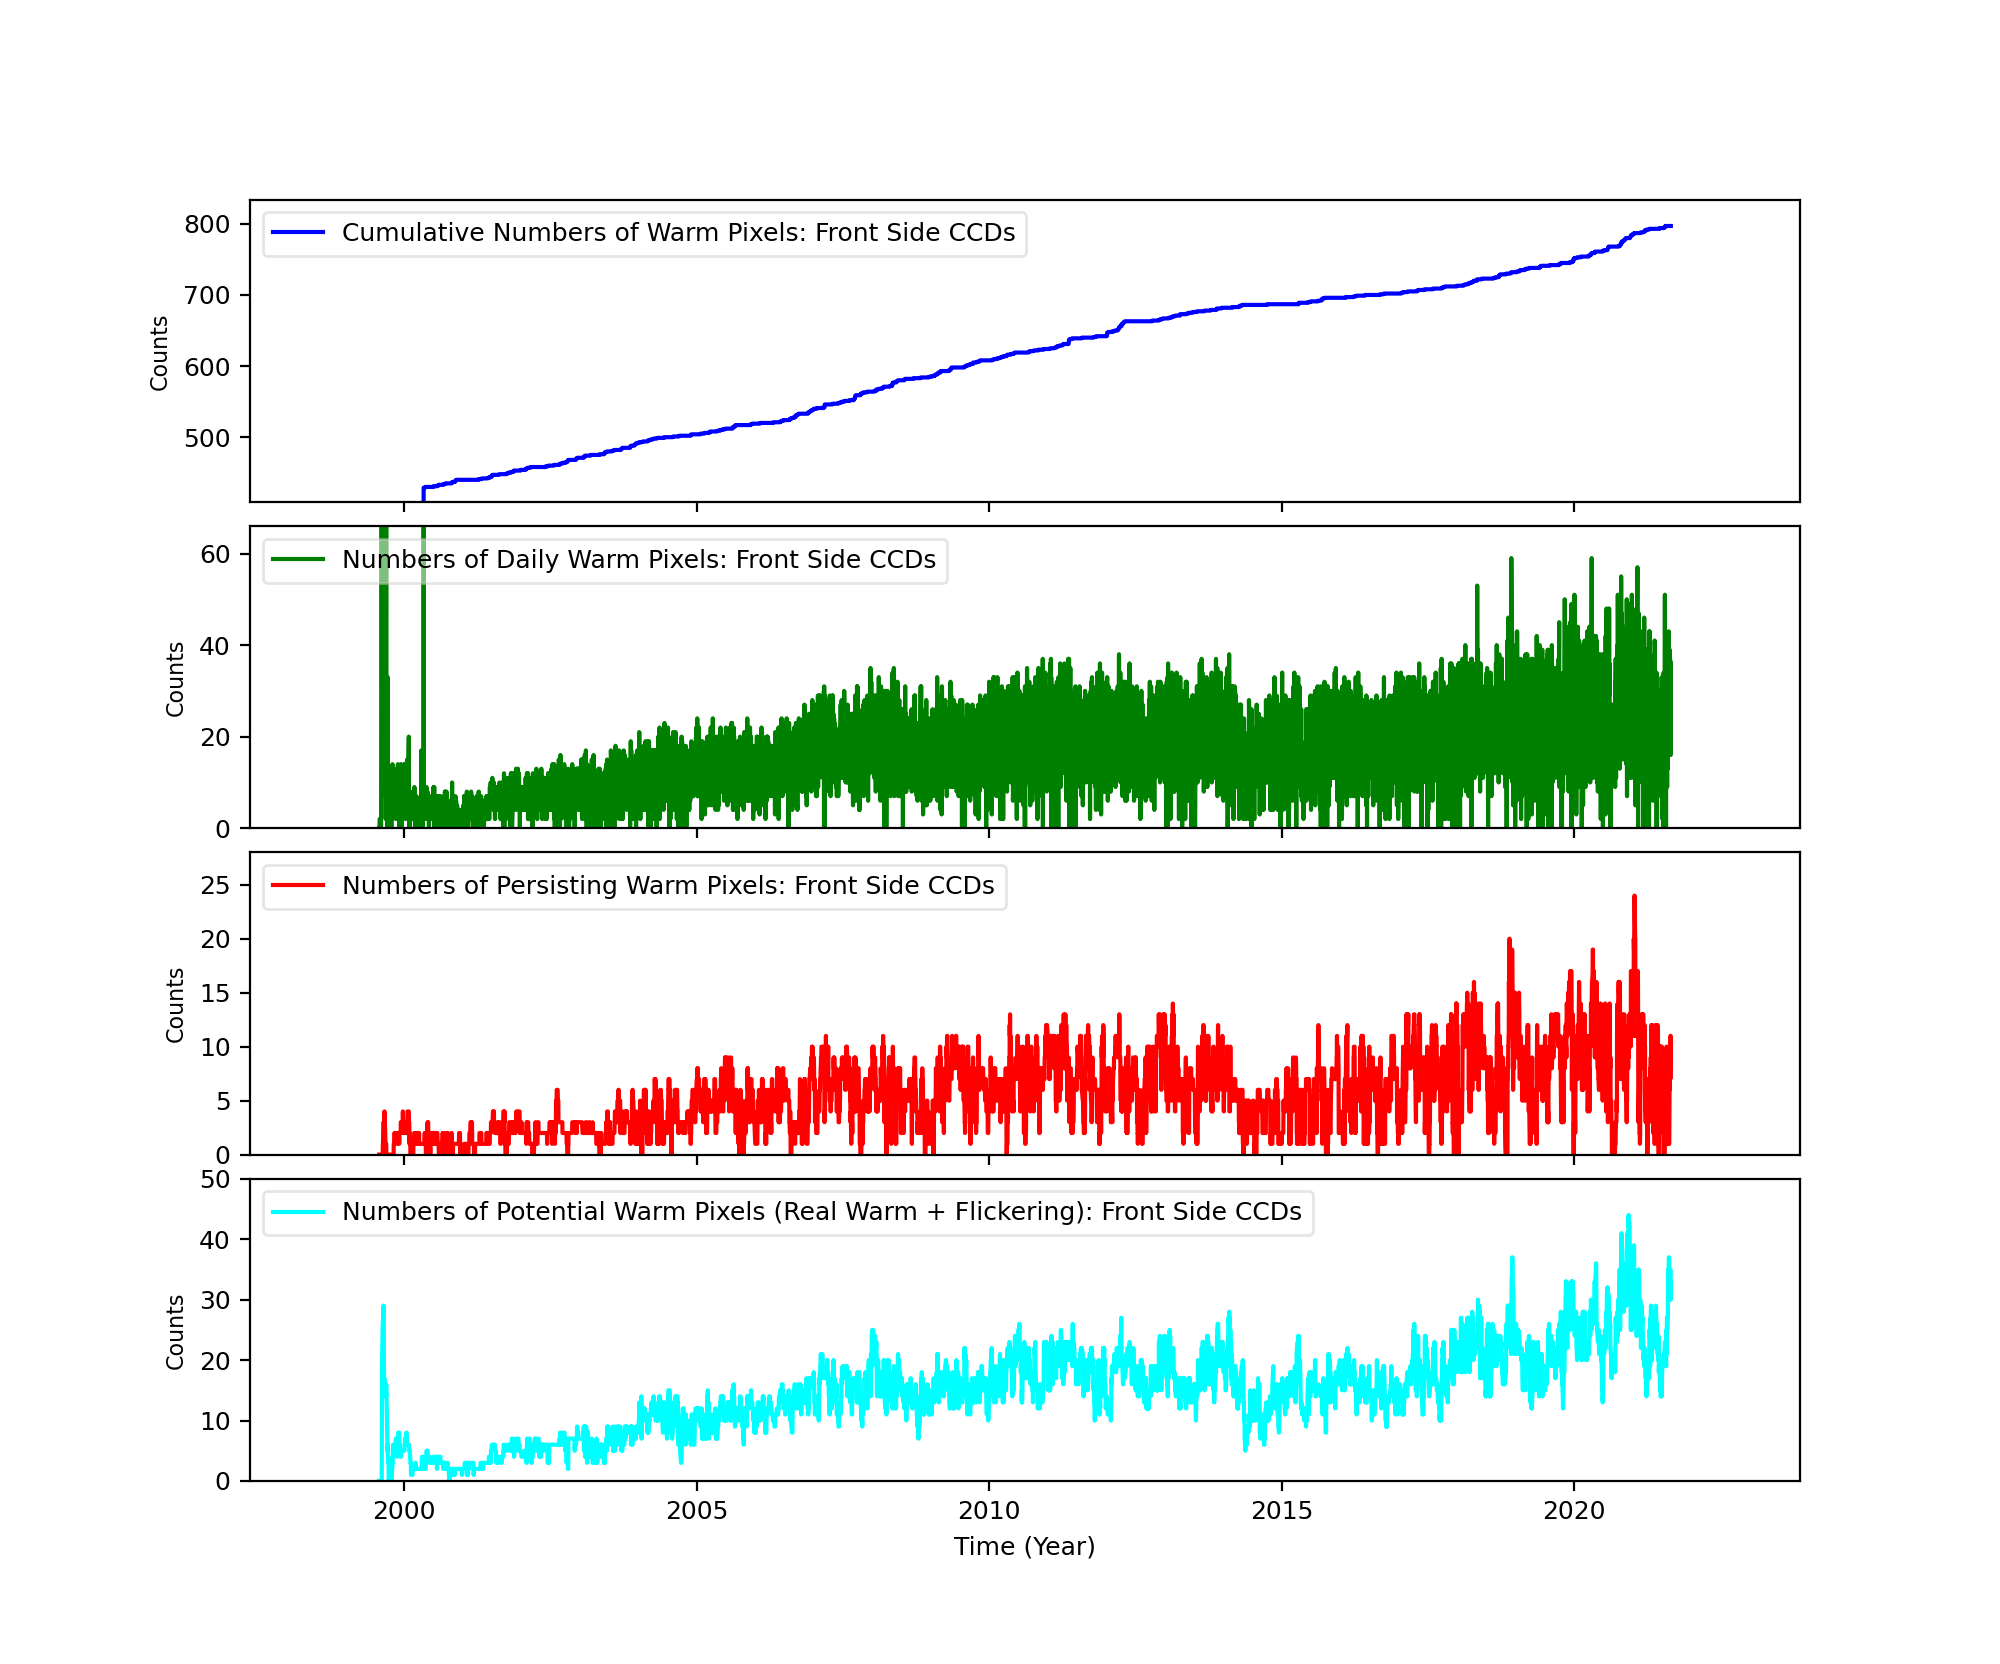
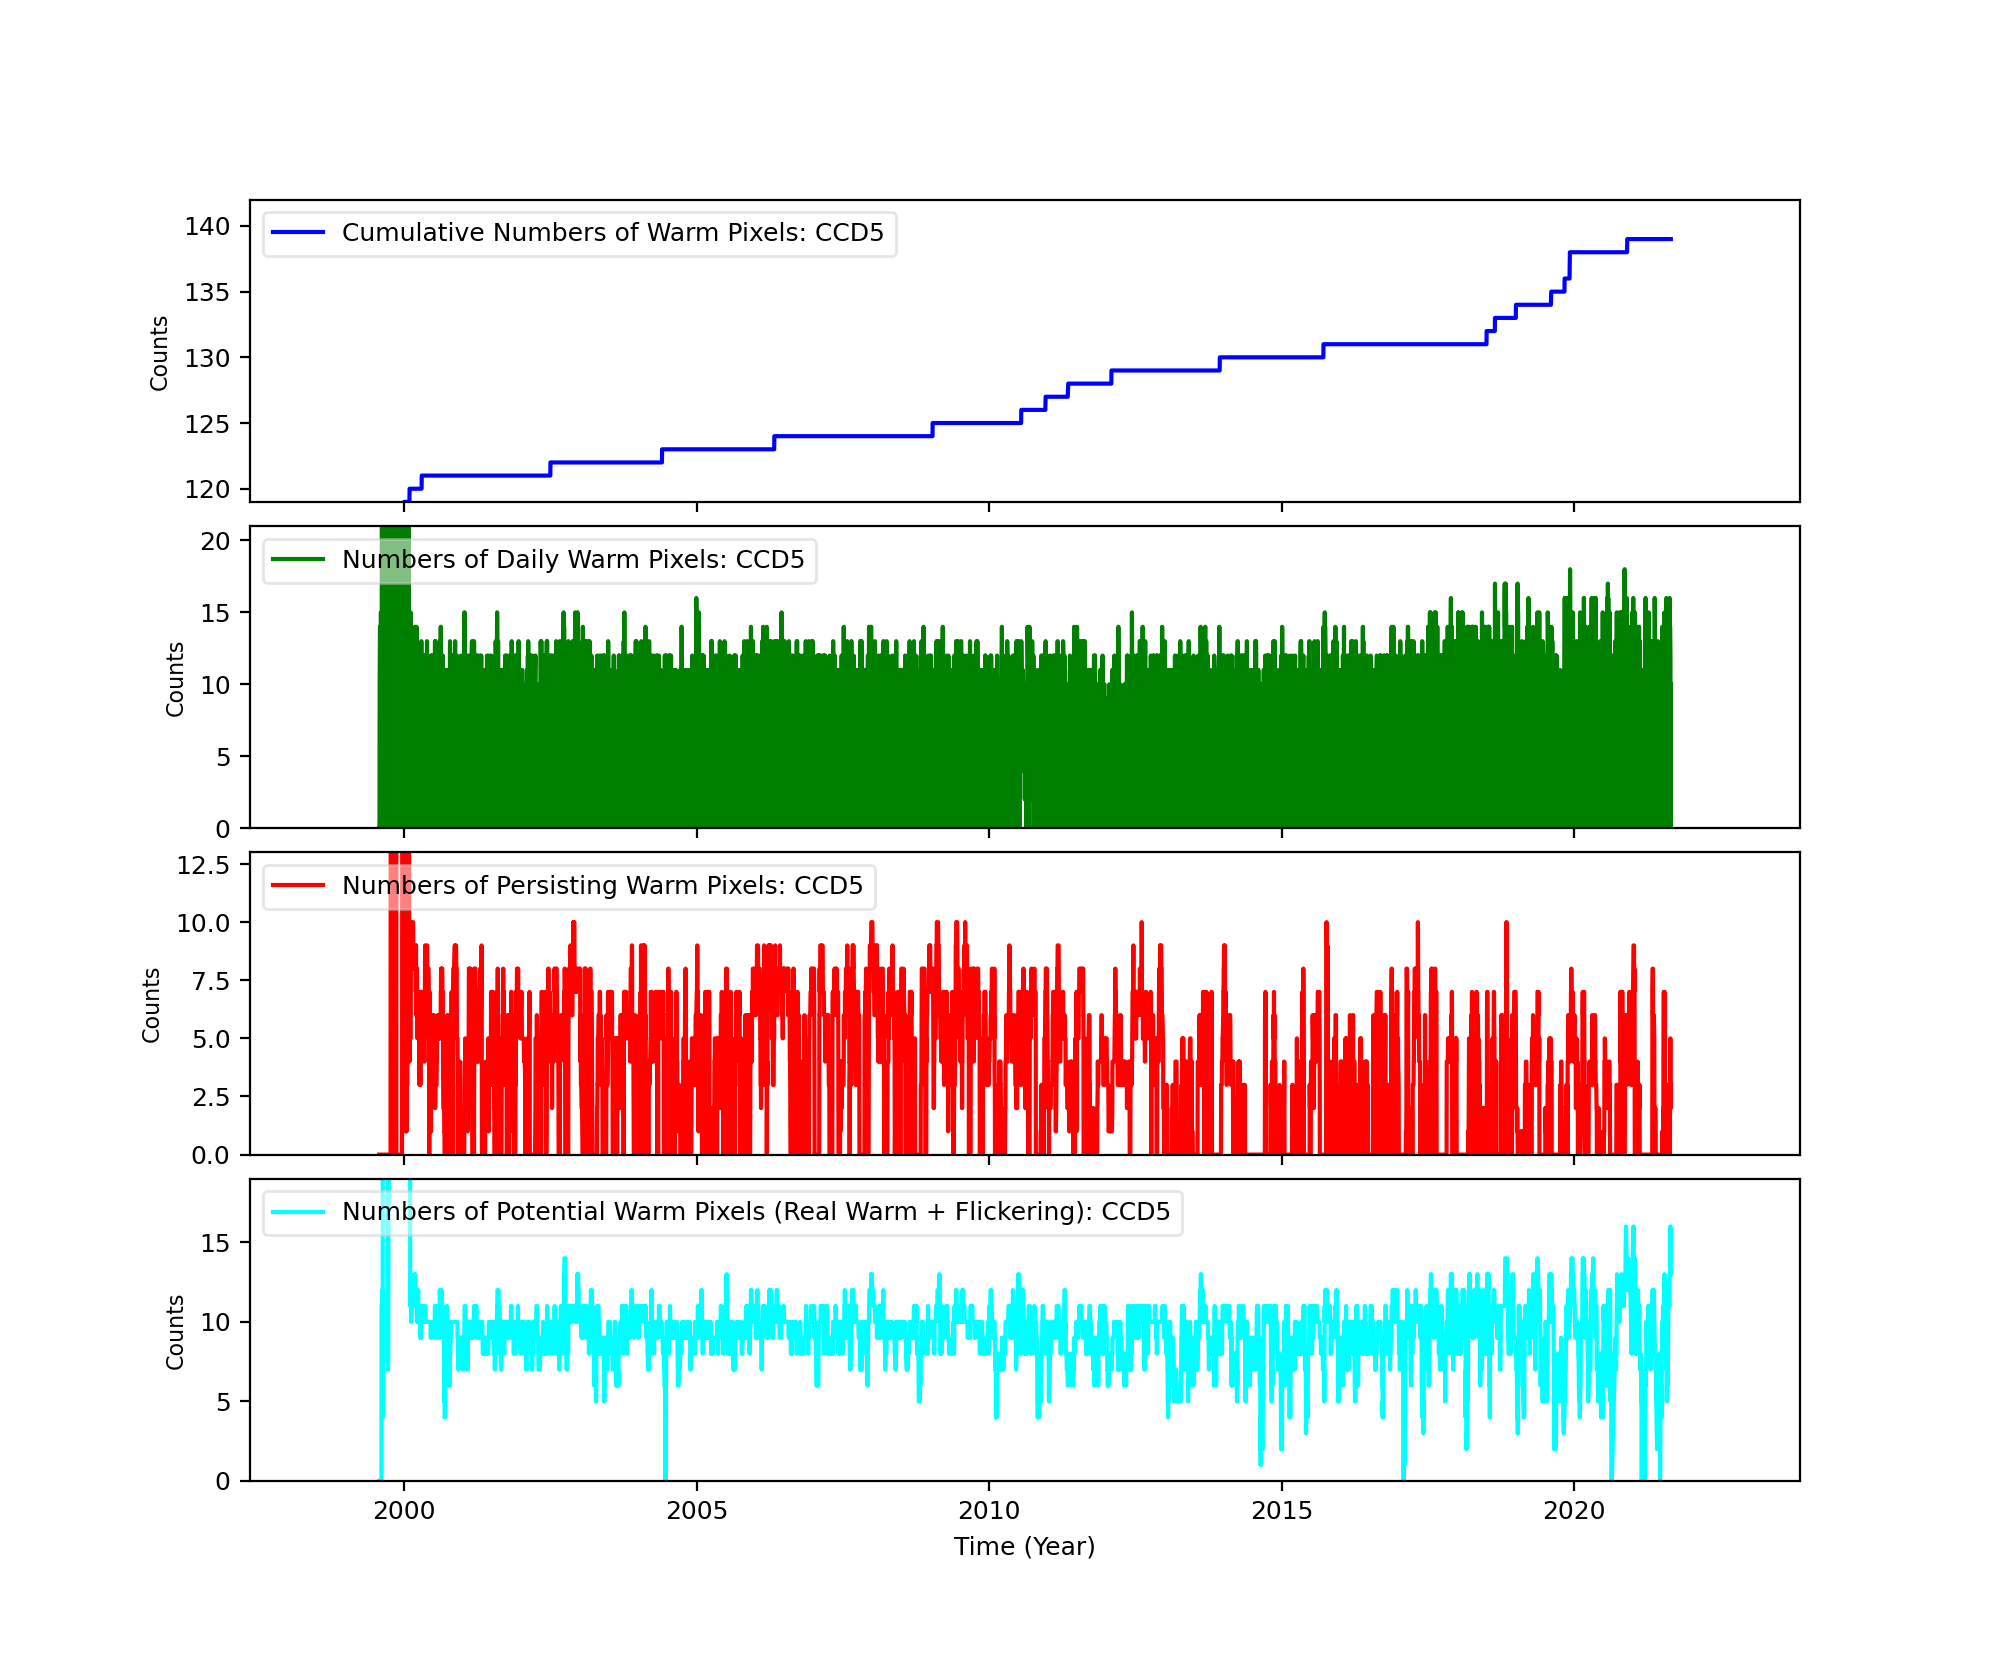
Bad Pixels
The plots below were generated with a new warm pixel finding script. Please see Acis Bad Pixel Page for details.
Front Side CCDs
Back Side CCD (CCD5)
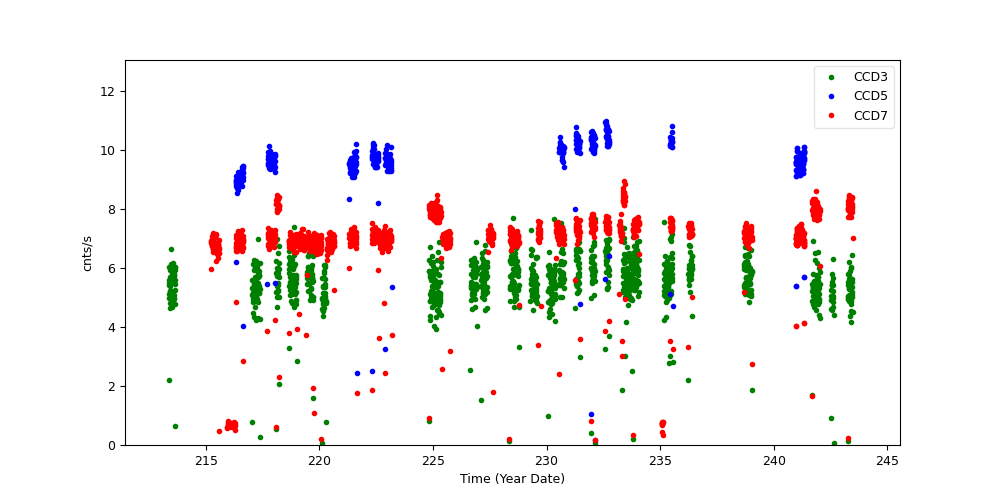
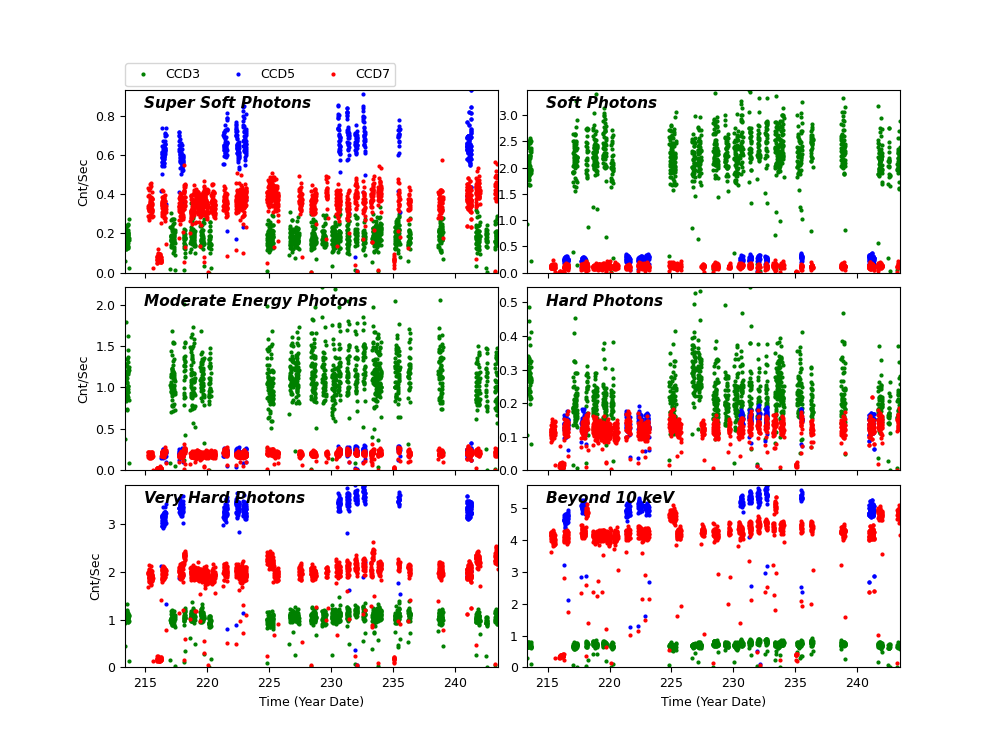
Science Instrument Background Rates
| Name | Low (keV) | High(KeV) | Description |
|---|---|---|---|
| SSoft | 0.00 | 0.50 | Super soft photons |
| Soft | 0.50 | 1.00 | Soft photons |
| Med | 1.00 | 3.00 | Moderate energy photons |
| Hard | 3.00 | 5.00 | Hard Photons |
| Harder | 5.00 | 10.00 | Very Hard photons |
| Hardest | 10.00 | Beyond 10 keV |
HRC
DOSE of Central 4K Pore-Pairs
Please refer to Maximum Dose Trends for more details.
)
|
|---|
IMAGE                NPIX      MEAN    STDDEV      MIN       MAX
HRCI_08_2021.fits  16777216	0.024 	0.155 	0.000 	4.000
)
IMAGE                       NPIX      MEAN    STDDEV      MIN       MAX
HRCI_08_1999_08_2021.fits  16777216	7.255 	6.458 	0.000 	314.000
)
|
|---|
IMAGE                NPIX      MEAN    STDDEV      MIN       MAX
HRCS_08_2021.fits  16777216	0.257 	0.629 	0.000 	10.000
)
IMAGE                       NPIX      MEAN    STDDEV      MIN       MAX
HRCS_08_1999_08_2021.fits  16777216	20.575 	36.527 	0.000 	1766.000
|
|
Max dose trend plots corrected for events that "pile-up"
in the center of the taps due to bad position information.
|
)
|
)
|
)
|
)
|
| May 2021 | Feb 2021 | Nov 2020 | Aug 2020 |
|---|
)
|
)
|
)
|
)
|
| May 2021 | Feb 2021 | Nov 2020 | Aug 2020 |
|---|
HRMA Focus
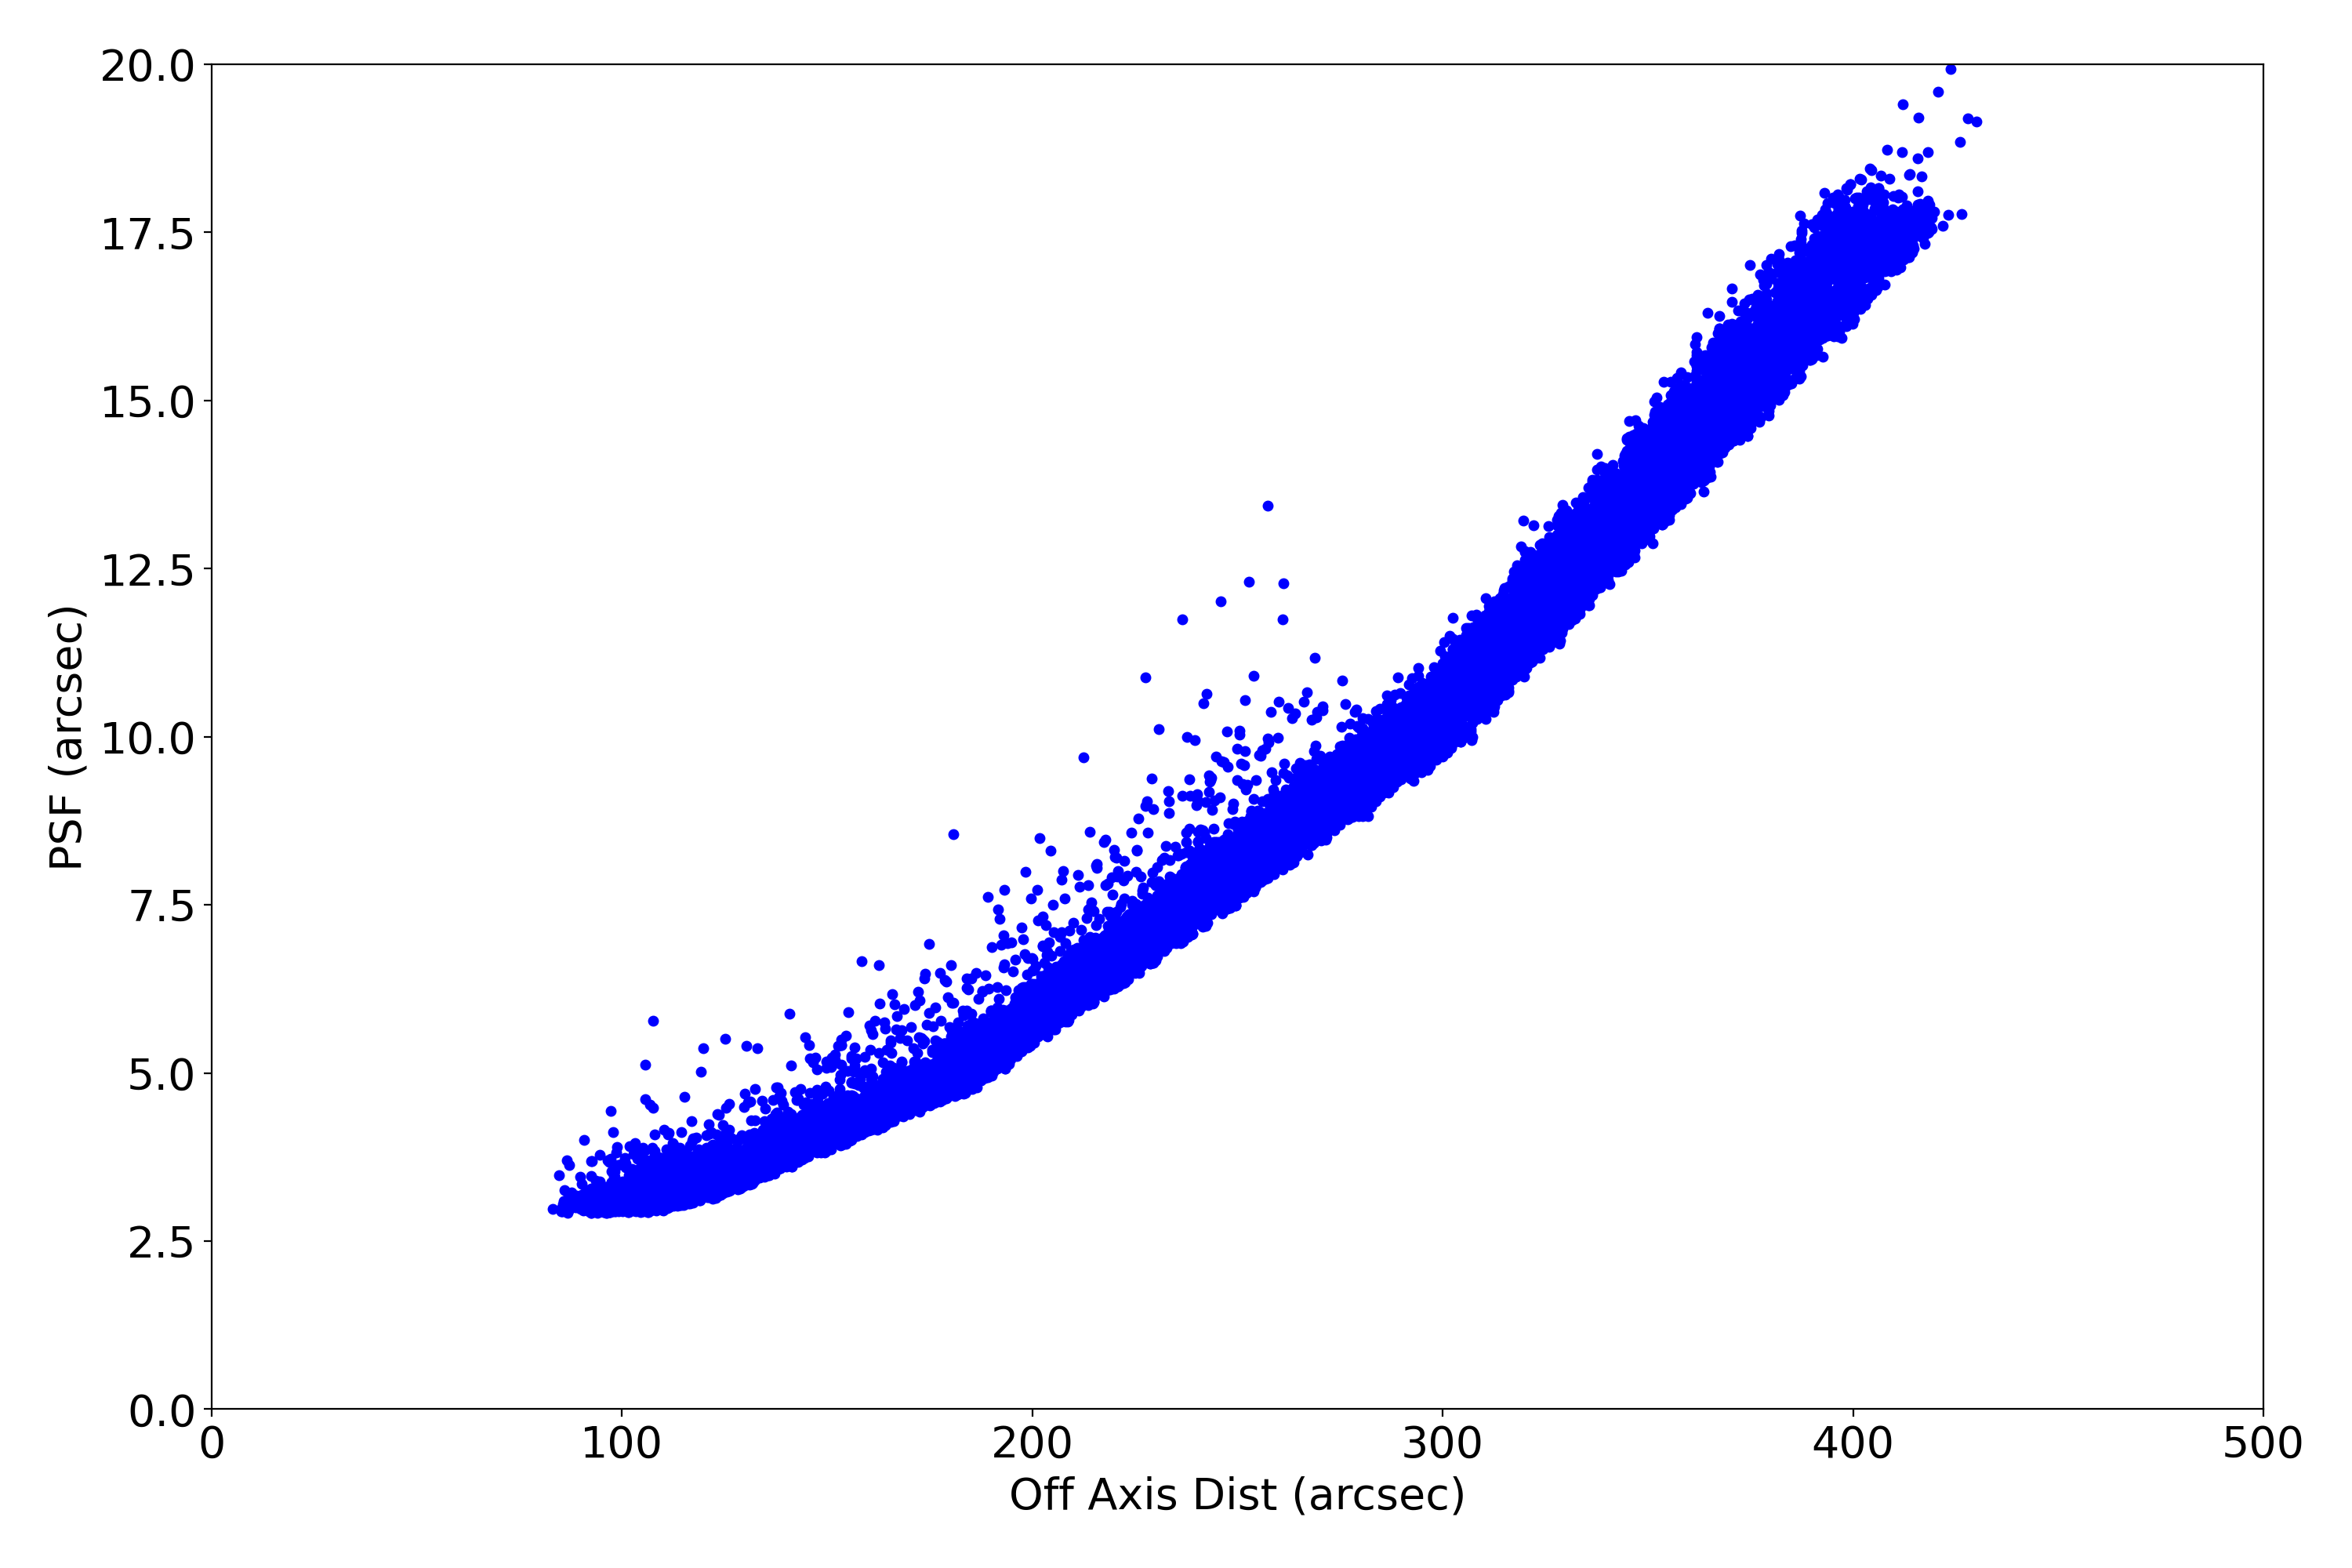
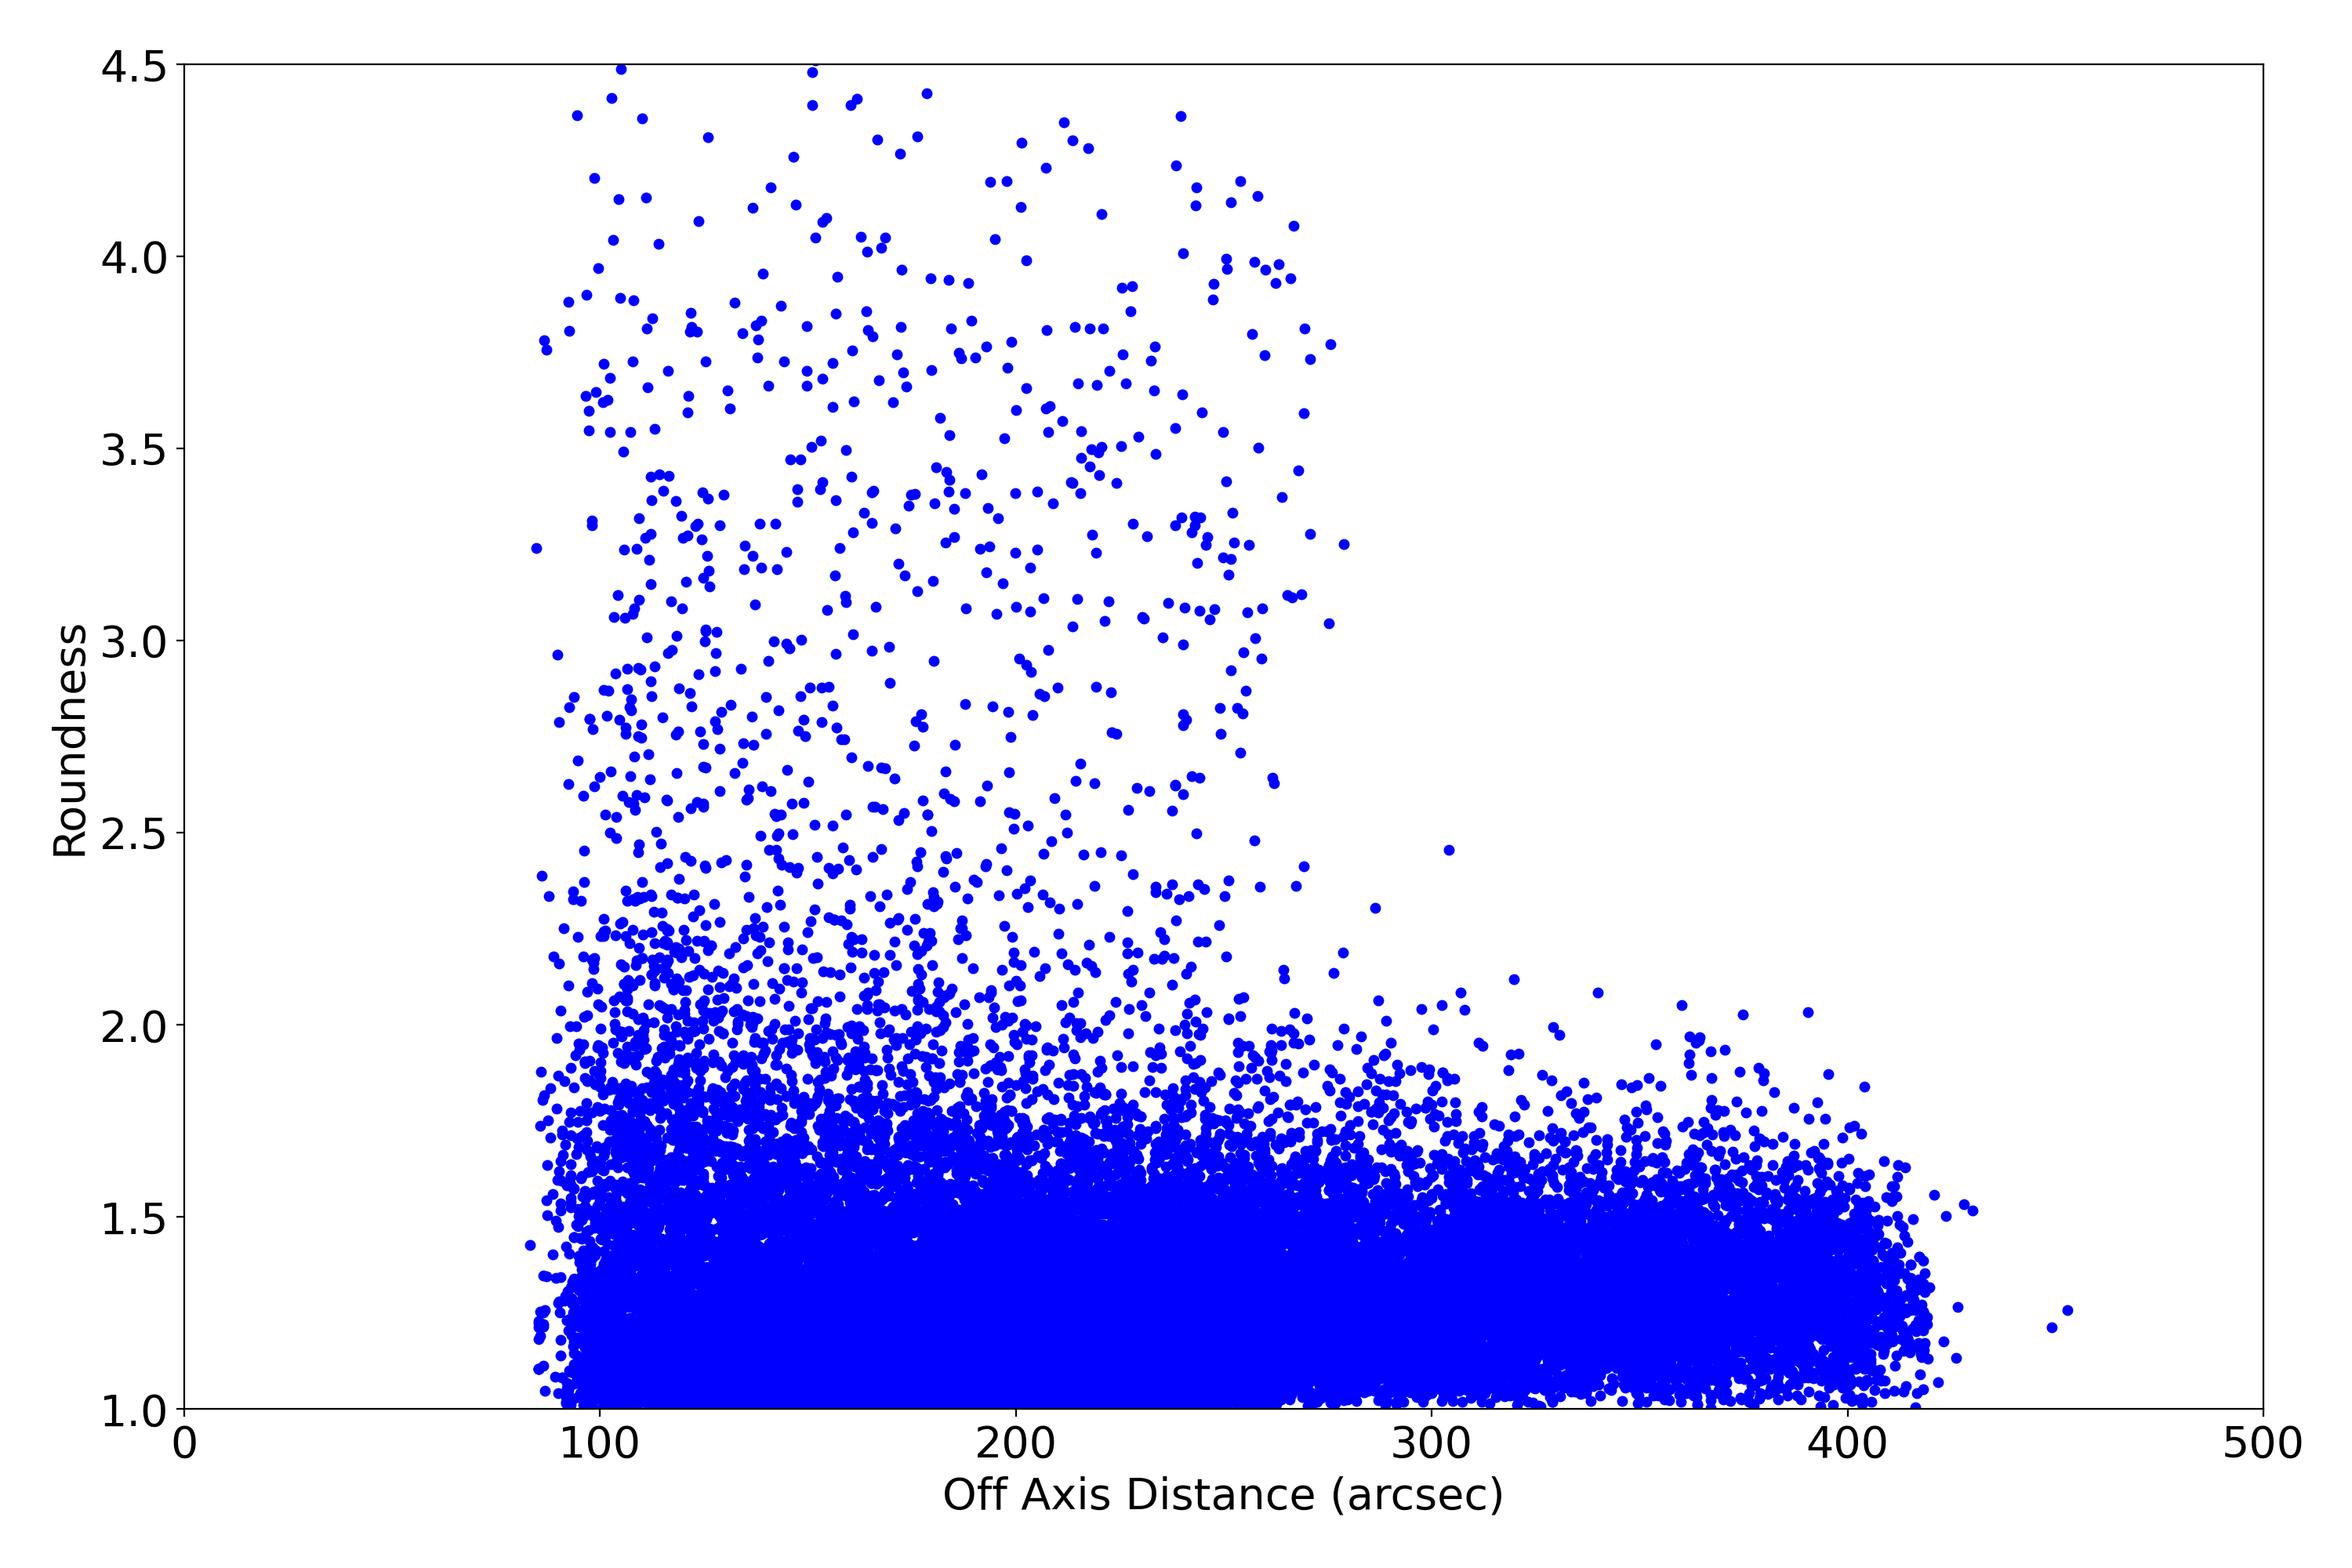
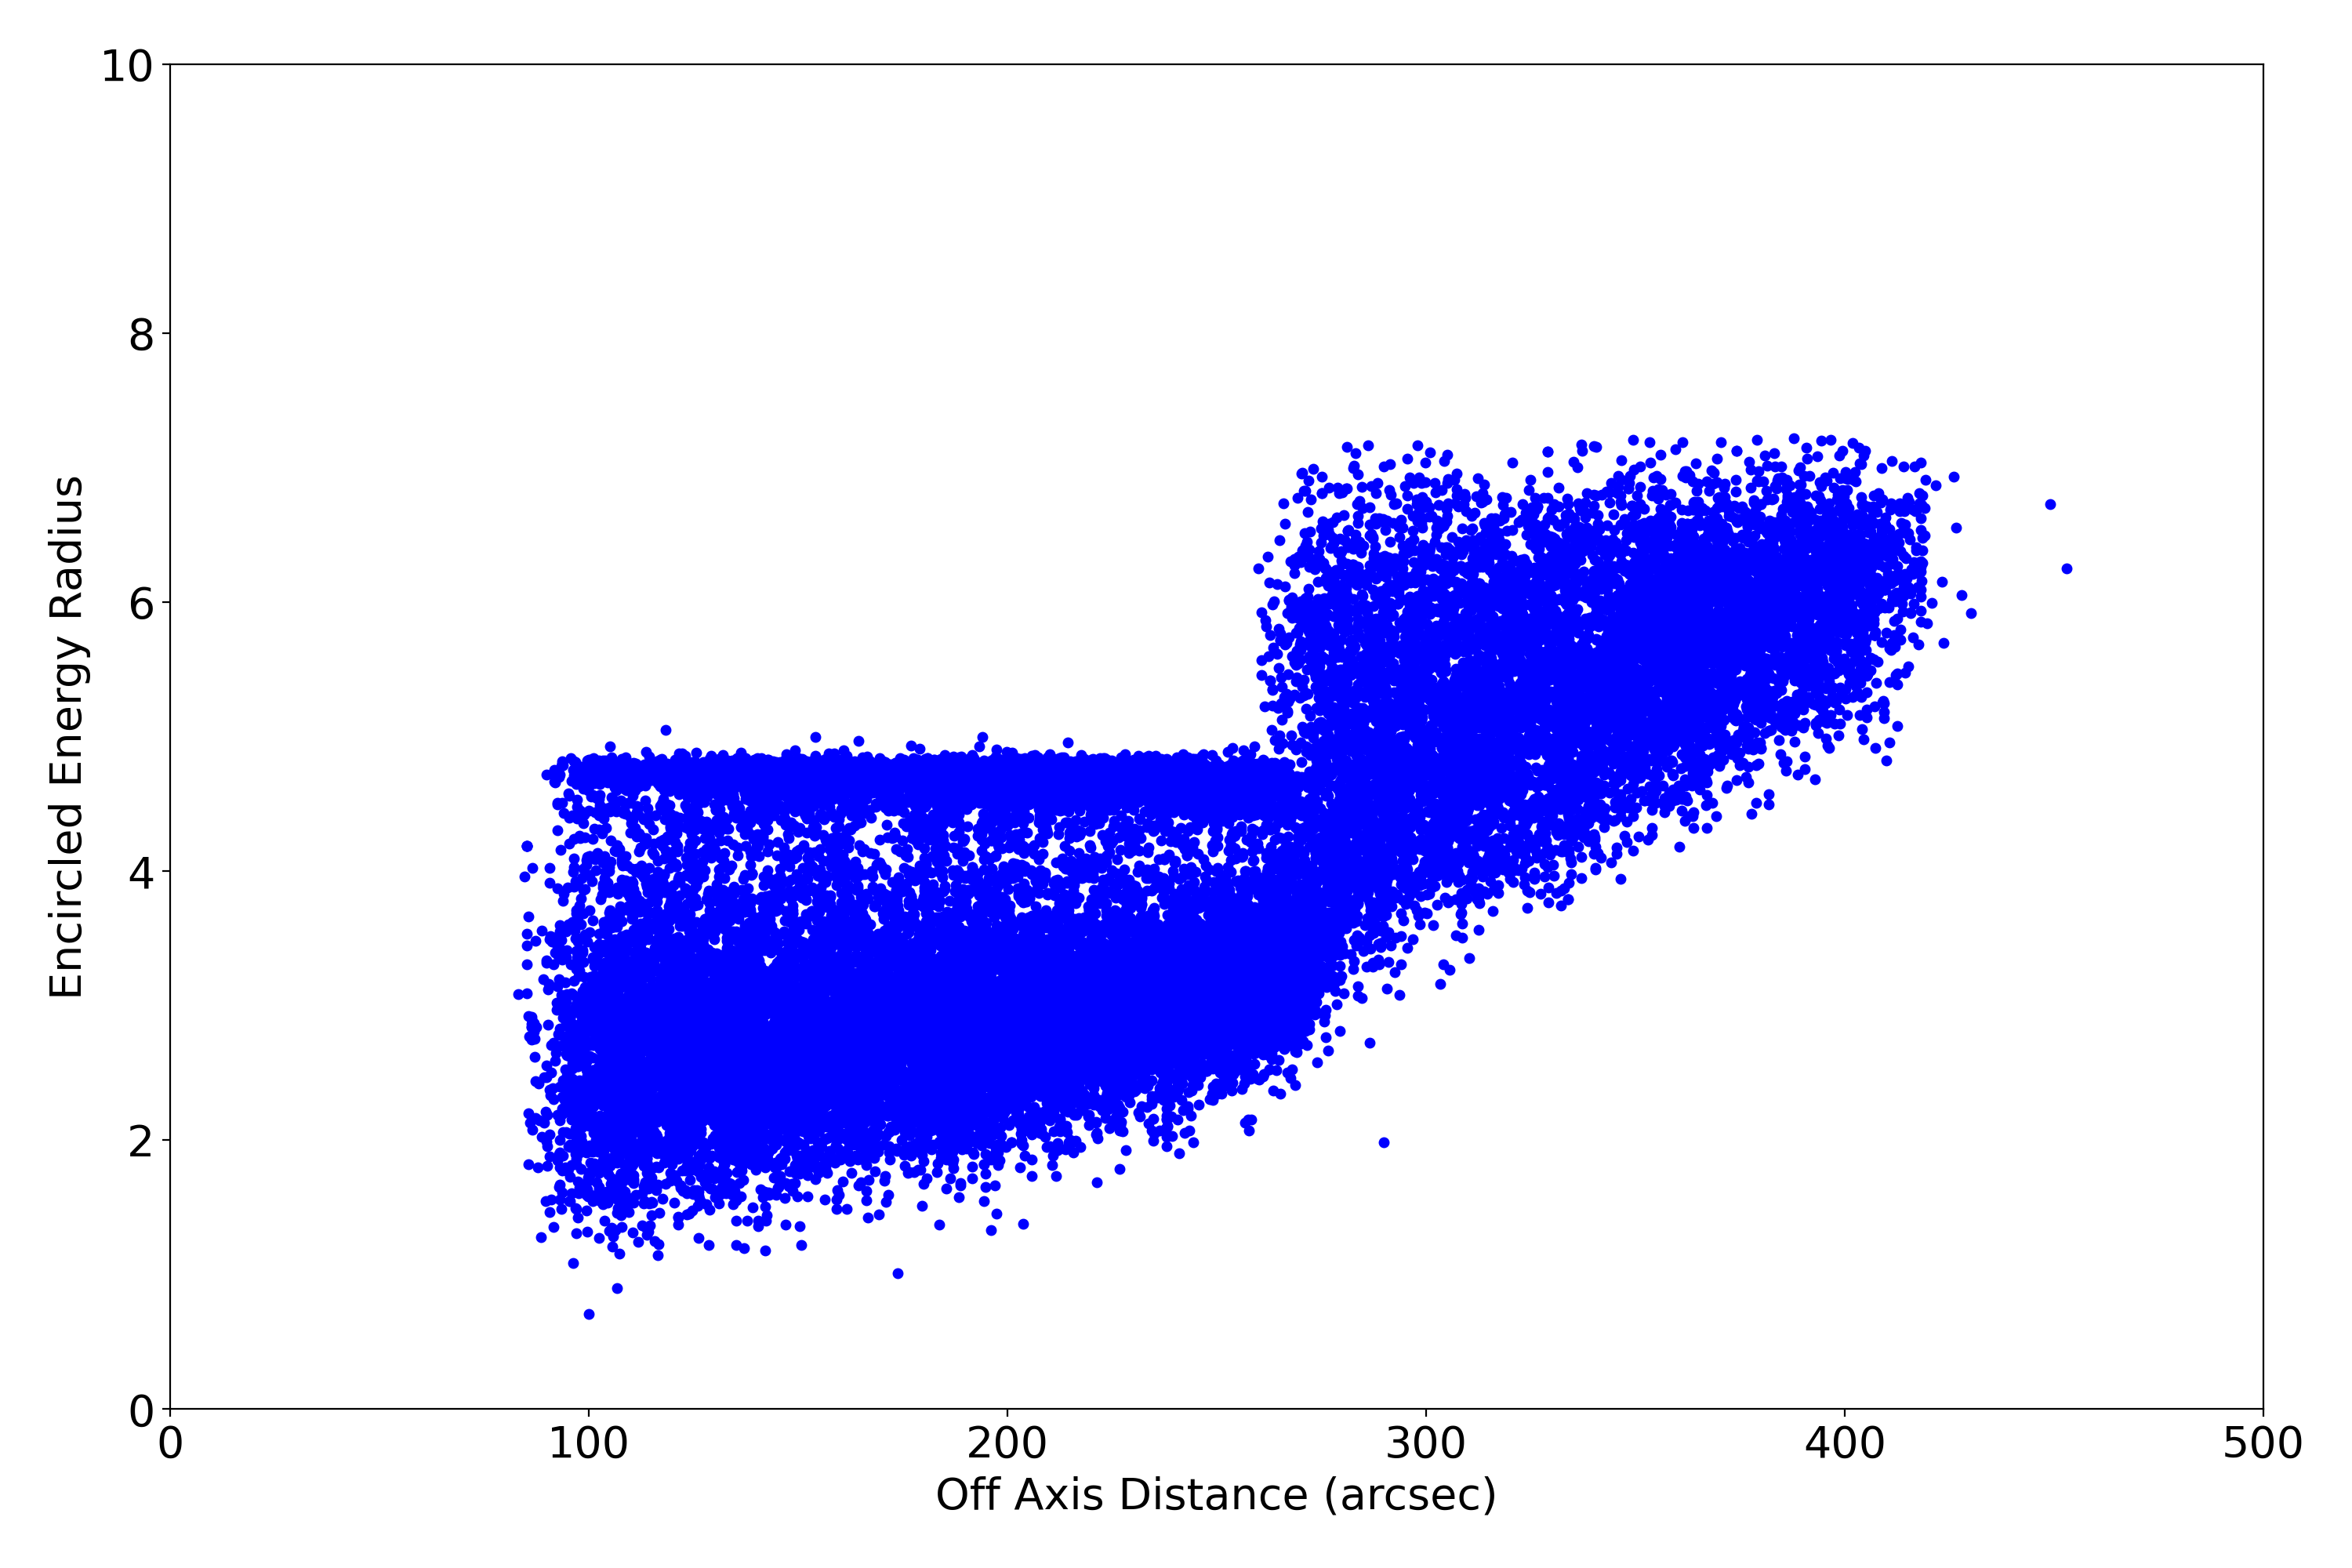
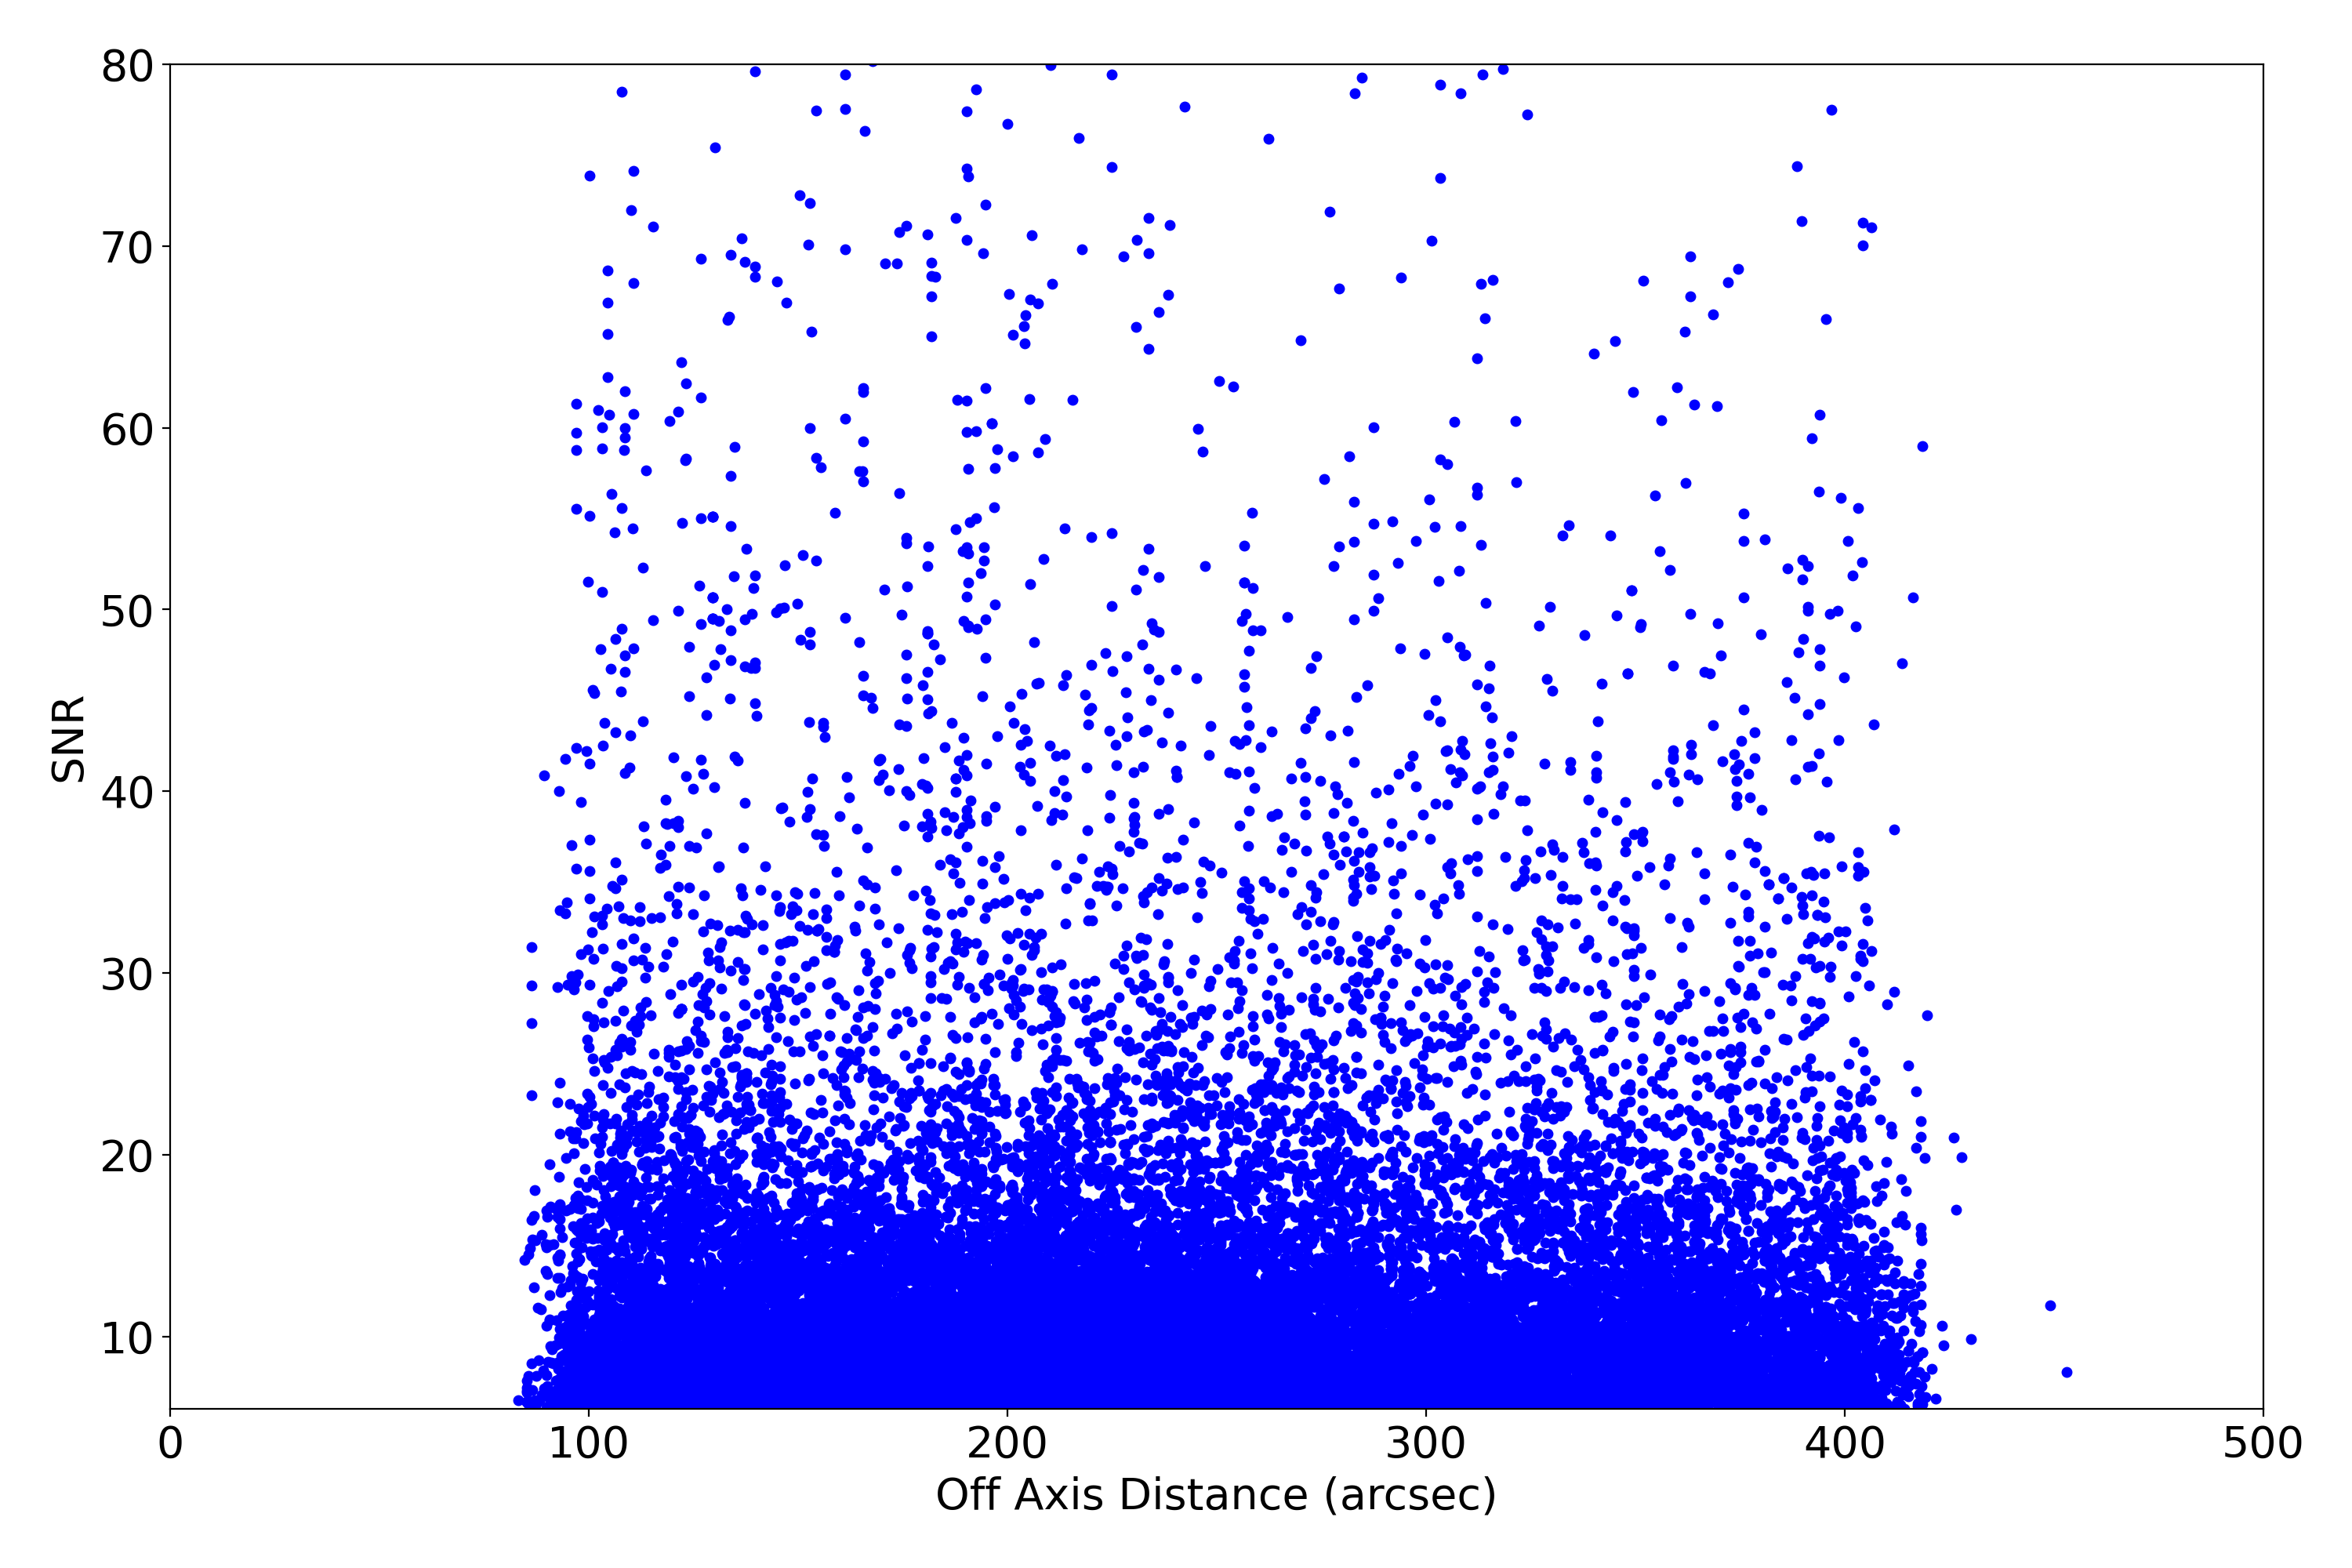
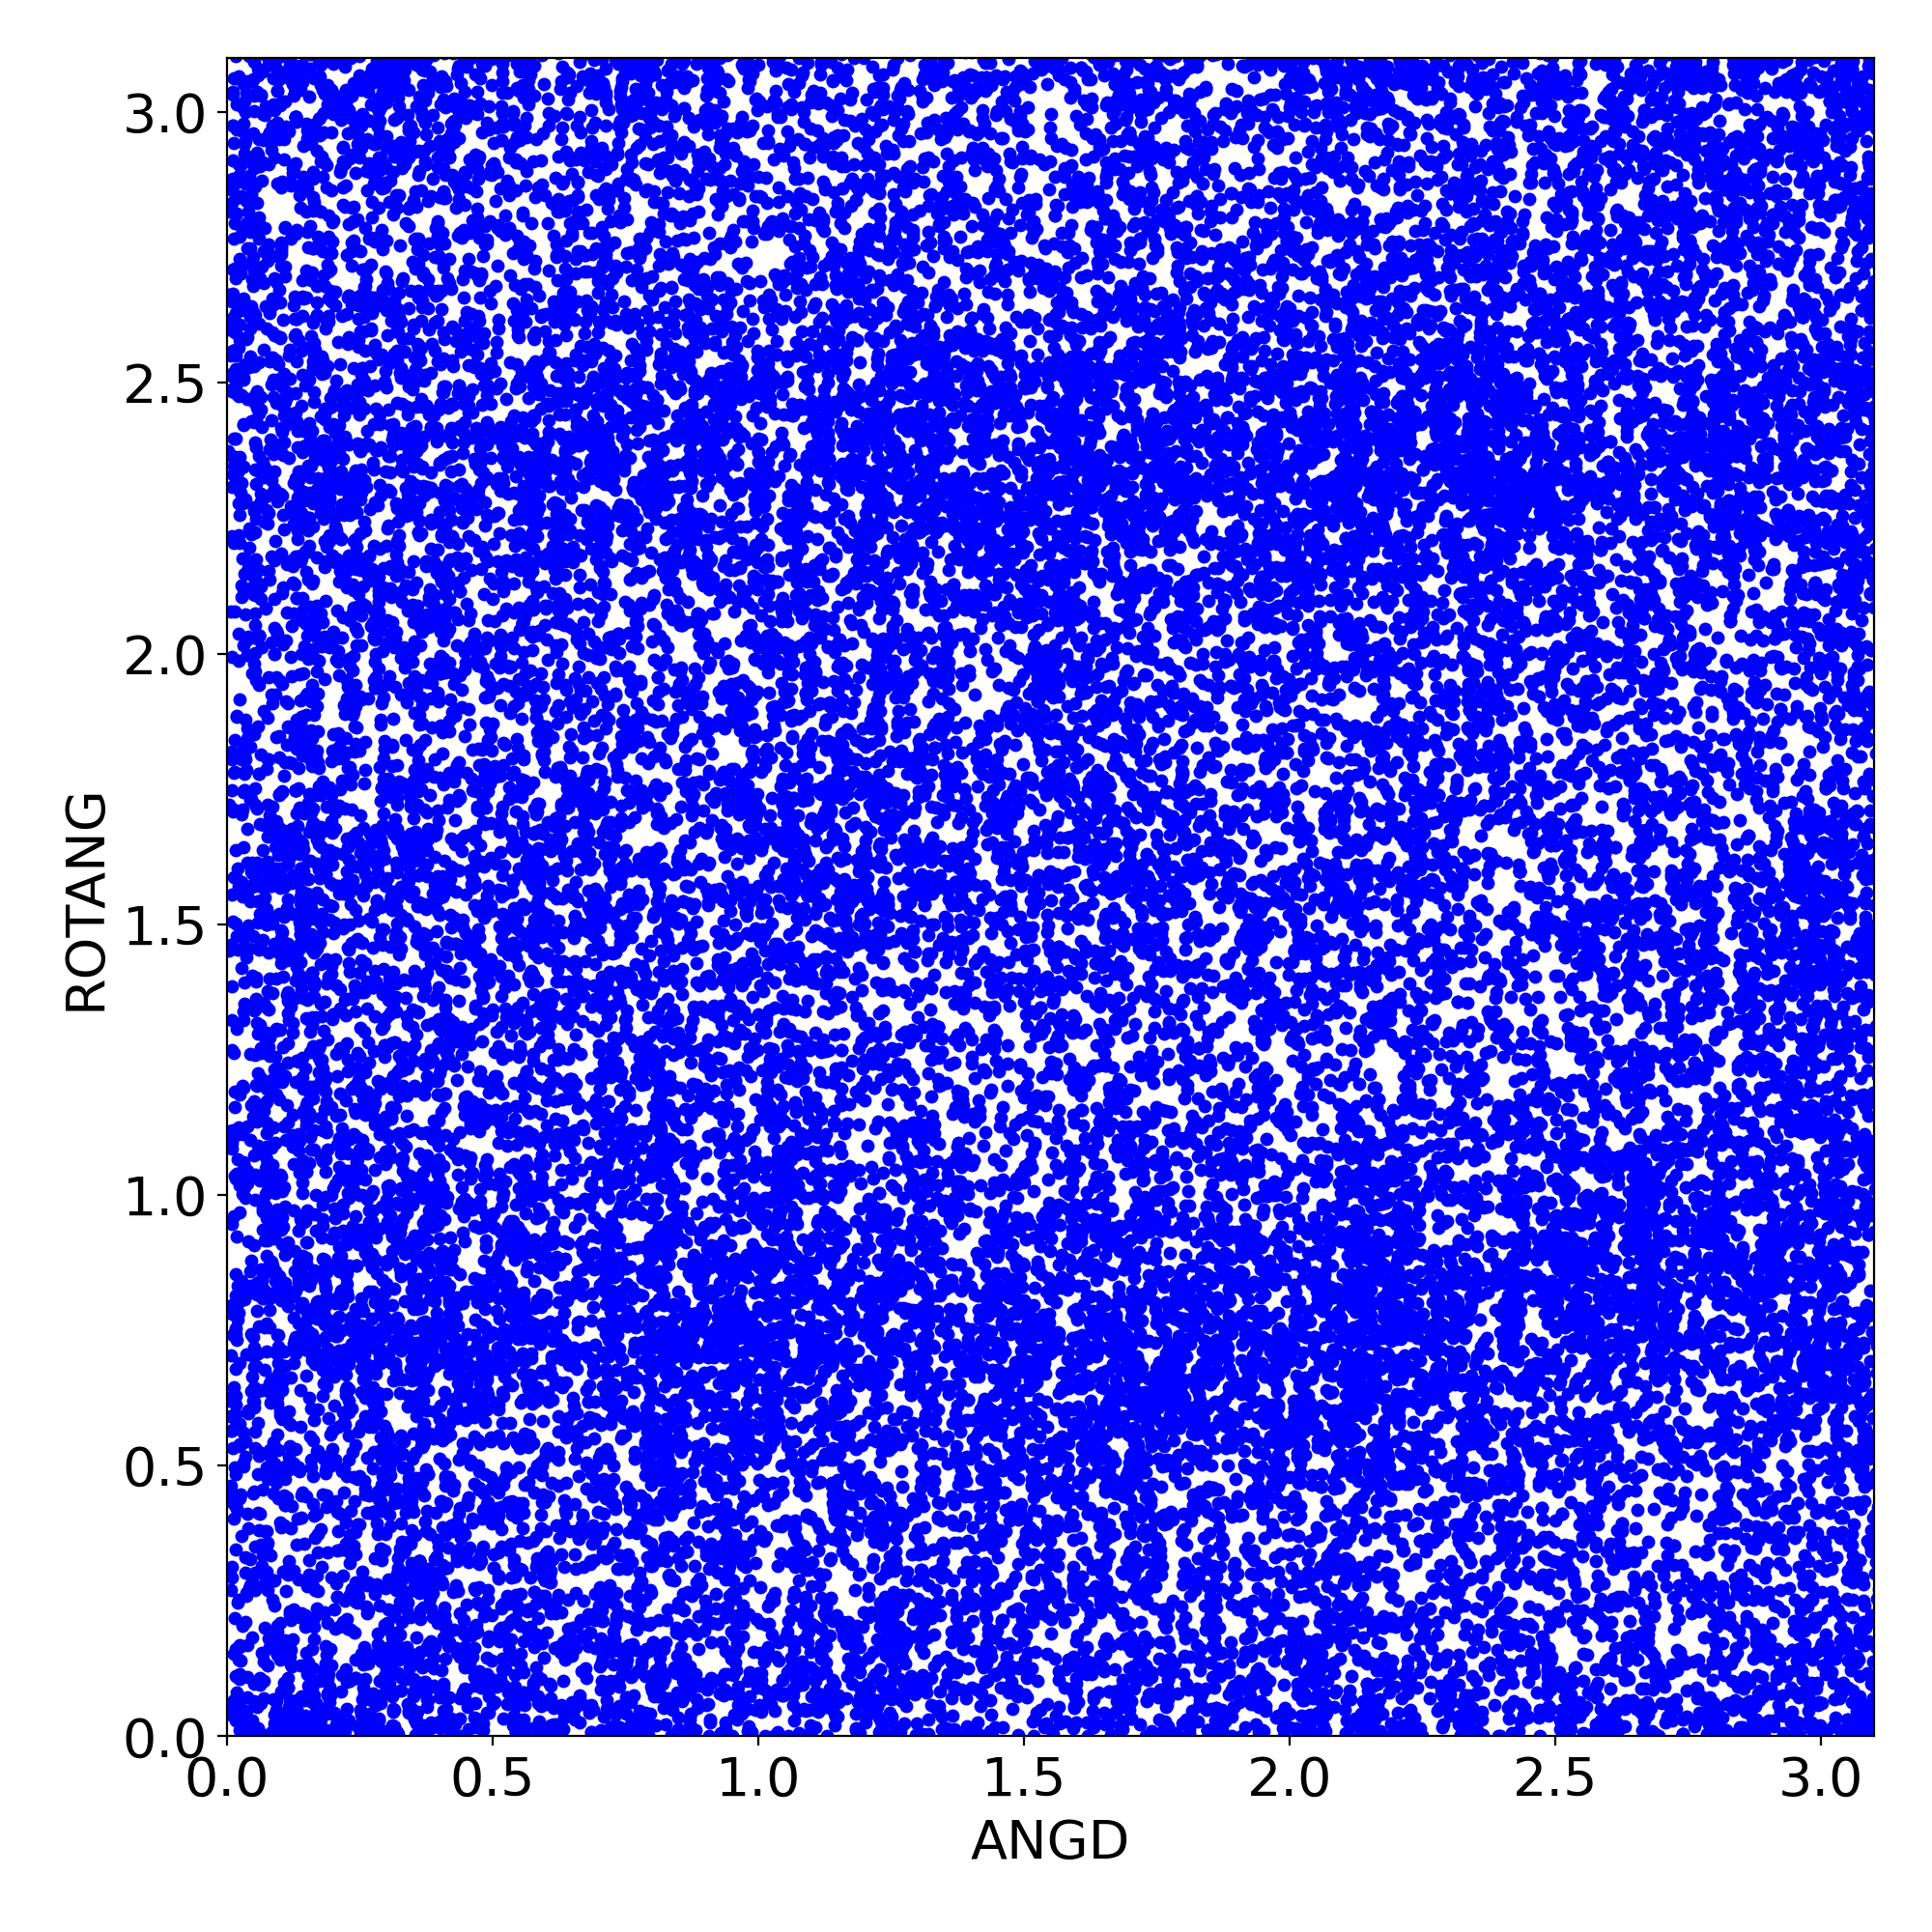
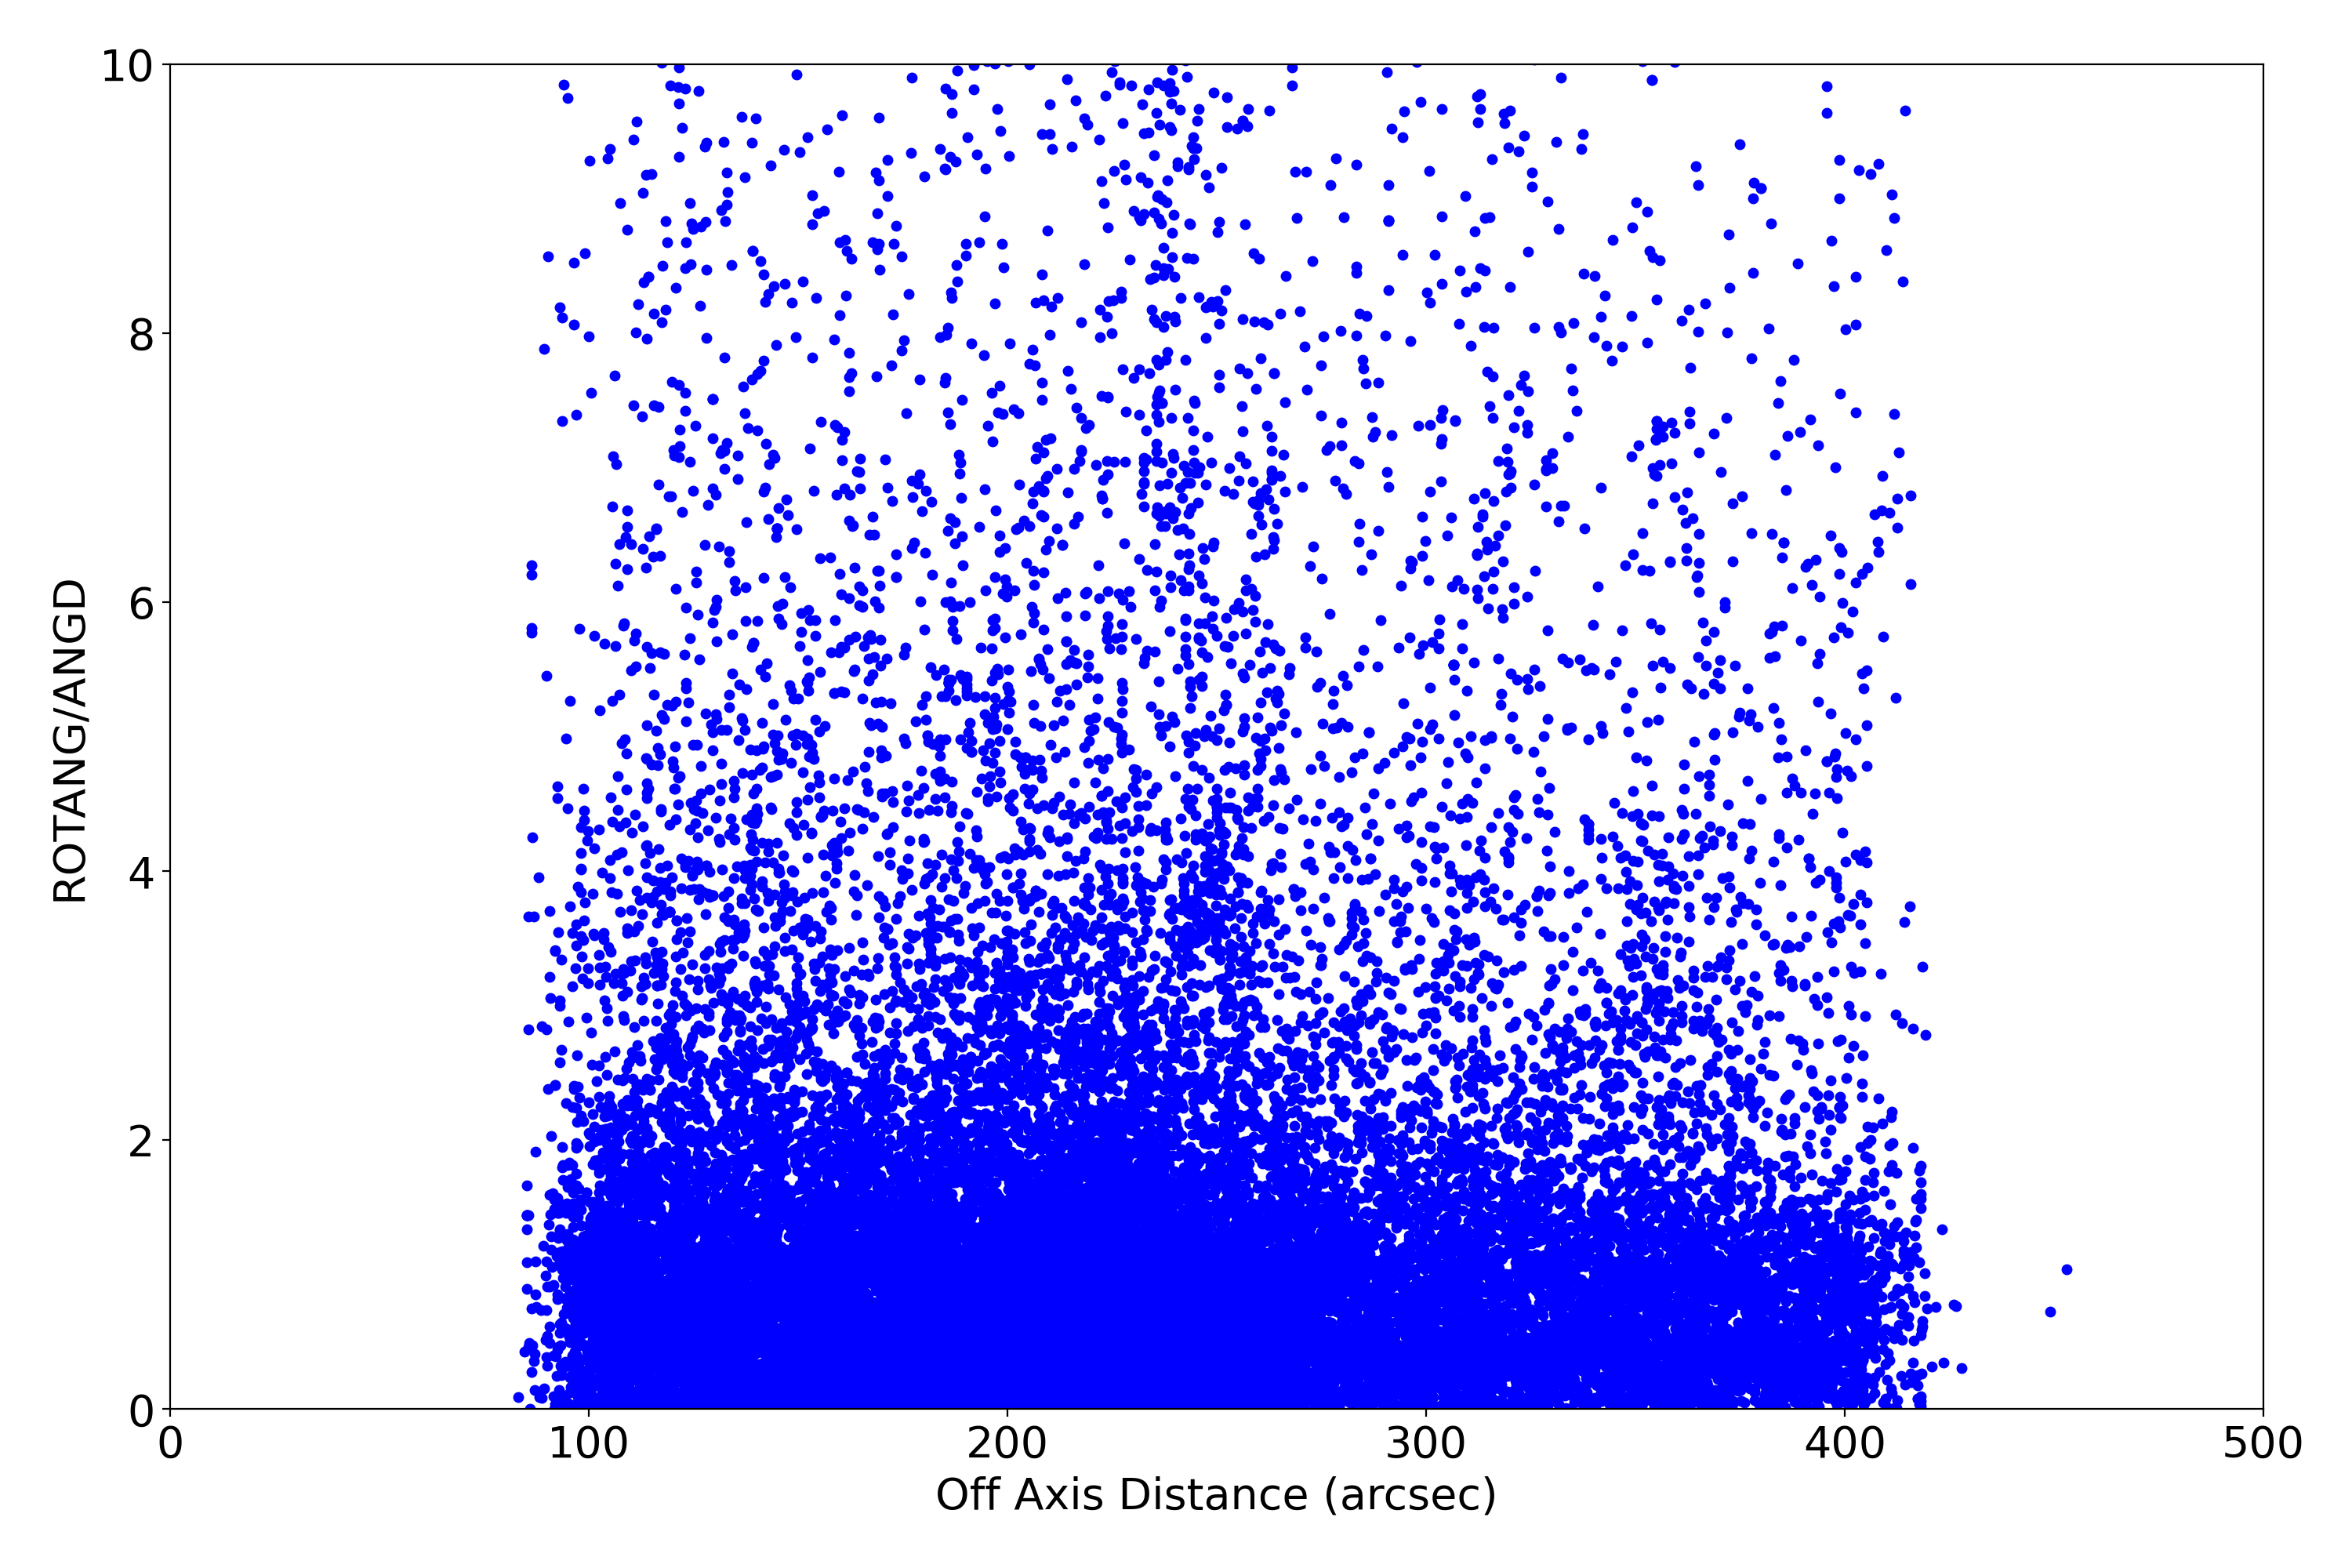
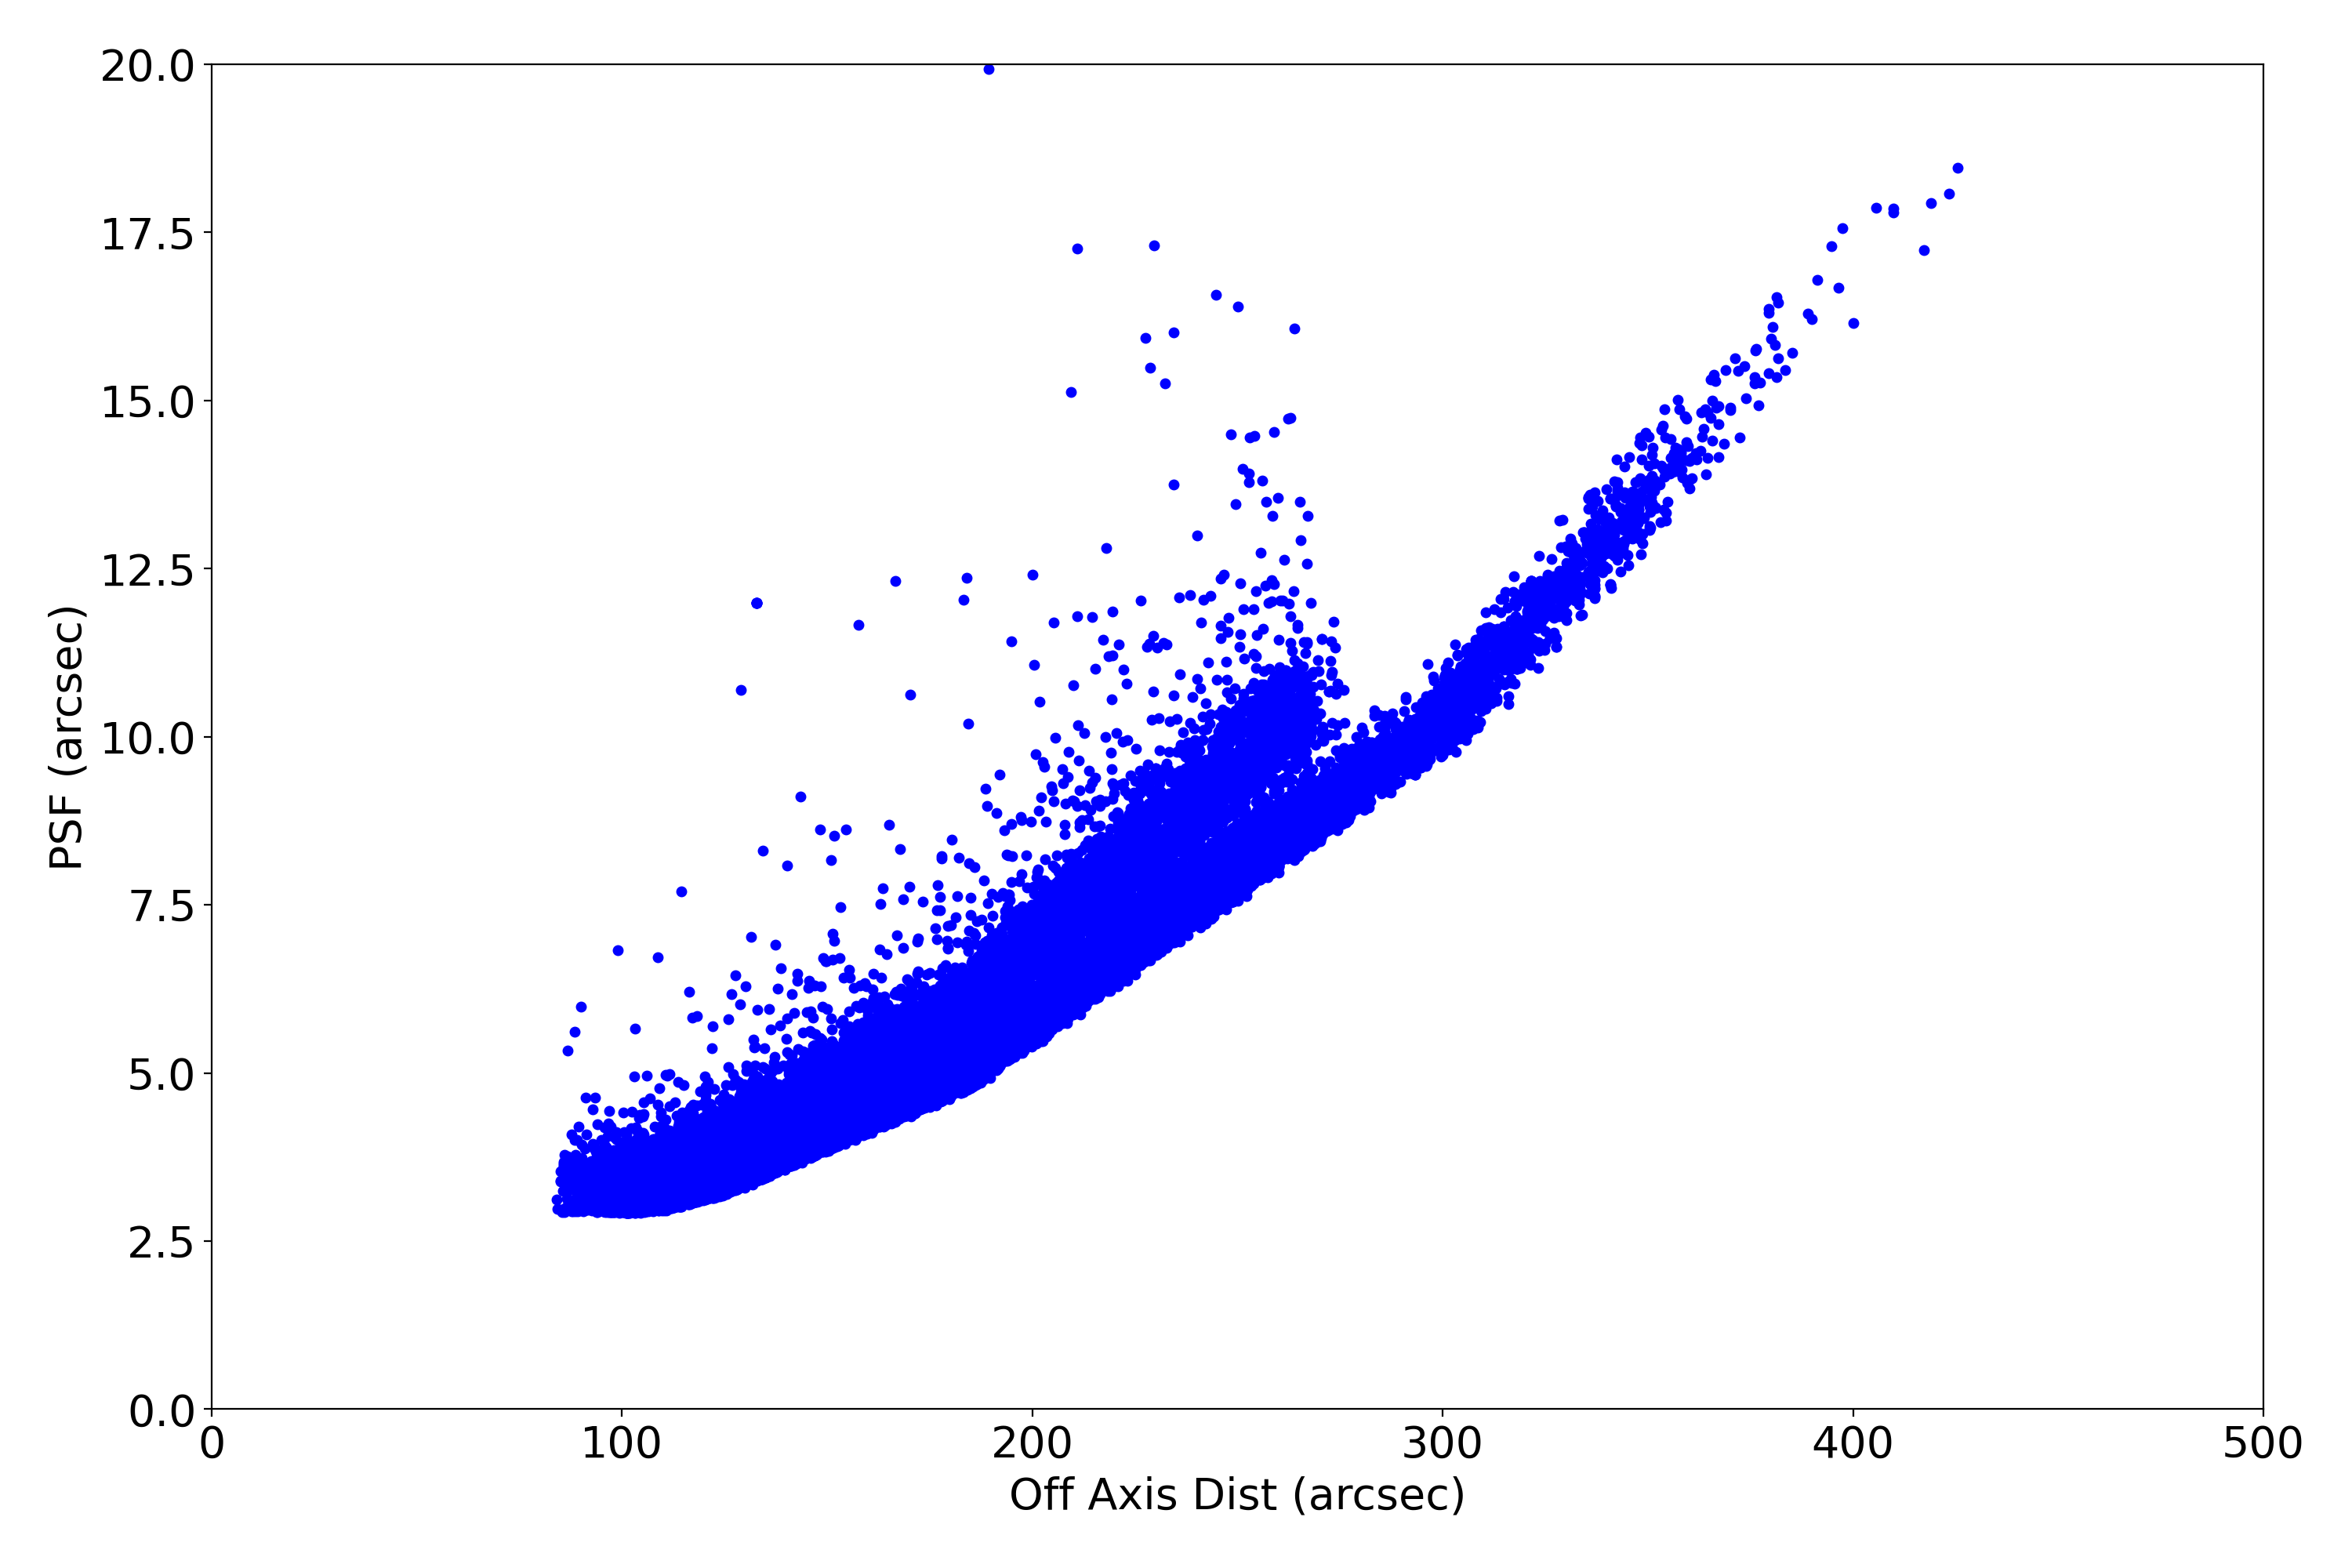
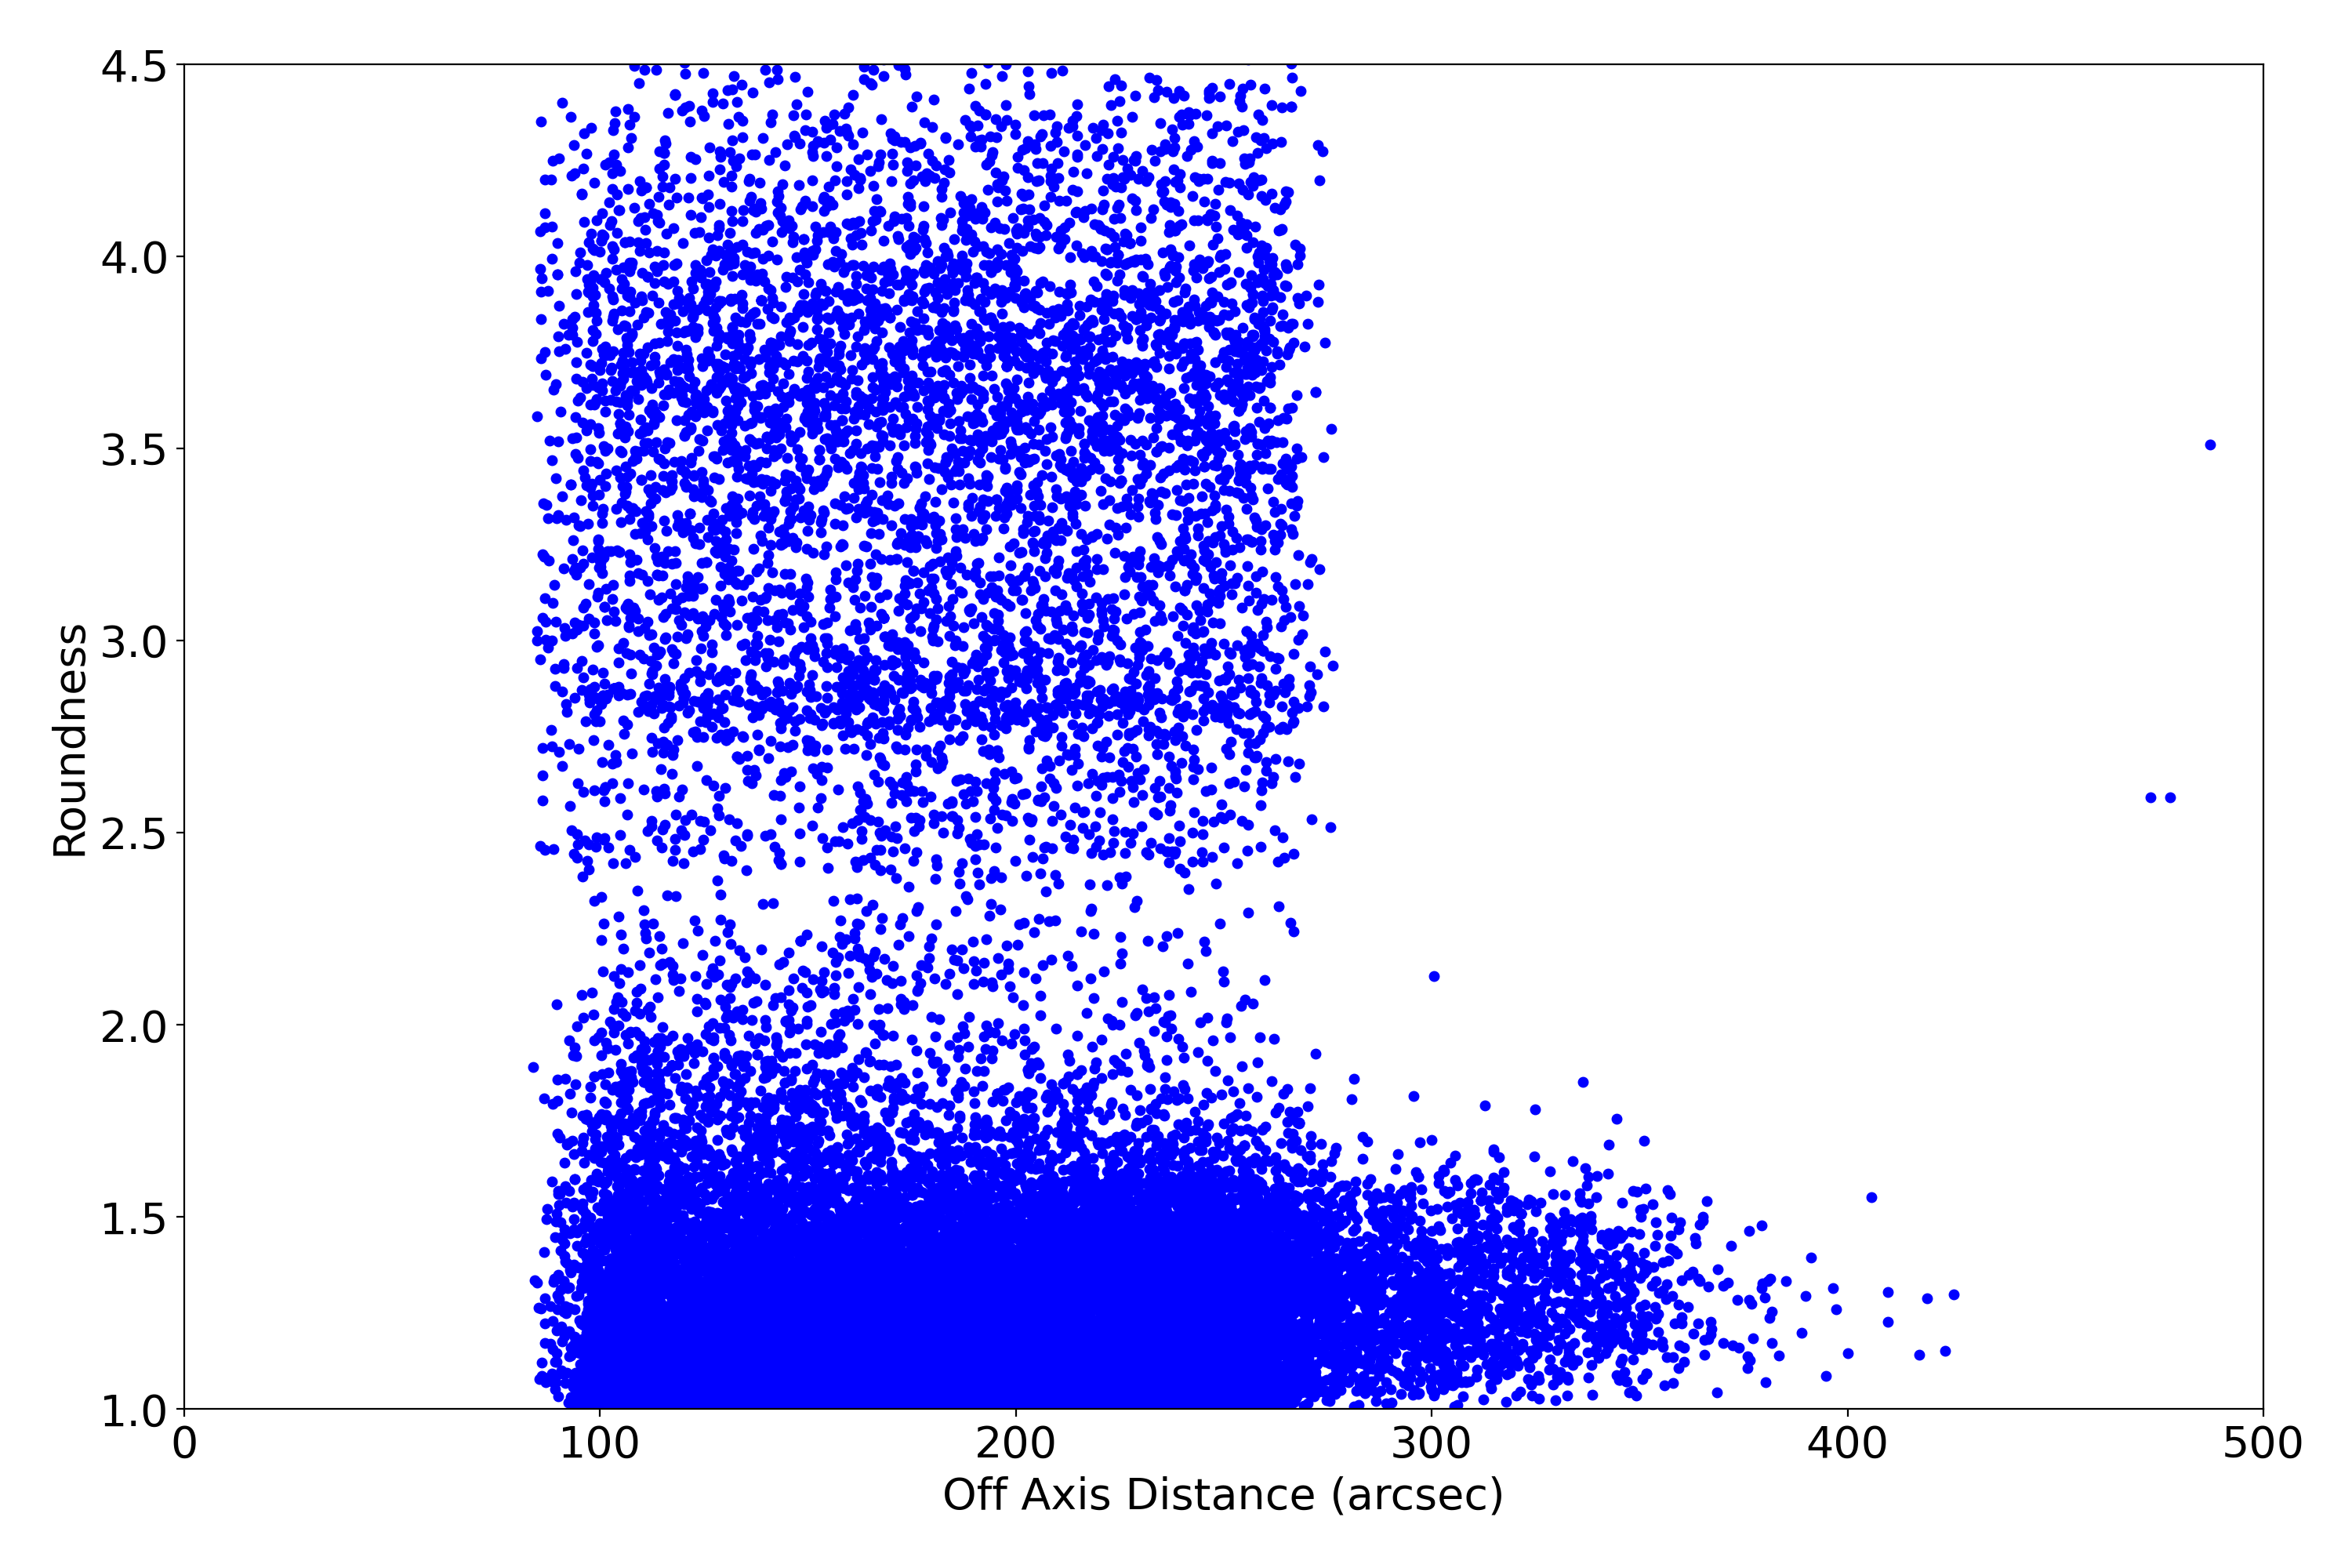
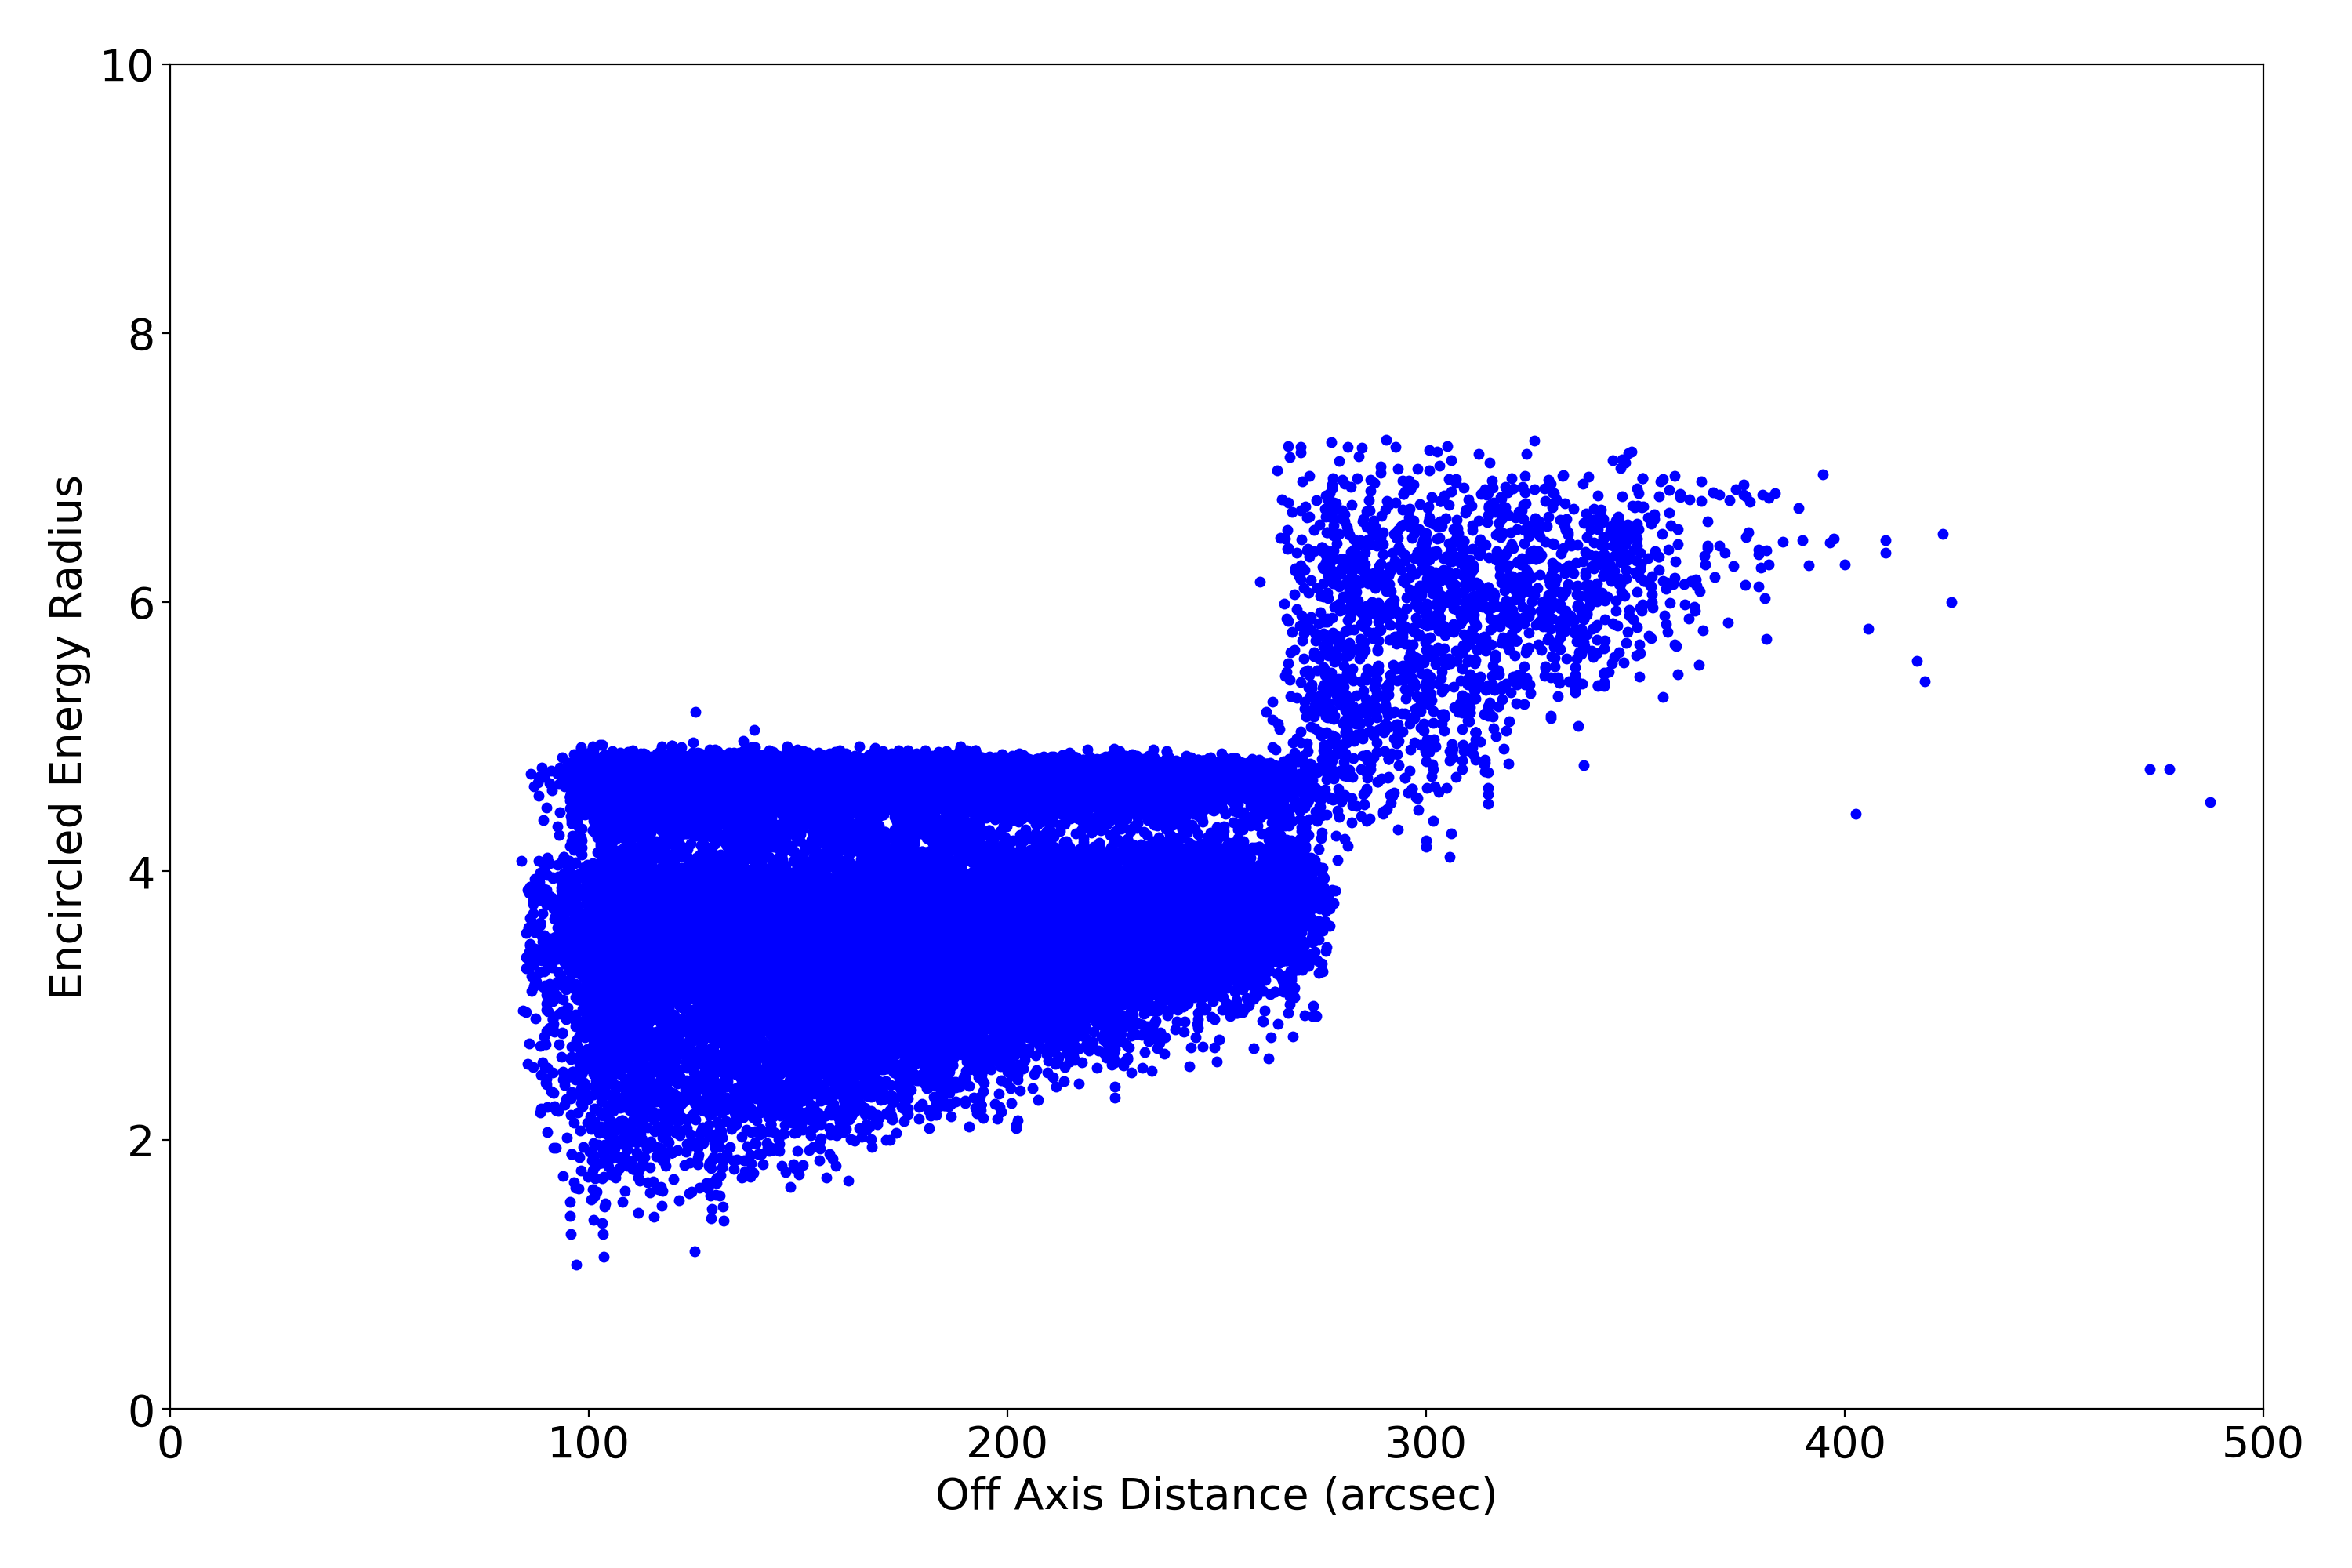
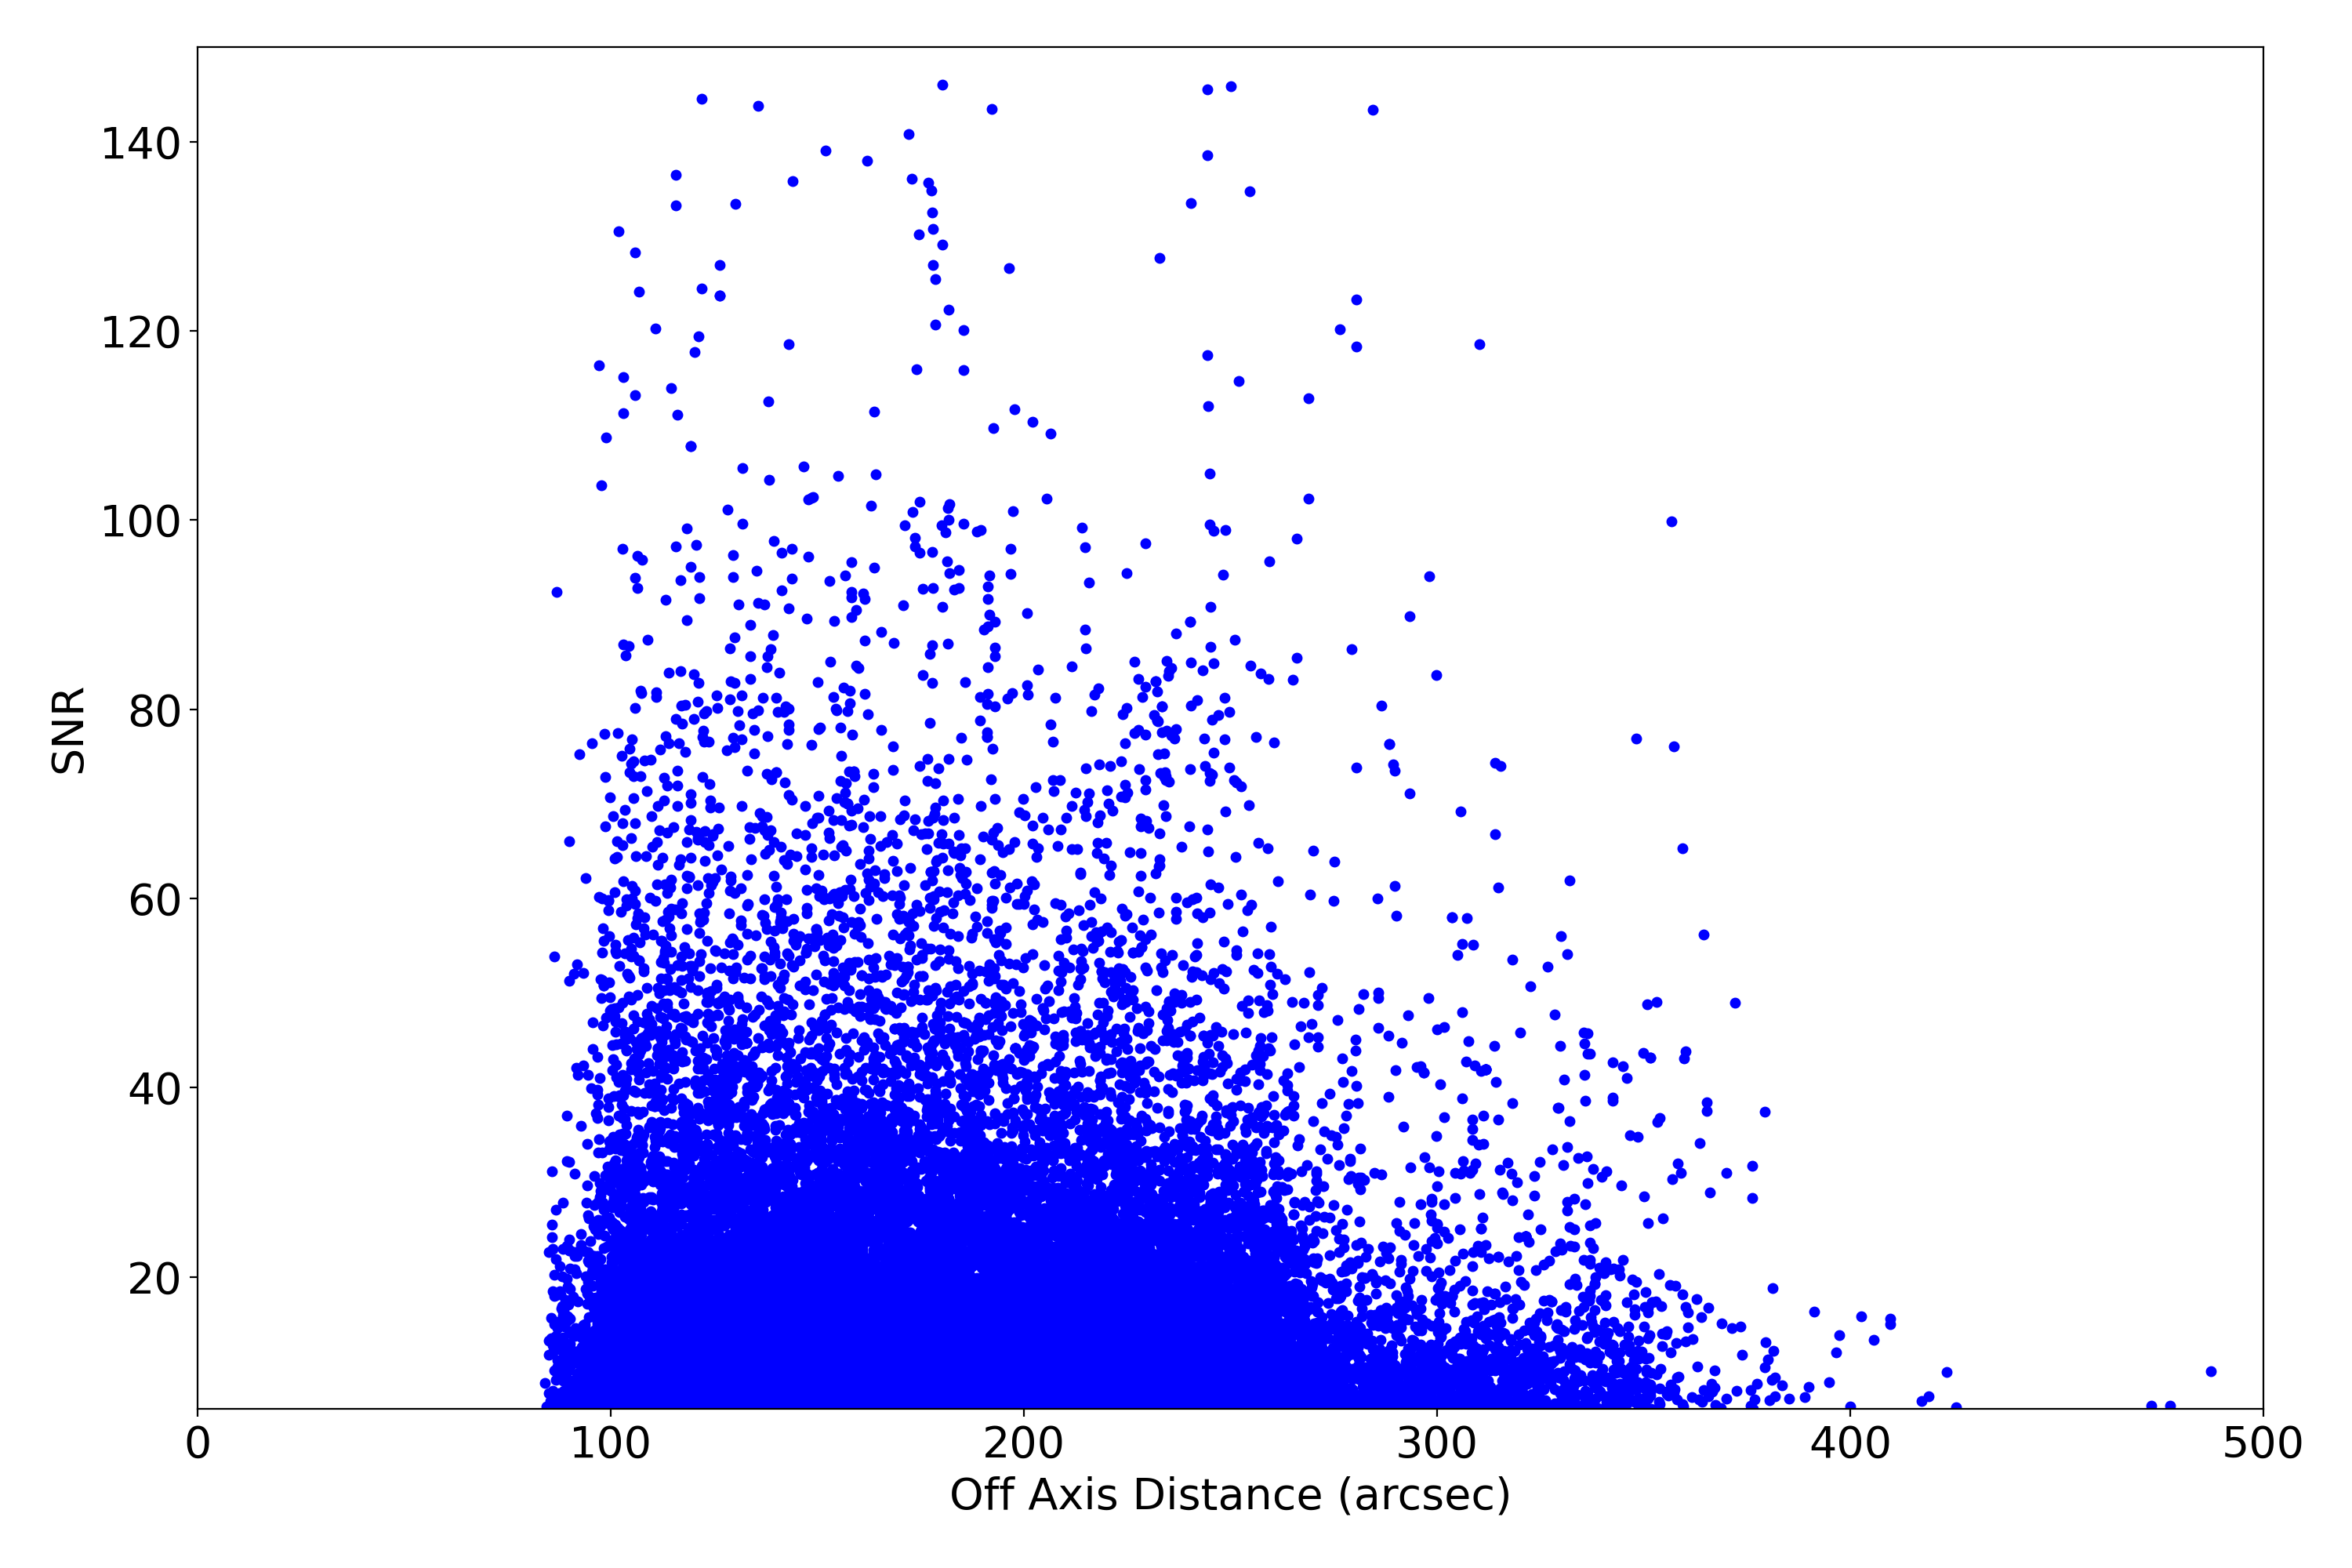
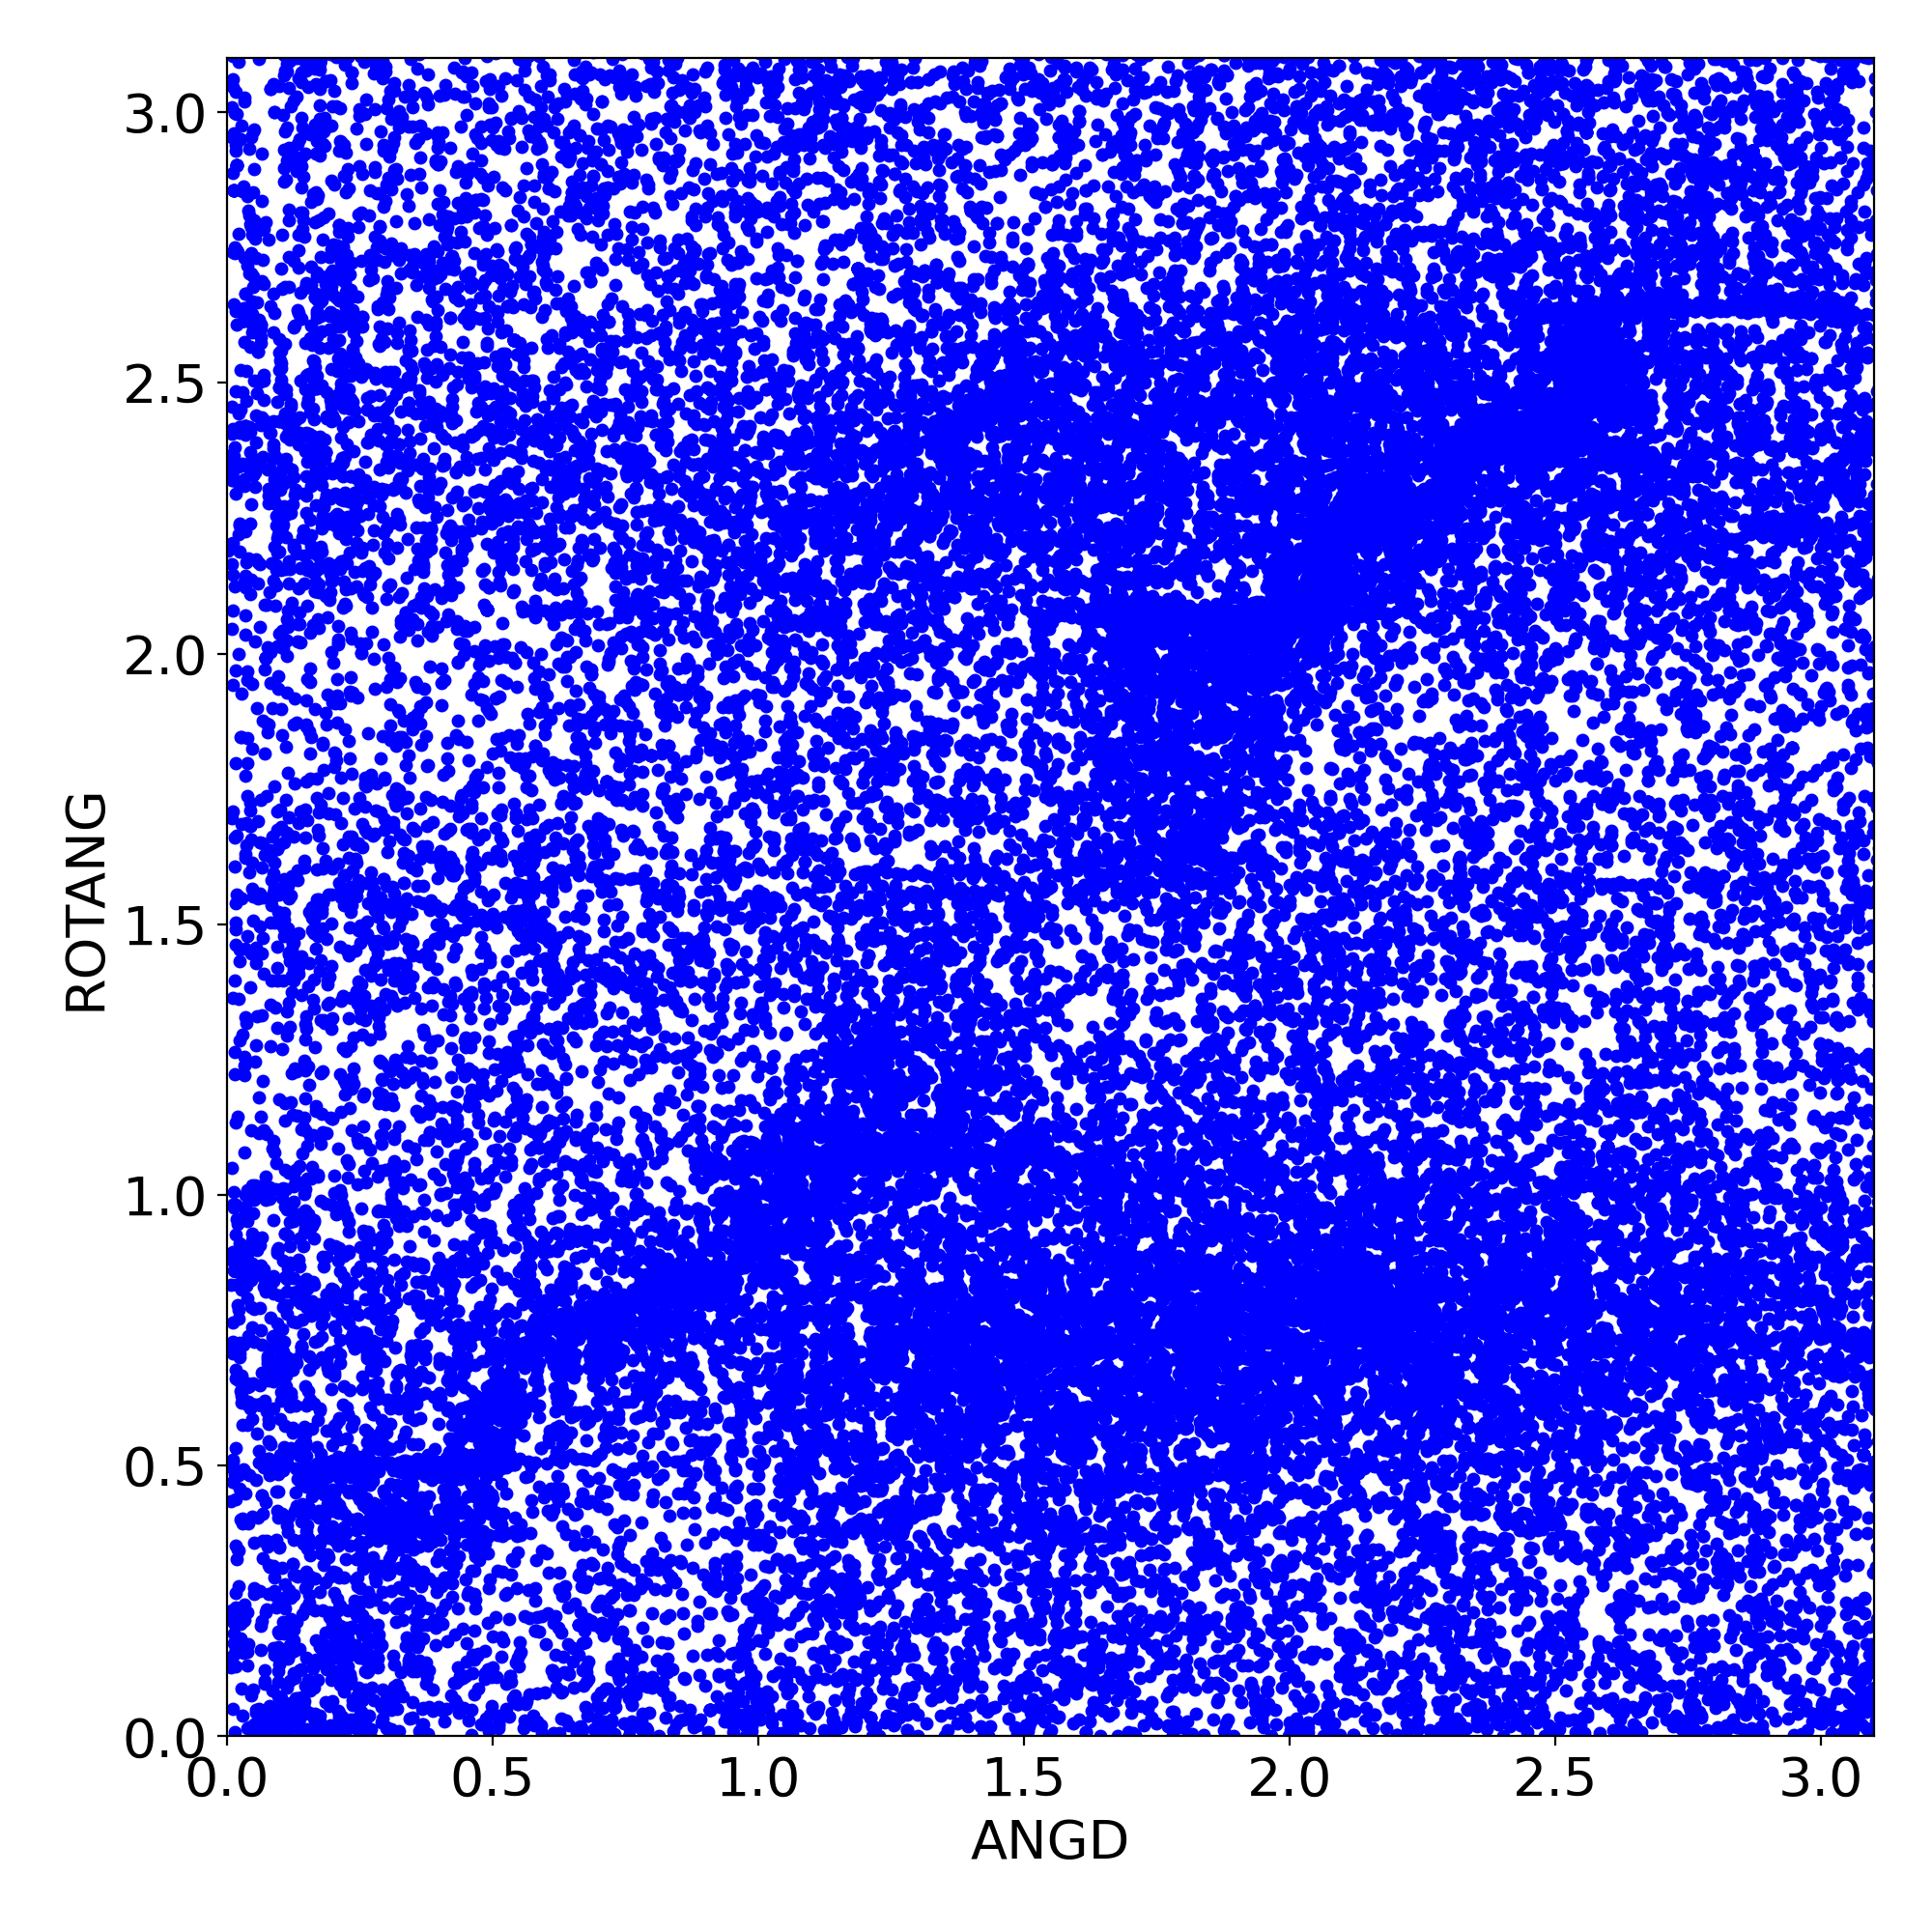
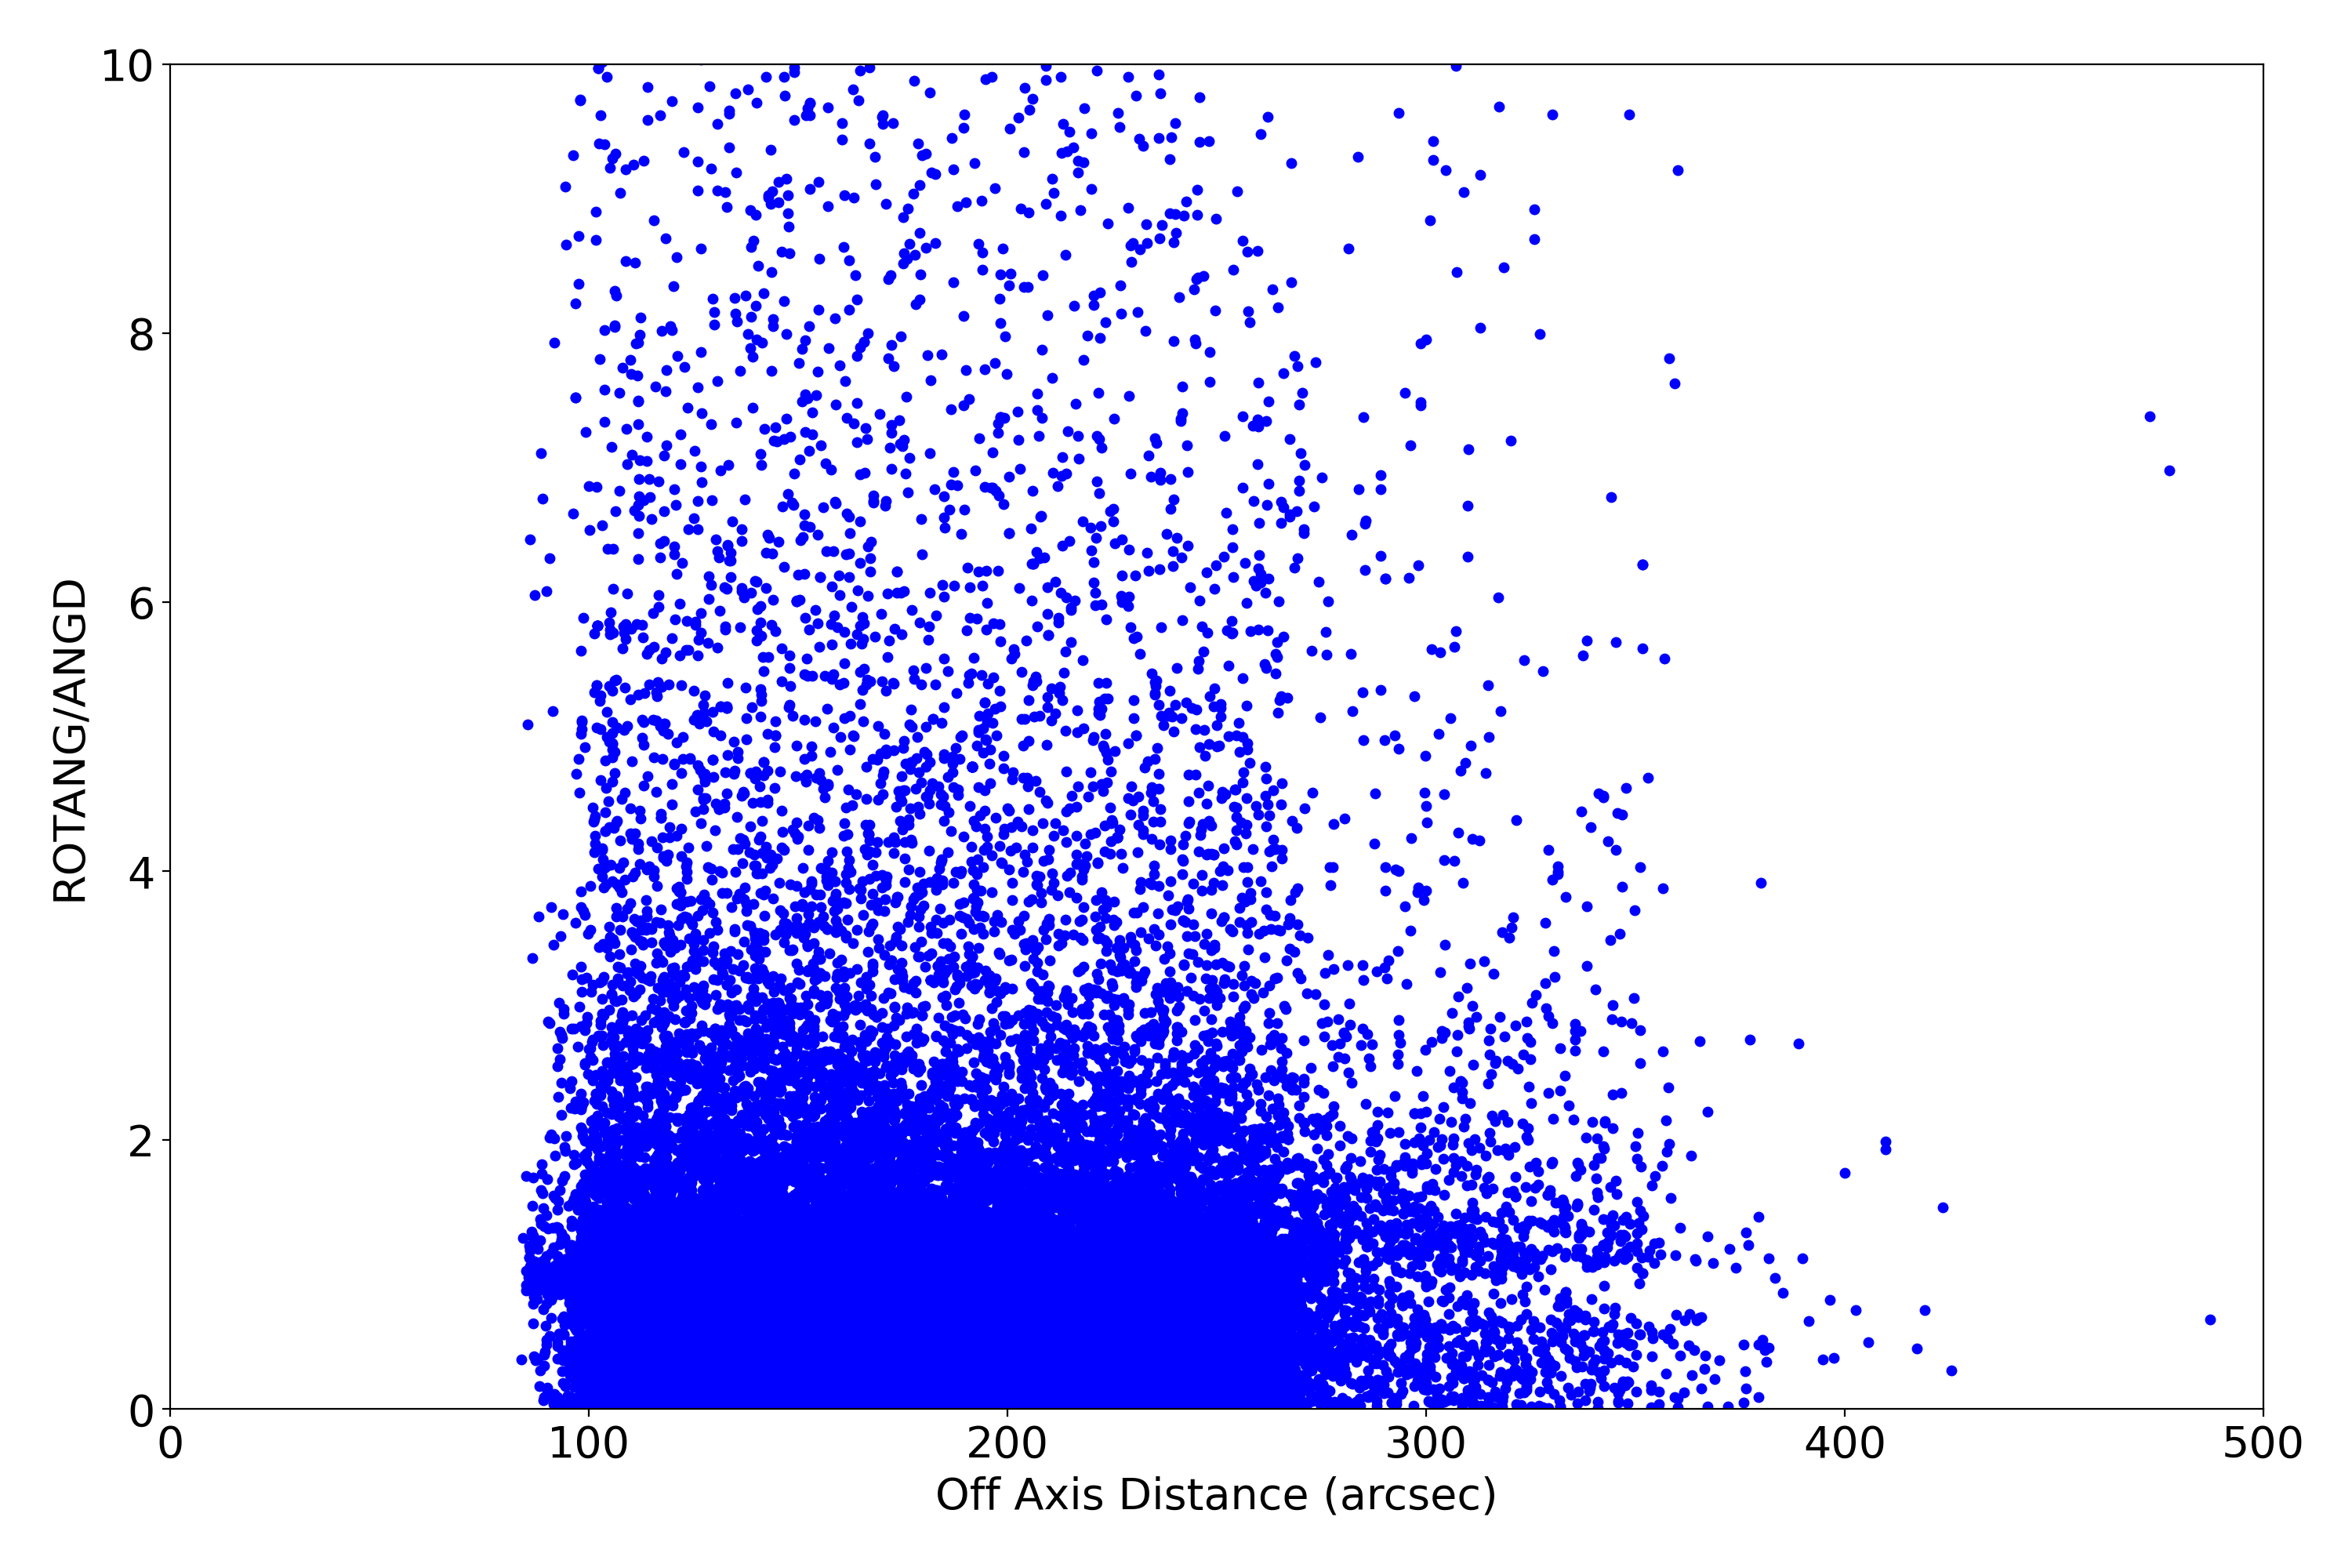
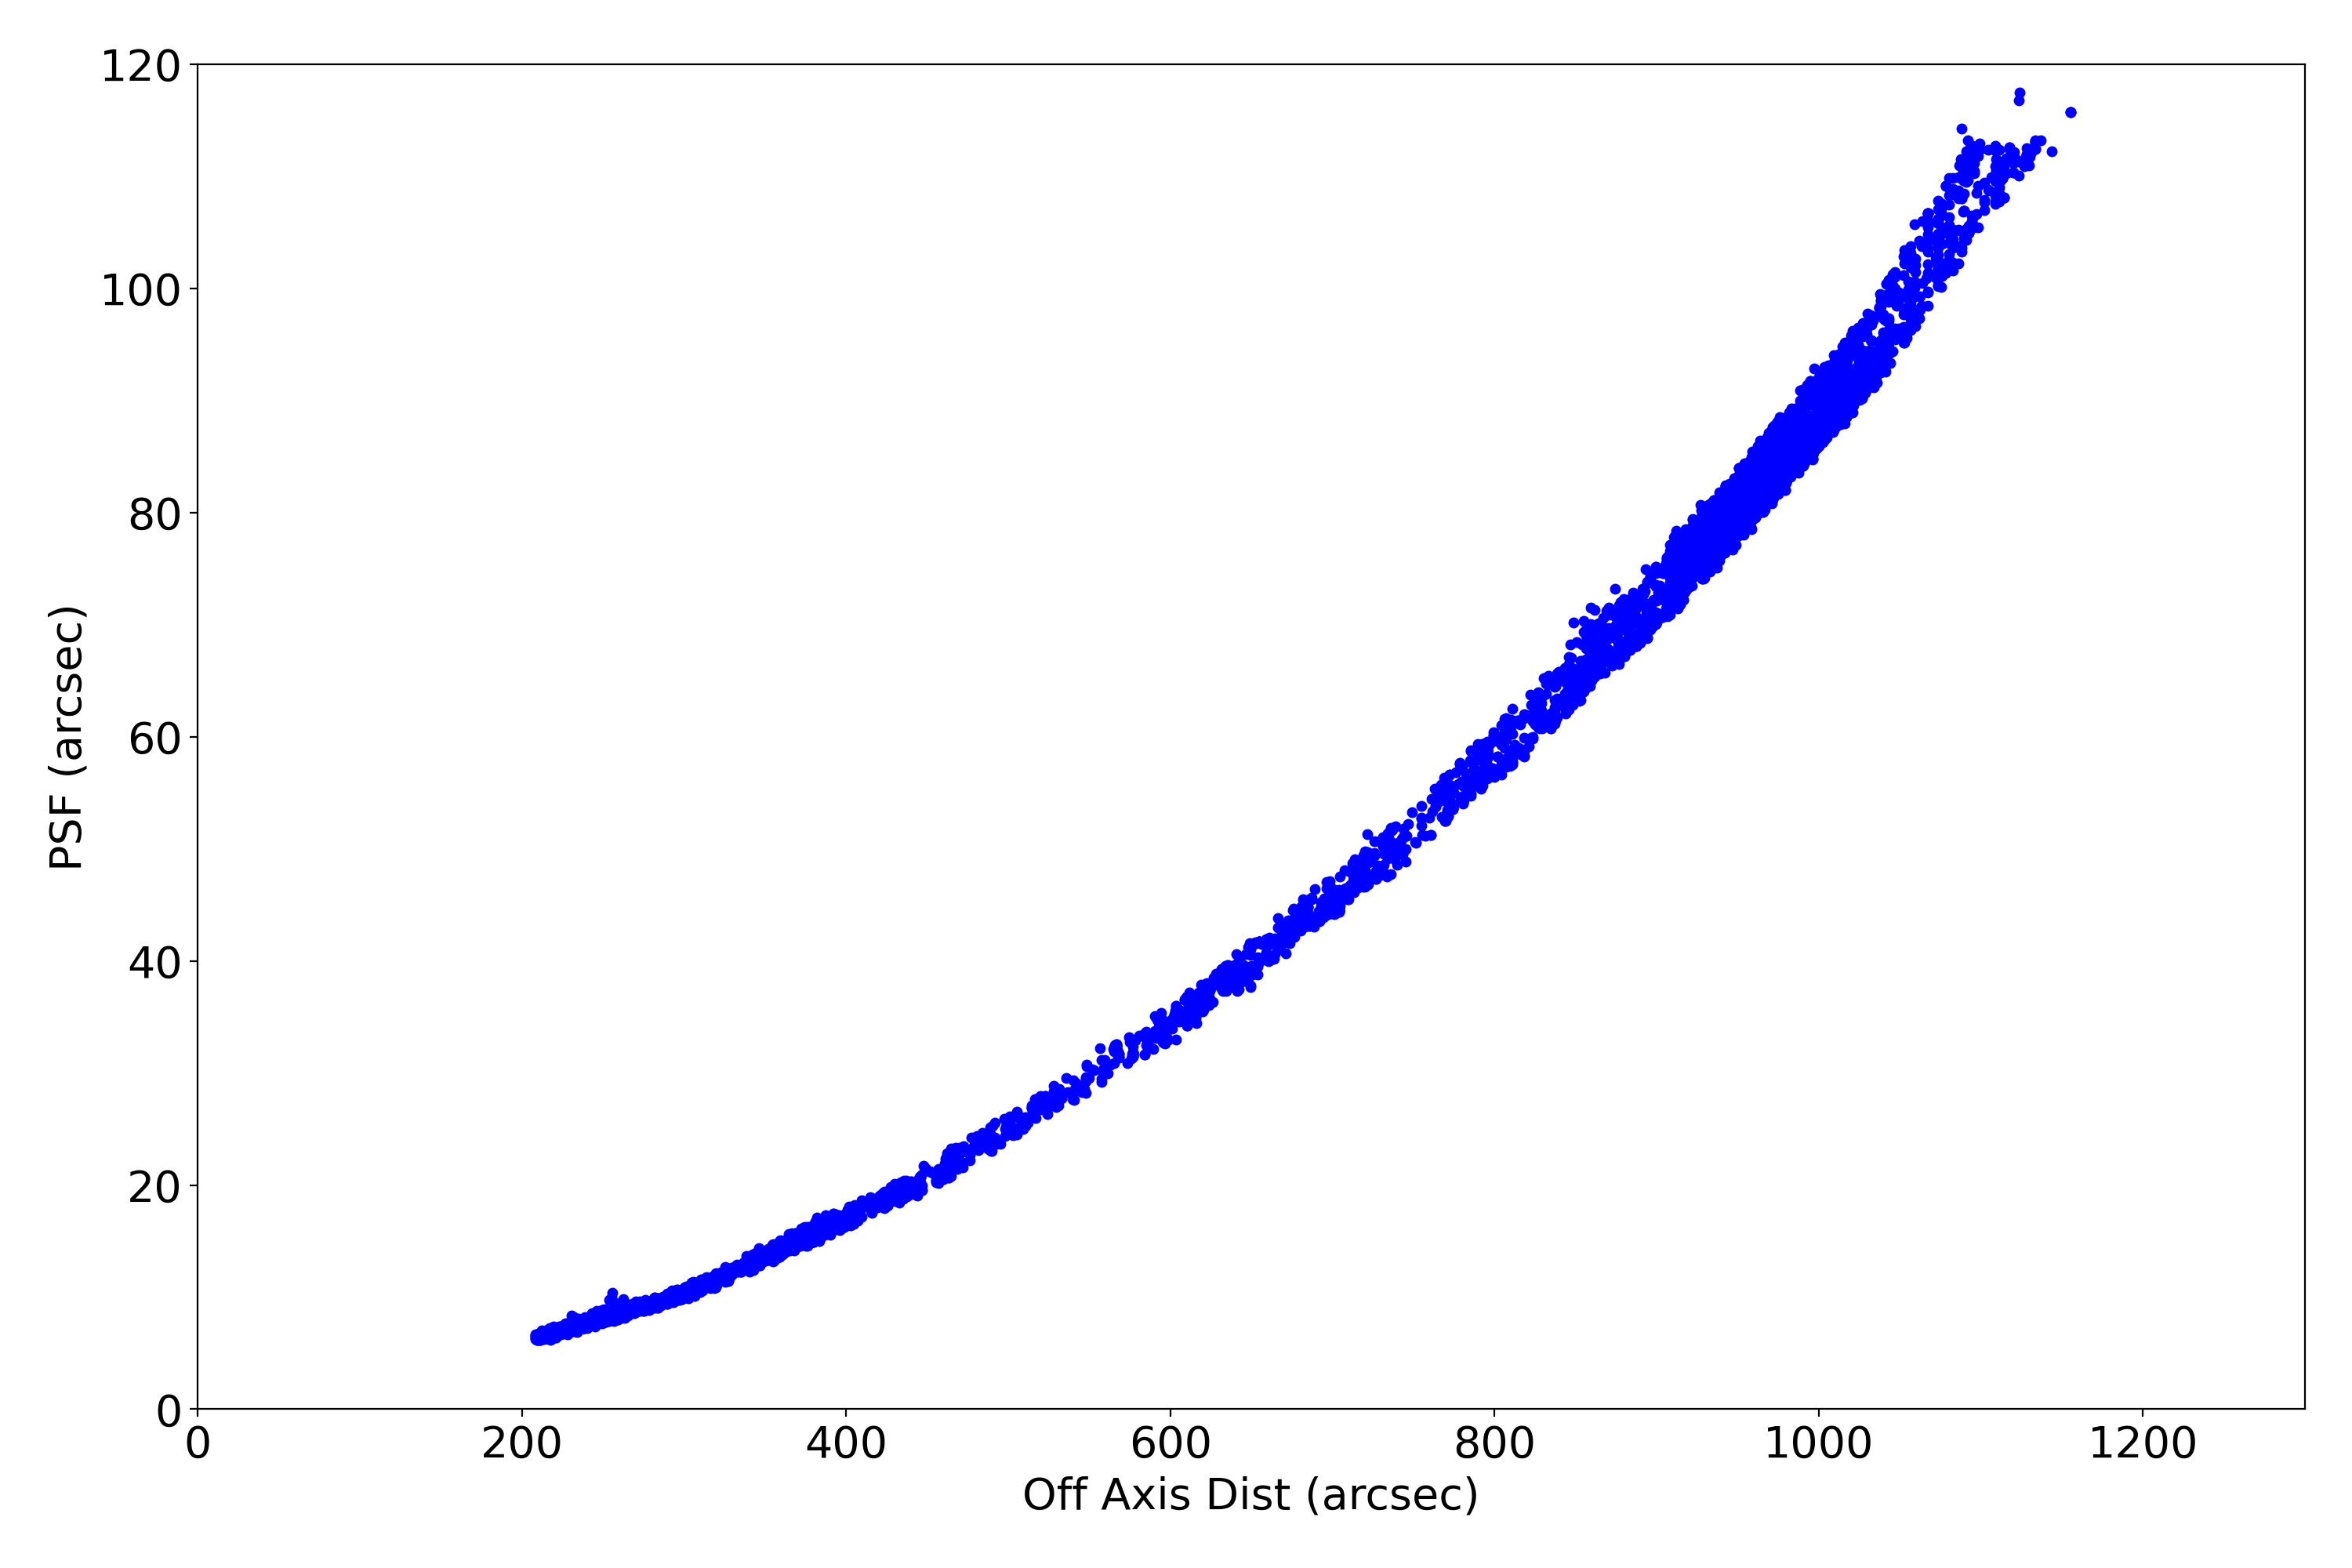
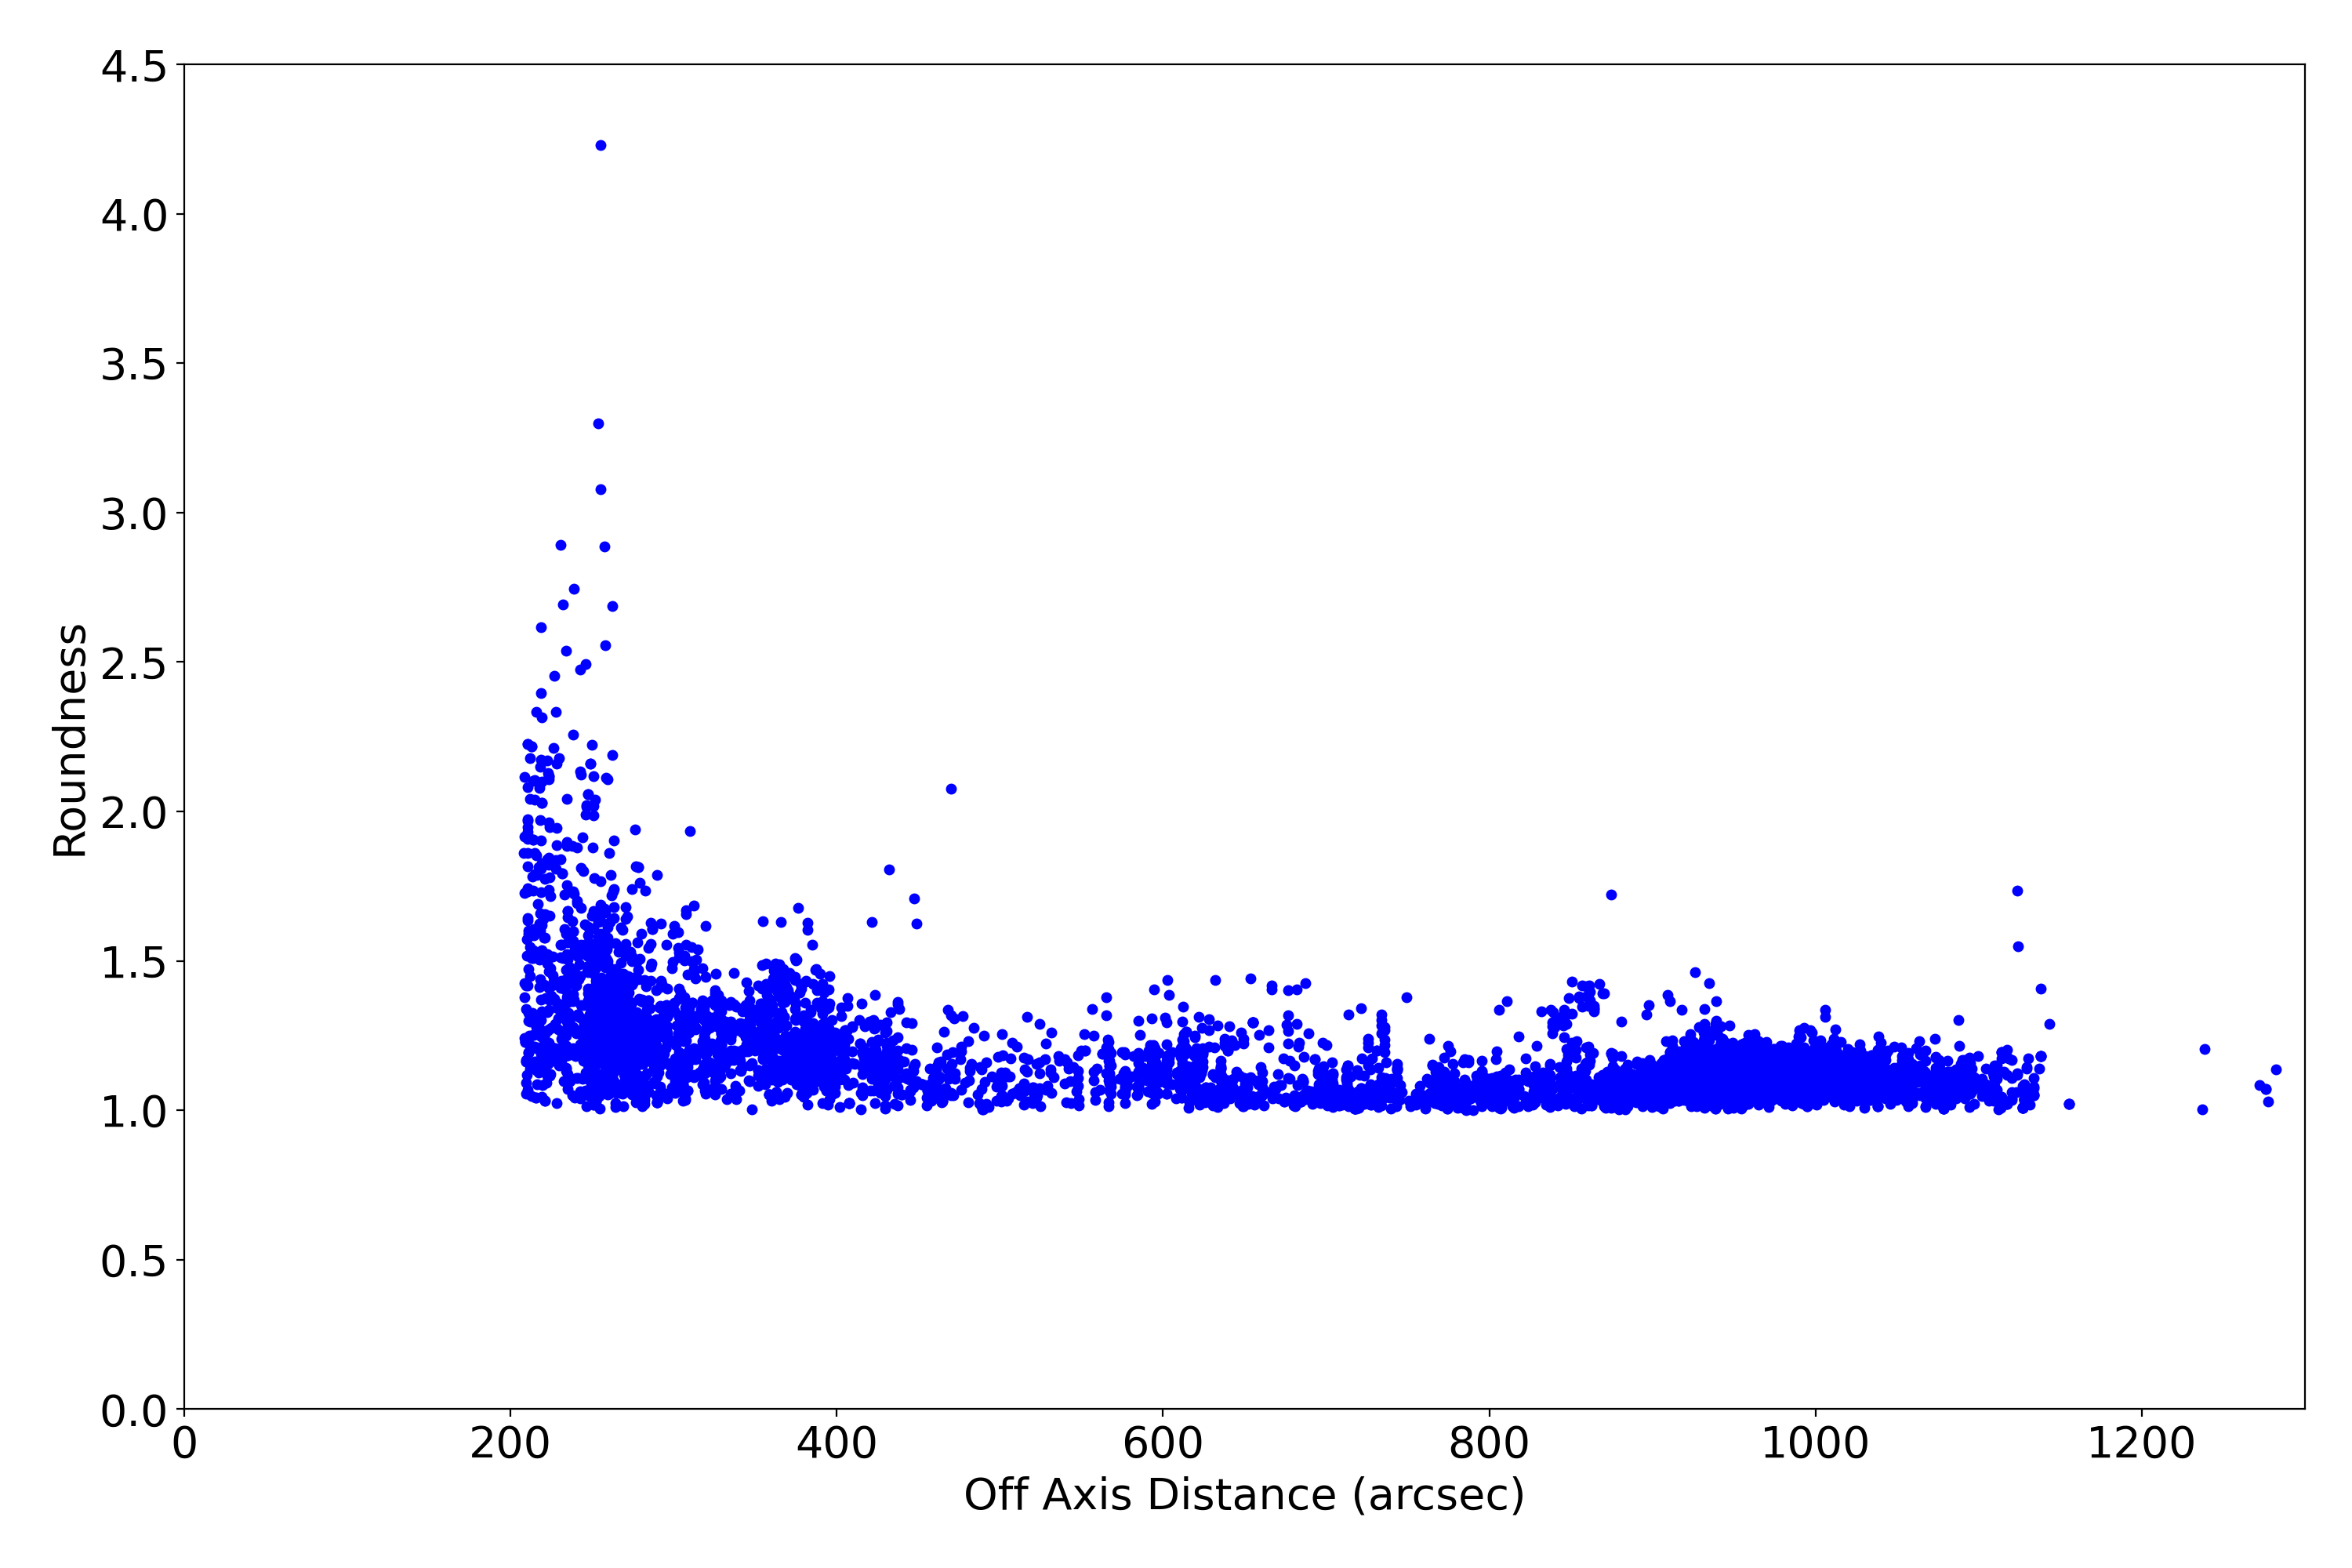
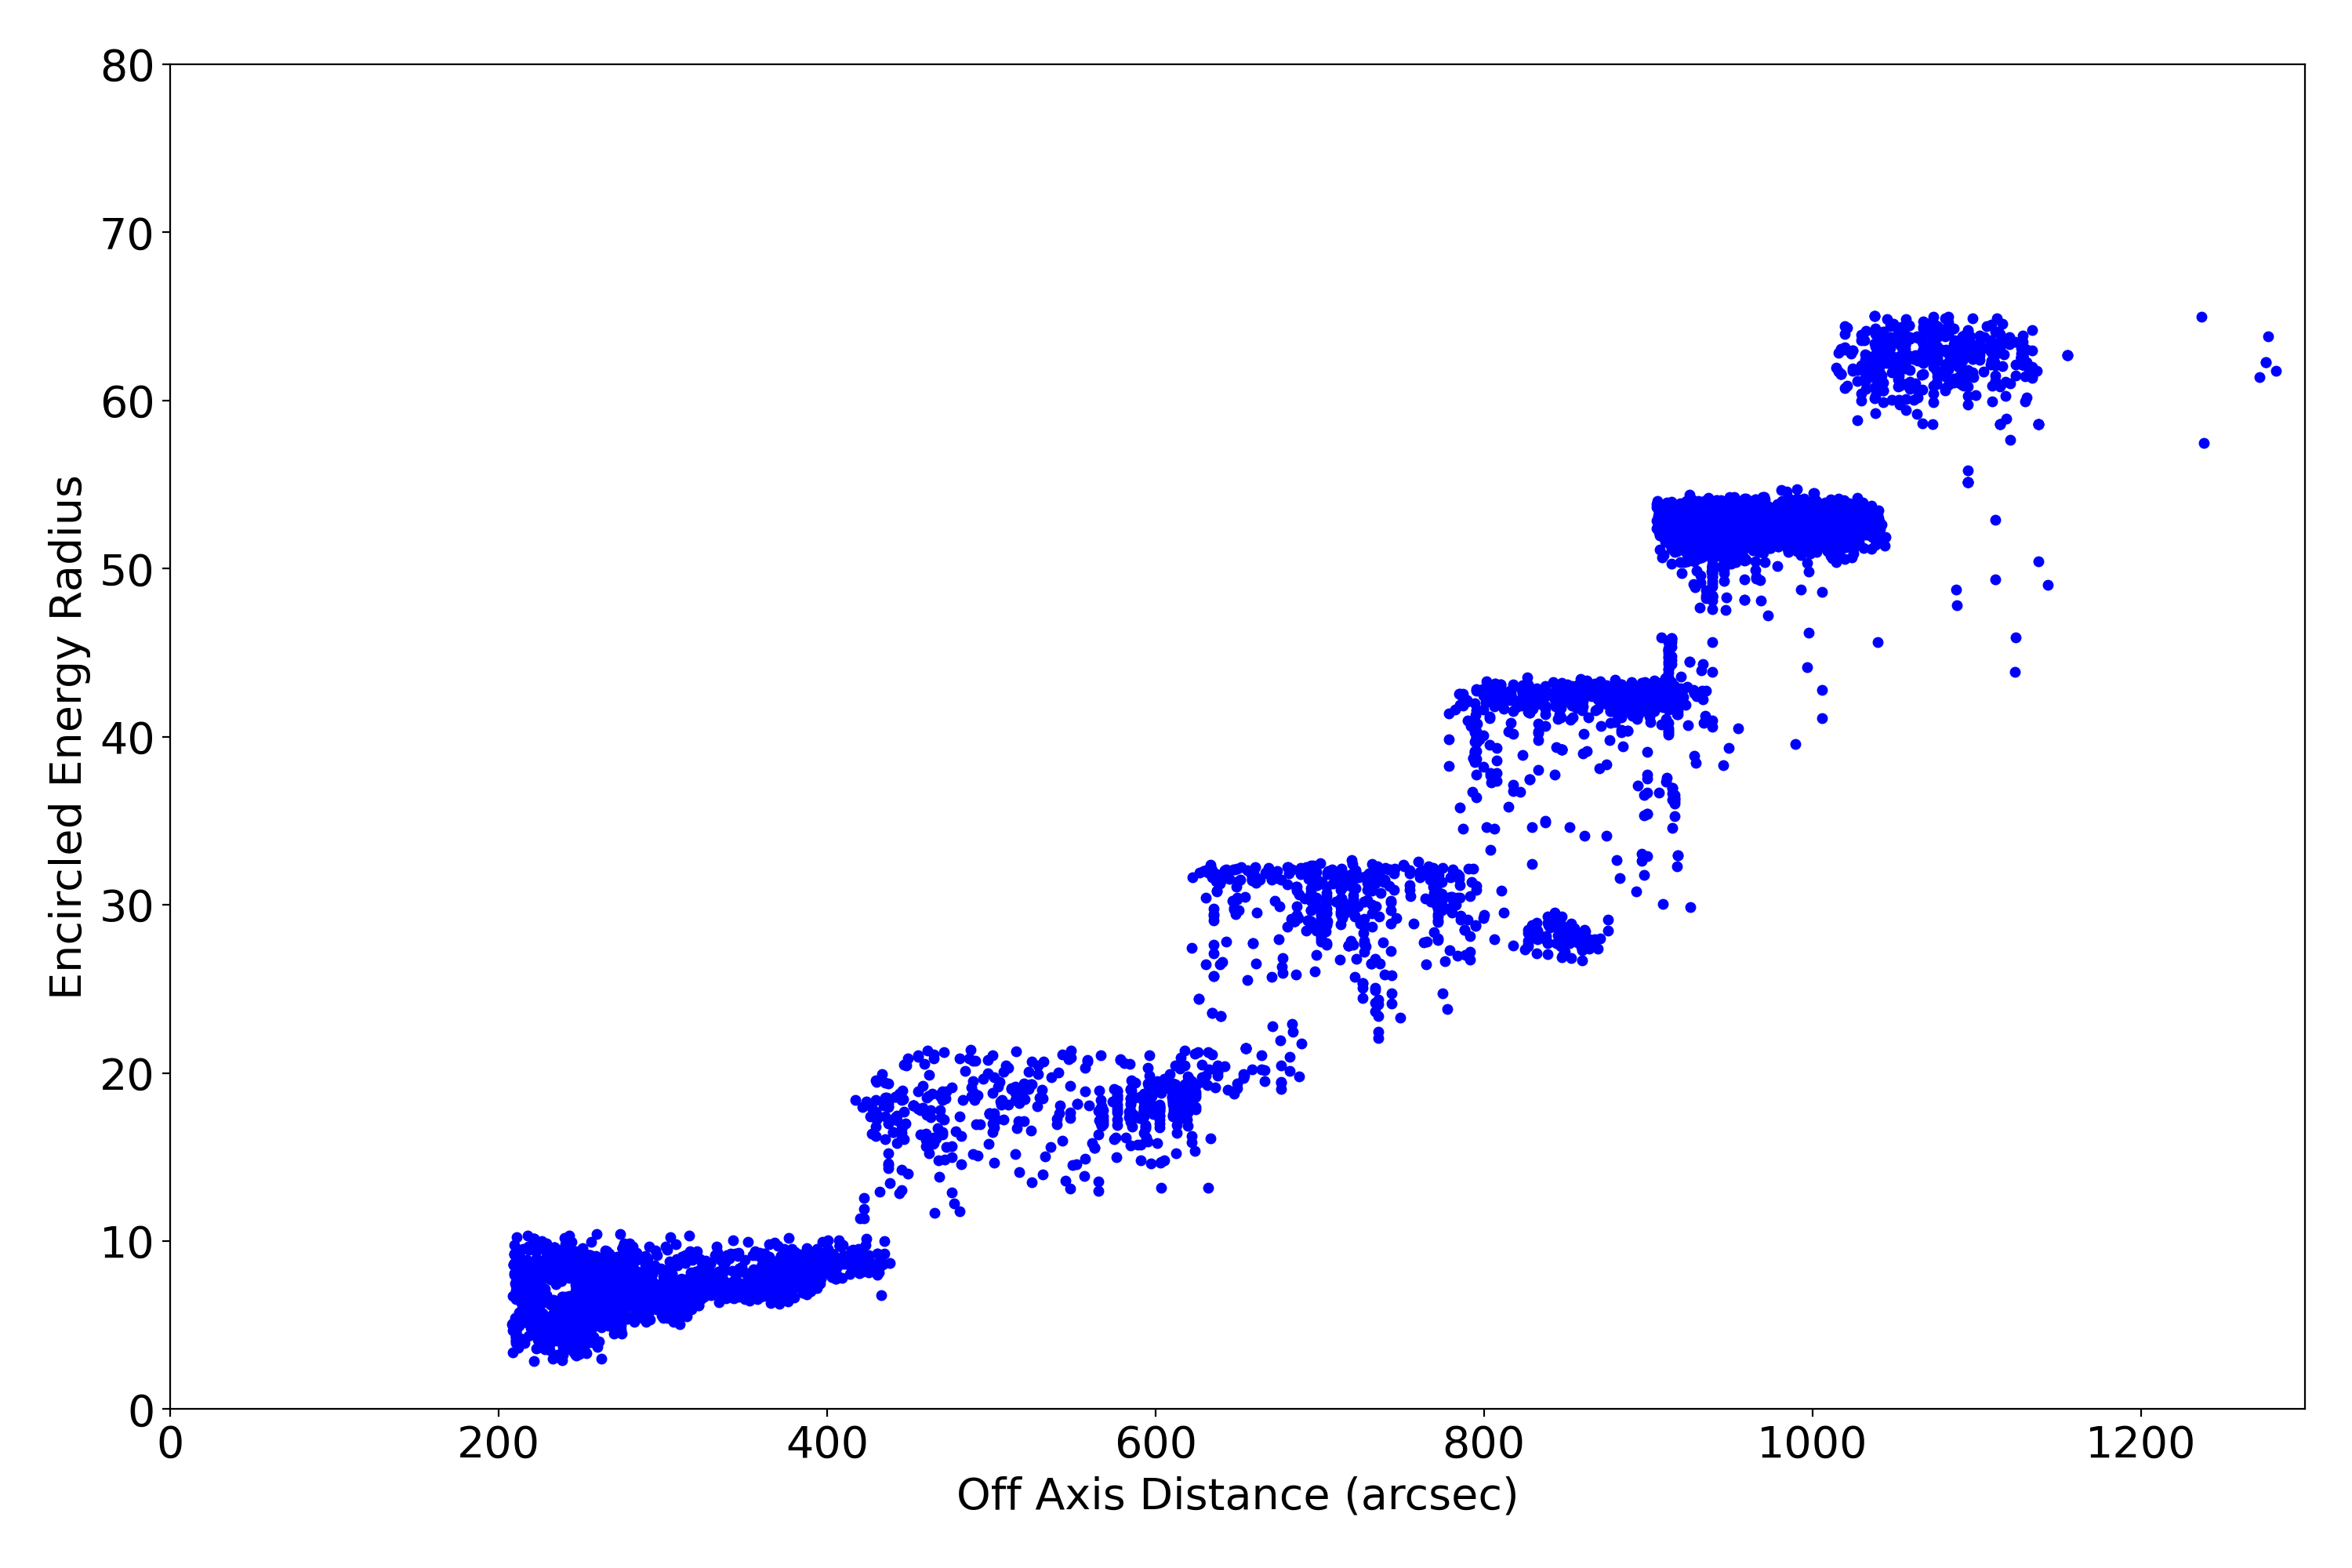
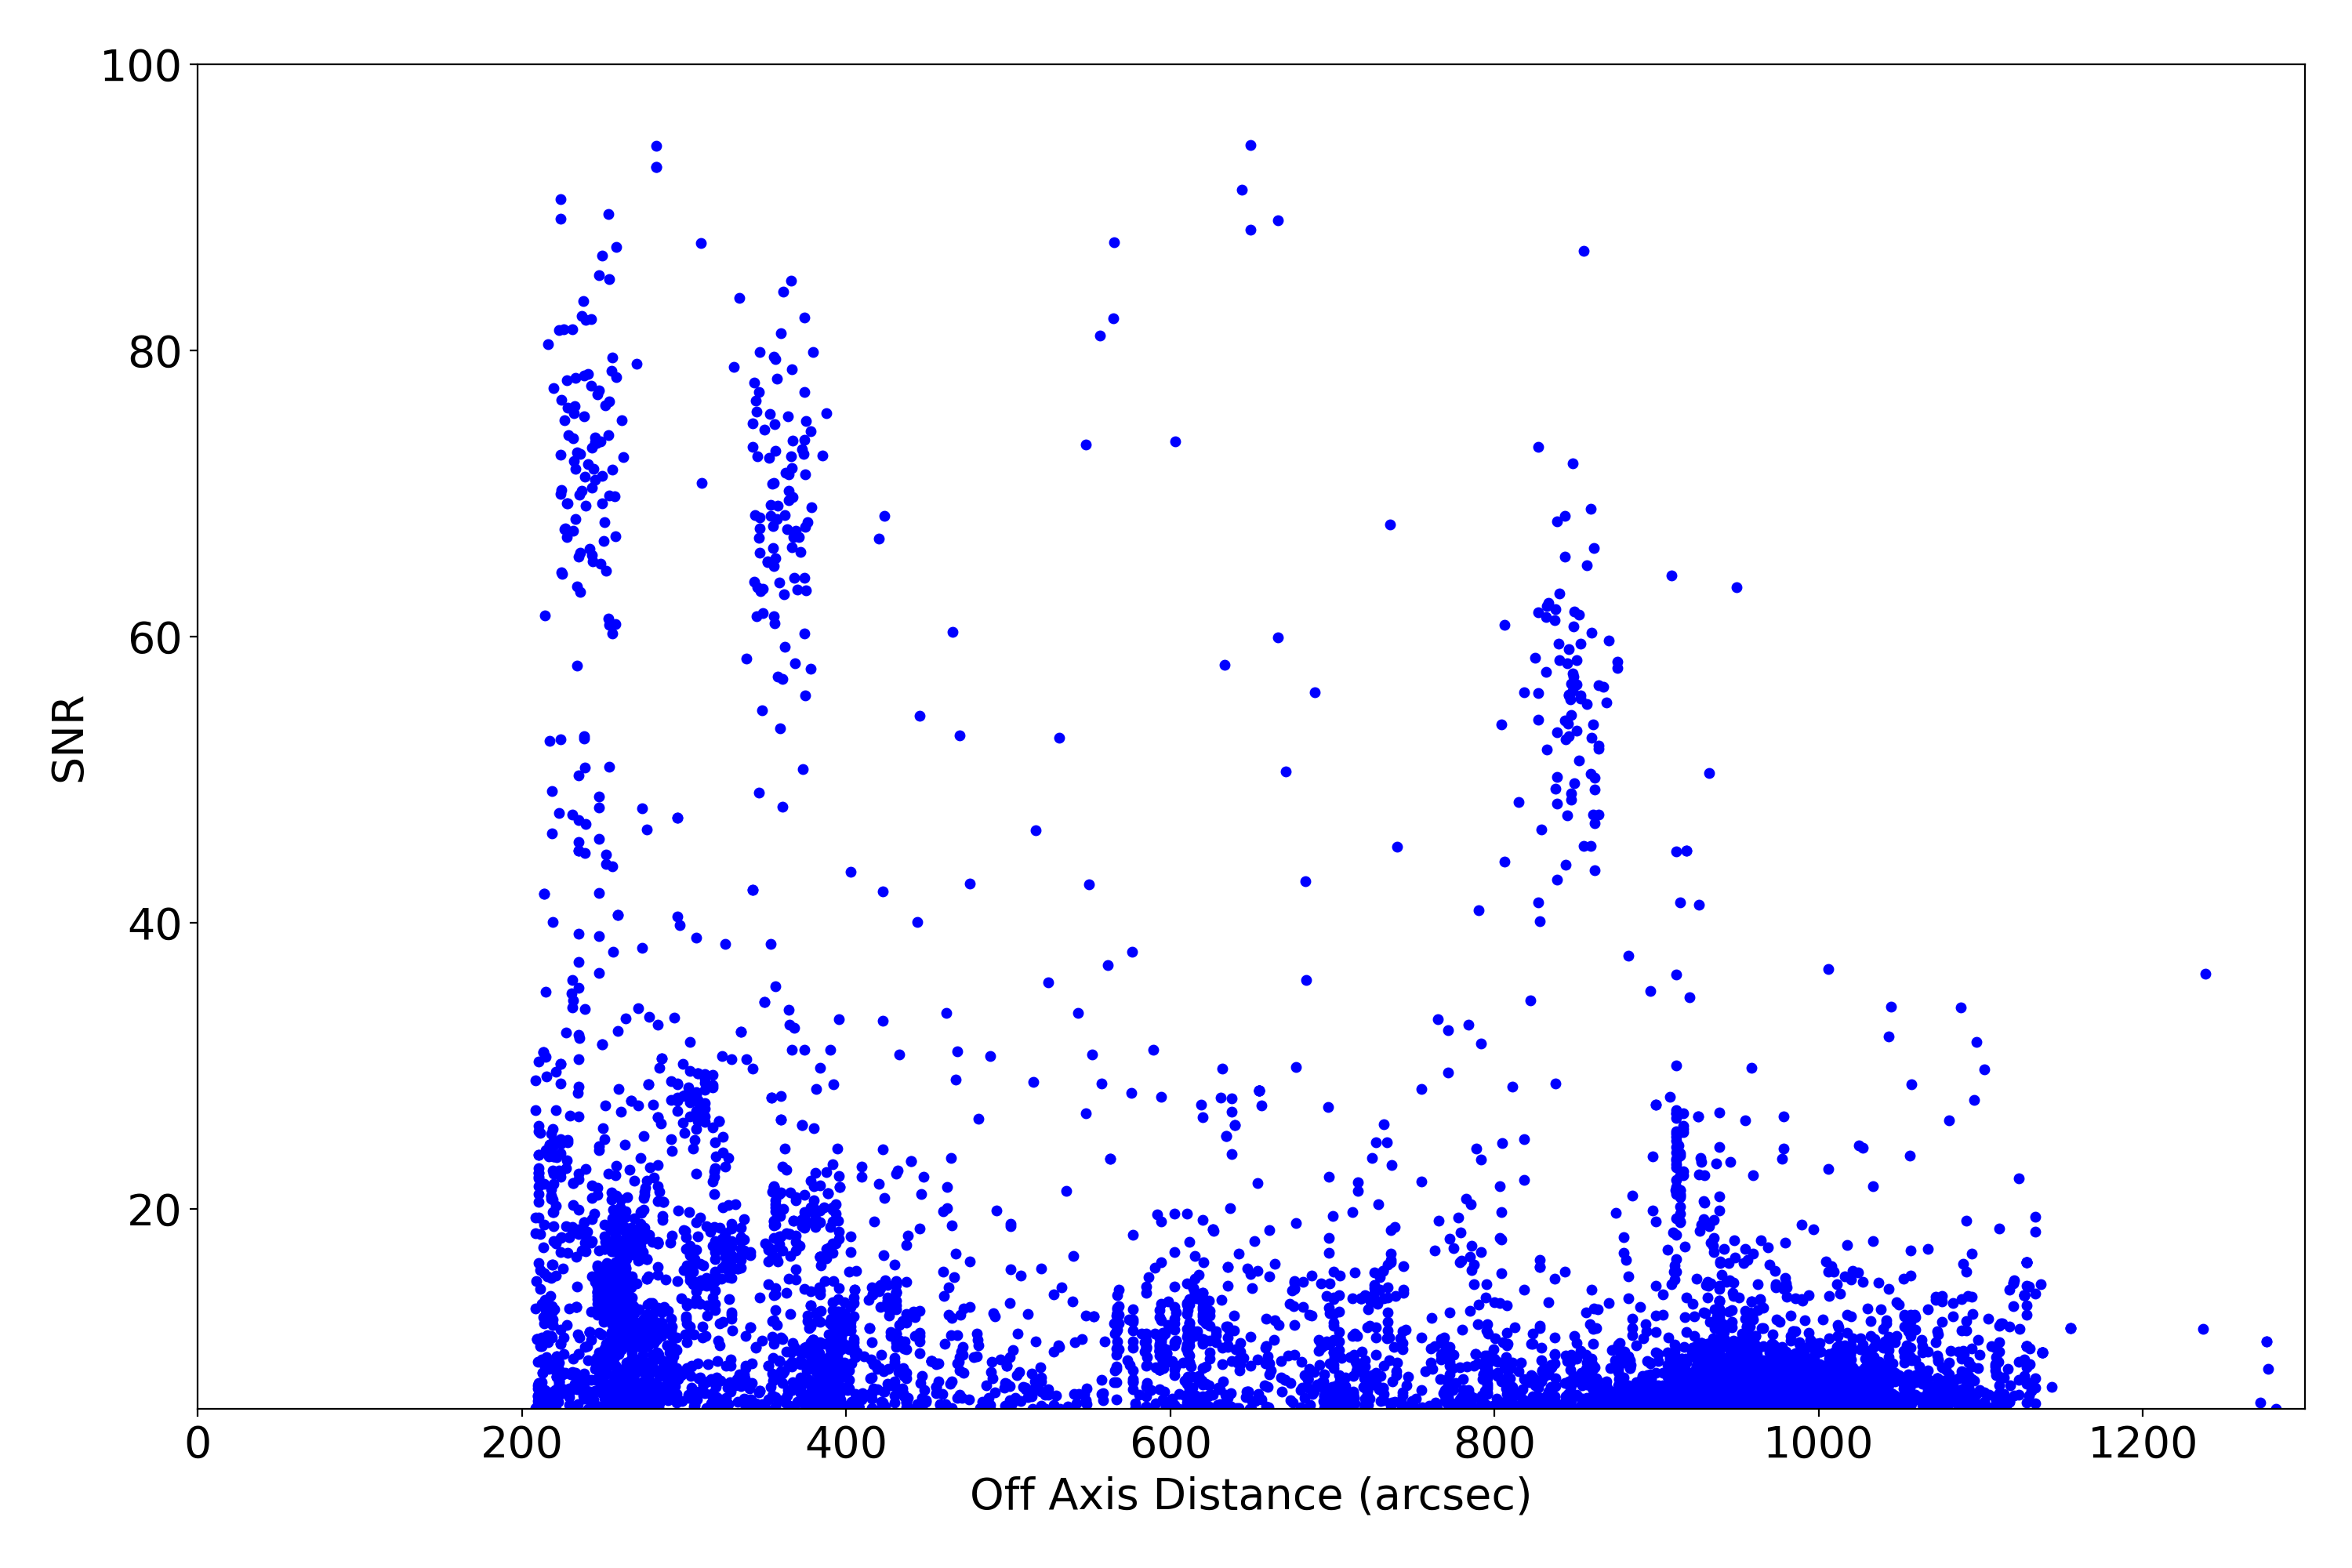
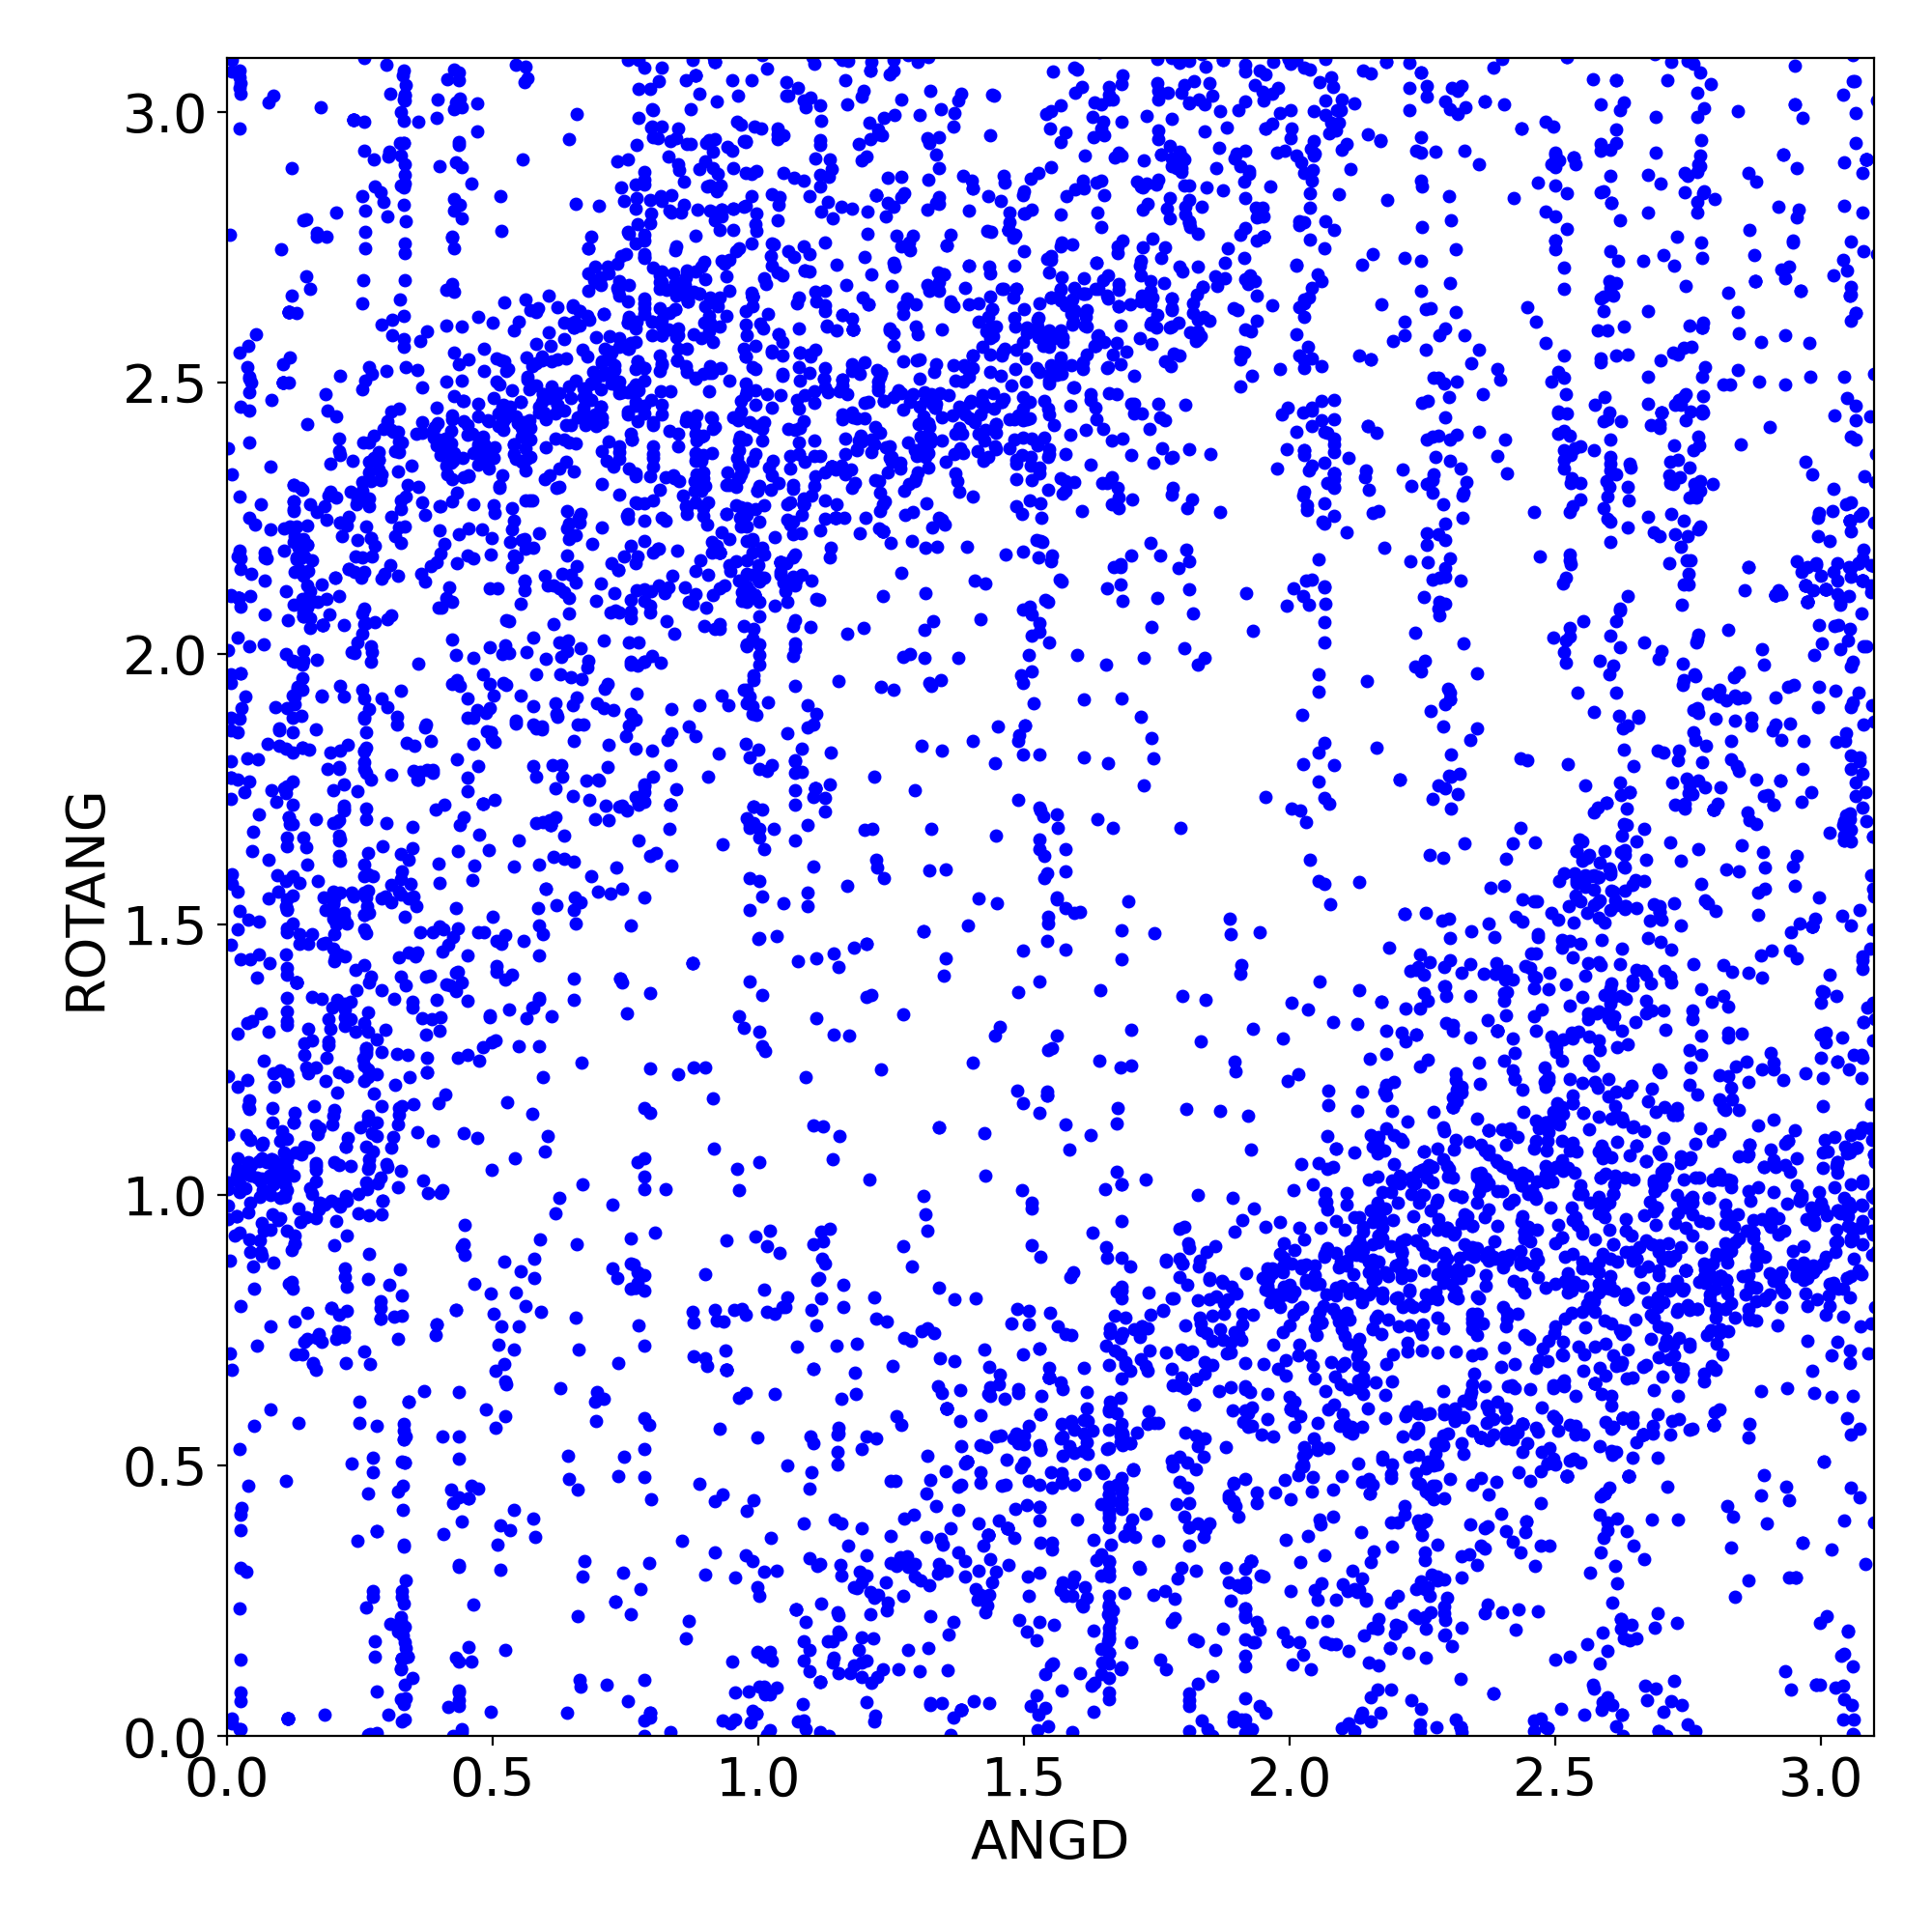
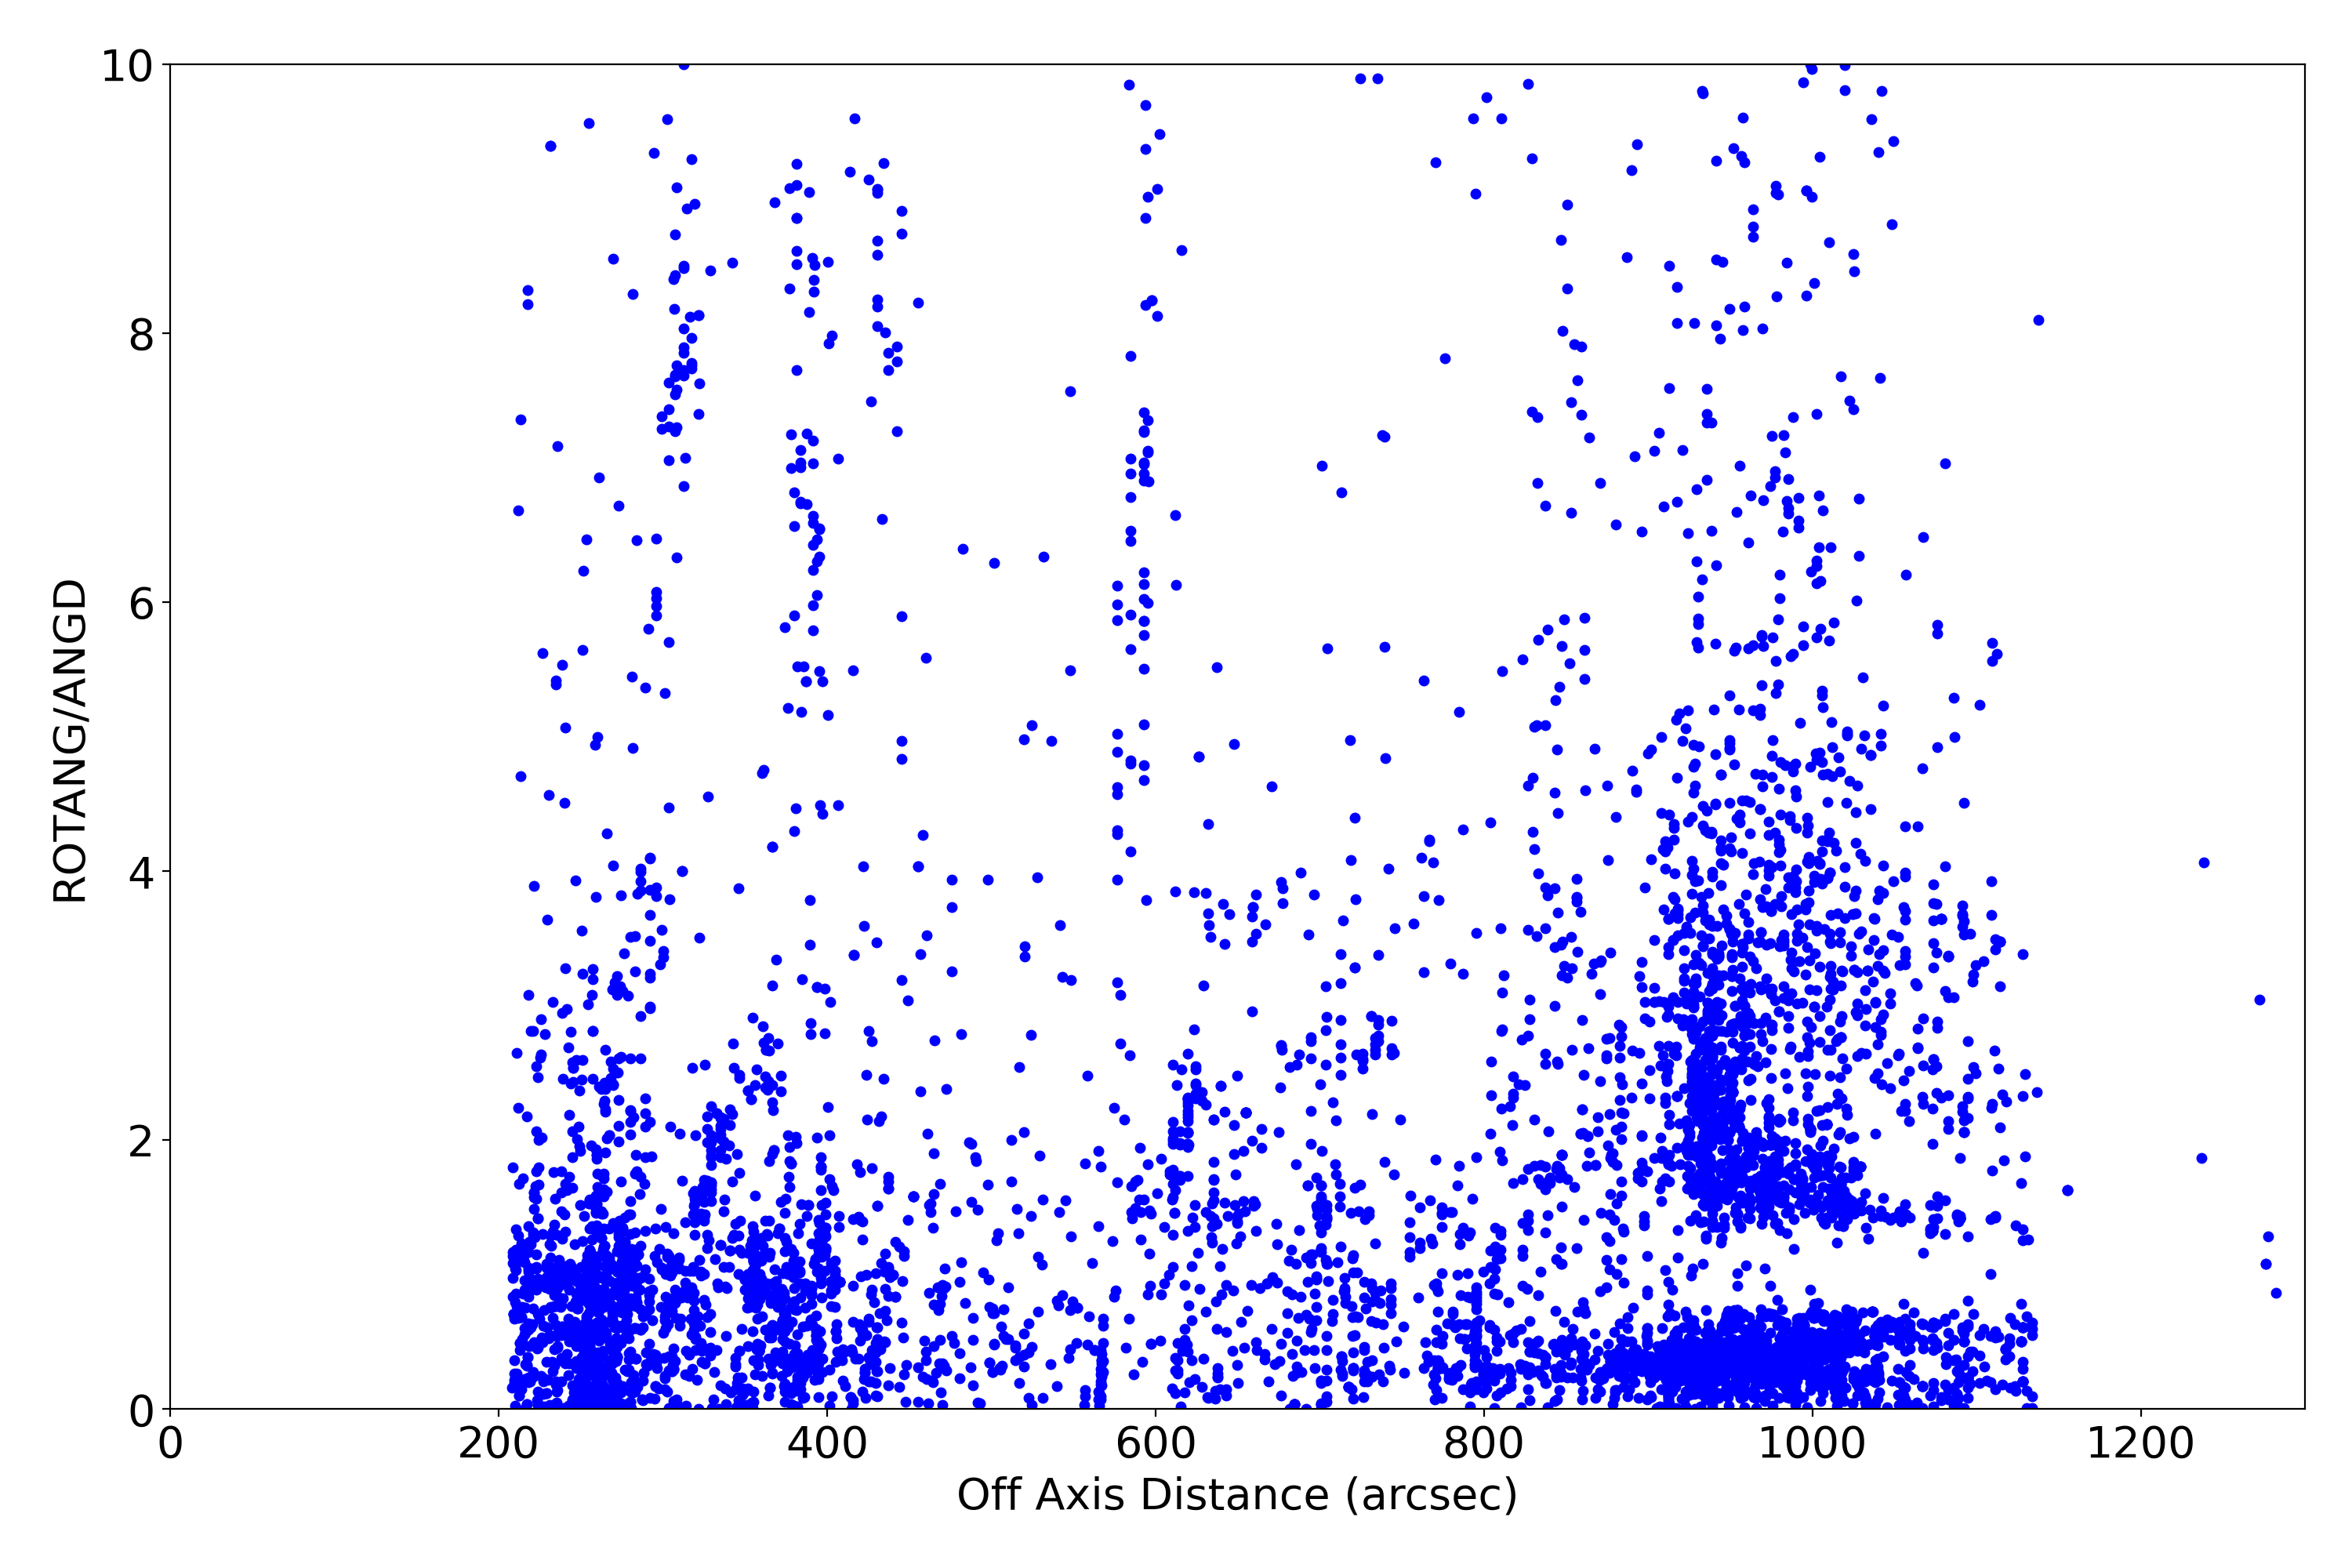
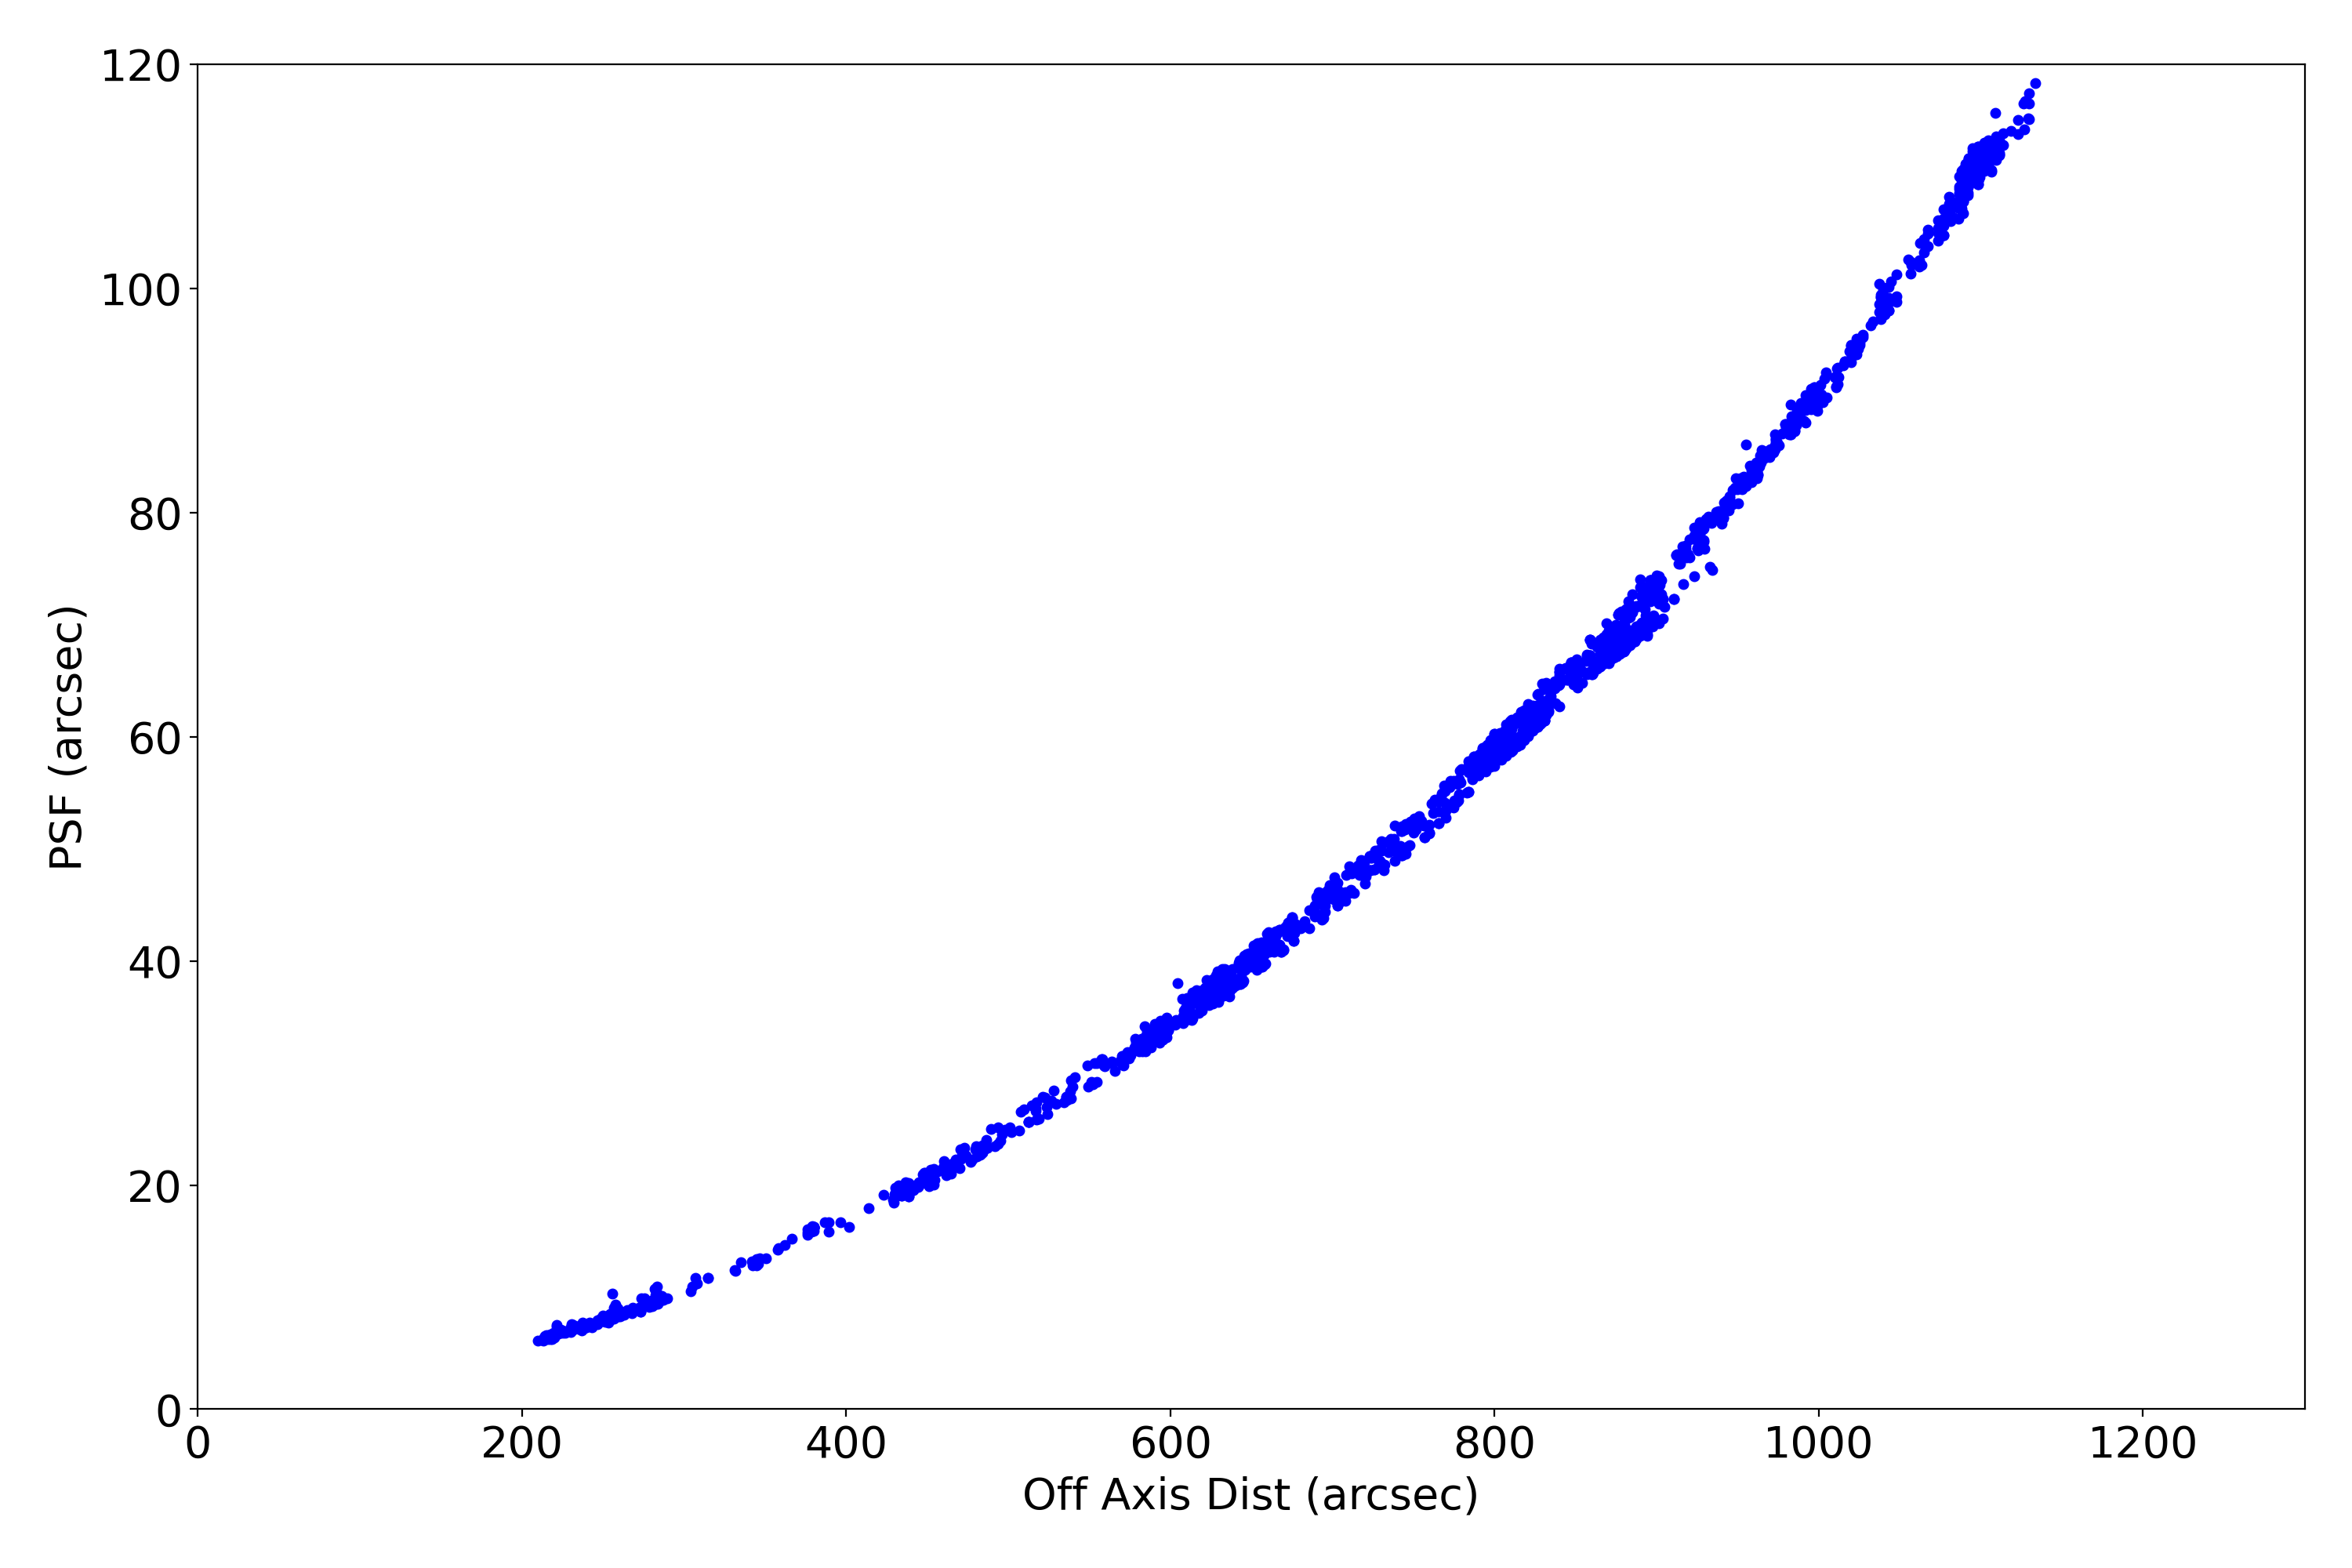
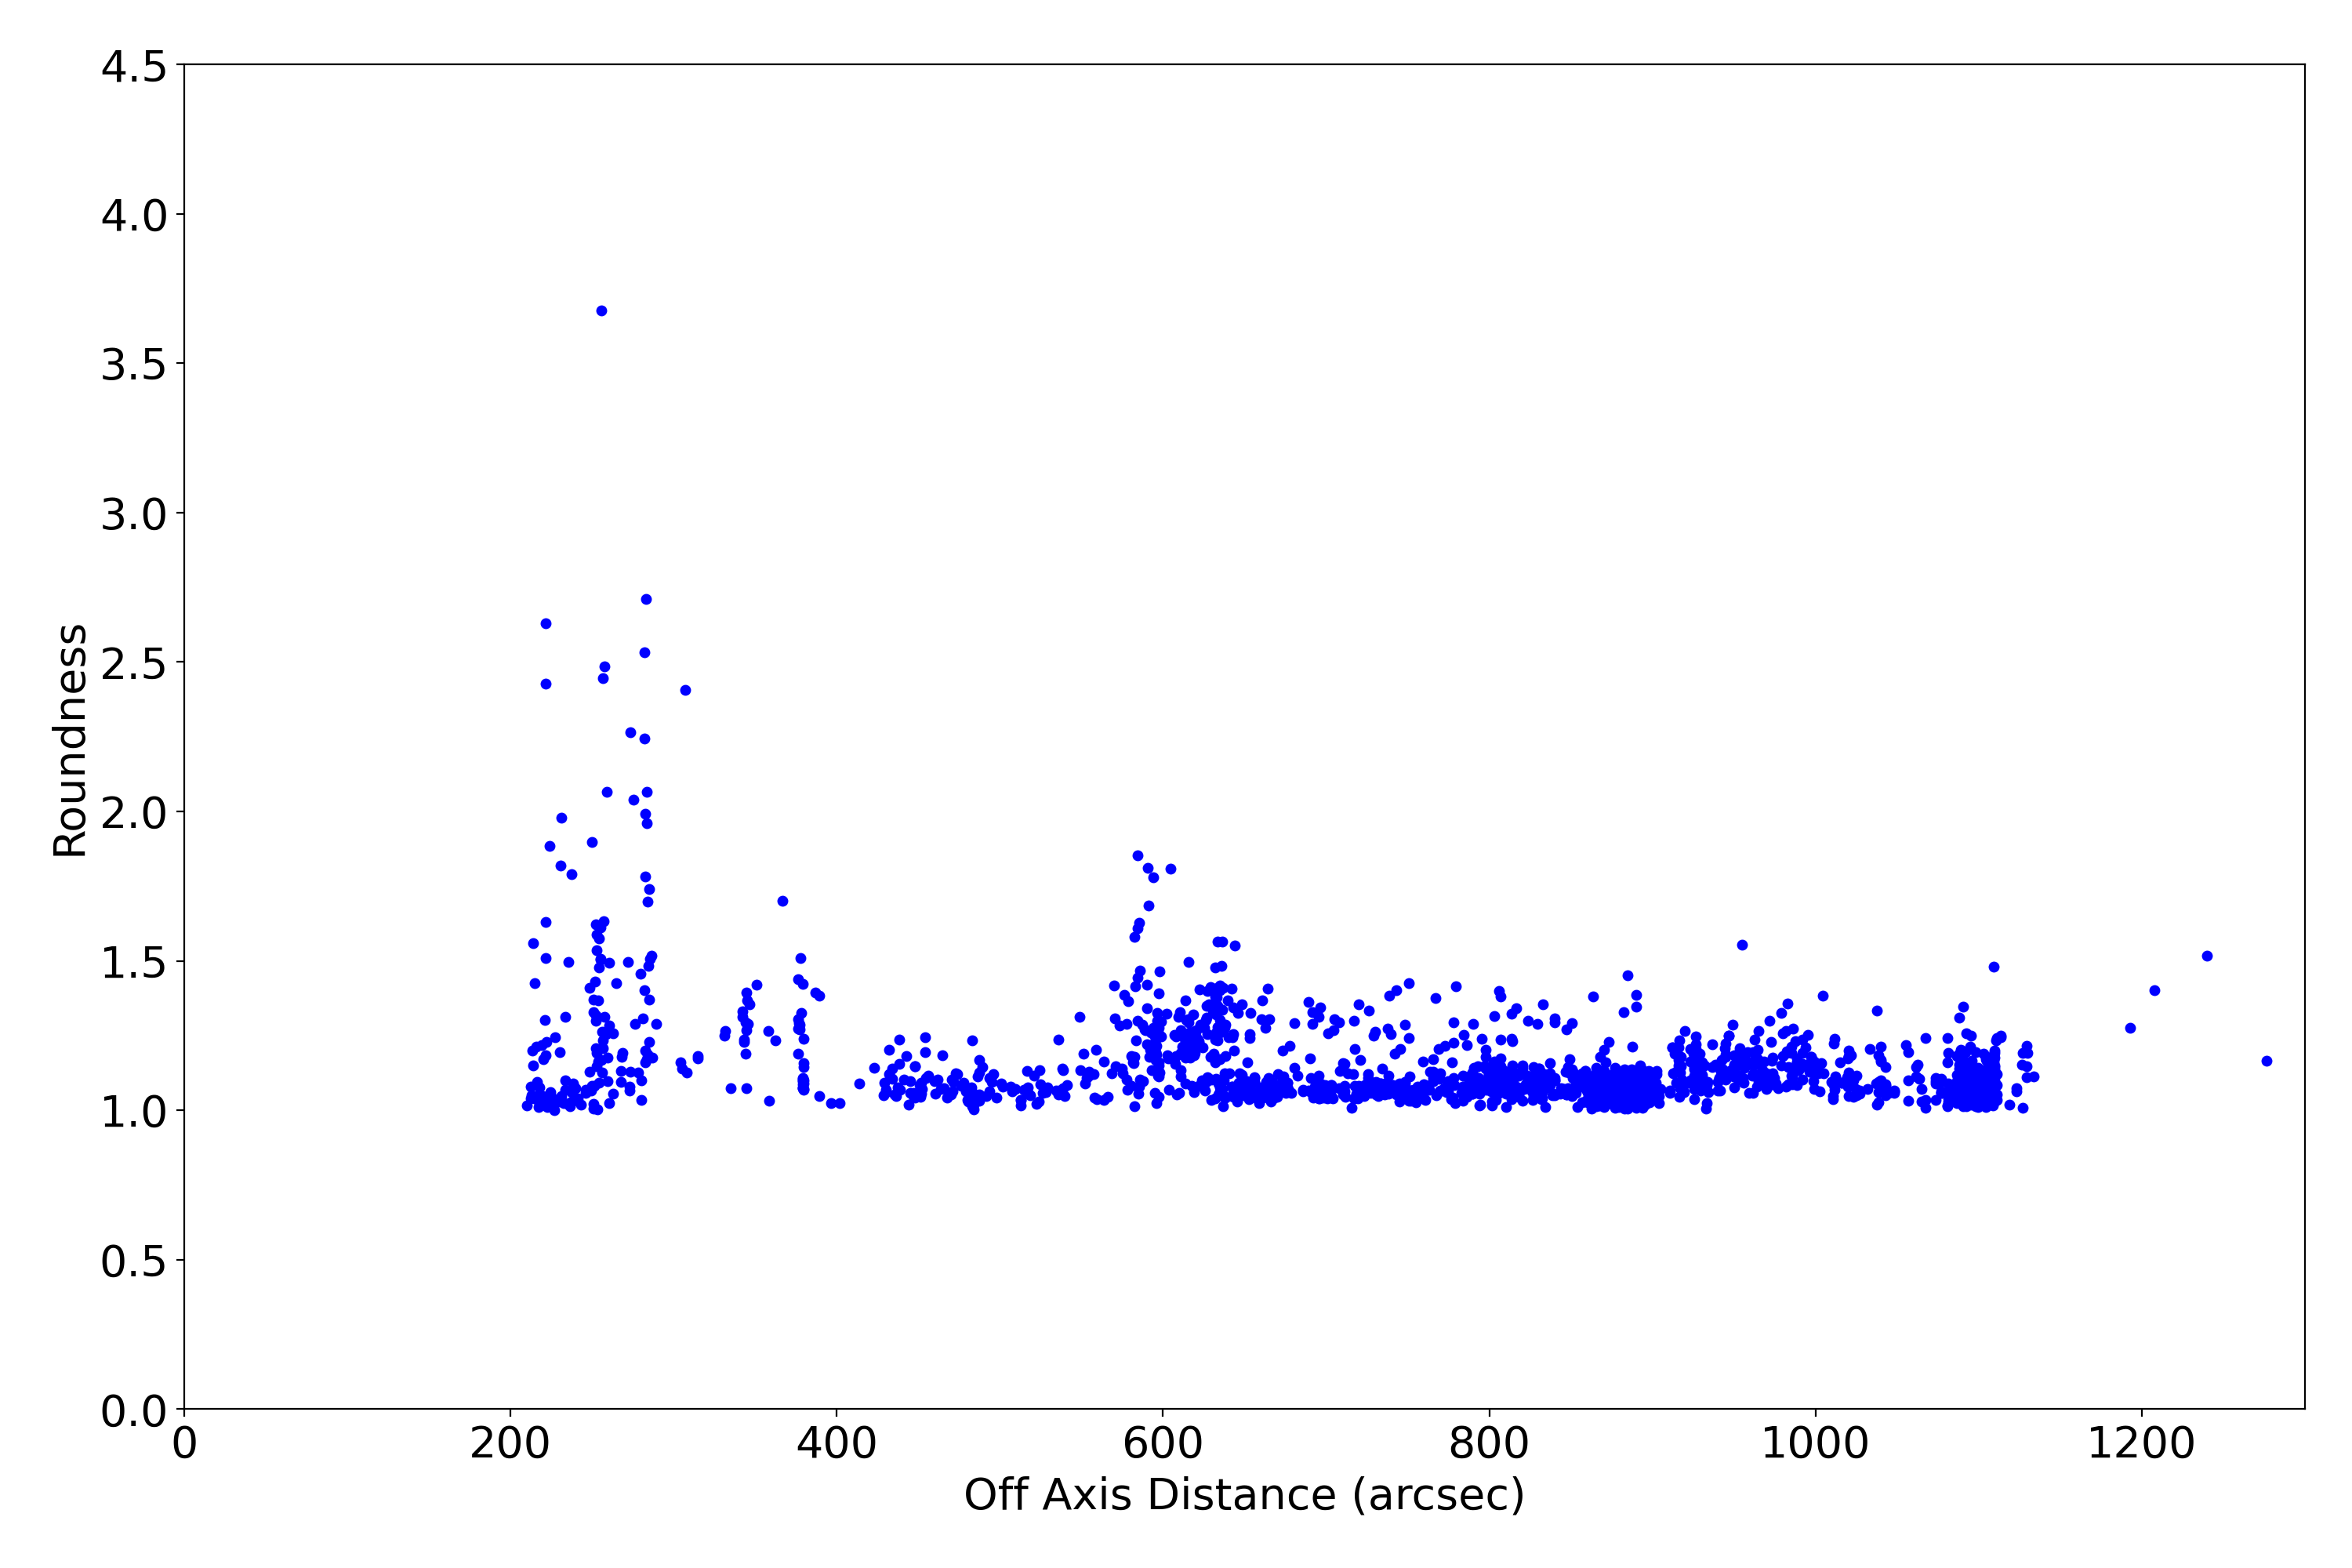
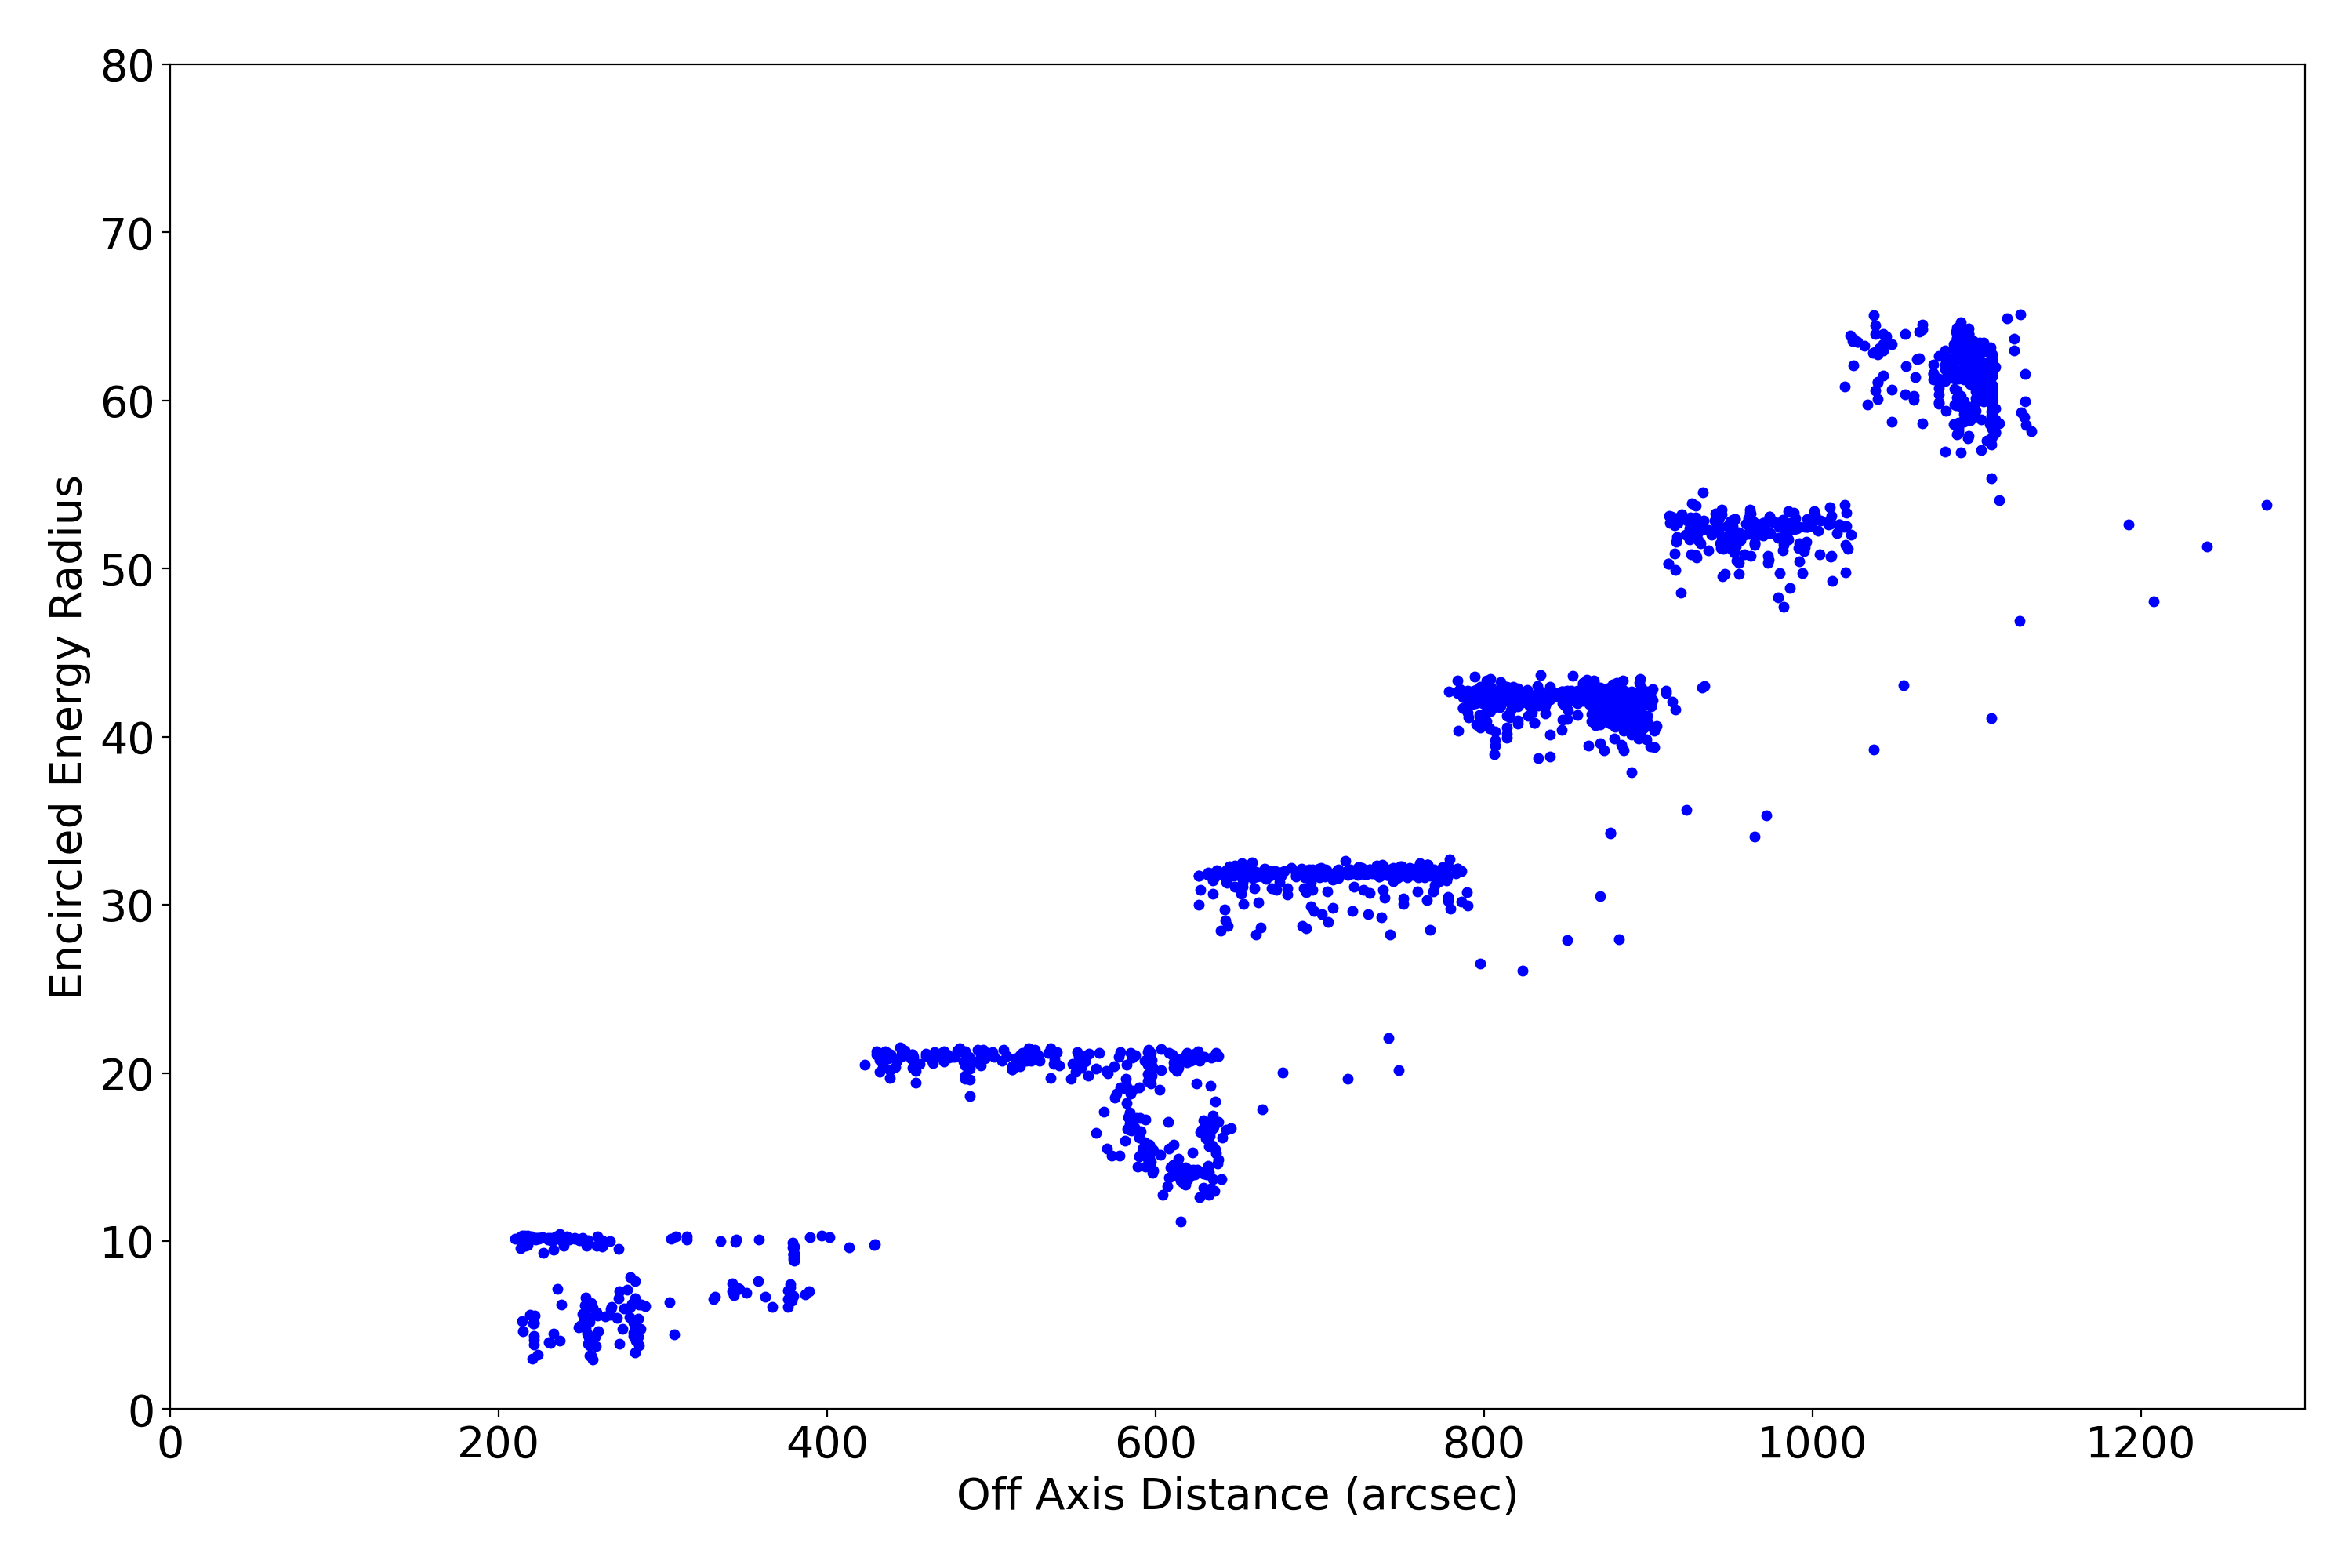
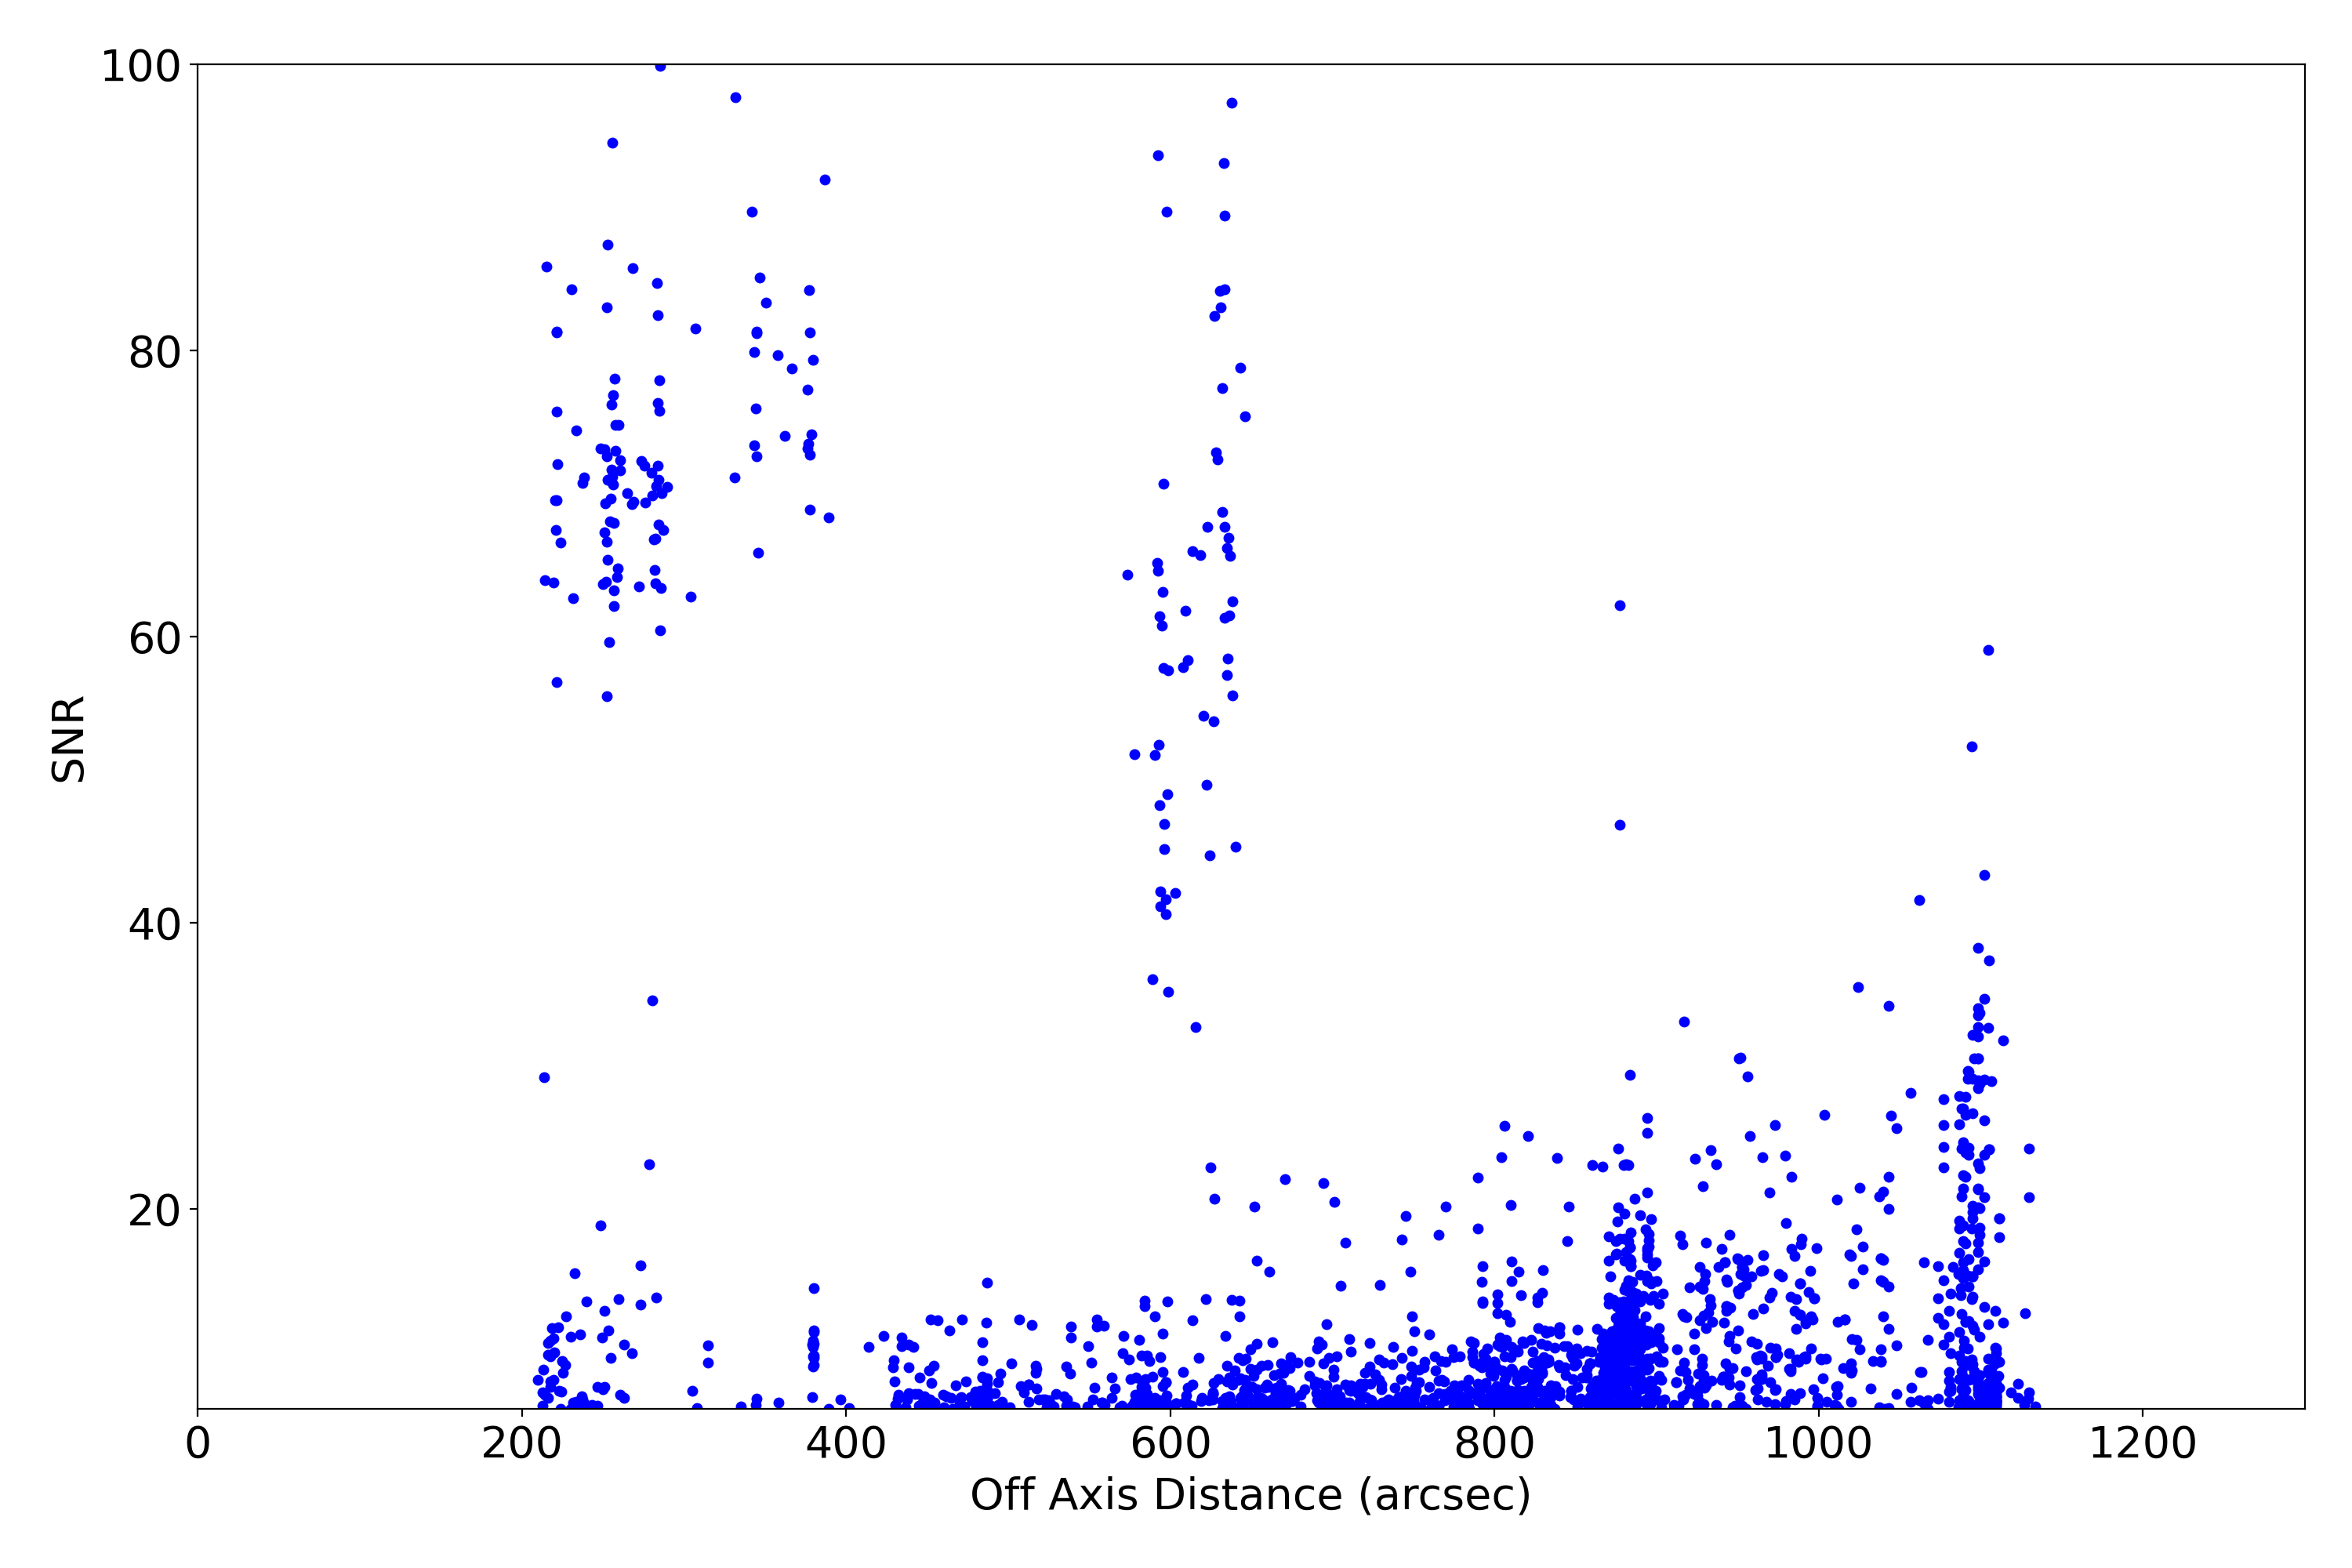
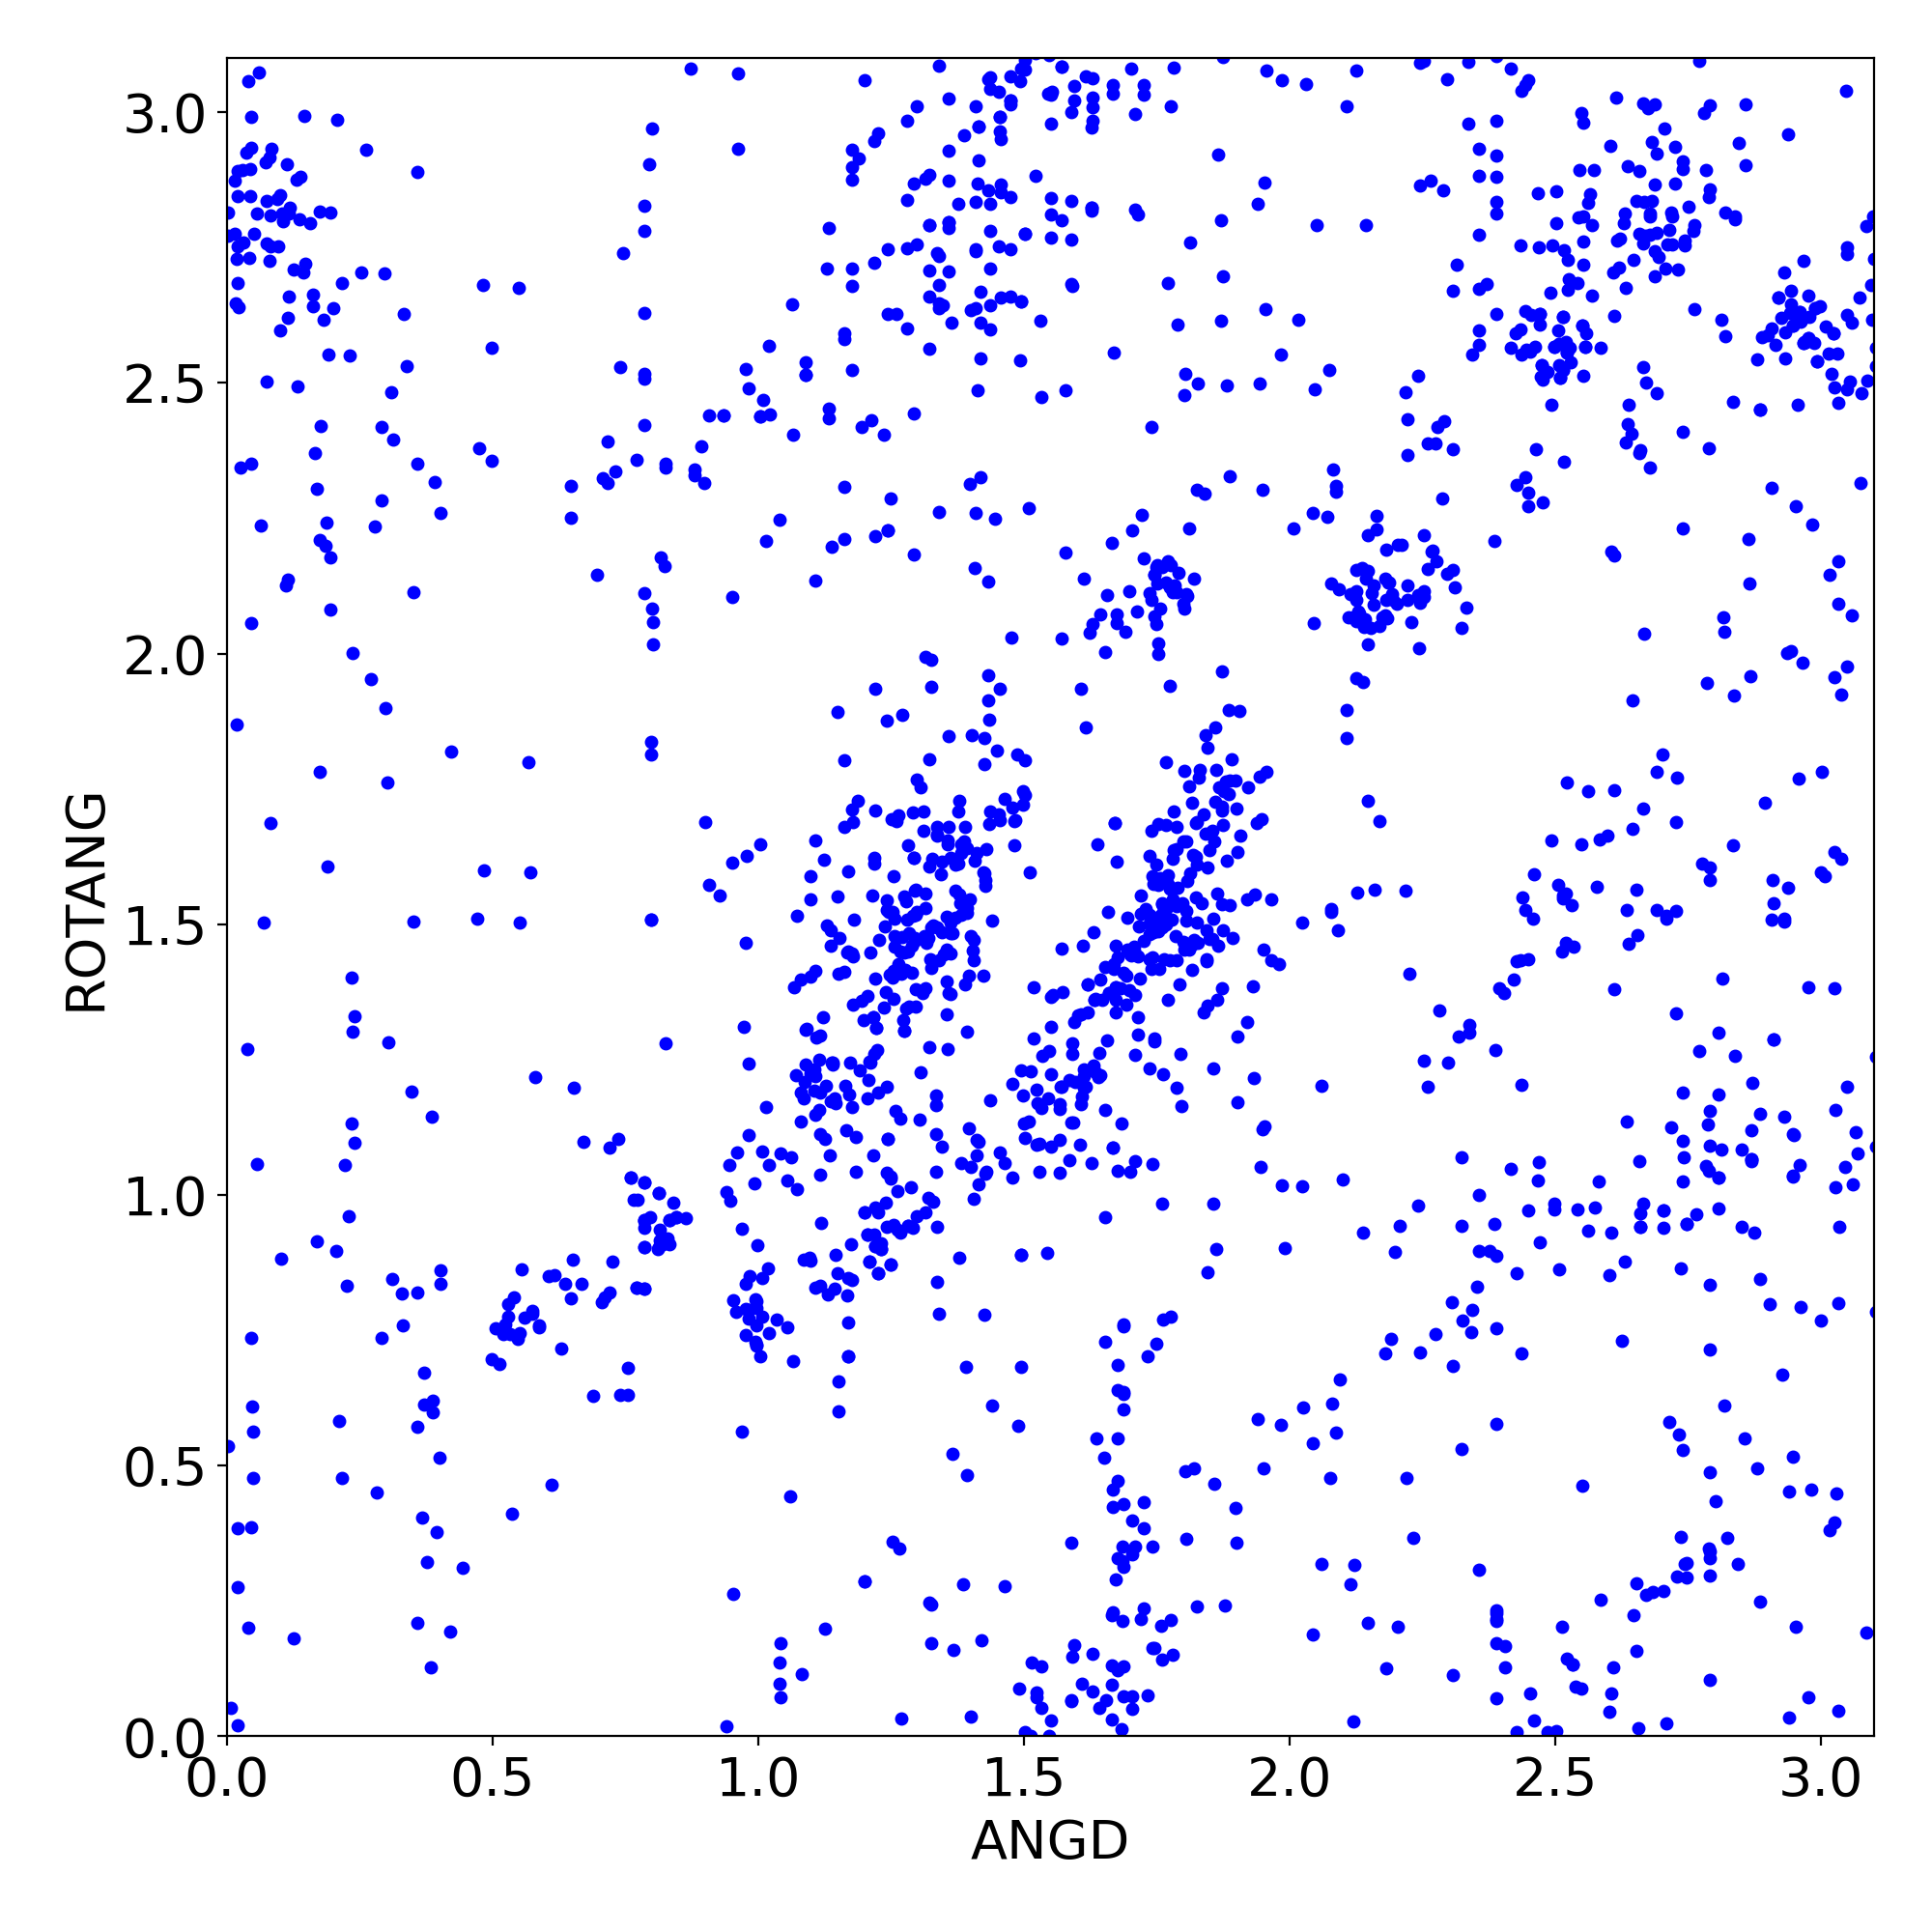
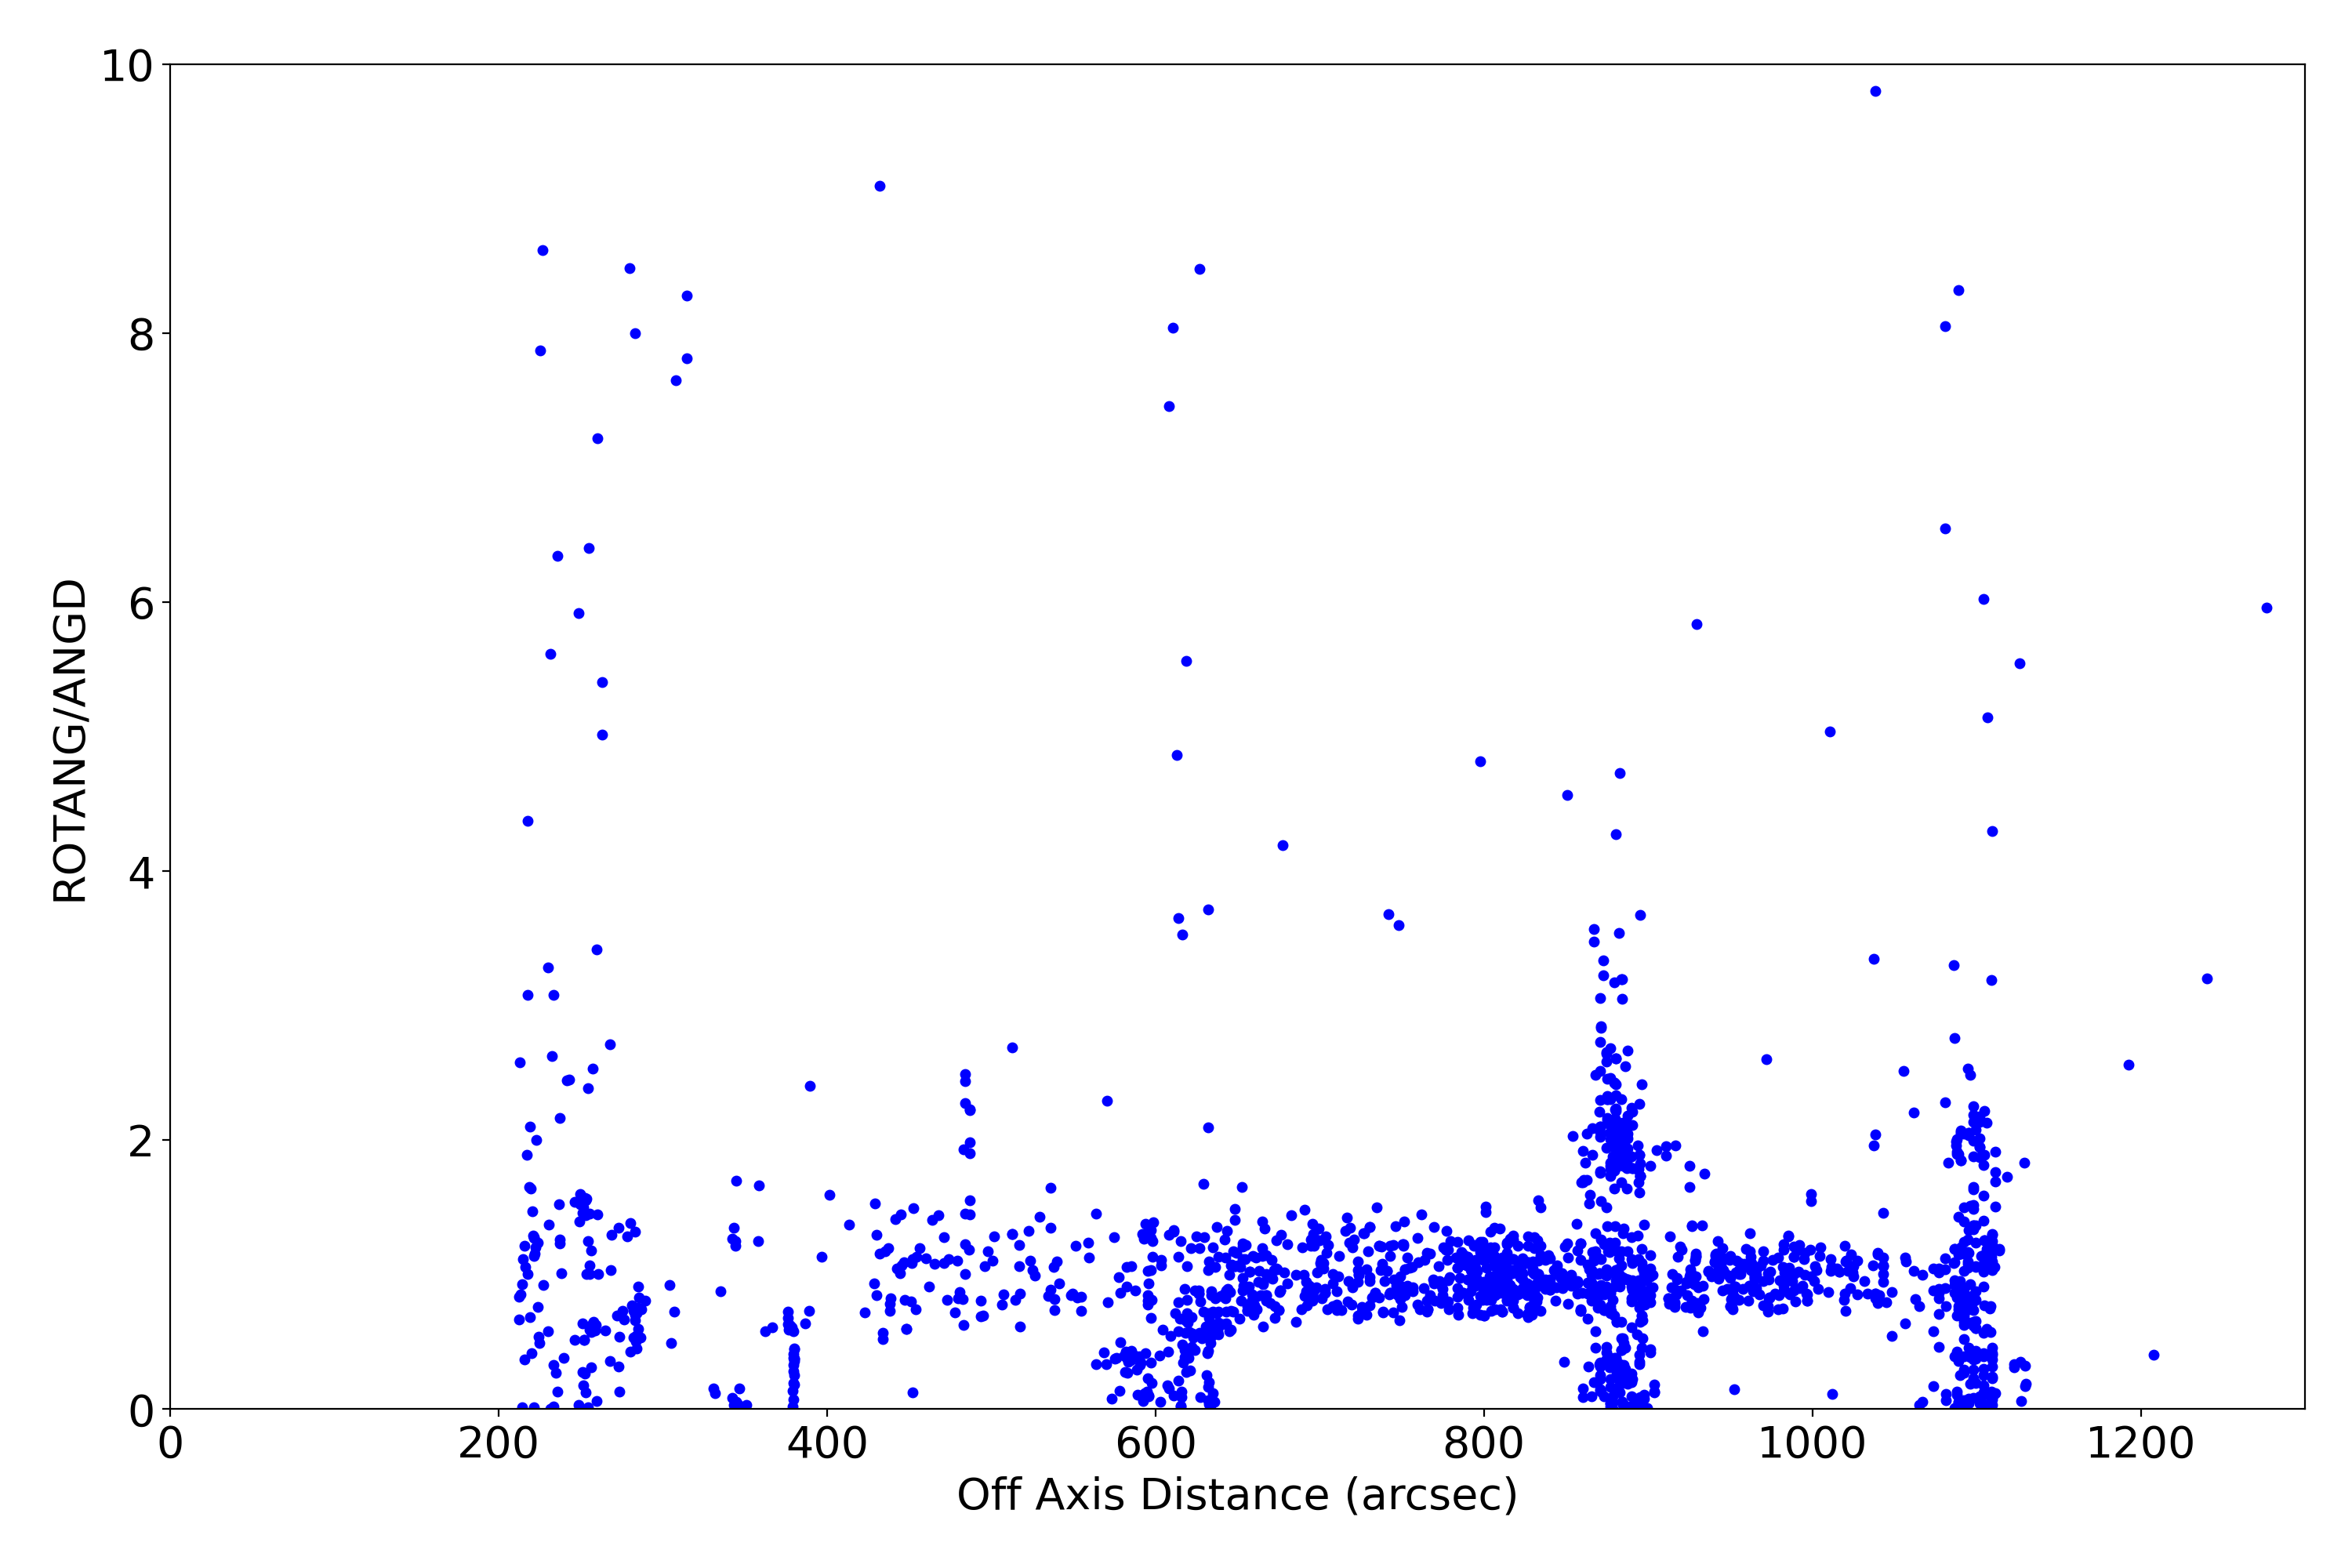
Plots below show various characteristics of detected imaging sources. Standard level 2 data products (*src2.fits) are used. Only observations with focus (sim_x) within 0.01 mm of nominal value for given SI configuration are used. Sources are also filtered for strength (SNR > 15).
| XY | PSF | Roundness | EE Radius | SNR | Rotation | Rotation2 | |
|---|---|---|---|---|---|---|---|
| ACIS I | 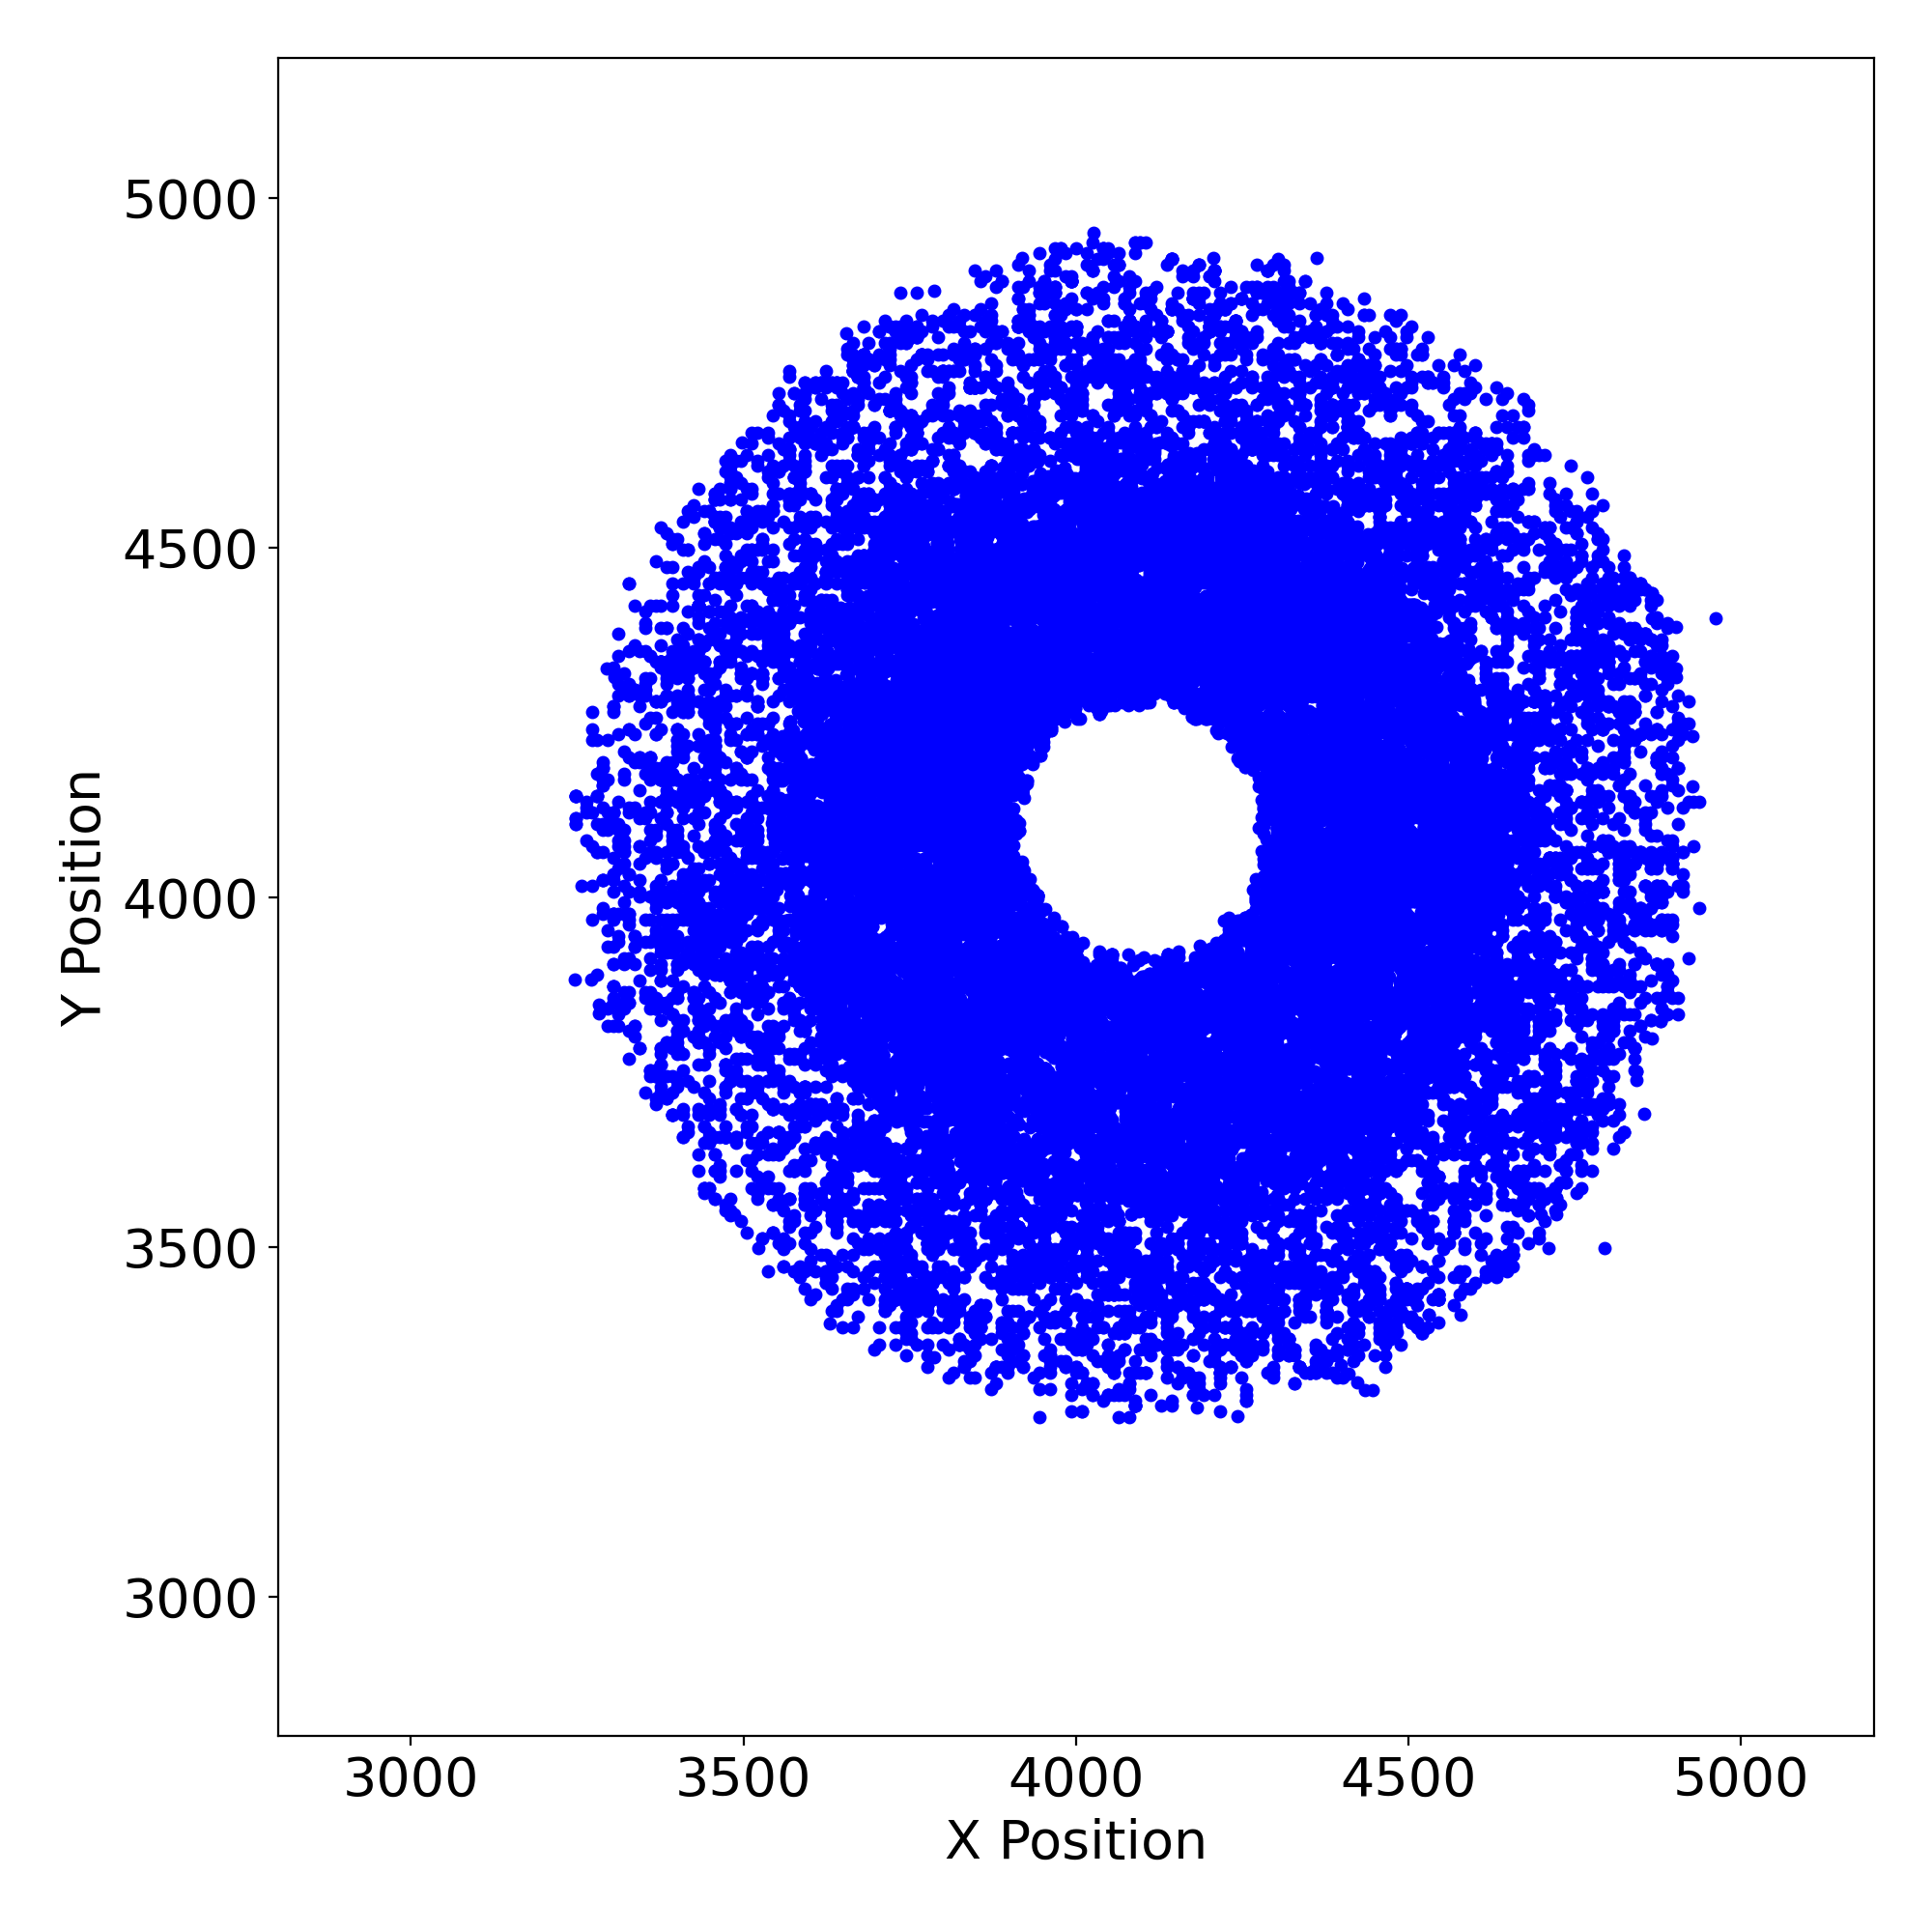 |
 |
 |
 |
 |
 |
 |
| ACIS S | 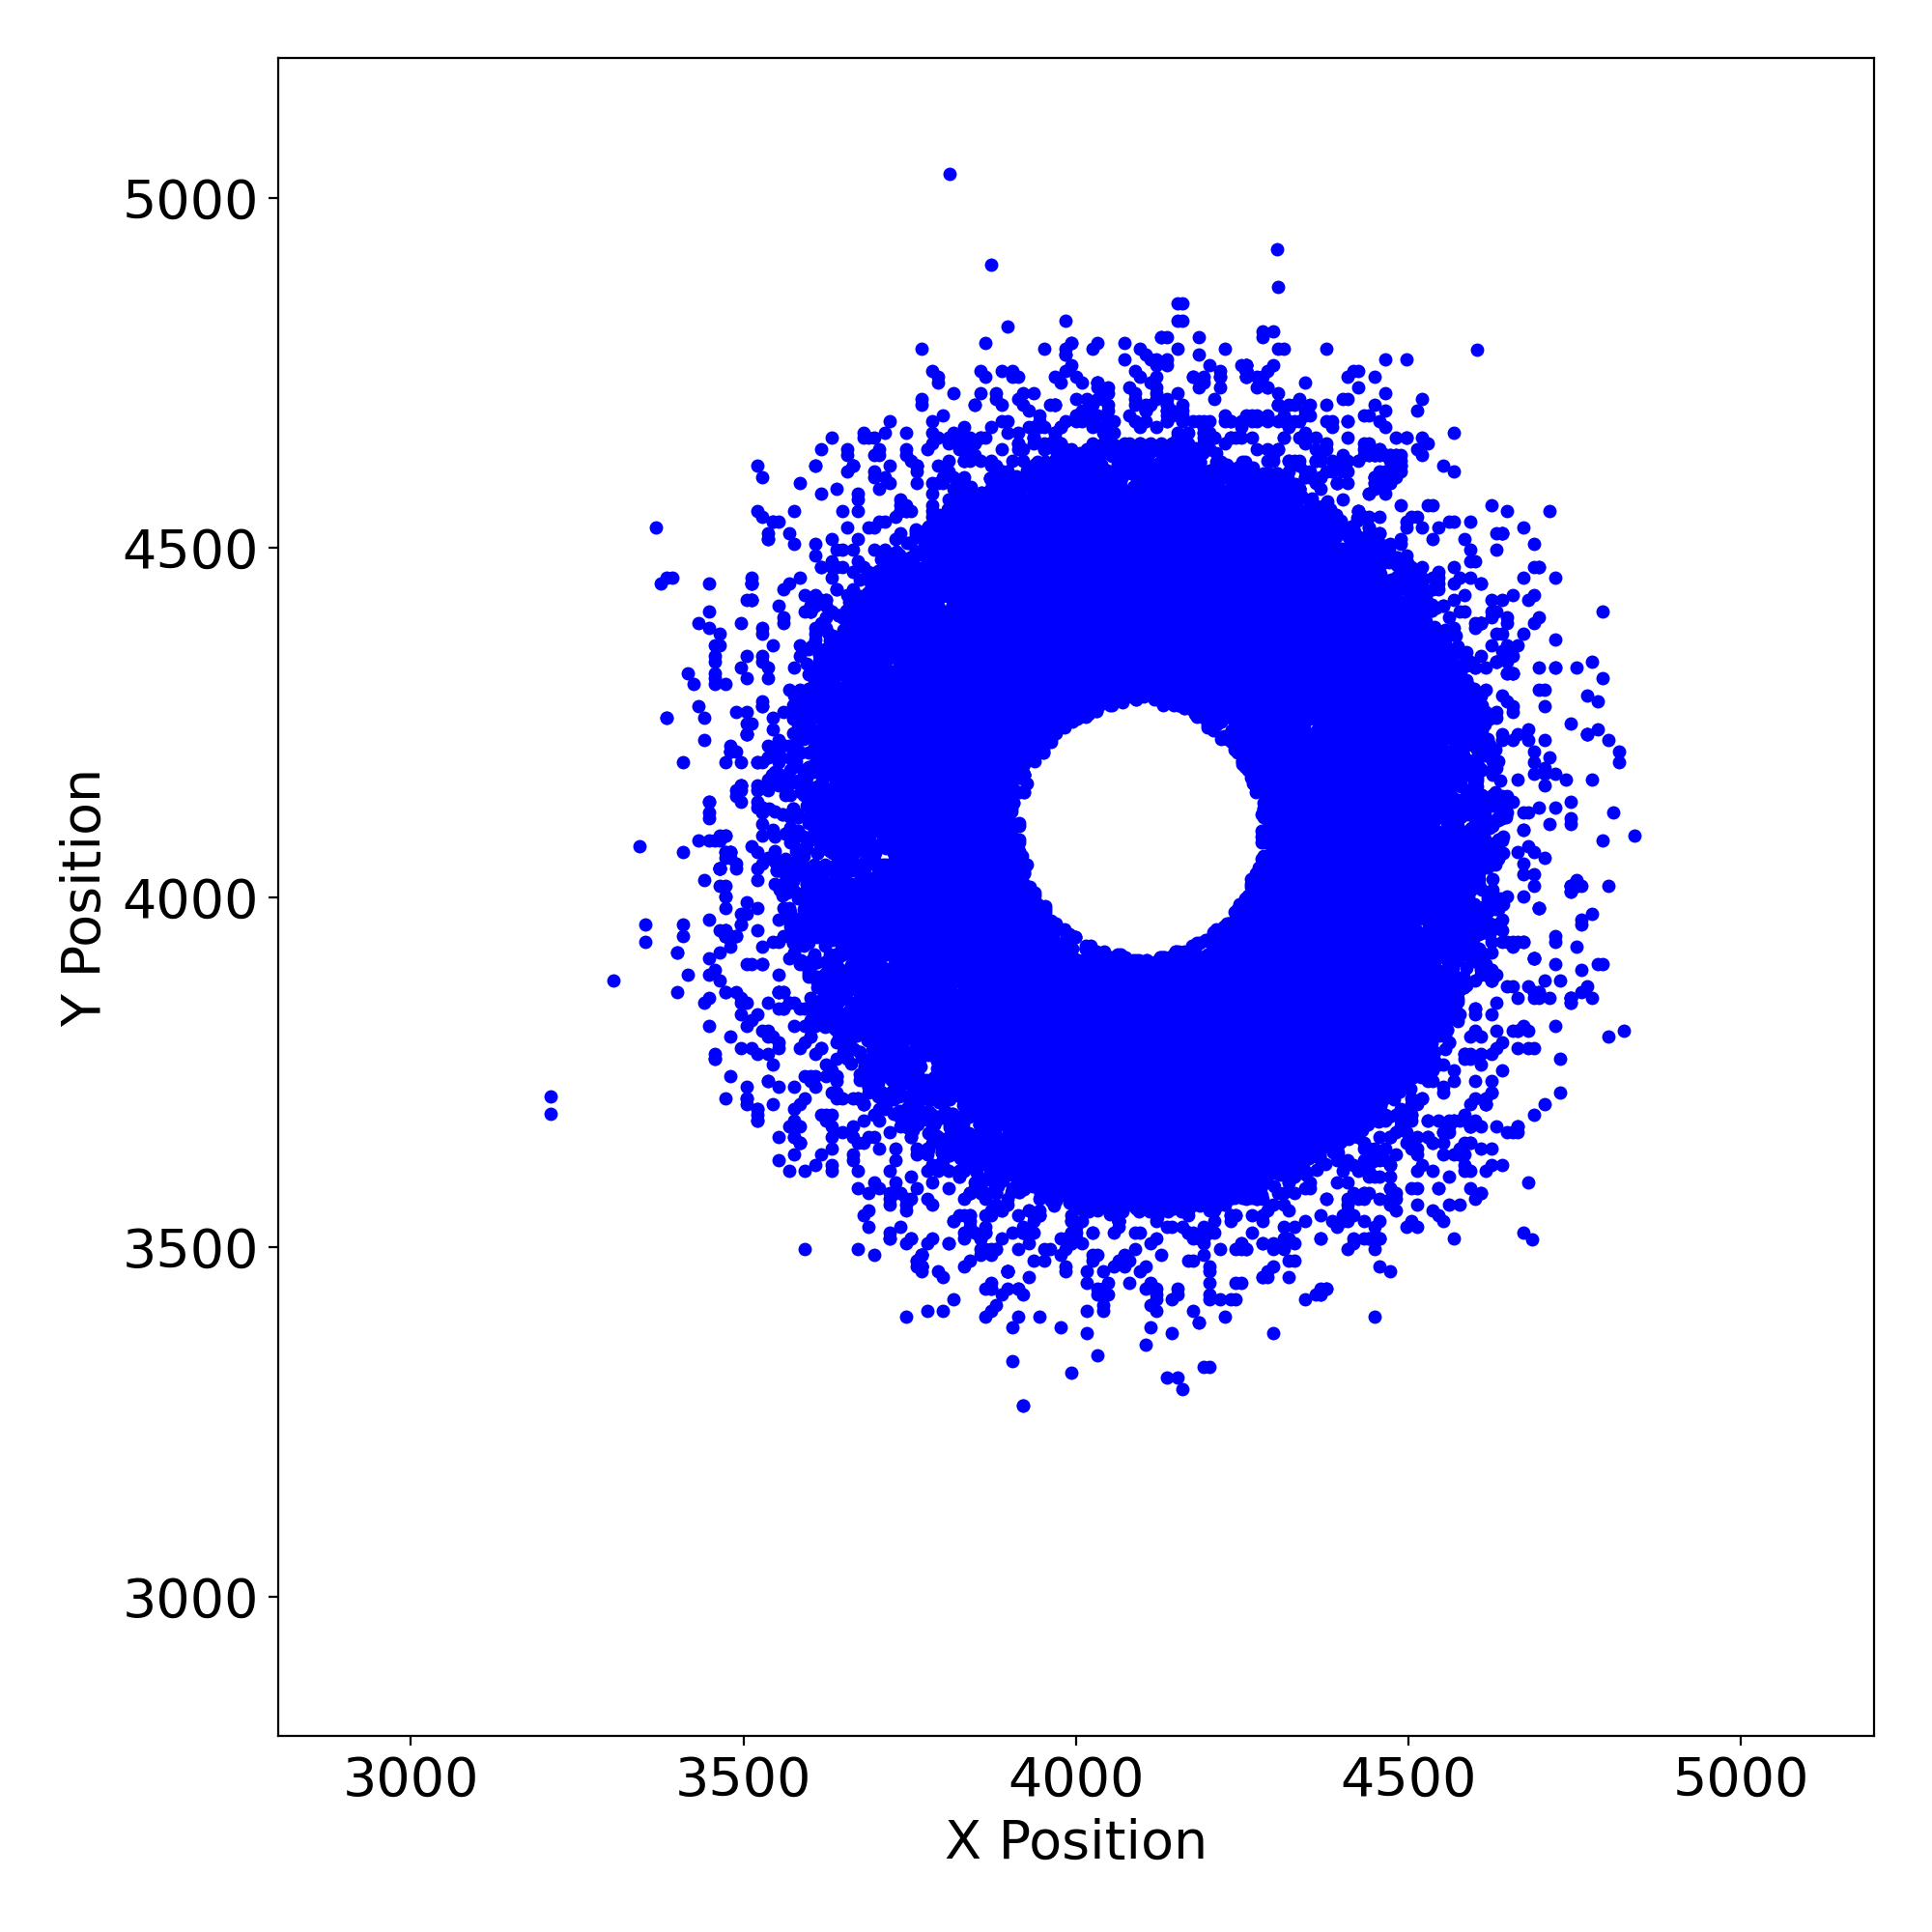 |
 |
 |
 |
 |
 |
 |
| HRC I | 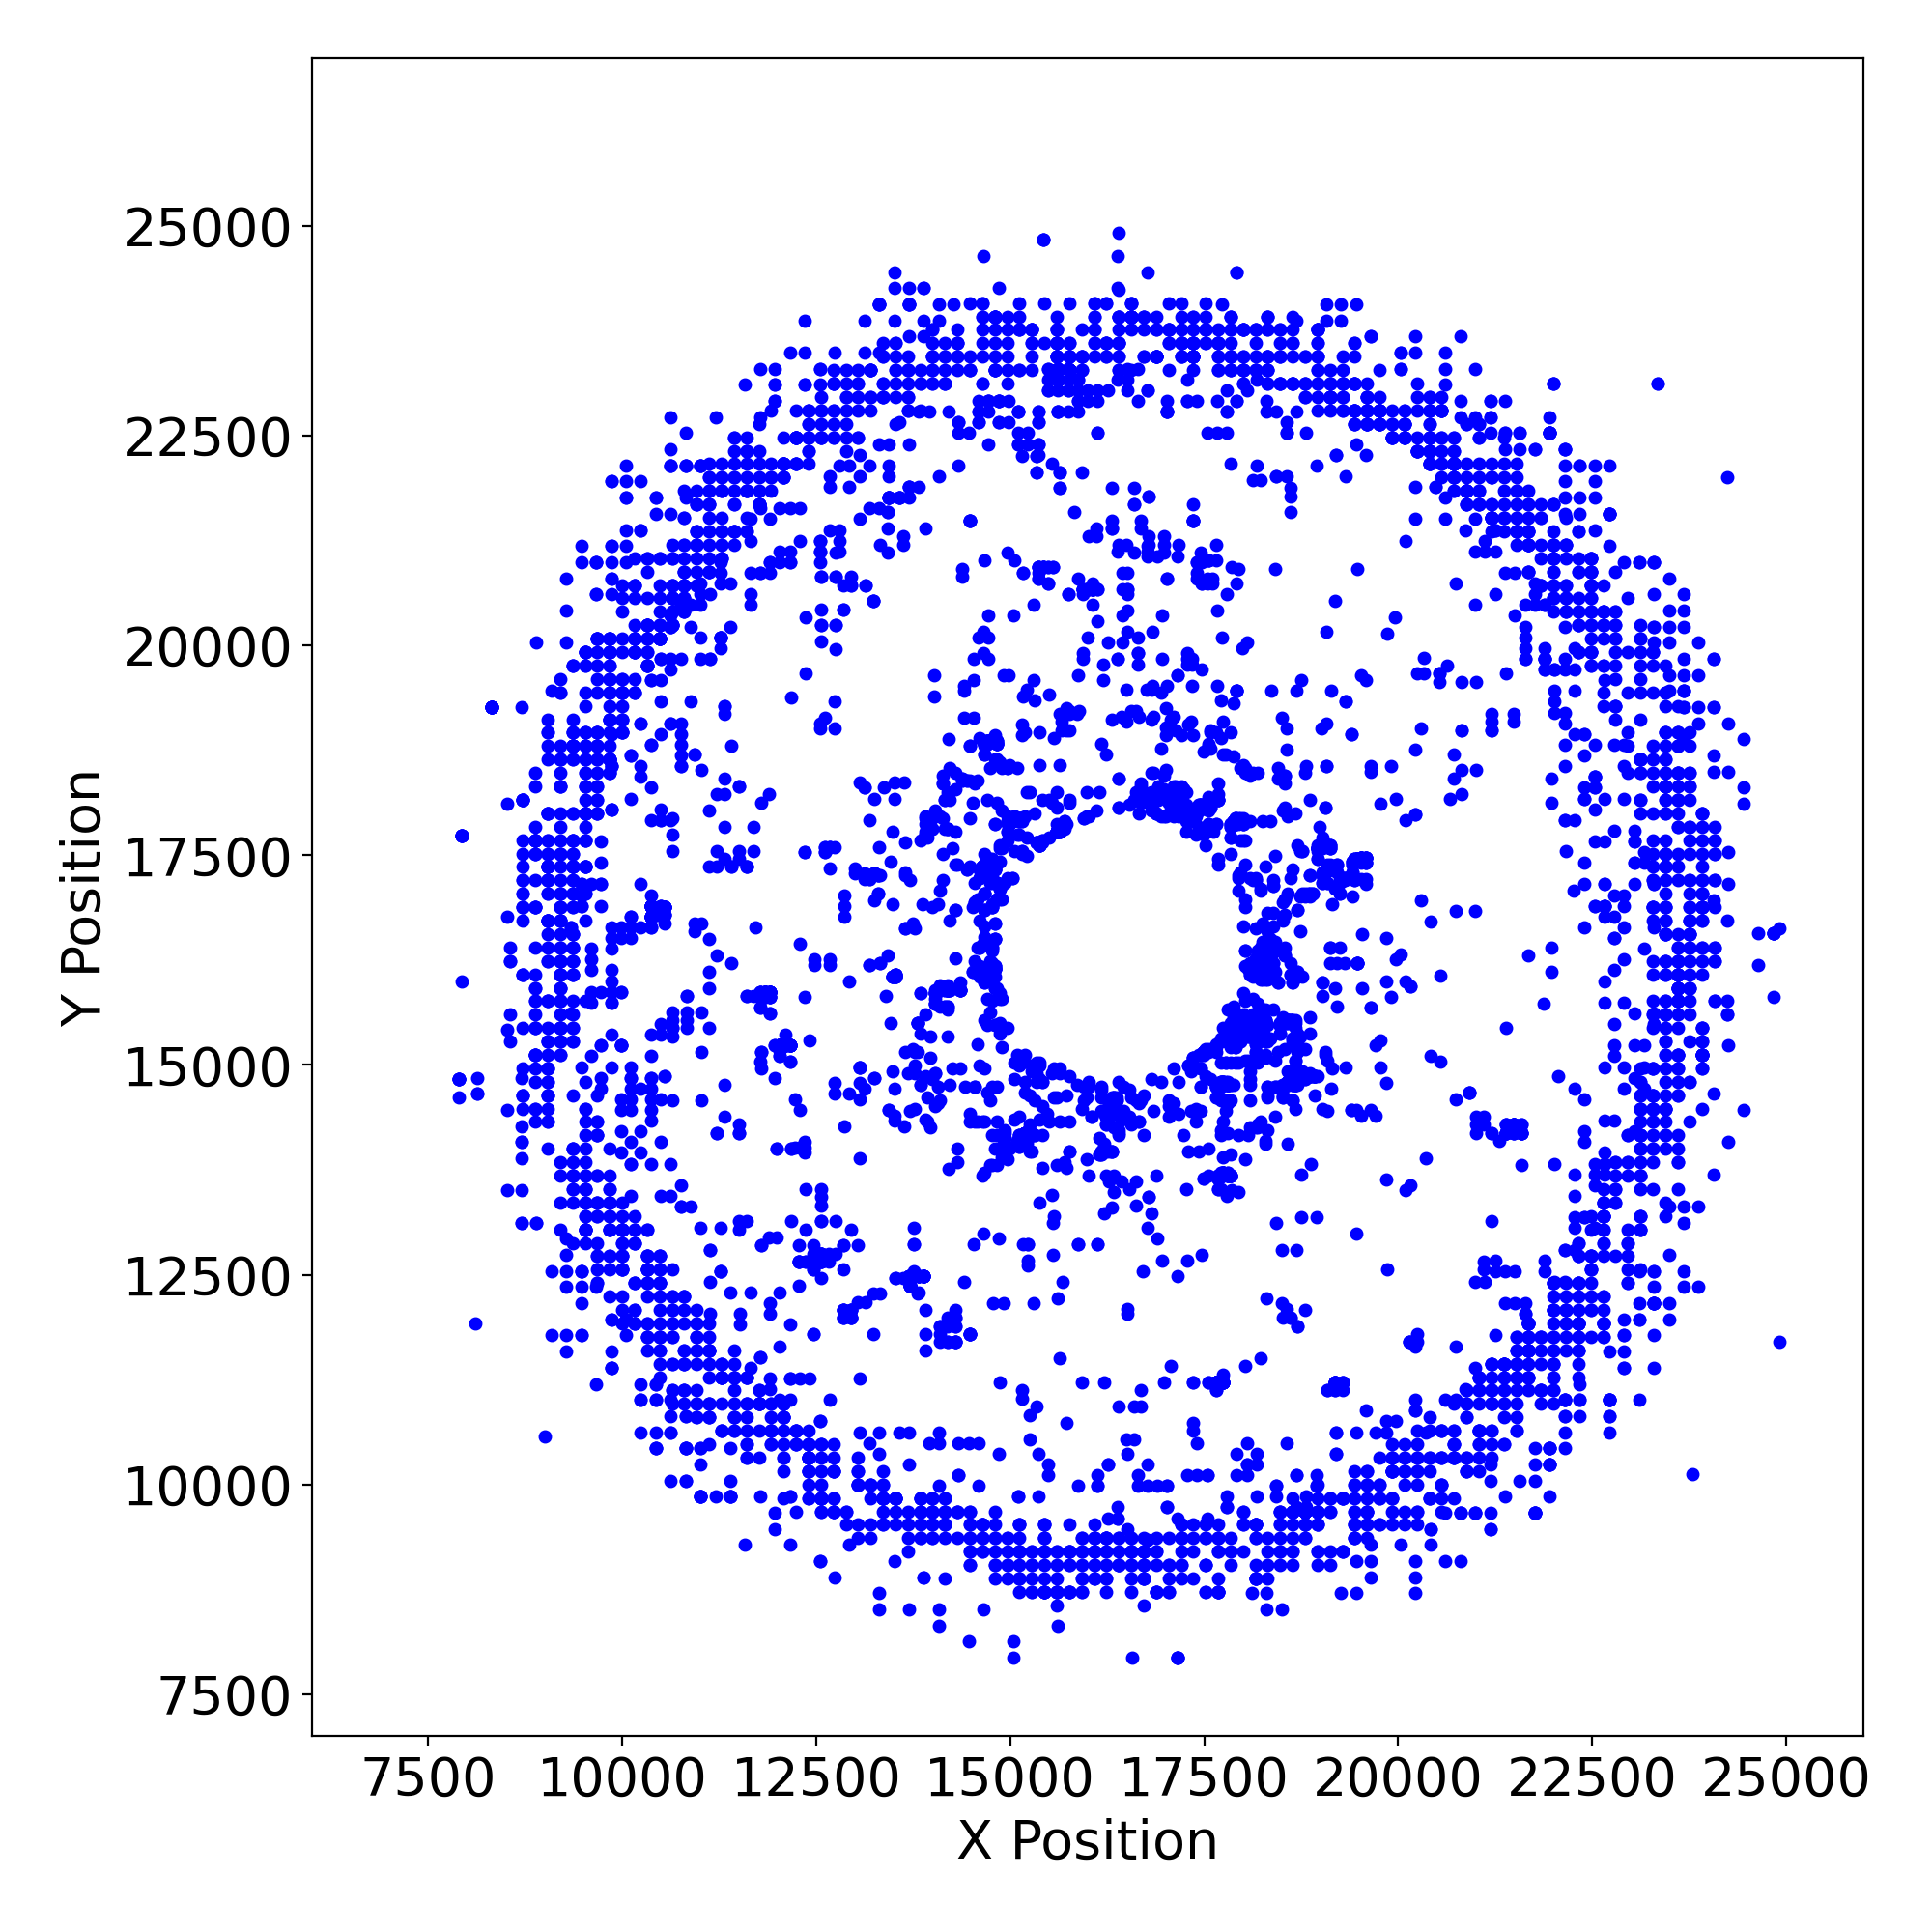 |
 |
 |
 |
 |
 |
 |
| HRC S | 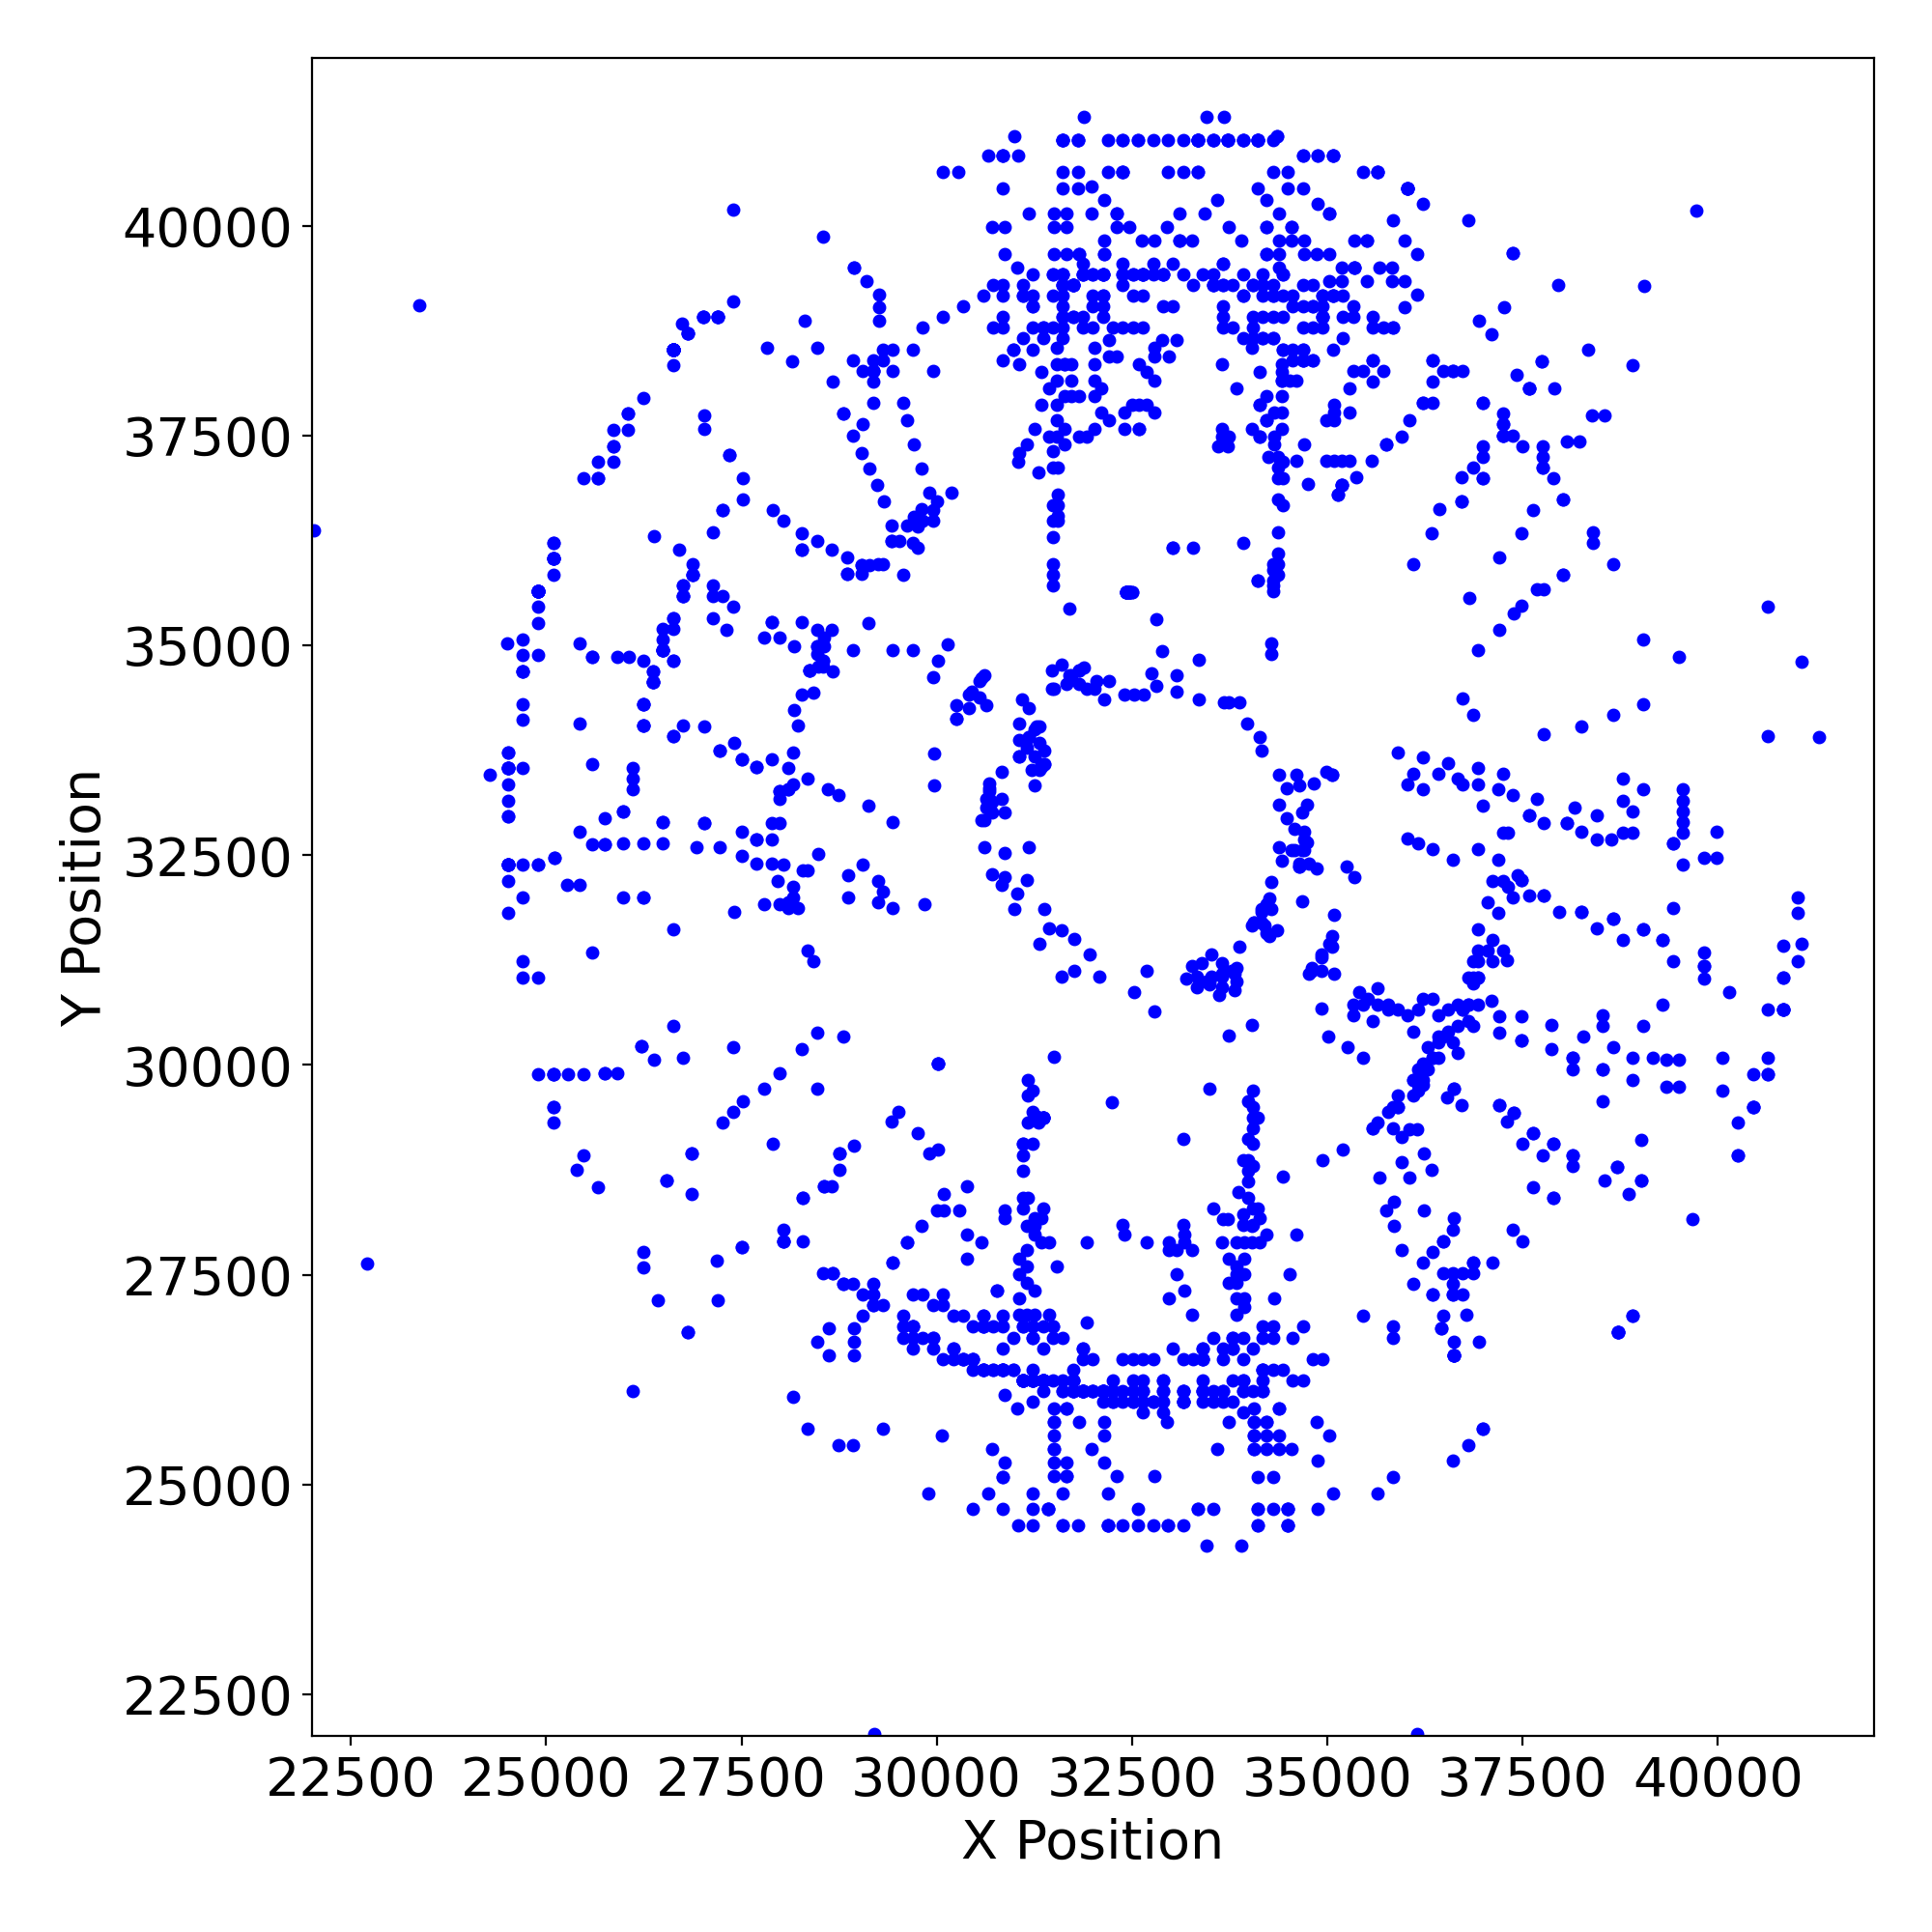 |
 |
 |
 |
 |
 |
 |
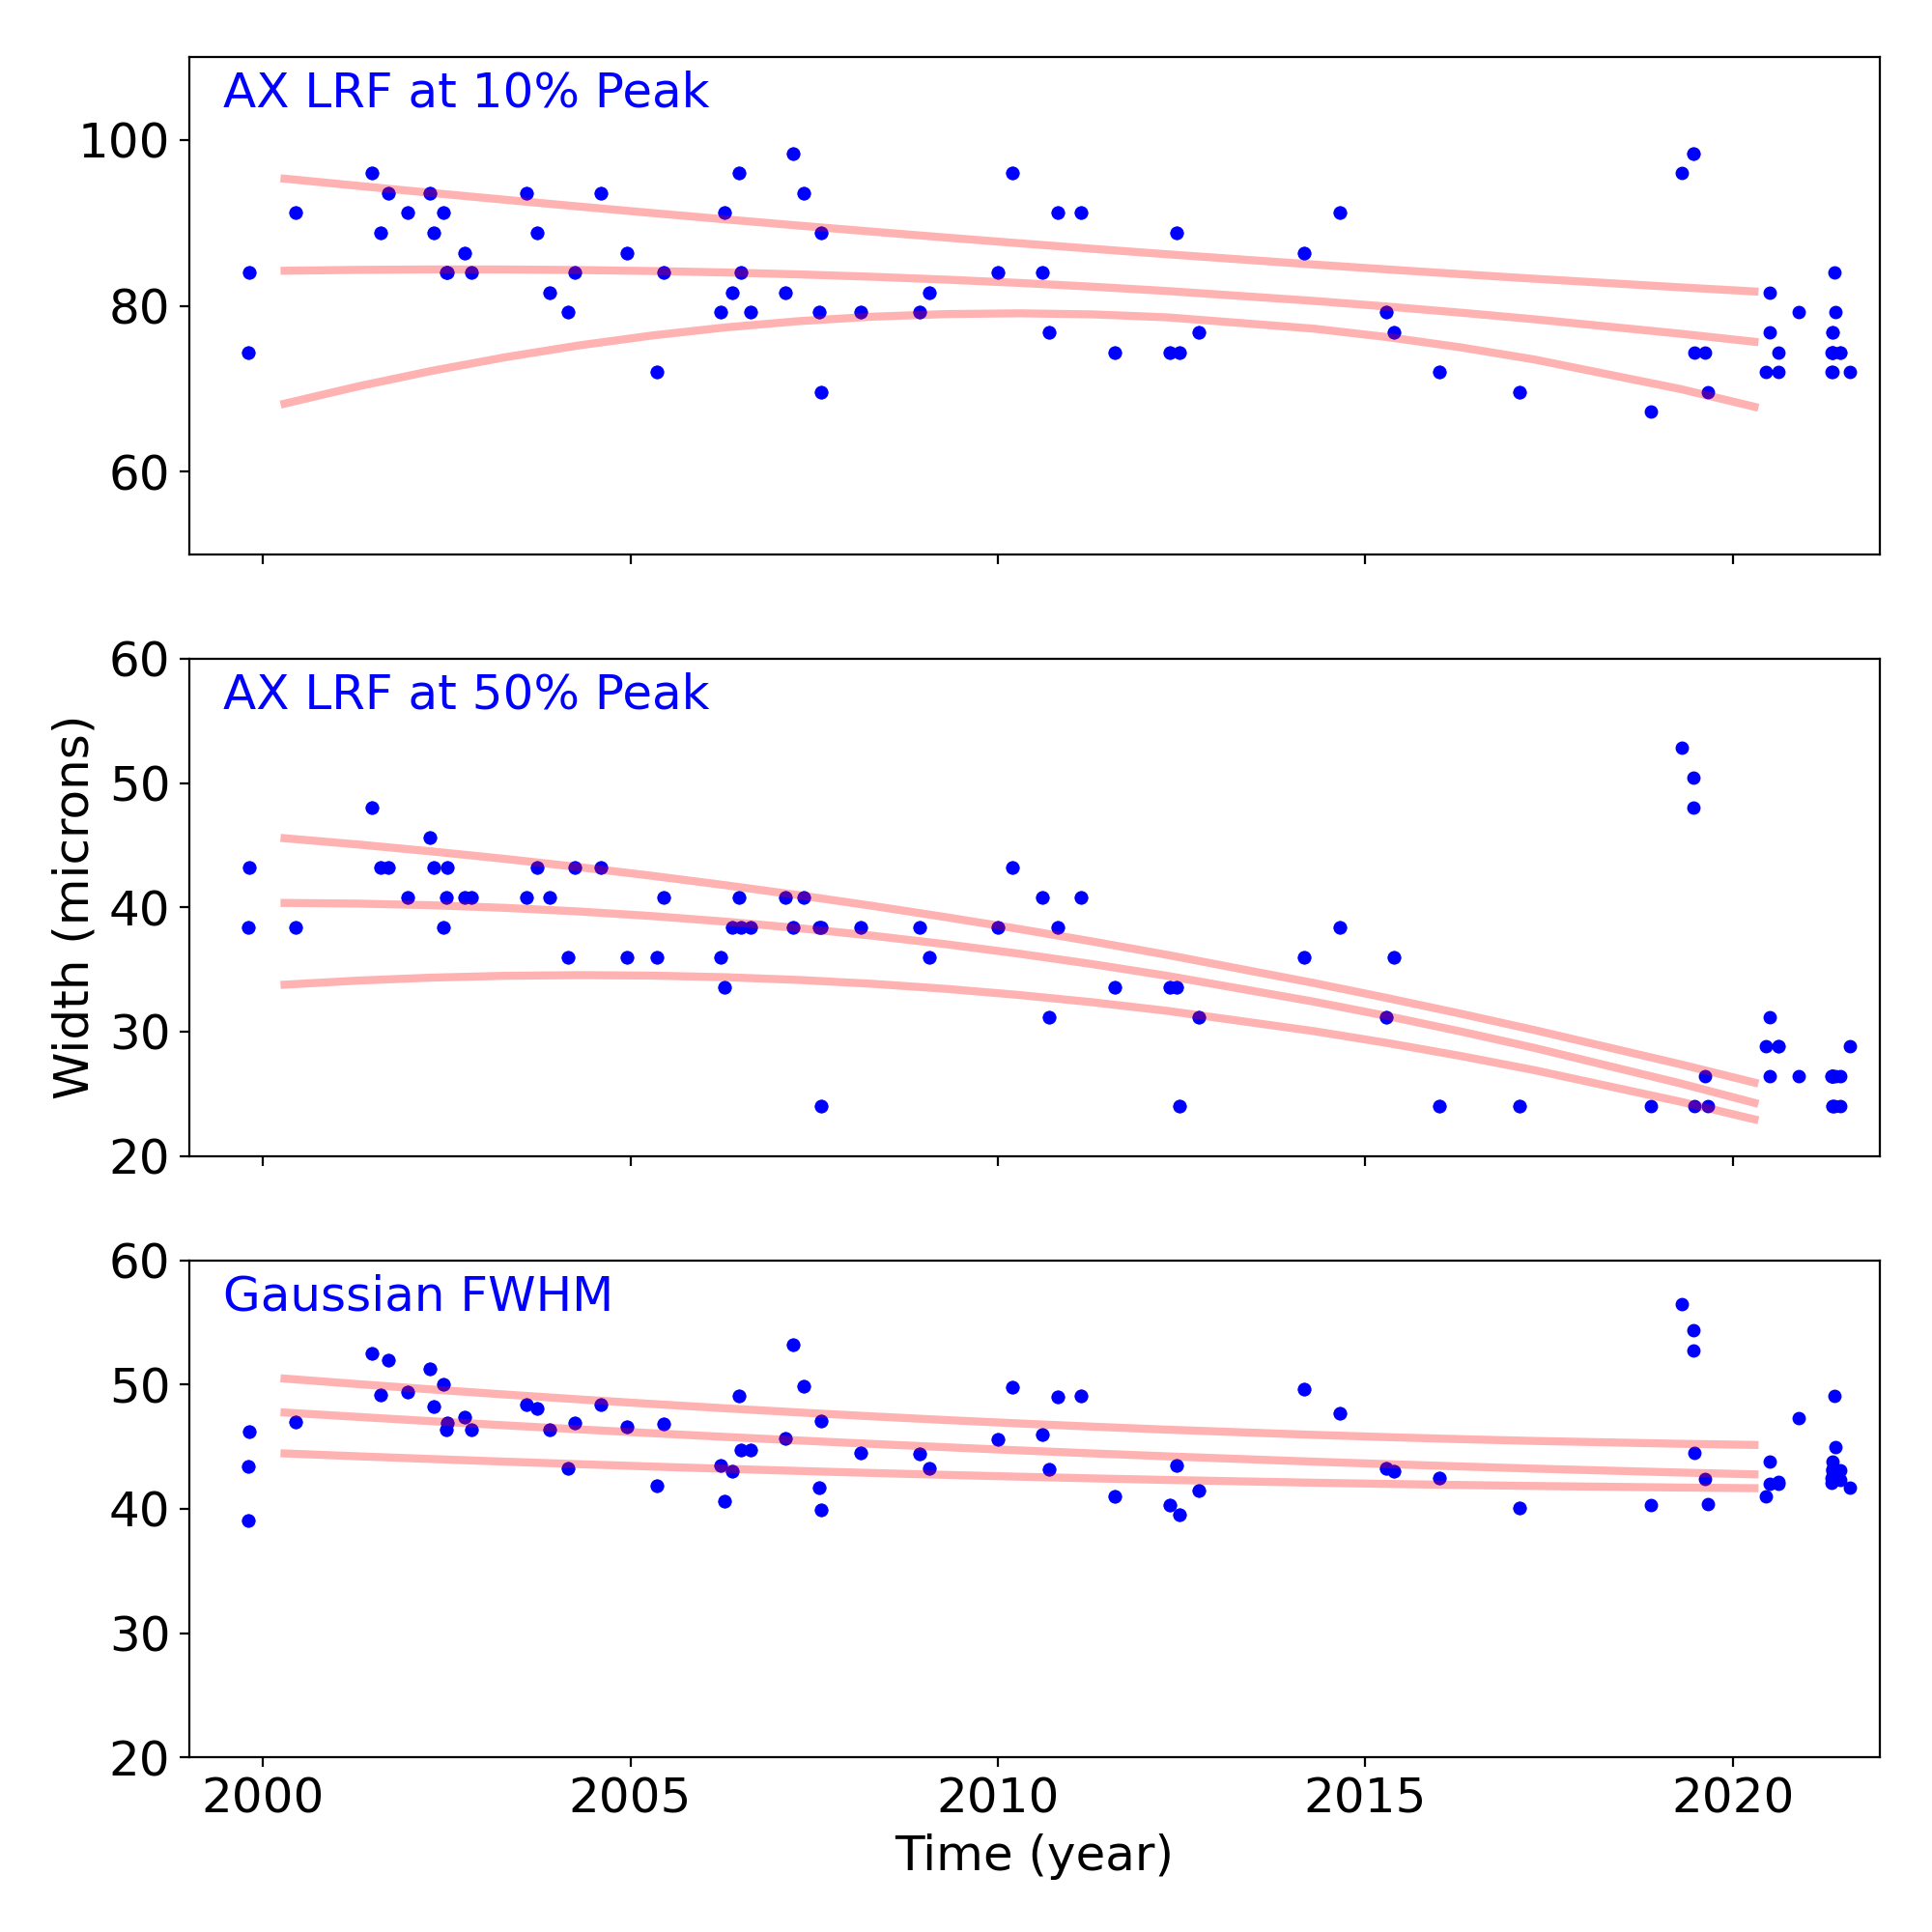
Gratings
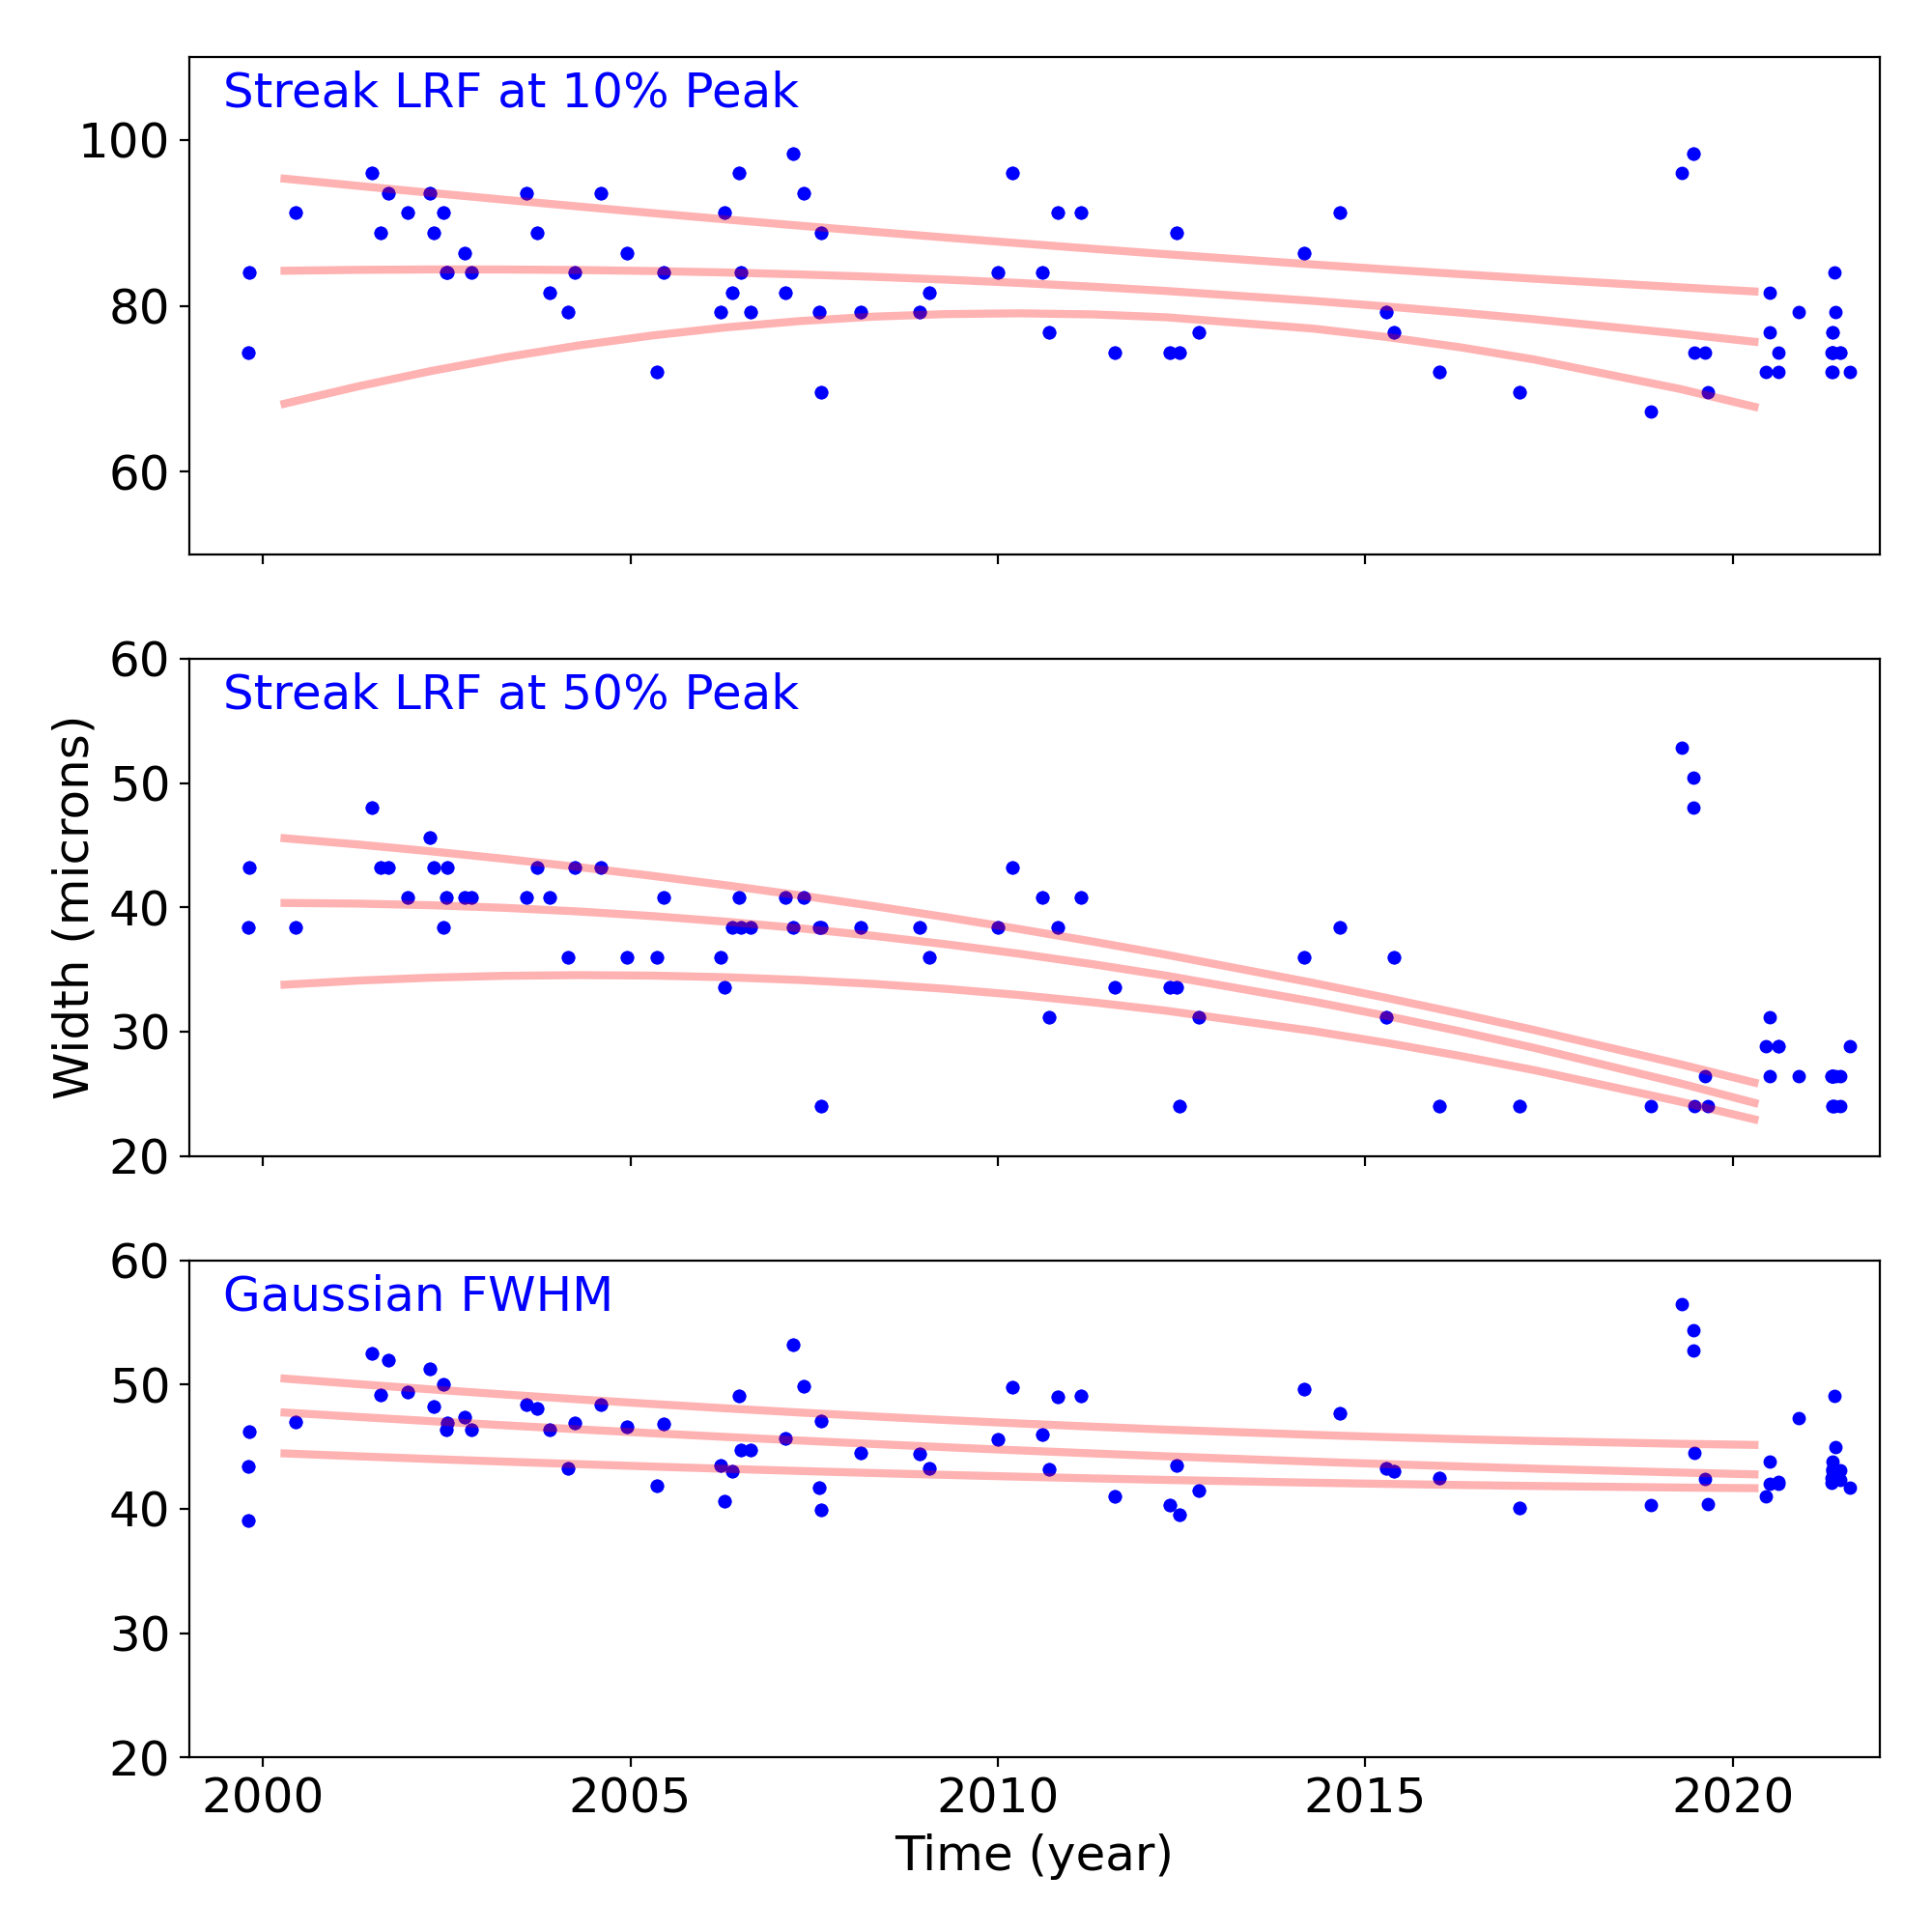
Grating Trends/Focus
We plot the width of the zero order streak of ACIS/HETG observations and the width of the zero order image for HRC/LETG observations of point sources. No significant defocusing trend is seen at this time. See Gratings Trends pages.
PCAD
ACA Trending
| ACIS |
)
|
)
|
)
|
|
|---|---|---|---|---|
)
|
)
|
)
| ||
| HRCI |
)
|
)
|
)
|
)
|
| HRCI |
)
|
)
|
)
|
)
|
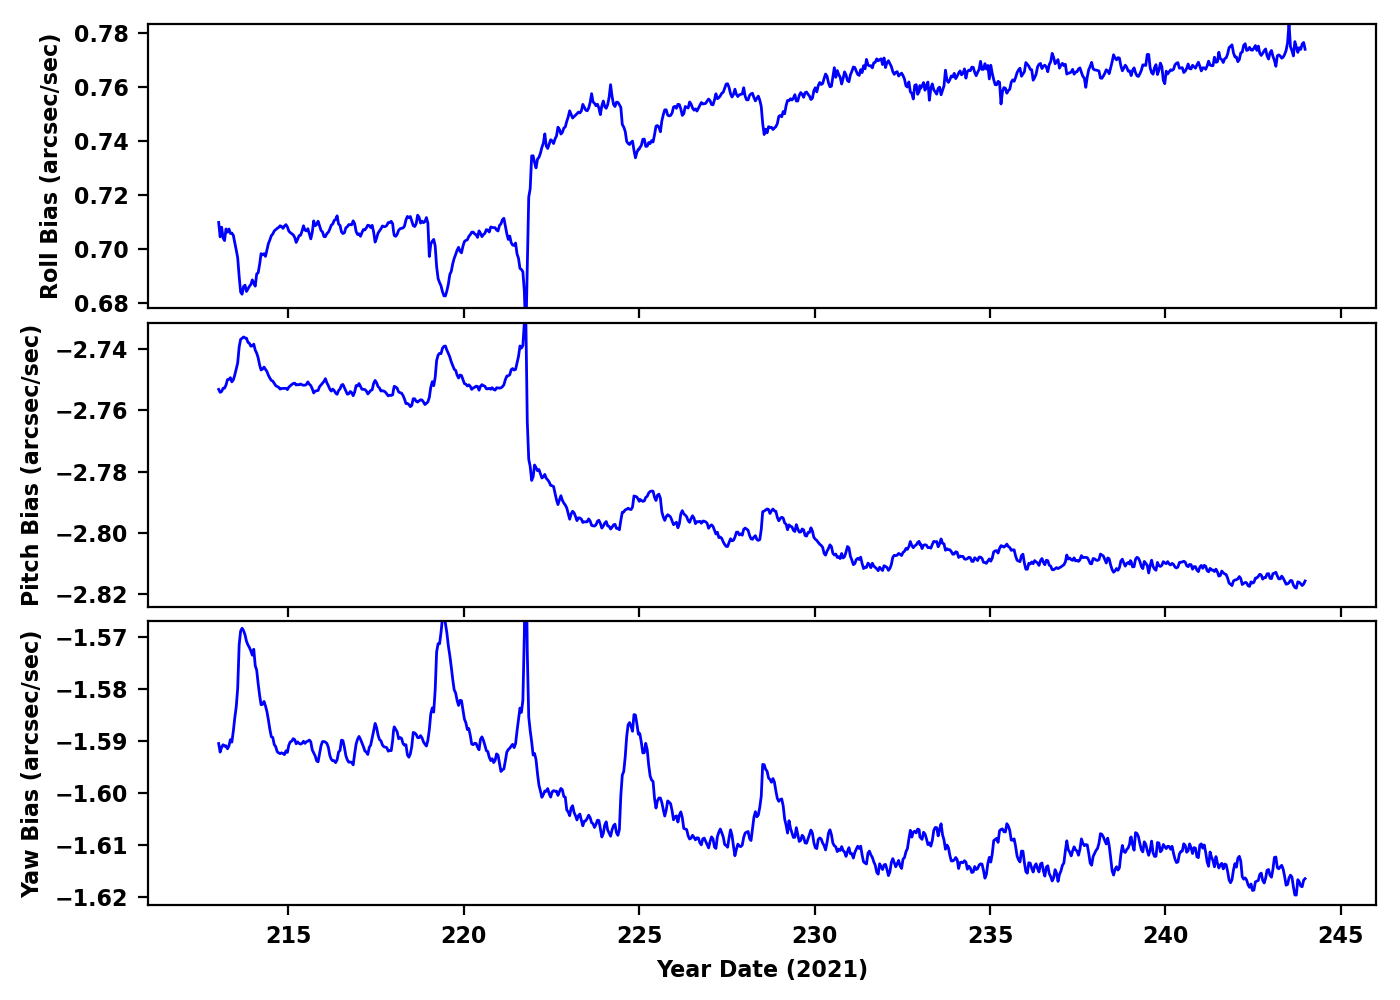
Gyro Bias Drift
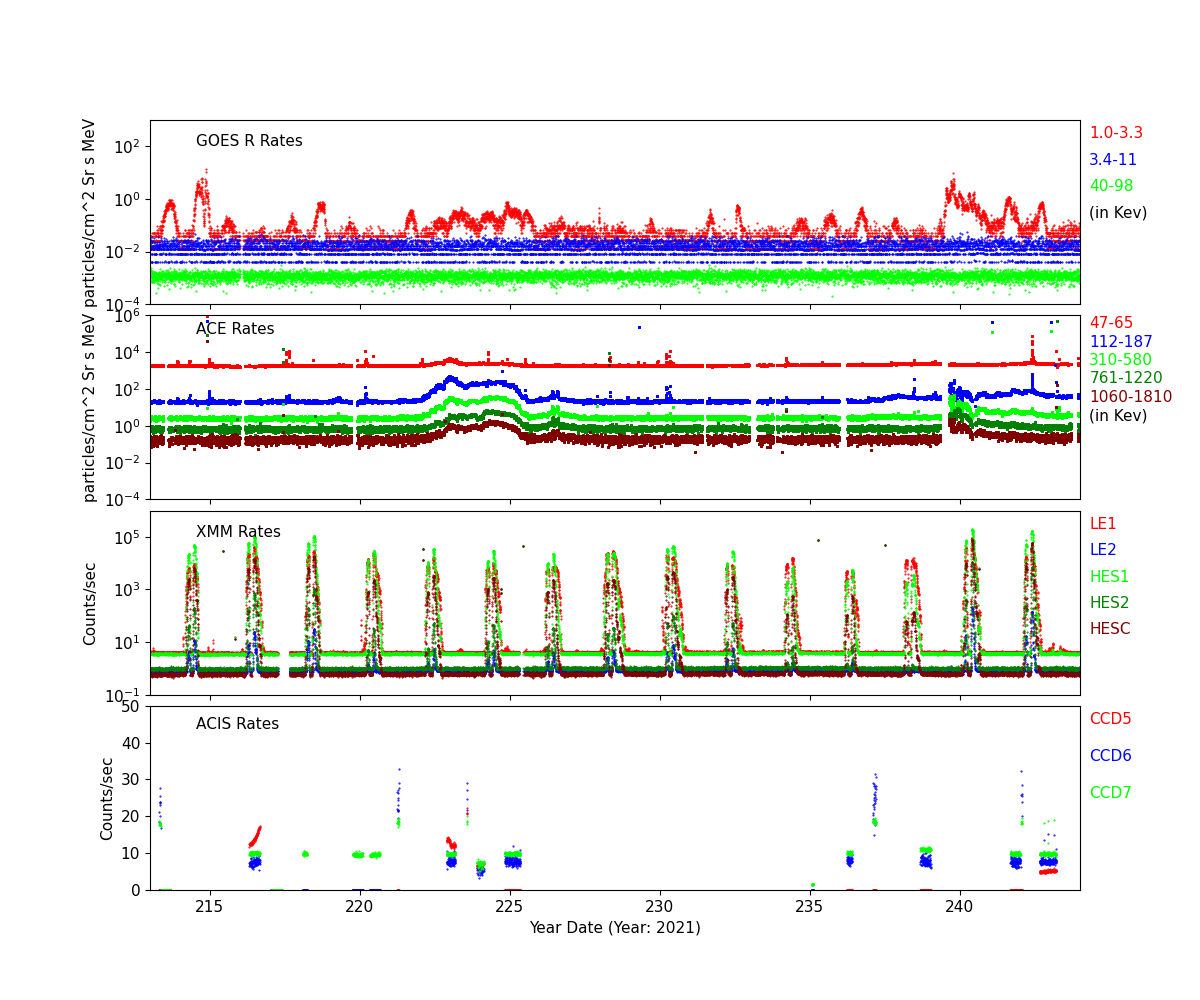
Radiation History
Radiation Count Rates of Aug 2021
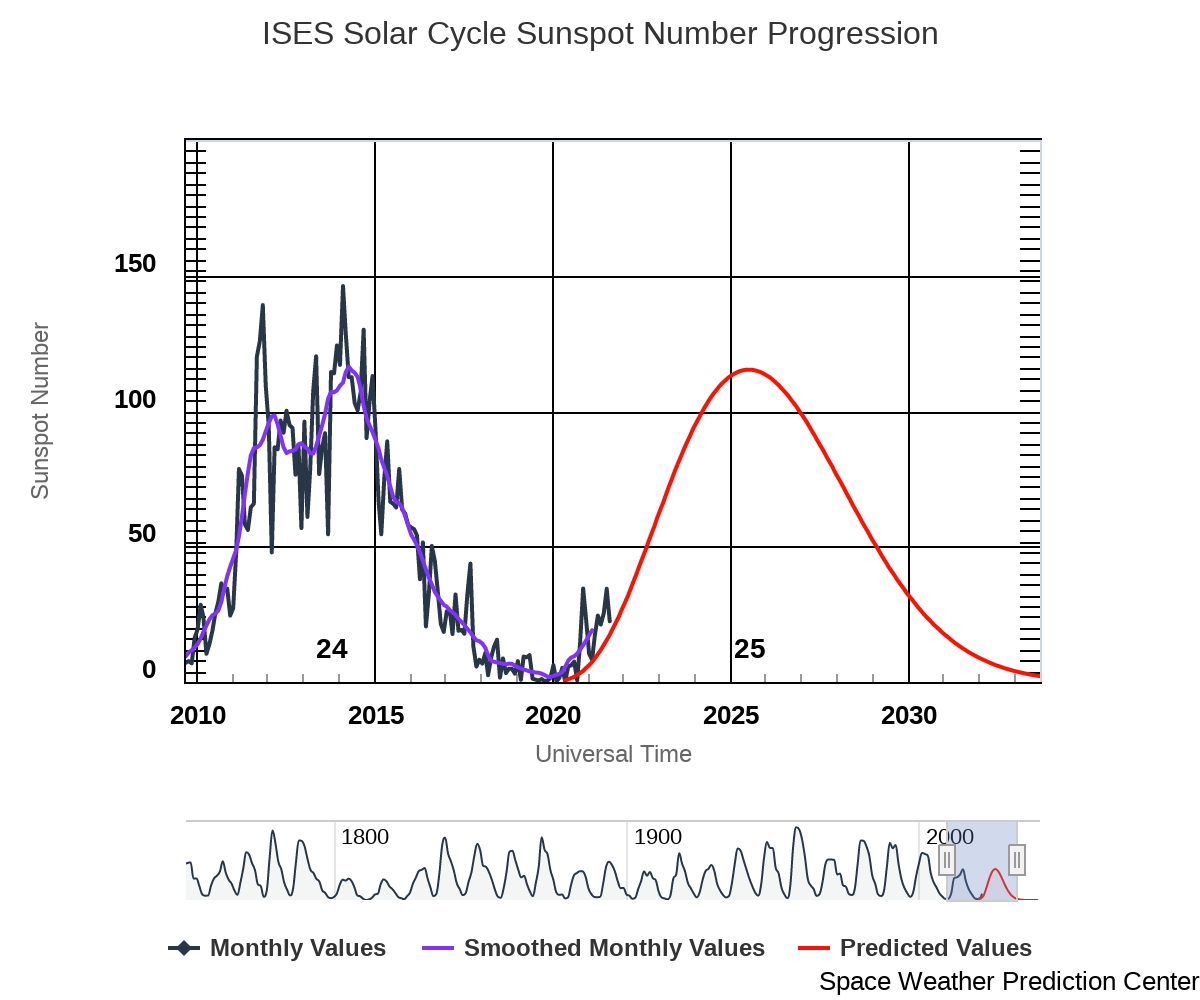
Sun Spot History (See:NOAA Page)
Trending
Quarterly Trends
- HRC Temperature
| Previous Quarter | |||||||
| MSID | MEAN | RMS | DELTA/YR | DELTA/YR/YR | UNITS | DESCRIPTION | |
| 2ceahvpt | 0.004 | 9.805e-04 | (3.00+/-0.02)e2 | -0.21 +/- 0.69 | K | CEA RADIATOR TEMPERATURE AT CENTER | |
|---|---|---|---|---|---|---|---|
| 2chtrpzt | 0.003 | 9.399e-04 | (2.96+/-0.02)e2 | -0.39 +/- 0.63 | K | CENTRAL ELECTRONICS BOX TEMP | |
| 2condmxt | 9.414e-04 | 0.001 | (2.93+/-0.02)e2 | 0.46 +/- 0.70 | K | CONDUIT -X FACE TEMPERATURE | |
| 2dcentrt | 0.001 | 8.813e-04 | (2.92+/-0.02)e2 | 0.24 +/- 0.64 | K | DETECTOR HOUSING TEMP 2 | |
| 2dtstatt | 3.413e-04 | 9.308e-04 | (2.93+/-0.02)e2 | 1.10 +/- 0.72 | K | DETECTOR HOUSING TEMP 1 | |
| 2fhtrmzt | -1.772e-04 | 0.001 | (2.95+/-0.02)e2 | 0.77 +/- 0.83 | K | FRONT END ELECTRONICS BOX TEMPERATURE | |
| 2fradpyt | -2.341e-04 | 0.001 | (2.91+/-0.02)e2 | 0.49 +/- 0.83 | K | FRONT END ASSEMBLY +Y AT RADIATOR CENTER TEMP | |
| 2pmt1t | -6.262e-04 | 0.001 | (2.94+/-0.03)e2 | 0.38 +/- 0.79 | K | PMT 1 TEMPERATURE | |
| 2pmt2t | 3.029e-05 | 0.001 | (2.97+/-0.03)e2 | 0.29 +/- 0.90 | K | PMT 2 TEMPERATURE | |
| 2uvlspxt | 6.965e-04 | 9.309e-04 | (2.88+/-0.02)e2 | -0.29 +/- 0.65 | K | UV LIGHT SHIELD NEXT TO SNOUT TEMP | |
- HRC HK
| Previous Quarter | |||||||
| MSID | MEAN | RMS | DELTA/YR | DELTA/YR/YR | UNITS | DESCRIPTION | |
| 2fe00atm | 1.393e-04 | 8.325e-04 | 22.21 +/- 1.92 | 0.70 +/- 0.64 | C | Front end temperature | |
|---|---|---|---|---|---|---|---|
| 2fepratm | on | 0.010 | 0.001 | 23.84 +/- 2.25 | 0.72 +/- 0.72 | C | FE temp card temperature | off | 0.021 | 0.003 | 24.60 +/- 1.82 | -46.68 +/- 55.27 |
| 2imhvatm | on | 0.014 | 0.001 | 31.50 +/- 1.86 | -0.18 +/- 0.53 | C | Imaging det HVPS temperature | off | 0.020 | 0.003 | 32.19 +/- 1.52 | (2.31+/-0.78)e2 |
| 2iminatm | on | 0.013 | 0.001 | 19.43 +/- 2.05 | 1.38 +/- 0.63 | C | Imaging det temperature | off | 0.017 | 0.003 | 20.28 +/- 1.68 | (4.58+/-0.27)e2 |
| 2lvplatm | on | 0.014 | 9.685e-04 | 27.66 +/- 1.74 | -0.06 +/- 0.49 | C | LVPS plate temperature | off | 0.013 | 0.003 | 28.34 +/- 1.54 | (5.30+/-0.44)e2 |
| 2prbscr | on | 7.327e-04 | 4.016e-05 | 1.71 +/- 0.07 | 0.01 +/- 0.02 | AMP | Primary bus current | off | 4.603e-05 | 1.343e-04 | 1.75 +/- 0.07 | 23.17 +/- 2.35 |
| 2prbsvl | 3.449e-04 | 5.854e-05 | 27.56 +/- 0.14 | -0.01 +/- 0.02 | V | Primary bus voltage | |
| 2smtratm | on | 2.245e-07 | 4.368e-07 | 5.94 +/- 0.00 | (1.93+/-5.58)e-5 | C | Selected motor temperature | off | -2.535e-06 | 1.275e-06 | 5.94 +/- 0.00 | (2.18+/-0.66)e-10 |
| 2sphvatm | on | 0.024 | 0.001 | 32.01 +/- 2.09 | 1.71 +/- 0.64 | C | Spect det HVPS temperature | off | -0.006 | 0.004 | 32.73 +/- 2.15 | (6.38+/-0.34)e2 |
| 2spinatm | on | 0.015 | 0.001 | 18.26 +/- 2.05 | 1.12 +/- 0.62 | C | Spect det temperature | off | 0.014 | 0.003 | 19.17 +/- 1.75 | (7.31+/-0.28)e2 |
- PCAD Temperature
| Previous Quarter | |||||||
| MSID | MEAN | RMS | DELTA/YR | DELTA/YR/YR | UNITS | DESCRIPTION | |
| aacccdpt | -6.798e-06 | 6.235e-04 | (2.63+/-0.01)e2 | 0.58 +/- 0.47 | K | AC CCD TEMP (PRI) | |
|---|---|---|---|---|---|---|---|
| aacccdrt | 1.261e-04 | 6.625e-04 | (3.07+/-0.02)e2 | 0.60 +/- 0.50 | K | AC CCD TEMP (RDNT) | |
| aach1t | -1.226e-05 | 6.555e-04 | (3.04+/-0.02)e2 | 0.60 +/- 0.49 | K | AC HOUSING TEMP (ACH1) | |
| aach2t | 3.140e-05 | 6.586e-04 | (3.04+/-0.02)e2 | 0.59 +/- 0.49 | K | AC HOUSING TEMP (ACH2) | |
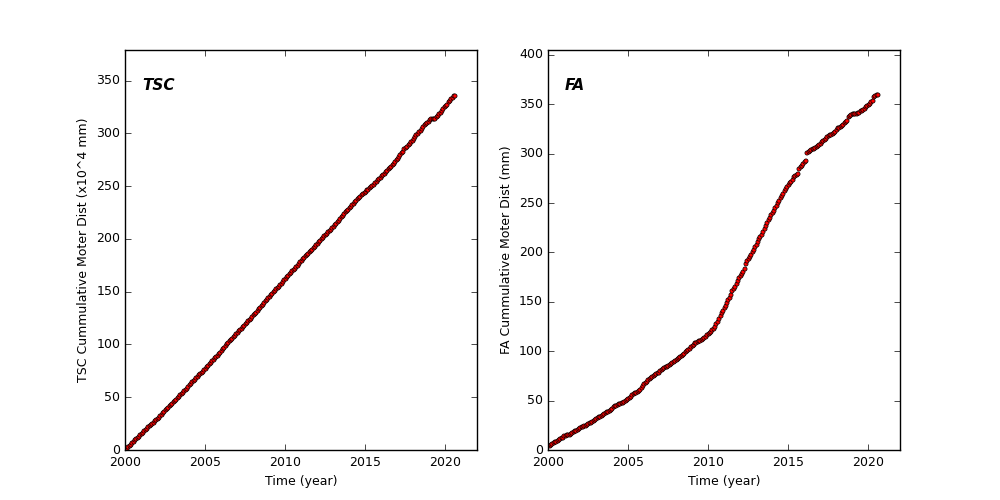
Spacecraft Motions
TSC and FA Cummulative Moter Distance
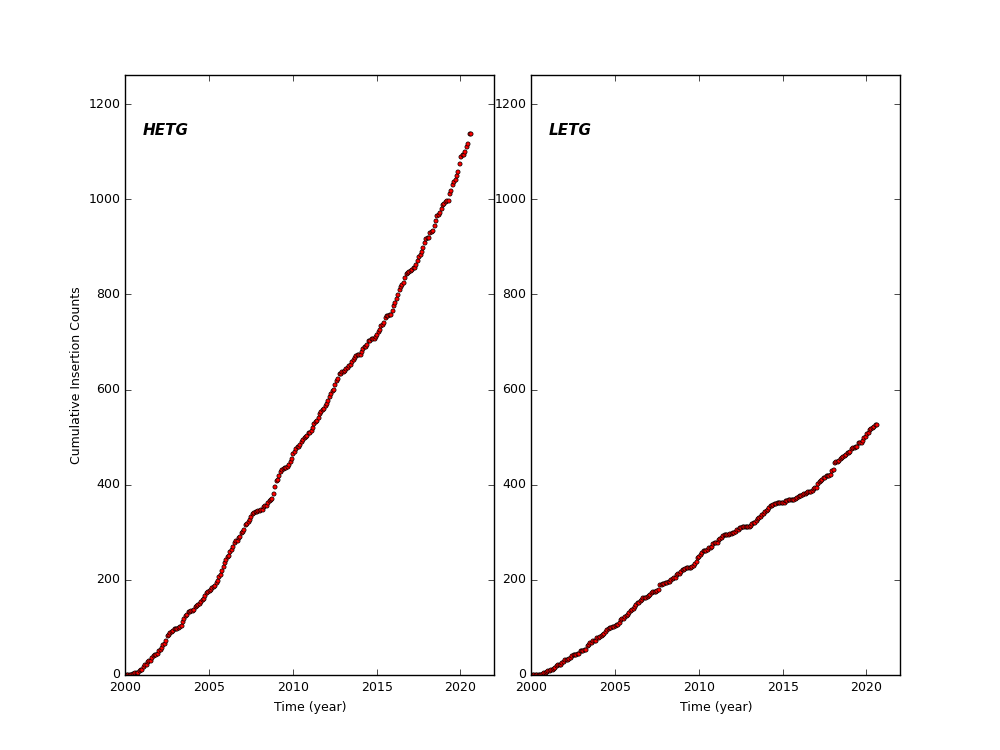
HETG and LETG Cummulative Insertion Counts
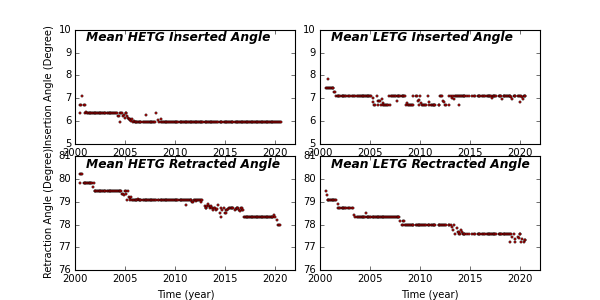
HETG/LETG Insertion/Retraction Angle
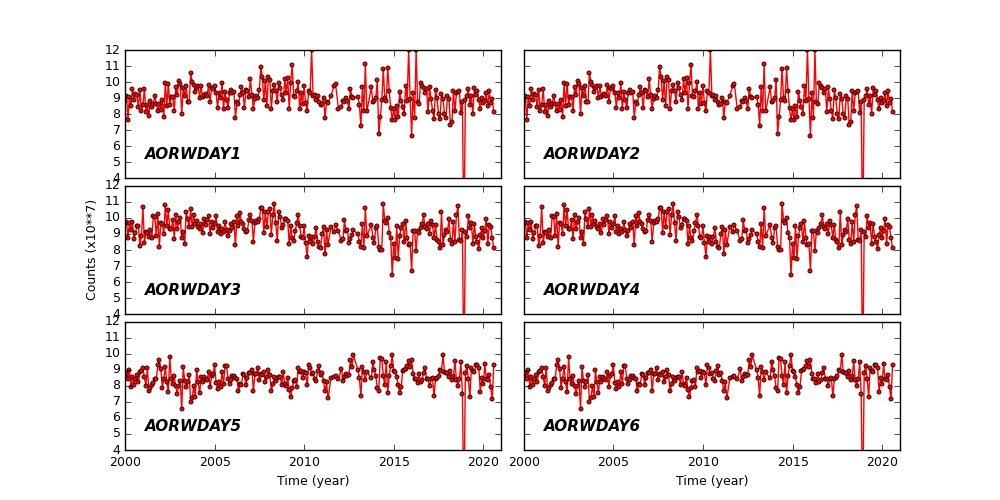
Reaction Wheel Rotations