ACIS
ACIS DOSE Registered-Photon-Map
The steps we took to compute the dose map are;
- Level 1 Event files for a specified month are obtained from archive.
- Image data including I2, I3, S2, S3 CCDs are extracted from all event files.
- All the extracted image data were merged to create a month long exposure map for the month.
- The exposure map is opened with ds9, and check a distribution of count rates against energy. From this, estimate the upper threshold value. Any events beyond this upper threshold are assumed erroneous events such as bad pixels.
- Using this upper threshold, the data is filtered, and create a cleaned exposure map for the month.
- The exposure map from each month from the Sep 1999 is added up to create a cumulative exposure map for each month.
- Using fimgstatistic, we compute count rate statistics for each CCDs.
- For observations with high data drop rates (e.g., Crab nebula, Cas A), we corrected the observations by adding events.
Please check more detail plots at Telemetered Photon Dose Trend page.
)
)
)
Statistics:
# IMAGE     NPIX     MEAN        RMS        MIN     MAX
ACIS_jun21 6004901       9.002         21.925           0.0     2638


I2 node 0  262654	6.956416	3.256462	0.0	 54.0
I2 node 1  262654	7.252699	4.956088	0.0	1707.0
I2 node 2  262654	7.005481	3.324971	0.0	 61.0
I2 node 3  262654	7.127687	3.651388	0.0	537.0

I3 node 0  262654	8.071172	3.649541	0.0	148.0
I3 node 1  262654	8.335456	4.066594	0.0	131.0
I3 node 2  262654	8.104934	3.472512	0.0	 69.0
I3 node 3  262654	7.785328	3.454575	0.0	116.0

S2 node 0  262654	9.668011	11.231427	0.0	2609.0
S2 node 1  262654	11.184314	16.837652	0.0	427.0
S2 node 2  262654	15.400988	30.753838	0.0	674.0
S2 node 3  262654	14.966460	20.908290	0.0	575.0

S3 node 0  262654	20.545110	61.918954	0.0	2638.0
S3 node 1  262654	18.225961	17.226253	0.0	421.0
S3 node 2  262654	19.174311	29.020313	0.0	575.0
S3 node 3  262654	18.742359	38.062414	0.0	658.0
)
)
)
Statistics:
 IMAGE     NPIX      MEAN        RMS           MIN      MAX
ACIS_total   6004901       2499.218         3219.182           0.0   138470


I2 node 0  262654	2158.950556	432.951983	461.0	12839.0
I2 node 1  262654	2270.497923	614.344113	474.0	121530.0
I2 node 2  262654	2296.947950	485.972691	491.0	13359.0
I2 node 3  262654	2302.655438	594.650103	467.0	28765.0

I3 node 0  262654	2473.297173	608.119409	457.0	13285.0
I3 node 1  262654	2550.650731	1720.775937	491.0	55629.0
I3 node 2  262654	2266.789085	423.739915	458.0	13419.0
I3 node 3  262654	2259.140476	455.891952	430.0	34119.0

S2 node 0  262654	2913.859827	471.583312	1590.0	22236.0
S2 node 1  262654	3089.727743	700.694880	1768.0	16768.0
S2 node 2  262654	3421.022112	707.597431	2192.0	28804.0
S2 node 3  262654	3383.427271	562.325858	1933.0	68539.0

S3 node 0  262654	5195.640698	2869.137428	2245.0	52952.0
S3 node 1  262654	6382.637523	2344.018323	0.0	37961.0
S3 node 2  262654	5122.634329	1332.023051	2298.0	27011.0
S3 node 3  262654	3997.599977	747.146325	2421.0	26288.0
)
|
)
|
)
|
)
|
| Mar 2021 | Dec 2020 | Sep 2020 | Jun 2020 |
|---|
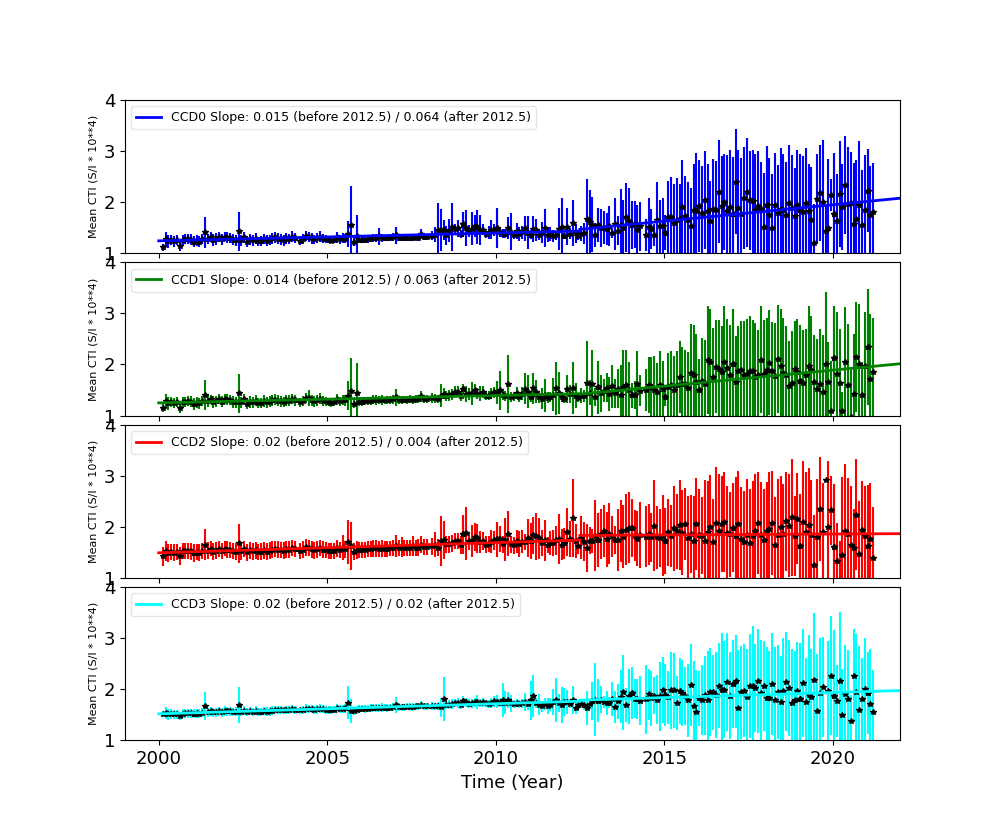
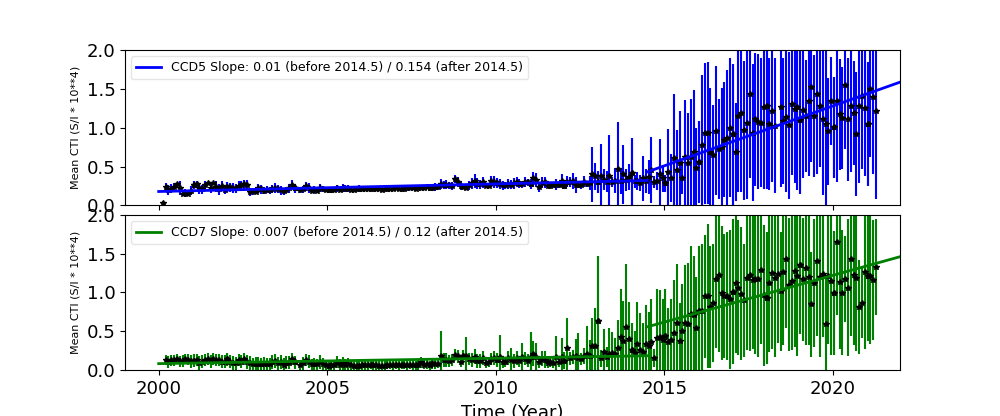
The Mean Detrended CTI
We report CTIs with a refined data definition. CTIs were computed for the temperature dependency corrected data. Please see CTI page for detailed explanation. CTI's are computed for Mn K alpha, and defined as slope/intercept x10^4 of row # vs ADU. Data file: here
Imaging CCDs
Spectral CCDs
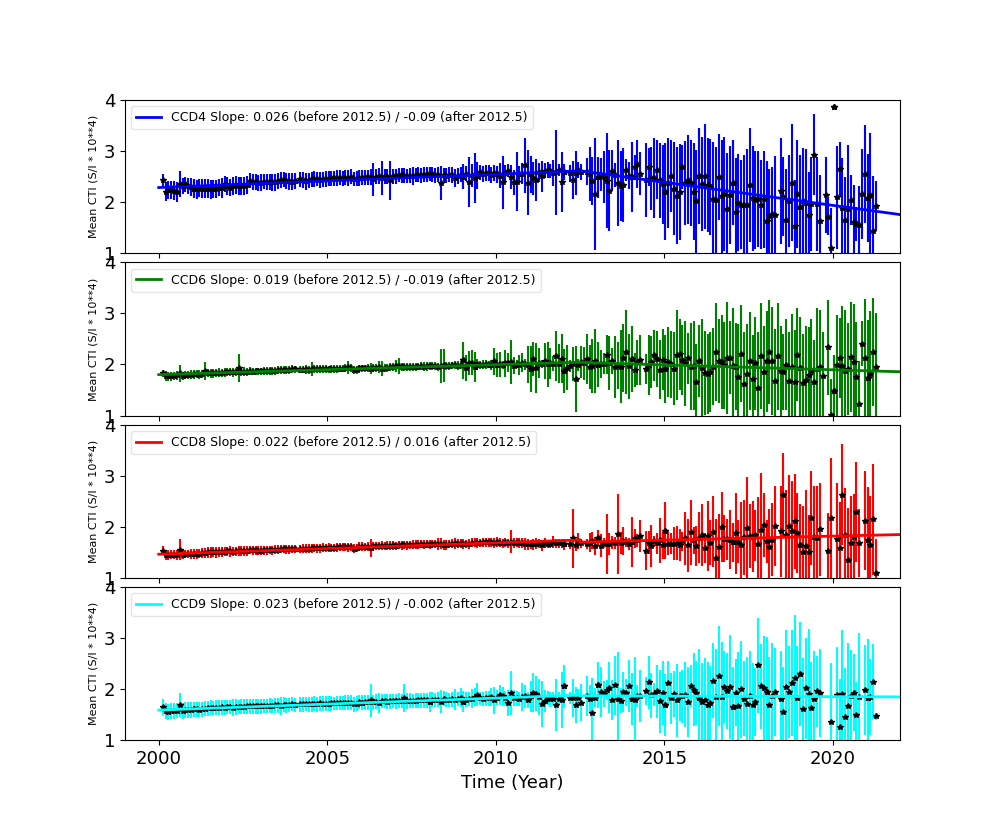
Backside CCDs
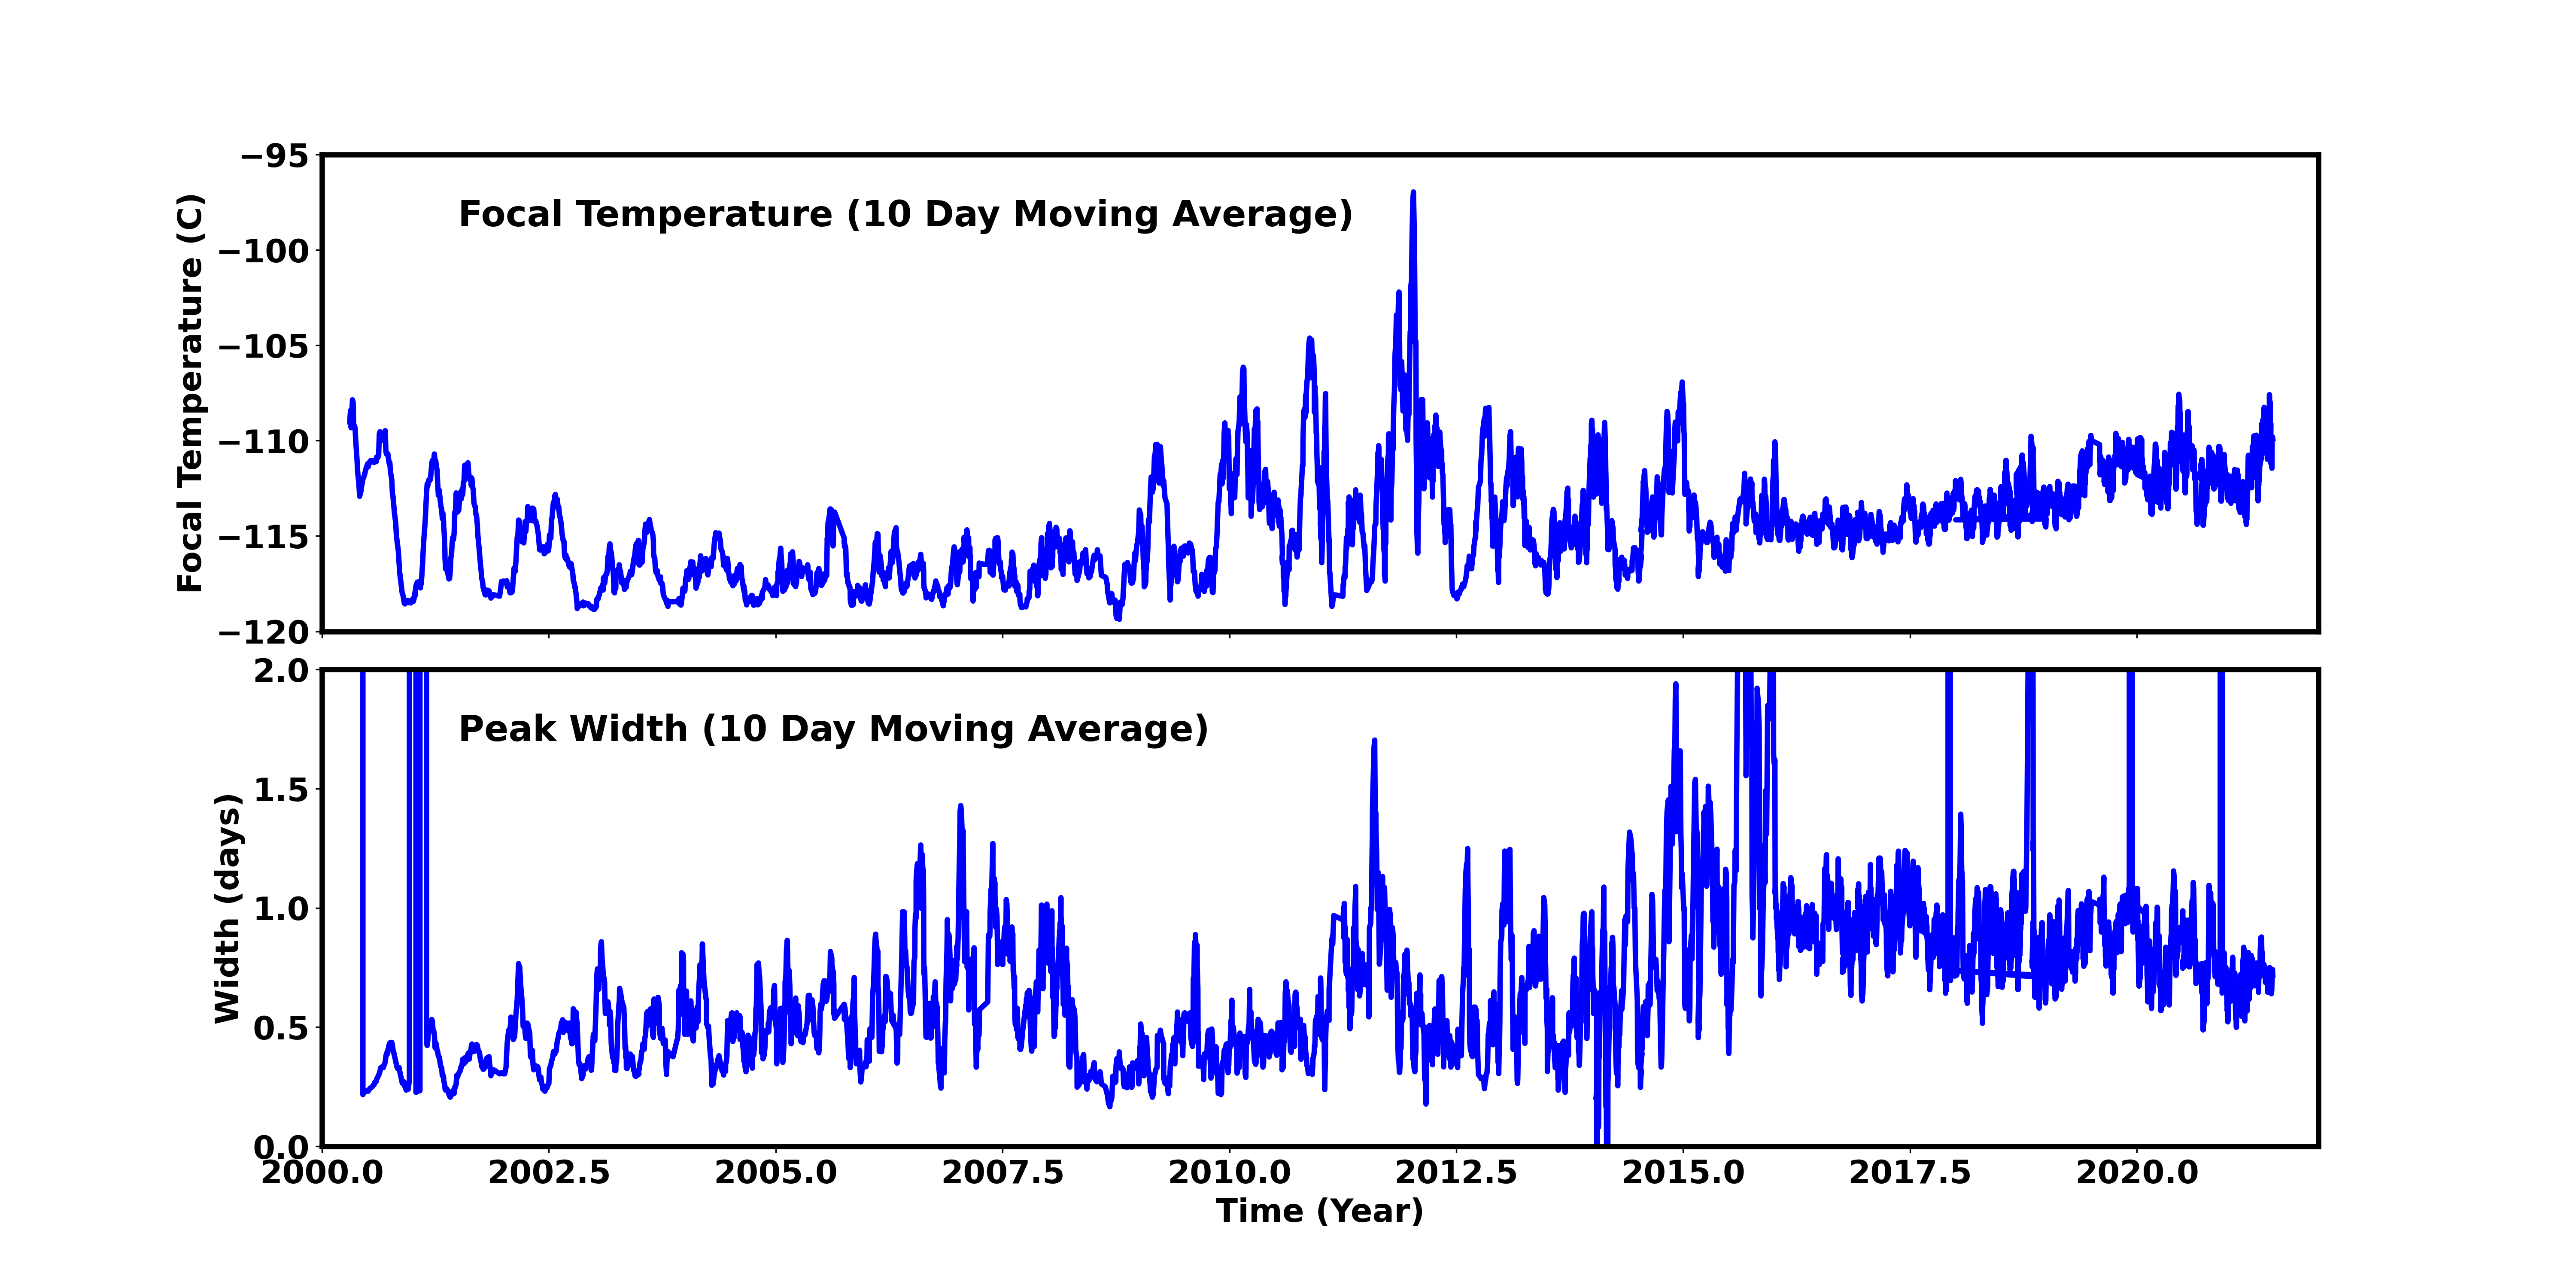
Focal Plane Temperature
Jun 2021 Focal Temperature
| The Mean (max) FPT: | |
|---|---|
| -109.94 | +/- 5.87 C |
| Mean Width: | |
| 0.69 | +/- 0.17 days |
Averaged Focal Plane Temperature
We are using 10 period moving averages to show trends of peak temperatures and peak widths. Note, the gaps in the width plot are due to missing/corrupted data.
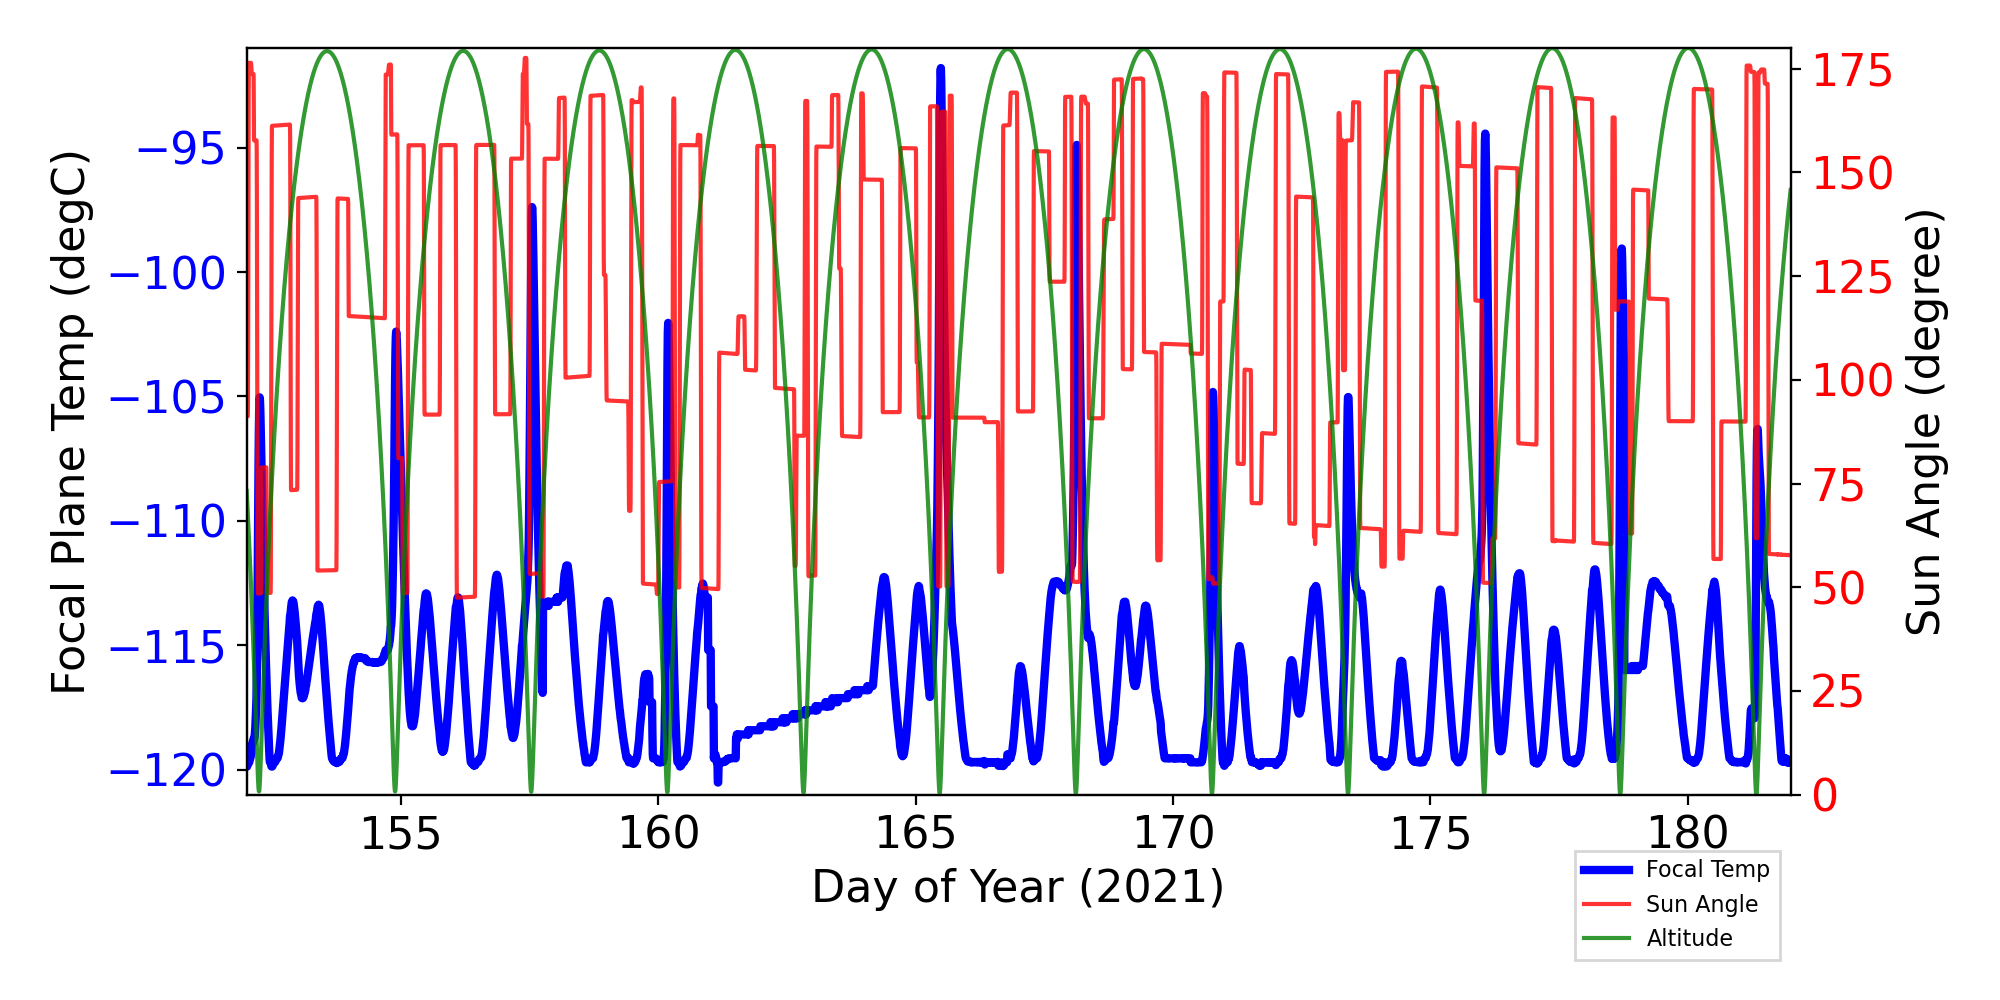
Focal Plane Temperature, Sun Angle and Altitude
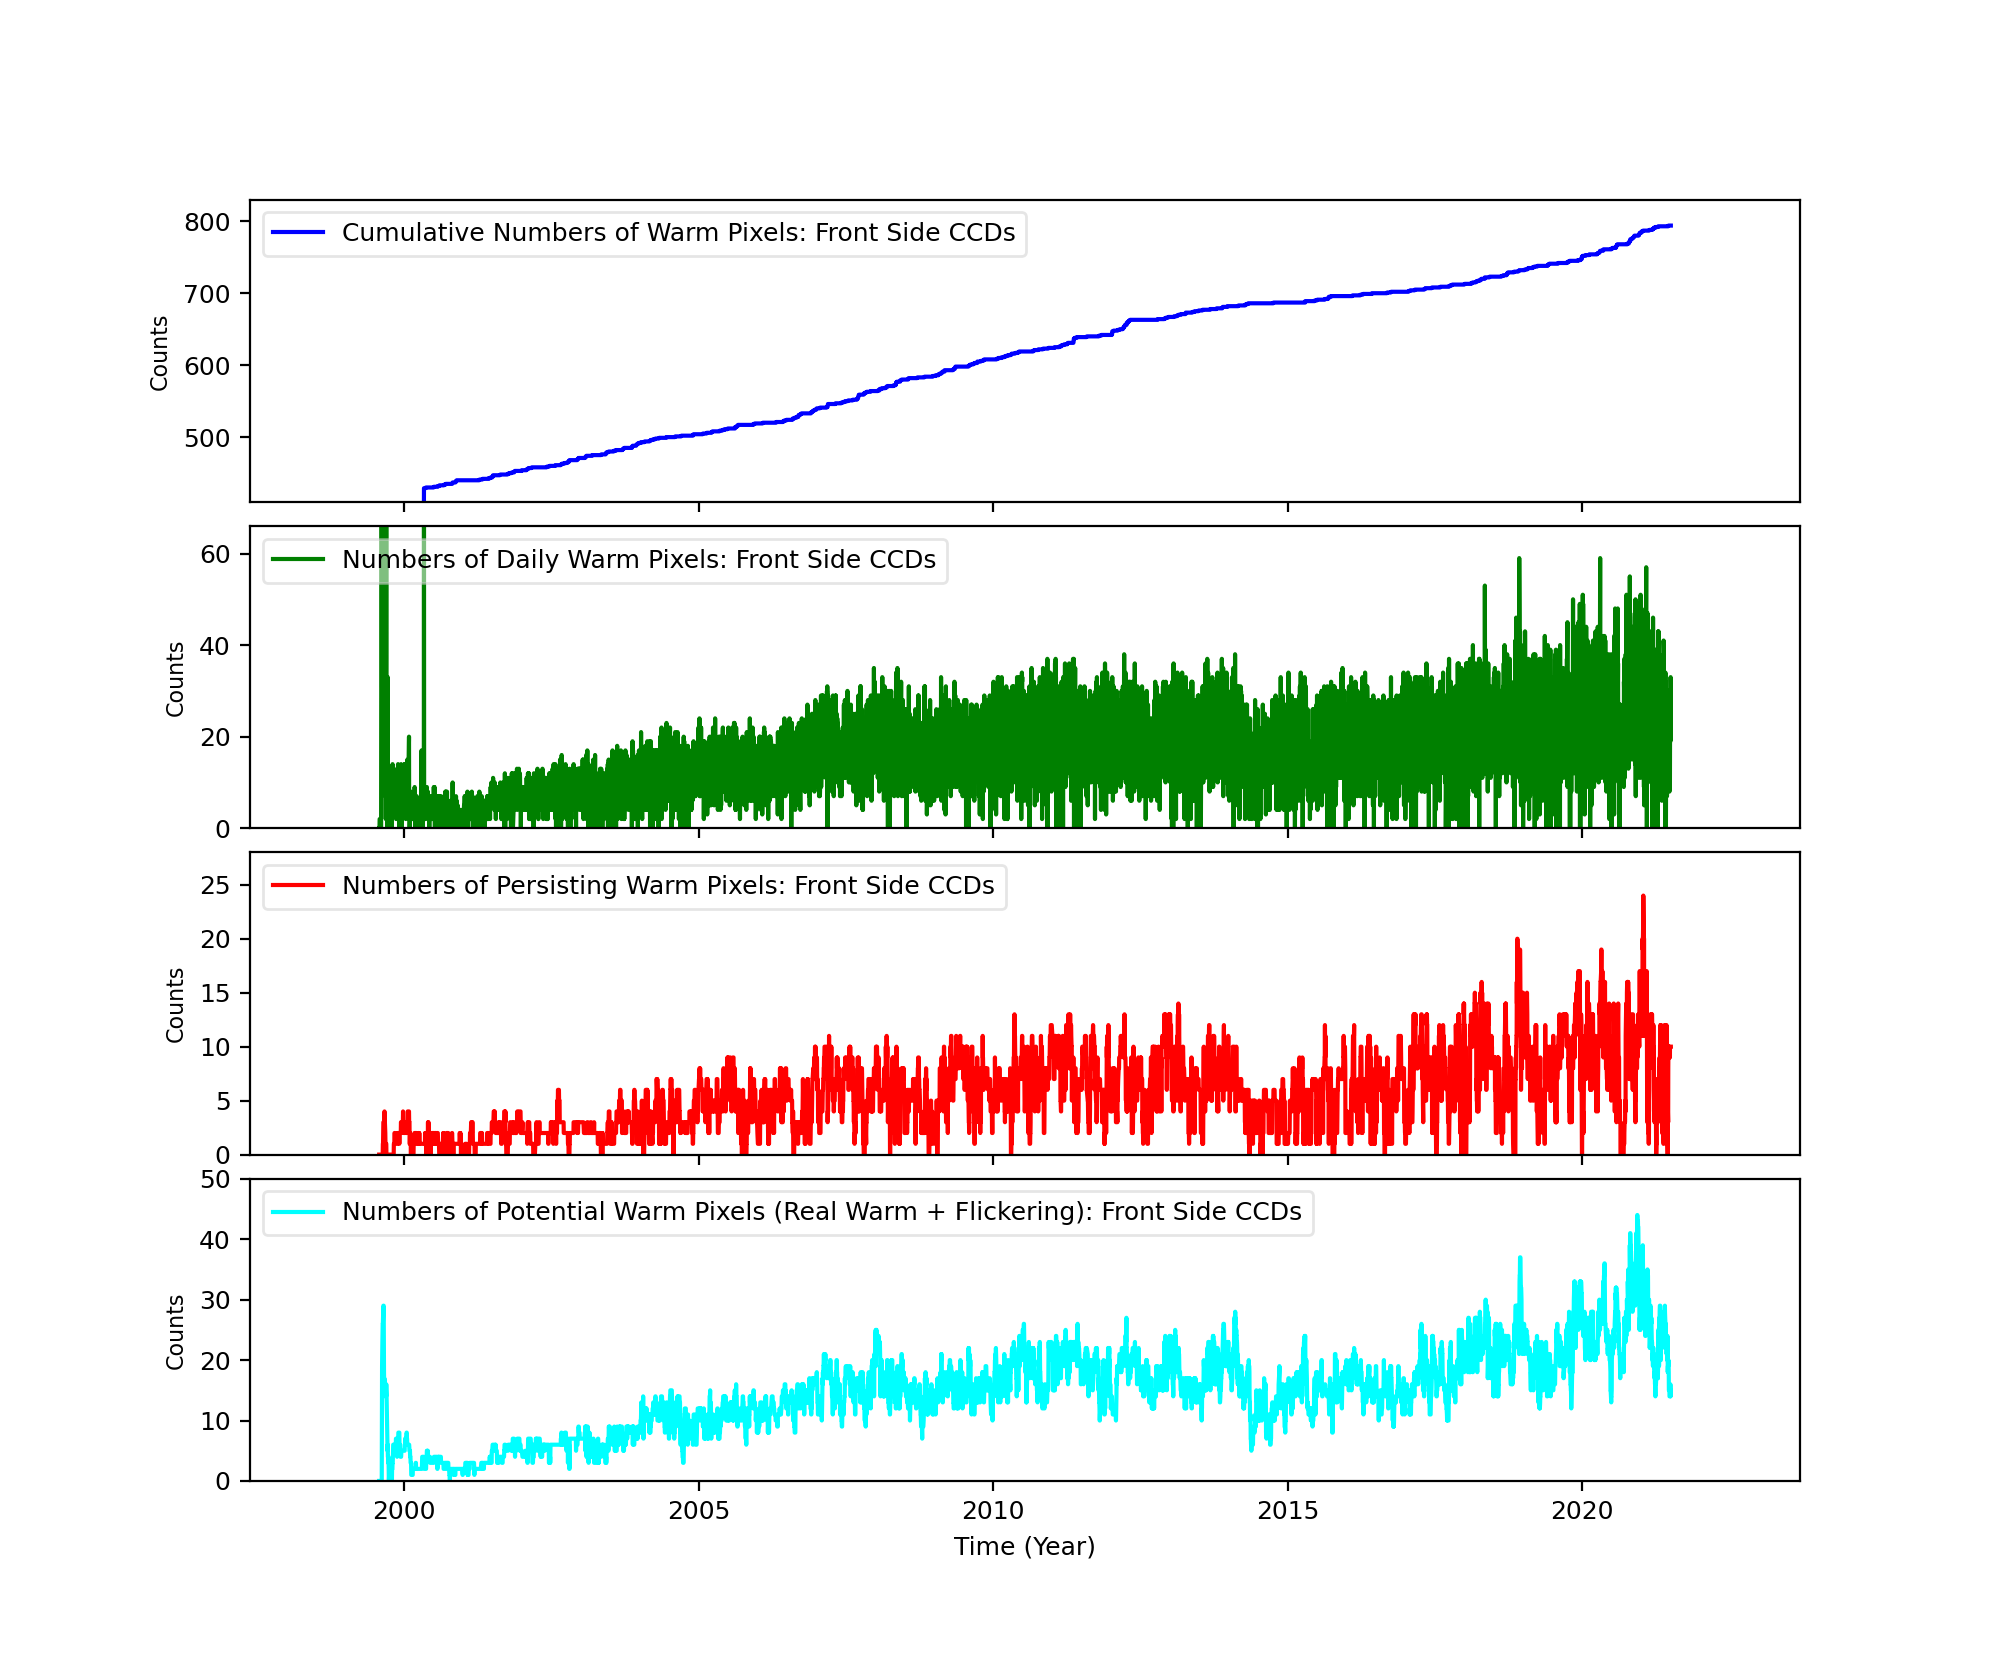
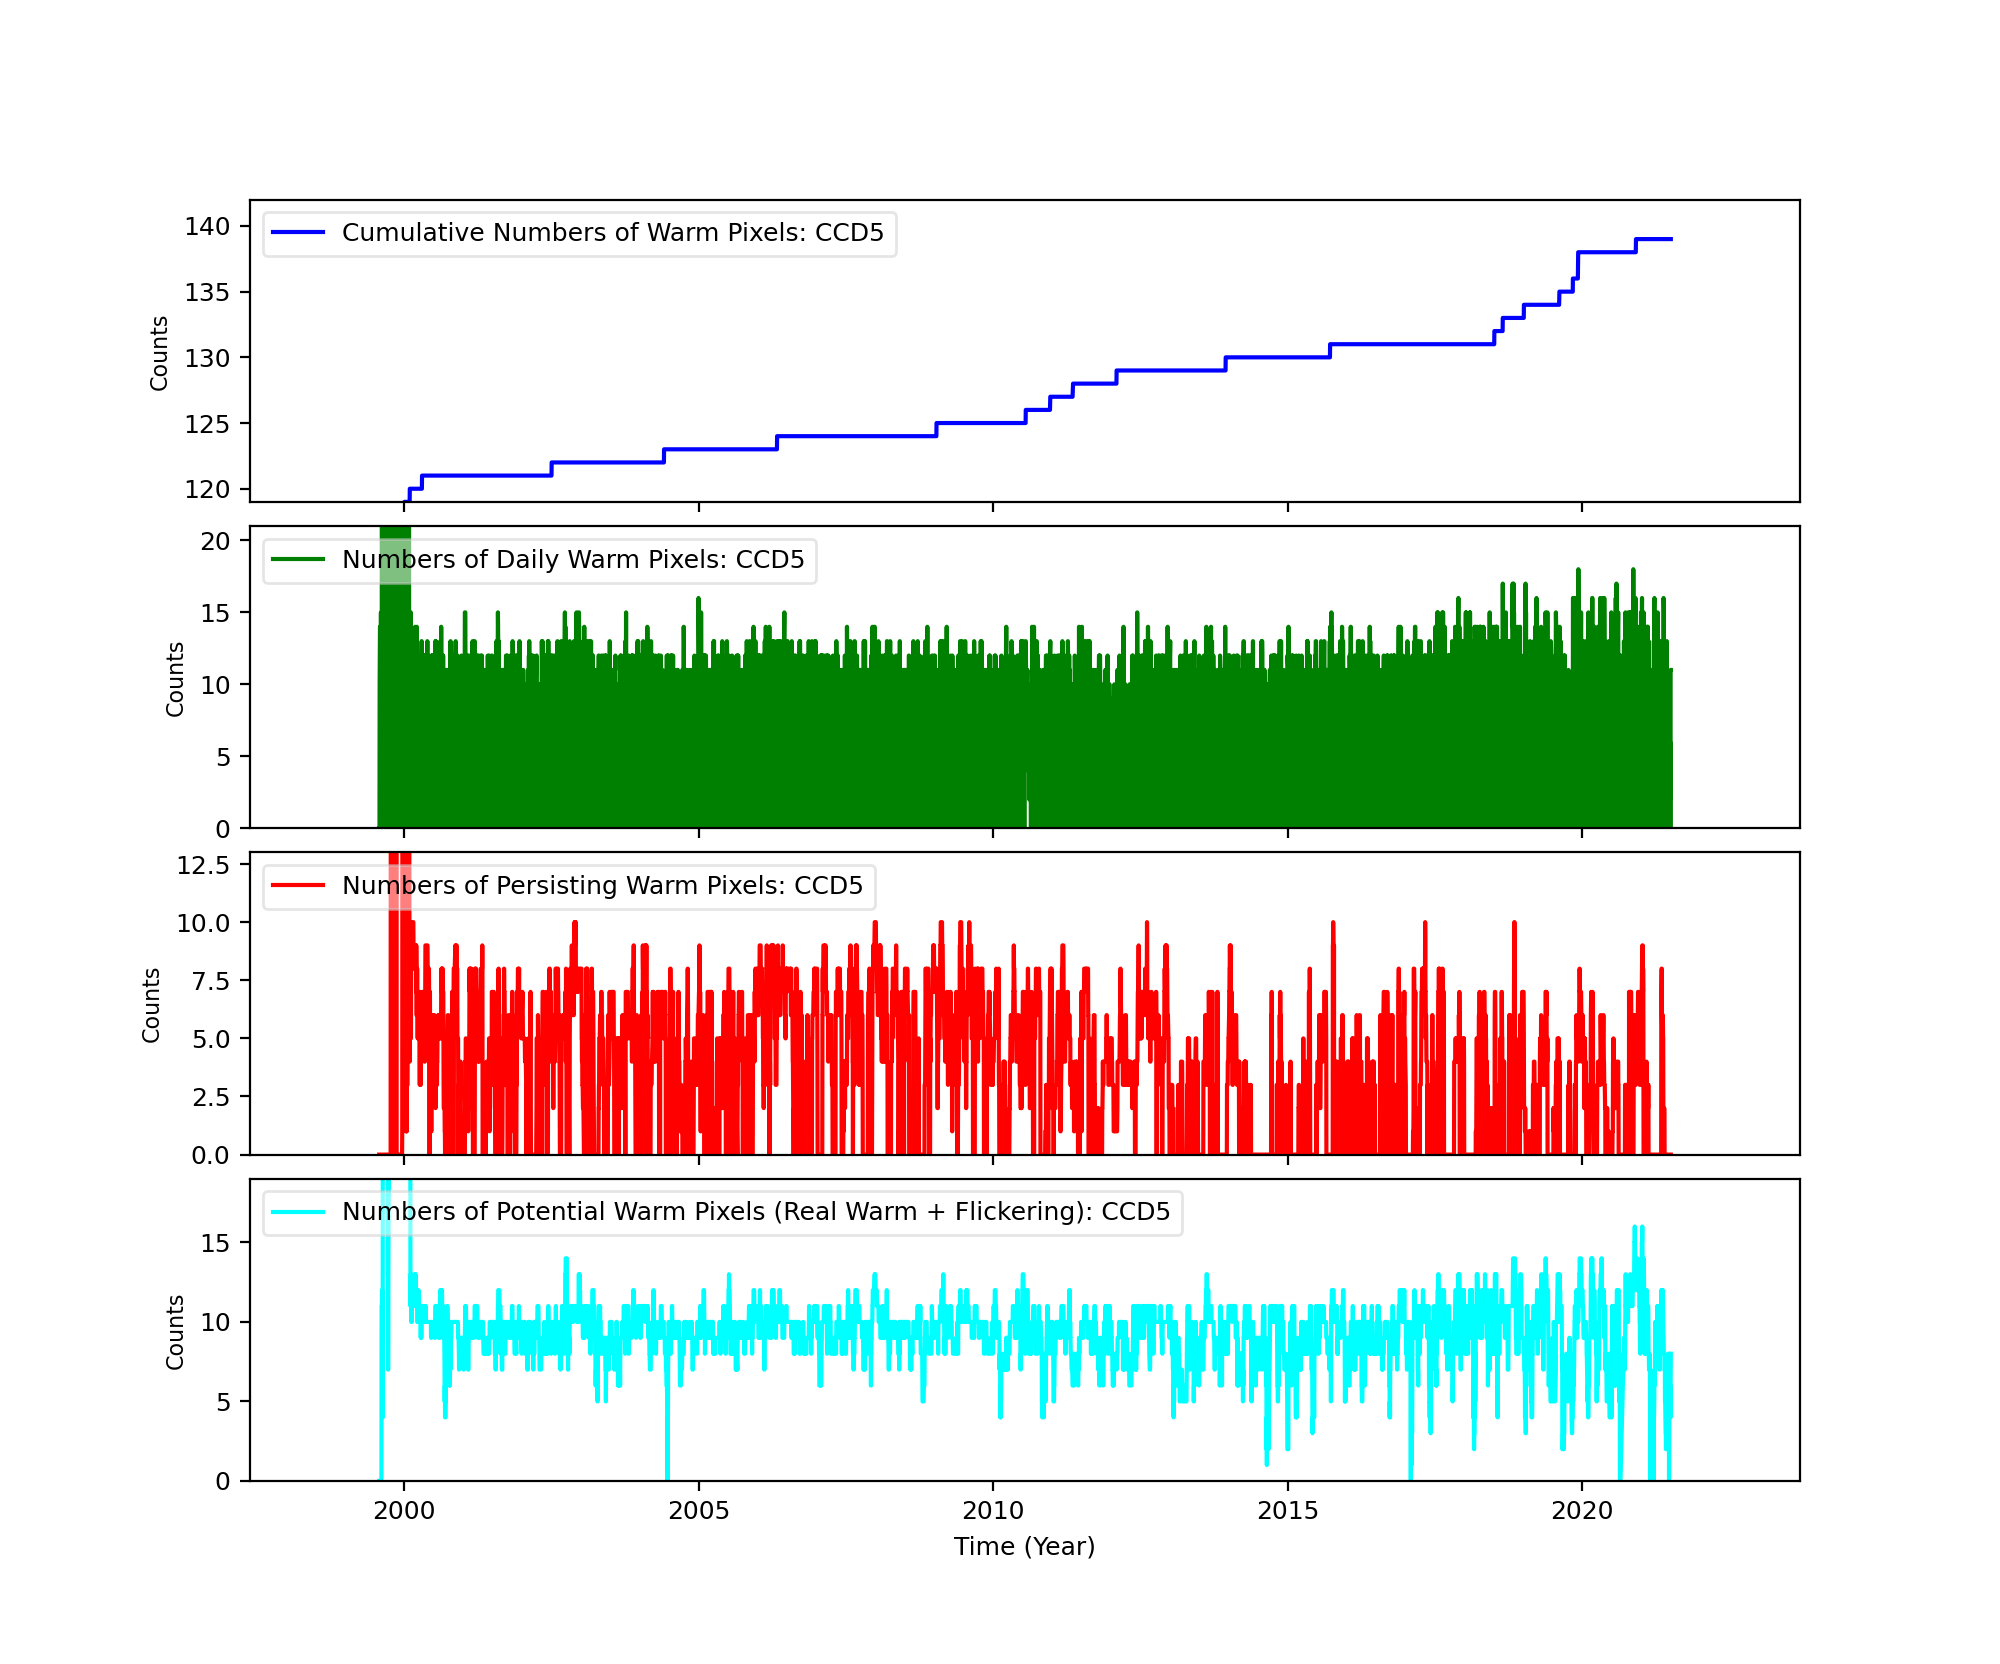
Bad Pixels
The plots below were generated with a new warm pixel finding script. Please see Acis Bad Pixel Page for details.
Front Side CCDs
Back Side CCD (CCD5)
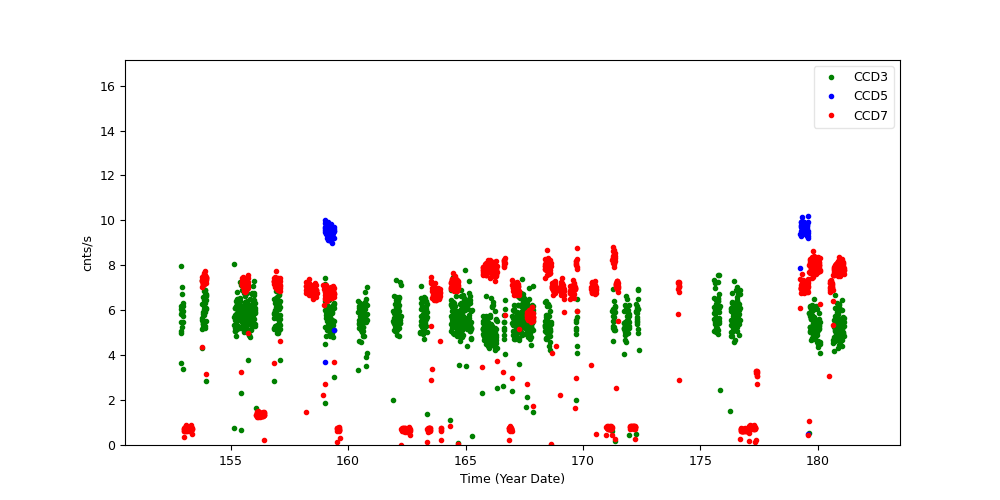
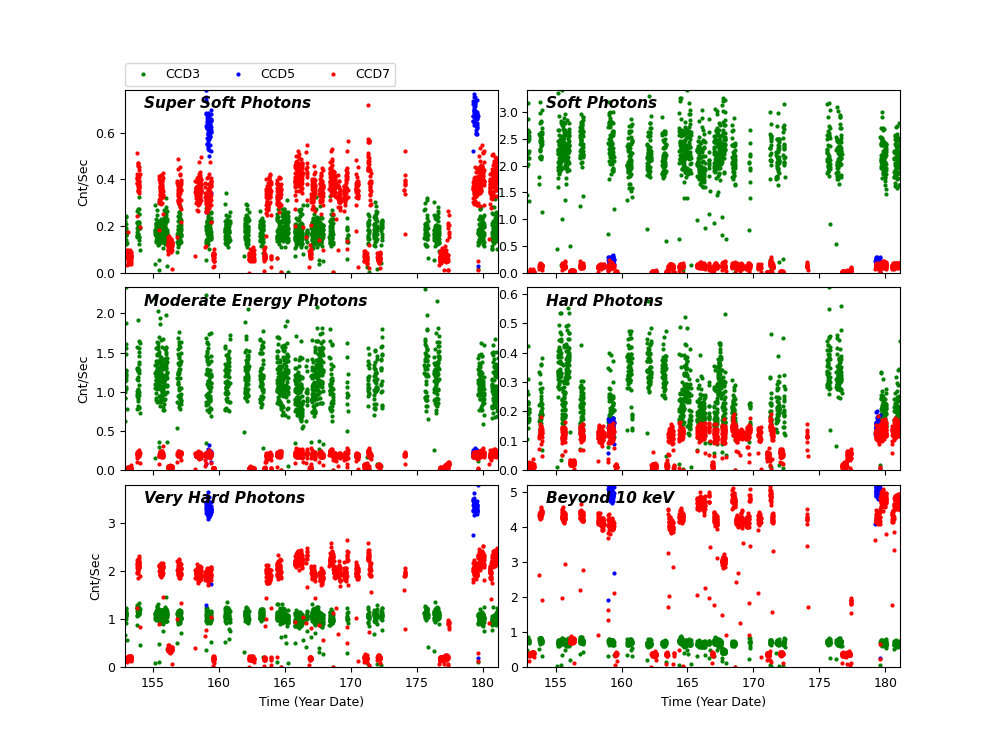
Science Instrument Background Rates
| Name | Low (keV) | High(KeV) | Description |
|---|---|---|---|
| SSoft | 0.00 | 0.50 | Super soft photons |
| Soft | 0.50 | 1.00 | Soft photons |
| Med | 1.00 | 3.00 | Moderate energy photons |
| Hard | 3.00 | 5.00 | Hard Photons |
| Harder | 5.00 | 10.00 | Very Hard photons |
| Hardest | 10.00 | Beyond 10 keV |
HRC
DOSE of Central 4K Pore-Pairs
Please refer to Maximum Dose Trends for more details.
)
|
|---|
IMAGE                NPIX      MEAN    STDDEV      MIN       MAX
HRCI_06_2021.fits  16777216	0.006 	0.079 	0.000 	3.000
)
IMAGE                       NPIX      MEAN    STDDEV      MIN       MAX
HRCI_08_1999_06_2021.fits  16777216	7.030 	6.411 	0.000 	313.000
)
|
|---|
IMAGE                NPIX      MEAN    STDDEV      MIN       MAX
HRCS_06_2021.fits  16777216	0.104 	0.410 	0.000 	22.000
)
IMAGE                       NPIX      MEAN    STDDEV      MIN       MAX
HRCS_08_1999_06_2021.fits  16777216	20.145 	35.677 	0.000 	1761.000
|
|
Max dose trend plots corrected for events that "pile-up"
in the center of the taps due to bad position information.
|
)
|
)
|
)
|
)
|
| Mar 2021 | Dec 2020 | Sep 2020 | Jun 2020 |
|---|
)
|
)
|
)
|
)
|
| Mar 2021 | Dec 2020 | Sep 2020 | Jun 2020 |
|---|
Gratings
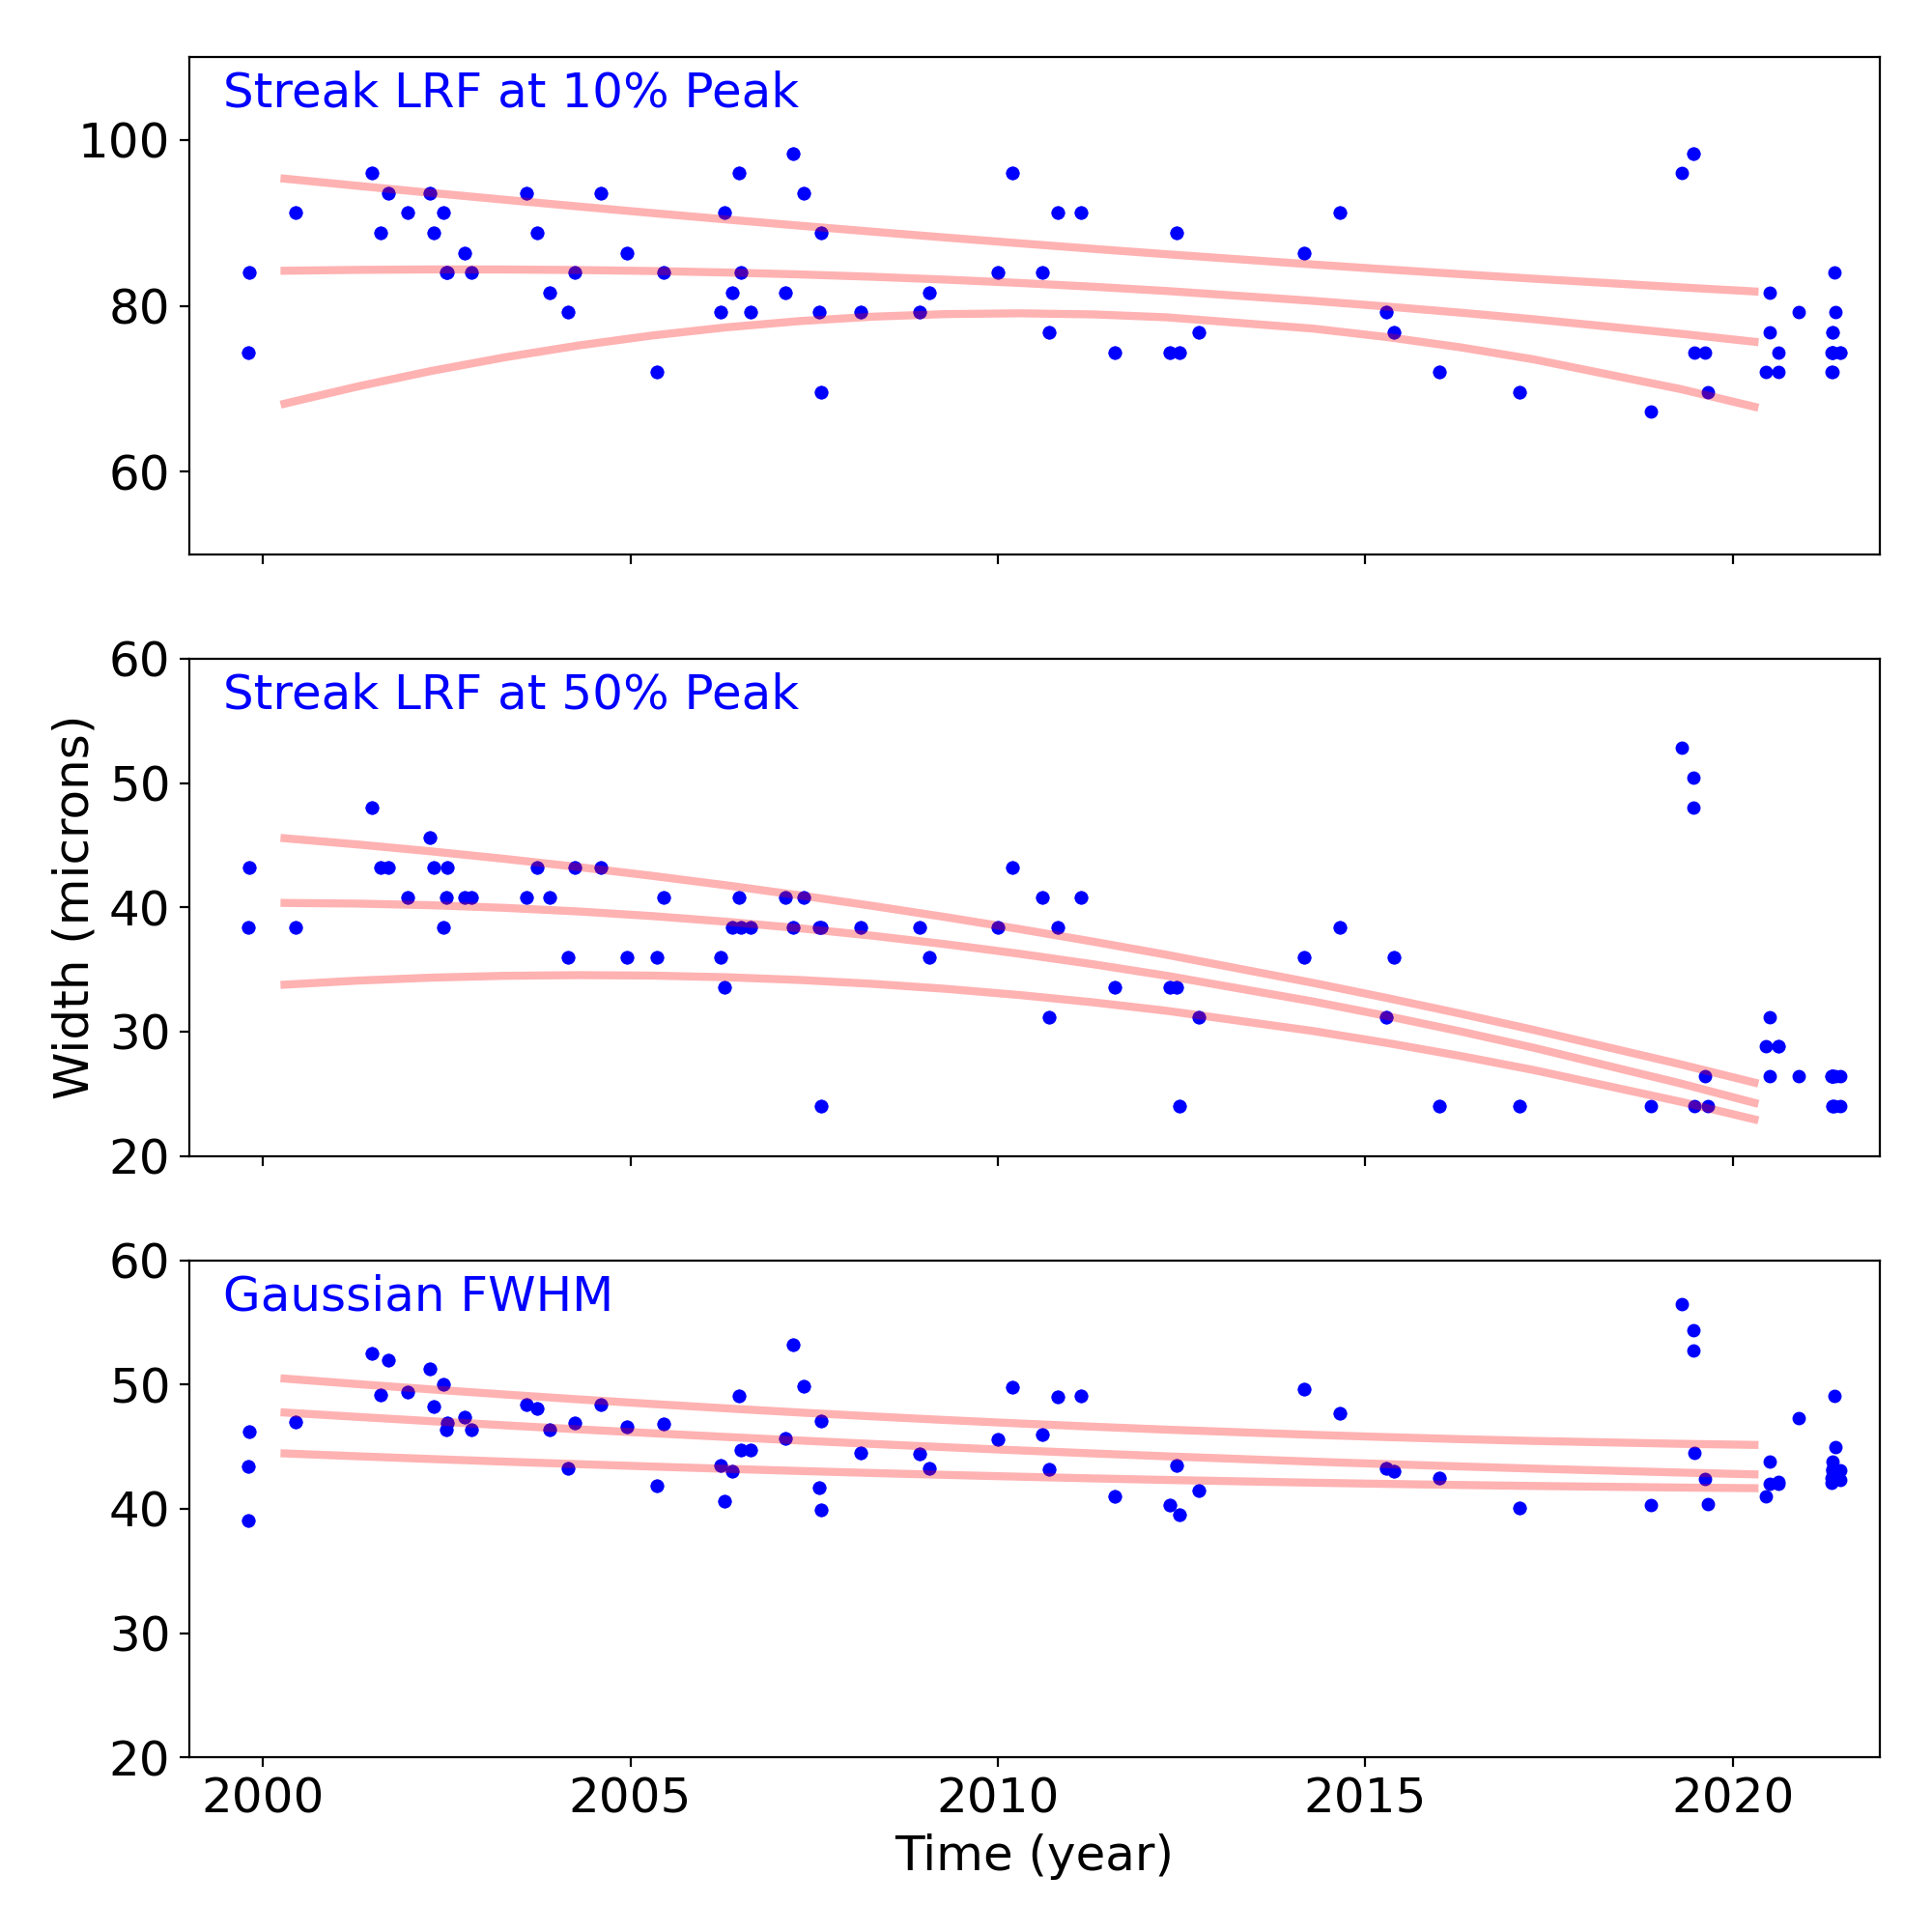
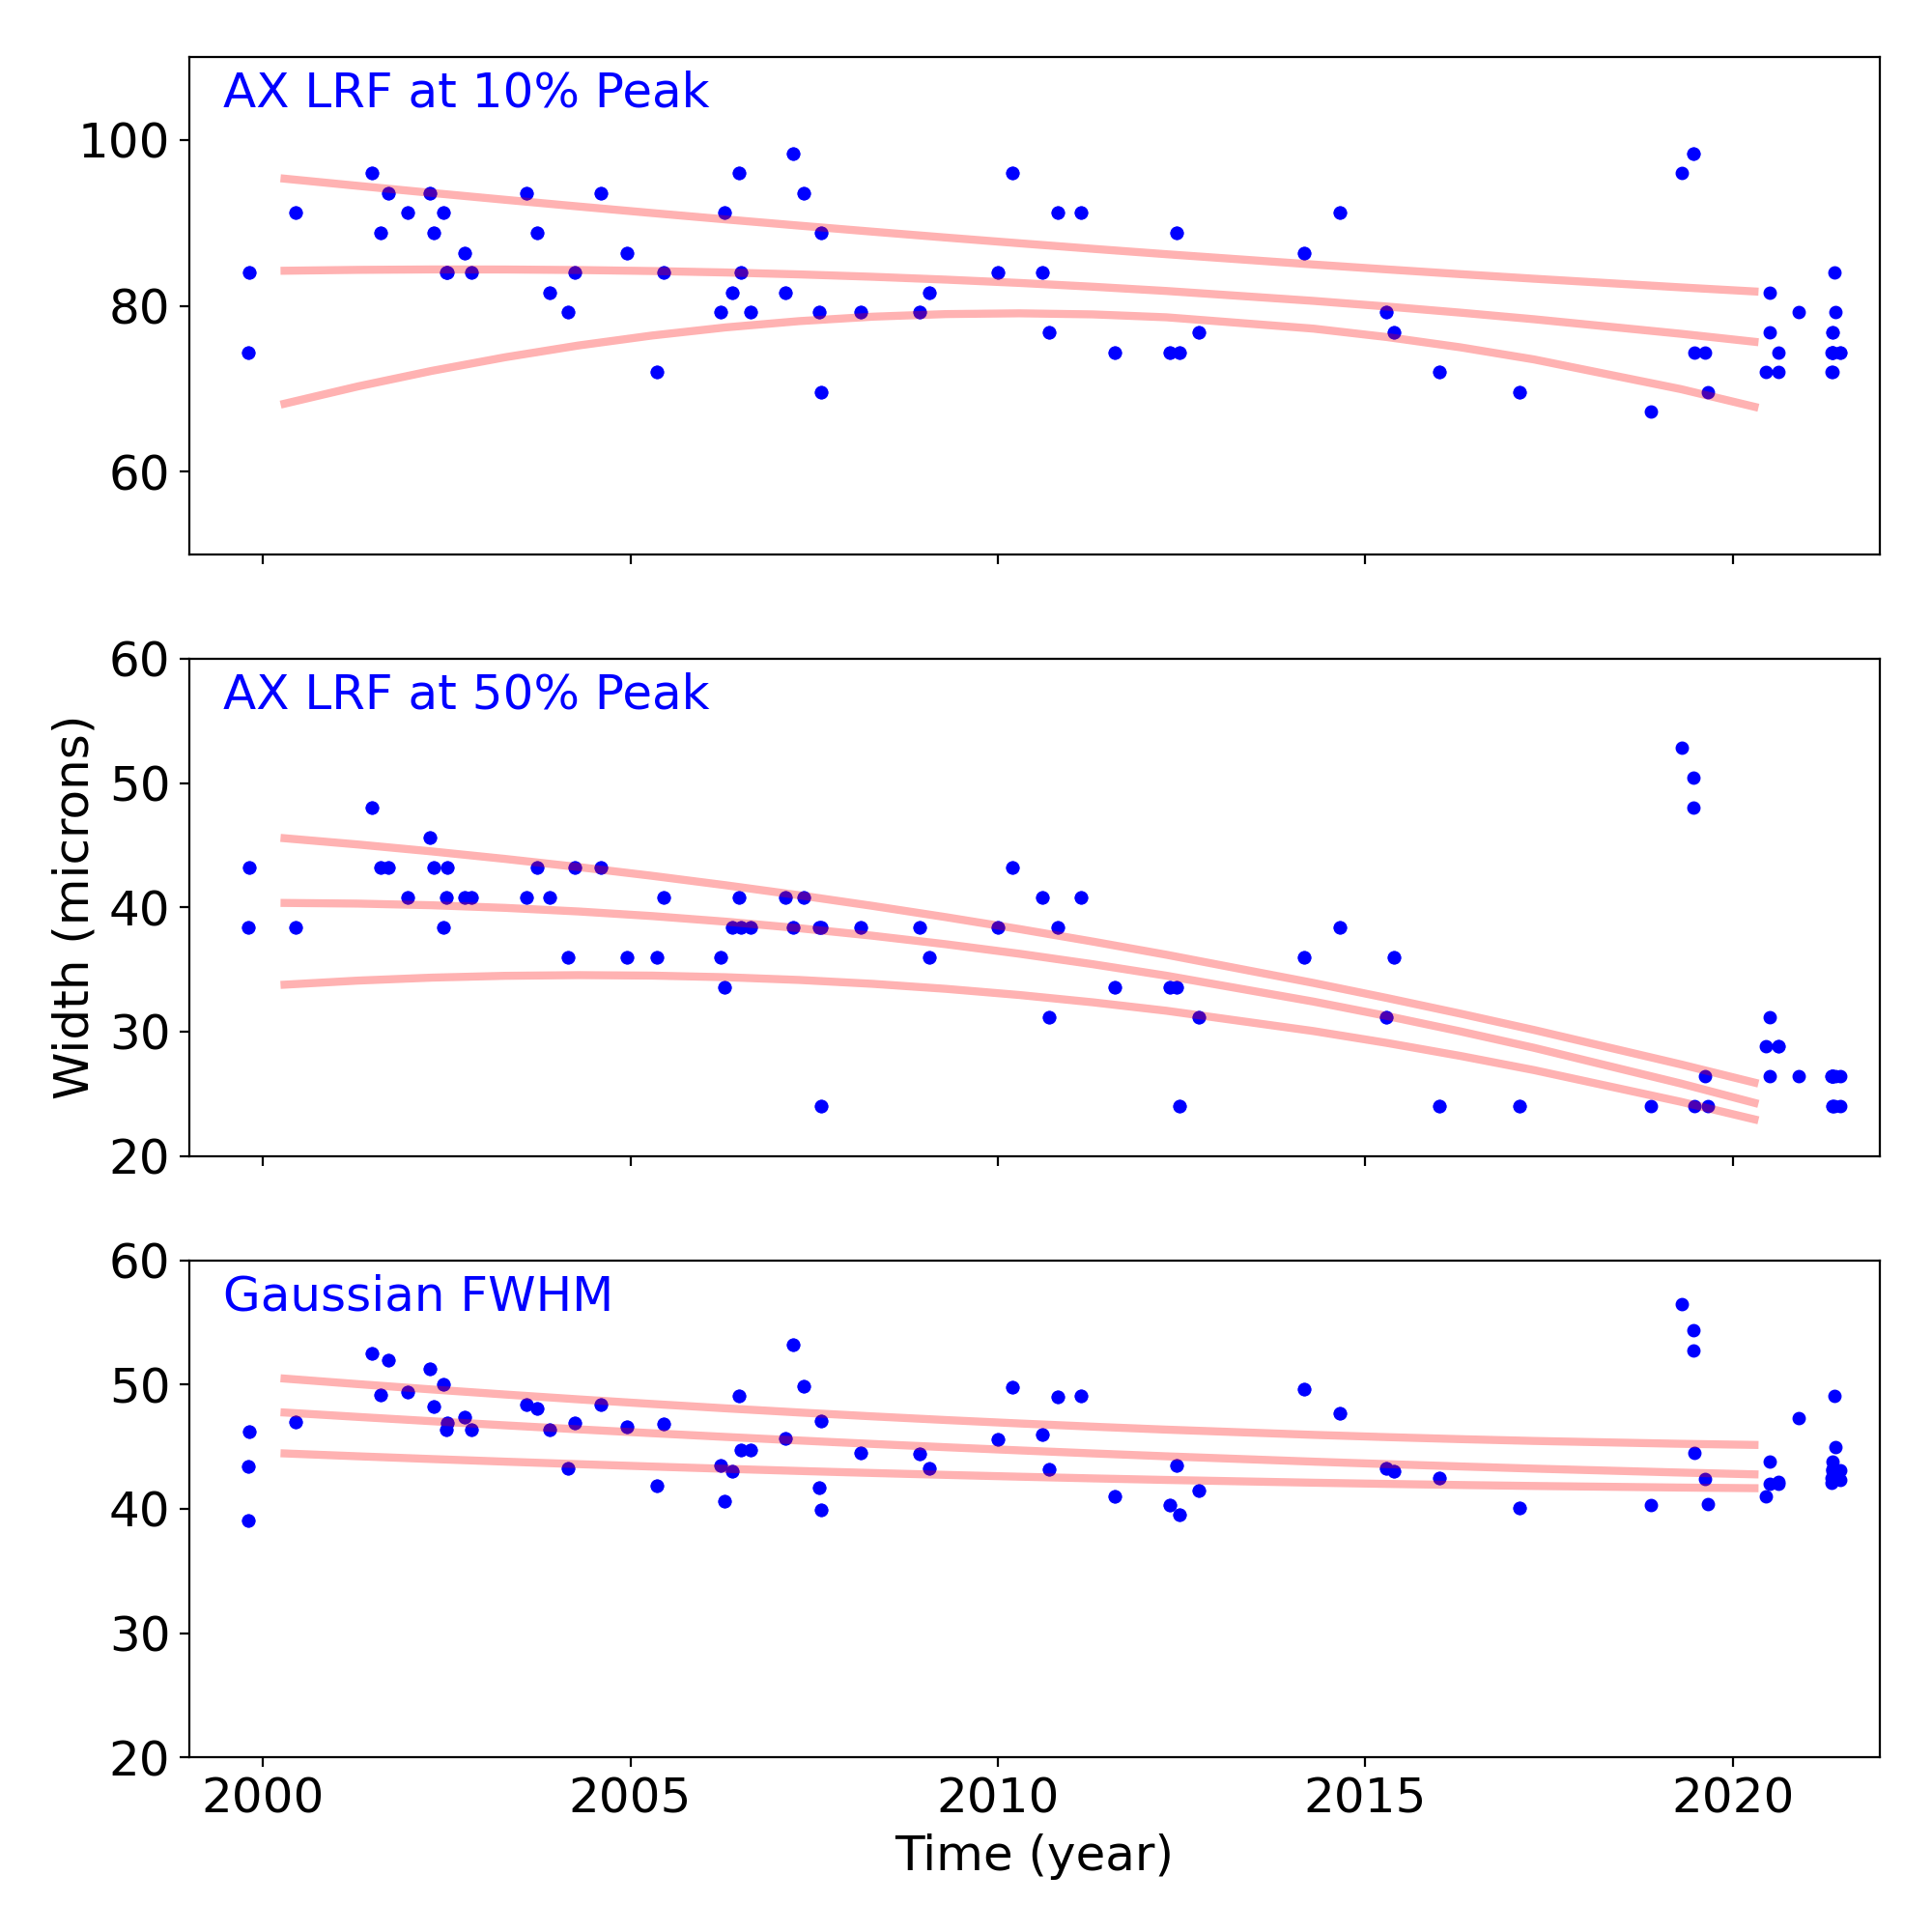
Grating Trends/Focus
We plot the width of the zero order streak of ACIS/HETG observations and the width of the zero order image for HRC/LETG observations of point sources. No significant defocusing trend is seen at this time. See Gratings Trends pages.
PCAD
ACA Trending
| ACIS |
)
|
)
|
)
|
|
|---|---|---|---|---|
)
|
)
|
)
| ||
| HRCI |
)
|
)
|
)
|
)
|
| HRCI |
)
|
)
|
)
|
)
|
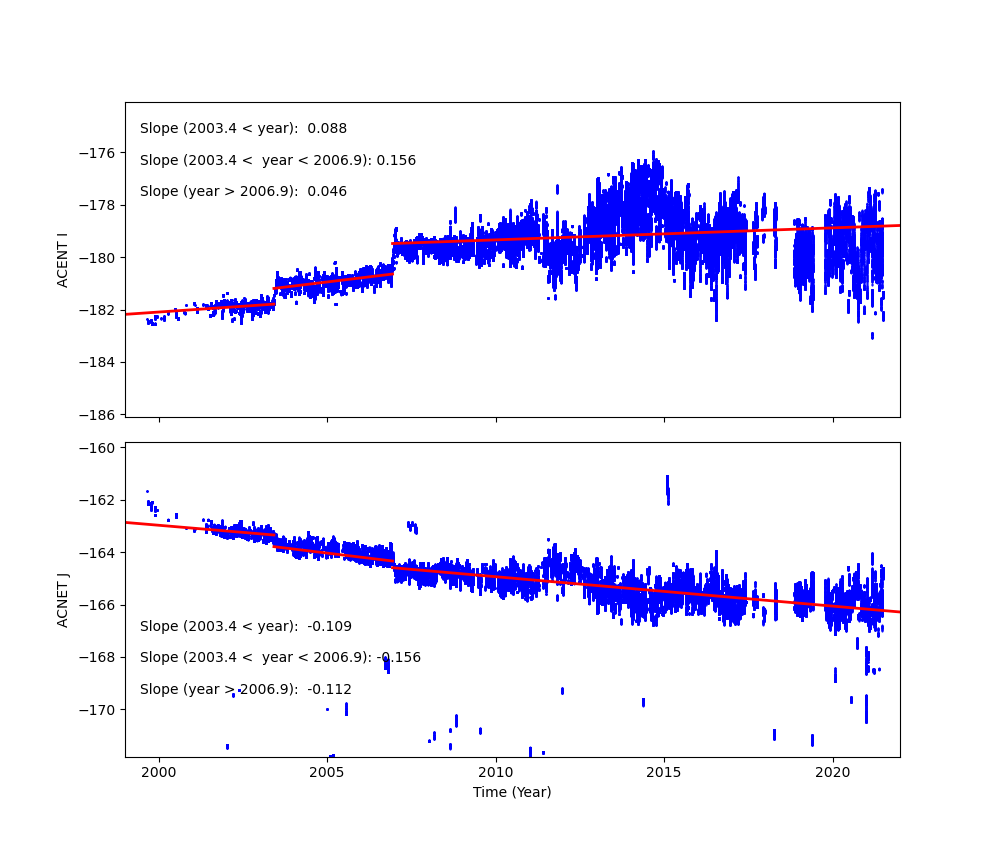
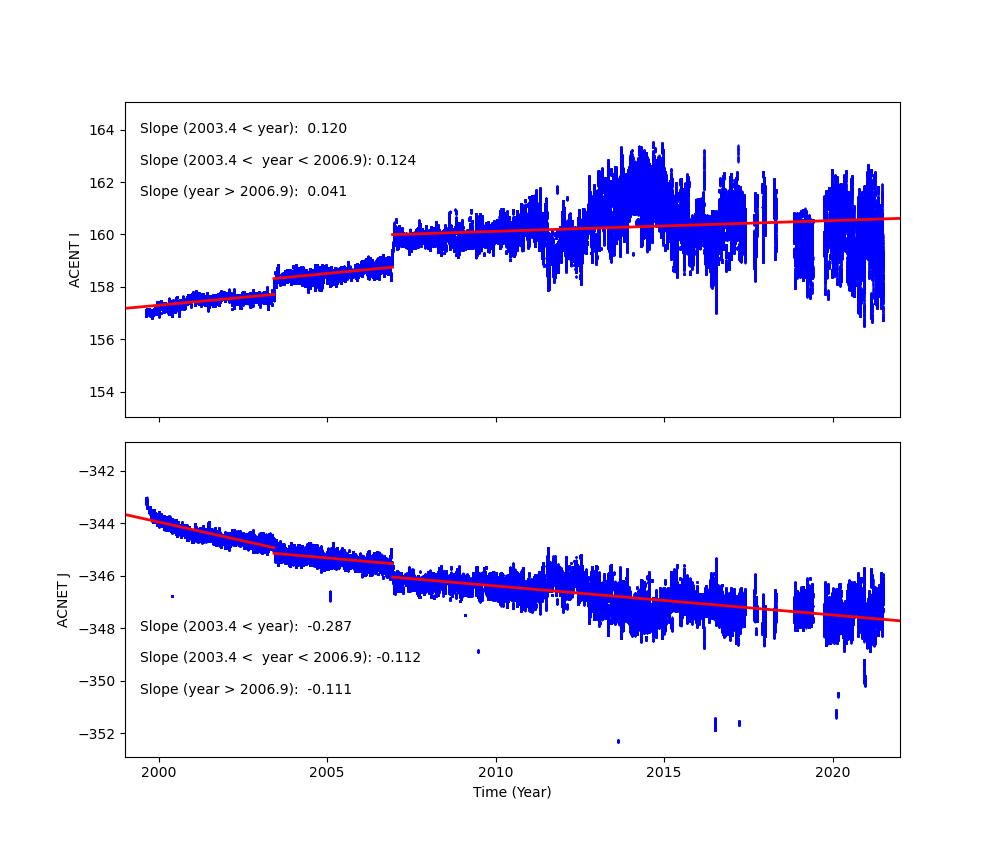
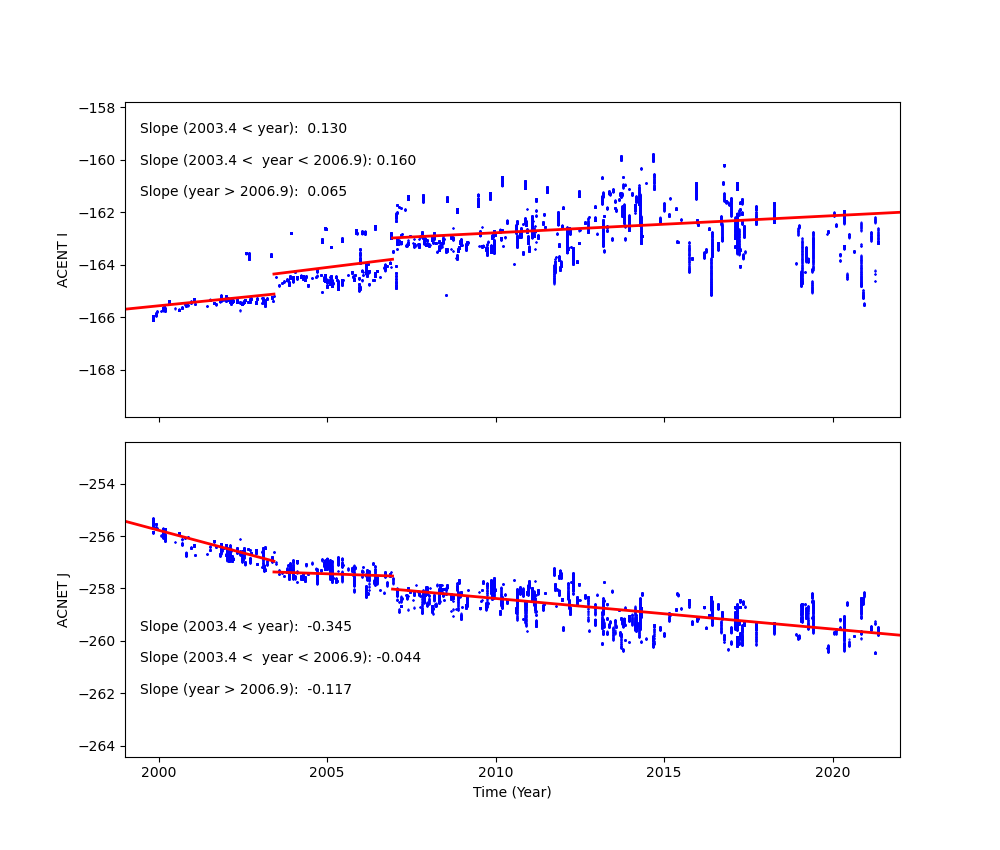
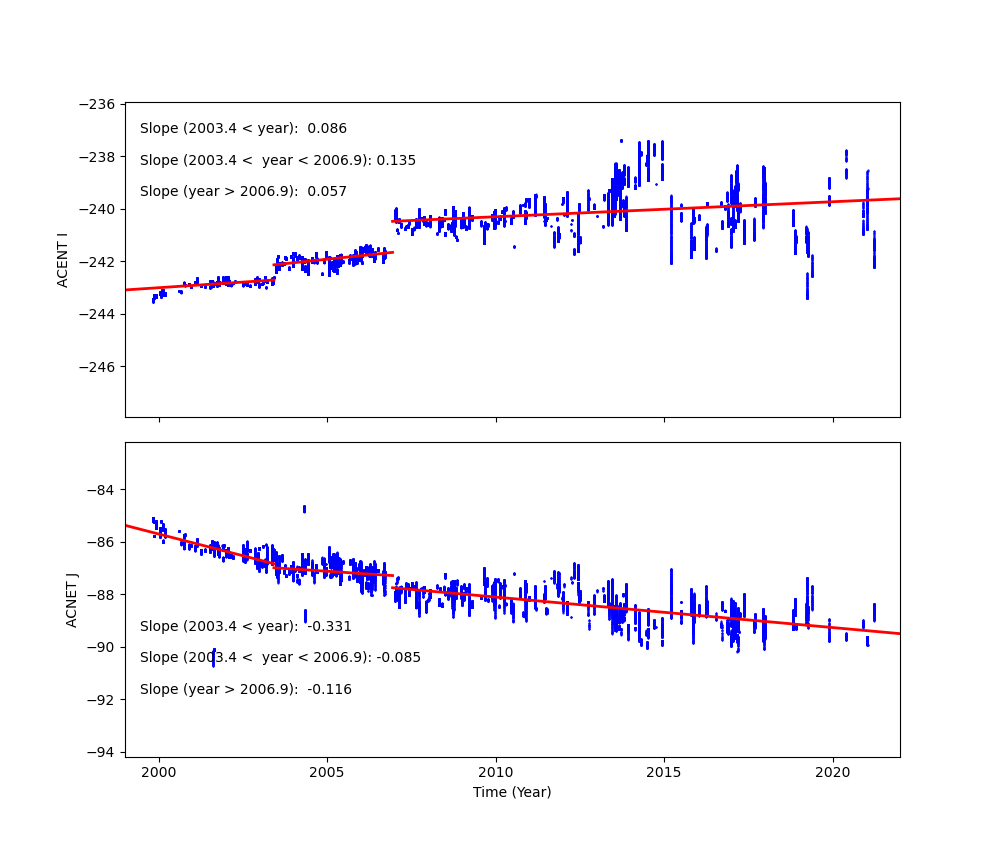
Fid Light Drift
Fid light positions on ACA drift with time. The drift trends of Fid light 2 with ACIS-I and ACIS-S configurations are shown below.
The top panel shows Fid light 2 drift in ACENT I (app. along with -Y axis), and the
bottom panel shows that in ACENT J (app. along with Z axis). The unit is a pixel, and
one pixel is approximately 0.5 arcsec. The slope listed at the top right corner is
the change in a position per year (arcsec/yr). The vertical line on DOM = 1411 (Jun 1, 2003)
indicates a transition date of use of IRU-1 to IRU-2.
See also Tom Aldcroft's updated page:
https://cxc.cfa.harvard.edu/mta/ASPECT/fid_drift
Fid 2 (ACIS-I)
Fid 2 (ACIS-S)
Fid 8 (HRC-I)
Fid 12 (HRC-S)
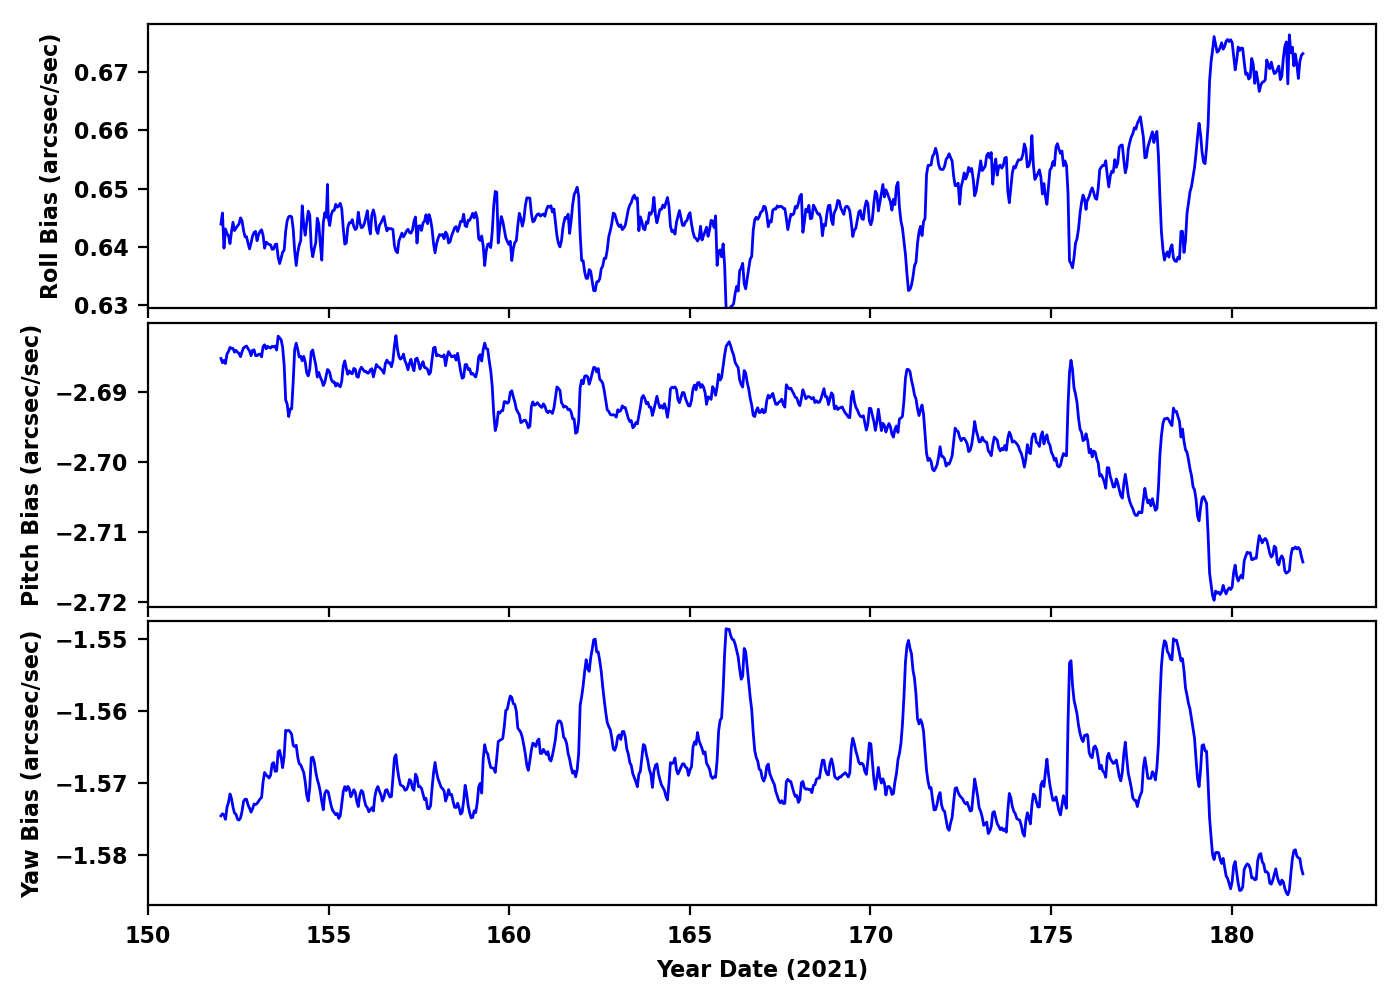
Gyro Bias Drift
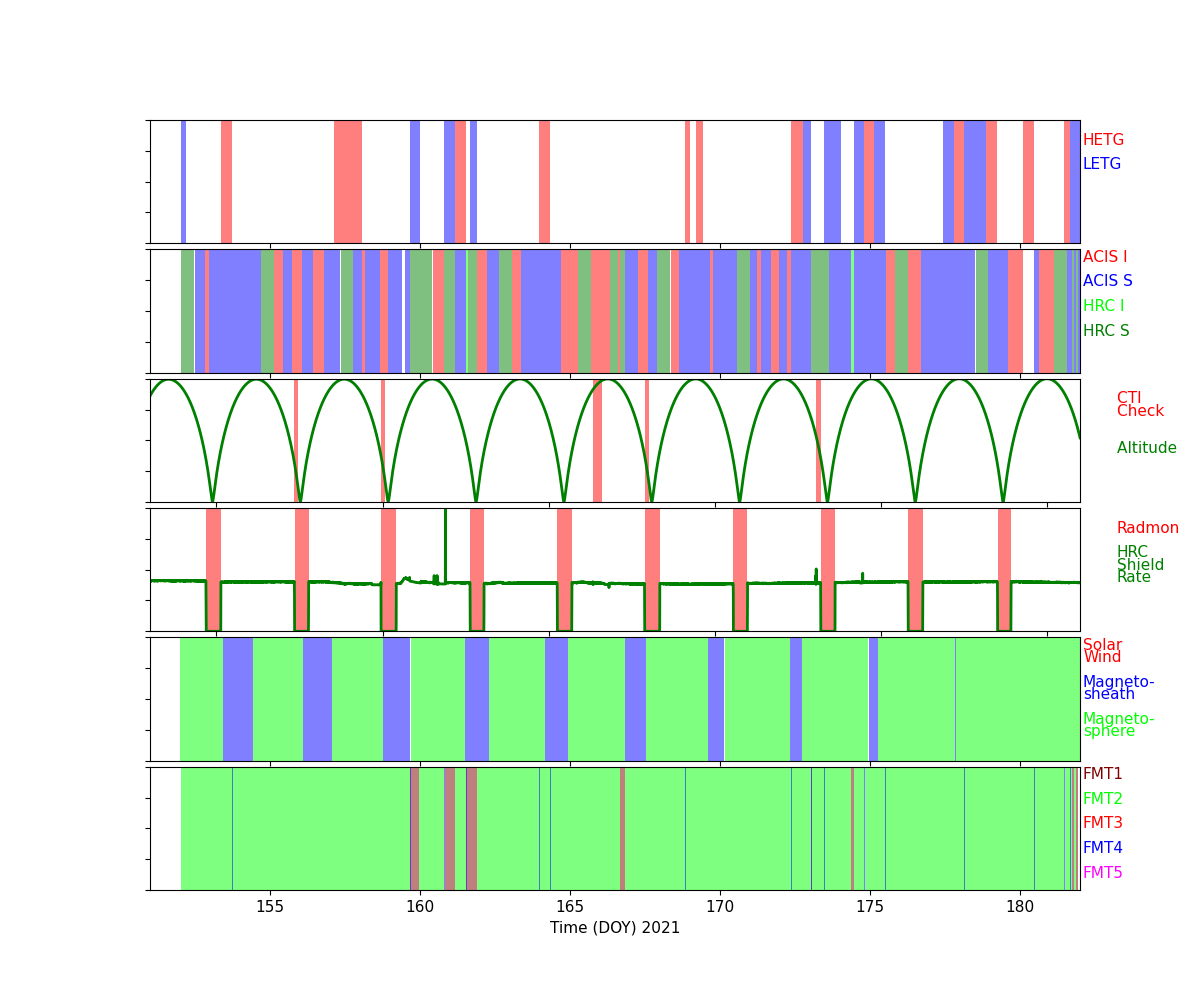
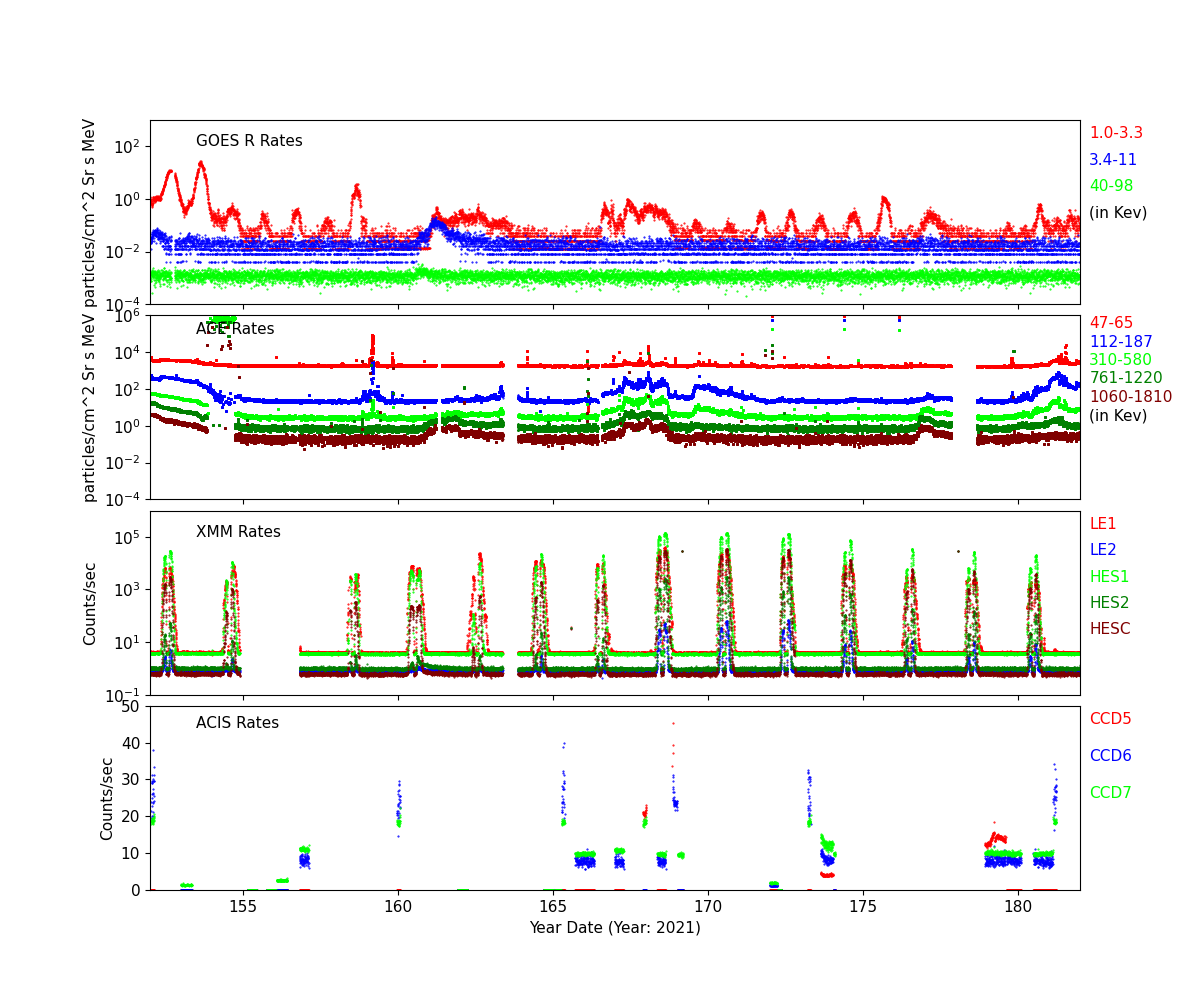
Radiation History
Radiation Count Rates of Jun 2021
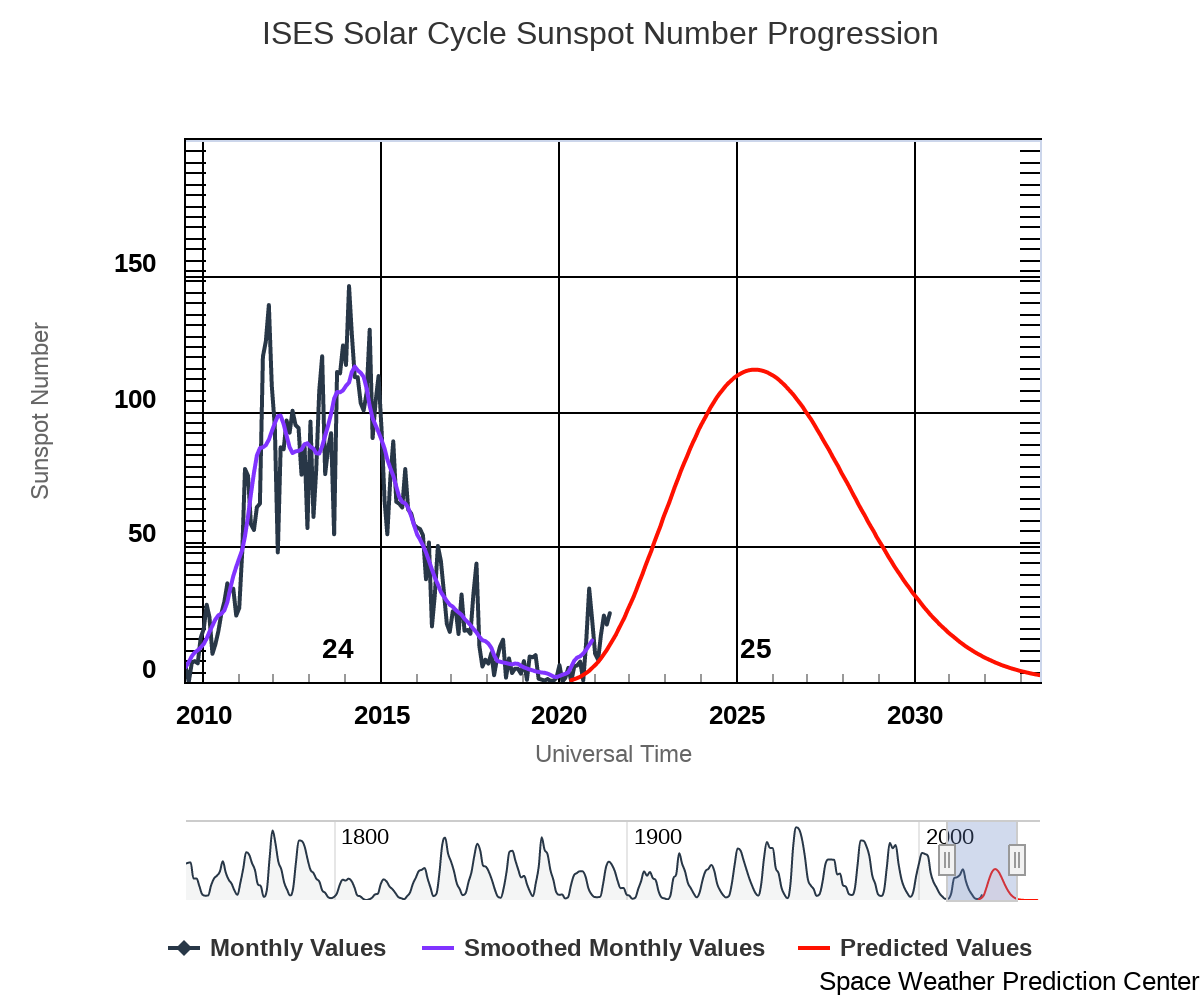
Sun Spot History (See:NOAA Page)
Trending
Critical Trends
| ACIS Temperatures - Daily Maximums | |||||||
|---|---|---|---|---|---|---|---|
| MSID | MEAN | RMS | DELTA/YR | DELTA/YR/YR | UNITS | DESCRIPTION | |
| 1pdeaat | -0.015 | 0.003 | (3.04+/-0.07)e2 | 2.99 +/- 2.00 | K | PSMC DEA PS A TEMP | |
| HRMA Computed Averages - Daily Maximums | |||||||
|---|---|---|---|---|---|---|---|
| MSID | MEAN | RMS | DELTA/YR | DELTA/YR/YR | UNITS | DESCRIPTION | |
| obaavg | -0.018 | 9.078e-04 | (2.98+/-0.02)e2 | -1.07 +/- 0.64 | TEMP | OBA/TFTE | |
| EPHIN Temperatures - Daily Maximums | |||||||
|---|---|---|---|---|---|---|---|
| MSID | MEAN | RMS | DELTA/YR | DELTA/YR/YR | UNITS | DESCRIPTION | |
| teio | 0.003 | 0.010 | (3.25+/-0.24)e2 | -8.45 +/- 4.53 | K | EPHIN ELECTRONICS HOUSING TEMP | |
| tephin | 4.500e-04 | 0.004 | (3.33+/-0.08)e2 | -4.60 +/- 2.75 | K | EPHIN SENSOR HOUSING TEMP | |
| S/C Main Temperatures - Daily Maximums | |||||||
|---|---|---|---|---|---|---|---|
| MSID | MEAN | RMS | DELTA/YR | DELTA/YR/YR | UNITS | DESCRIPTION | |
| tcylfmzm | -0.017 | 0.006 | (3.14+/-0.15)e2 | -6.49 +/- 3.27 | K | CNT CYL TEMP:-Z SIDE UNDER LAE-1 | |
| tcylfmzp | -0.011 | 0.006 | (3.17+/-0.13)e2 | -5.22 +/- 2.96 | K | CNT CYL TEMP:-Z SIDE UNDER LAE-2 | |
| S/C Ancillary Temperatures - Daily Maximums | |||||||
|---|---|---|---|---|---|---|---|
| MSID | MEAN | RMS | DELTA/YR | DELTA/YR/YR | UNITS | DESCRIPTION | |
| tfssbkt1 | 0.014 | 0.012 | (3.45+/-0.29)e2 | 1.32 +/- 4.91 | K | FSS BRAC | |
| tfssbkt2 | 0.004 | 0.014 | (3.41+/-0.32)e2 | -0.15 +/- 5.24 | K | FSS BRAC | |
| tsctsf1 | 0.005 | 0.002 | (3.18+/-0.05)e2 | -2.71 +/- 1.62 | K | SC-TS FITTING -1 TEMP | |
| tsctsf6 | 0.001 | 0.002 | (3.18+/-0.05)e2 | -2.54 +/- 1.66 | K | SC-TS FITTING -6 TEMP | |
| MUPS - Daily Maximums | |||||||
|---|---|---|---|---|---|---|---|
| MSID | MEAN | RMS | DELTA/YR | DELTA/YR/YR | UNITS | DESCRIPTION | |
| pm1thv1t | 0.038 | 0.007 | (3.50+/-0.17)e2 | -4.59 +/- 3.15 | K | MUPS 1 THRUSTER VALVE 01 TEMP | |
| pm2thv1t | 0.052 | 0.020 | (3.22+/-0.47)e2 | -5.48 +/- 8.91 | K | MUPS 2 THRUSTER VALVE 01 TEMP | |
| pm1thv2t | 0.040 | 0.007 | (3.52+/-0.16)e2 | -3.96 +/- 3.21 | K | MUPS 1 THRUSTER VALVE 02 TEMP | |
| pm2thv2t | 0.151 | 0.024 | (3.11+/-0.57)e2 | -8.80 +/- 9.92 | K | MUPS 2 THRUSTER VALVE 02 TEMP | |
| pline02t | 0.026 | 0.006 | (3.32+/-0.13)e2 | -4.71 +/- 2.94 | K | PROP LINE TEMP 02 | |
| pline03t | 0.021 | 0.006 | (3.28+/-0.15)e2 | -4.13 +/- 2.82 | K | PROP LINE TEMP 03 | |
| pline04t | 0.023 | 0.005 | (3.15+/-0.11)e2 | -3.48 +/- 2.72 | K | PROP LINE TEMP 04 | |
Quarterly Trends
- HRMA Struts
| Previous Quarter | |||||||
| MSID | MEAN | RMS | DELTA/YR | DELTA/YR/YR | UNITS | DESCRIPTION | |
| 4rt584t | -0.008 | 5.257e-04 | (3.00+/-0.01)e2 | -1.30 +/- 0.38 | K | RT 584 - STRUT TEMP | |
|---|---|---|---|---|---|---|---|
| 4rt585t | -0.008 | 5.297e-04 | (3.01+/-0.01)e2 | -1.45 +/- 0.38 | K | RT 585 - STRUT TEMP | |
| 4rt586t | -0.009 | 4.458e-04 | (2.97+/-0.01)e2 | -1.25 +/- 0.31 | K | RT 586 - STRUT TEMP | |
| 4rt587t | -0.008 | 3.104e-04 | (2.91+/-0.01)e2 | -0.68 +/- 0.21 | K | RT 587 - STRUT TEMP | |
| 4rt597t | -0.007 | 0.001 | (3.07+/-0.03)e2 | -2.05 +/- 0.91 | K | RT 597 - TFTE TEMP | |
| 4rt598t | -0.006 | 0.001 | (3.07+/-0.03)e2 | -2.48 +/- 0.90 | K | RT 598 - TFTE TEMP | |
- OB Forward Bulkhead
| Previous Quarter | |||||||
| MSID | MEAN | RMS | DELTA/YR | DELTA/YR/YR | UNITS | DESCRIPTION | |
| 4rt705t | -0.011 | 6.305e-04 | (2.92+/-0.02)e2 | -1.23 +/- 0.45 | K | RT 705 - OB BUL | |
|---|---|---|---|---|---|---|---|
| 4rt706t | -0.011 | 6.481e-04 | (2.90+/-0.02)e2 | -1.39 +/- 0.46 | K | RT 706 - OB BUL | |
| 4rt707t | -0.012 | 6.545e-04 | (2.93+/-0.02)e2 | -1.24 +/- 0.47 | K | RT 707 - OB BULKHEAD TEMP | |
| 4rt708t | -0.012 | 7.392e-04 | (2.98+/-0.02)e2 | -1.30 +/- 0.53 | K | RT 708 - OB BULKHEAD TEMP | |
| 4rt709t | -0.012 | 7.957e-04 | (2.99+/-0.02)e2 | -1.36 +/- 0.57 | K | RT 709 - OB BULKHEAD TEMP | |
| 4rt710t | -0.011 | 8.582e-04 | (3.01+/-0.02)e2 | -1.34 +/- 0.62 | K | RT 710 - OB BULKHEAD TEMP | |
- HRMA Thermal
- HRMA Thermal
| Previous Quarter | |||||||
| MSID | MEAN | RMS | DELTA/YR | DELTA/YR/YR | UNITS | DESCRIPTION | |
| 4rt568t | -0.014 | 7.290e-04 | (2.98+/-0.02)e2 | -1.67 +/- 0.52 | K | RT 568 - HRMA TEMP | |
|---|---|---|---|---|---|---|---|
| 4rt569t | -0.005 | 1.894e-04 | (2.96+/-0.00)e2 | -0.42 +/- 0.11 | K | RT 569 - HRMA TEMP | |
| 4rt570t | -0.003 | 9.528e-05 | (2.95+/-0.00)e2 | -0.07 +/- 0.04 | K | RT 570 - HRMA TEMP | |
| 4rt575t | -0.012 | 9.484e-04 | (3.03+/-0.02)e2 | -1.84 +/- 0.69 | K | RT 575 - OB CONE TEMP | |
| 4rt576t | -0.013 | 6.930e-04 | (2.94+/-0.02)e2 | -1.63 +/- 0.49 | K | RT 576 - OB CONE TEMP | |
| 4rt578t | -0.030 | 0.001 | (3.01+/-0.03)e2 | -1.62 +/- 0.87 | K | RT 578 - OB CONE TEMP | |
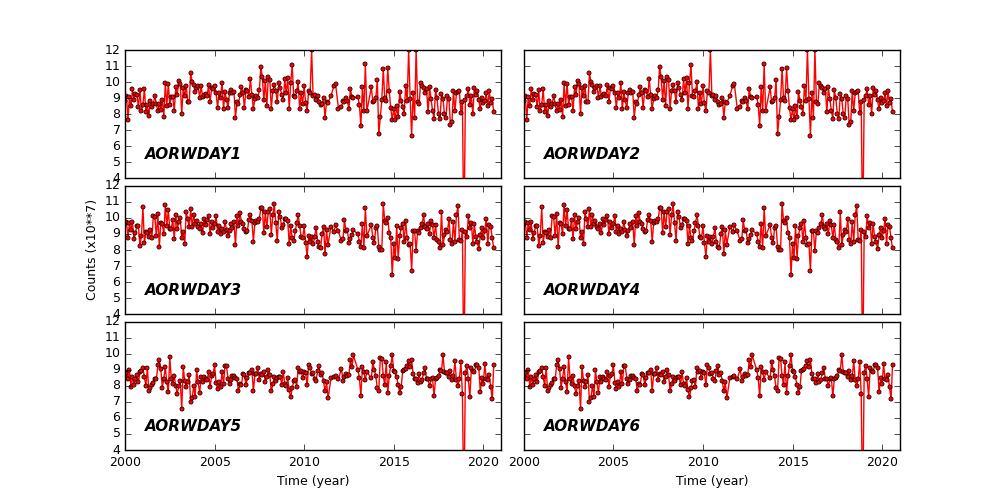
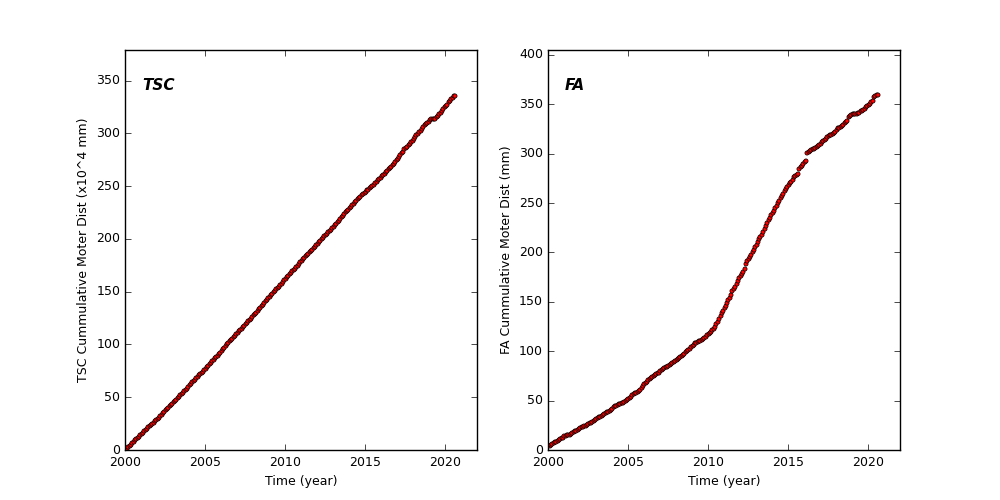
Spacecraft Motions
TSC and FA Cummulative Moter Distance
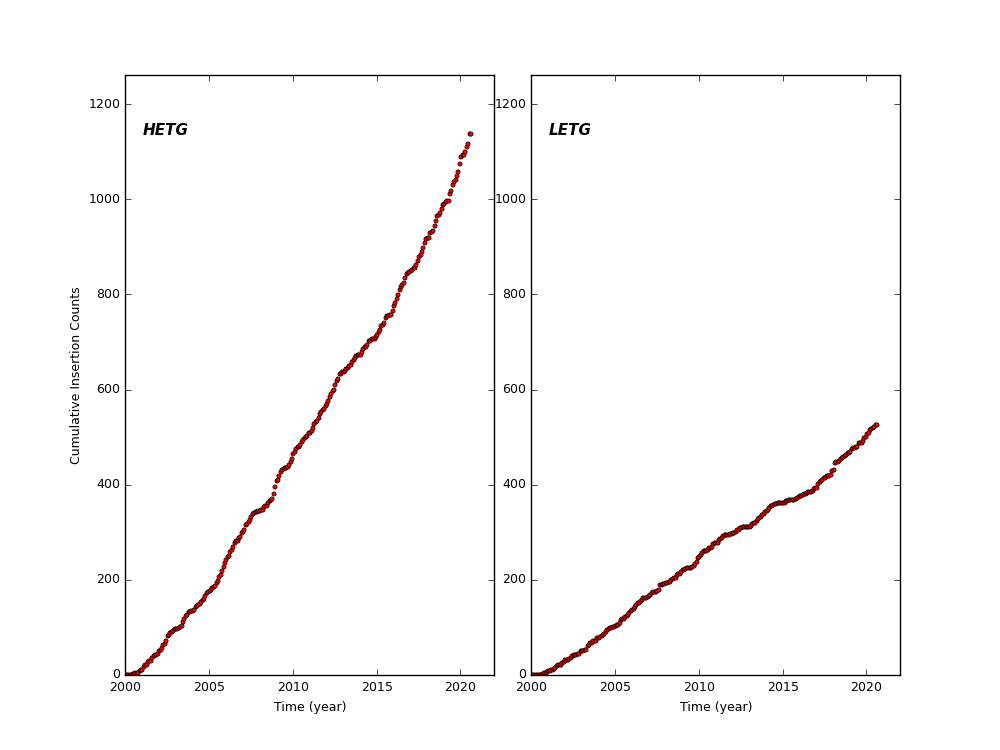
HETG and LETG Cummulative Insertion Counts
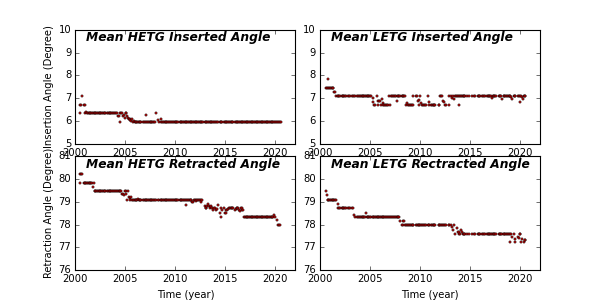
HETG/LETG Insertion/Retraction Angle
Reaction Wheel Rotations