ACIS
ACIS DOSE Registered-Photon-Map
The steps we took to compute the dose map are;
- Level 1 Event files for a specified month are obtained from archive.
- Image data including I2, I3, S2, S3 CCDs are extracted from all event files.
- All the extracted image data were merged to create a month long exposure map for the month.
- The exposure map is opened with ds9, and check a distribution of count rates against energy. From this, estimate the upper threshold value. Any events beyond this upper threshold are assumed erroneous events such as bad pixels.
- Using this upper threshold, the data is filtered, and create a cleaned exposure map for the month.
- The exposure map from each month from the Sep 1999 is added up to create a cumulative exposure map for each month.
- Using fimgstatistic, we compute count rate statistics for each CCDs.
- For observations with high data drop rates (e.g., Crab nebula, Cas A), we corrected the observations by adding events.
Please check more detail plots at Telemetered Photon Dose Trend page.
)
)
)
Statistics:
# IMAGE     NPIX     MEAN        RMS        MIN     MAX
ACIS_nov21 6004901       7.543         9.131           0.0     1178


I2 node 0  262654	5.957582	2.952787	0.0	 56.0
I2 node 1  262654	6.482349	3.928779	0.0	1178.0
I2 node 2  262654	6.523395	3.102891	0.0	 69.0
I2 node 3  262654	5.957844	3.078554	0.0	271.0

I3 node 0  262654	8.063741	3.627936	0.0	105.0
I3 node 1  262654	8.374660	3.832703	0.0	302.0
I3 node 2  262654	8.024842	3.428908	0.0	 76.0
I3 node 3  262654	7.694135	3.382108	0.0	148.0

S2 node 0  262654	10.086903	5.001393	0.0	1138.0
S2 node 1  262654	10.841857	4.671921	0.0	344.0
S2 node 2  262654	11.112389	4.974061	0.0	815.0
S2 node 3  262654	10.221354	4.387075	0.0	686.0

S3 node 0  262654	13.749031	5.795028	1.0	114.0
S3 node 1  262654	16.422930	5.785562	0.0	705.0
S3 node 2  262654	16.089162	5.061628	1.0	894.0
S3 node 3  262654	13.774245	4.195131	0.0	 60.0
)
)
)
Statistics:
 IMAGE     NPIX      MEAN        RMS           MIN      MAX
ACIS_total   6004901       2531.523         3254.303           0.0   139932


I2 node 0  262654	2187.947656	439.455979	466.0	13125.0
I2 node 1  262654	2301.142958	623.975649	483.0	124876.0
I2 node 2  262654	2329.292155	494.020460	501.0	13644.0
I2 node 3  262654	2334.865576	603.506027	475.0	28811.0

I3 node 0  262654	2509.933914	617.379529	464.0	13574.0
I3 node 1  262654	2587.147719	1727.580609	500.0	55718.0
I3 node 2  262654	2300.918926	431.227733	469.0	13665.0
I3 node 3  262654	2292.625543	463.191584	439.0	34458.0

S2 node 0  262654	2951.035505	478.202071	1604.0	22297.0
S2 node 1  262654	3128.465787	709.979625	1790.0	16957.0
S2 node 2  262654	3461.796714	714.620162	2210.0	29343.0
S2 node 3  262654	3423.556371	568.642599	1943.0	69960.0

S3 node 0  262654	5257.428485	2892.713575	2290.0	53479.0
S3 node 1  262654	6451.765752	2351.216549	0.0	38637.0
S3 node 2  262654	5190.725854	1337.579782	2347.0	27128.0
S3 node 3  262654	4058.097405	751.611242	2455.0	26369.0
)
|
)
|
)
|
)
|
| Aug 2021 | May 2021 | Feb 2021 | Nov 2020 |
|---|
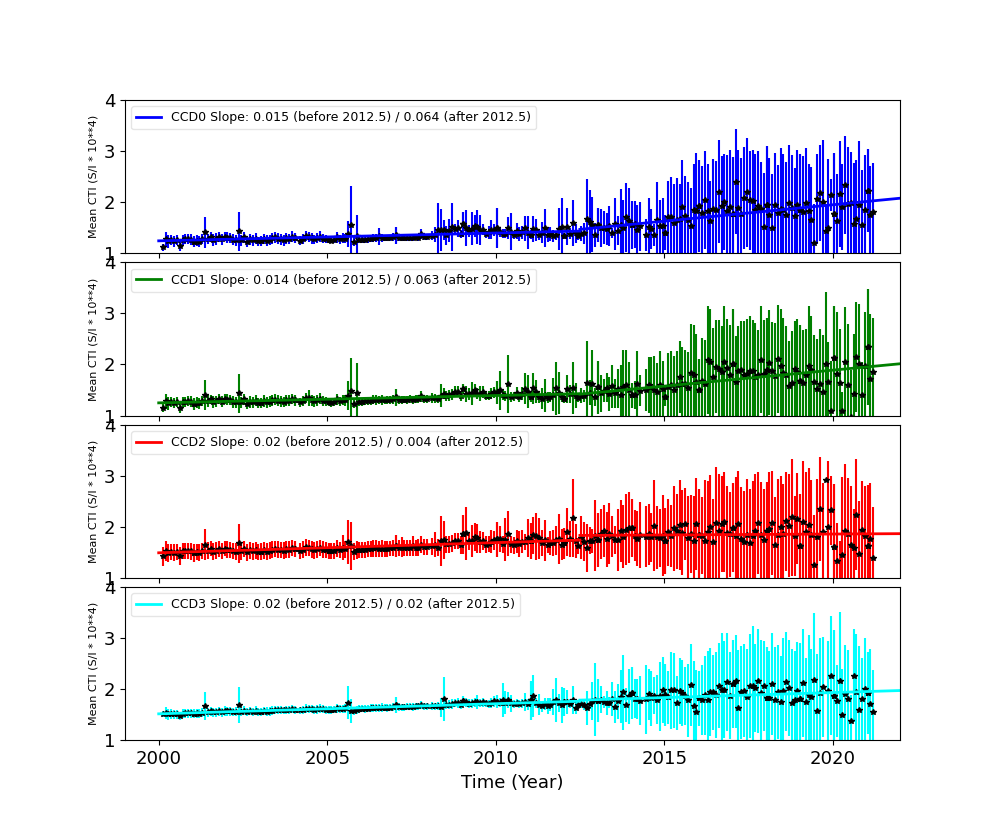
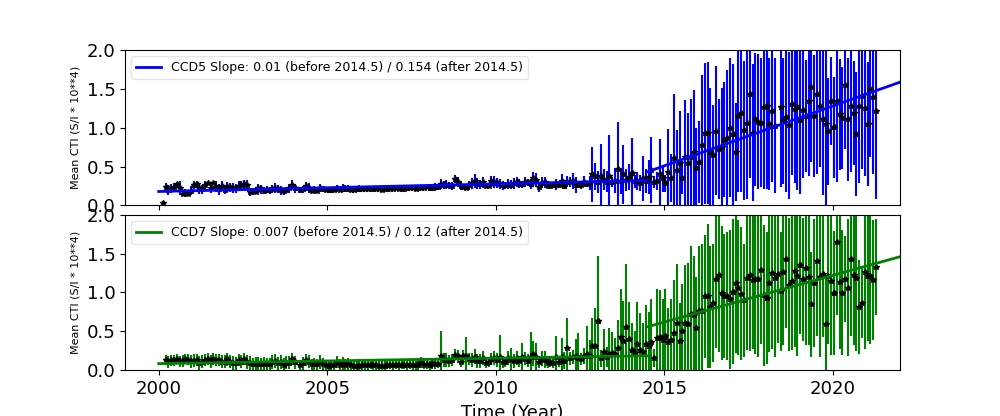
The Mean Detrended CTI
We report CTIs with a refined data definition. CTIs were computed for the temperature dependency corrected data. Please see CTI page for detailed explanation. CTI's are computed for Mn K alpha, and defined as slope/intercept x10^4 of row # vs ADU. Data file: here
Imaging CCDs
Spectral CCDs
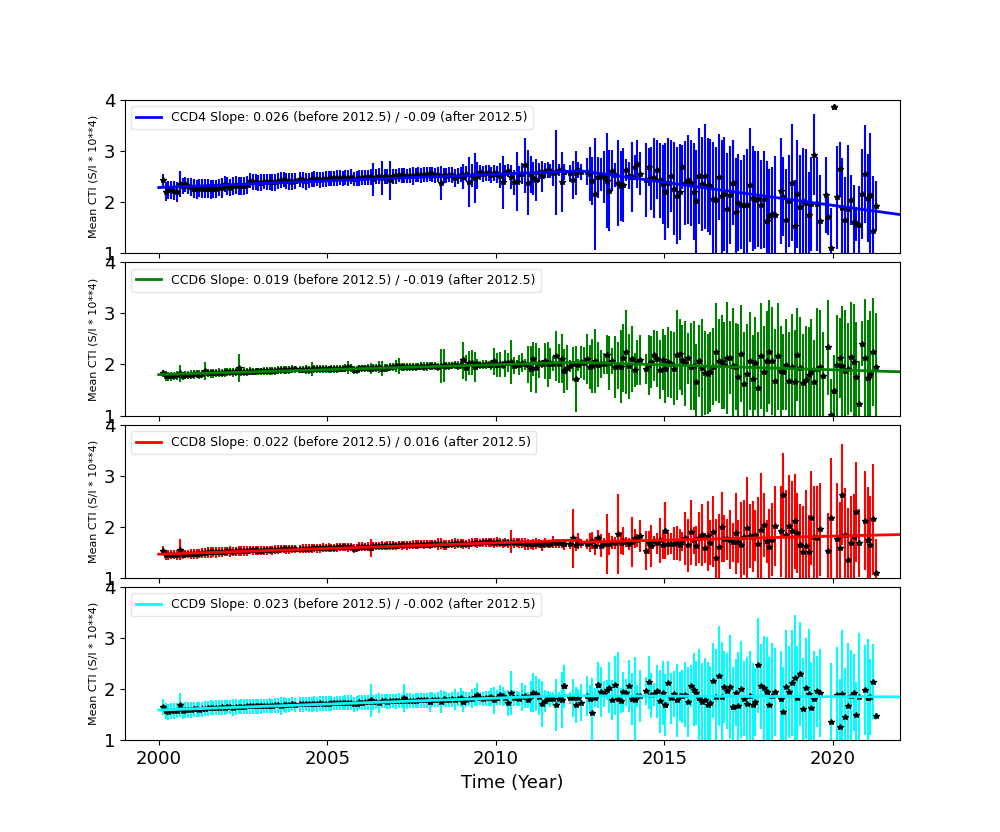
Backside CCDs
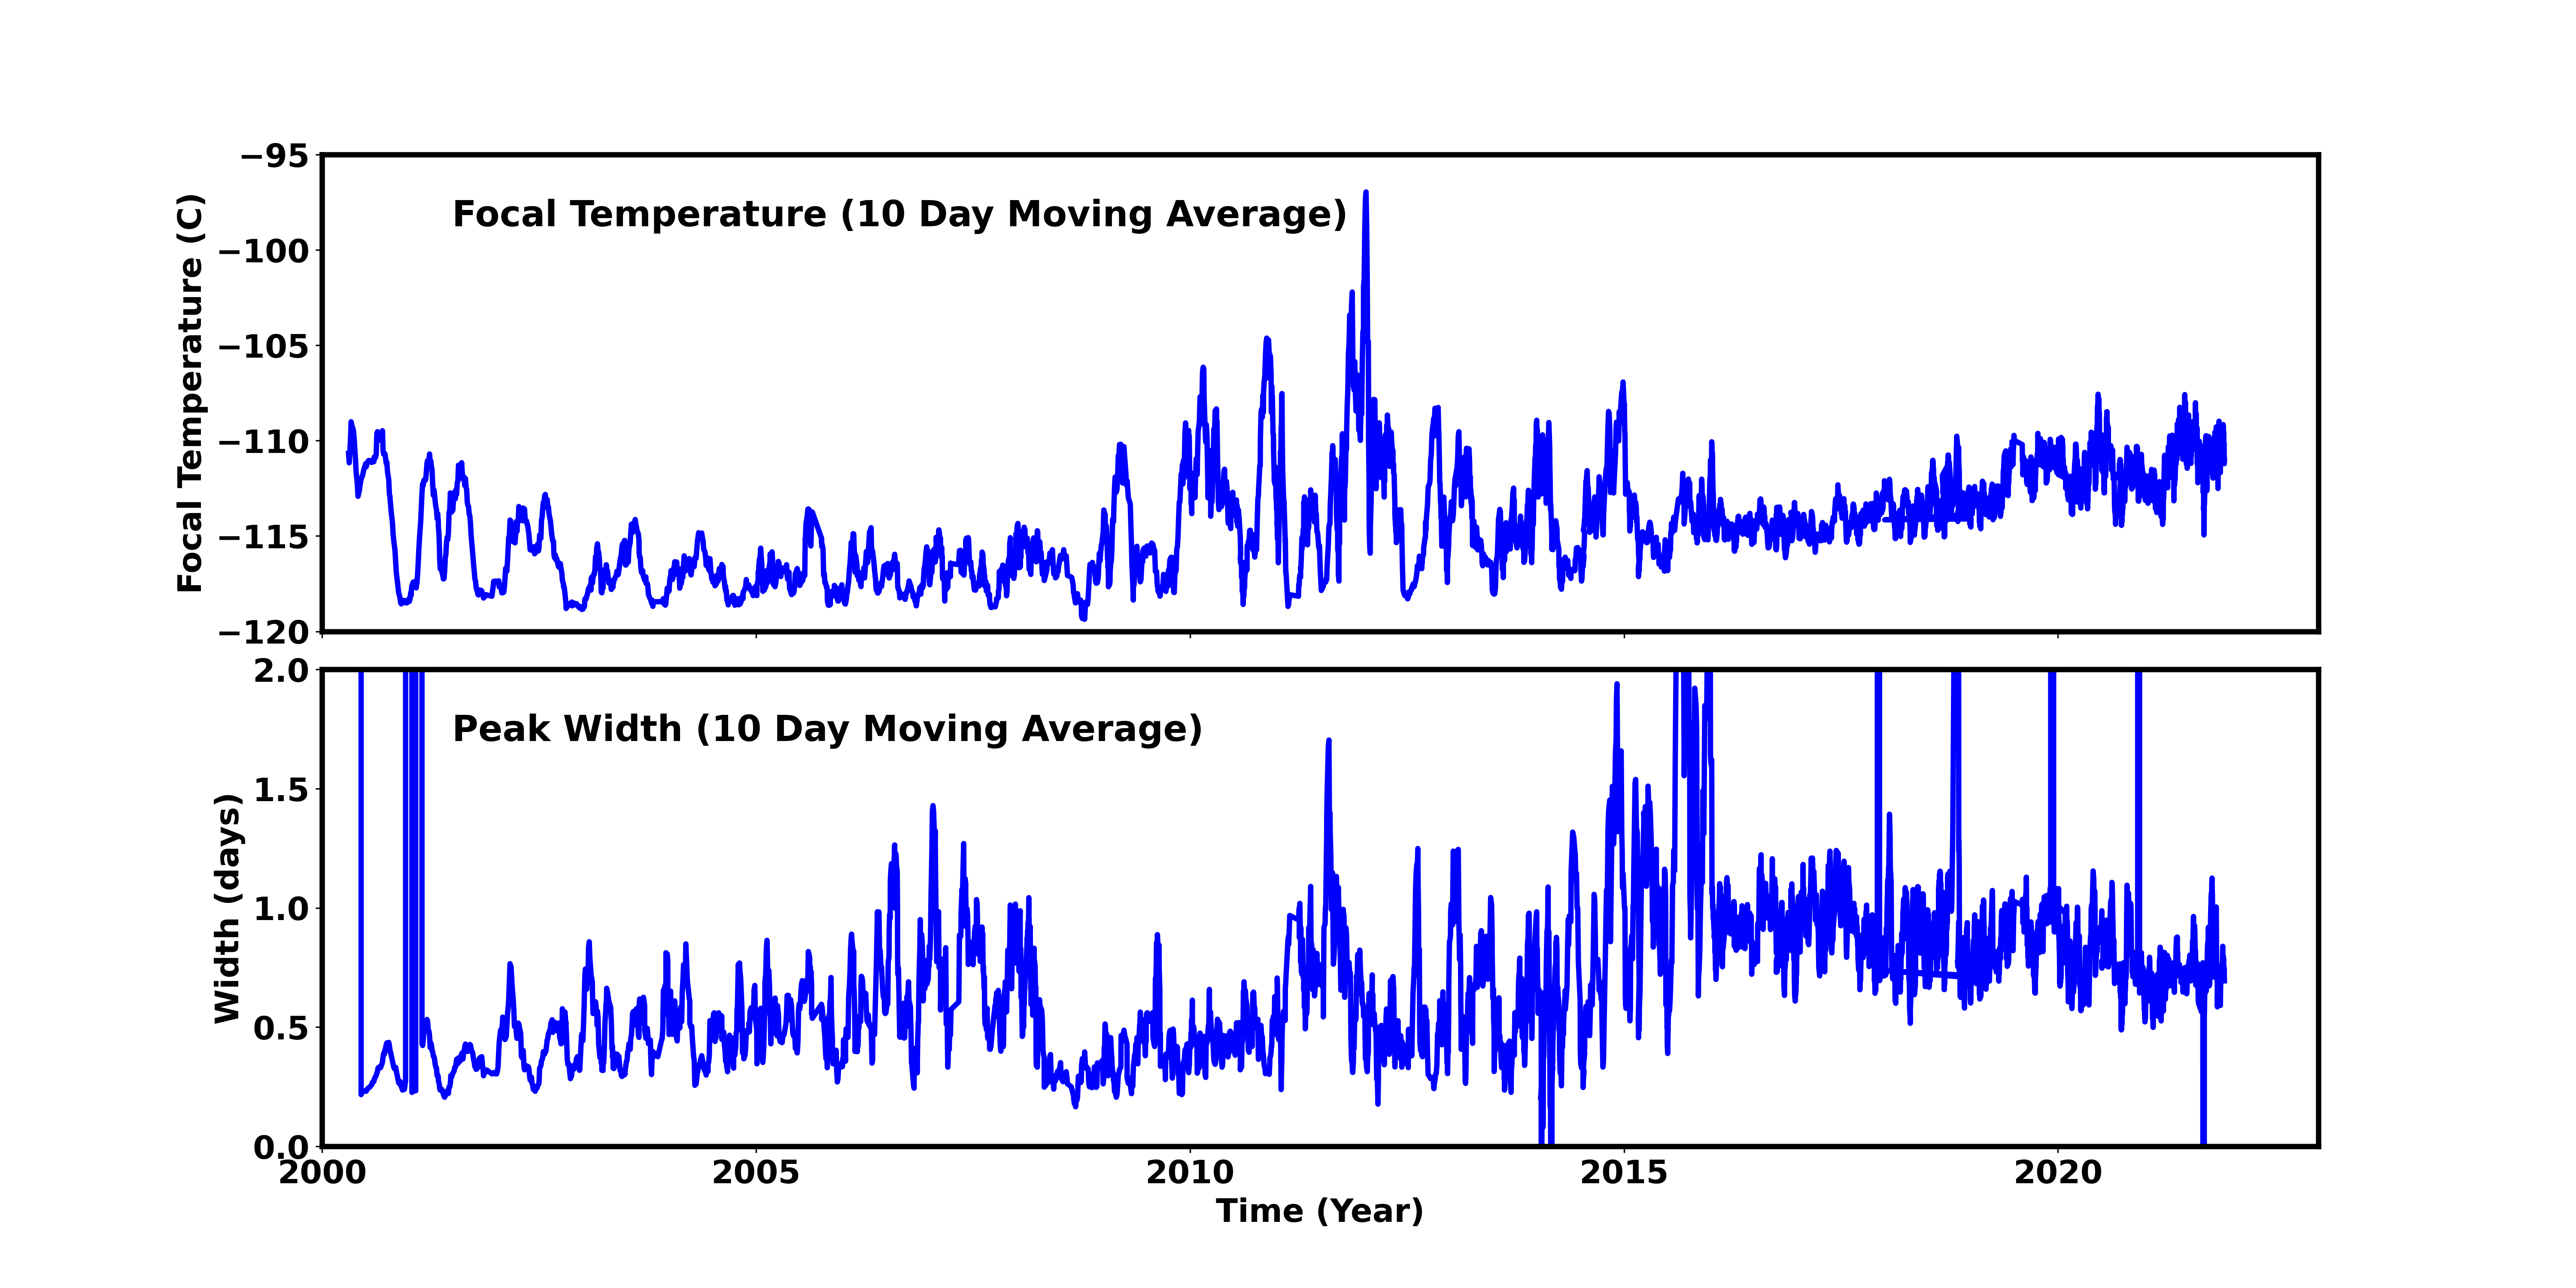
Focal Plane Temperature
Nov 2021 Focal Temperature
| The Mean (max) FPT: | |
|---|---|
| -110.16 | +/- 4.91 C |
| Mean Width: | |
| 0.71 | +/- 0.27 days |
Averaged Focal Plane Temperature
We are using 10 period moving averages to show trends of peak temperatures and peak widths. Note, the gaps in the width plot are due to missing/corrupted data.
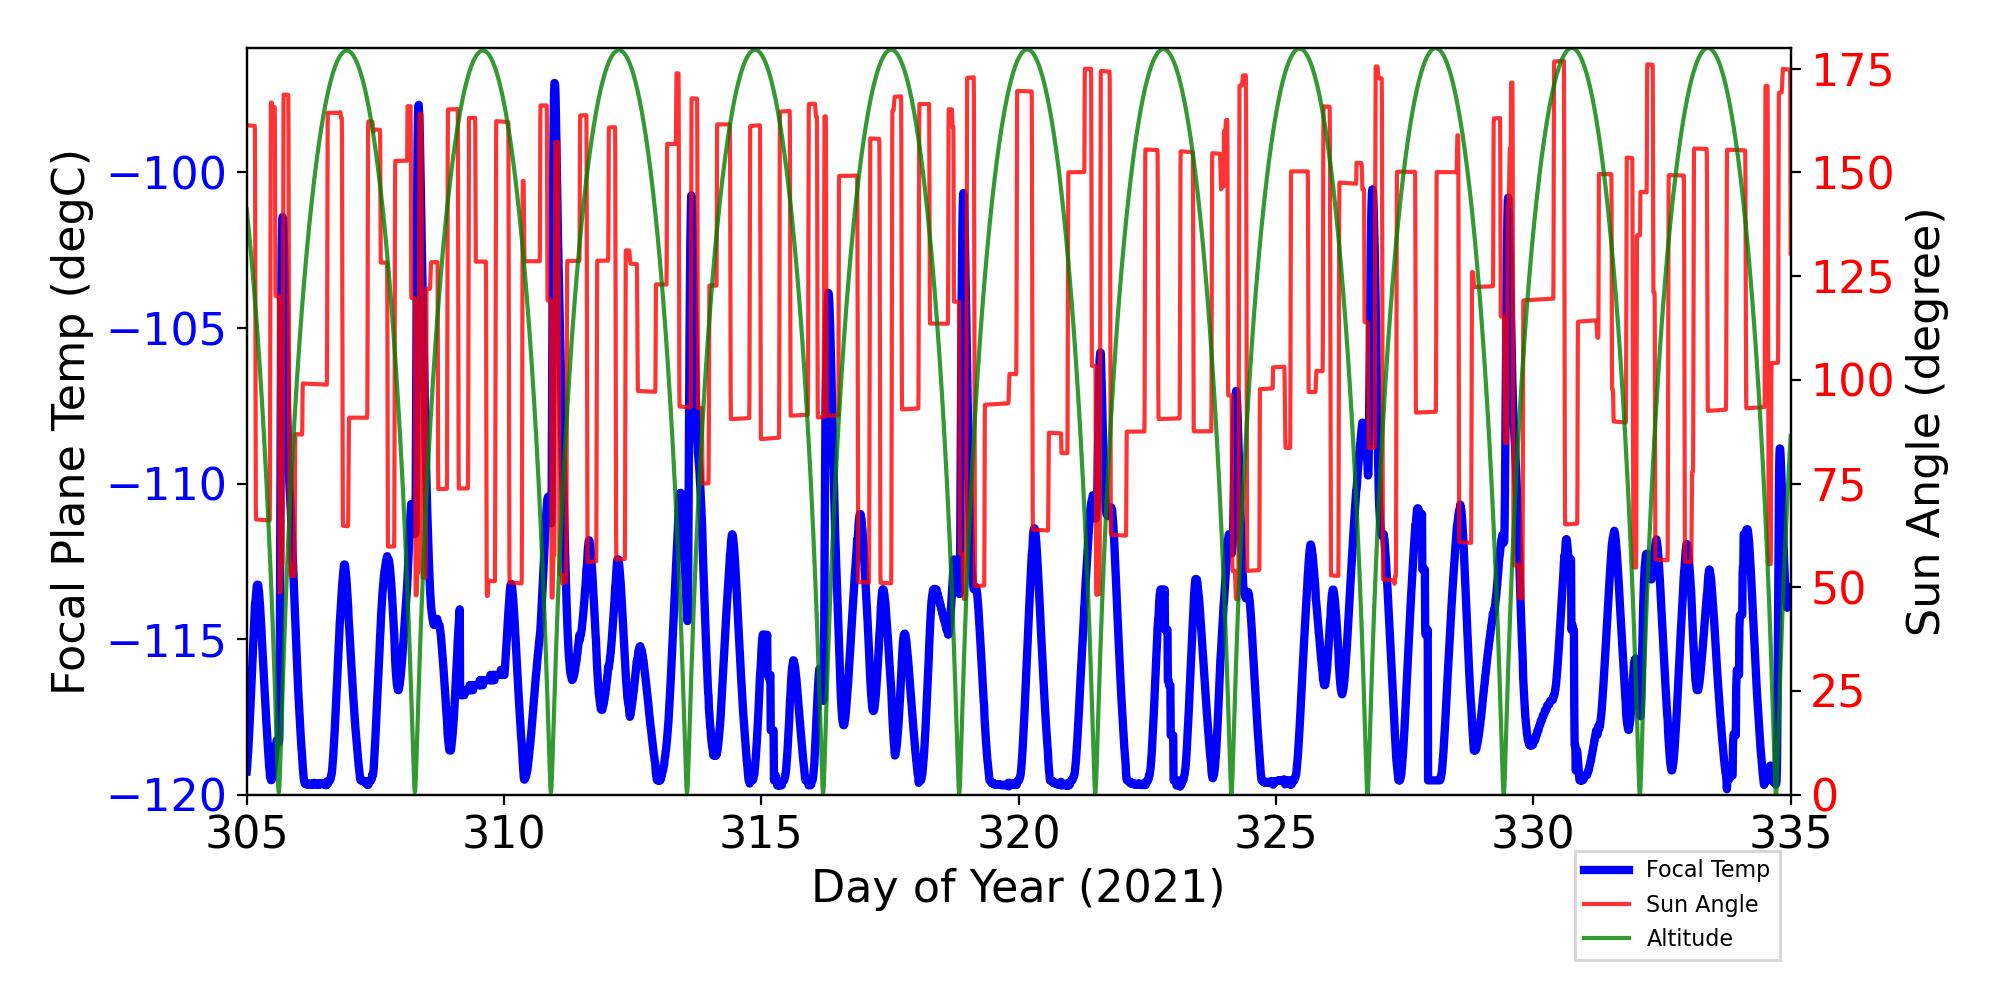
Focal Plane Temperature, Sun Angle and Altitude
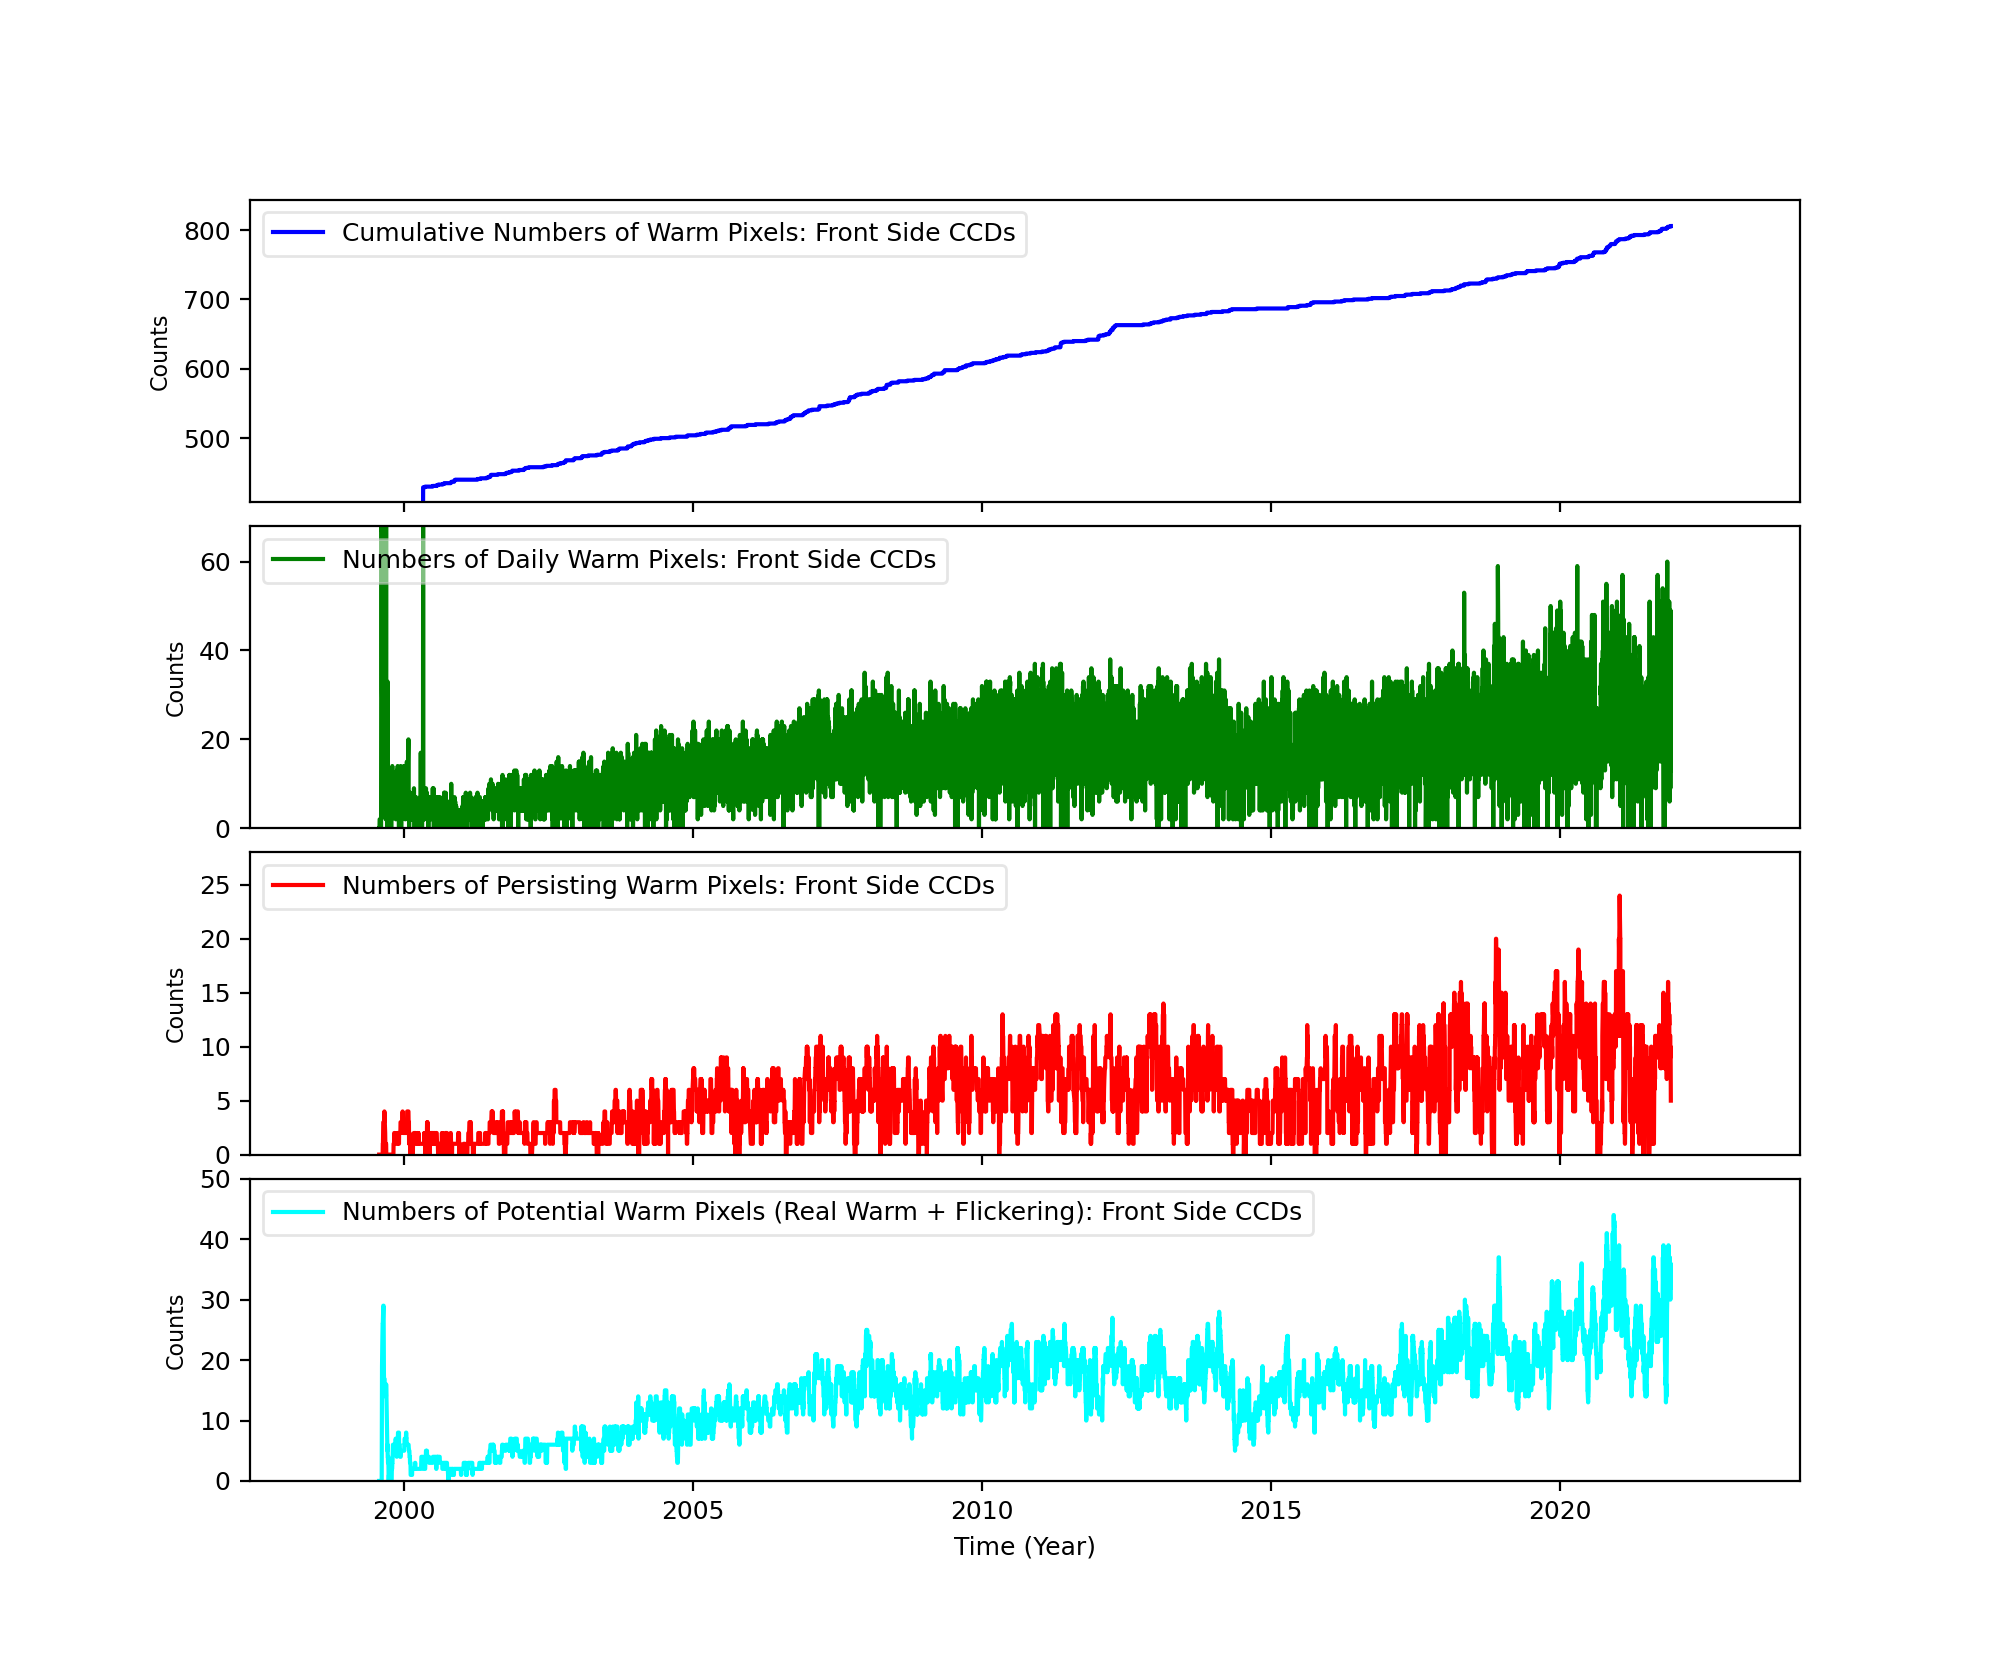
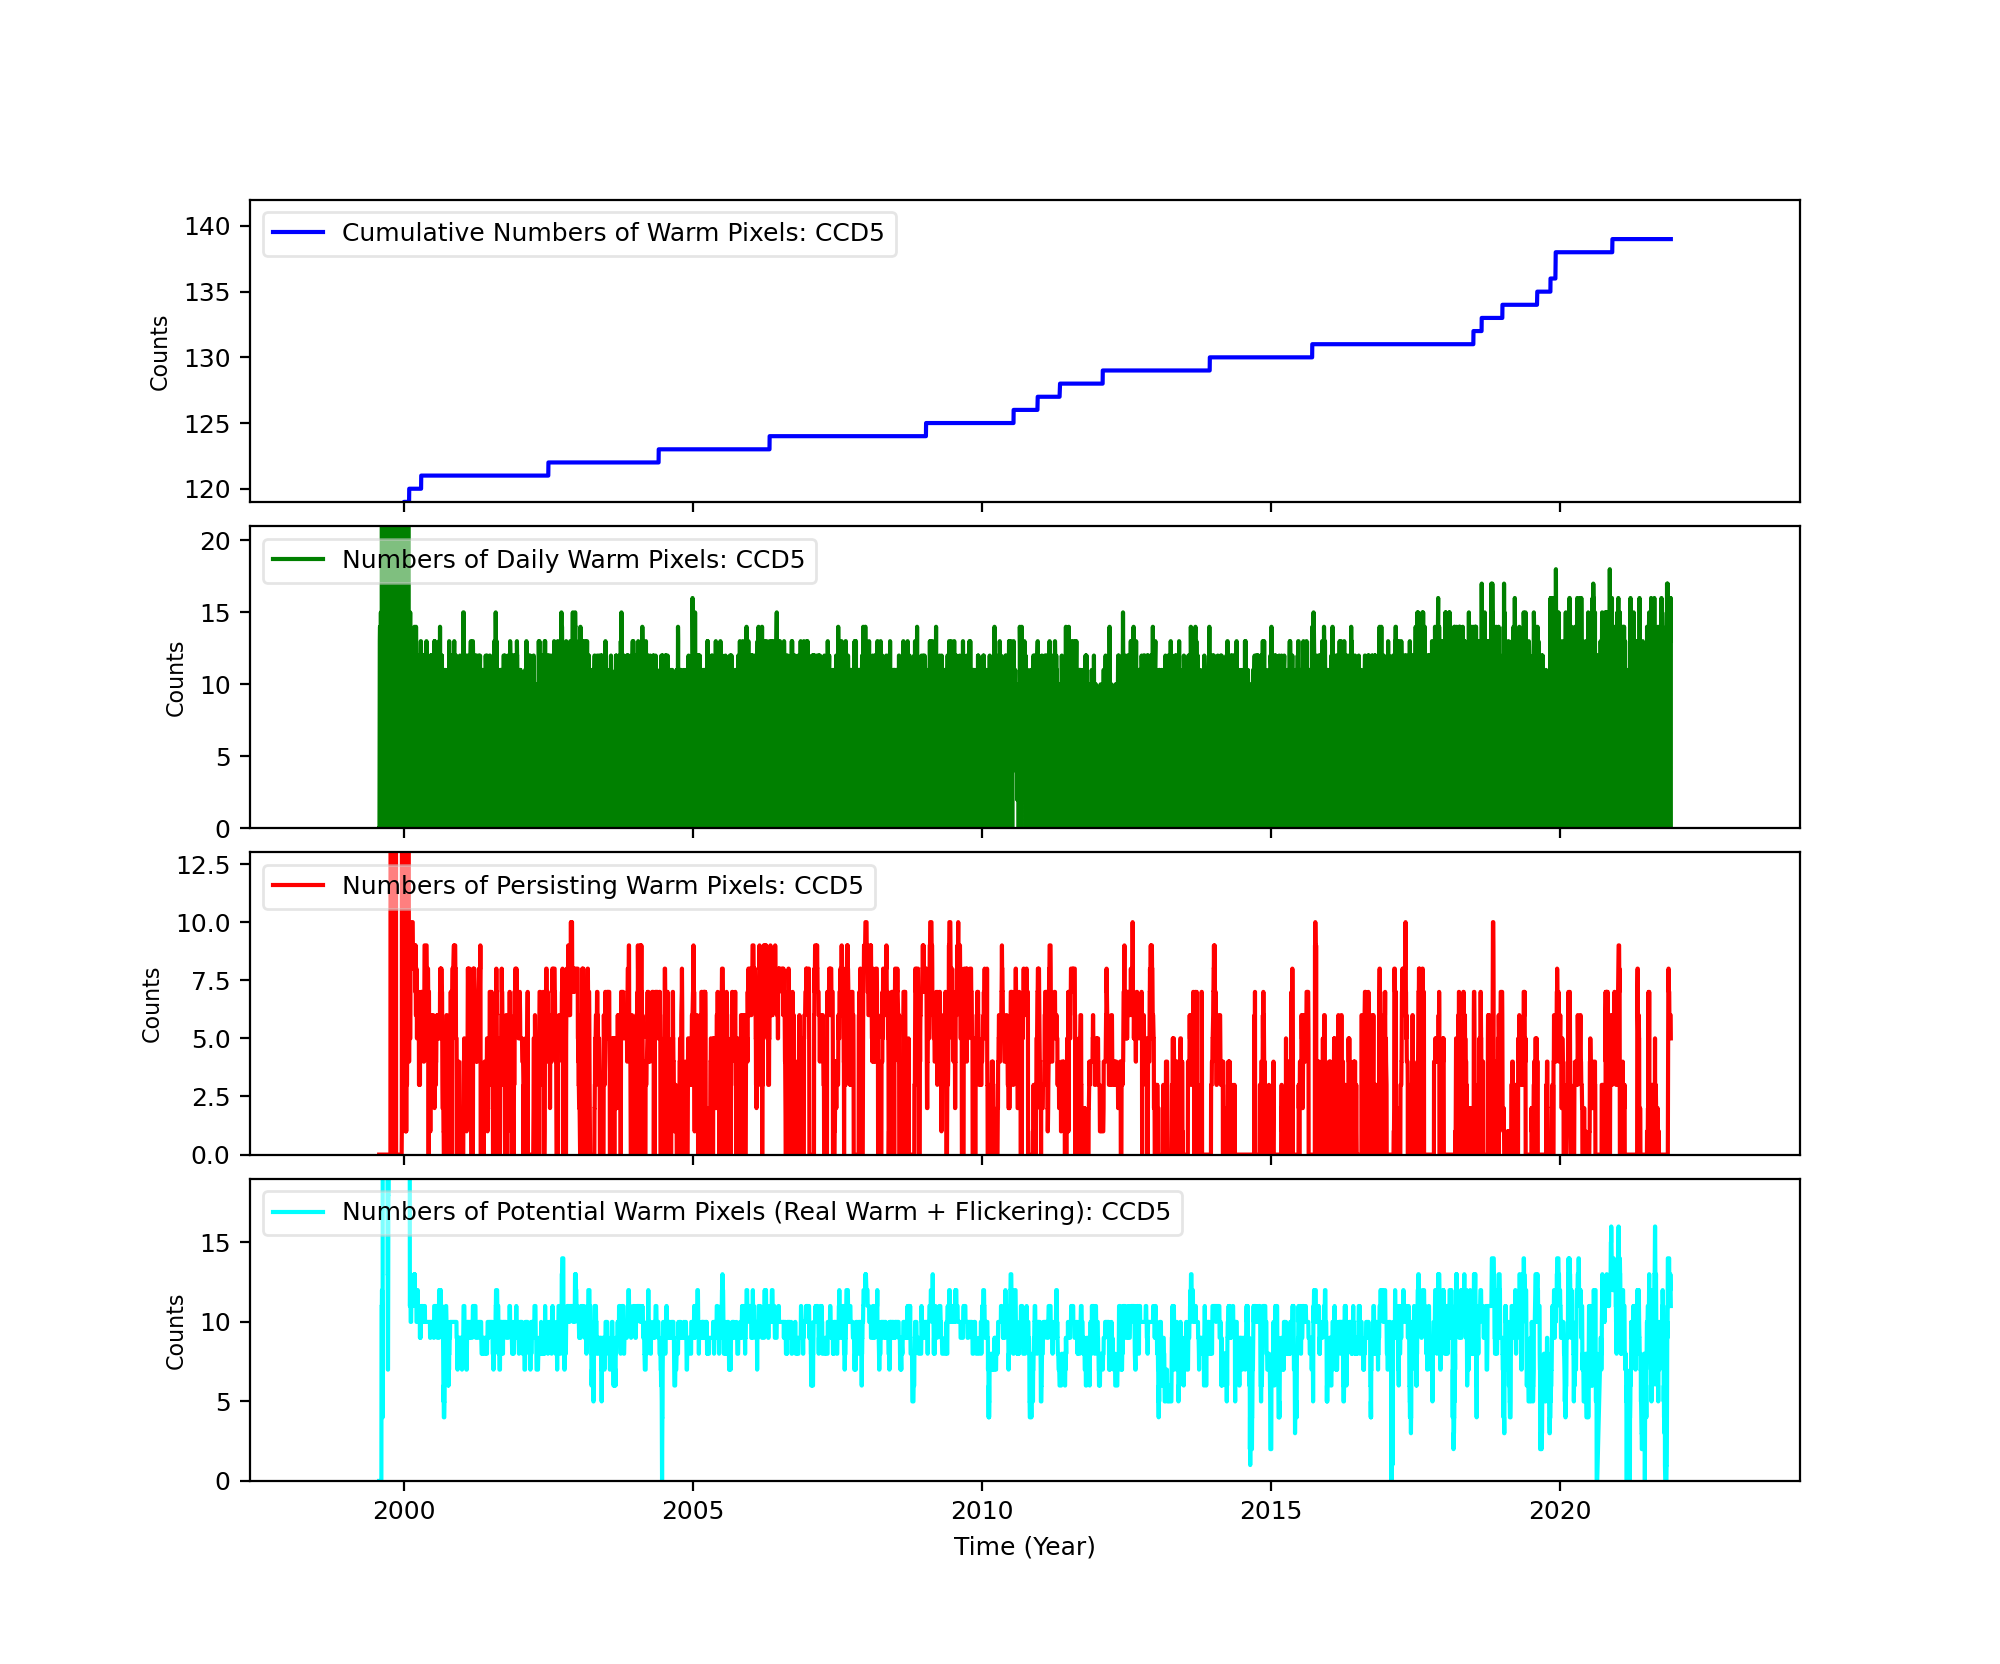
Bad Pixels
The plots below were generated with a new warm pixel finding script. Please see Acis Bad Pixel Page for details.
Front Side CCDs
Back Side CCD (CCD5)
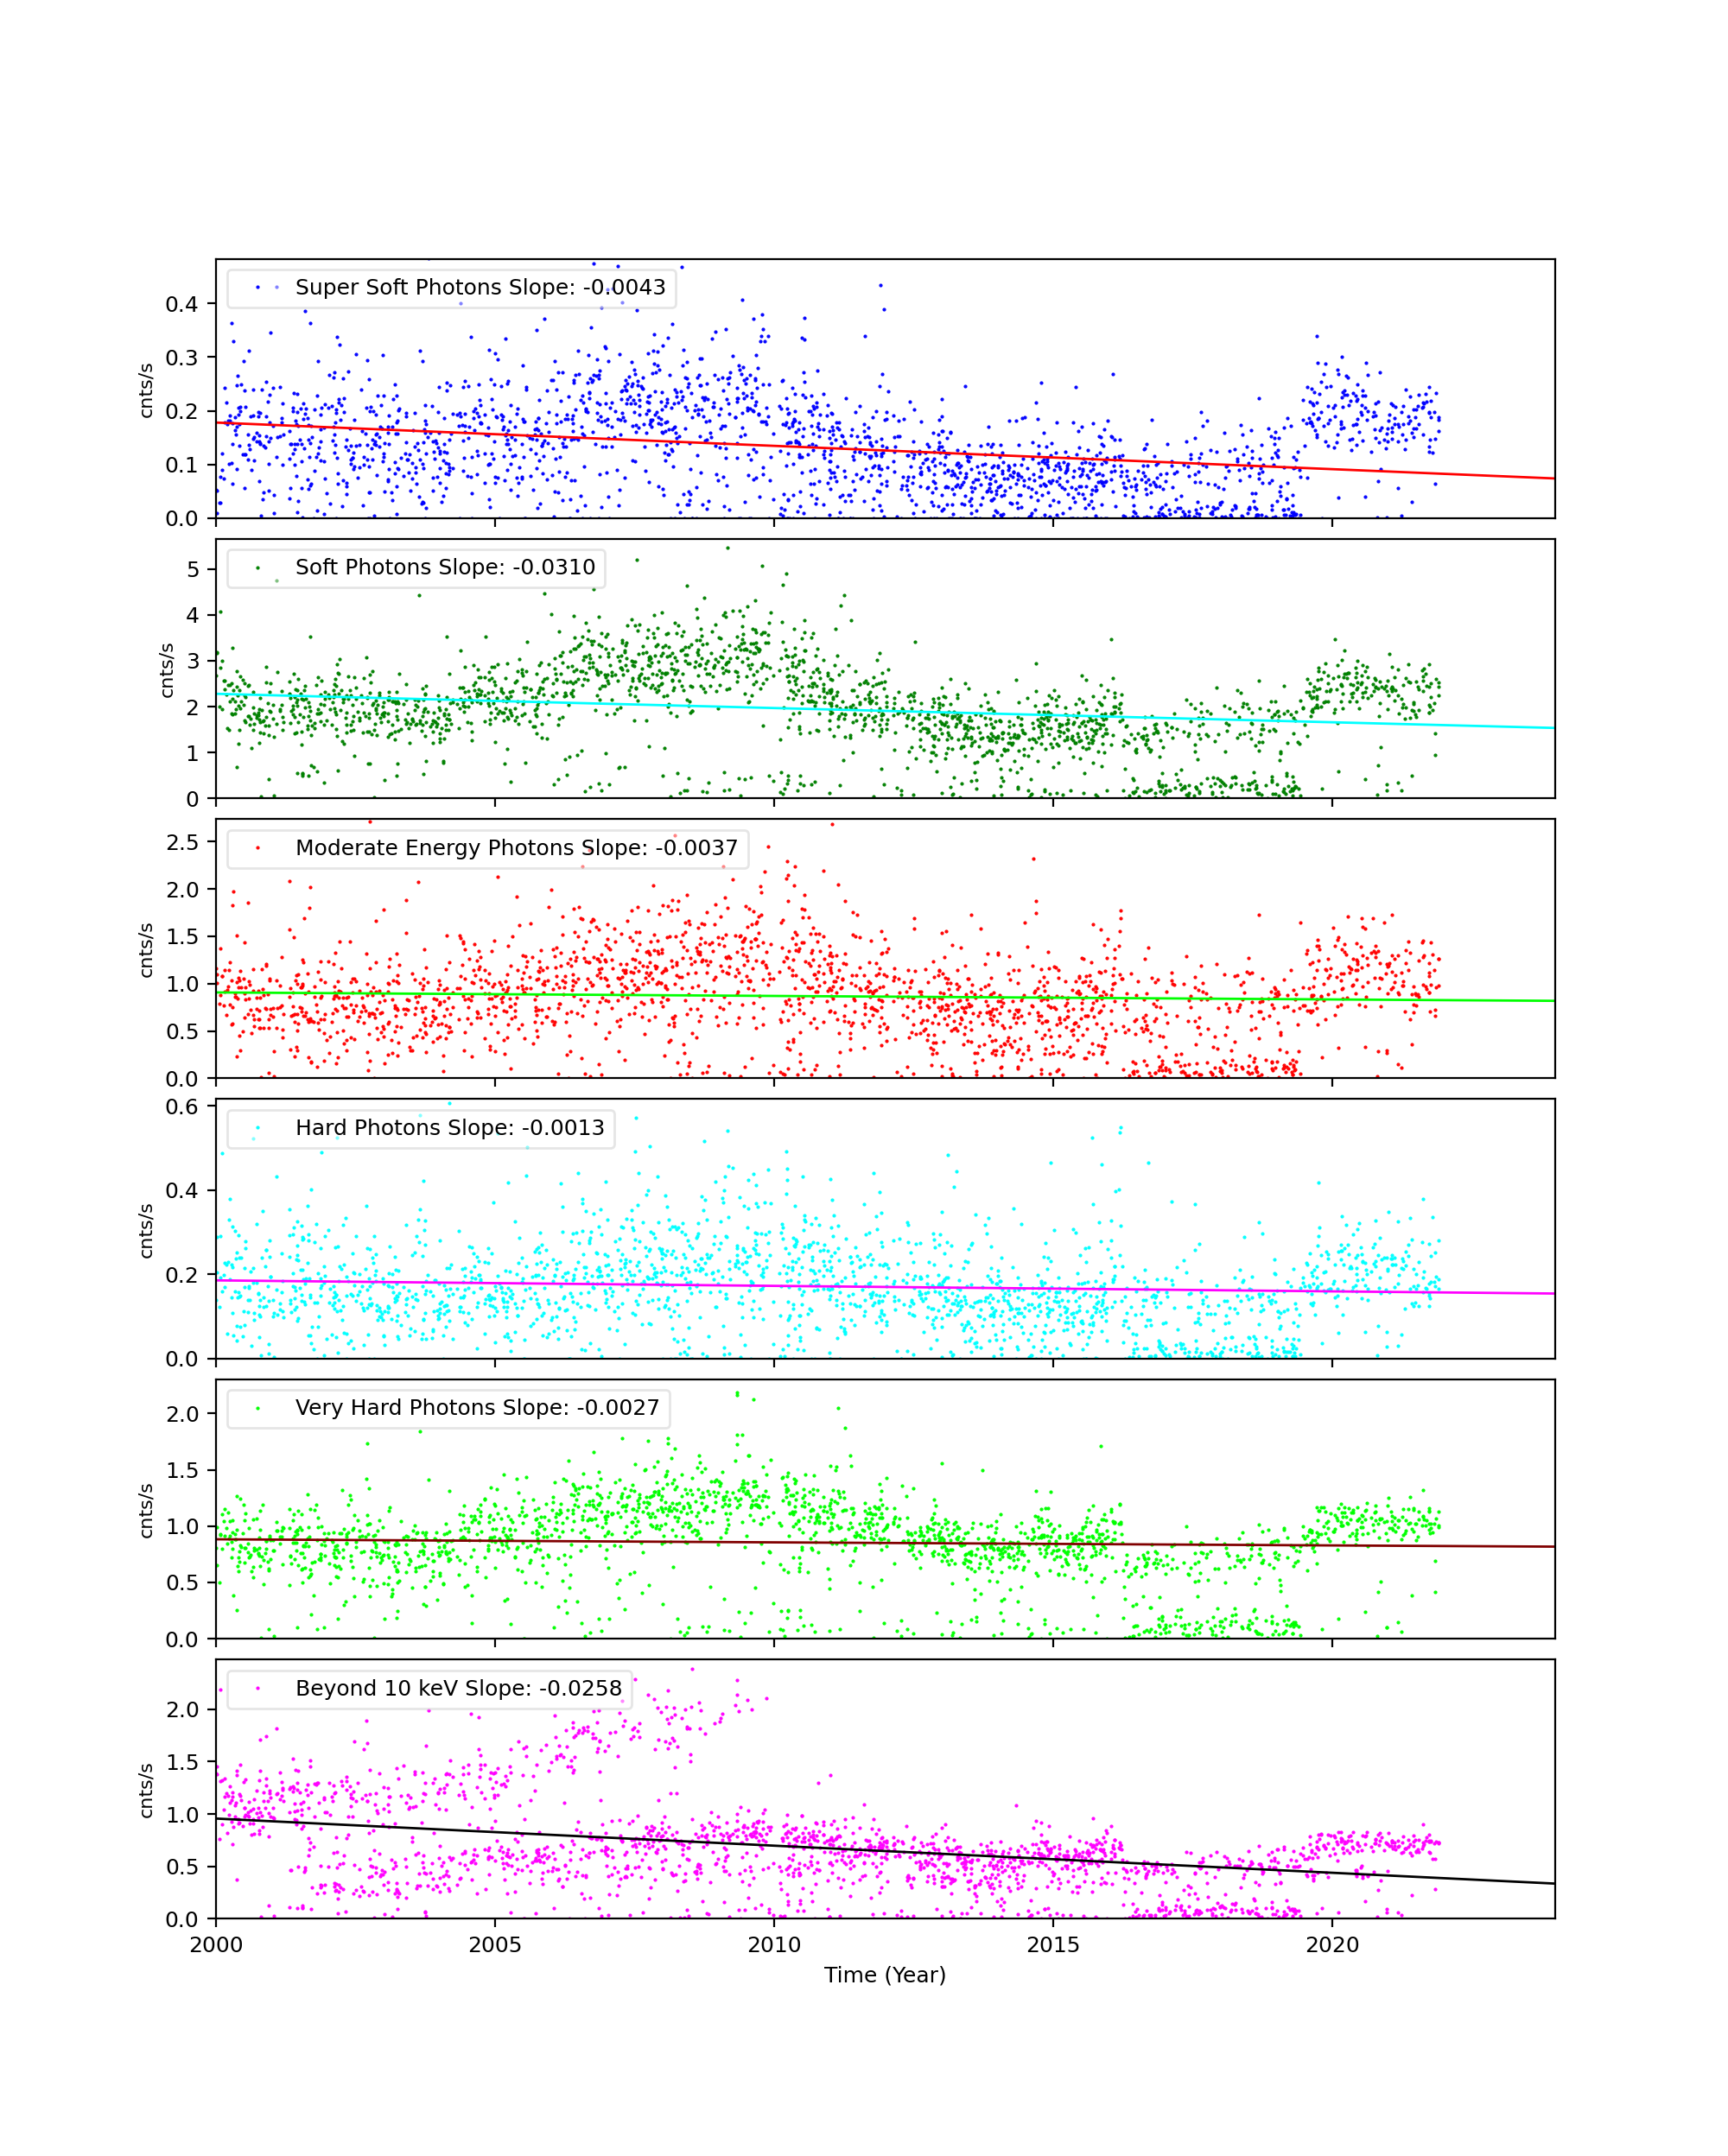
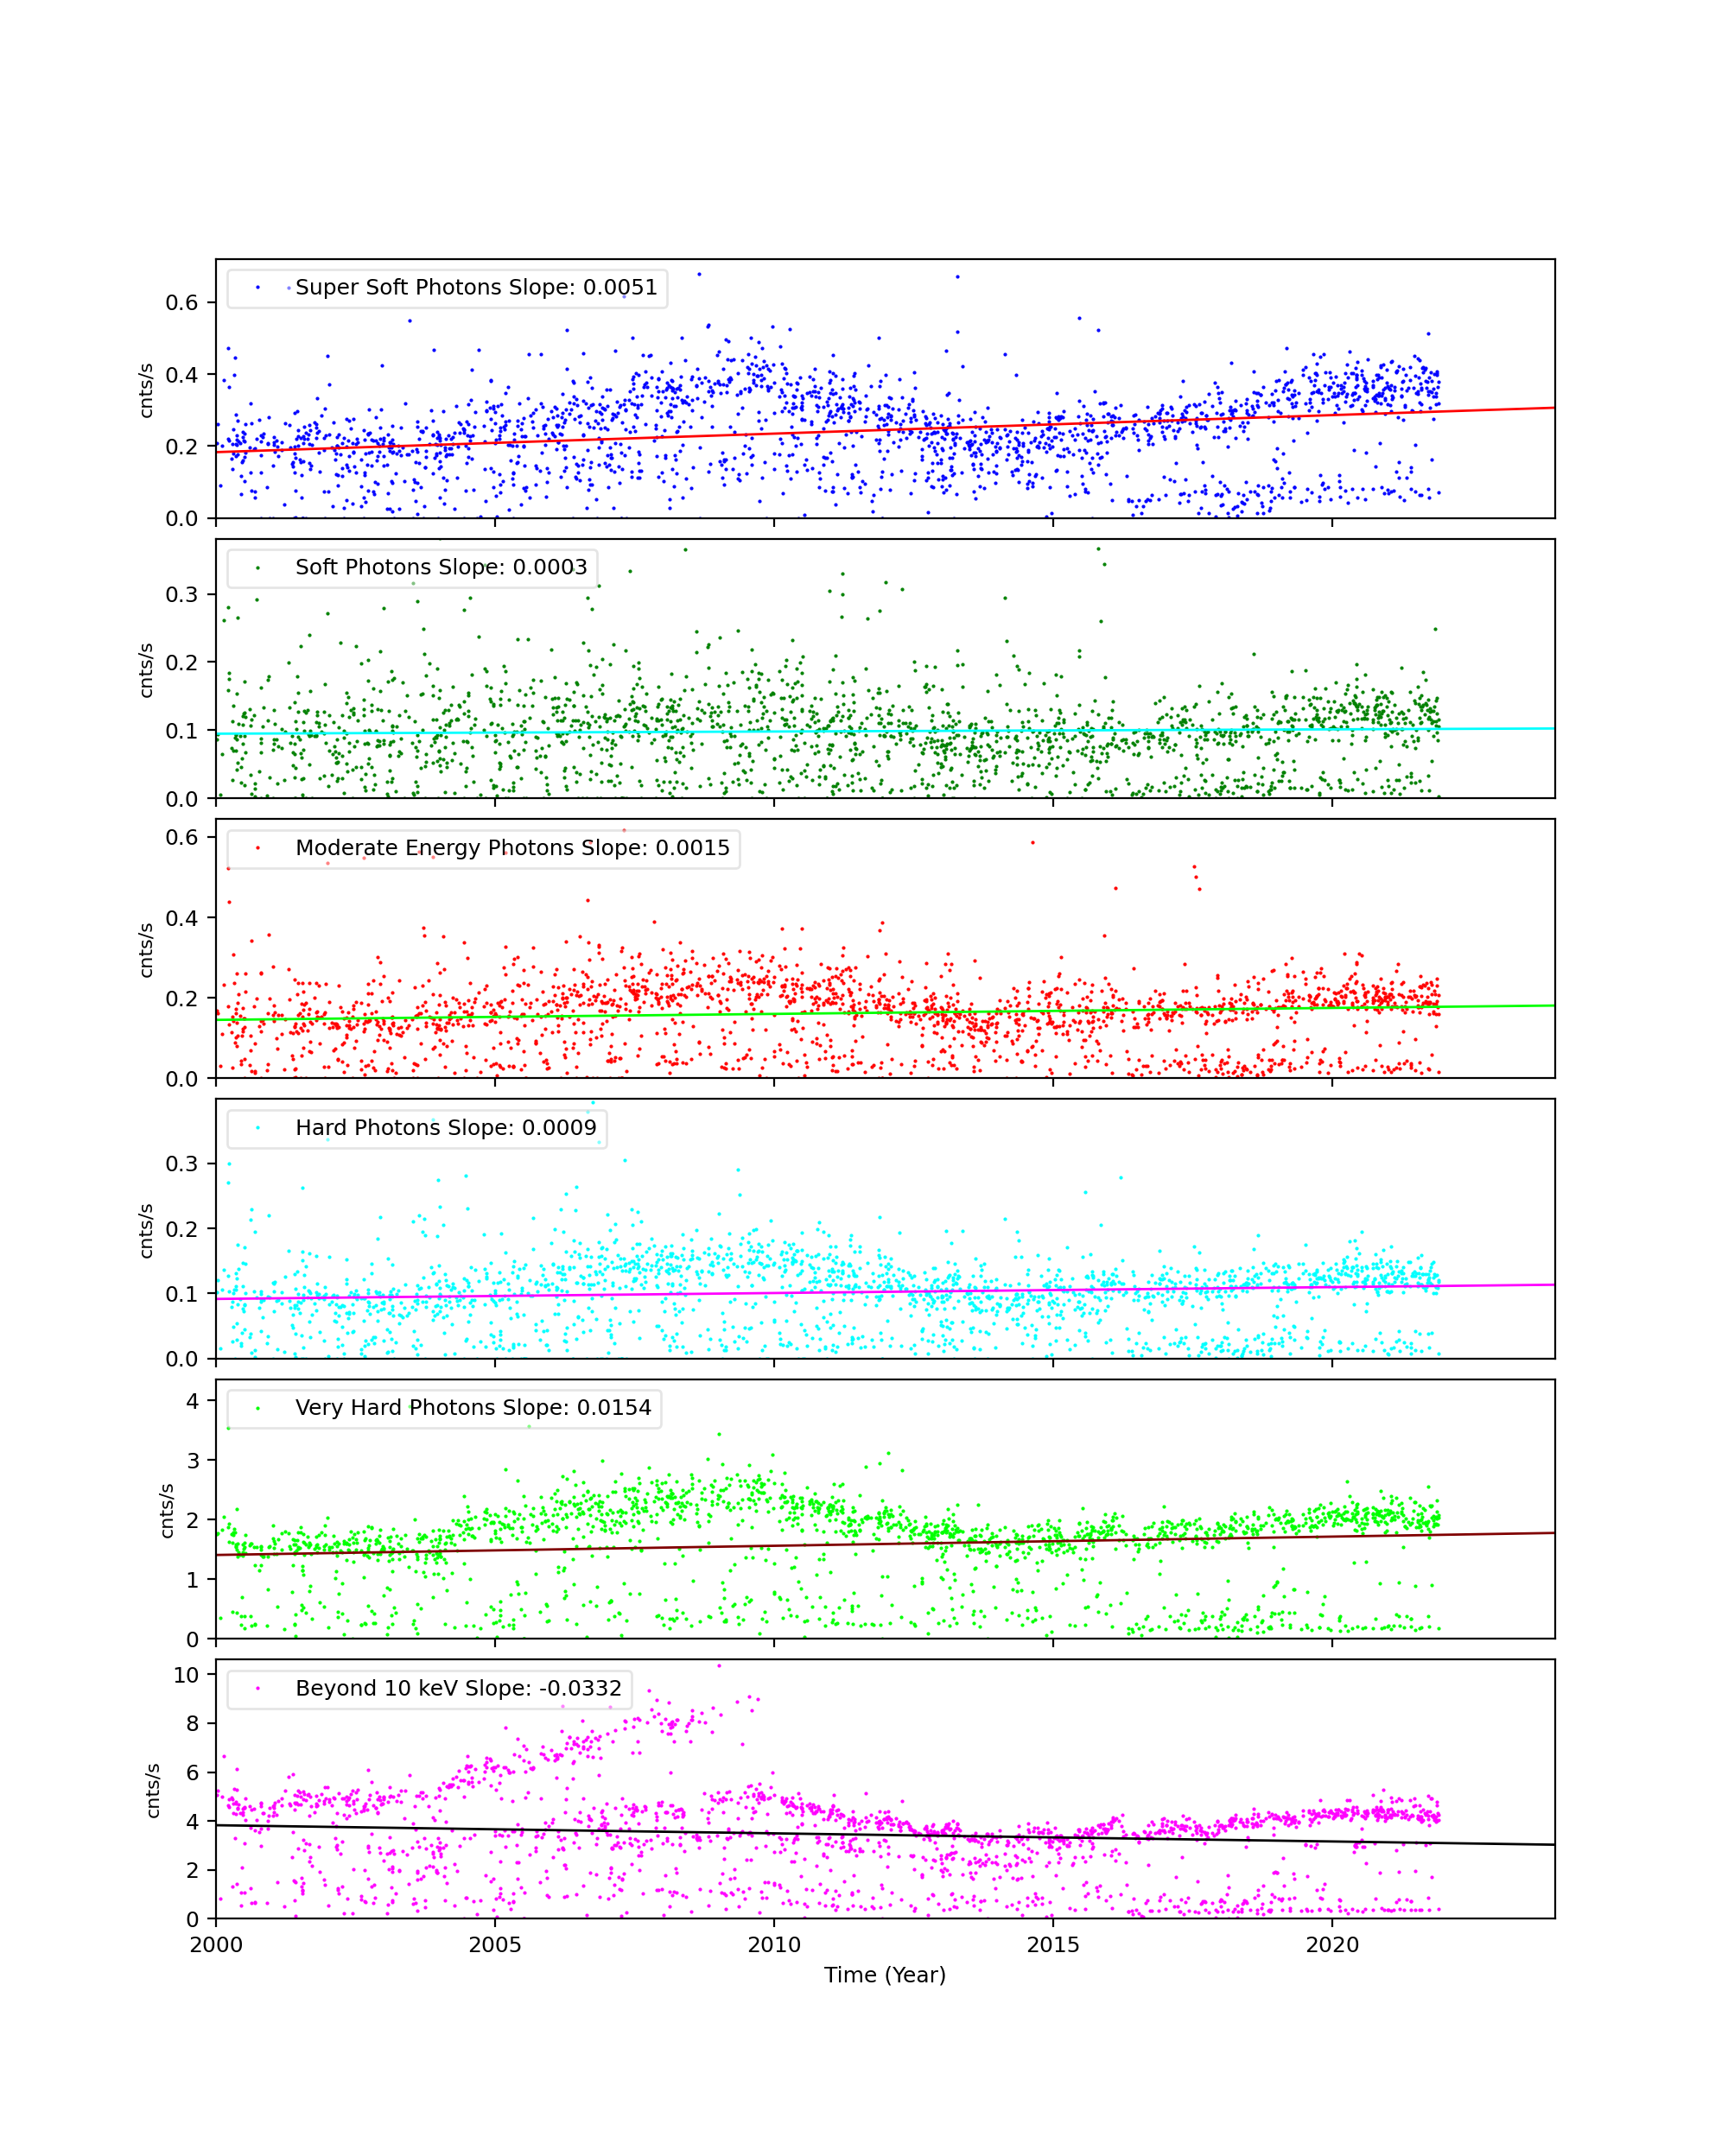
Science Instrument Background Rates
| Name | Low (keV) | High(KeV) | Description |
|---|---|---|---|
| SSoft | 0.00 | 0.50 | Super soft photons |
| Soft | 0.50 | 1.00 | Soft photons |
| Med | 1.00 | 3.00 | Moderate energy photons |
| Hard | 3.00 | 5.00 | Hard Photons |
| Harder | 5.00 | 10.00 | Very Hard photons |
| Hardest | 10.00 | Beyond 10 keV |
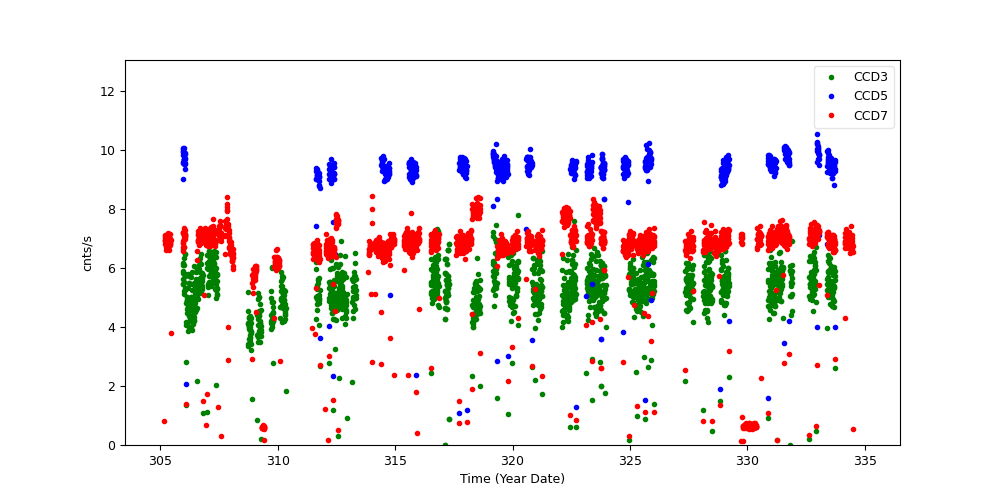
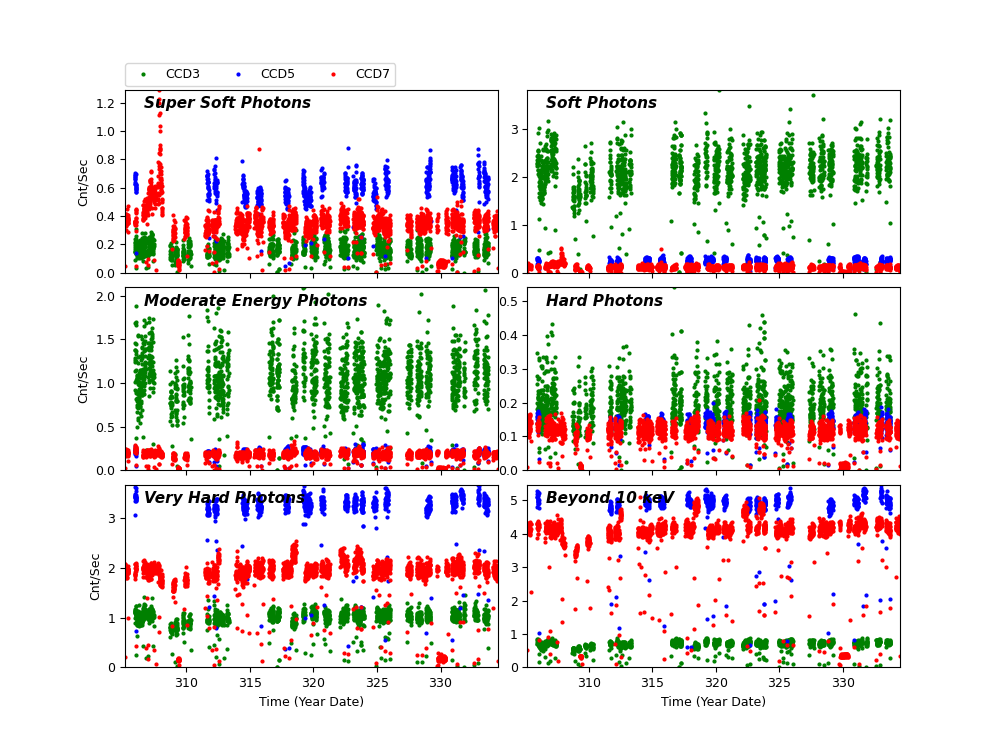
The following three plots show trends of SIB from year 2000. CCDs shown here are CCD3, CCD5, and CCD7. Fitted lines are linear fit after eliminating extreme outliers. For >10 keV plots, 2 lines are fit. One is with a 13 keV filter, and another without.
CCD 3
CCD 5
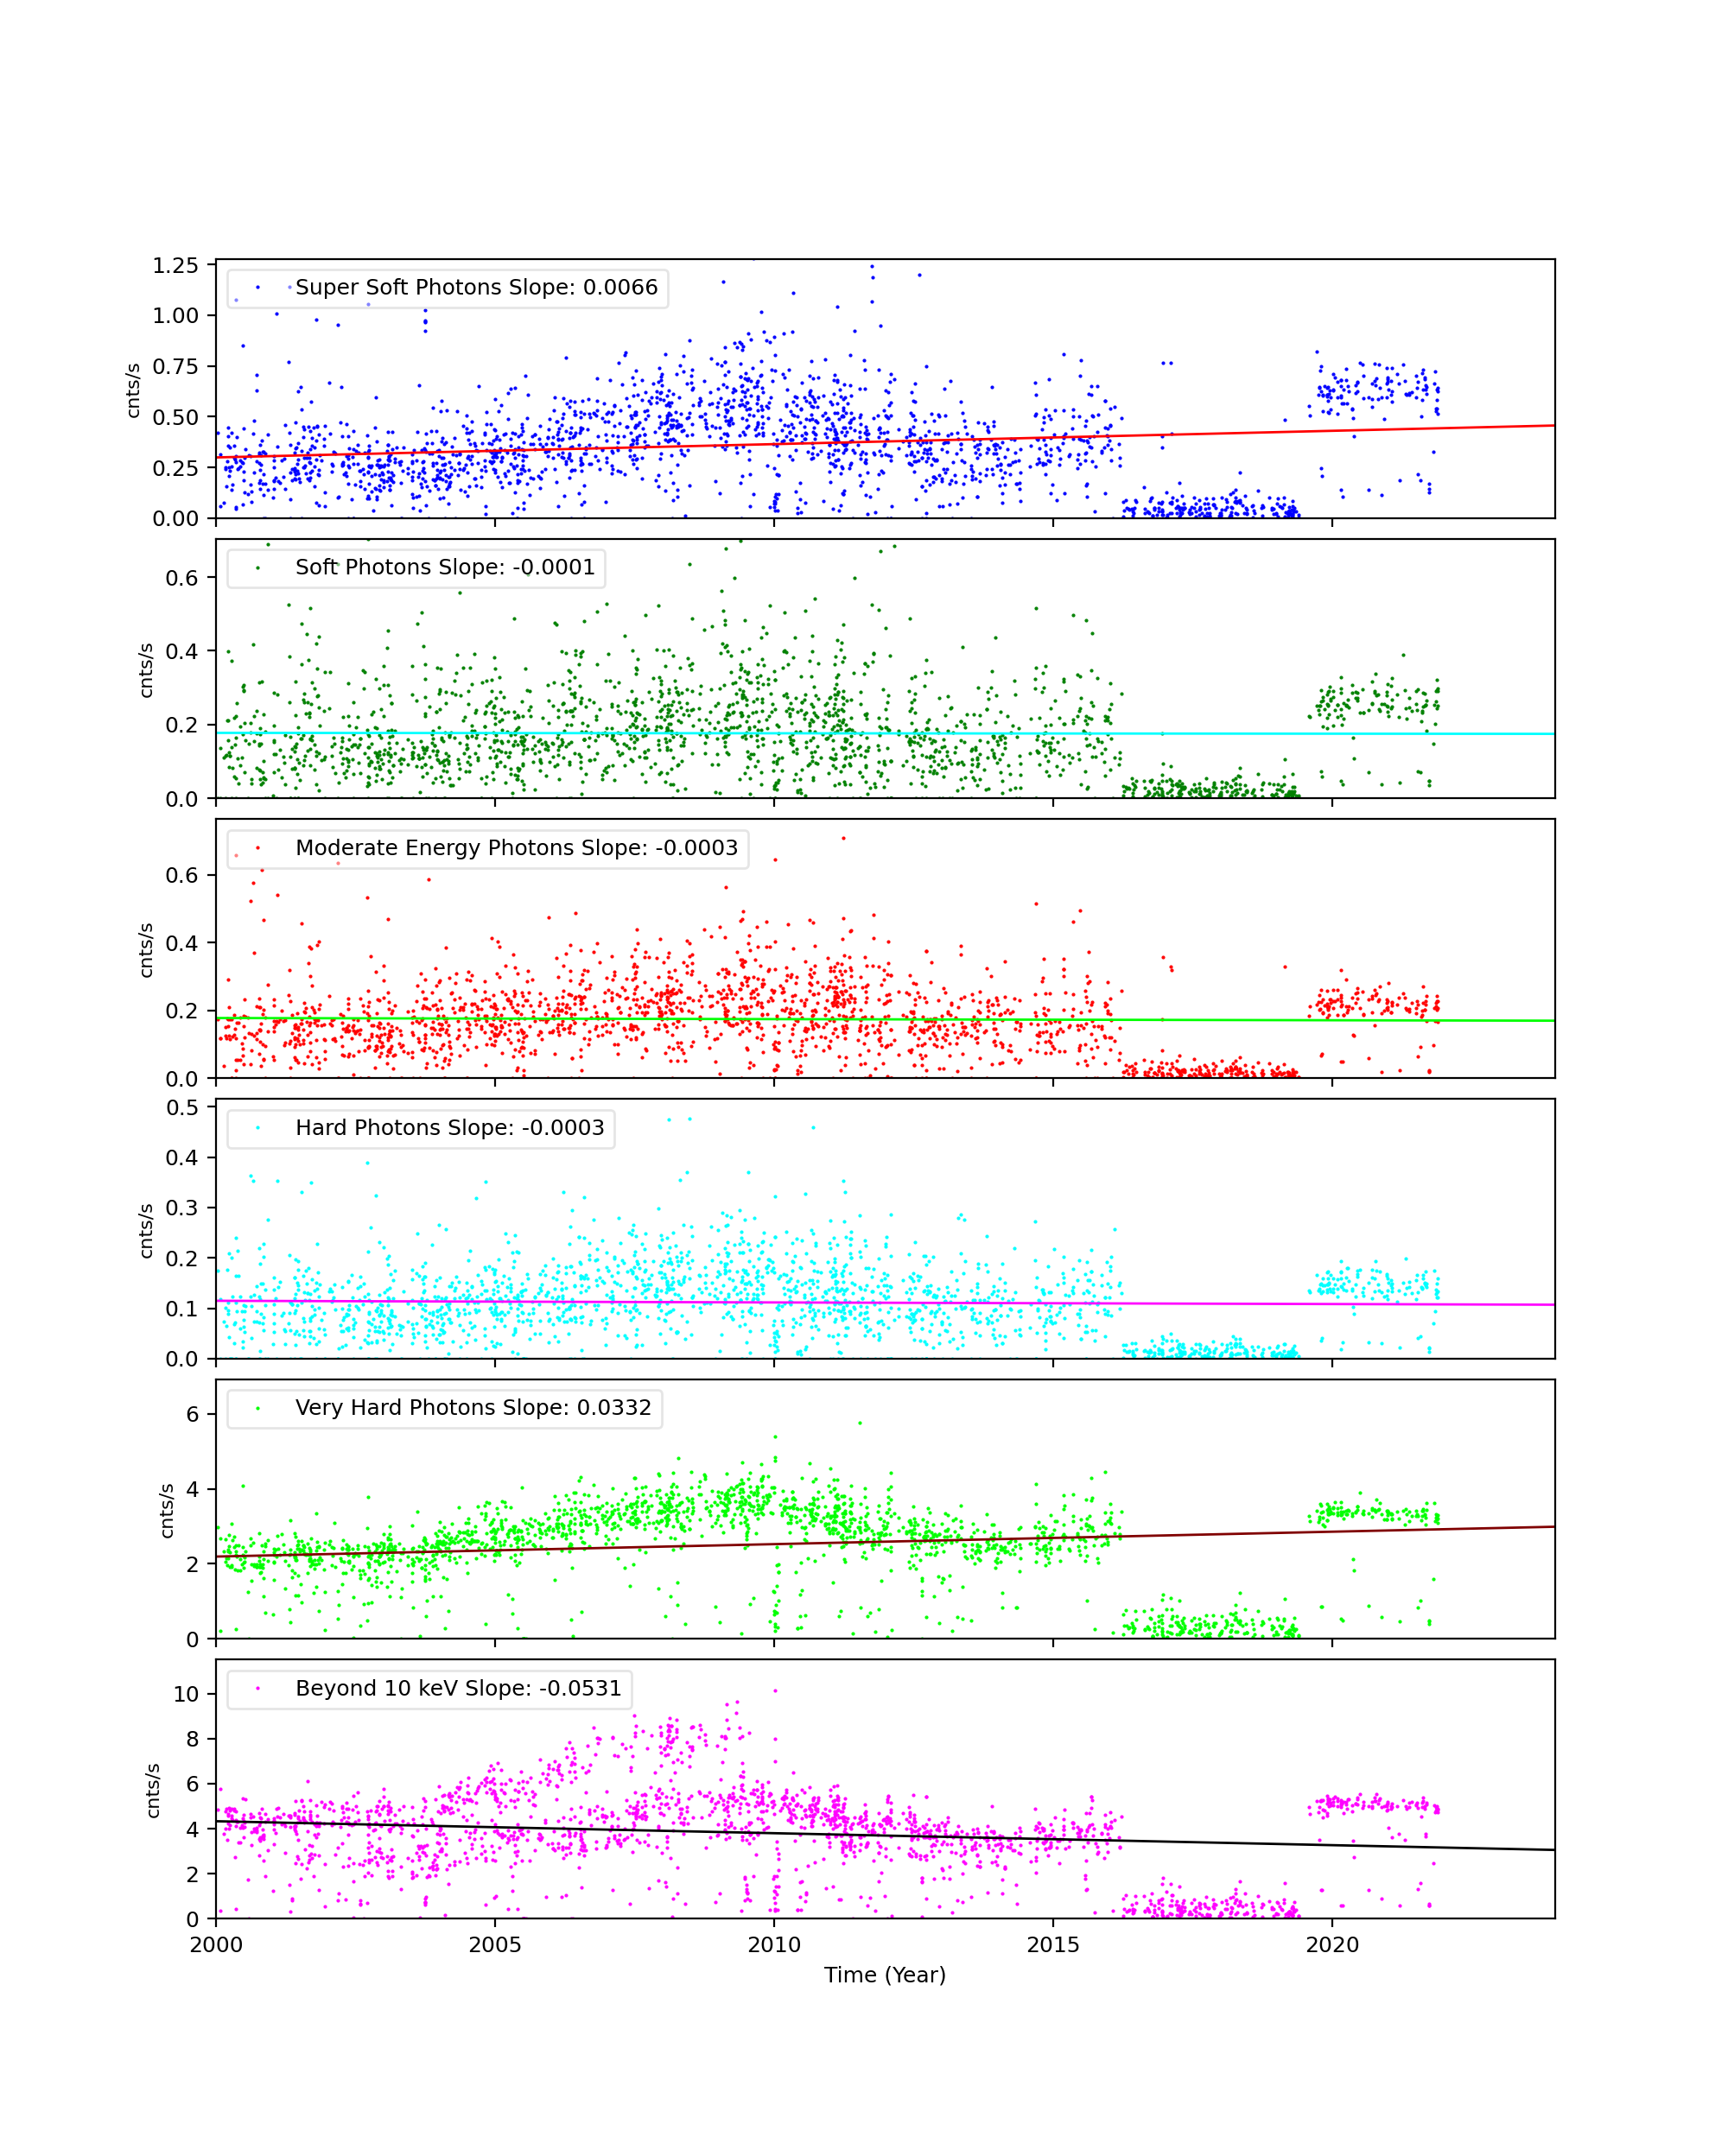
CCD 7
ACIS Histogram Mode Trends
We collected data from acis histogram mode data, and created trend plots of peak portions and peak widths against time (DOM). The peaks were estimated by fitting a simple Gaussian on three peaks (Al, Ti, and Mn), and the widths were estimated by a width at the half max from the peak.
All histogram data are taken under TIMED and GRADED_HIST mode, SIM position is at an external calibration source position, the focal temperature is around -119.7 C, and parameter settings in aciselec, acistemp are set to about same for all.
CCD 3, Peak Position
CCD 3, Peak Widths
CCD 3, Count Rates
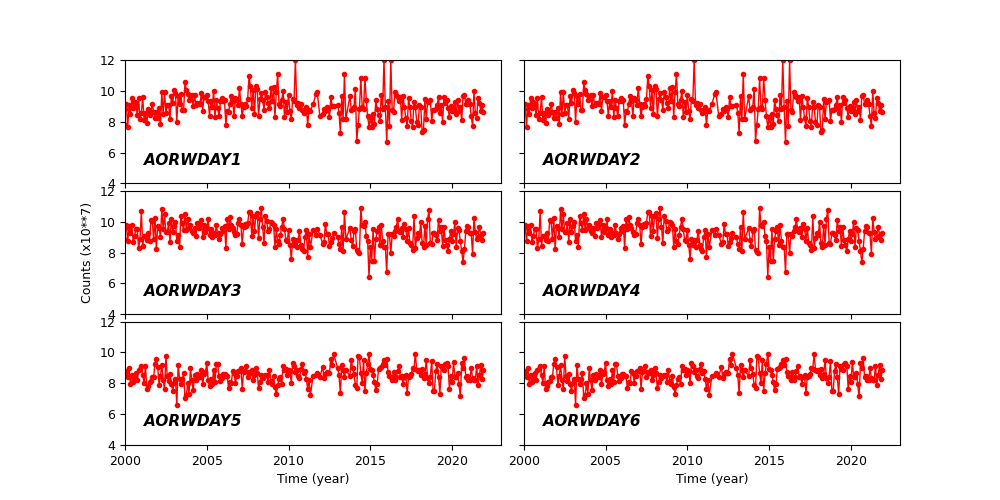
HRC
DOSE of Central 4K Pore-Pairs
Please refer to Maximum Dose Trends for more details.
)
|
|---|
IMAGE                NPIX      MEAN    STDDEV      MIN       MAX
HRCI_11_2021.fits  16777216	0.024 	0.154 	0.000 	3.000
)
IMAGE                       NPIX      MEAN    STDDEV      MIN       MAX
HRCI_08_1999_11_2021.fits  16777216	7.621 	6.557 	0.000 	314.000
)
|
|---|
IMAGE                NPIX      MEAN    STDDEV      MIN       MAX
HRCS_11_2021.fits  16777216	0.086 	0.357 	0.000 	24.000
)
IMAGE                       NPIX      MEAN    STDDEV      MIN       MAX
HRCS_08_1999_11_2021.fits  16777216	20.755 	36.775 	0.000 	1767.000
|
|
Max dose trend plots corrected for events that "pile-up"
in the center of the taps due to bad position information.
|
)
|
)
|
)
|
)
|
| Aug 2021 | May 2021 | Feb 2021 | Nov 2020 |
|---|
)
|
)
|
)
|
)
|
| Aug 2021 | May 2021 | Feb 2021 | Nov 2020 |
|---|
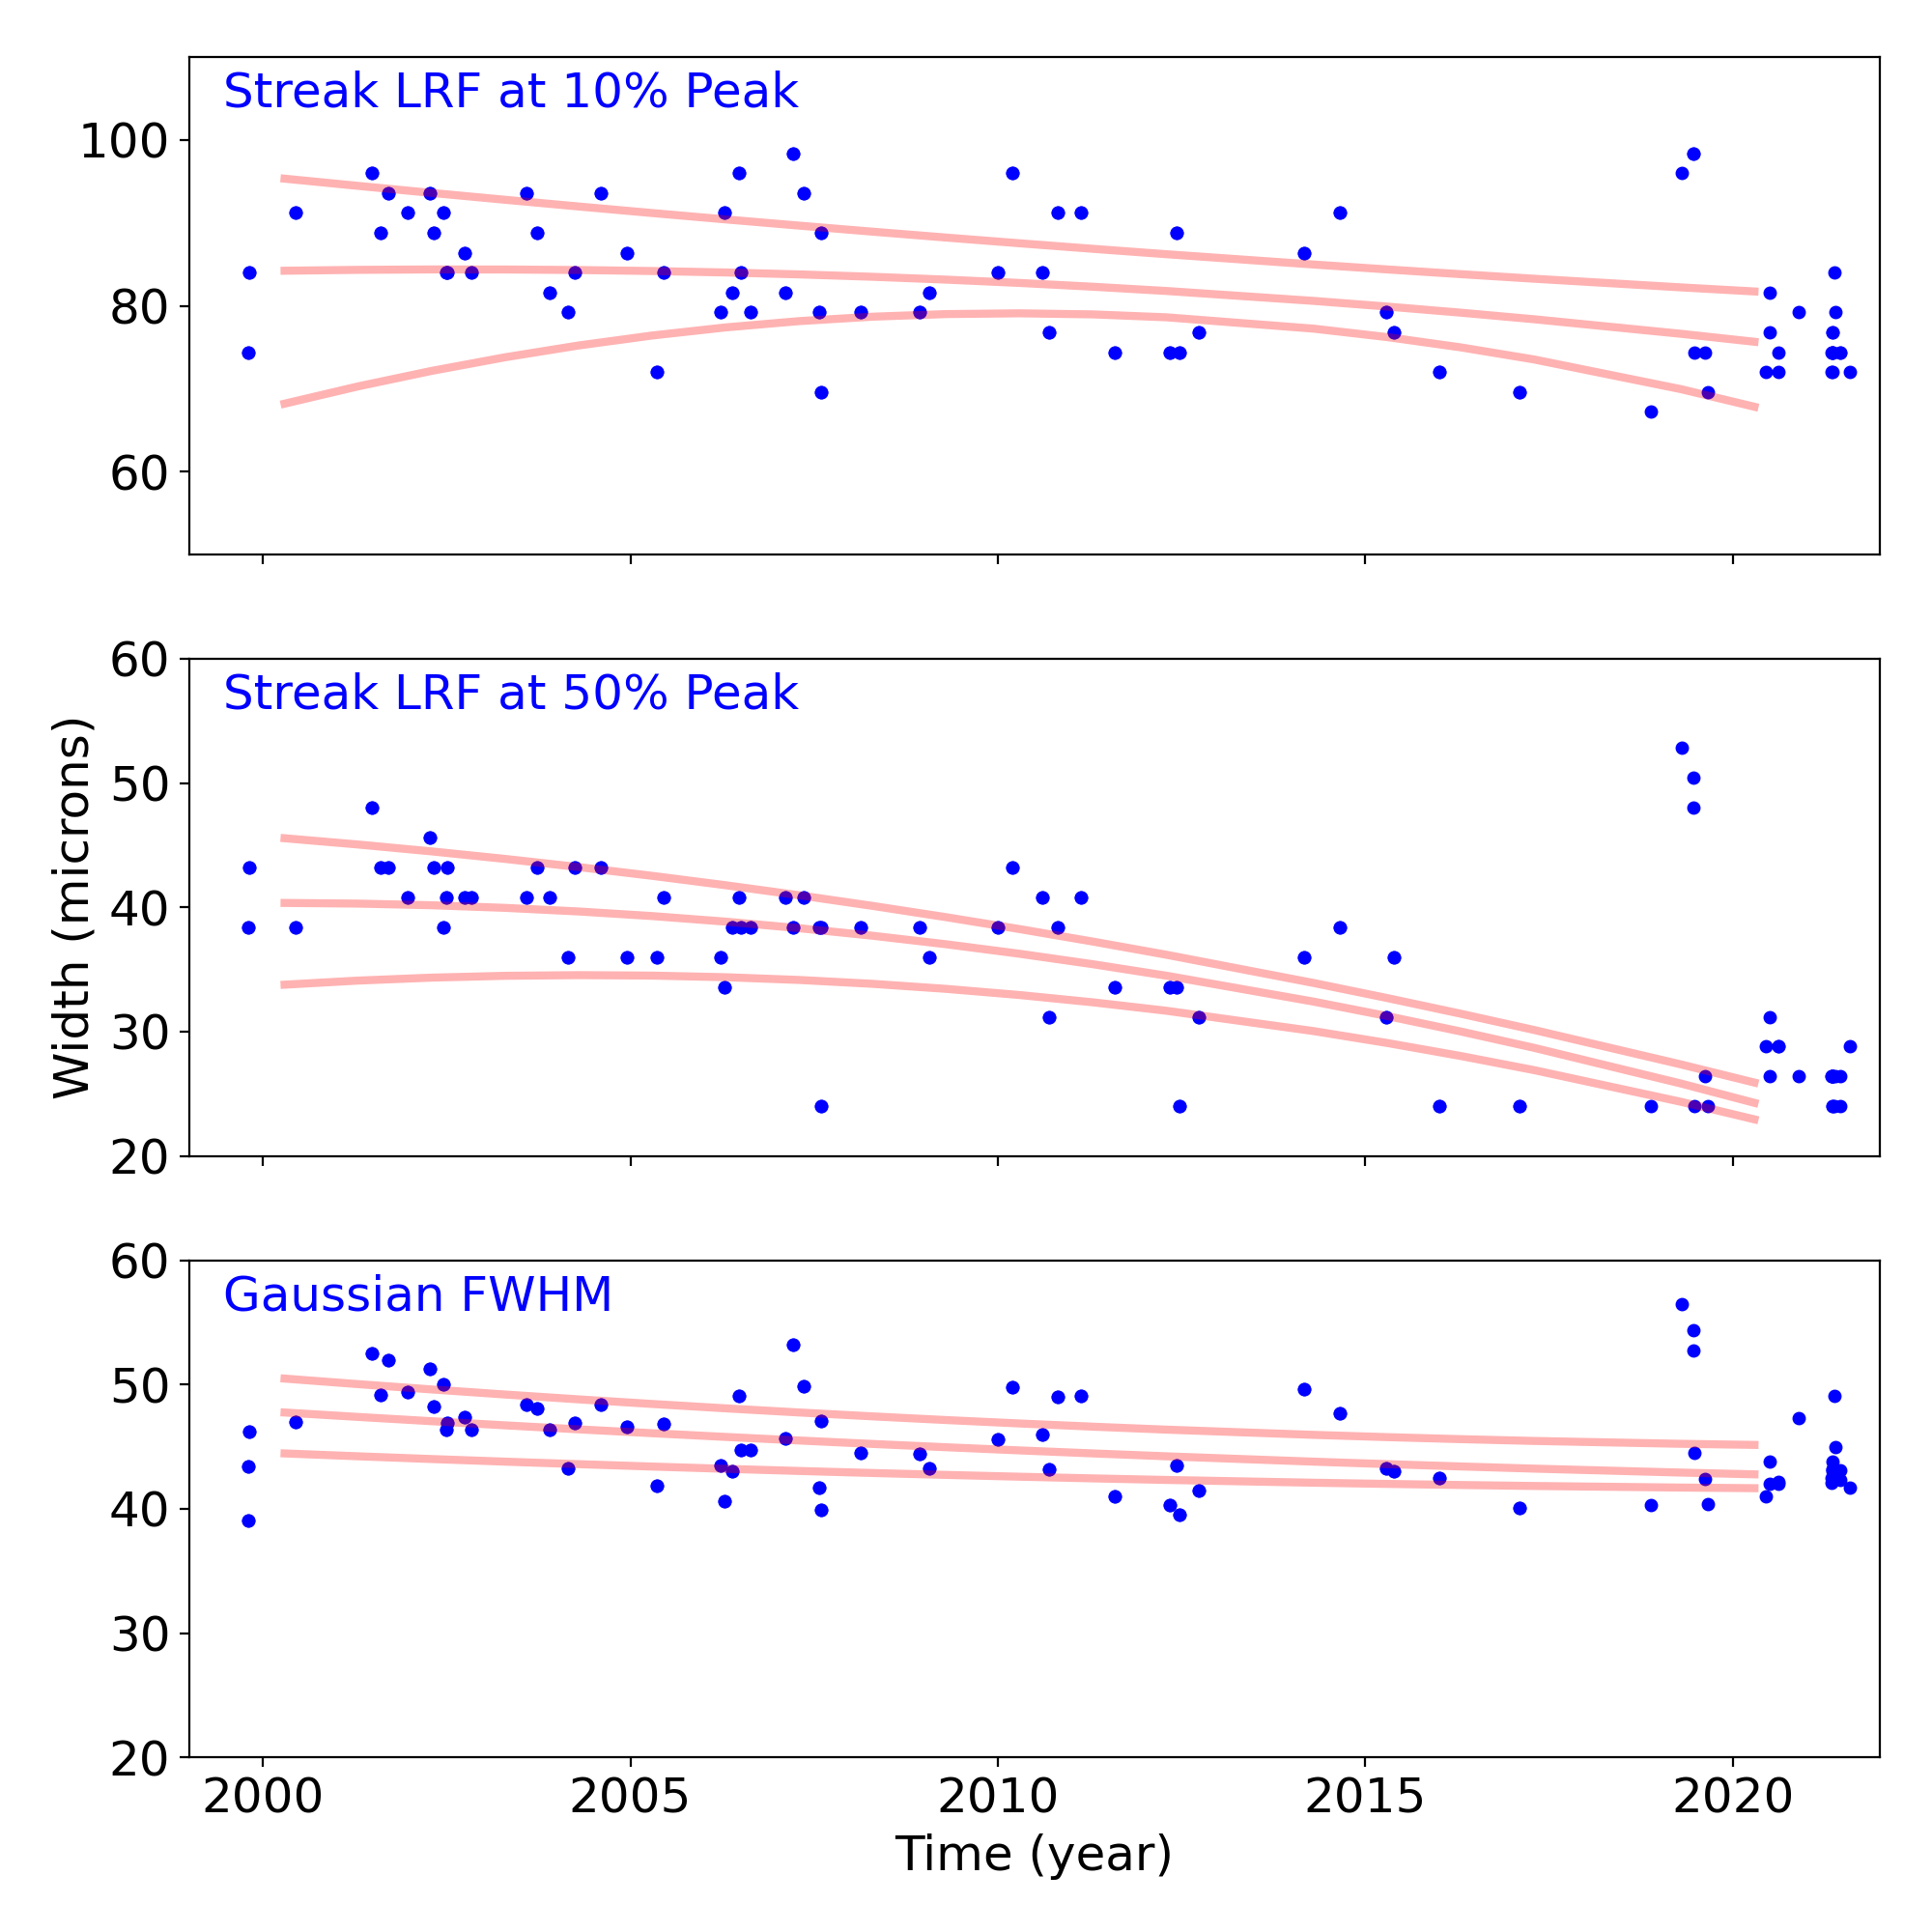
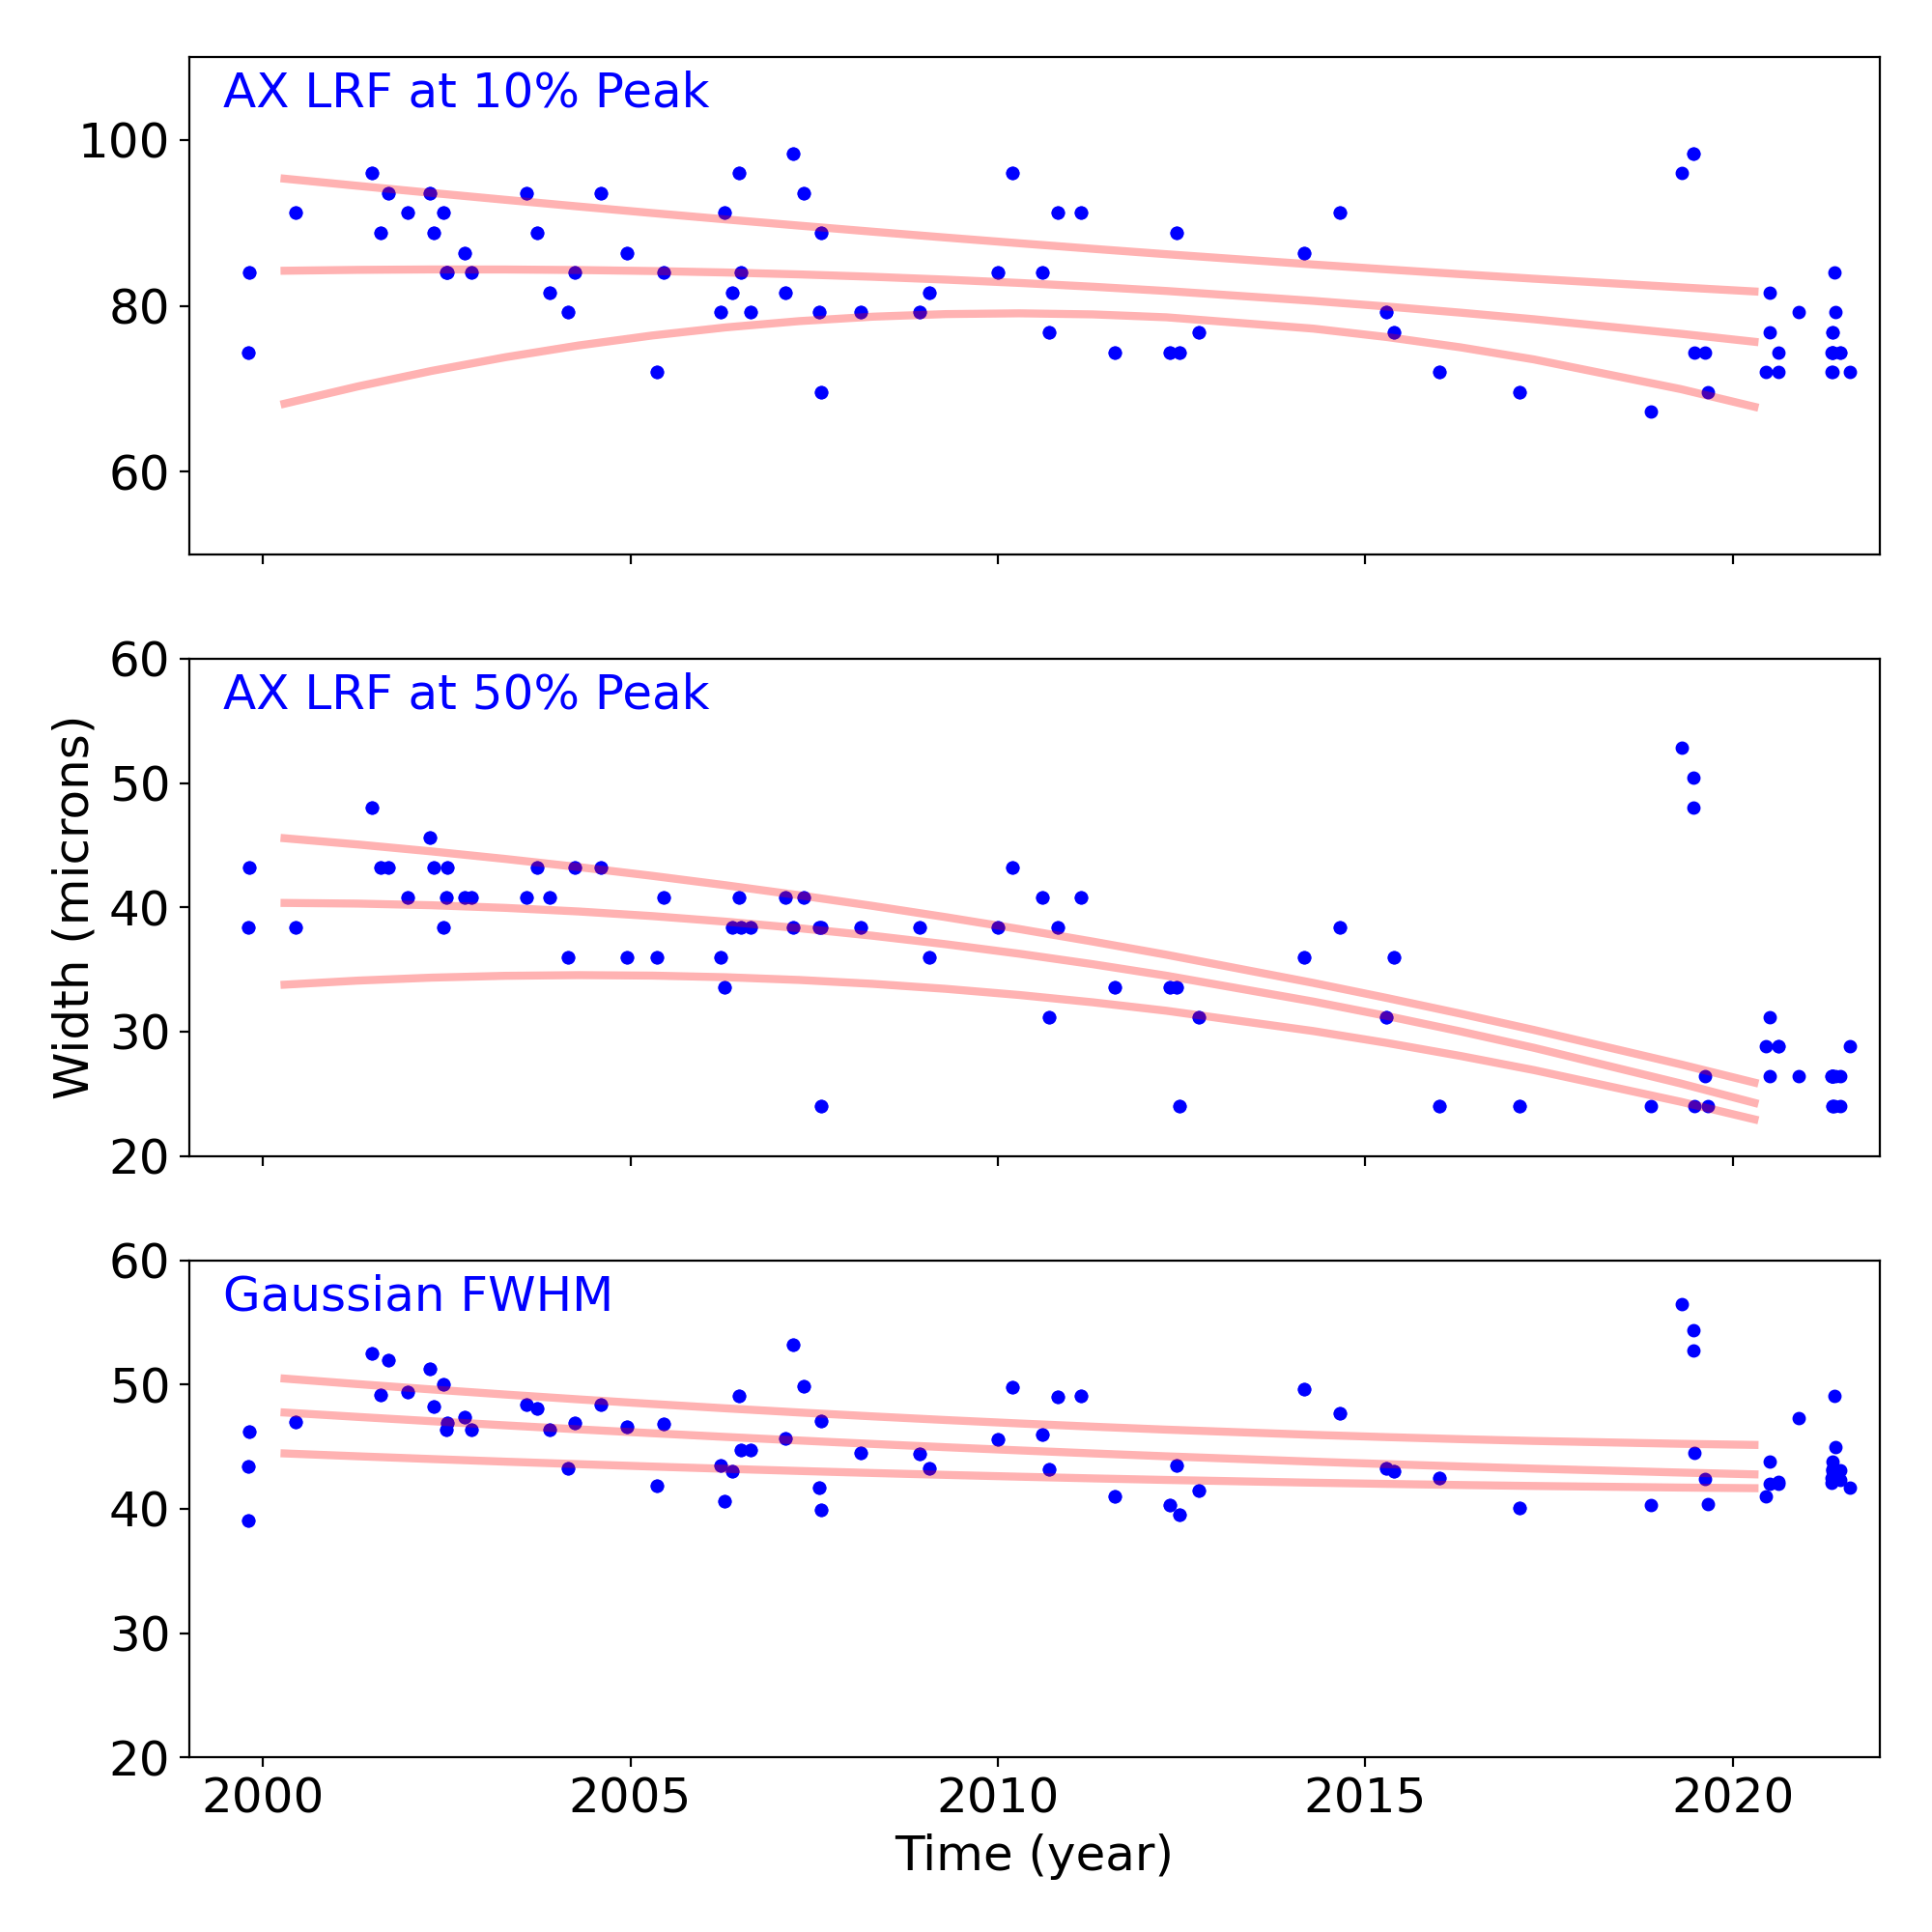
Gratings
Grating Trends/Focus
We plot the width of the zero order streak of ACIS/HETG observations and the width of the zero order image for HRC/LETG observations of point sources. No significant defocusing trend is seen at this time. See Gratings Trends pages.
PCAD
ACA Trending
| ACIS |
)
|
)
|
)
|
|
|---|---|---|---|---|
)
|
)
|
)
| ||
| HRCI |
)
|
)
|
)
|
)
|
| HRCI |
)
|
)
|
)
|
)
|
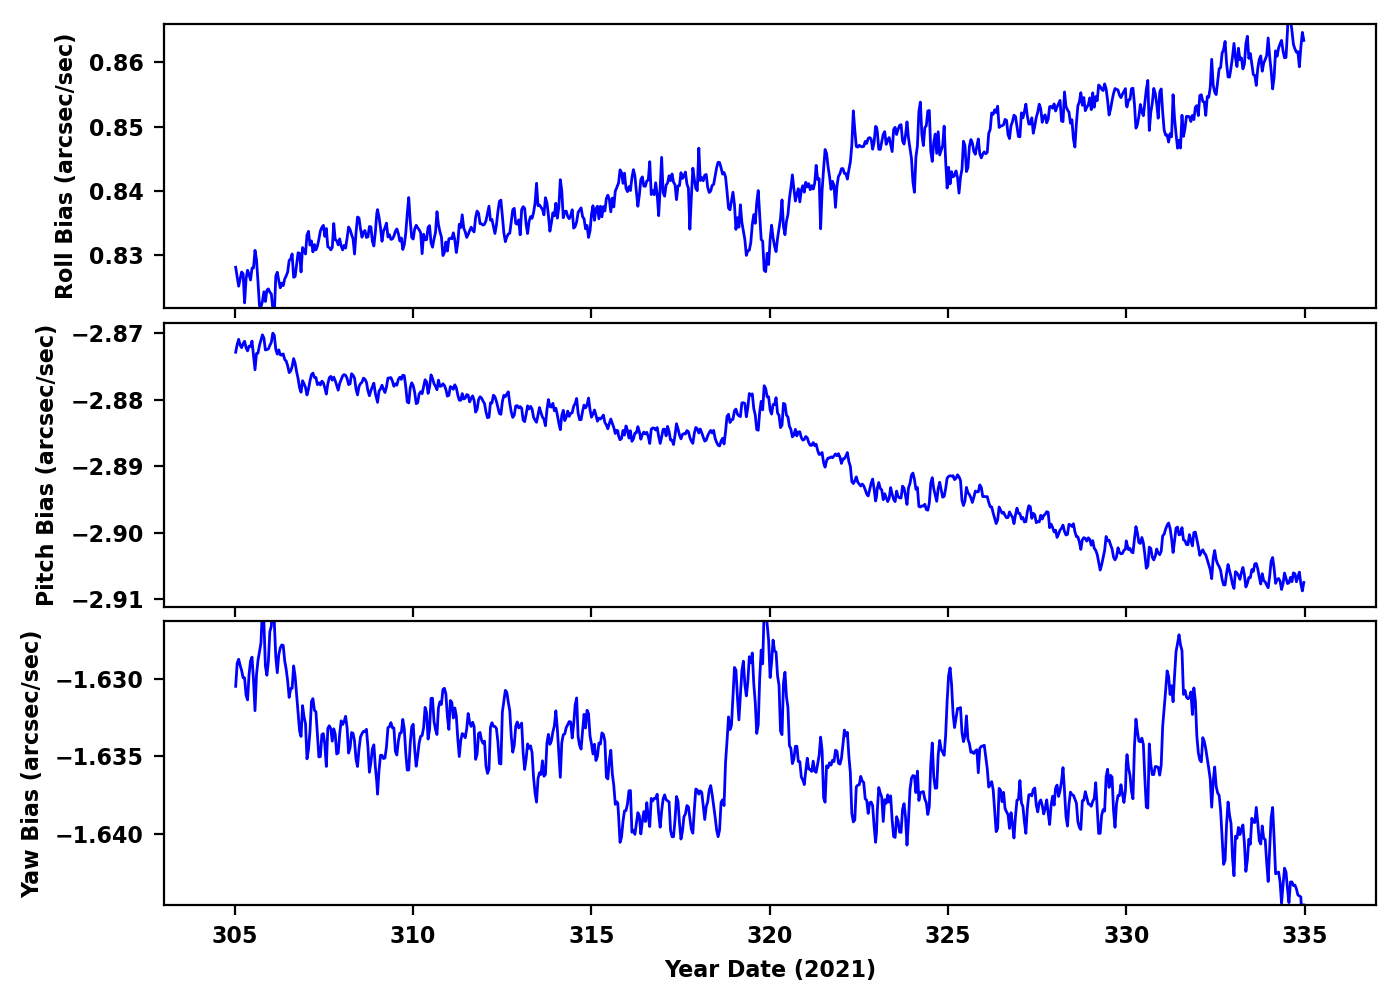
Gyro Bias Drift
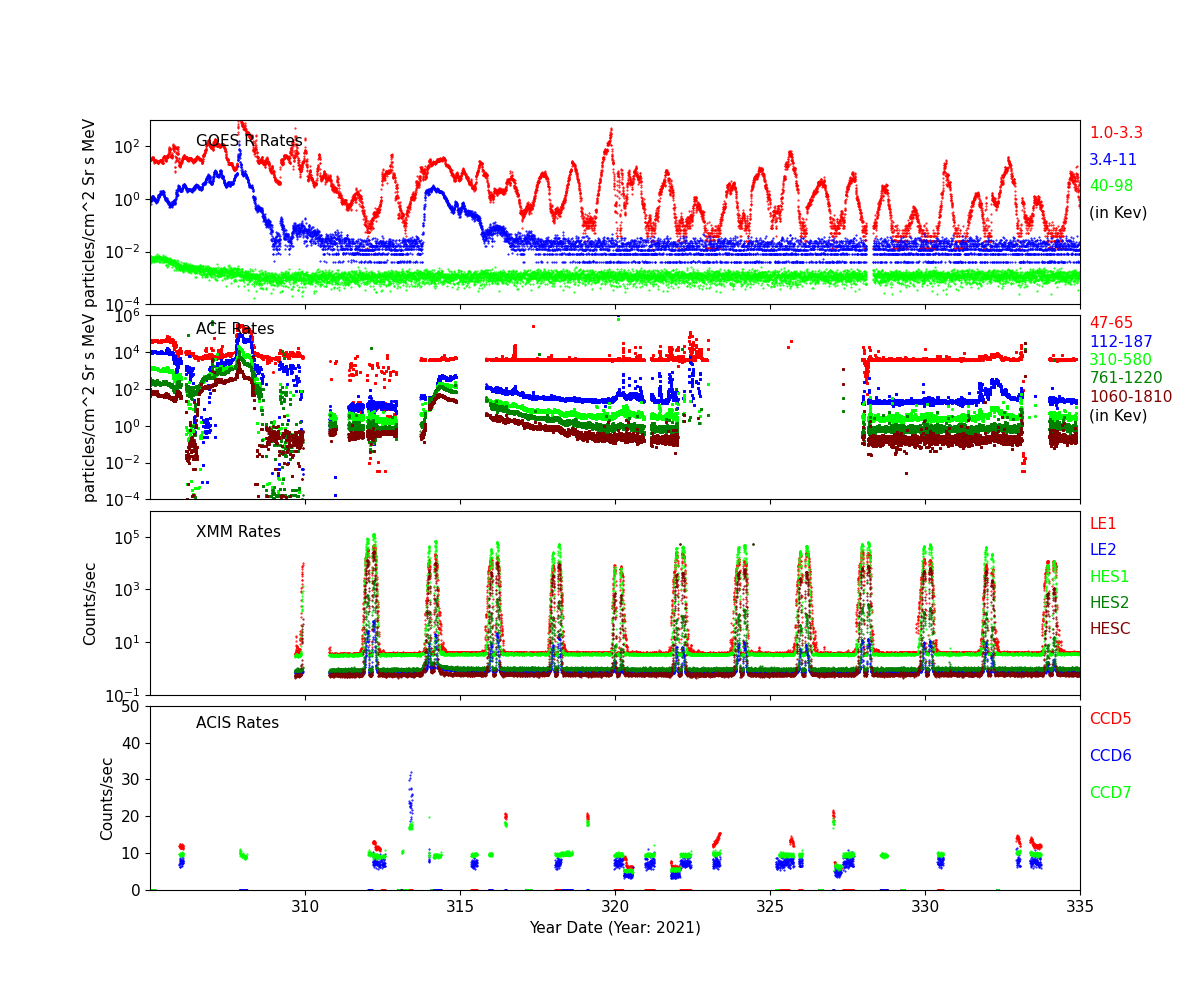
Radiation History
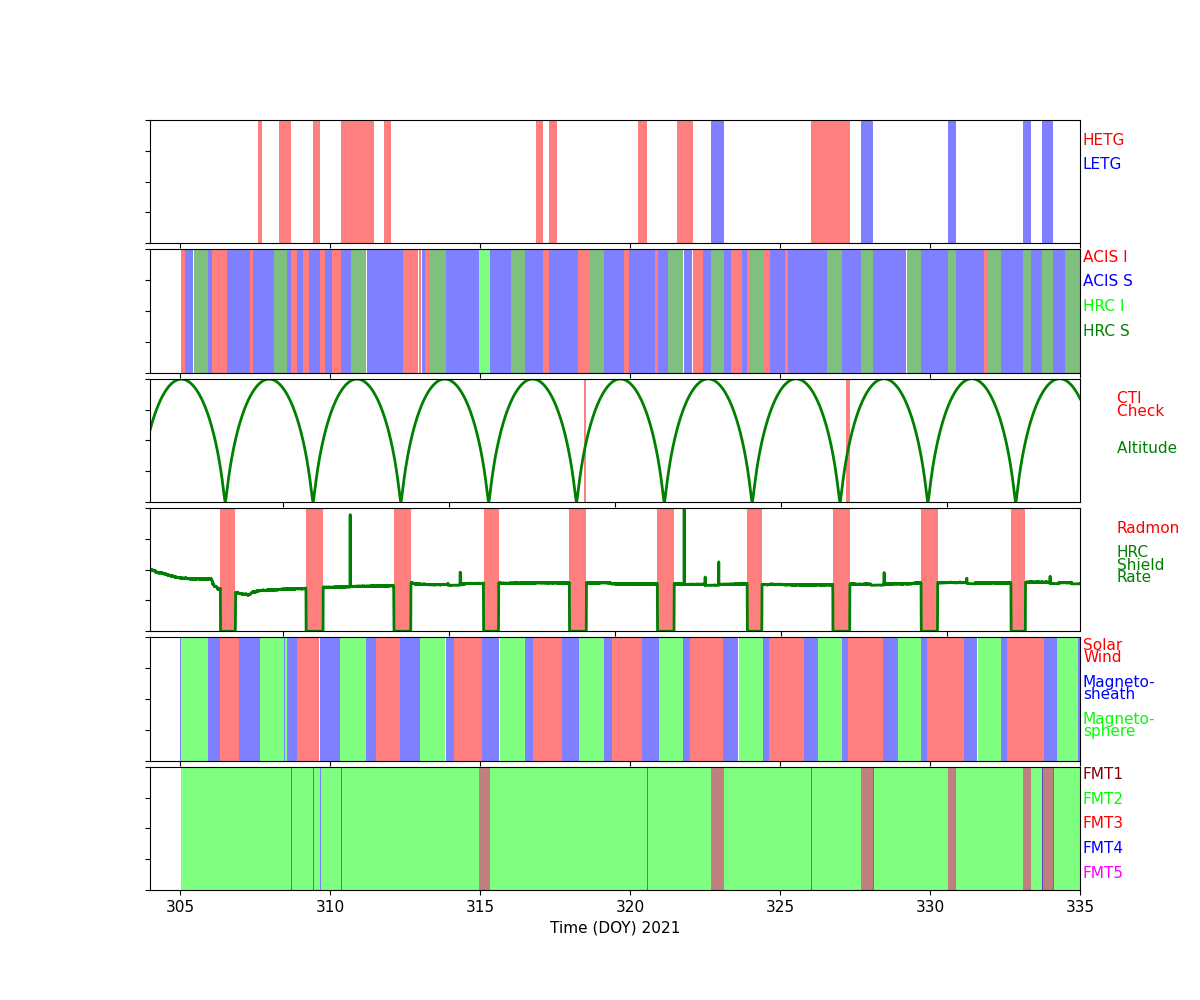
Radiation Count Rates of Nov 2021
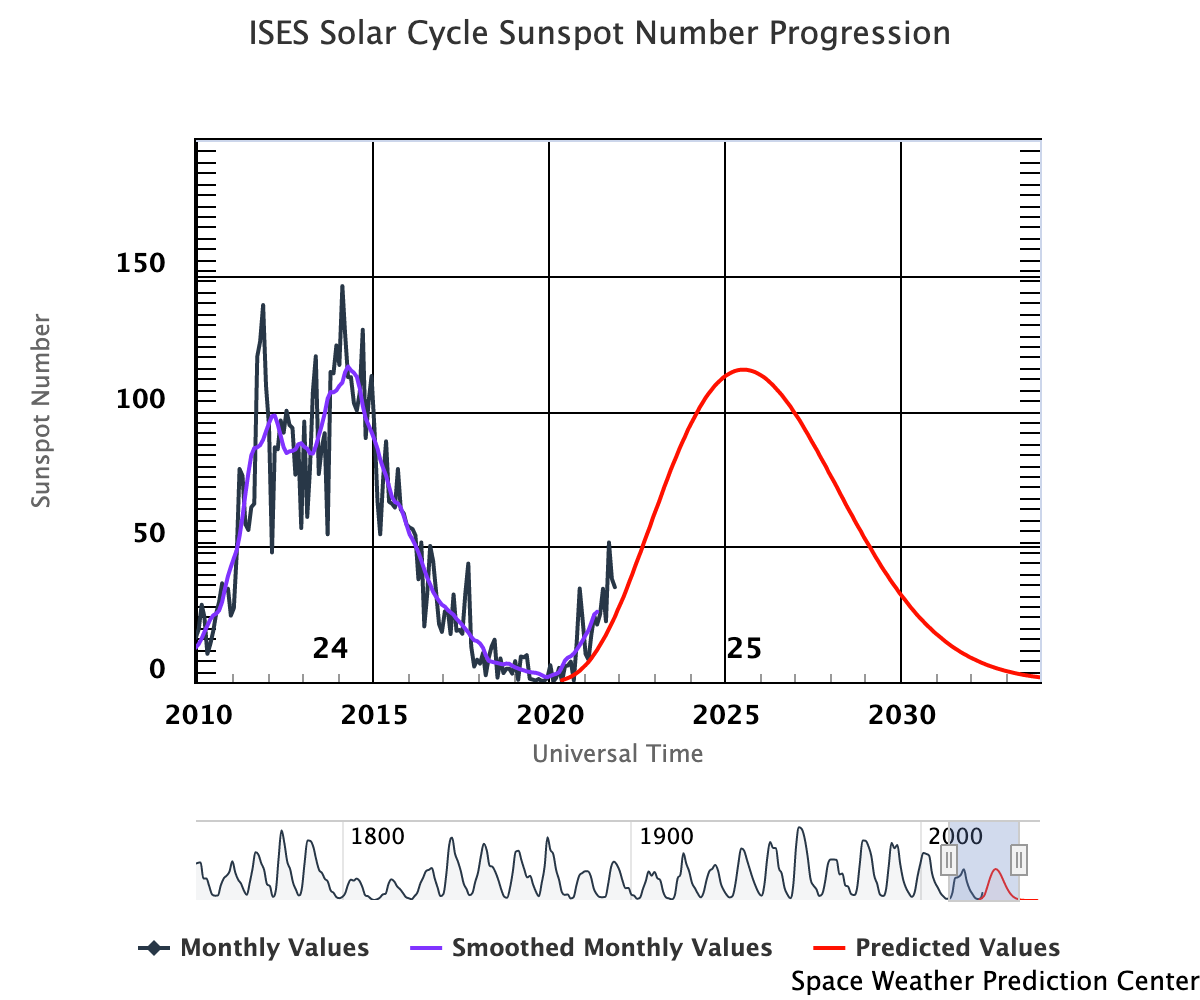
Sun Spot History (See:NOAA Page)
Trending
Quarterly Trends
- HRMA Heater
| Previous Quarter | |||||||
| MSID | MEAN | RMS | DELTA/YR | DELTA/YR/YR | UNITS | DESCRIPTION | |
| ohrthr03 | 3.309e-04 | 1.201e-05 | (2.95+/-0.00)e2 | 0.02 +/- 0.01 | K | RT 5: HRMA FORWARD APERTURE PLATE | |
|---|---|---|---|---|---|---|---|
| ohrthr09 | 0.006 | 1.182e-04 | (2.96+/-0.00)e2 | 0.21 +/- 0.05 | K | RT 105: HRMA CAP | |
| ohrthr17 | 0.006 | 1.269e-04 | (2.96+/-0.00)e2 | 0.21 +/- 0.05 | K | RT 125: HSA OUTER CYNLINDER | |
| ohrthr24 | 0.010 | 2.469e-04 | (2.96+/-0.01)e2 | 0.36 +/- 0.15 | K | RT 12: HRMA AFT HEATER PLATE | |
| ohrthr38 | 0.021 | 7.312e-04 | (3.00+/-0.02)e2 | 0.95 +/- 0.54 | K | RT 120: HRMA AFT COLLIMATOR OUTER CYLINDER | |
| ohrthr52 | 0.006 | 1.233e-04 | (2.96+/-0.00)e2 | 0.21 +/- 0.05 | K | RT 100: HRMA CAP | |
- HRMA Thermal
| Previous Quarter | |||||||
| MSID | MEAN | RMS | DELTA/YR | DELTA/YR/YR | UNITS | DESCRIPTION | |
| 4rt568t | 0.023 | 7.753e-04 | (2.99+/-0.02)e2 | 1.03 +/- 0.58 | K | RT 568 - HRMA TEMP | |
|---|---|---|---|---|---|---|---|
| 4rt569t | 0.009 | 2.162e-04 | (2.96+/-0.01)e2 | 0.32 +/- 0.12 | K | RT 569 - HRMA TEMP | |
| 4rt570t | 0.005 | 1.129e-04 | (2.95+/-0.00)e2 | 0.14 +/- 0.05 | K | RT 570 - HRMA TEMP | |
| 4rt575t | 0.026 | 0.001 | (3.04+/-0.03)e2 | 1.13 +/- 0.77 | K | RT 575 - OB CONE TEMP | |
| 4rt576t | 0.022 | 7.623e-04 | (2.95+/-0.02)e2 | 1.02 +/- 0.56 | K | RT 576 - OB CONE TEMP | |
| 4rt578t | 0.029 | 0.001 | (3.01+/-0.03)e2 | 0.95 +/- 0.93 | K | RT 578 - OB CONE TEMP | |
- MUPS
| Previous Quarter | |||||||
| MSID | MEAN | RMS | DELTA/YR | DELTA/YR/YR | UNITS | DESCRIPTION | |
| pm1thv1t | 0.022 | 0.006 | (3.53+/-0.14)e2 | -3.75 +/- 2.68 | K | MUPS 1 THRUSTER VALVE 01 TEMP | |
|---|---|---|---|---|---|---|---|
| pline02t | 0.038 | 0.005 | (3.34+/-0.12)e2 | -4.79 +/- 2.65 | K | PROP LINE TEMP 02 | |
| pline03t | 0.031 | 0.006 | (3.30+/-0.13)e2 | -4.07 +/- 2.64 | K | PROP LINE TEMP 03 | |
| pline04t | 0.043 | 0.005 | (3.17+/-0.11)e2 | -1.19 +/- 2.78 | K | PROP LINE TEMP 04 | |
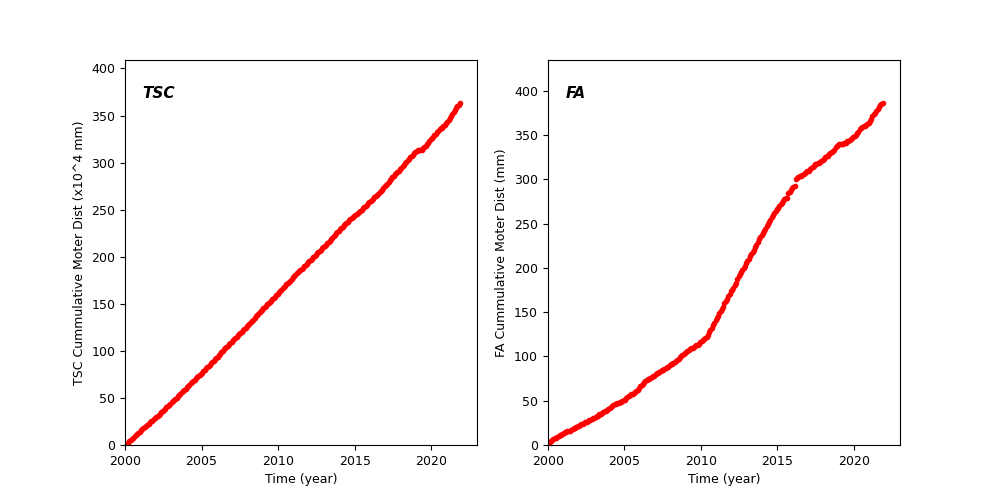
Spacecraft Motions
TSC and FA Cummulative Moter Distance
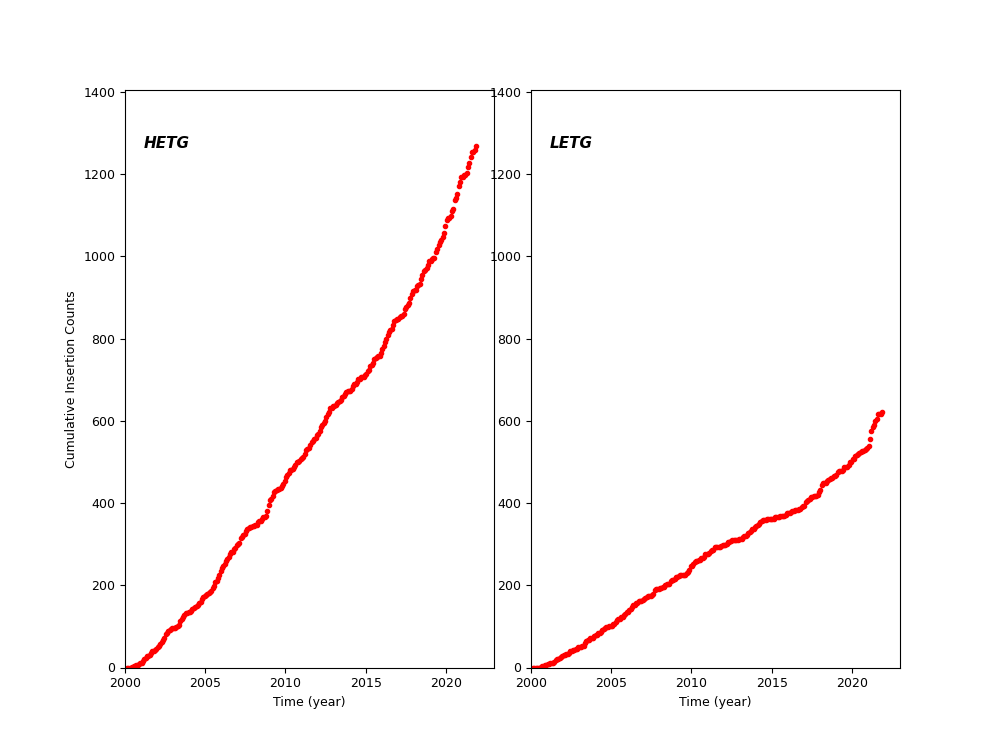
HETG and LETG Cummulative Insertion Counts
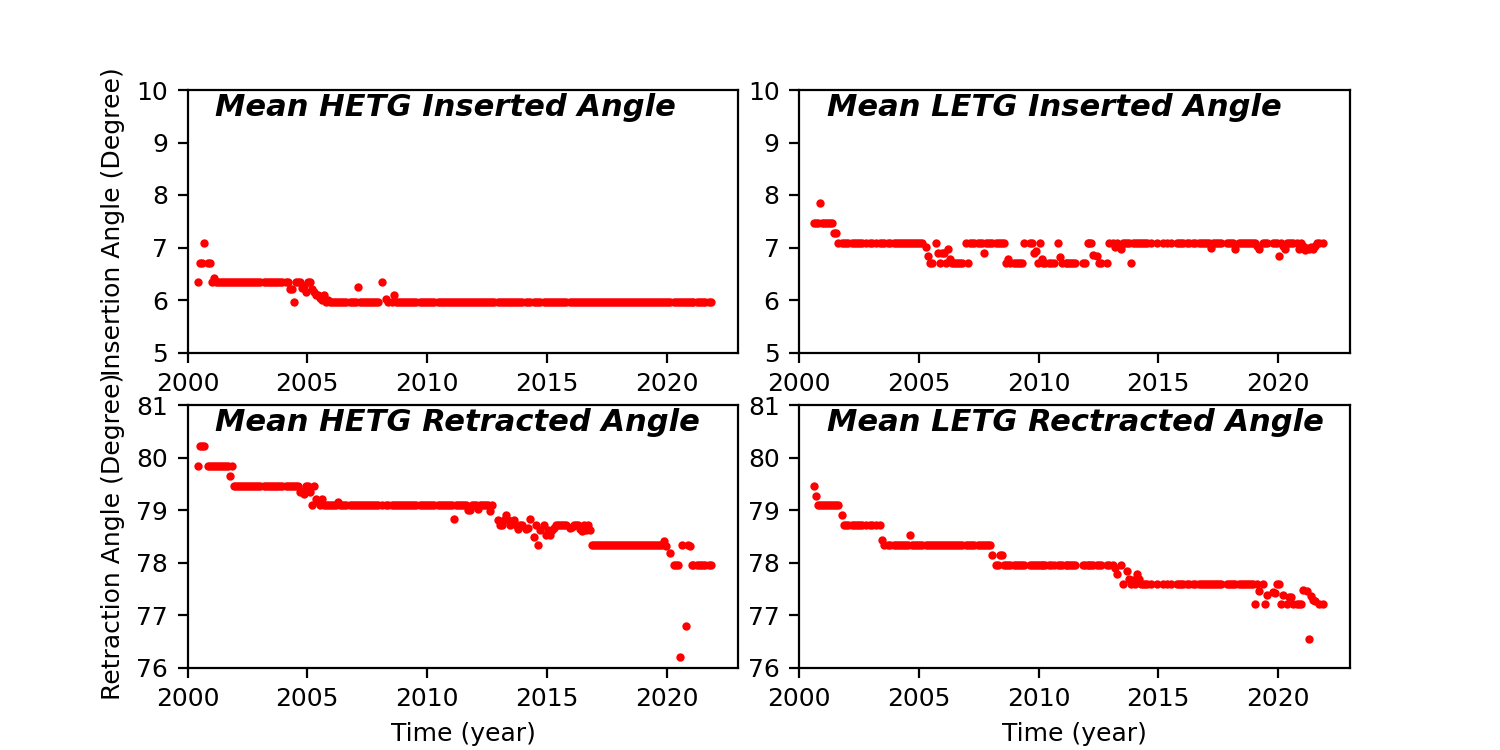
HETG/LETG Insertion/Retraction Angle
Reaction Wheel Rotations