ACIS
ACIS DOSE Registered-Photon-Map
The steps we took to compute the dose map are;
- Level 1 Event files for a specified month are obtained from archive.
- Image data including I2, I3, S2, S3 CCDs are extracted from all event files.
- All the extracted image data were merged to create a month long exposure map for the month.
- The exposure map is opened with ds9, and check a distribution of count rates against energy. From this, estimate the upper threshold value. Any events beyond this upper threshold are assumed erroneous events such as bad pixels.
- Using this upper threshold, the data is filtered, and create a cleaned exposure map for the month.
- The exposure map from each month from the Sep 1999 is added up to create a cumulative exposure map for each month.
- Using fimgstatistic, we compute count rate statistics for each CCDs.
- For observations with high data drop rates (e.g., Crab nebula, Cas A), we corrected the observations by adding events.
Please check more detail plots at Telemetered Photon Dose Trend page.
)
)
)
Statistics:
# IMAGE     NPIX     MEAN        RMS        MIN     MAX
ACIS_sep21 6004901       6.186         7.909           0.0     1729


I2 node 0  262654	6.266179	3.194158	0.0	 72.0
I2 node 1  262654	6.506698	3.727276	0.0	804.0
I2 node 2  262654	6.734742	3.353713	0.0	 72.0
I2 node 3  262654	6.912671	3.617102	0.0	272.0

I3 node 0  262654	8.351249	3.805143	0.0	109.0
I3 node 1  262654	8.260996	5.164068	0.0	1442.0
I3 node 2  262654	7.673233	3.438815	0.0	 80.0
I3 node 3  262654	7.591938	3.371472	0.0	117.0

S2 node 0  262654	6.912937	5.512198	0.0	1729.0
S2 node 1  262654	7.047705	3.479982	0.0	194.0
S2 node 2  262654	7.136416	3.465925	0.0	259.0
S2 node 3  262654	7.021983	3.402434	0.0	431.0

S3 node 0  262654	10.767256	7.543903	0.0	162.0
S3 node 1  262654	11.862446	4.636355	0.0	107.0
S3 node 2  262654	11.520293	3.917526	0.0	 59.0
S3 node 3  262654	10.487873	3.887251	0.0	 49.0
)
)
)
Statistics:
 IMAGE     NPIX      MEAN        RMS           MIN      MAX
ACIS_total   6004901       2517.470         3239.301           0.0   139275


I2 node 0  262654	2174.632063	436.491458	464.0	12992.0
I2 node 1  262654	2286.826810	619.217758	478.0	122769.0
I2 node 2  262654	2313.388810	490.030176	496.0	13483.0
I2 node 3  262654	2319.180905	599.288107	471.0	28788.0

I3 node 0  262654	2492.554076	612.952930	461.0	13503.0
I3 node 1  262654	2569.785095	1724.885498	495.0	55681.0
I3 node 2  262654	2284.893591	427.727722	468.0	13554.0
I3 node 3  262654	2277.168366	459.864031	432.0	34315.0

S2 node 0  262654	2935.082966	475.317618	1599.0	22270.0
S2 node 1  262654	3111.916099	706.210210	1782.0	16870.0
S2 node 2  262654	3444.738212	712.006361	2199.0	29089.0
S2 node 3  262654	3407.082626	567.045074	1939.0	69260.0

S3 node 0  262654	5232.792536	2889.093671	2271.0	53380.0
S3 node 1  262654	6422.810594	2349.383924	0.0	38094.0
S3 node 2  262654	5162.358862	1336.647974	2326.0	27092.0
S3 node 3  262654	4033.325117	751.432014	2438.0	26340.0
)
|
)
|
)
|
)
|
| Jun 2021 | Mar 2021 | Dec 2020 | Sep 2020 |
|---|
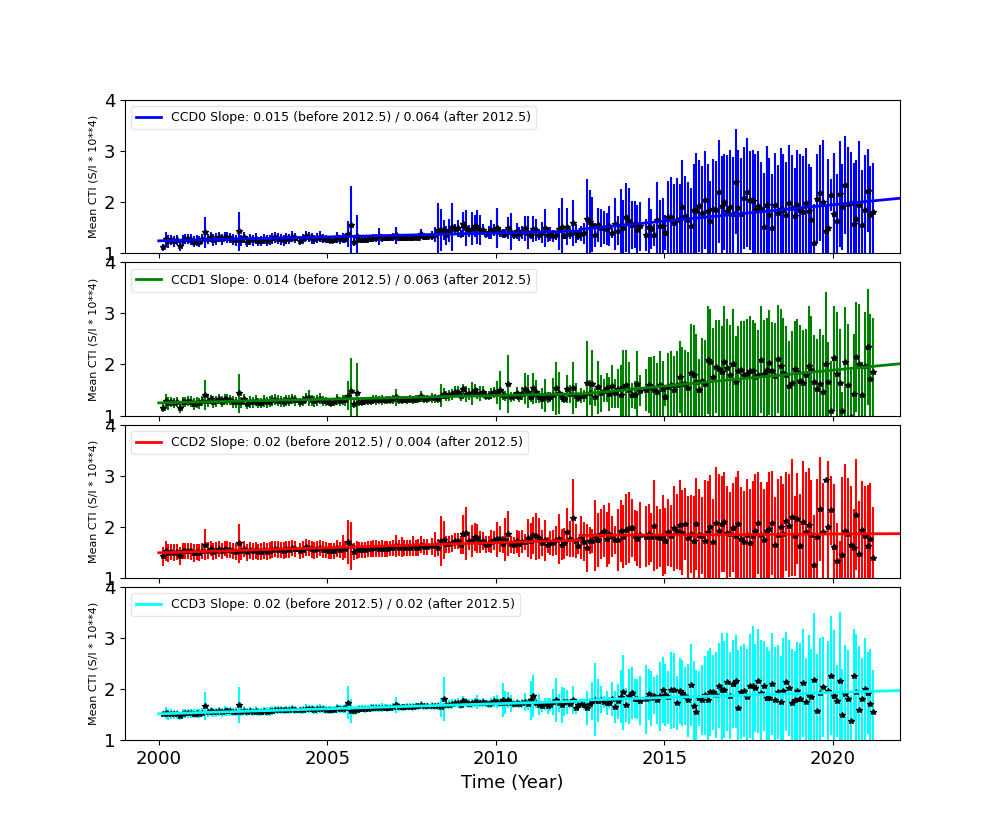
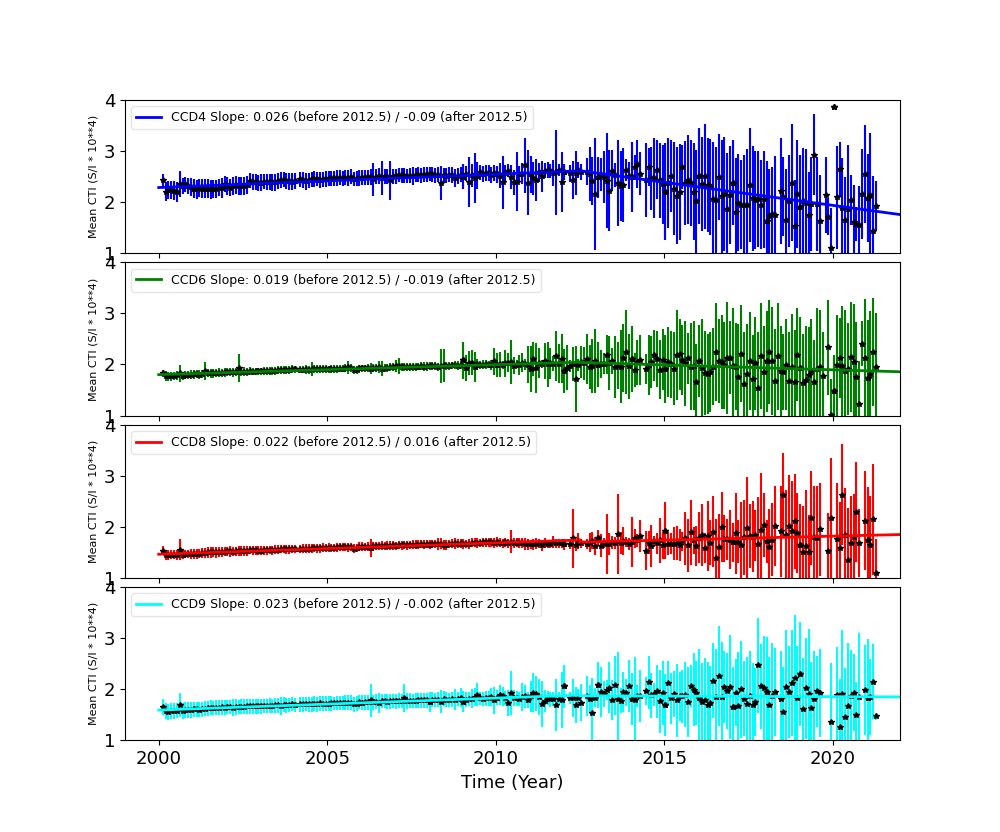
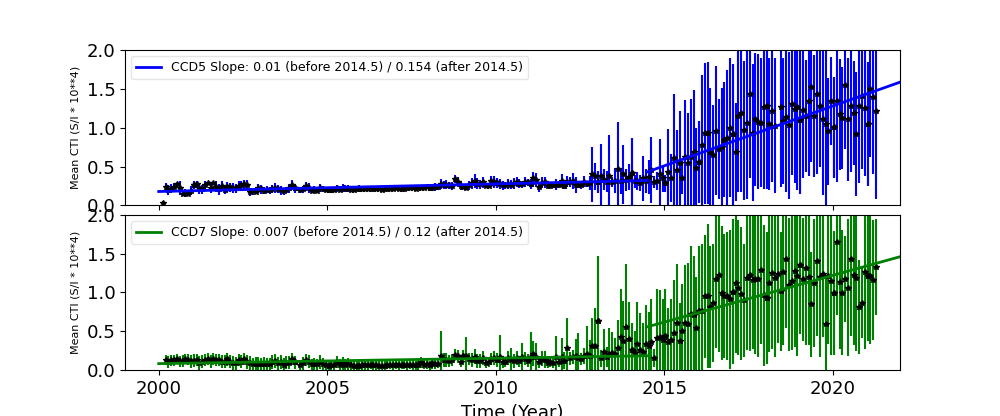
The Mean Detrended CTI
We report CTIs with a refined data definition. CTIs were computed for the temperature dependency corrected data. Please see CTI page for detailed explanation. CTI's are computed for Mn K alpha, and defined as slope/intercept x10^4 of row # vs ADU. Data file: here
Imaging CCDs
Spectral CCDs
Backside CCDs
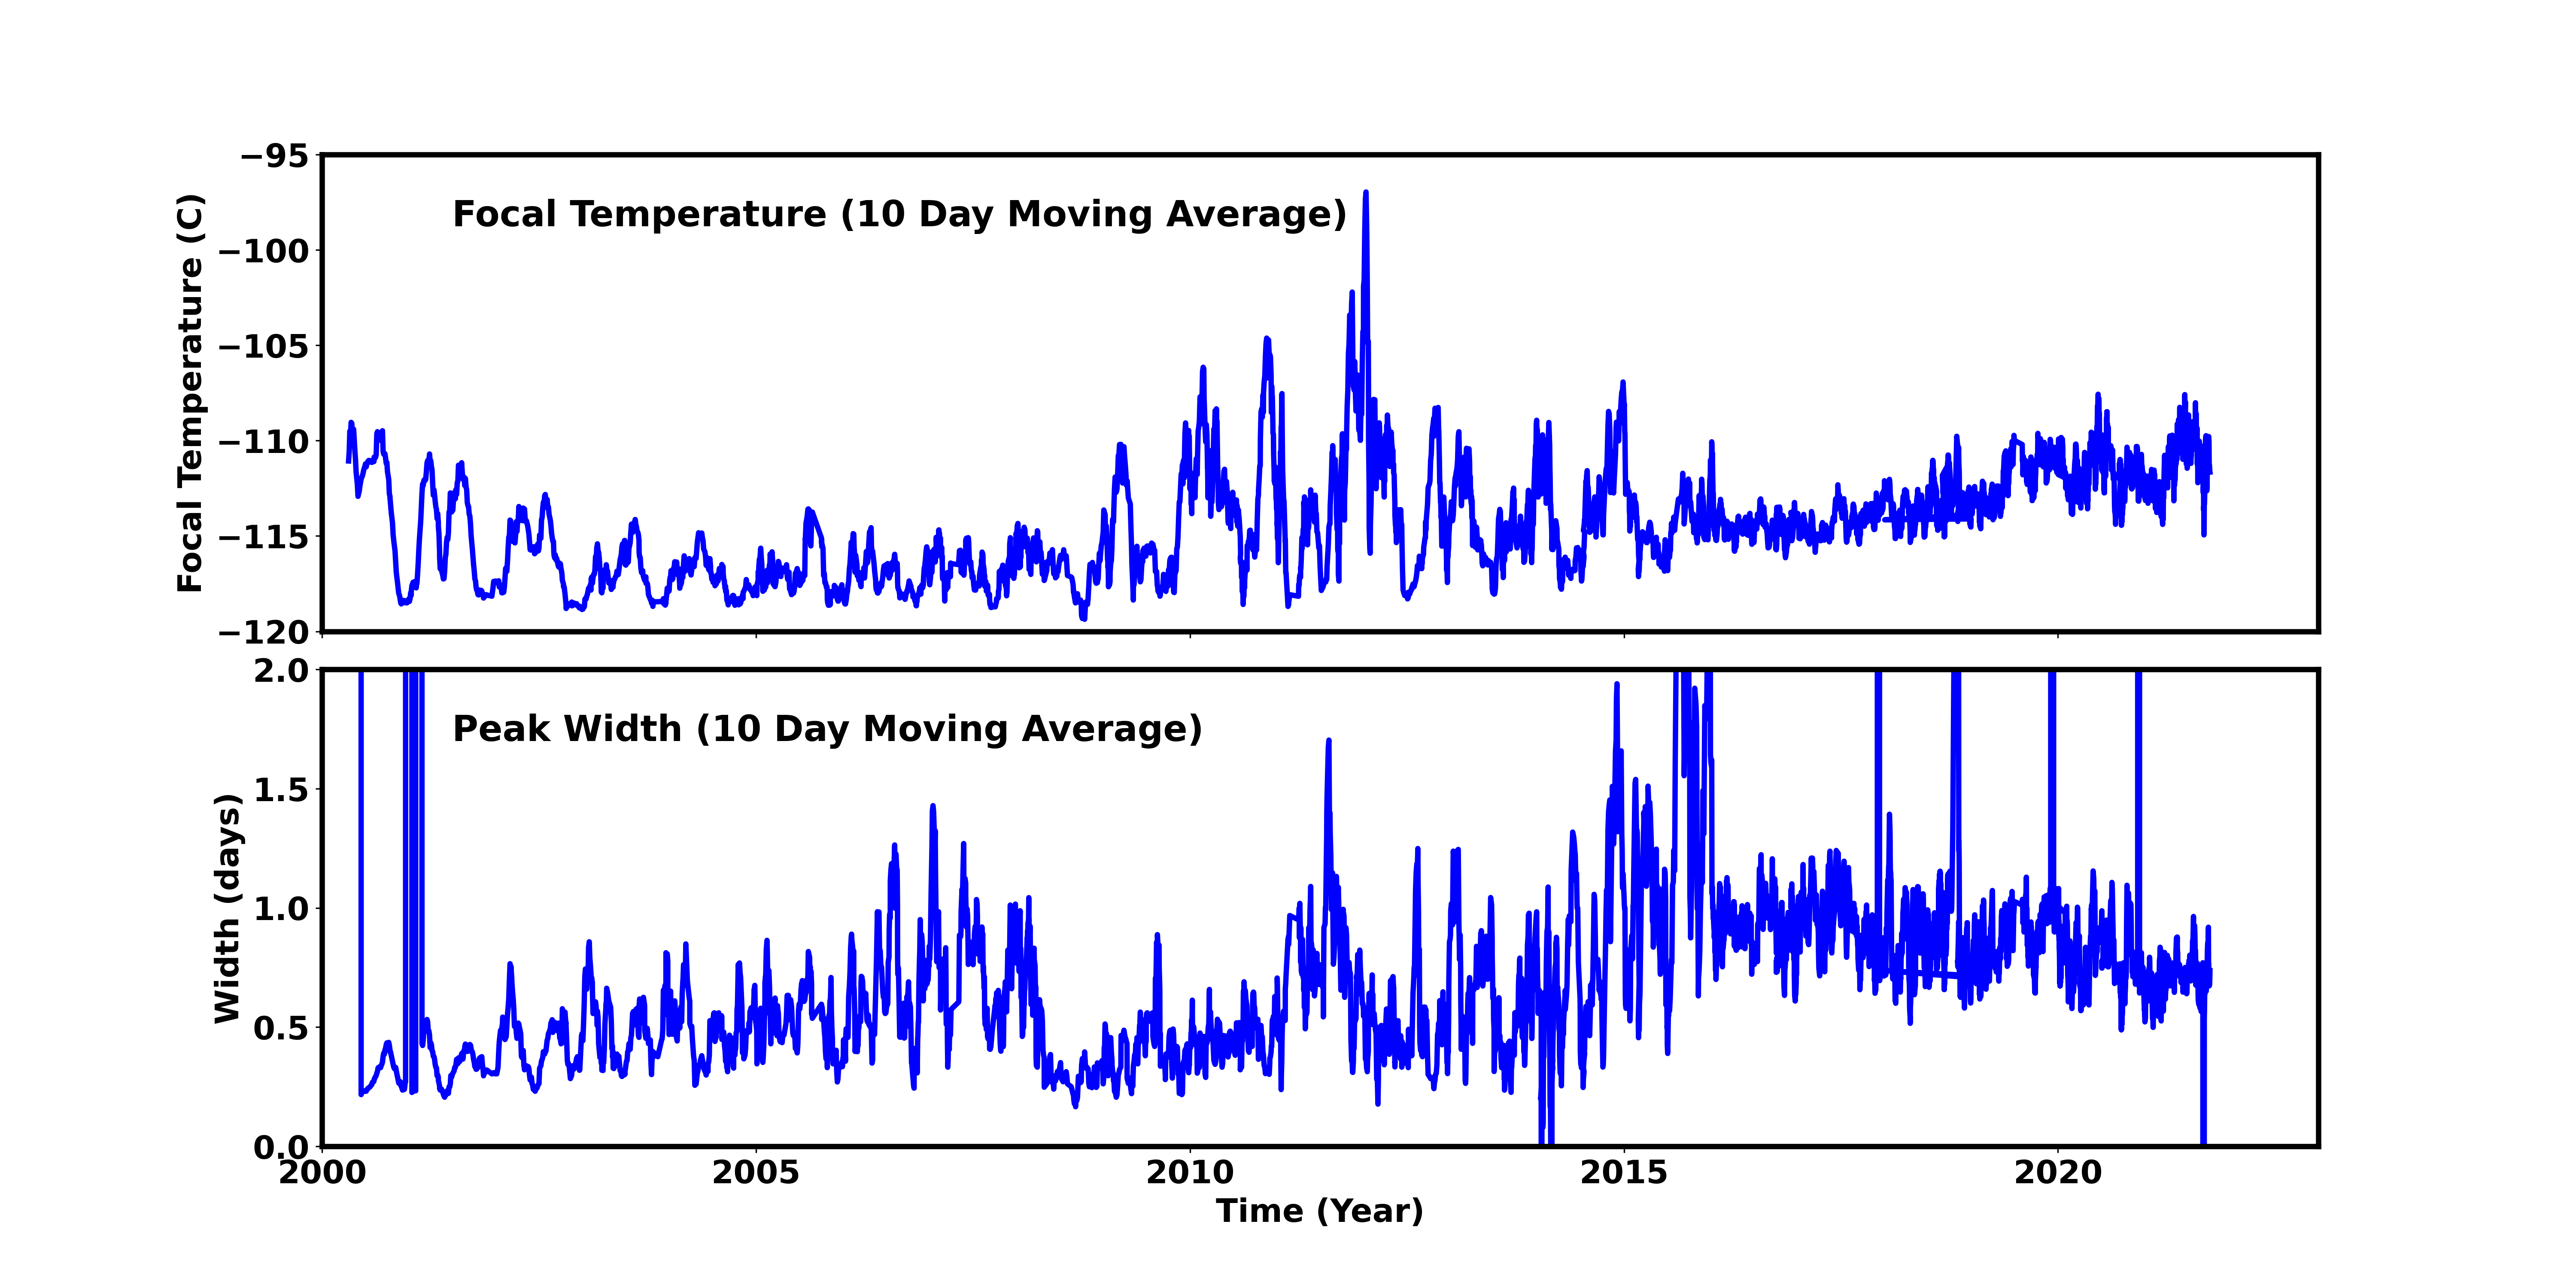
Focal Plane Temperature
Sep 2021 Focal Temperature
| The Mean (max) FPT: | |
|---|---|
| -111.57 | +/- 4.72 C |
| Mean Width: | |
| 0.72 | +/- 0.32 days |
Averaged Focal Plane Temperature
We are using 10 period moving averages to show trends of peak temperatures and peak widths. Note, the gaps in the width plot are due to missing/corrupted data.
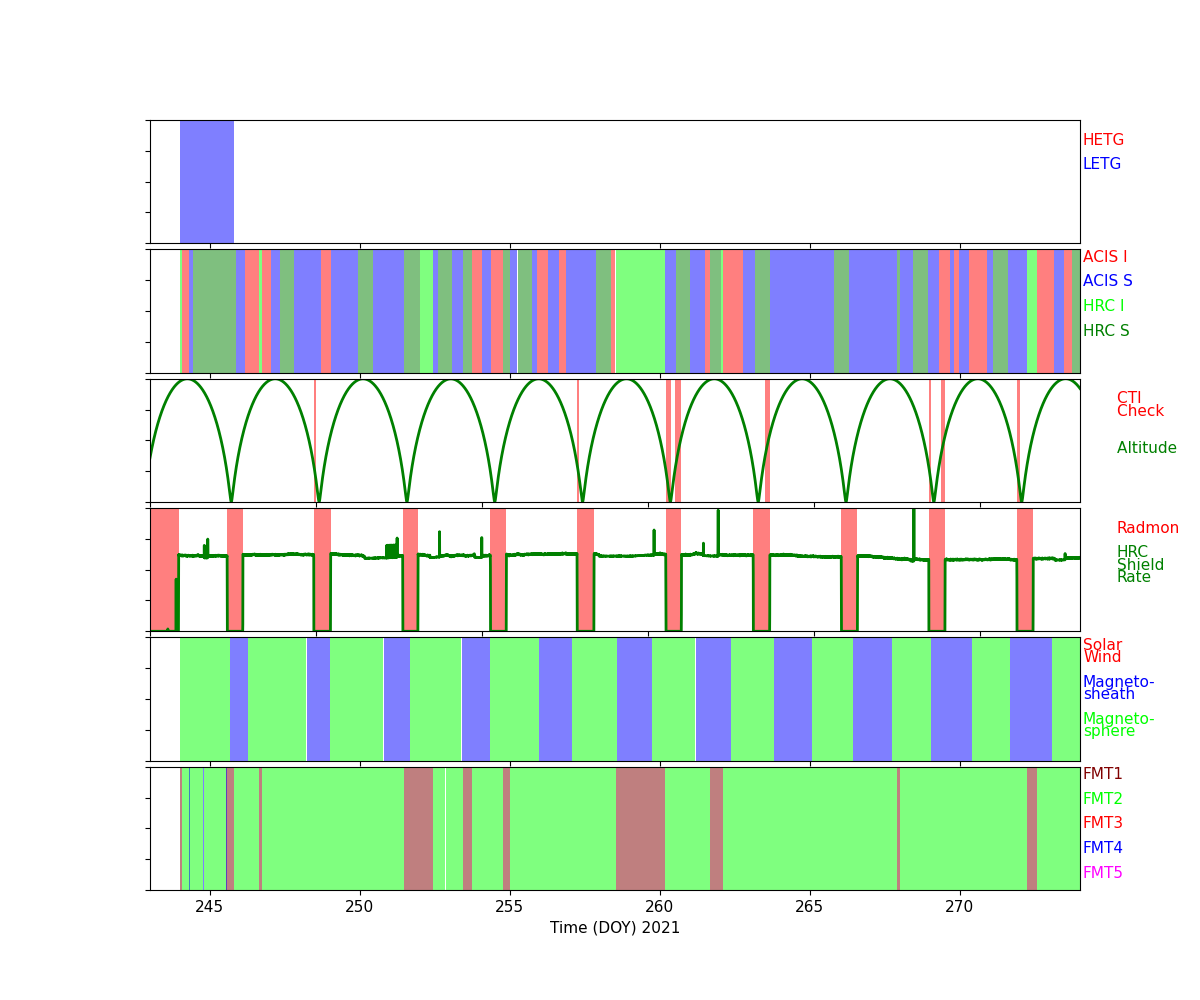
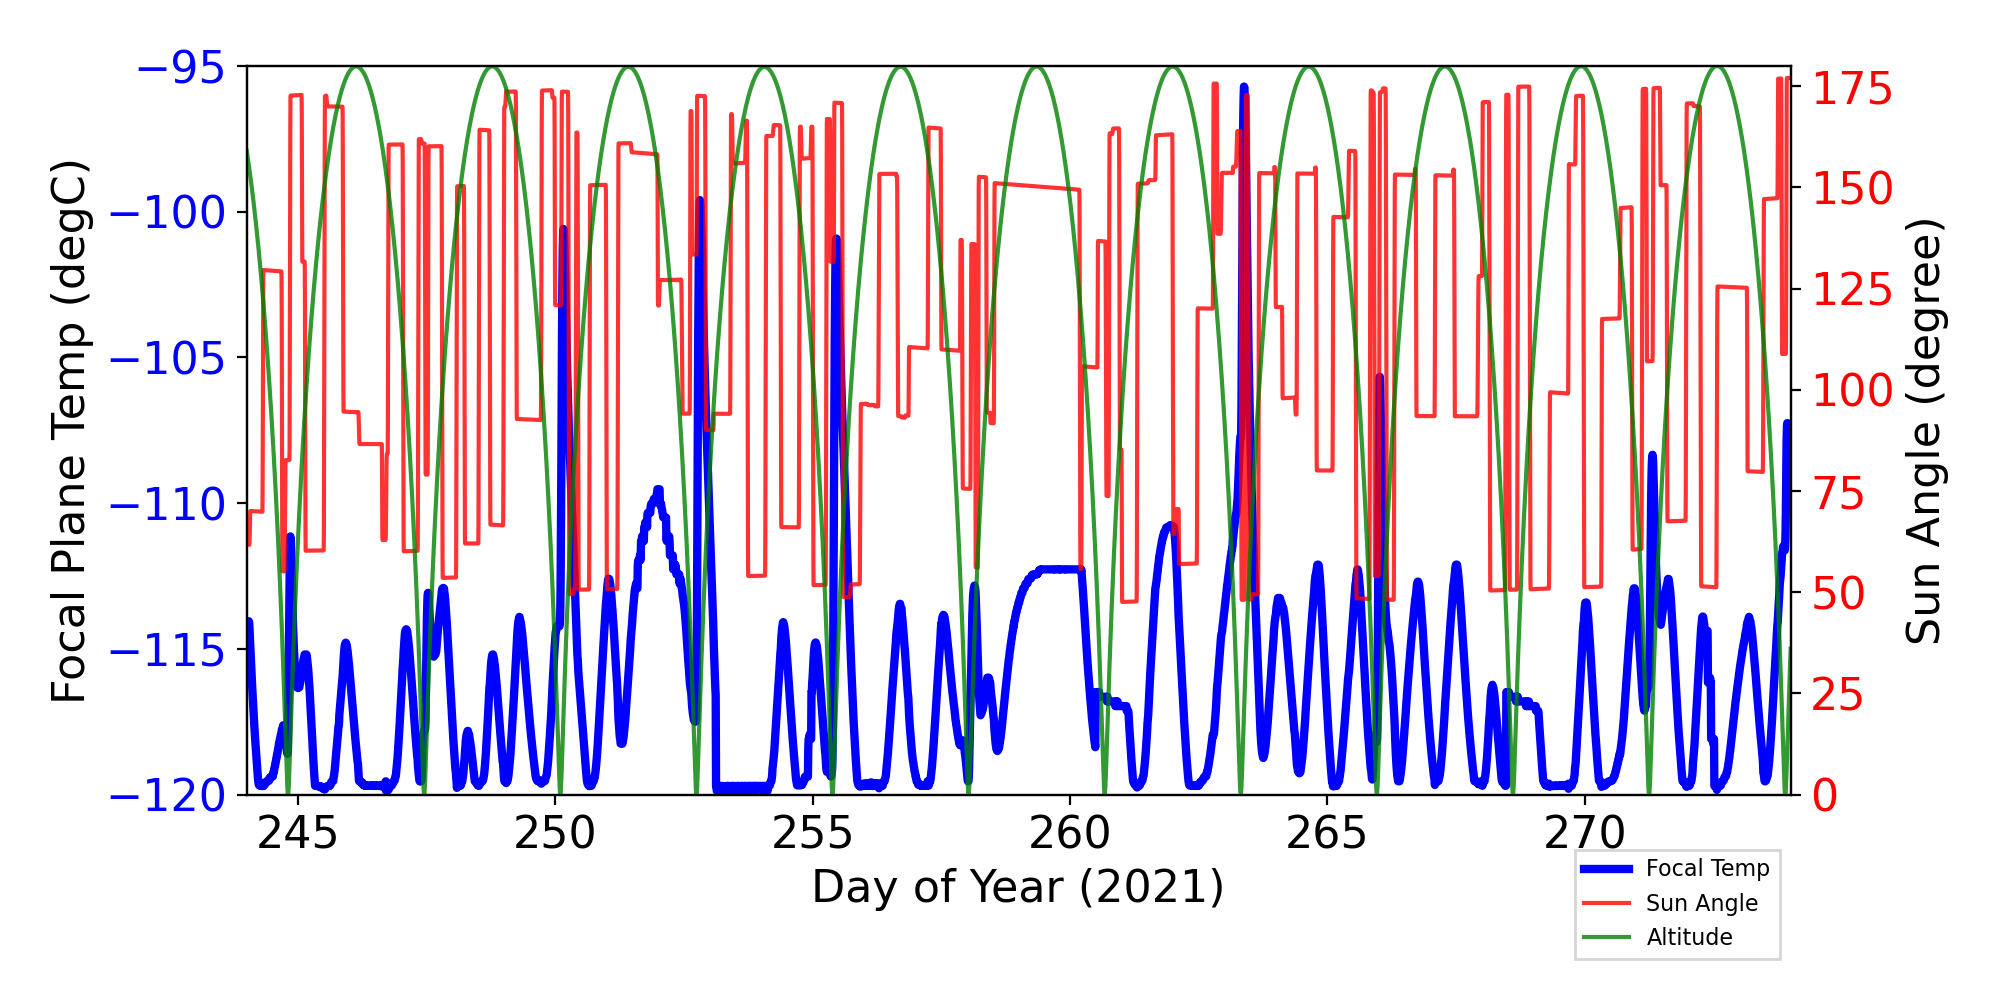
Focal Plane Temperature, Sun Angle and Altitude
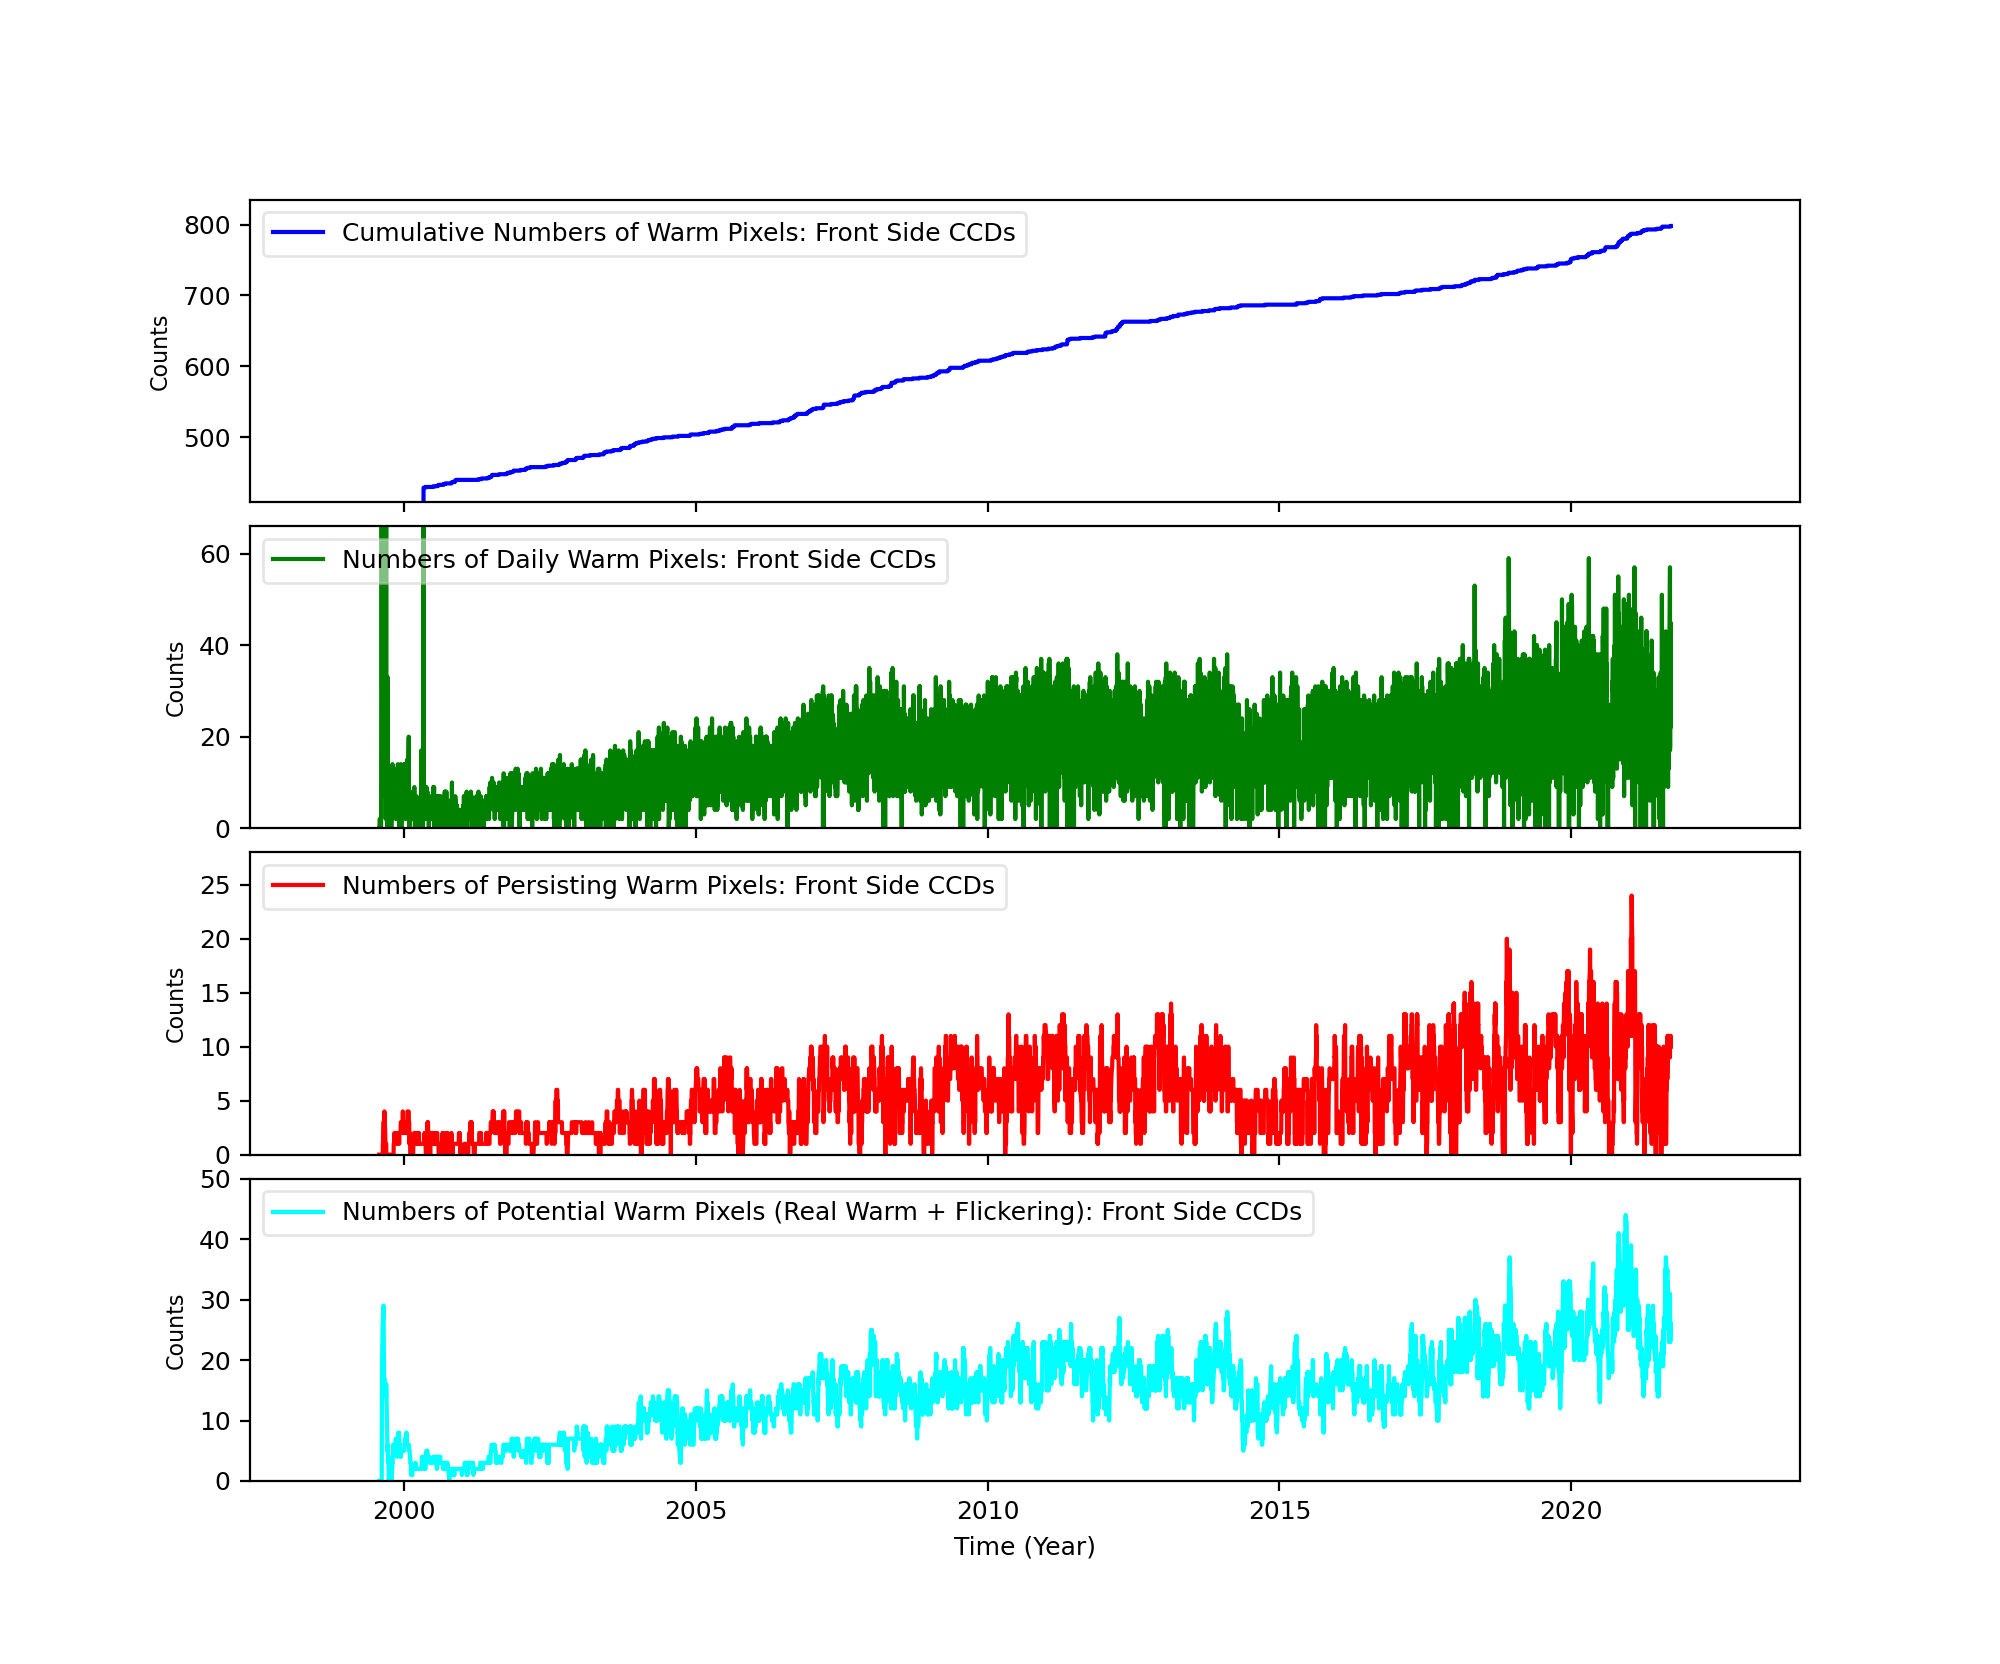
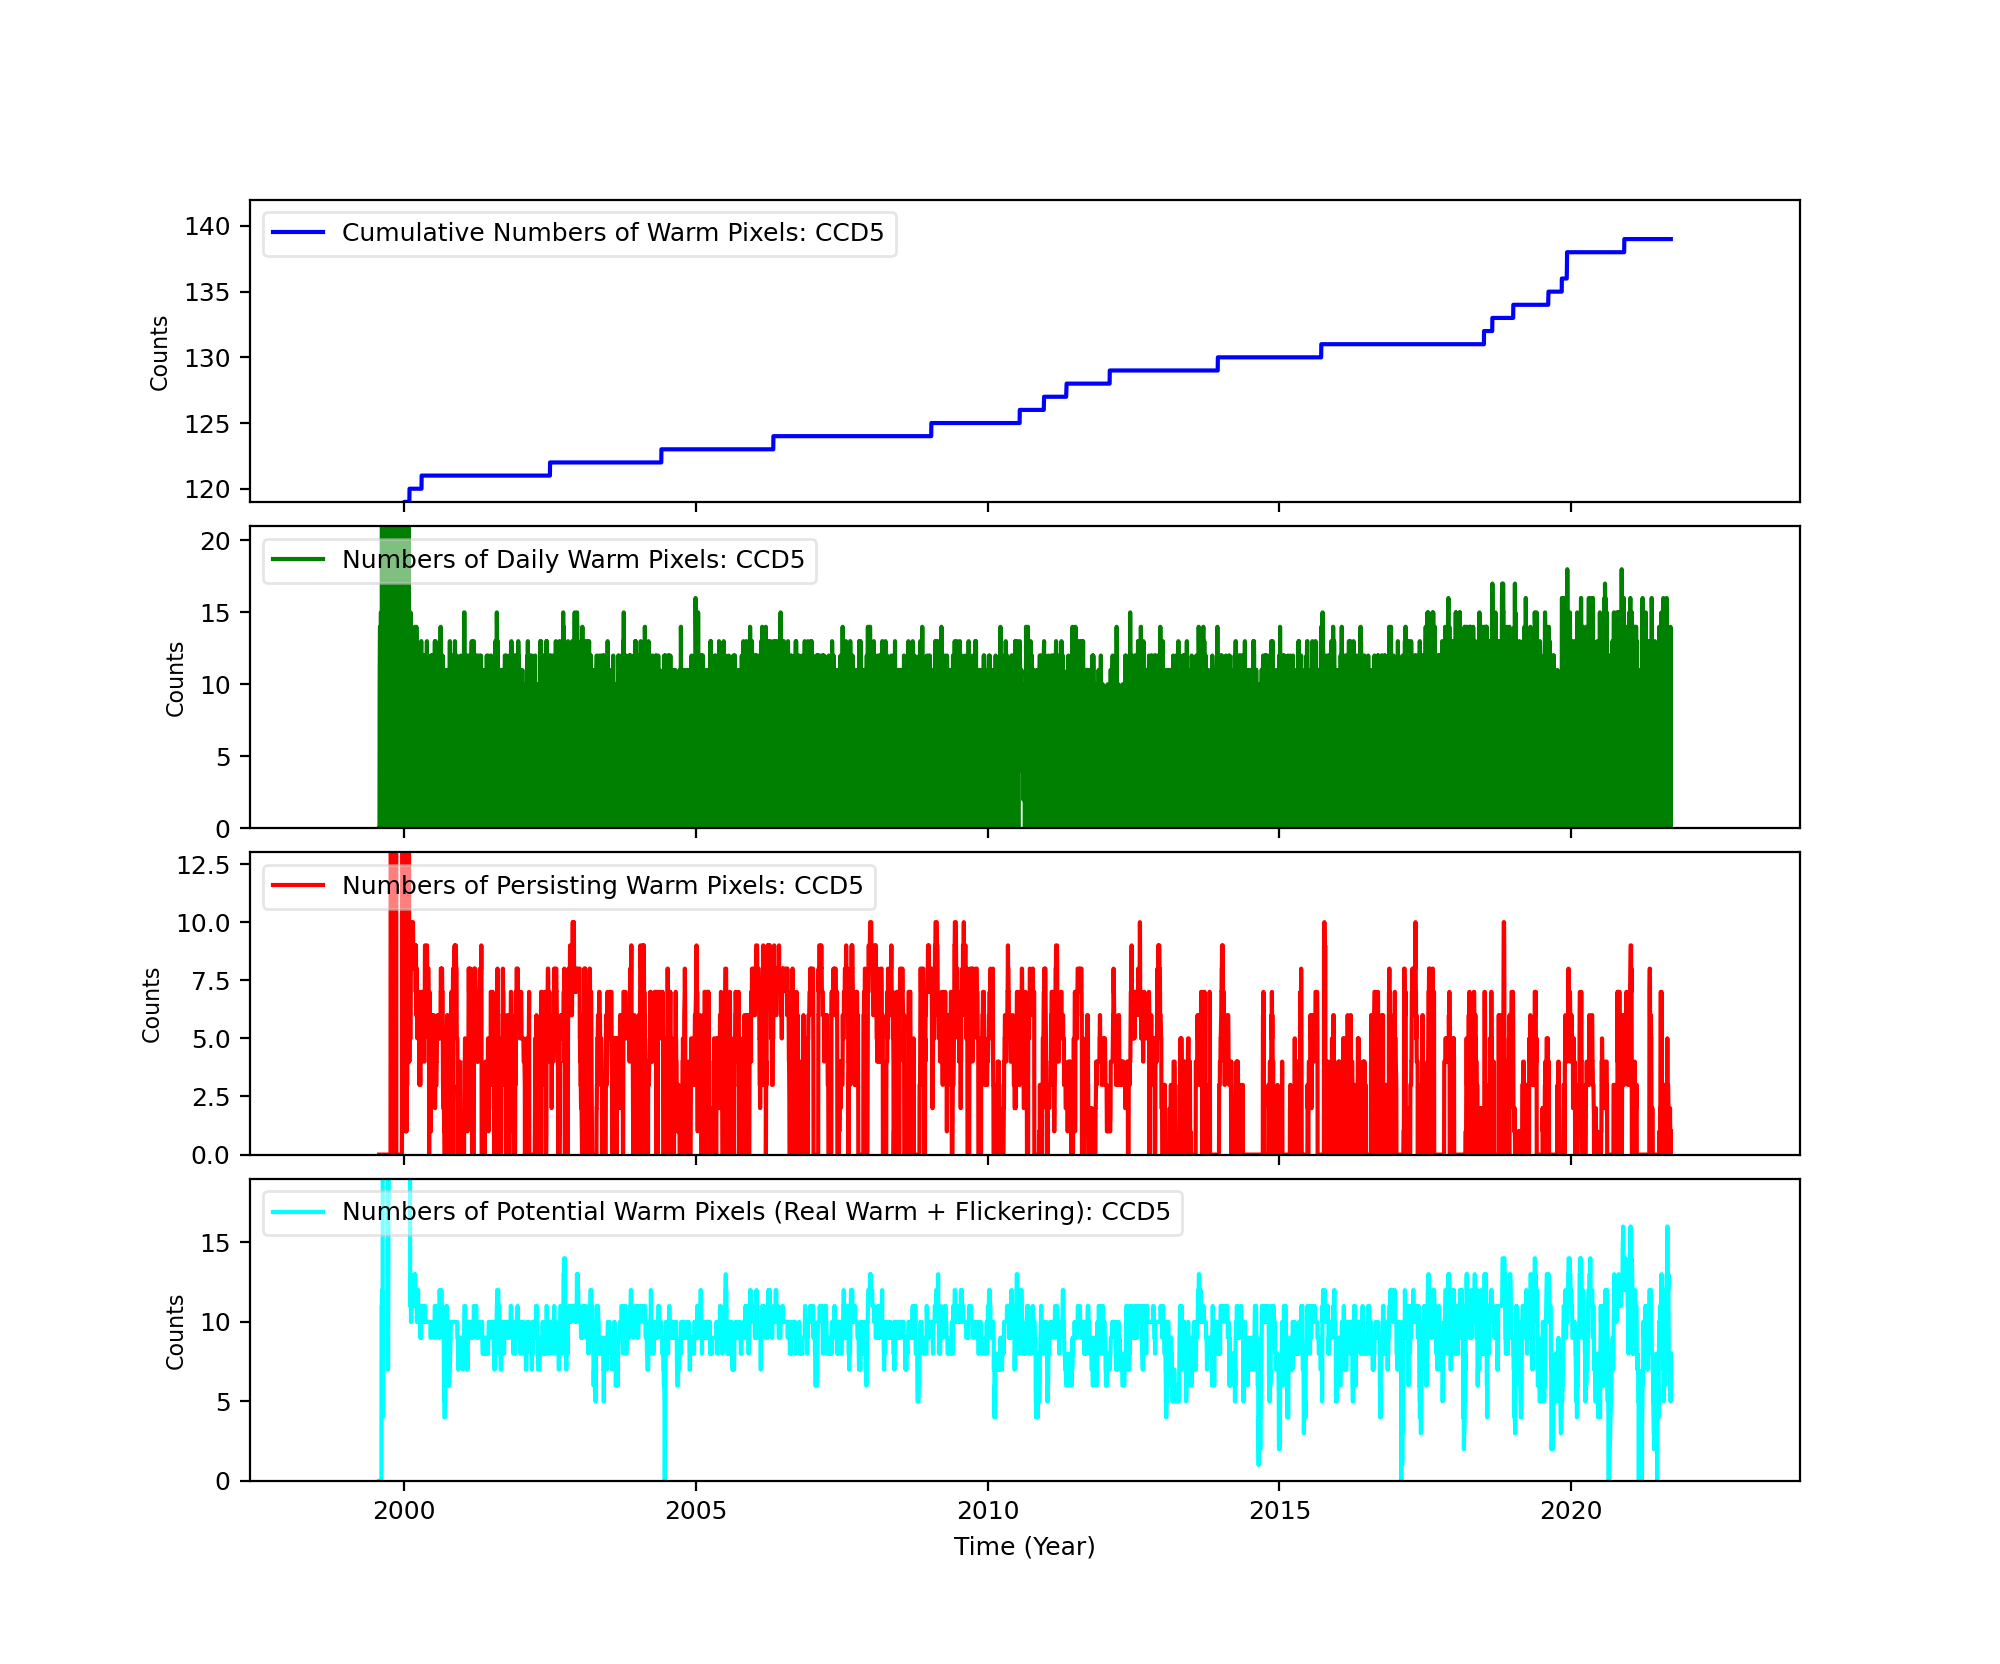
Bad Pixels
The plots below were generated with a new warm pixel finding script. Please see Acis Bad Pixel Page for details.
Front Side CCDs
Back Side CCD (CCD5)
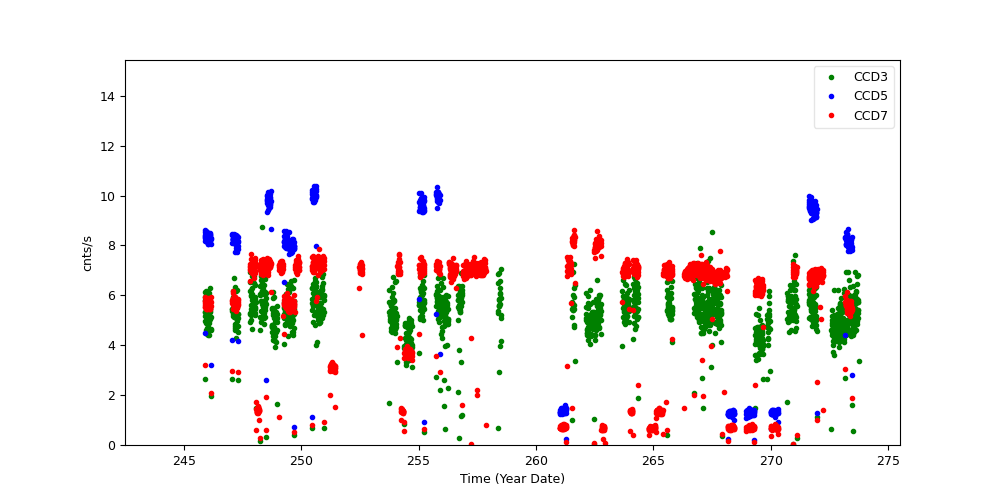
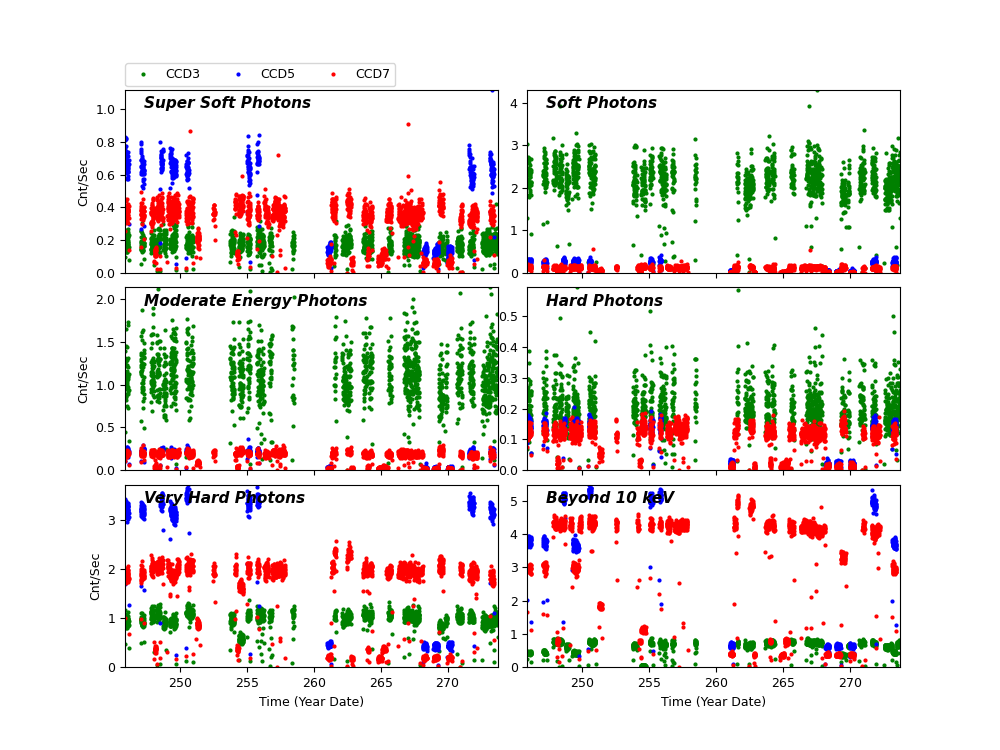
Science Instrument Background Rates
| Name | Low (keV) | High(KeV) | Description |
|---|---|---|---|
| SSoft | 0.00 | 0.50 | Super soft photons |
| Soft | 0.50 | 1.00 | Soft photons |
| Med | 1.00 | 3.00 | Moderate energy photons |
| Hard | 3.00 | 5.00 | Hard Photons |
| Harder | 5.00 | 10.00 | Very Hard photons |
| Hardest | 10.00 | Beyond 10 keV |
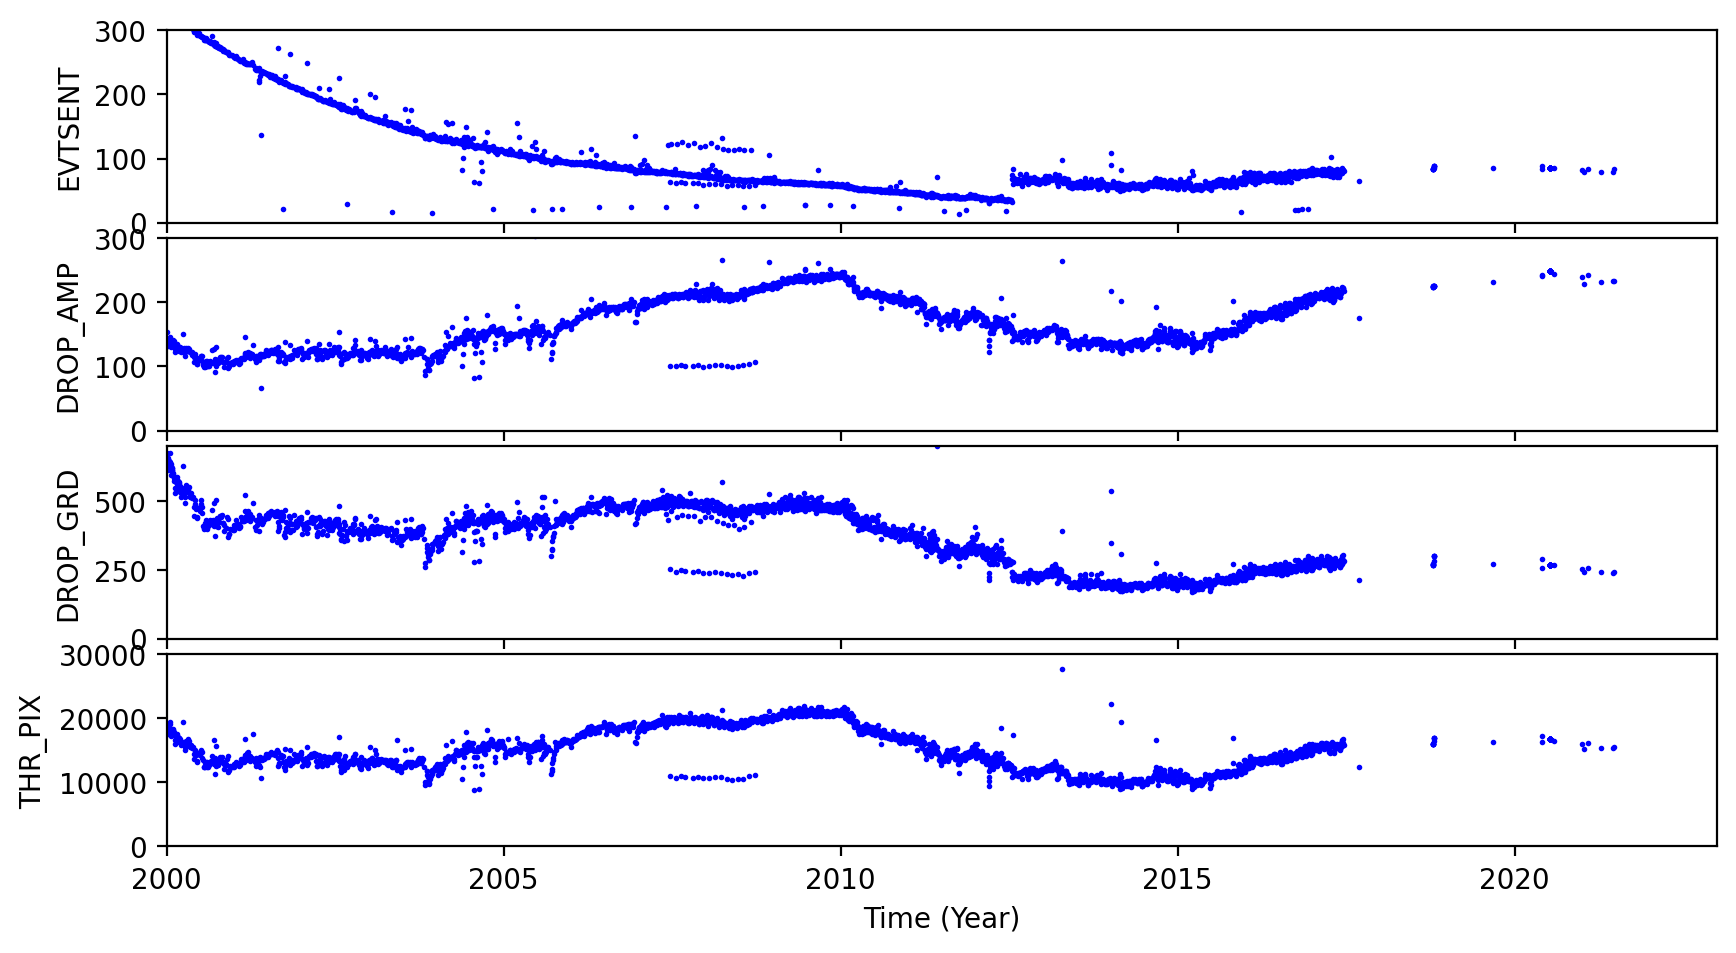
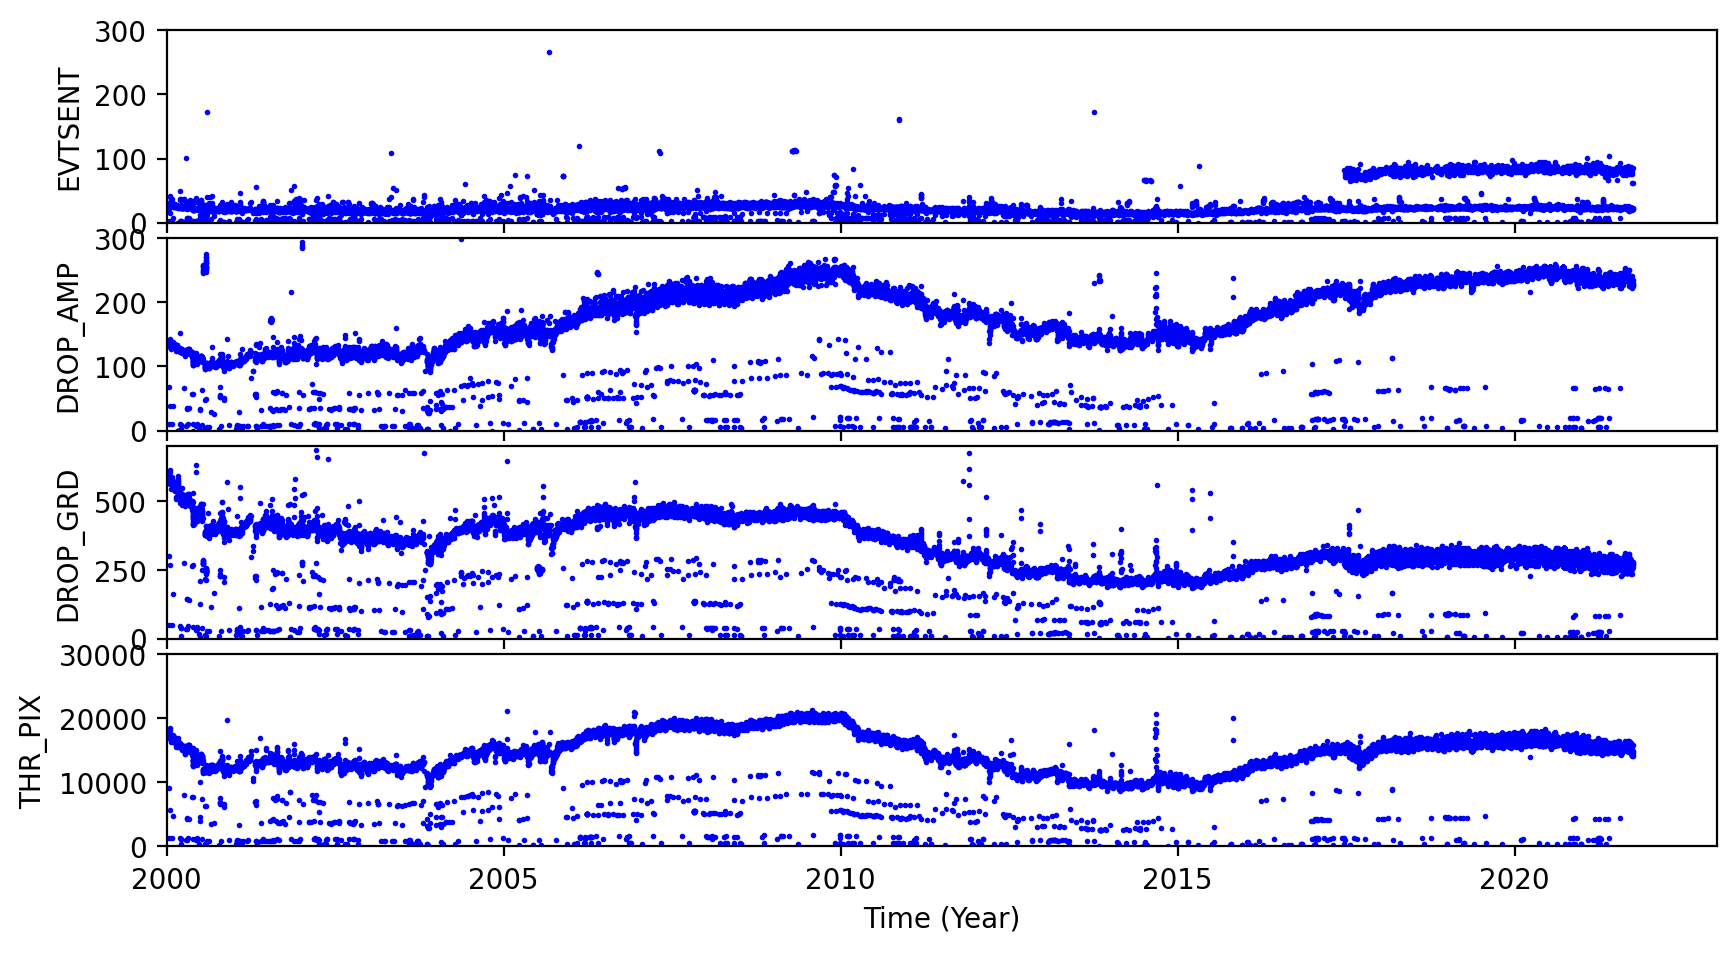
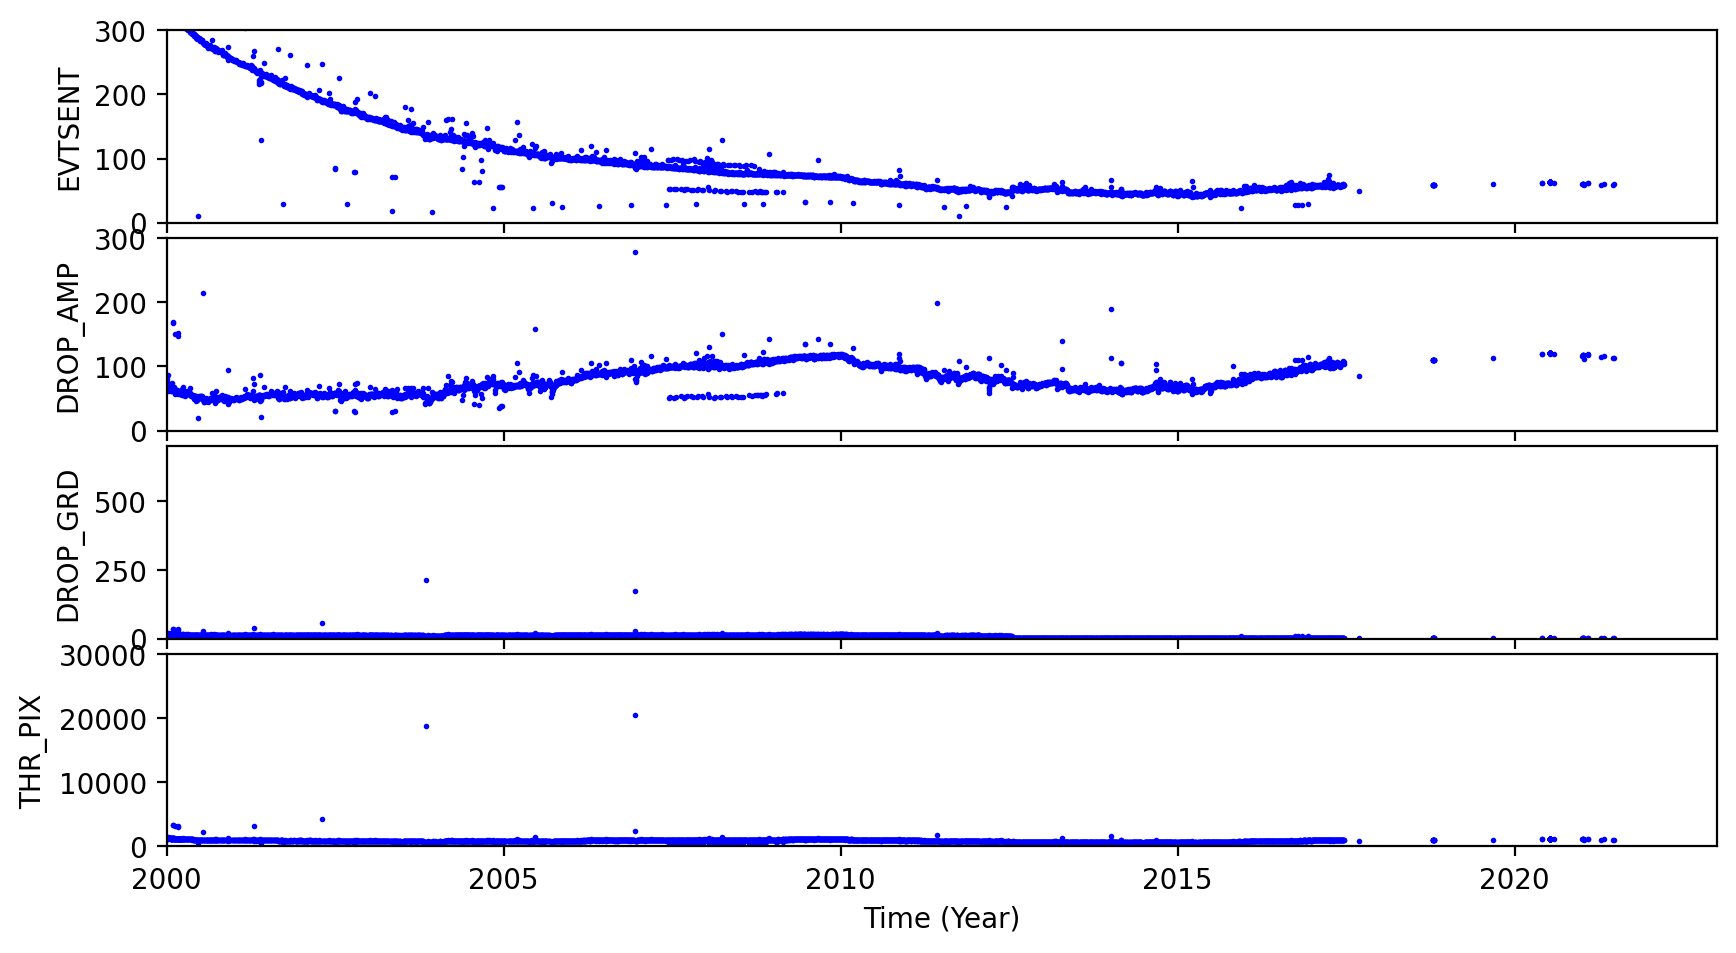
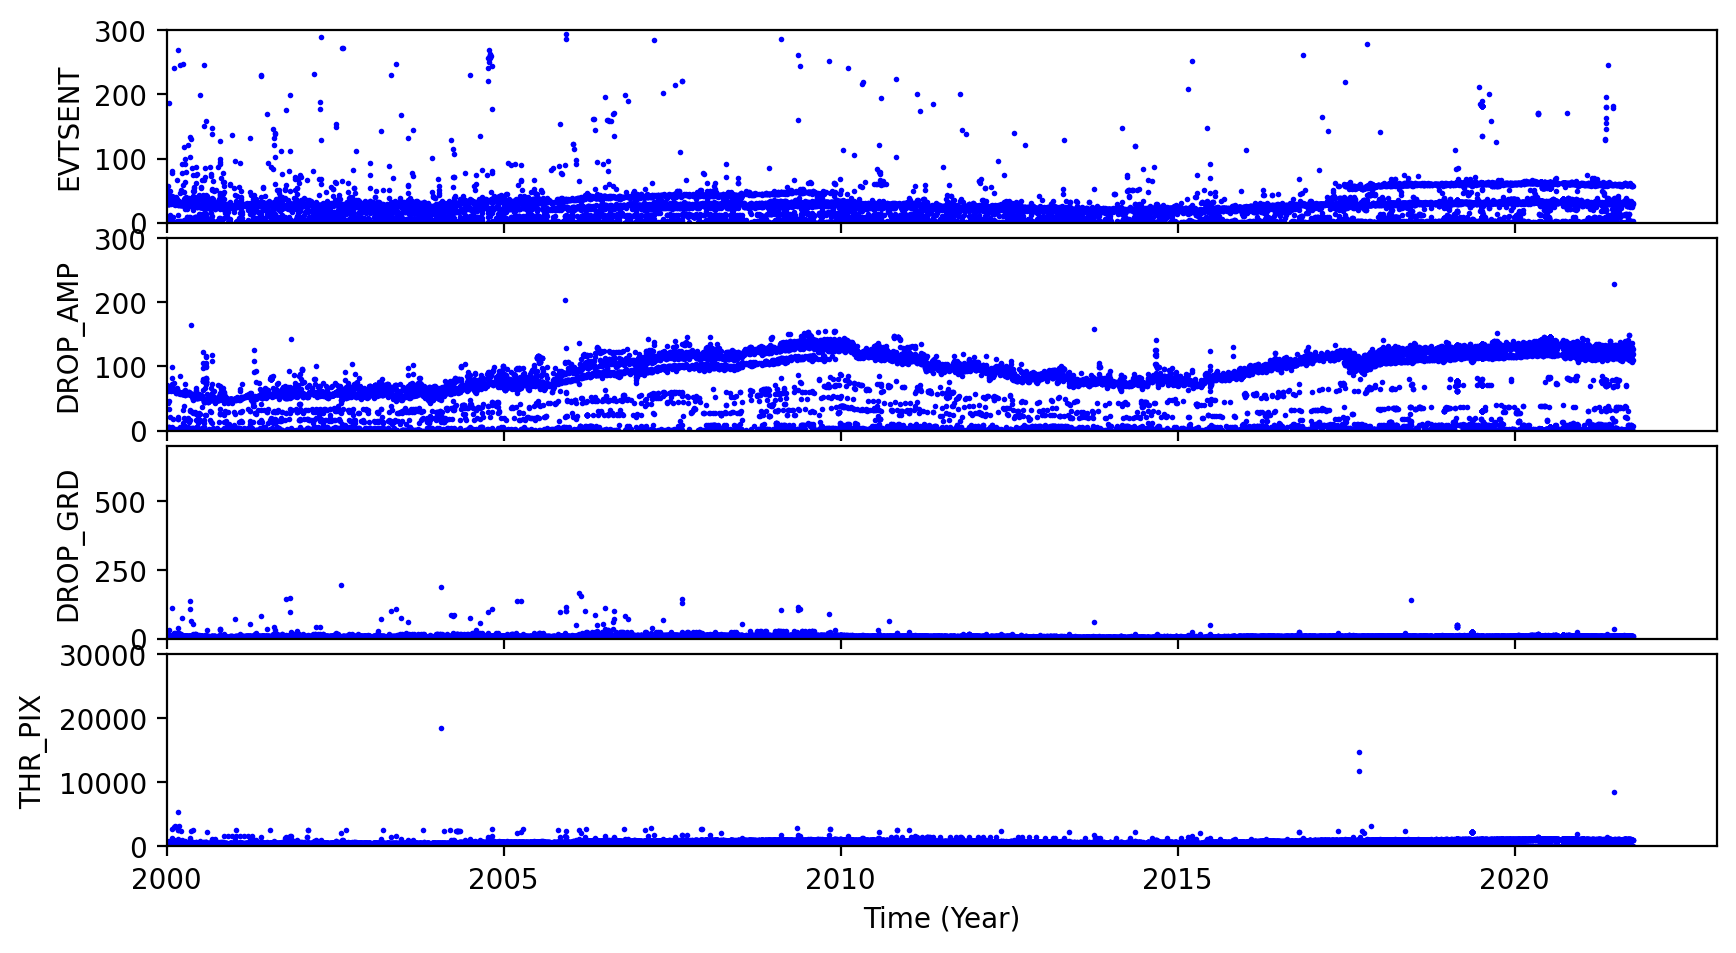
ACIS Rejected Events
The links below are plots of stat1 quantities, showing on-board rejected events. The average EVTSENT, DROP_AMP, DROP_POS, DROP_GRD, THR_PIX, and maximum BERR_SUM obtained from L1 acis*stat1.fits files are plotted for each observation. CTI observations are plotted separately from regular science observations.
Column definitions:
- EVTSENT - number of events sent in data record
- DROP_AMP - number of discarded events due to corrected amplitude
- DROP_POS - number of discarded events due to CCD position
- DROP_GRD - number of discarded events due to grade code
- THR_PIX - number of pixels above respective threshold level
- BERR_SUM - number of pixel bias errors so far in science run
Note the half-life decline of the CTI source is clearly evidenced in the steady janline of EVTSENT.
CCD3 Observations
| CTI | Science |
|
|
|---|
CCD7 Observations
| CTI | Science |
|
|
|---|
ACIS Gain Trends
We computed ACIS gain and offset from ACIS event1 files used in CTI computation, following the step described by C. Grant ACIS gain @ -120C page.
Instead computing gains and offsets from individual observations, we combined all data from each month and computed an monthly averaged gain and offset.
The following plots show CCD3 and CCD5 gains and offset trends.
| CCD 3 | |
)
|
)
|
| CCD 5 | |
)
|
)
|
[an error occurred while processing this directive]
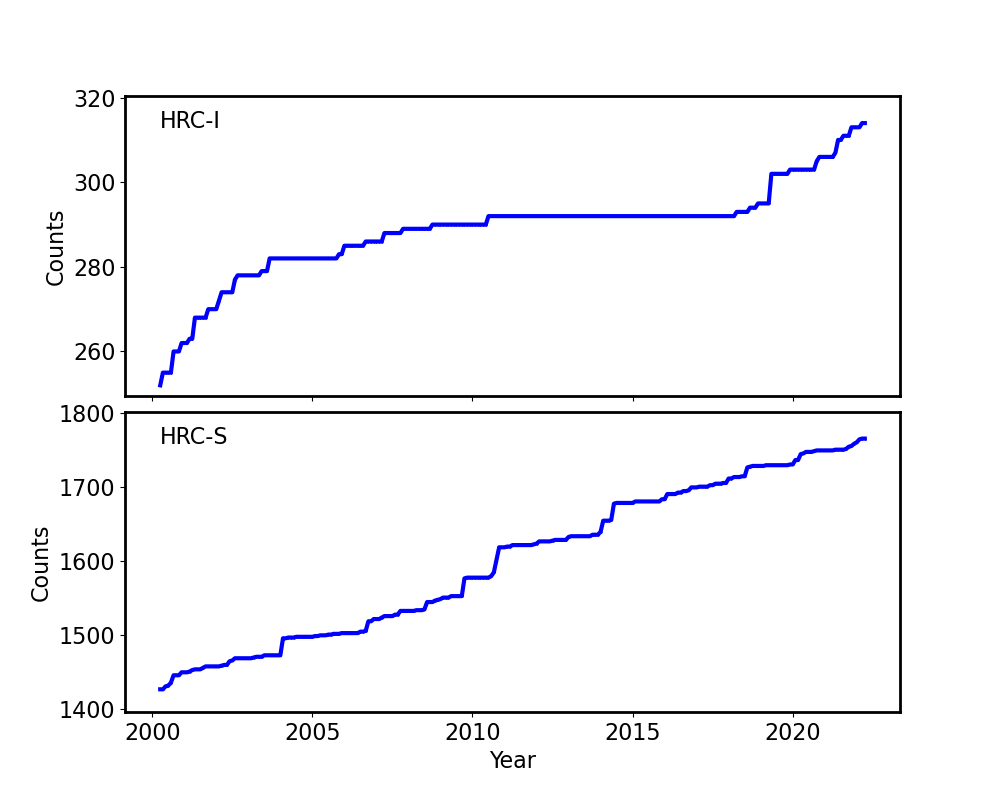
HRC
DOSE of Central 4K Pore-Pairs
Please refer to Maximum Dose Trends for more details.
)
|
|---|
IMAGE                NPIX      MEAN    STDDEV      MIN       MAX
HRCI_09_2021.fits  16777216	0.175 	0.427 	0.000 	11.000
)
IMAGE                       NPIX      MEAN    STDDEV      MIN       MAX
HRCI_08_1999_09_2021.fits  16777216	7.431 	6.505 	0.000 	314.000
)
|
|---|
IMAGE                NPIX      MEAN    STDDEV      MIN       MAX
HRCS_09_2021.fits  16777216	0.082 	0.304 	0.000 	18.000
)
IMAGE                       NPIX      MEAN    STDDEV      MIN       MAX
HRCS_08_1999_09_2021.fits  16777216	20.657 	36.600 	0.000 	1766.000
|
|
Max dose trend plots corrected for events that "pile-up"
in the center of the taps due to bad position information.
|
)
|
)
|
)
|
)
|
| Jun 2021 | Mar 2021 | Dec 2020 | Sep 2020 |
|---|
)
|
)
|
)
|
)
|
| Jun 2021 | Mar 2021 | Dec 2020 | Sep 2020 |
|---|
Gratings
Grating Trends/Focus
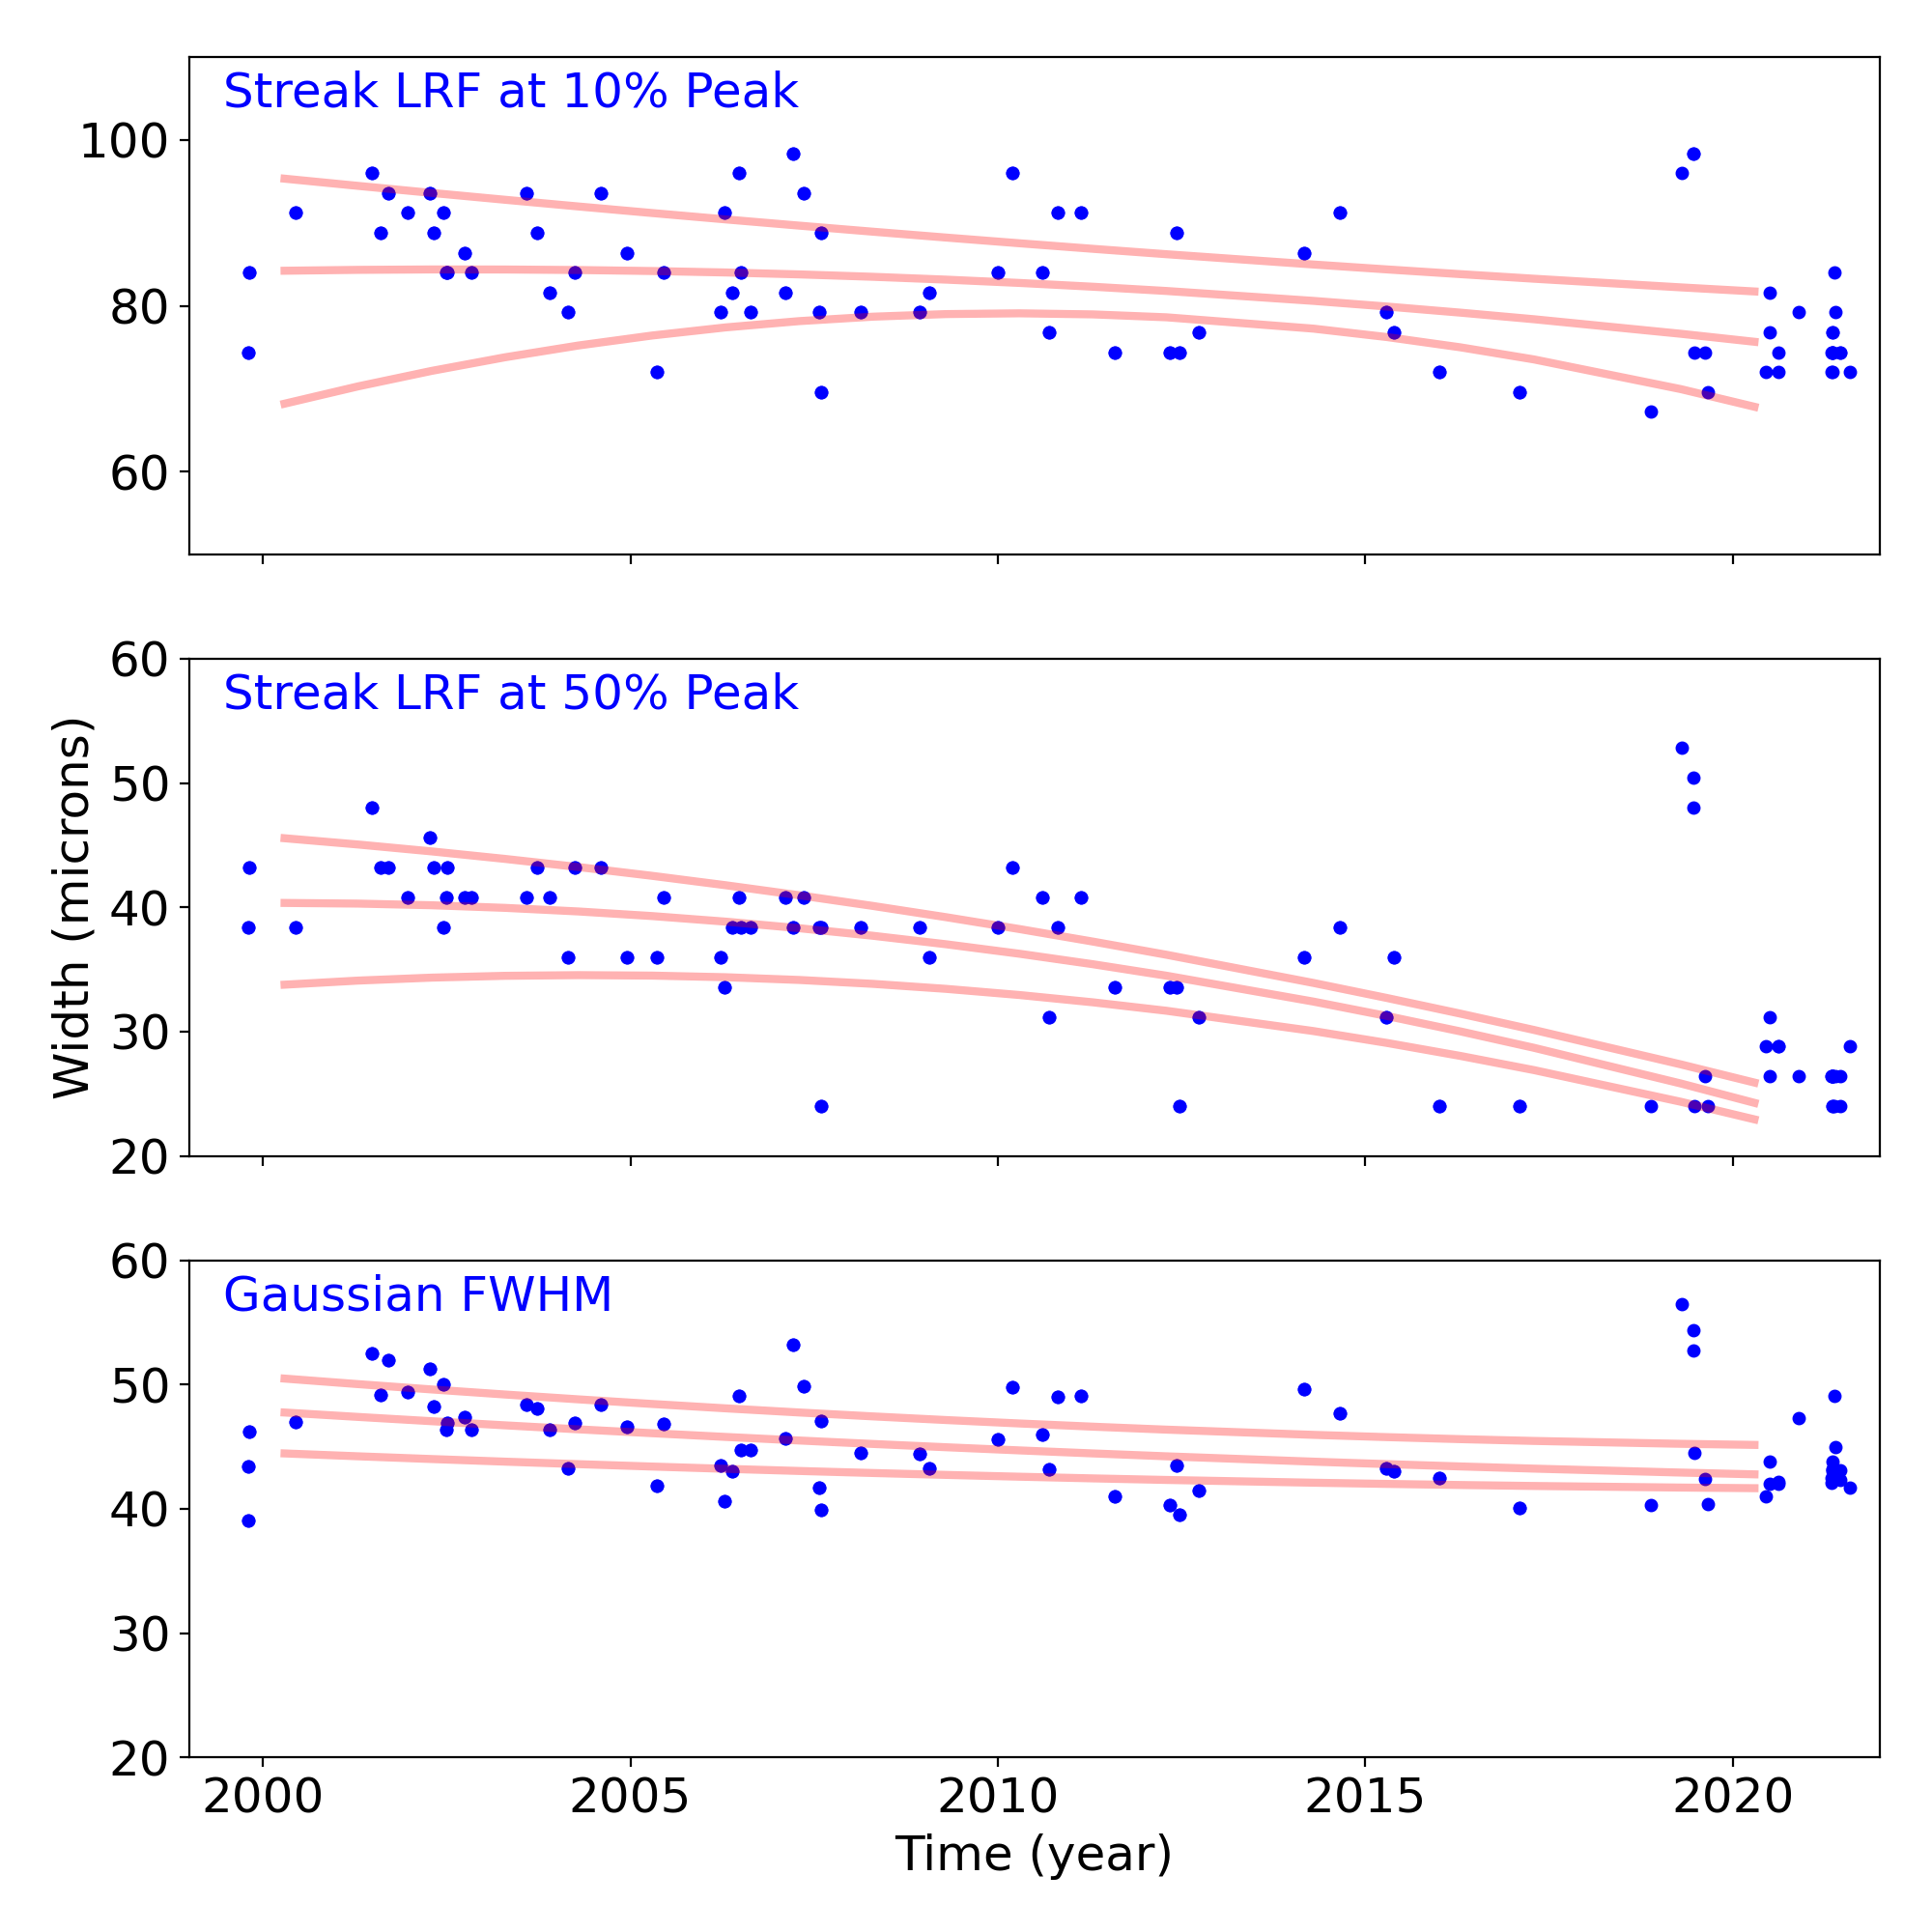
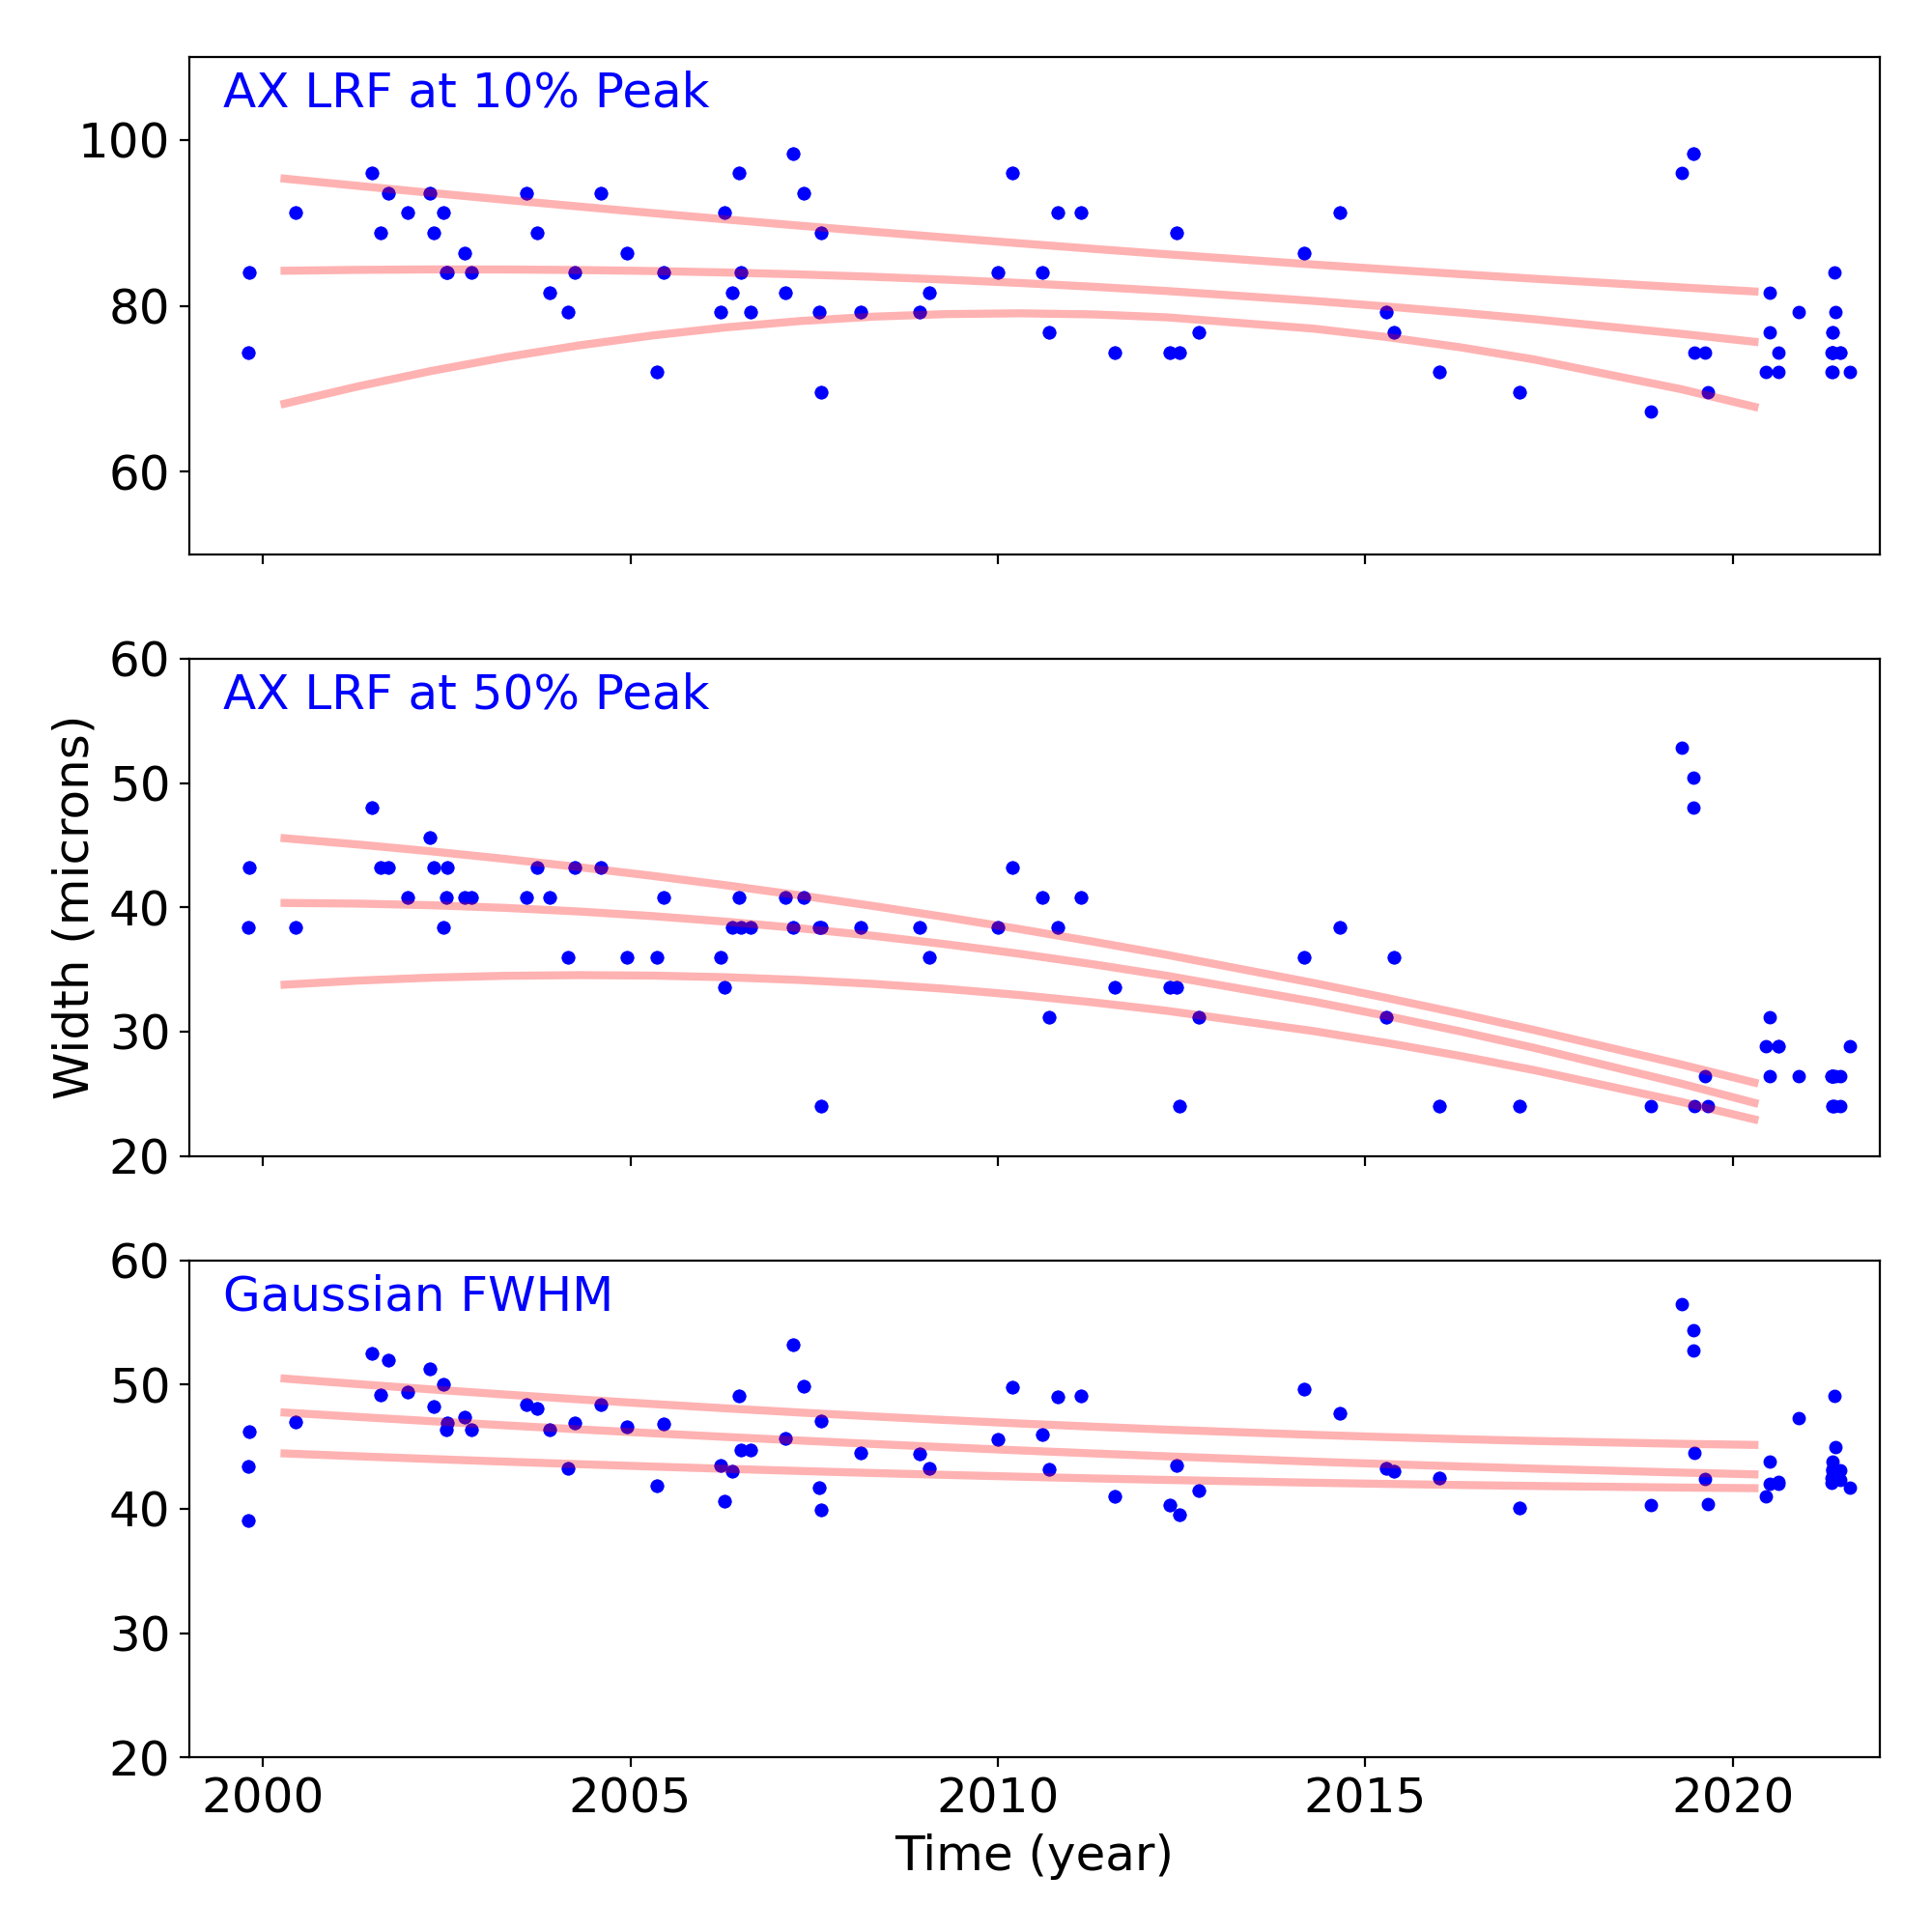
We plot the width of the zero order streak of ACIS/HETG observations and the width of the zero order image for HRC/LETG observations of point sources. No significant defocusing trend is seen at this time. See Gratings Trends pages.
PCAD
ACA Trending
| ACIS |
)
|
)
|
)
|
|
|---|---|---|---|---|
)
|
)
|
)
| ||
| HRCI |
)
|
)
|
)
|
)
|
| HRCI |
)
|
)
|
)
|
)
|
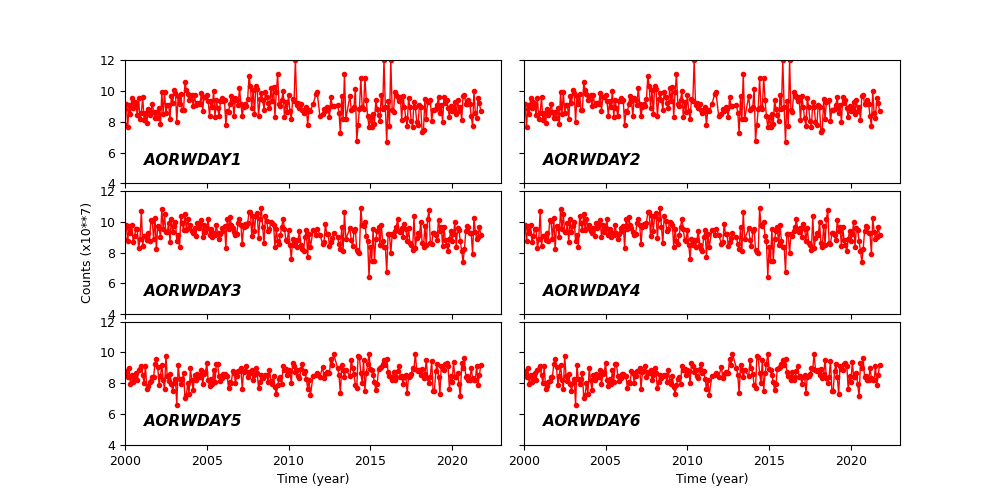
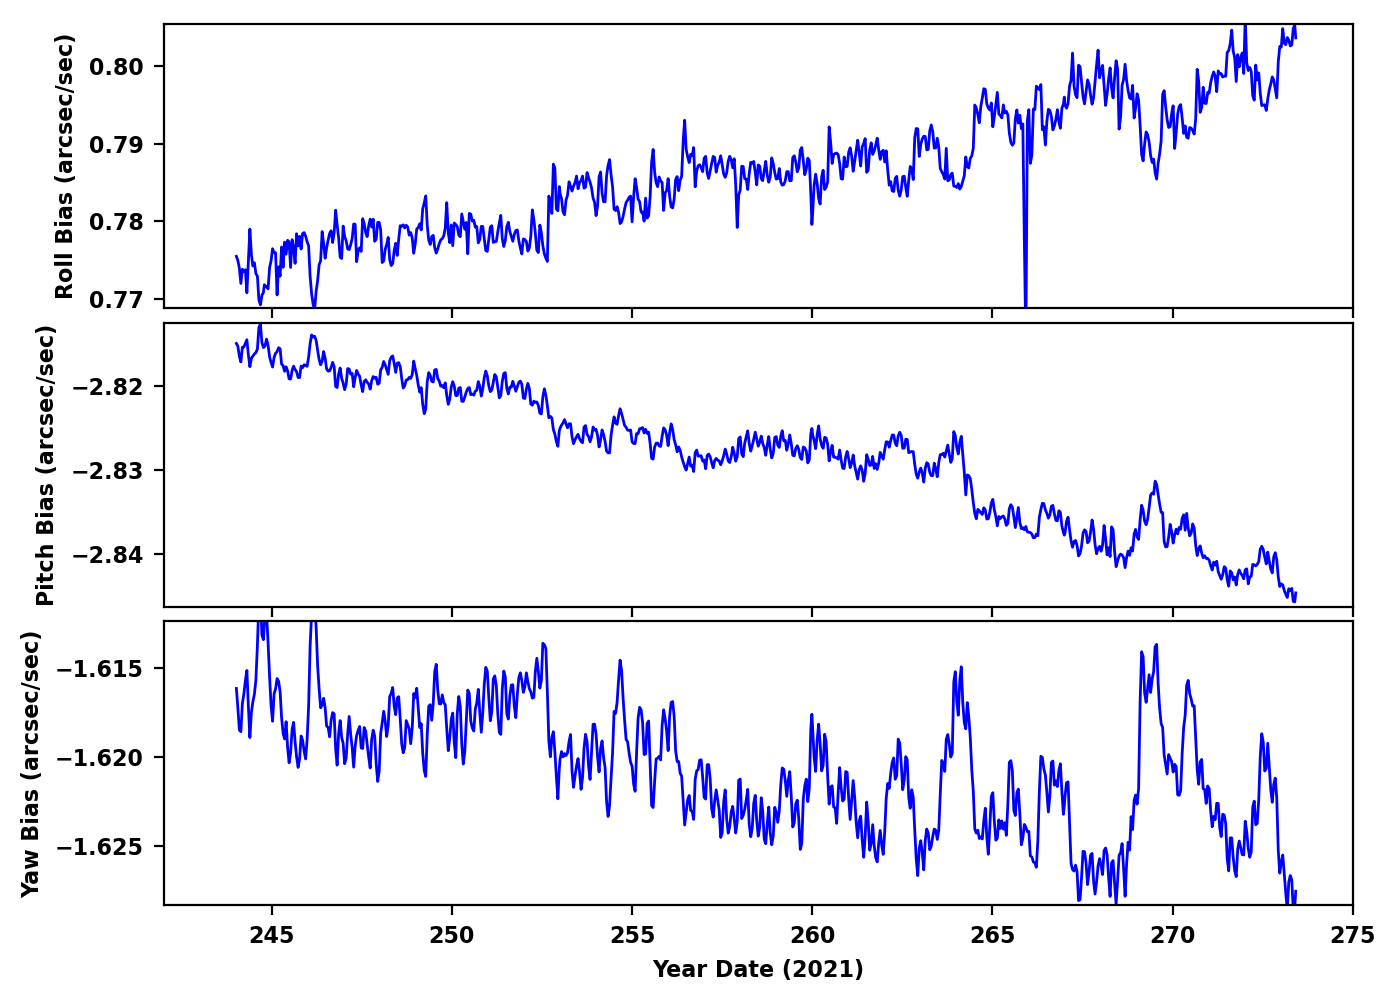
Gyro Bias Drift
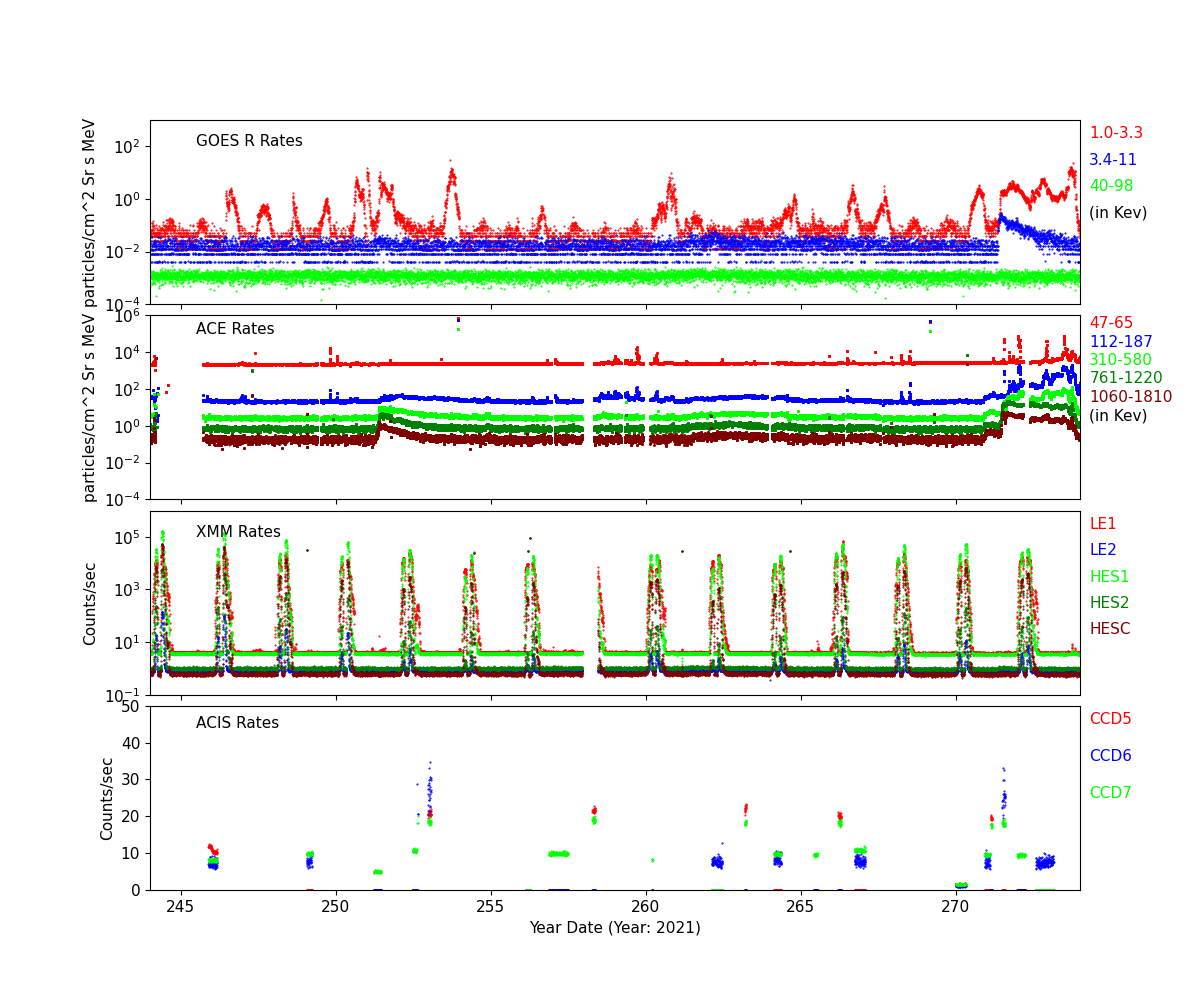
Radiation History
Radiation Count Rates of Sep 2021
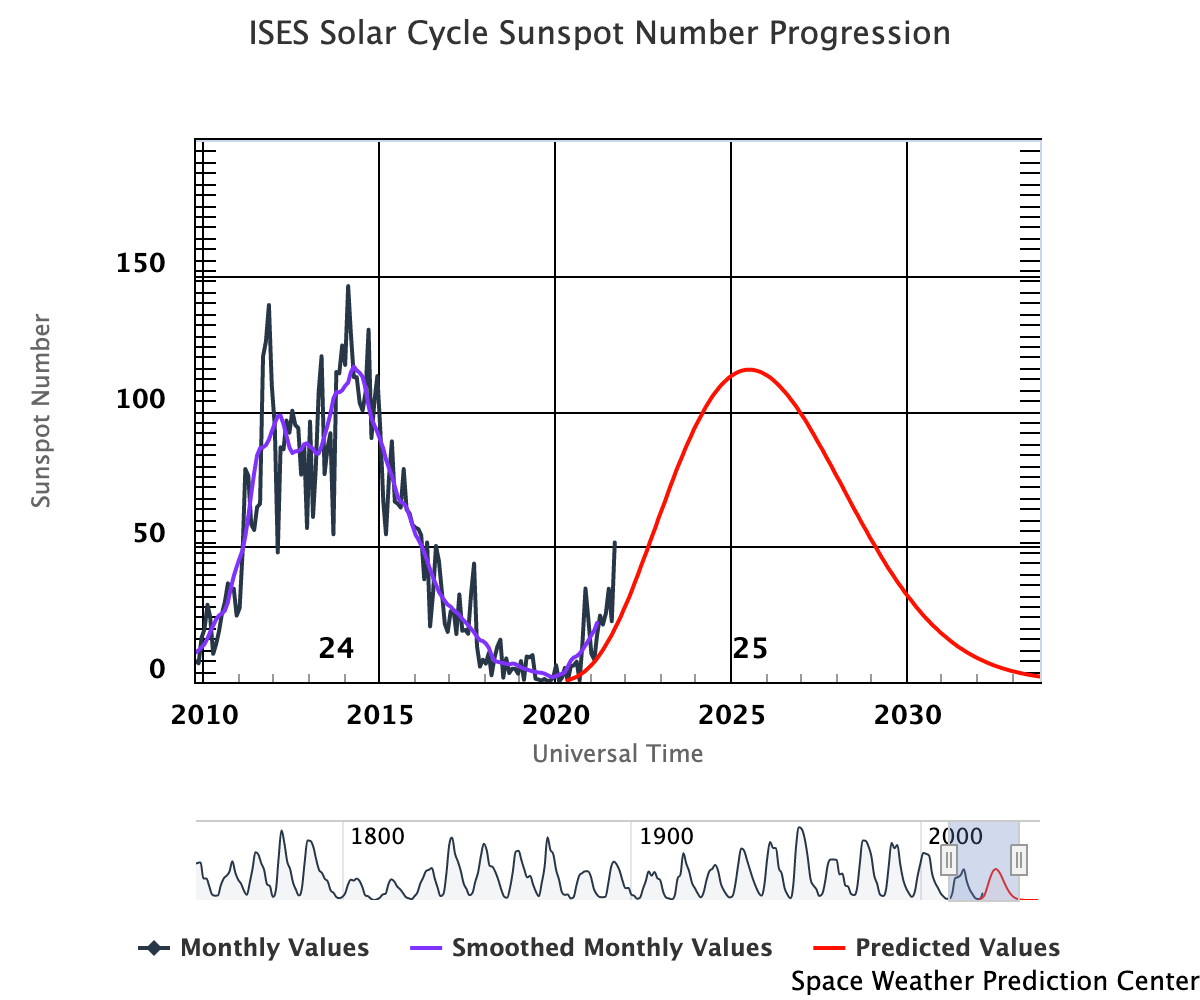
Sun Spot History (See:NOAA Page)
-->
Trending
Critical Trends
| ACIS Temperatures - Daily Maximums | |||||||
|---|---|---|---|---|---|---|---|
| MSID | MEAN | RMS | DELTA/YR | DELTA/YR/YR | UNITS | DESCRIPTION | |
| 1pdeaat | 0.009 | 0.003 | (3.04+/-0.07)e2 | -1.46 +/- 2.29 | K | PSMC DEA PS A TEMP | |
| HRMA Computed Averages - Daily Maximums | |||||||
|---|---|---|---|---|---|---|---|
| MSID | MEAN | RMS | DELTA/YR | DELTA/YR/YR | UNITS | DESCRIPTION | |
| obaavg | -8.168e-04 | 9.070e-04 | (2.97+/-0.02)e2 | -0.88 +/- 0.63 | TEMP | OBA/TFTE | |
| EPHIN Temperatures - Daily Maximums | |||||||
|---|---|---|---|---|---|---|---|
| MSID | MEAN | RMS | DELTA/YR | DELTA/YR/YR | UNITS | DESCRIPTION | |
| teio | -0.022 | 0.010 | (3.24+/-0.24)e2 | 5.34 +/- 4.95 | K | EPHIN ELECTRONICS HOUSING TEMP | |
| tephin | -0.008 | 0.003 | (3.33+/-0.08)e2 | 4.86 +/- 2.73 | K | EPHIN SENSOR HOUSING TEMP | |
| S/C Main Temperatures - Daily Maximums | |||||||
|---|---|---|---|---|---|---|---|
| MSID | MEAN | RMS | DELTA/YR | DELTA/YR/YR | UNITS | DESCRIPTION | |
| tcylfmzm | 0.009 | 0.006 | (3.14+/-0.15)e2 | 3.48 +/- 3.62 | K | CNT CYL TEMP:-Z SIDE UNDER LAE-1 | |
| tcylfmzp | 0.011 | 0.006 | (3.16+/-0.14)e2 | 4.96 +/- 3.25 | K | CNT CYL TEMP:-Z SIDE UNDER LAE-2 | |
| S/C Ancillary Temperatures - Daily Maximums | |||||||
|---|---|---|---|---|---|---|---|
| MSID | MEAN | RMS | DELTA/YR | DELTA/YR/YR | UNITS | DESCRIPTION | |
| tfssbkt1 | -0.005 | 0.012 | (3.44+/-0.28)e2 | 2.08 +/- 5.02 | K | FSS BRAC | |
| tfssbkt2 | -0.009 | 0.013 | (3.39+/-0.31)e2 | 1.25 +/- 5.43 | K | FSS BRAC | |
| tsctsf1 | 0.011 | 0.002 | (3.18+/-0.05)e2 | -0.49 +/- 1.56 | K | SC-TS FITTING -1 TEMP | |
| tsctsf6 | 0.002 | 0.002 | (3.18+/-0.05)e2 | 2.04 +/- 1.66 | K | SC-TS FITTING -6 TEMP | |
| MUPS - Daily Maximums | |||||||
|---|---|---|---|---|---|---|---|
| MSID | MEAN | RMS | DELTA/YR | DELTA/YR/YR | UNITS | DESCRIPTION | |
| pm1thv1t | -0.005 | 0.006 | (3.52+/-0.14)e2 | 0.80 +/- 2.96 | K | MUPS 1 THRUSTER VALVE 01 TEMP | |
| pm2thv1t | 0.013 | 0.019 | (3.23+/-0.45)e2 | -0.65 +/- 8.08 | K | MUPS 2 THRUSTER VALVE 01 TEMP | |
| pm1thv2t | -0.007 | 0.006 | (3.54+/-0.14)e2 | 0.28 +/- 2.94 | K | MUPS 1 THRUSTER VALVE 02 TEMP | |
| pm2thv2t | -0.022 | 0.022 | (3.17+/-0.50)e2 | 3.28 +/- 9.12 | K | MUPS 2 THRUSTER VALVE 02 TEMP | |
| pline02t | -0.010 | 0.005 | (3.33+/-0.12)e2 | 3.08 +/- 2.85 | K | PROP LINE TEMP 02 | |
| pline03t | -0.006 | 0.006 | (3.29+/-0.13)e2 | 4.05 +/- 2.76 | K | PROP LINE TEMP 03 | |
| pline04t | -0.005 | 0.005 | (3.16+/-0.11)e2 | 1.42 +/- 2.83 | K | PROP LINE TEMP 04 | |
Quarterly Trends
- PCAD FTS Temperature and Gradient
| Previous Quarter | |||||||
| MSID | MEAN | RMS | DELTA/YR | DELTA/YR/YR | UNITS | DESCRIPTION | |
| ohrthr27 | -3.115e-05 | 5.590e-06 | (2.97+/-0.00)e2 | 0.00 +/- 0.00 | K | RT 20 : PERISCOPE | |
|---|---|---|---|---|---|---|---|
| ohrthr42 | -4.986e-04 | 1.963e-04 | (2.96+/-0.00)e2 | -0.13 +/- 0.12 | K | RT 133: PERISCOPE | |
| ohrthr43 | -5.792e-04 | 2.229e-04 | (2.96+/-0.01)e2 | -0.18 +/- 0.15 | K | RT 134: PERISCOPE | |
| oobagrd3 | 7.597e-05 | 4.542e-05 | -0.33 +/- 0.11 | 0.03 +/- 0.04 | K | RT 505 TO RT 504: PERISCOPE GRADIENT MONITOR | |
| oobagrd6 | -8.101e-06 | 4.916e-06 | 0.10 +/- 0.01 | -0.00 +/- 0.00 | K | RT 507 TO RT 506: PERISCOPE GRADIENT MONITOR | |
- SIM Temperature
| Previous Quarter | |||||||
| MSID | MEAN | RMS | DELTA/YR | DELTA/YR/YR | UNITS | DESCRIPTION | |
| 3btu_bpt | 0.027 | 0.003 | (2.68+/-0.06)e2 | 0.24 +/- 2.11 | K | BTU BASEPLATE (+X)), ABORT HTR TSC2 | |
|---|---|---|---|---|---|---|---|
| 3tsmxcet | 0.056 | 0.018 | (2.40+/-0.42)e2 | -4.50 +/- 6.29 | K | -X TURTLE SHELL NR HRC CEA | |
| 3tsmxspt | 0.147 | 0.084 | (4.43+/-1.97)e2 | -32.80 +/- 31.41 | K | -X TURTLE SHELL NR ACIS SS | |
- SIIM Electronics
| Previous Quarter | |||||||
| MSID | MEAN | RMS | DELTA/YR | DELTA/YR/YR | UNITS | DESCRIPTION | |
| agrndadc | -3.353e-07 | 4.287e-08 | -(1.55+/-1.26)e-4 | (7.99+/-3.10)e-5 | V | Analog fround A/D convert reading | |
|---|---|---|---|---|---|---|---|
| fatabadc | -4.418e-05 | 2.568e-05 | 4.99 +/- 0.07 | -(1.62+/-494.50)e-5 | V | FA Tab Position Sensor A/D Converter | |
| n15vadc | -8.440e-07 | 1.191e-07 | -15.02 +/- 0.00 | (3.09+/-10.36)e-5 | V | -15V Power Supply A/D Converter Reading | |
| p15vadc | -1.305e-06 | 1.625e-07 | 14.96 +/- 0.00 | -(7.13+/-16.41)e-5 | V | +15V Power Supply A/D Converter Reading | |
| p5vadc | -9.523e-05 | 8.298e-06 | 4.99 +/- 0.02 | 0.01 +/- 0.01 | V | +5V Power Supply A/D Converter Reading | |
| tsctabadc | 3.137e-05 | 5.868e-05 | 4.97 +/- 0.17 | -0.04 +/- 0.02 | V | TSC Tab Position Sensor A/D converter | |
Spacecraft Motions
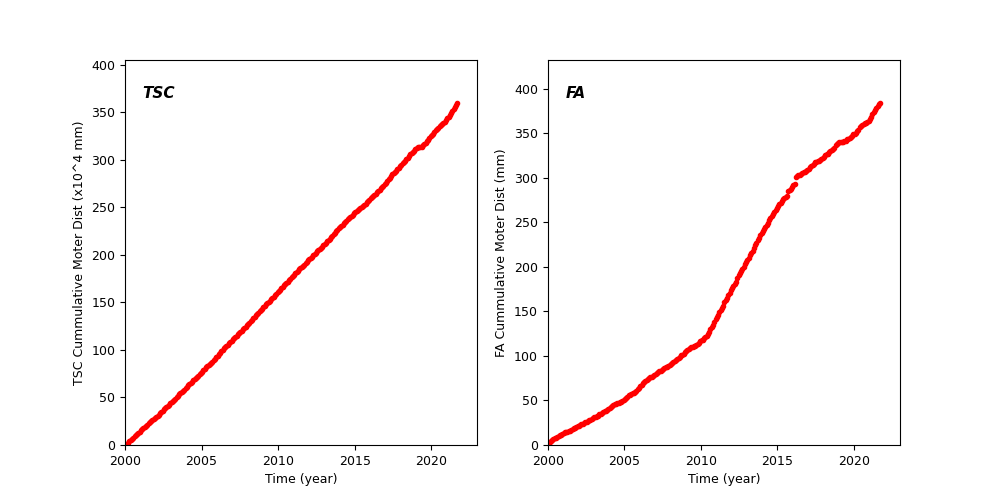
TSC and FA Cummulative Moter Distance
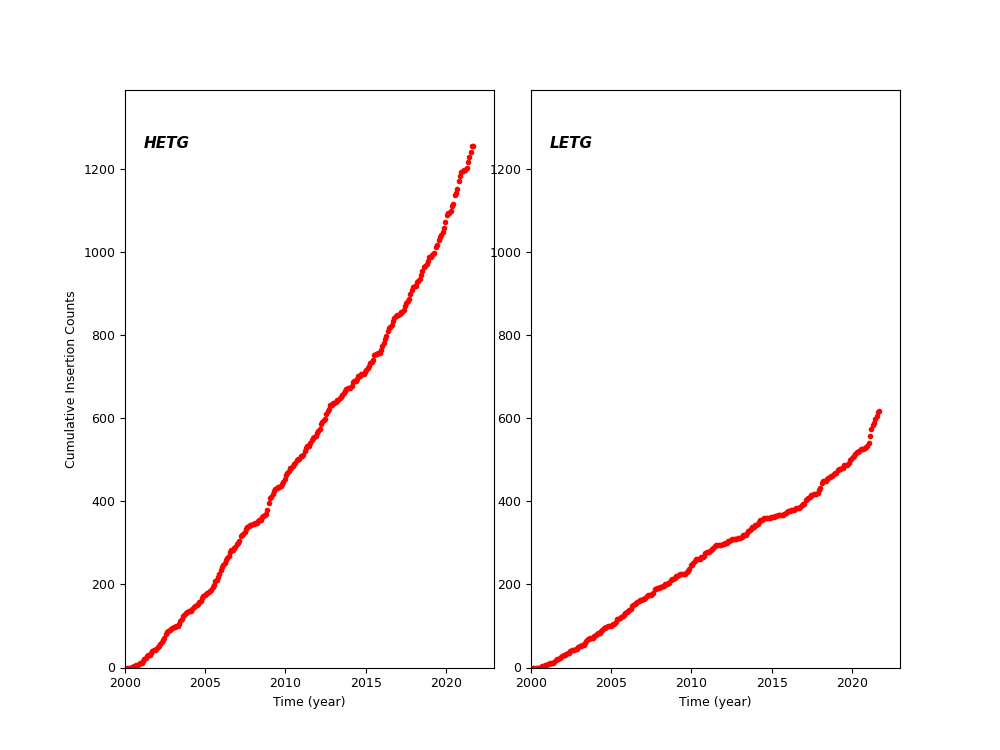
HETG and LETG Cummulative Insertion Counts
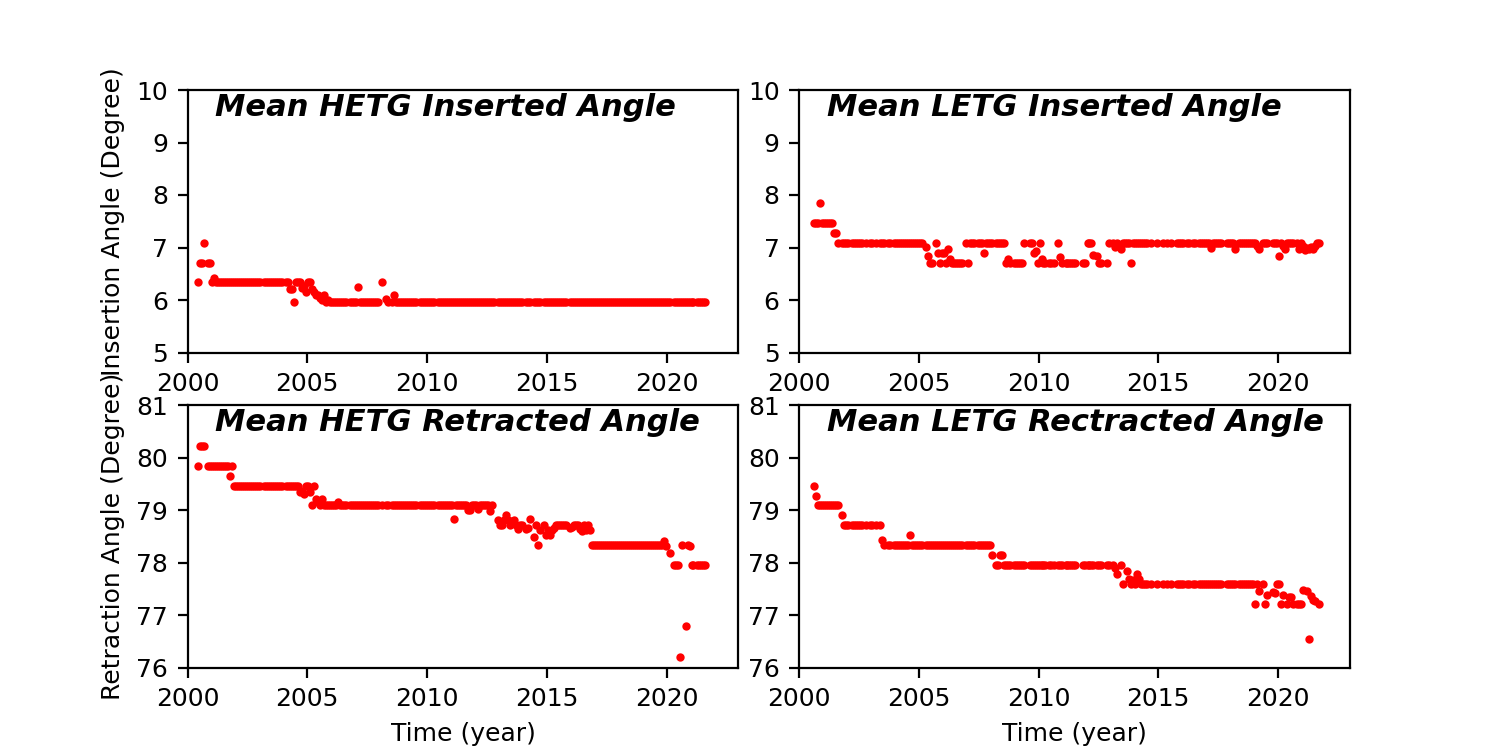
HETG/LETG Insertion/Retraction Angle
Reaction Wheel Rotations