ACIS
ACIS DOSE Registered-Photon-Map
The steps we took to compute the dose map are;
- Level 1 Event files for a specified month are obtained from archive.
- Image data including I2, I3, S2, S3 CCDs are extracted from all event files.
- All the extracted image data were merged to create a month long exposure map for the month.
- The exposure map is opened with ds9, and check a distribution of count rates against energy. From this, estimate the upper threshold value. Any events beyond this upper threshold are assumed erroneous events such as bad pixels.
- Using this upper threshold, the data is filtered, and create a cleaned exposure map for the month.
- The exposure map from each month from the Sep 1999 is added up to create a cumulative exposure map for each month.
- Using fimgstatistic, we compute count rate statistics for each CCDs.
- For observations with high data drop rates (e.g., Crab nebula, Cas A), we corrected the observations by adding events.
Please check more detail plots at Telemetered Photon Dose Trend page.
)
)
)
Statistics:
# IMAGE     NPIX     MEAN        RMS        MIN     MAX
ACIS_dec21 6004901       7.098         9.033           0.0     2529


I2 node 0  262654	7.569930	3.441753	0.0	 74.0
I2 node 1  262654	8.080646	4.402403	0.0	1225.0
I2 node 2  262654	7.902206	3.441058	0.0	 90.0
I2 node 3  262654	7.929969	7.160745	0.0	2155.0

I3 node 0  262654	8.307679	3.760946	0.0	 91.0
I3 node 1  262654	8.087252	3.506758	0.0	134.0
I3 node 2  262654	7.913700	3.396381	0.0	 73.0
I3 node 3  262654	8.094732	3.554803	0.0	155.0

S2 node 0  262654	8.315445	6.085623	0.0	2529.0
S2 node 1  262654	8.428529	3.915966	0.0	211.0
S2 node 2  262654	8.491422	5.645328	0.0	2100.0
S2 node 3  262654	8.473557	3.838916	0.0	507.0

S3 node 0  262654	12.455875	4.912584	0.0	 83.0
S3 node 1  262654	14.524572	5.365246	0.0	215.0
S3 node 2  262654	14.246745	4.568800	1.0	 75.0
S3 node 3  262654	12.699992	4.194607	0.0	 55.0
)
)
)
Statistics:
 IMAGE     NPIX      MEAN        RMS           MIN      MAX
ACIS_total   6004901       2538.622         3262.199           0.0   140294


I2 node 0  262654	2195.517586	441.237548	471.0	13199.0
I2 node 1  262654	2309.223604	626.767055	484.0	126101.0
I2 node 2  262654	2337.194361	495.660201	503.0	13734.0
I2 node 3  262654	2342.795546	605.541260	476.0	28828.0

I3 node 0  262654	2518.241594	619.397581	465.0	13597.0
I3 node 1  262654	2595.234971	1728.417770	501.0	55734.0
I3 node 2  262654	2308.832627	432.837509	472.0	13728.0
I3 node 3  262654	2300.720275	465.004646	439.0	34531.0

S2 node 0  262654	2959.350950	479.691807	1607.0	22306.0
S2 node 1  262654	3136.894316	711.947759	1794.0	16992.0
S2 node 2  262654	3470.288136	715.843665	2213.0	29475.0
S2 node 3  262654	3432.029927	569.269205	1947.0	70294.0

S3 node 0  262654	5269.884360	2894.400048	2304.0	53553.0
S3 node 1  262654	6466.290324	2352.077013	0.0	38852.0
S3 node 2  262654	5204.972599	1338.103317	2363.0	27143.0
S3 node 3  262654	4070.797397	751.792519	2458.0	26383.0
)
|
)
|
)
|
)
|
| Sep 2021 | Jun 2021 | Mar 2021 | Dec 2020 |
|---|
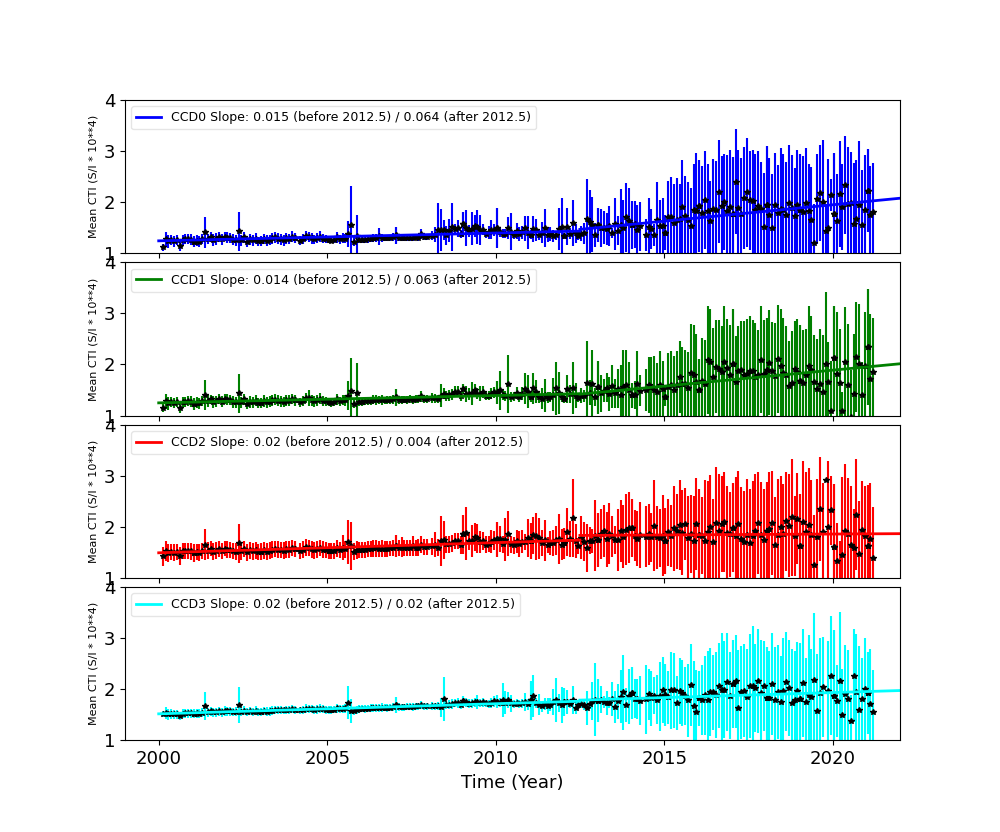
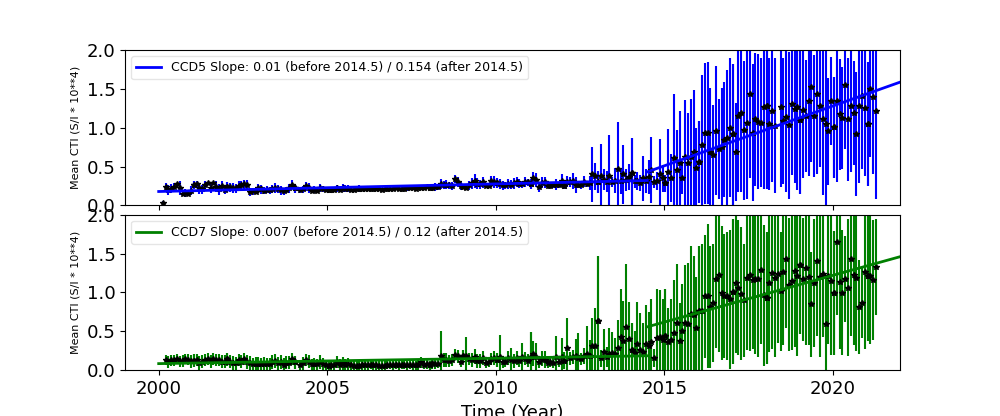
The Mean Detrended CTI
We report CTIs with a refined data definition. CTIs were computed for the temperature dependency corrected data. Please see CTI page for detailed explanation. CTI's are computed for Mn K alpha, and defined as slope/intercept x10^4 of row # vs ADU. Data file: here
Imaging CCDs
Spectral CCDs
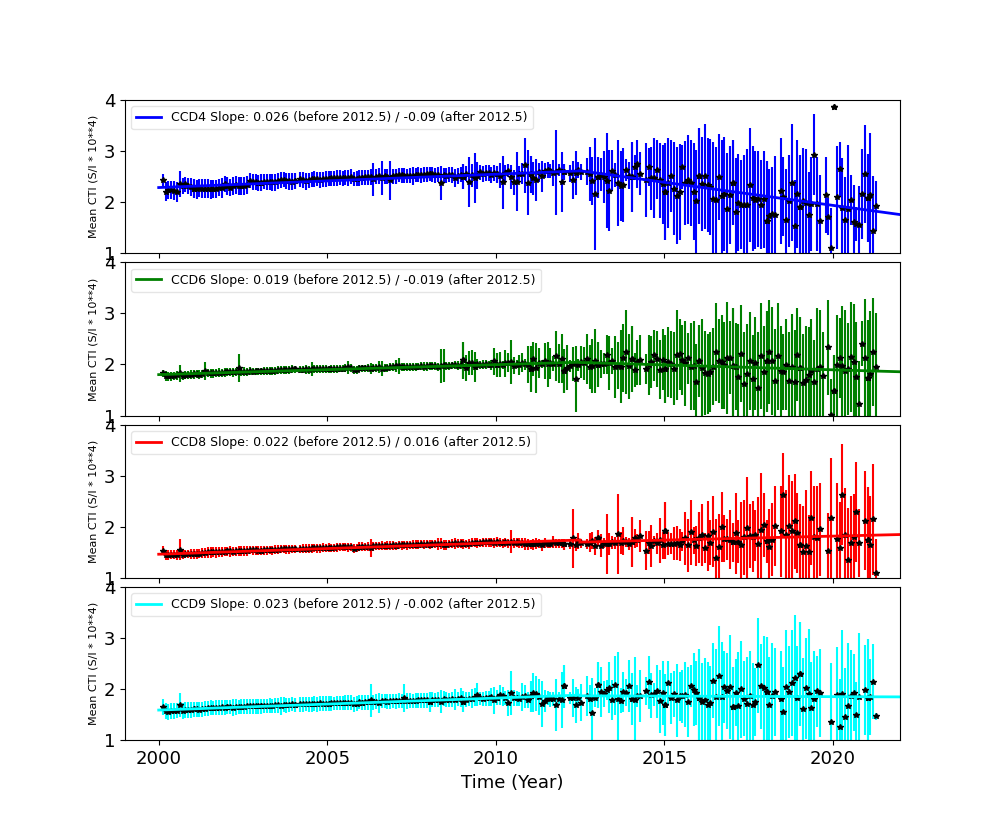
Backside CCDs
Focal Plane Temperature
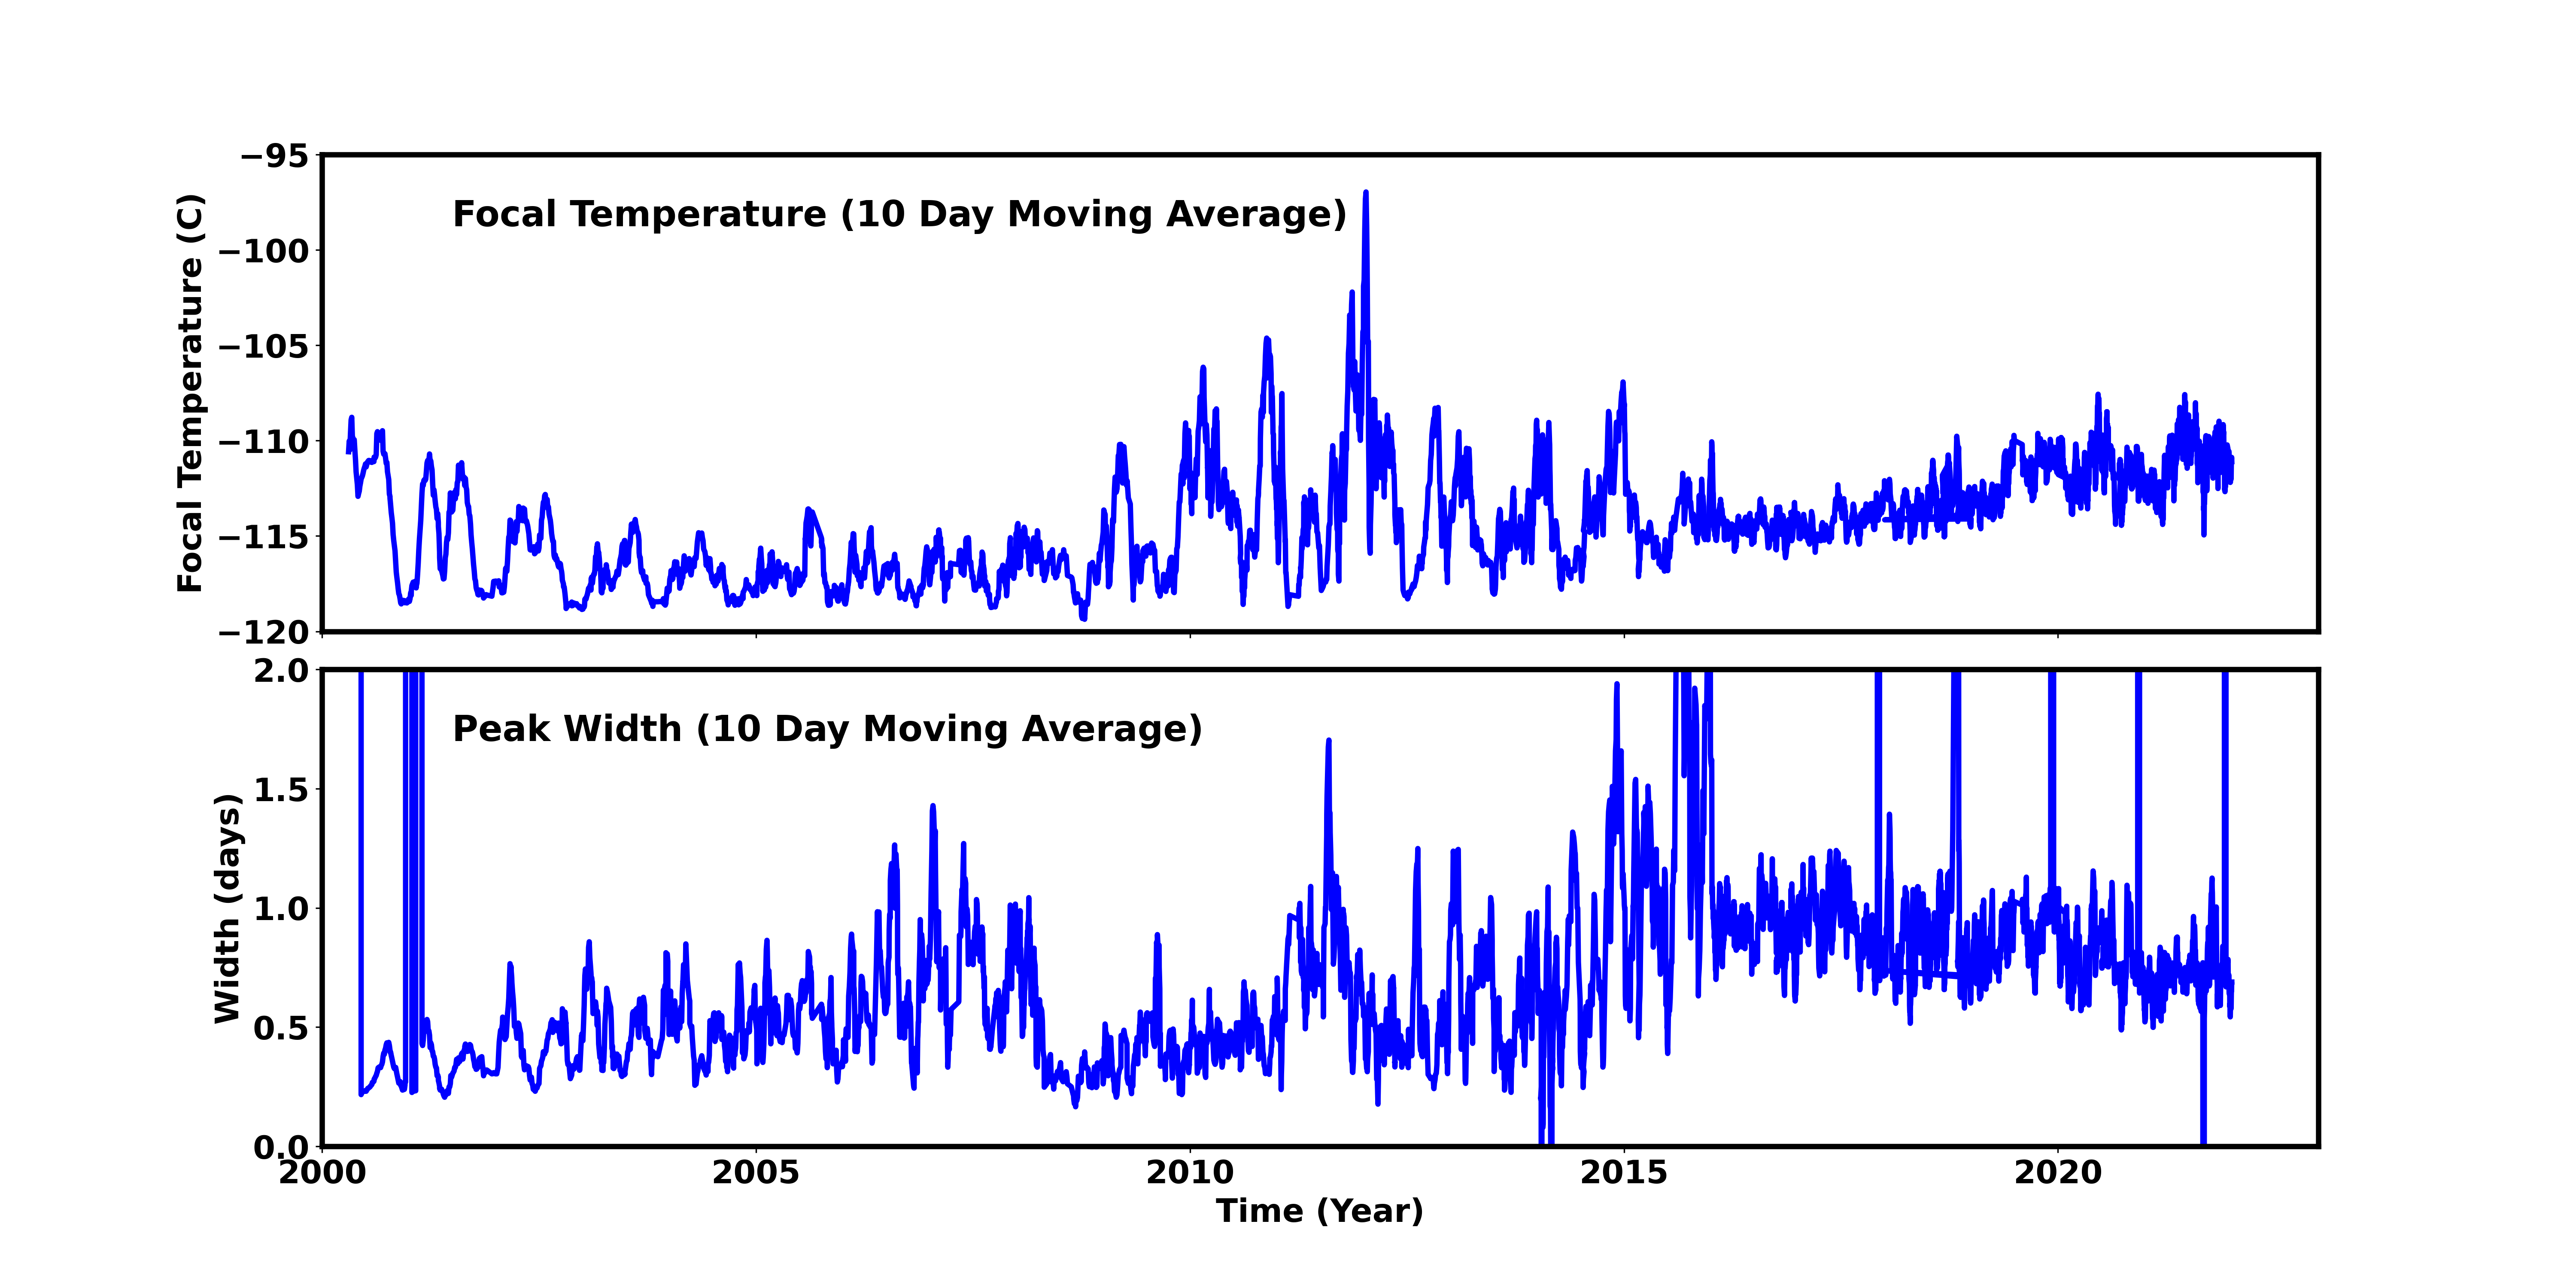
Dec 2021 Focal Temperature
| The Mean (max) FPT: | |
|---|---|
| -111.25 | +/- 3.1 C |
| Mean Width: | |
| 8.08 | +/- 49.18 days |
Averaged Focal Plane Temperature
We are using 10 period moving averages to show trends of peak temperatures and peak widths. Note, the gaps in the width plot are due to missing/corrupted data.
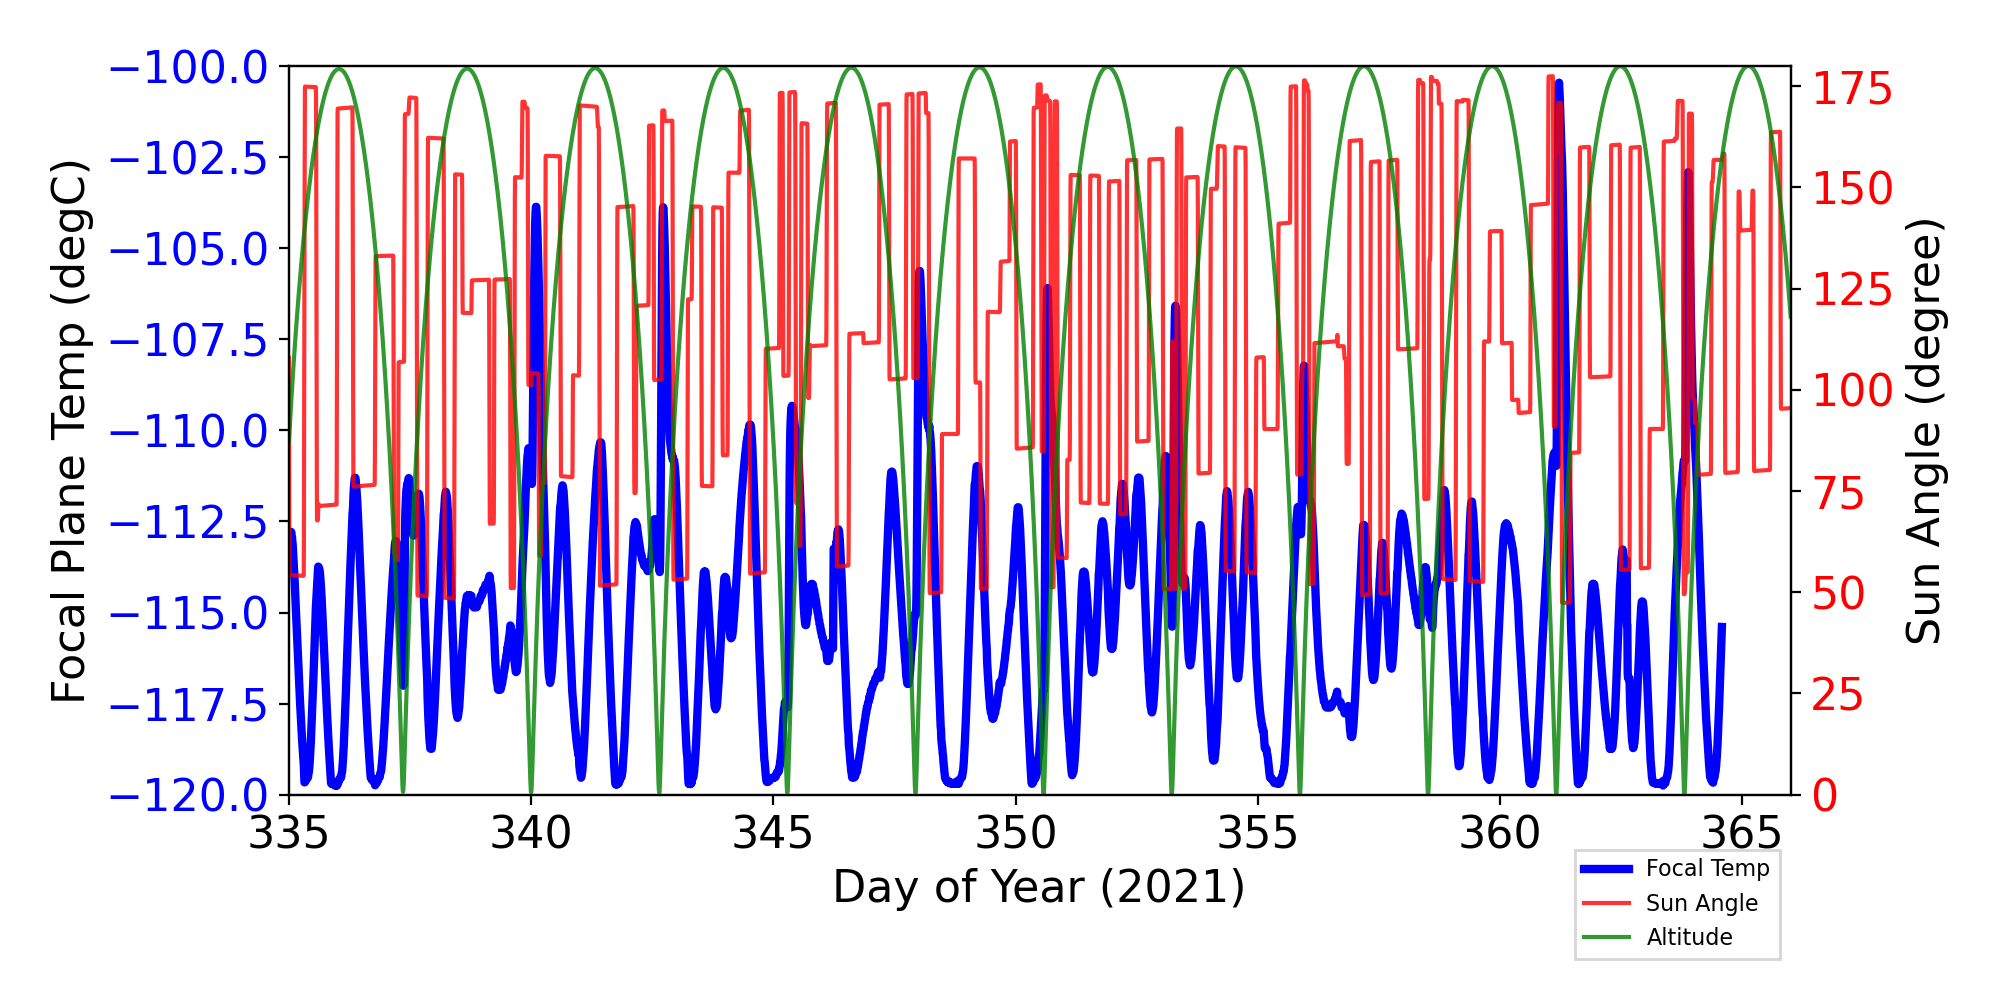
Focal Plane Temperature, Sun Angle and Altitude
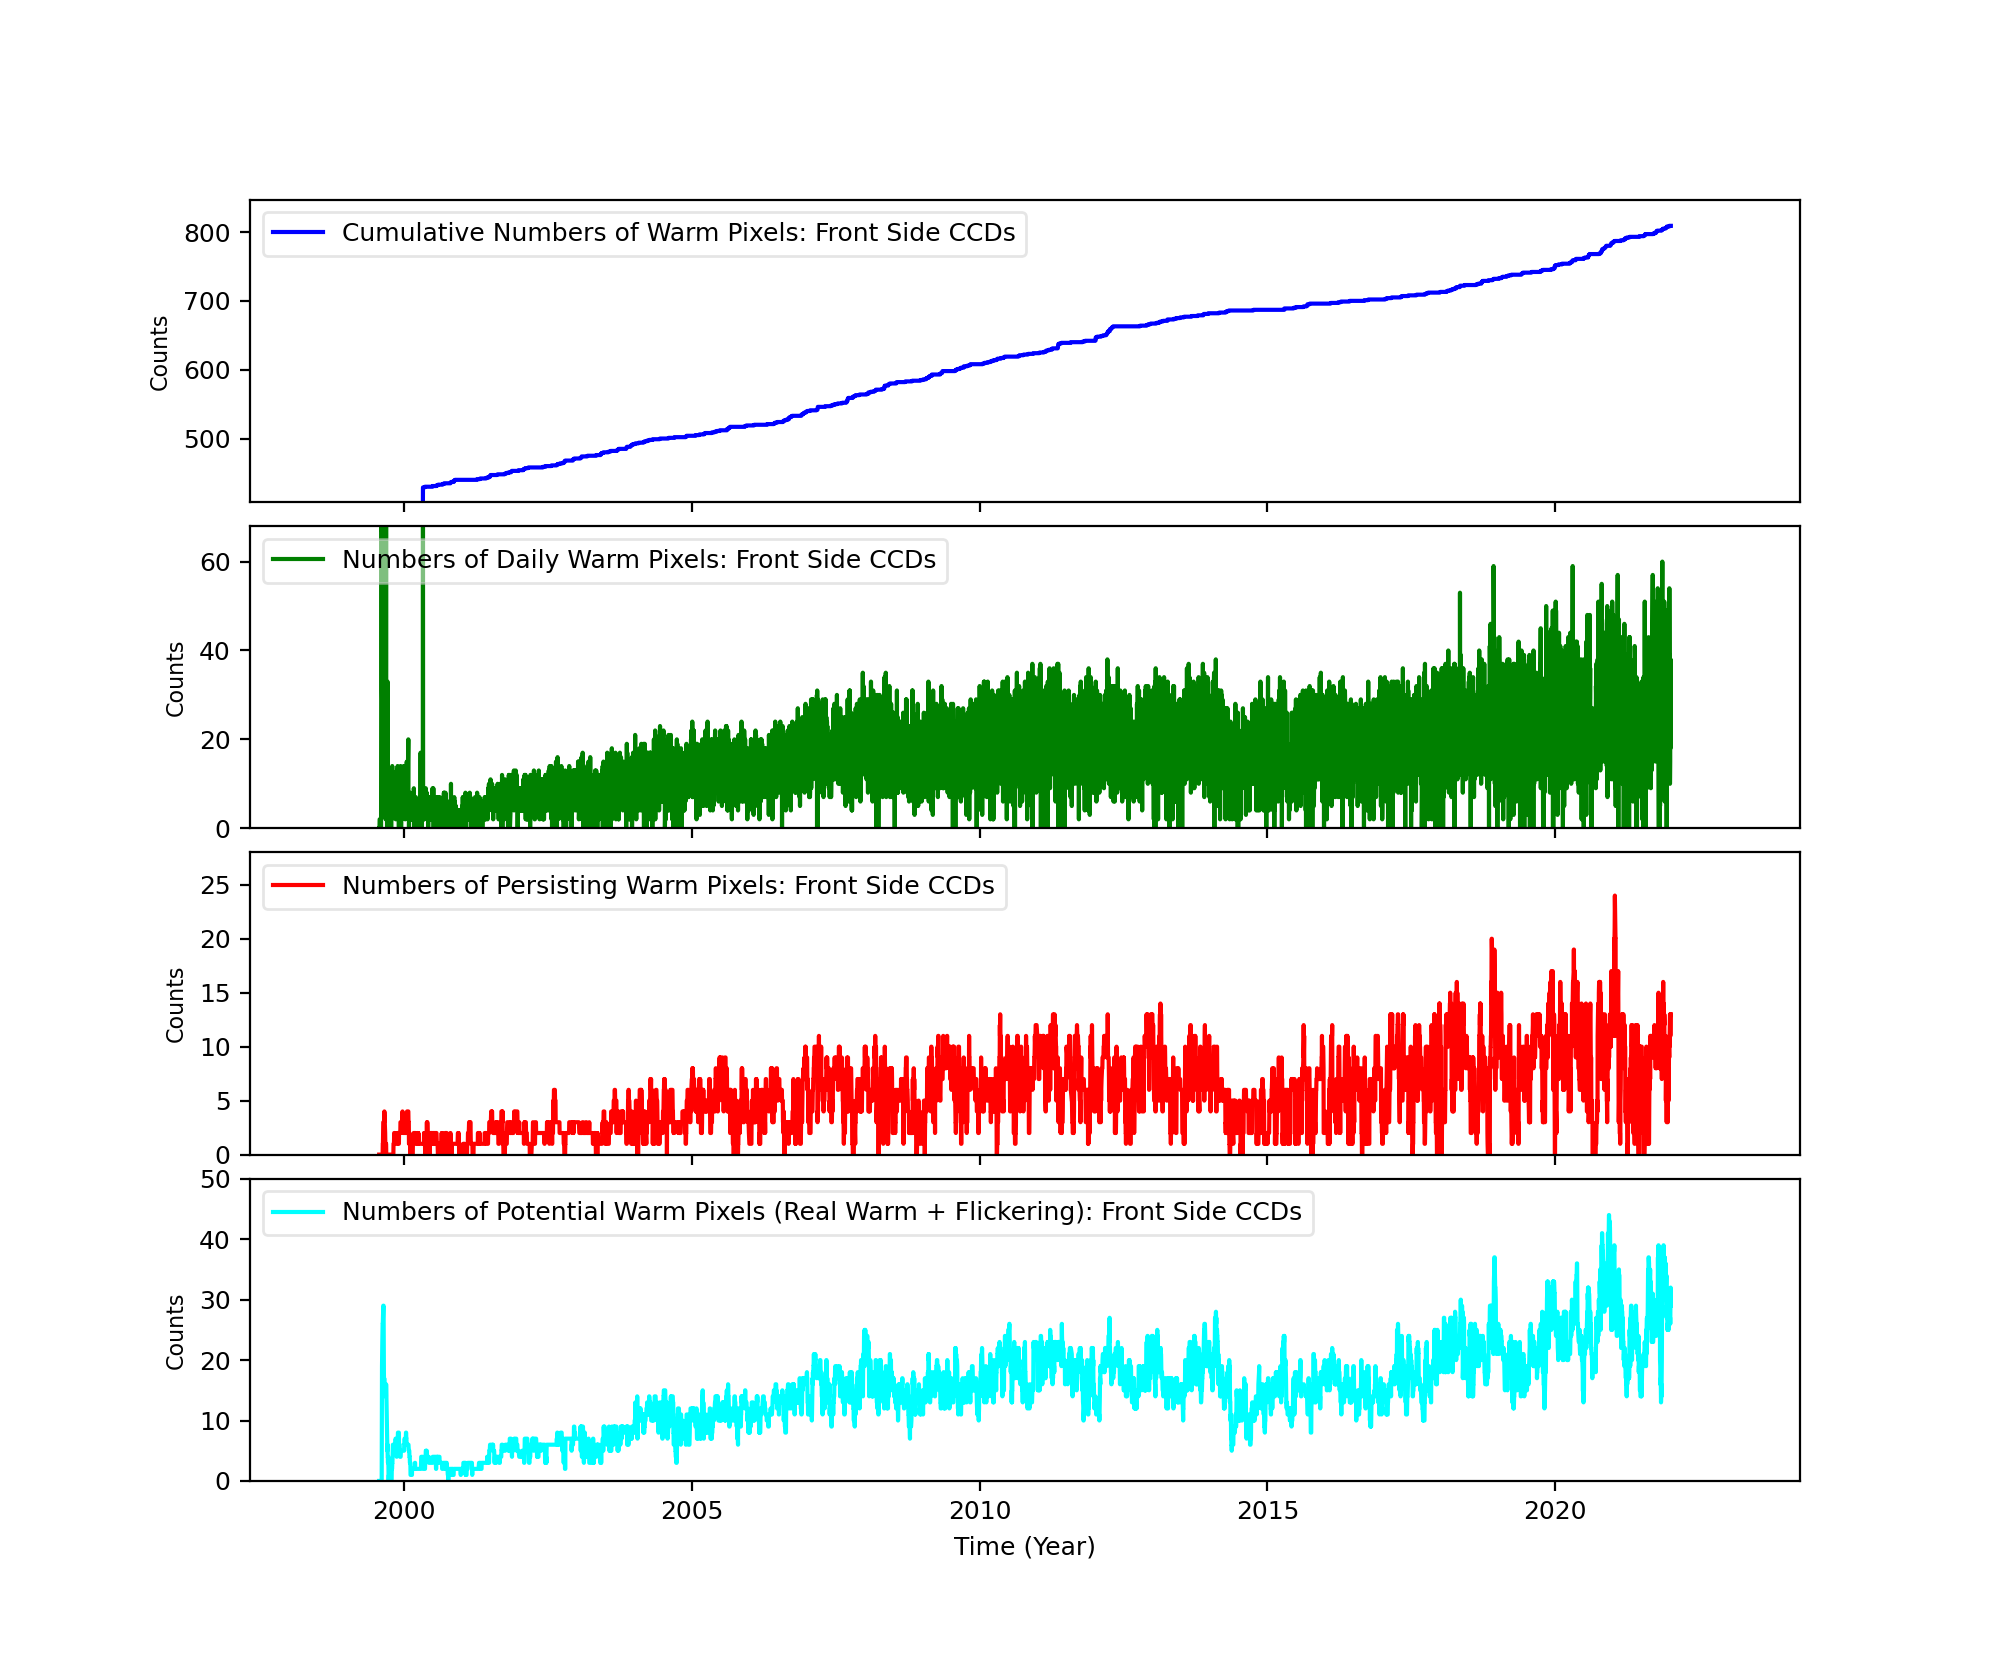
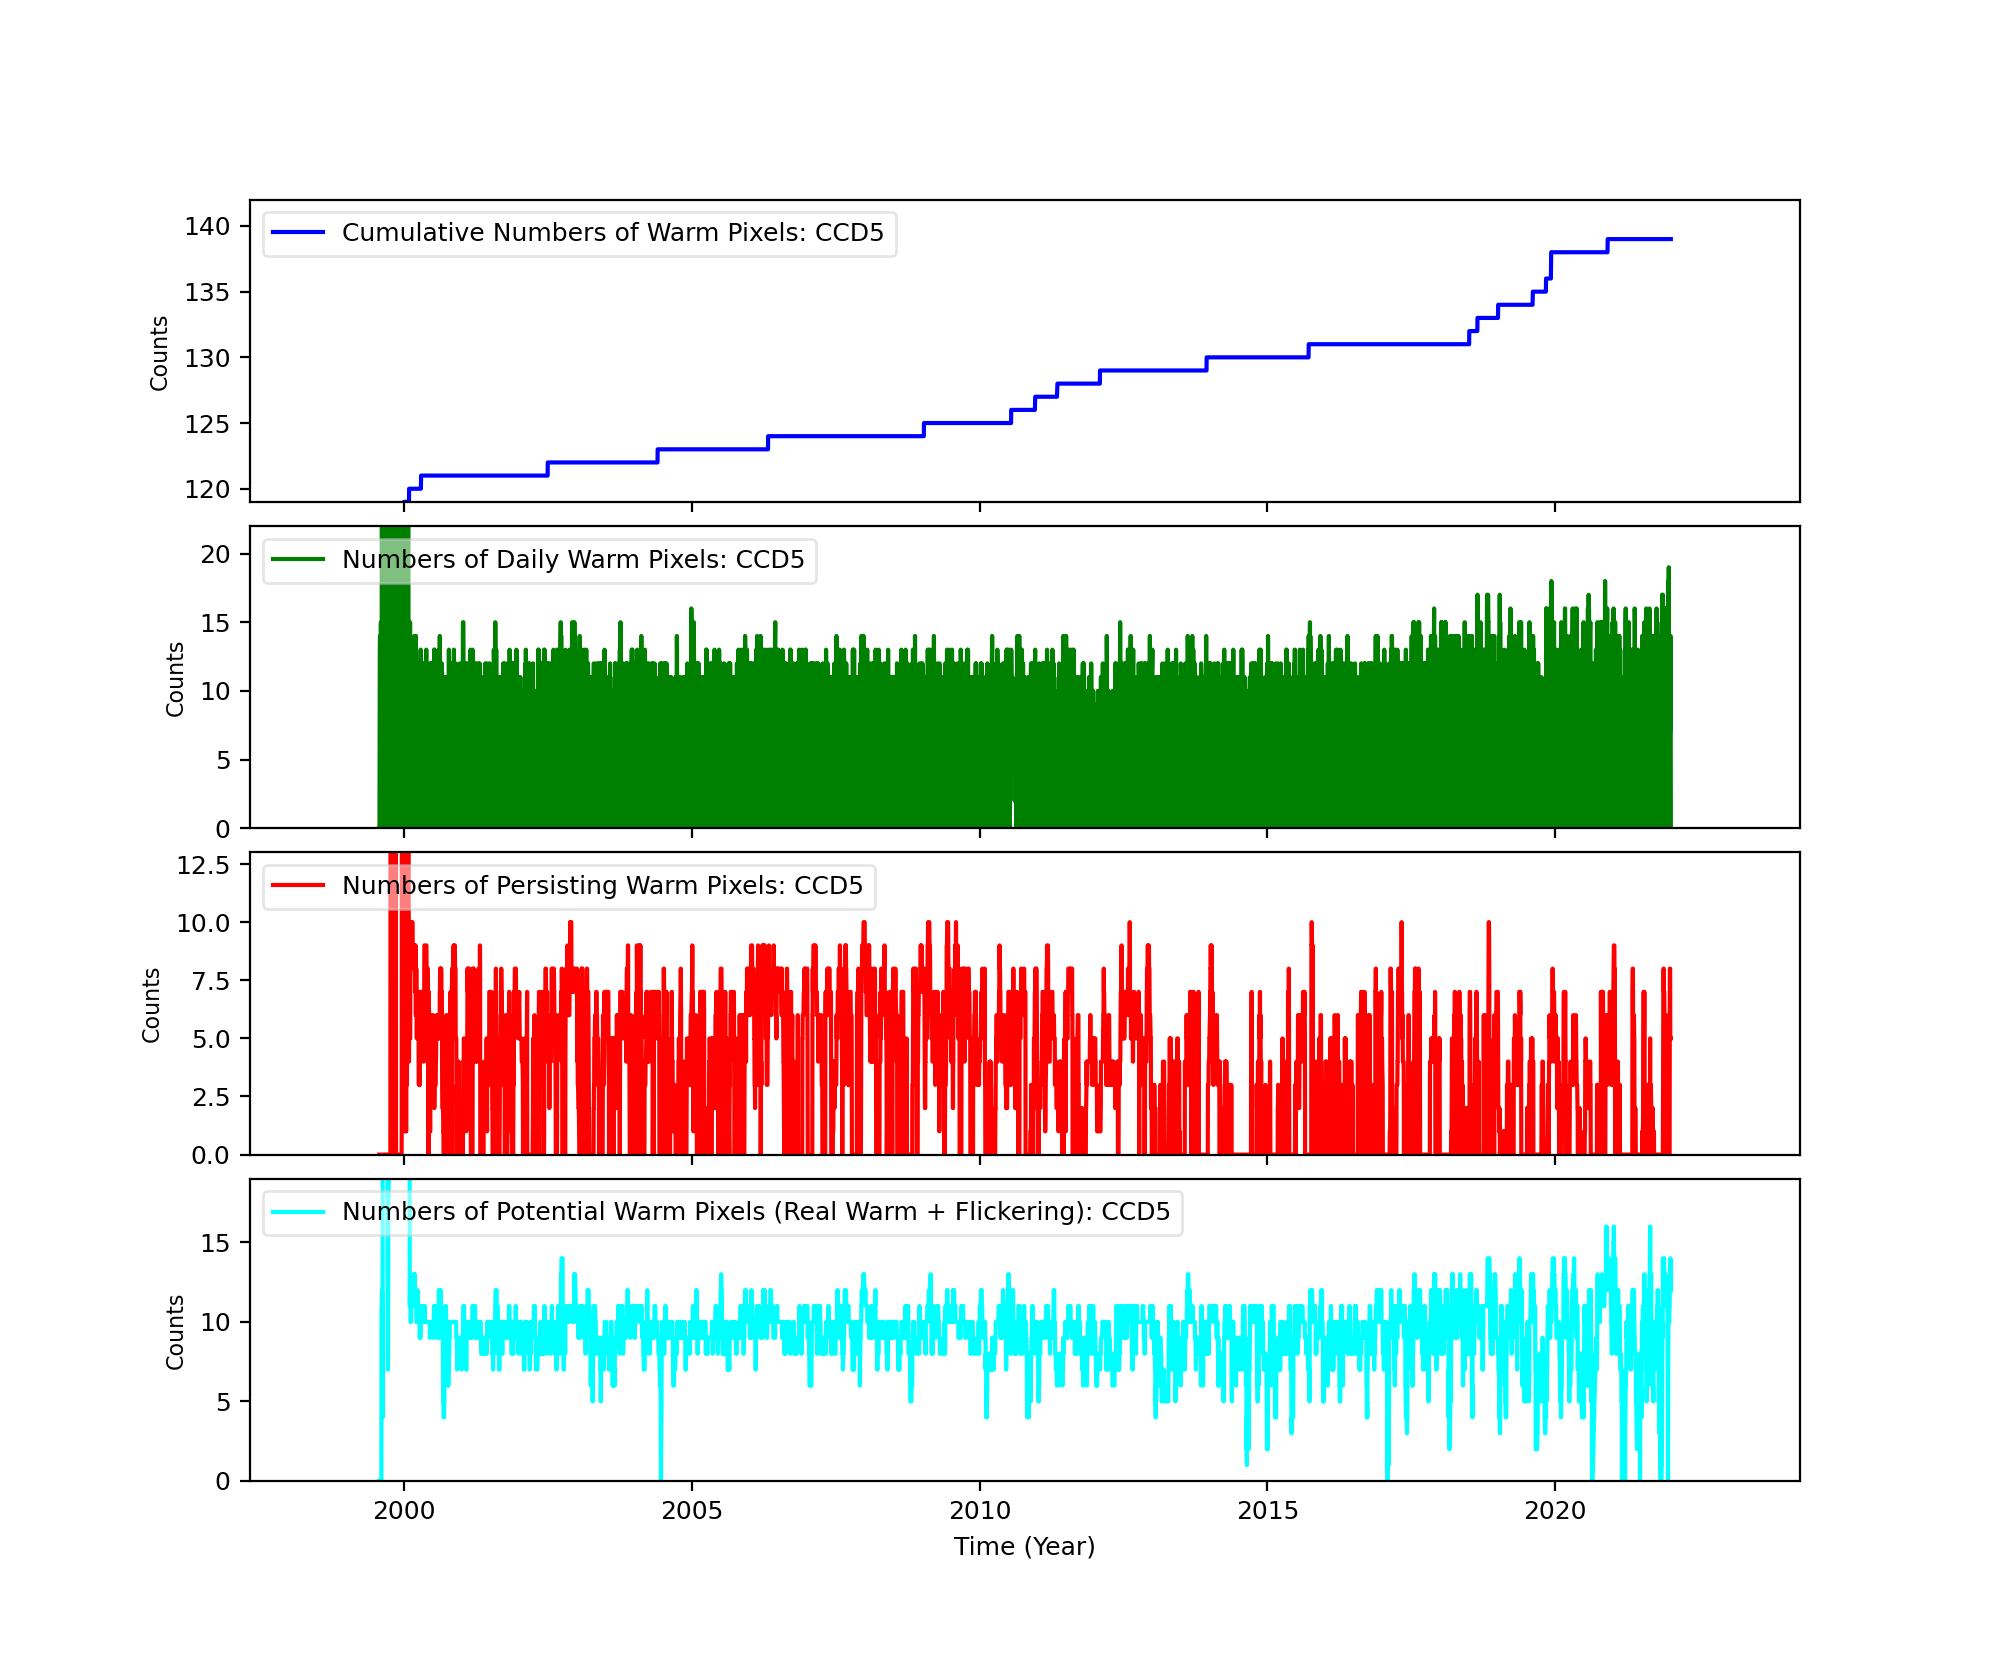
Bad Pixels
The plots below were generated with a new warm pixel finding script. Please see Acis Bad Pixel Page for details.
Front Side CCDs
Back Side CCD (CCD5)
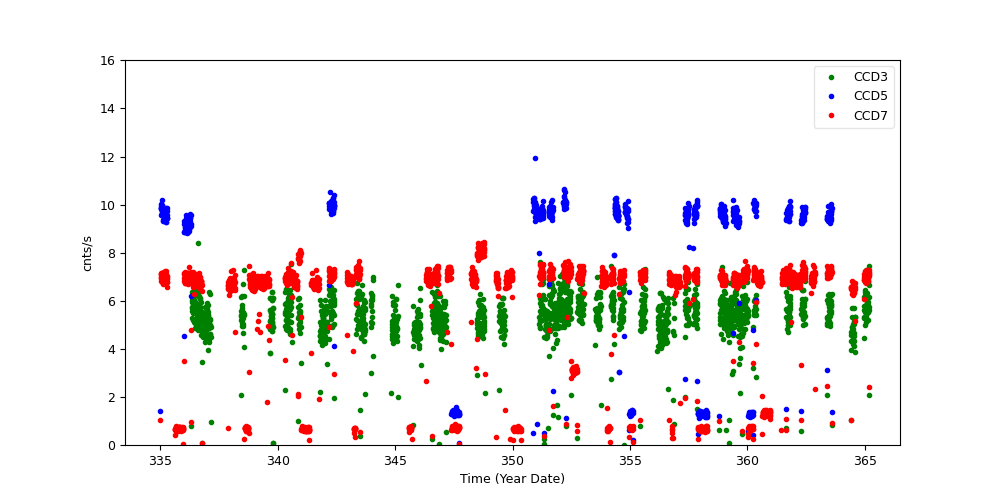
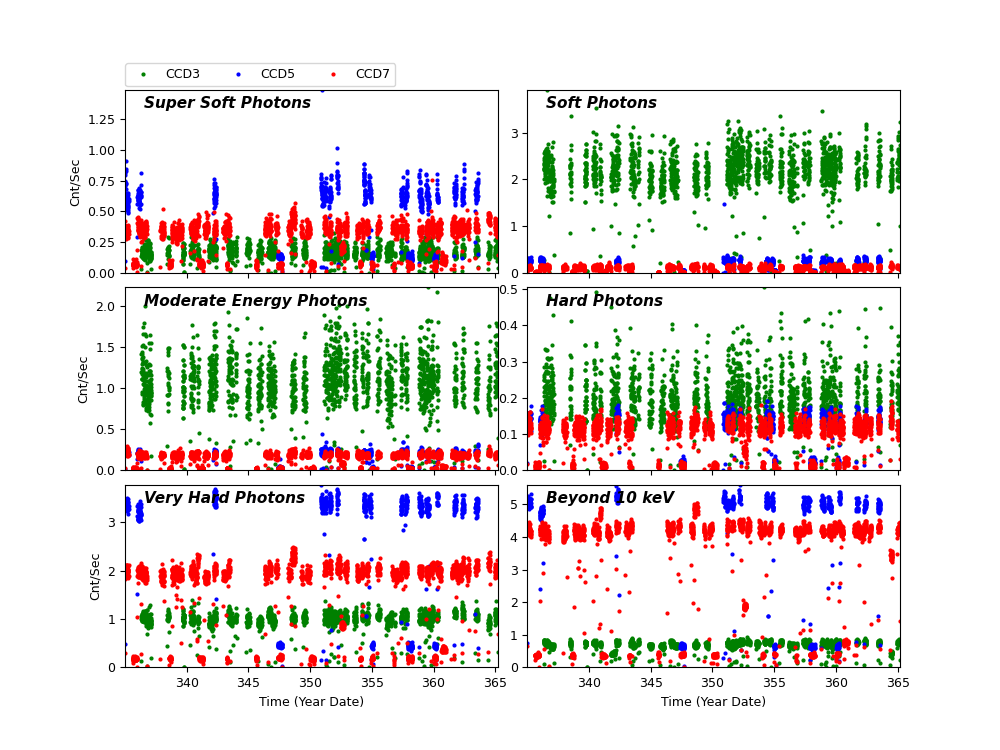
Science Instrument Background Rates
| Name | Low (keV) | High(KeV) | Description |
|---|---|---|---|
| SSoft | 0.00 | 0.50 | Super soft photons |
| Soft | 0.50 | 1.00 | Soft photons |
| Med | 1.00 | 3.00 | Moderate energy photons |
| Hard | 3.00 | 5.00 | Hard Photons |
| Harder | 5.00 | 10.00 | Very Hard photons |
| Hardest | 10.00 | Beyond 10 keV |
HRC
DOSE of Central 4K Pore-Pairs
Please refer to Maximum Dose Trends for more details.
)
|
|---|
IMAGE                NPIX      MEAN    STDDEV      MIN       MAX
HRCI_12_2021.fits  16777216	0.026 	0.161 	0.000 	6.000
)
IMAGE                       NPIX      MEAN    STDDEV      MIN       MAX
HRCI_08_1999_12_2021.fits  16777216	7.647 	6.564 	0.000 	314.000
)
|
|---|
IMAGE                NPIX      MEAN    STDDEV      MIN       MAX
HRCS_12_2021.fits  16777216	0.017 	0.135 	0.000 	4.000
)
IMAGE                       NPIX      MEAN    STDDEV      MIN       MAX
HRCS_08_1999_12_2021.fits  16777216	20.773 	36.797 	0.000 	1767.000
|
|
Max dose trend plots corrected for events that "pile-up"
in the center of the taps due to bad position information.
|
)
|
)
|
)
|
)
|
| Sep 2021 | Jun 2021 | Mar 2021 | Dec 2020 |
|---|
)
|
)
|
)
|
)
|
| Sep 2021 | Jun 2021 | Mar 2021 | Dec 2020 |
|---|
Gratings
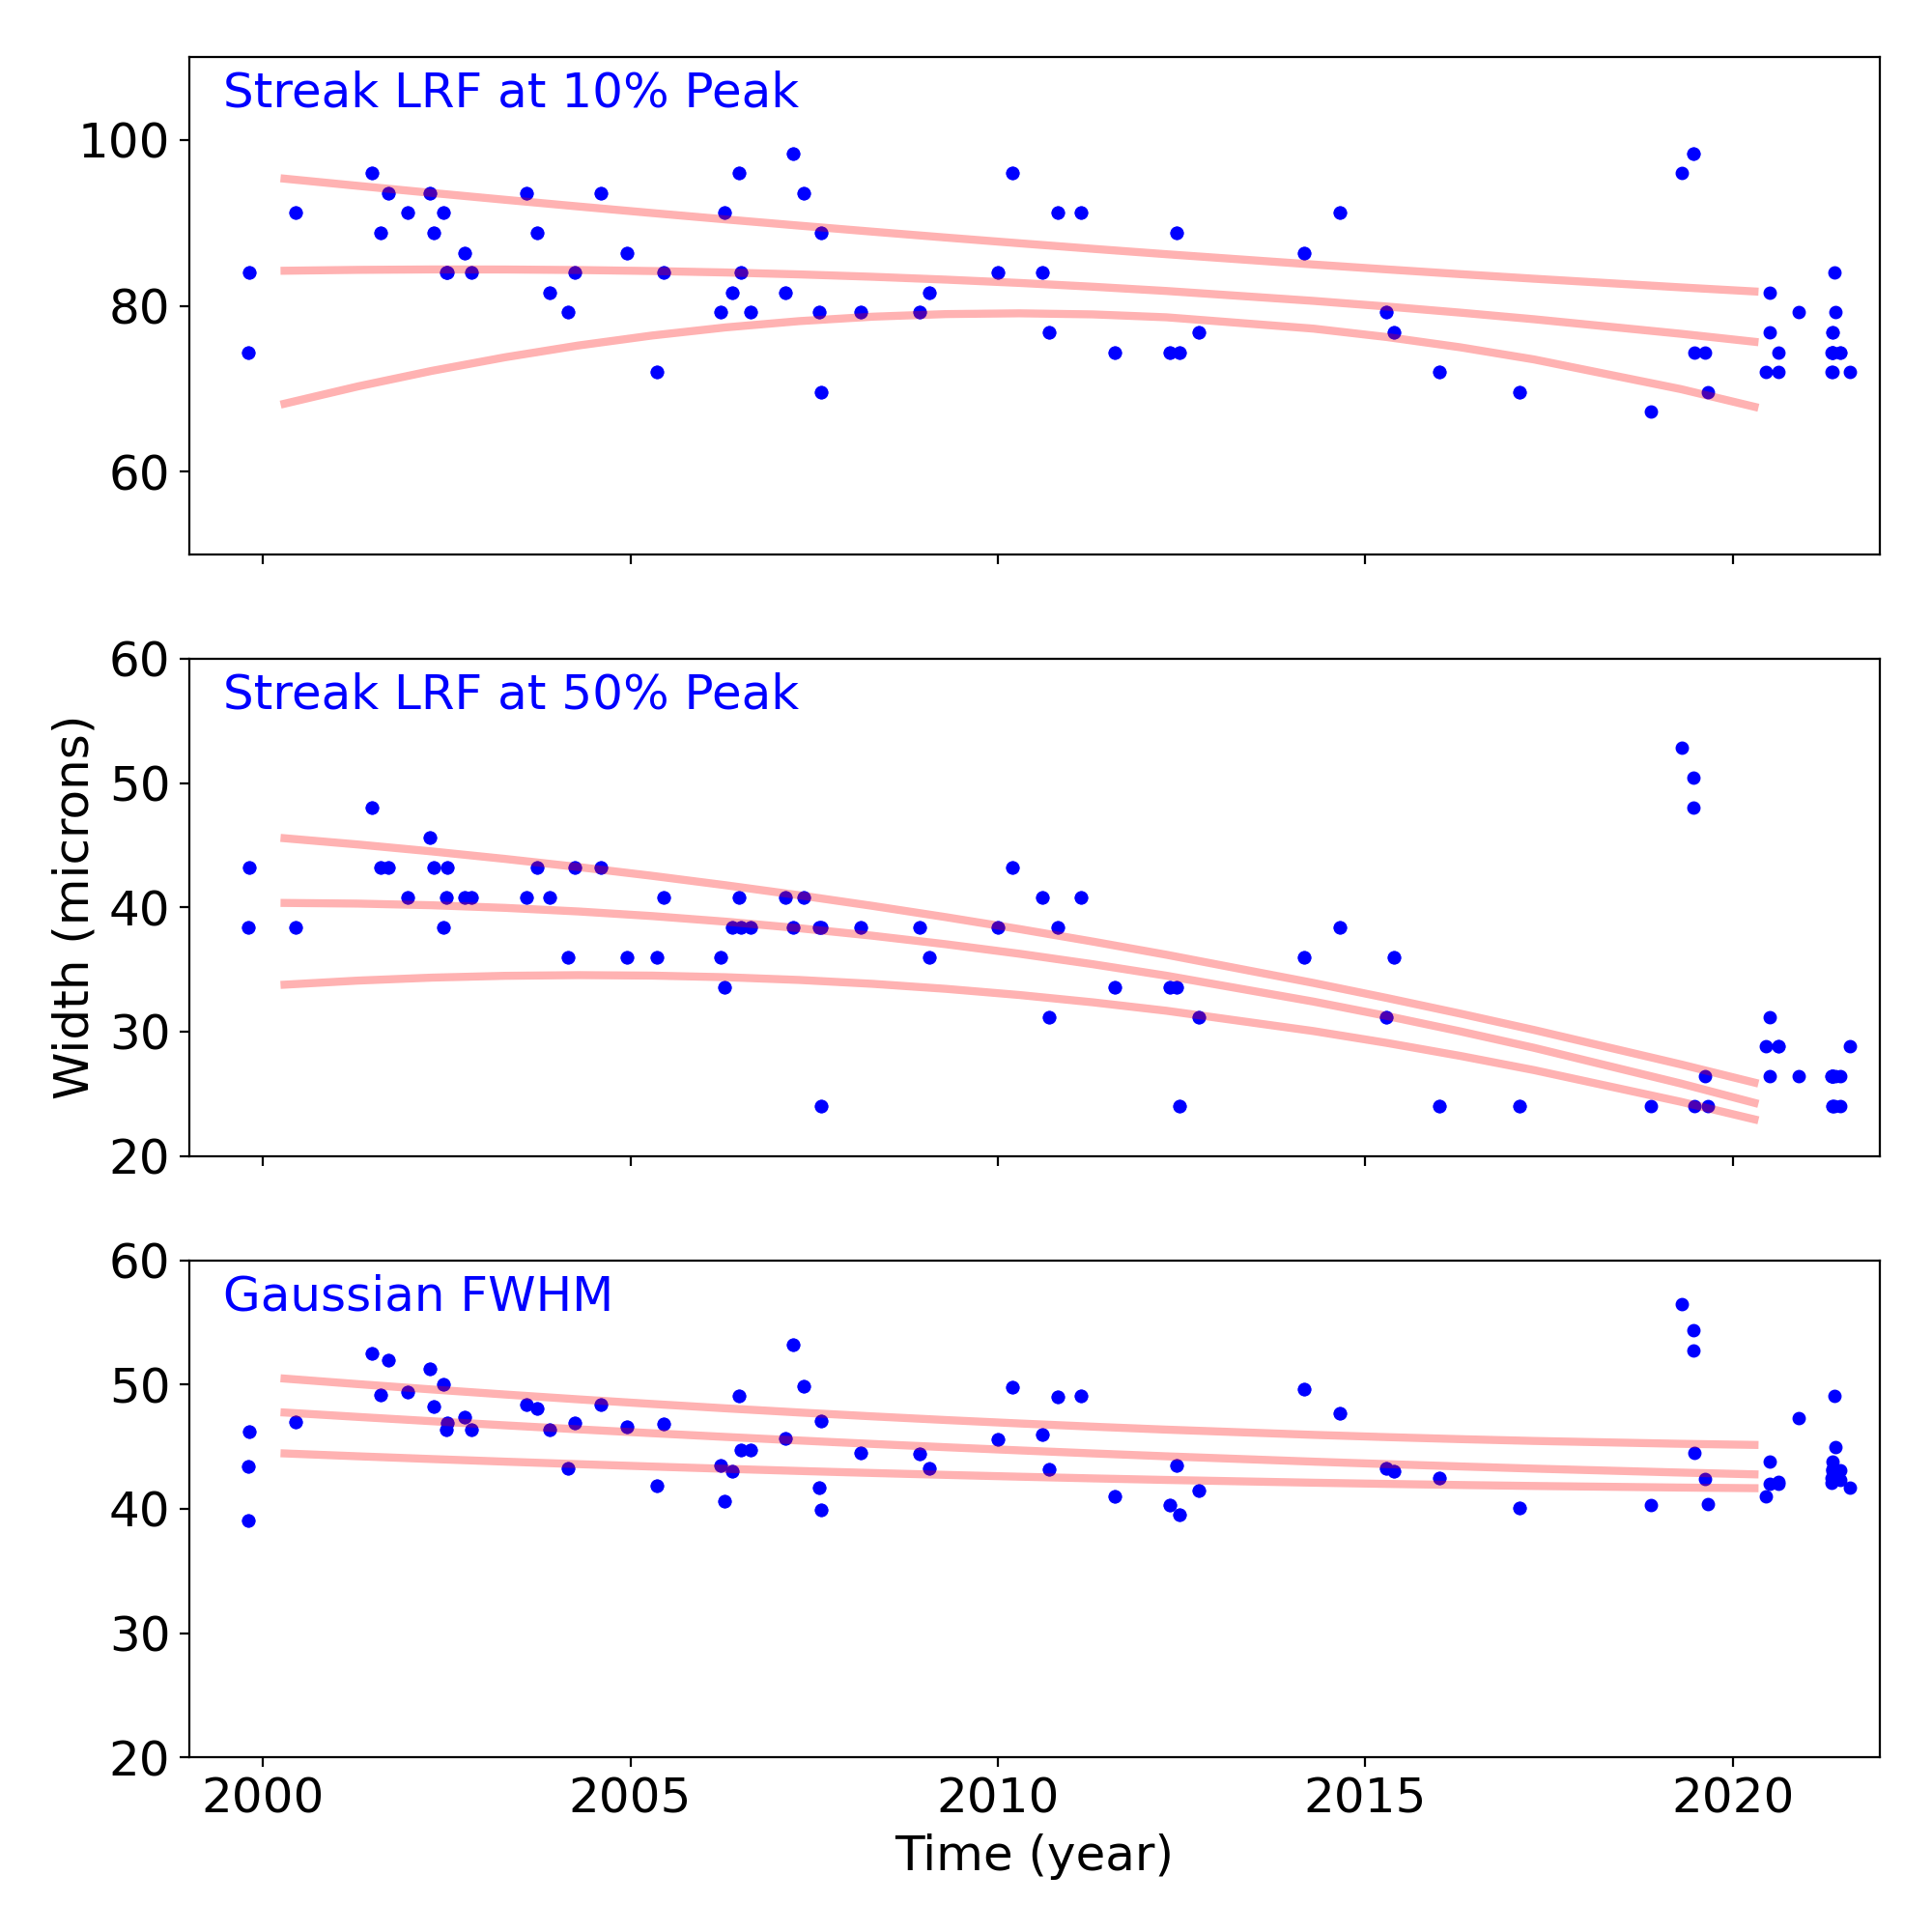
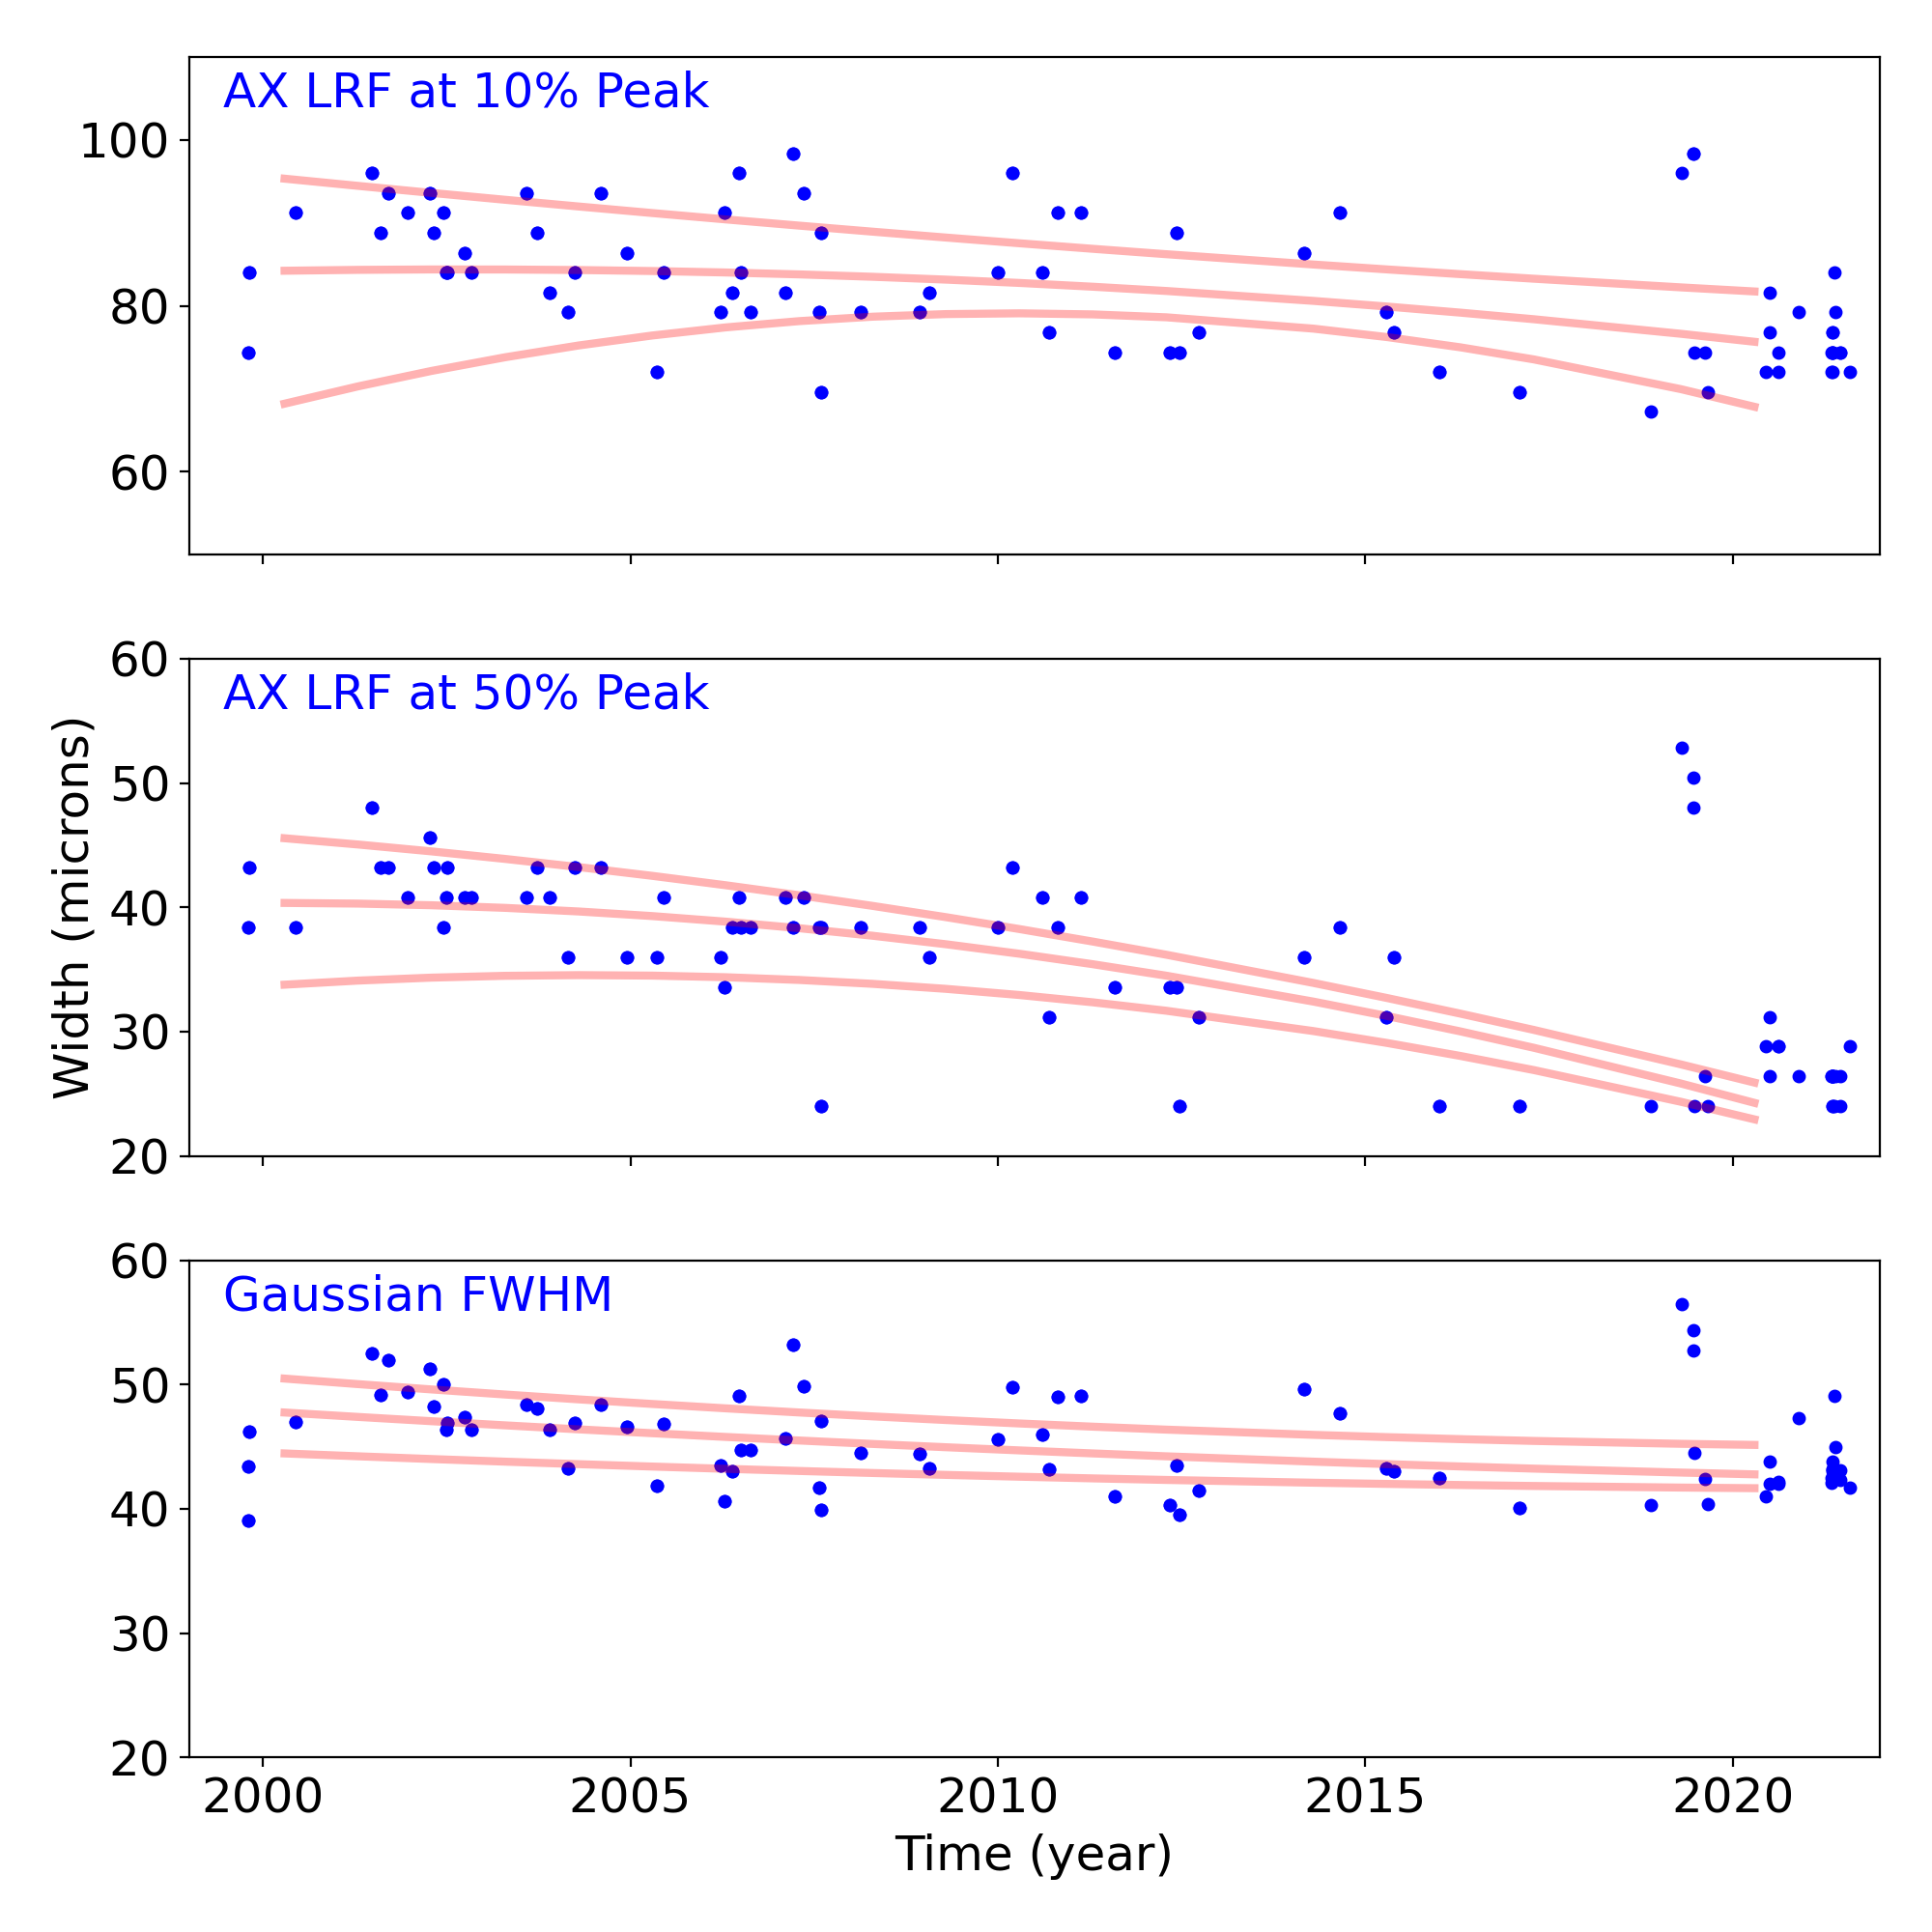
Grating Trends/Focus
We plot the width of the zero order streak of ACIS/HETG observations and the width of the zero order image for HRC/LETG observations of point sources. No significant defocusing trend is seen at this time. See Gratings Trends pages.
PCAD
ACA Trending
| ACIS |
)
|
)
|
)
|
|
|---|---|---|---|---|
)
|
)
|
)
| ||
| HRCI |
)
|
)
|
)
|
)
|
| HRCI |
)
|
)
|
)
|
)
|
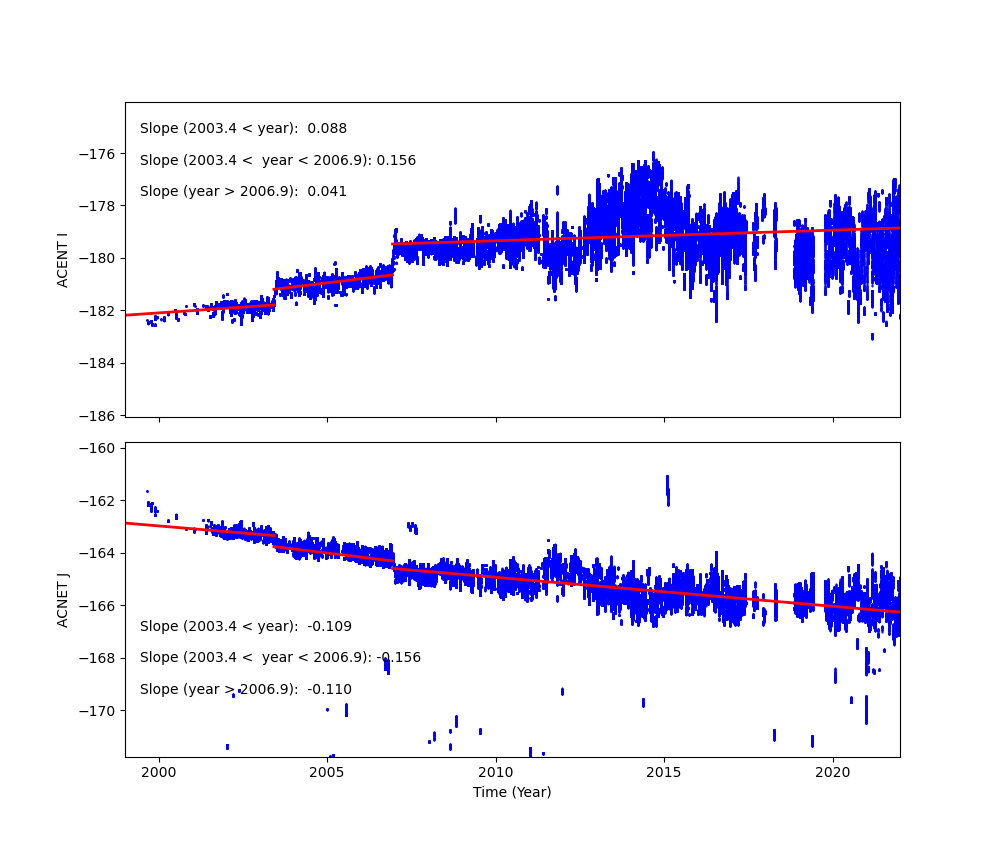
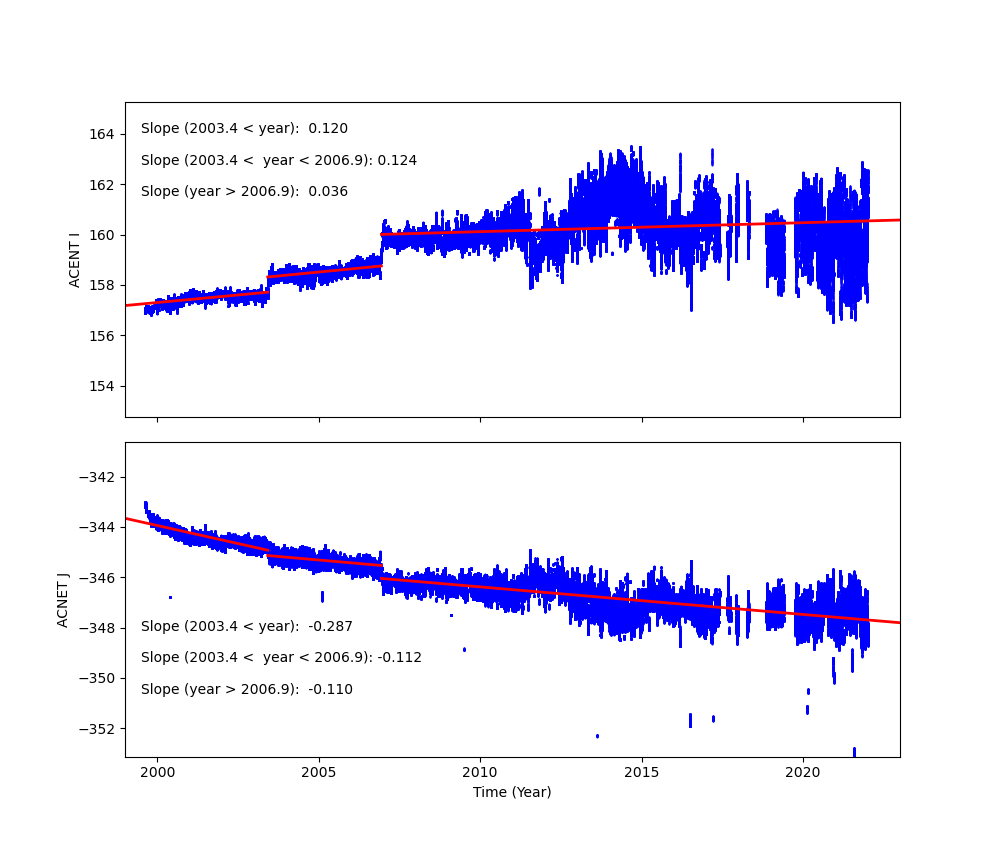
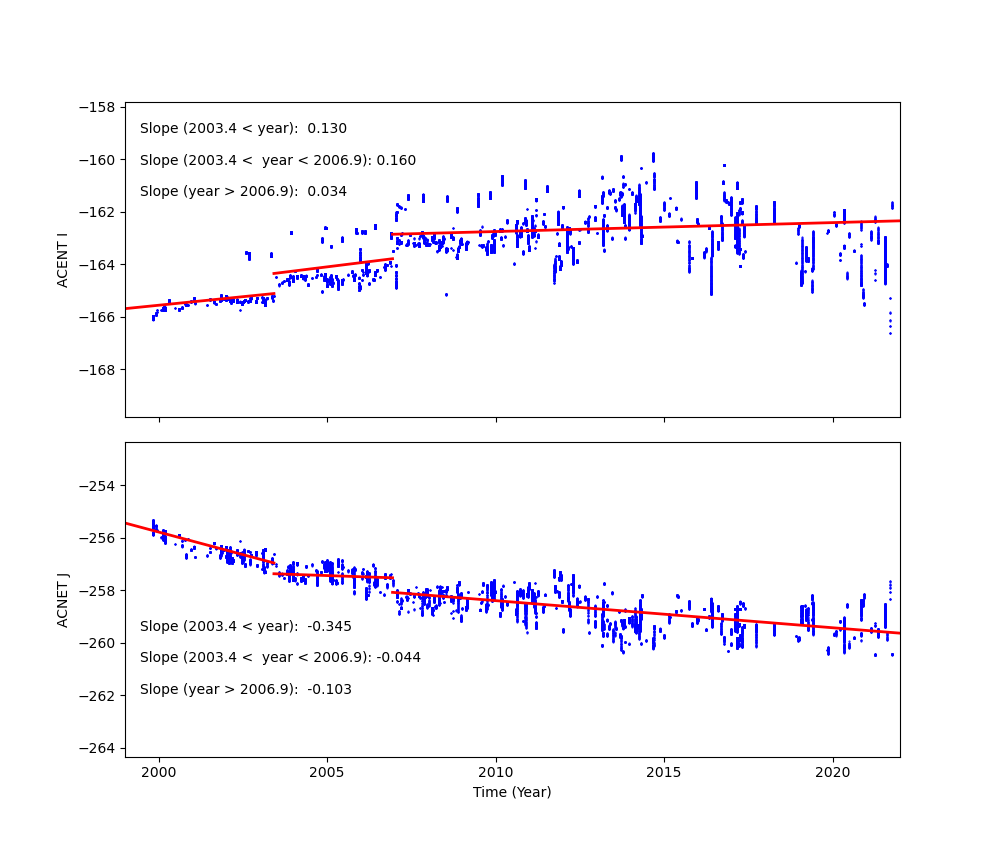
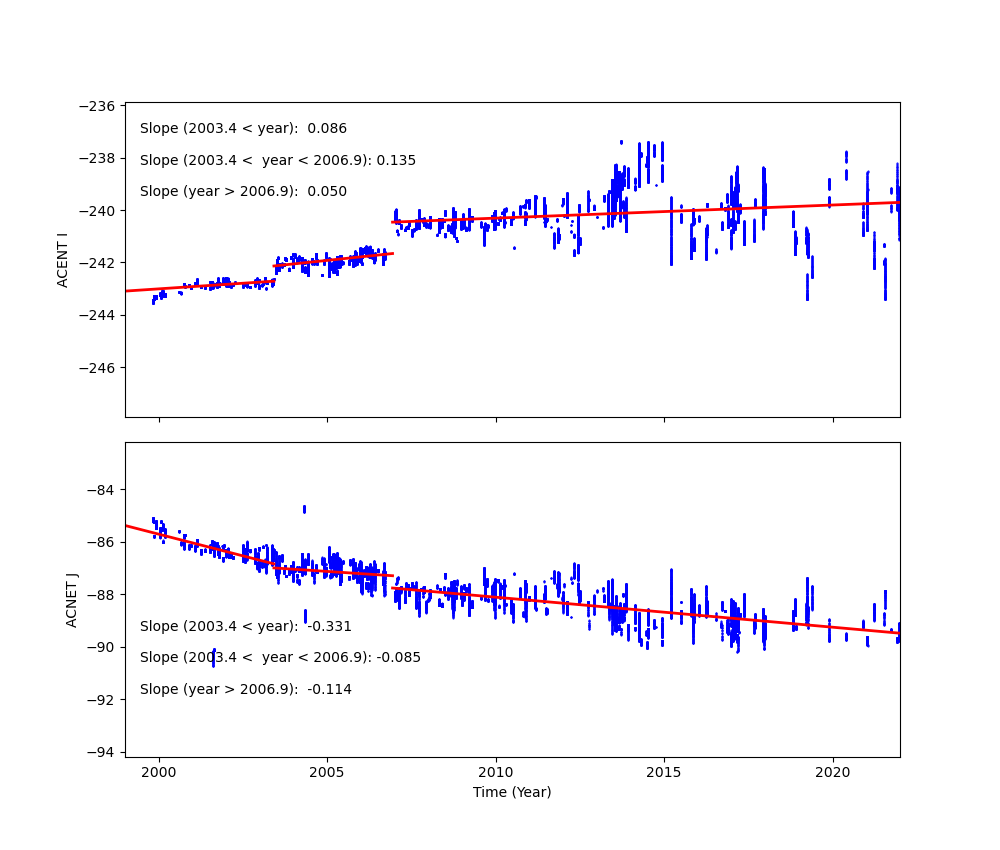
Fid Light Drift
Fid light positions on ACA drift with time. The drift trends of Fid light 2 with ACIS-I and ACIS-S configurations are shown below.
The top panel shows Fid light 2 drift in ACENT I (app. along with -Y axis), and the
bottom panel shows that in ACENT J (app. along with Z axis). The unit is a pixel, and
one pixel is approximately 0.5 arcsec. The slope listed at the top right corner is
the change in a position per year (arcsec/yr). The vertical line on DOM = 1411 (Jun 1, 2003)
indicates a transition date of use of IRU-1 to IRU-2.
See also Tom Aldcroft's updated page:
https://cxc.cfa.harvard.edu/mta/ASPECT/fid_drift
Fid 2 (ACIS-I)
Fid 2 (ACIS-S)
Fid 8 (HRC-I)
Fid 12 (HRC-S)
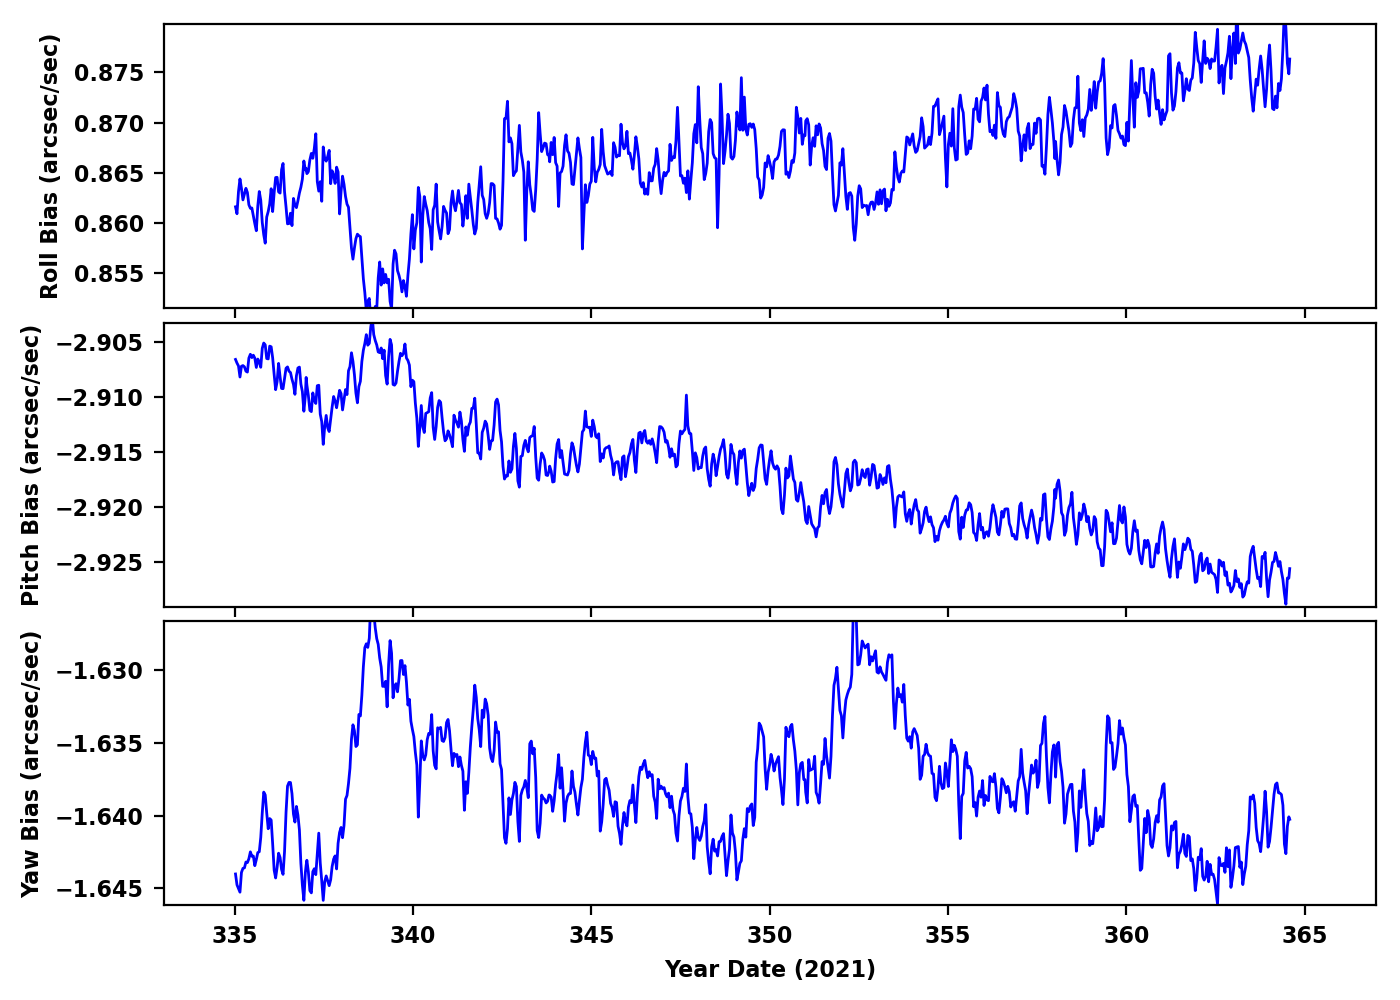
Gyro Bias Drift
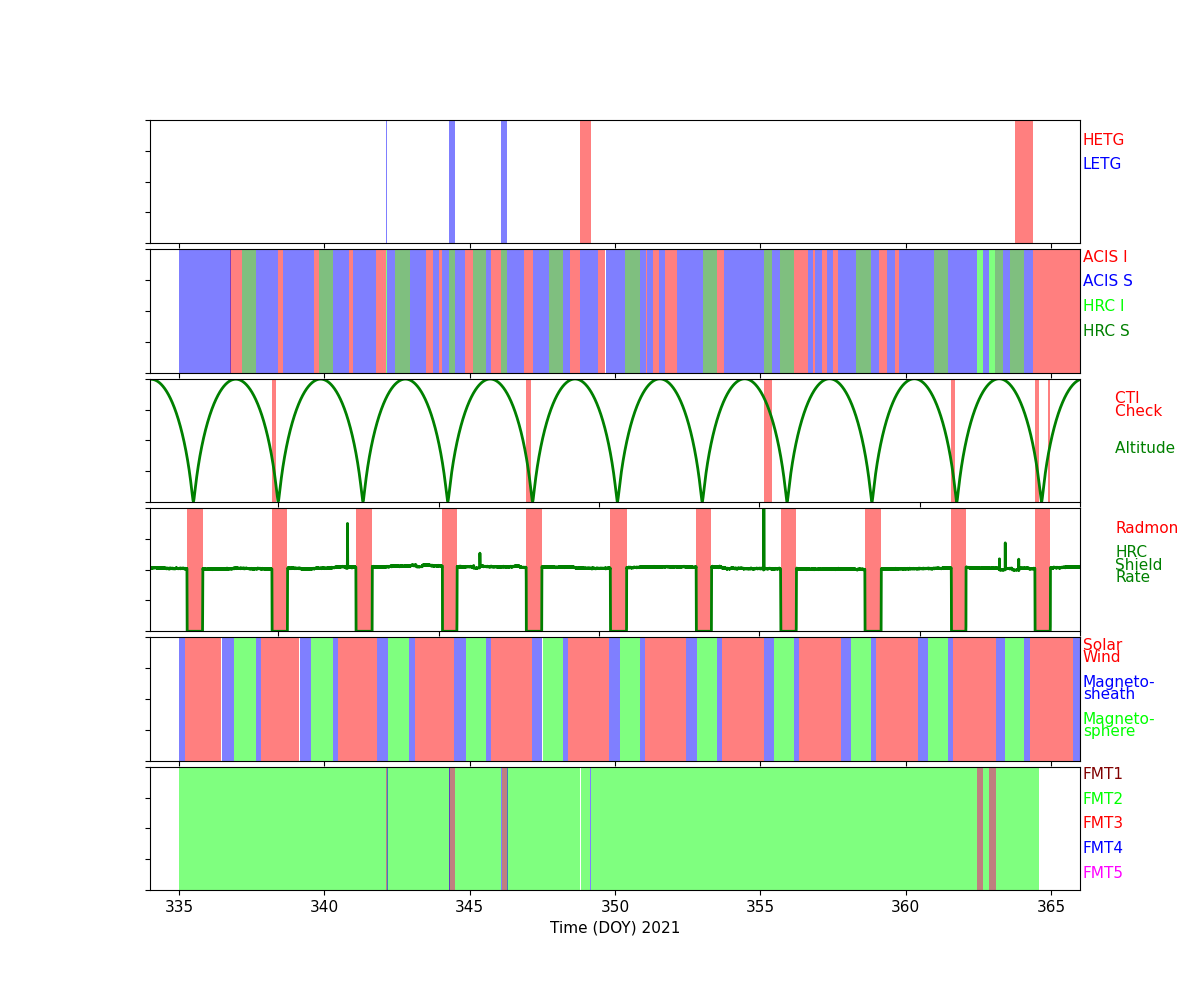
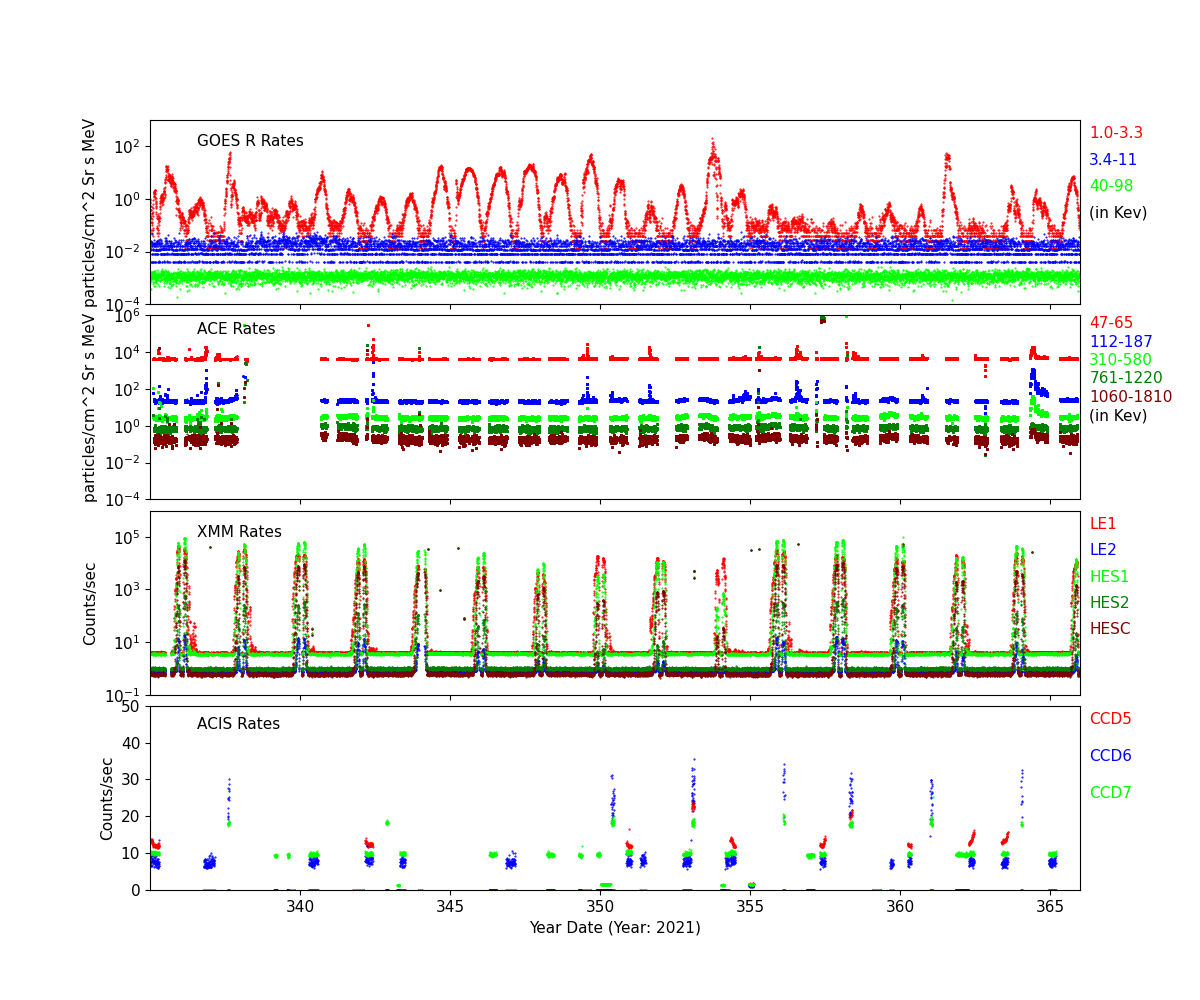
Radiation History
Radiation Count Rates of Dec 2021
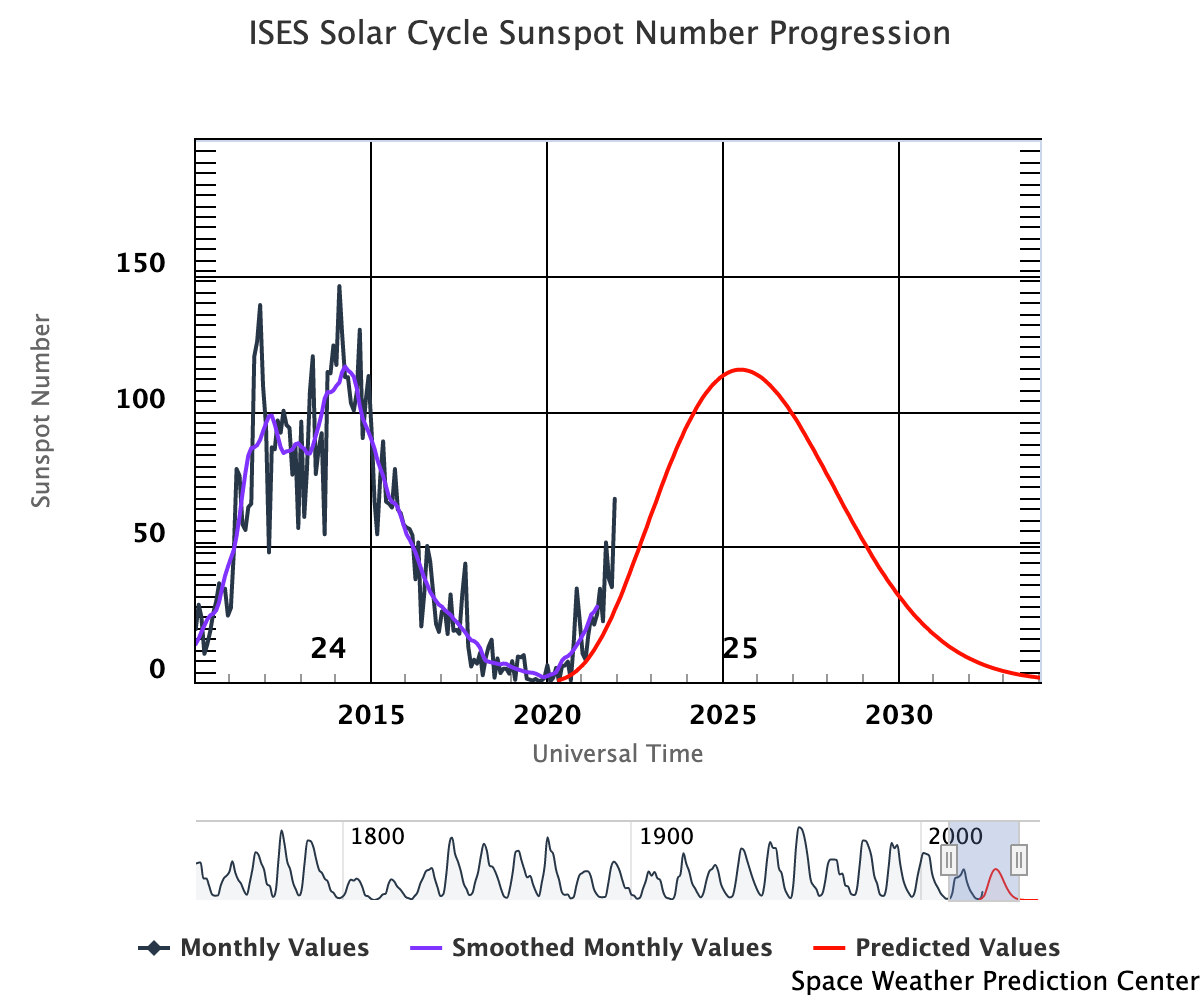
Sun Spot History (See:NOAA Page)
Trending
Critical Trends
| ACIS Temperatures - Daily Maximums | |||||||
|---|---|---|---|---|---|---|---|
| MSID | MEAN | RMS | DELTA/YR | DELTA/YR/YR | UNITS | DESCRIPTION | |
| 1pdeaat | -0.006 | 0.003 | (3.04+/-0.07)e2 | 3.26 +/- 1.92 | K | PSMC DEA PS A TEMP | |
| HRMA Computed Averages - Daily Maximums | |||||||
|---|---|---|---|---|---|---|---|
| MSID | MEAN | RMS | DELTA/YR | DELTA/YR/YR | UNITS | DESCRIPTION | |
| obaavg | 0.014 | 9.284e-04 | (2.98+/-0.02)e2 | -0.90 +/- 0.67 | TEMP | OBA/TFTE | |
| EPHIN Temperatures - Daily Maximums | |||||||
|---|---|---|---|---|---|---|---|
| MSID | MEAN | RMS | DELTA/YR | DELTA/YR/YR | UNITS | DESCRIPTION | |
| teio | 0.042 | 0.010 | (3.27+/-0.23)e2 | 1.18 +/- 3.95 | K | EPHIN ELECTRONICS HOUSING TEMP | |
| tephin | 0.047 | 0.004 | (3.36+/-0.09)e2 | -3.55 +/- 2.75 | K | EPHIN SENSOR HOUSING TEMP | |
| S/C Main Temperatures - Daily Maximums | |||||||
|---|---|---|---|---|---|---|---|
| MSID | MEAN | RMS | DELTA/YR | DELTA/YR/YR | UNITS | DESCRIPTION | |
| tcylfmzm | 0.020 | 0.006 | (3.15+/-0.13)e2 | 1.47 +/- 2.65 | K | CNT CYL TEMP:-Z SIDE UNDER LAE-1 | |
| tcylfmzp | 0.023 | 0.005 | (3.18+/-0.13)e2 | 2.04 +/- 2.38 | K | CNT CYL TEMP:-Z SIDE UNDER LAE-2 | |
| S/C Ancillary Temperatures - Daily Maximums | |||||||
|---|---|---|---|---|---|---|---|
| MSID | MEAN | RMS | DELTA/YR | DELTA/YR/YR | UNITS | DESCRIPTION | |
| tfssbkt1 | 0.038 | 0.012 | (3.48+/-0.27)e2 | -3.66 +/- 4.34 | K | FSS BRAC | |
| tfssbkt2 | 0.036 | 0.013 | (3.43+/-0.30)e2 | -0.91 +/- 4.57 | K | FSS BRAC | |
| tsctsf1 | 0.035 | 0.002 | (3.22+/-0.05)e2 | -1.13 +/- 1.73 | K | SC-TS FITTING -1 TEMP | |
| tsctsf6 | 0.033 | 0.002 | (3.21+/-0.06)e2 | -2.16 +/- 1.81 | K | SC-TS FITTING -6 TEMP | |
| MUPS - Daily Maximums | |||||||
|---|---|---|---|---|---|---|---|
| MSID | MEAN | RMS | DELTA/YR | DELTA/YR/YR | UNITS | DESCRIPTION | |
| pm1thv1t | 0.013 | 0.006 | (3.53+/-0.15)e2 | -1.61 +/- 2.95 | K | MUPS 1 THRUSTER VALVE 01 TEMP | |
| pm2thv1t | 0.043 | 0.018 | (3.28+/-0.43)e2 | 0.87 +/- 8.11 | K | MUPS 2 THRUSTER VALVE 01 TEMP | |
| pm1thv2t | 0.014 | 0.006 | (3.55+/-0.15)e2 | -2.22 +/- 3.10 | K | MUPS 1 THRUSTER VALVE 02 TEMP | |
| pm2thv2t | 0.025 | 0.022 | (3.18+/-0.51)e2 | -13.20 +/- 9.25 | K | MUPS 2 THRUSTER VALVE 02 TEMP | |
| pline02t | 0.027 | 0.005 | (3.35+/-0.12)e2 | -2.84 +/- 2.78 | K | PROP LINE TEMP 02 | |
| pline03t | 0.017 | 0.006 | (3.30+/-0.14)e2 | -1.74 +/- 2.62 | K | PROP LINE TEMP 03 | |
| pline04t | 0.033 | 0.005 | (3.18+/-0.11)e2 | -0.06 +/- 2.73 | K | PROP LINE TEMP 04 | |
Quarterly Trends
- HRMA Struts
| Previous Quarter | |||||||
| MSID | MEAN | RMS | DELTA/YR | DELTA/YR/YR | UNITS | DESCRIPTION | |
| 4rt584t | 0.017 | 6.246e-04 | (3.01+/-0.02)e2 | -1.22 +/- 0.44 | K | RT 584 - STRUT TEMP | |
|---|---|---|---|---|---|---|---|
| 4rt585t | 0.017 | 6.123e-04 | (3.01+/-0.02)e2 | -0.85 +/- 0.43 | K | RT 585 - STRUT TEMP | |
| 4rt586t | 0.015 | 5.096e-04 | (2.97+/-0.01)e2 | -0.50 +/- 0.35 | K | RT 586 - STRUT TEMP | |
| 4rt587t | 0.011 | 3.665e-04 | (2.91+/-0.01)e2 | -0.43 +/- 0.25 | K | RT 587 - STRUT TEMP | |
| 4rt597t | 0.025 | 0.001 | (3.09+/-0.03)e2 | -2.26 +/- 1.00 | K | RT 597 - TFTE TEMP | |
| 4rt598t | 0.025 | 0.001 | (3.08+/-0.03)e2 | -2.16 +/- 0.98 | K | RT 598 - TFTE TEMP | |
- OB Forward Bulkhead
| Previous Quarter | |||||||
| MSID | MEAN | RMS | DELTA/YR | DELTA/YR/YR | UNITS | DESCRIPTION | |
| 4rt705t | 0.015 | 7.065e-04 | (2.92+/-0.02)e2 | -0.74 +/- 0.54 | K | RT 705 - OB BUL | |
|---|---|---|---|---|---|---|---|
| 4rt706t | 0.015 | 7.141e-04 | (2.91+/-0.02)e2 | -0.75 +/- 0.54 | K | RT 706 - OB BUL | |
| 4rt707t | 0.015 | 7.173e-04 | (2.94+/-0.02)e2 | -0.70 +/- 0.55 | K | RT 707 - OB BULKHEAD TEMP | |
| 4rt708t | 0.017 | 8.064e-04 | (2.99+/-0.02)e2 | -0.68 +/- 0.62 | K | RT 708 - OB BULKHEAD TEMP | |
| 4rt709t | 0.019 | 8.703e-04 | (3.00+/-0.02)e2 | -0.94 +/- 0.67 | K | RT 709 - OB BULKHEAD TEMP | |
| 4rt710t | 0.019 | 9.353e-04 | (3.02+/-0.02)e2 | -0.84 +/- 0.72 | K | RT 710 - OB BULKHEAD TEMP | |
- HRMA Thermal
- HRMA Thermal
| Previous Quarter | |||||||
| MSID | MEAN | RMS | DELTA/YR | DELTA/YR/YR | UNITS | DESCRIPTION | |
| 4rt568t | 0.019 | 7.979e-04 | (2.99+/-0.02)e2 | -1.19 +/- 0.59 | K | RT 568 - HRMA TEMP | |
|---|---|---|---|---|---|---|---|
| 4rt569t | 0.008 | 2.242e-04 | (2.96+/-0.01)e2 | -0.20 +/- 0.12 | K | RT 569 - HRMA TEMP | |
| 4rt570t | 0.005 | 1.183e-04 | (2.96+/-0.00)e2 | -0.11 +/- 0.05 | K | RT 570 - HRMA TEMP | |
| 4rt575t | 0.021 | 0.001 | (3.04+/-0.03)e2 | -1.82 +/- 0.78 | K | RT 575 - OB CONE TEMP | |
| 4rt576t | 0.017 | 7.826e-04 | (2.95+/-0.02)e2 | -1.20 +/- 0.57 | K | RT 576 - OB CONE TEMP | |
| 4rt578t | 0.023 | 0.001 | (3.01+/-0.03)e2 | -1.45 +/- 0.94 | K | RT 578 - OB CONE TEMP | |
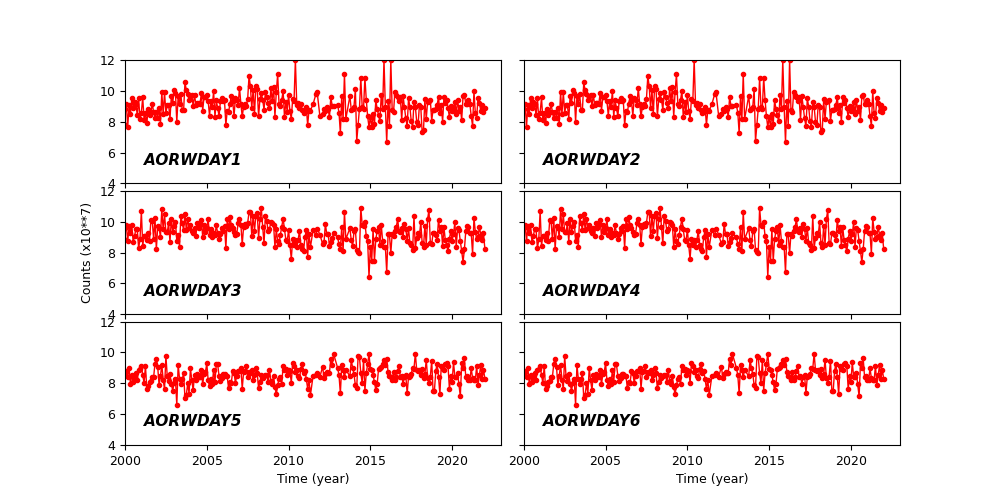
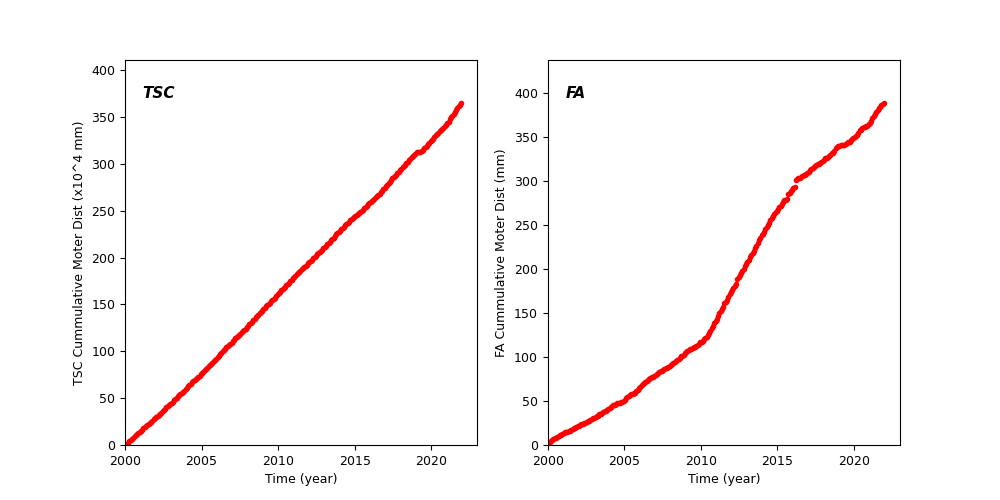
Spacecraft Motions
TSC and FA Cummulative Moter Distance
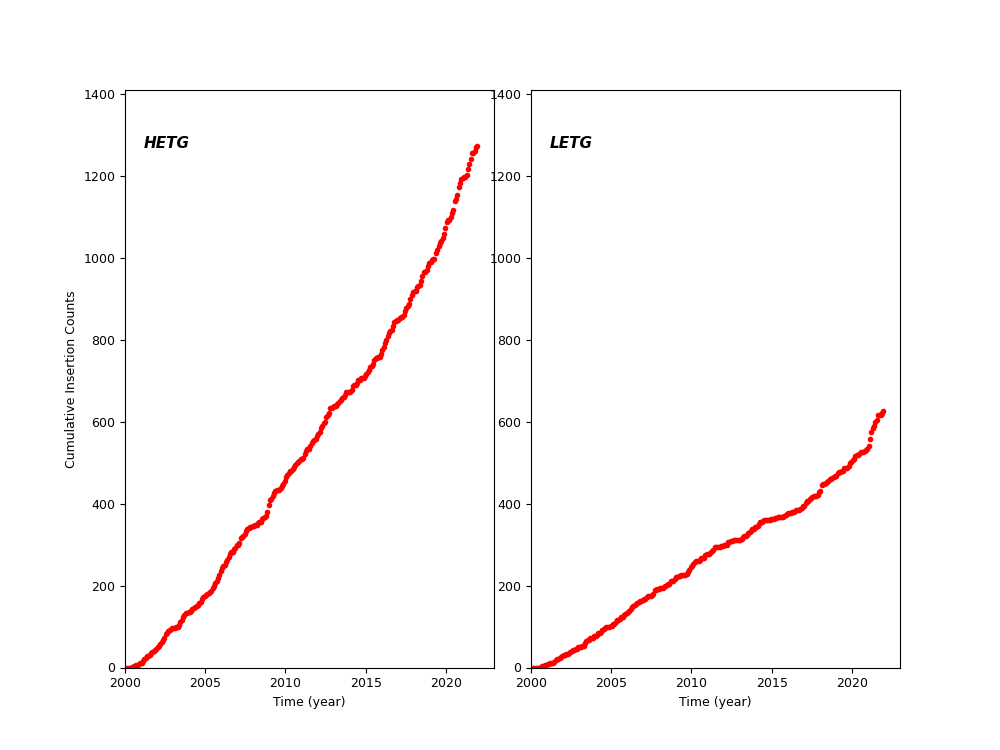
HETG and LETG Cummulative Insertion Counts
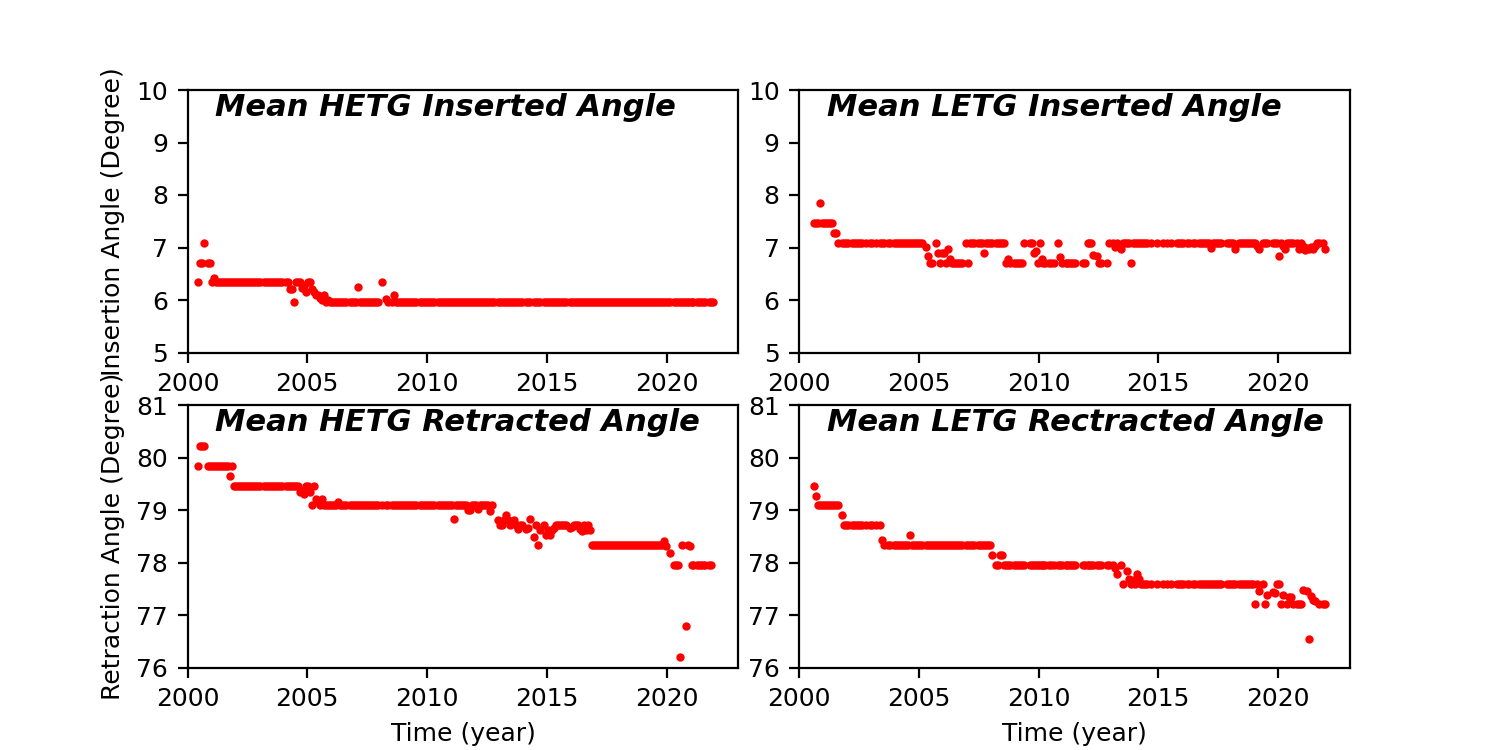
HETG/LETG Insertion/Retraction Angle
Reaction Wheel Rotations