ACIS
ACIS DOSE Registered-Photon-Map
The steps we took to compute the dose map are;
- Level 1 Event files for a specified month are obtained from archive.
- Image data including I2, I3, S2, S3 CCDs are extracted from all event files.
- All the extracted image data were merged to create a month long exposure map for the month.
- The exposure map is opened with ds9, and check a distribution of count rates against energy. From this, estimate the upper threshold value. Any events beyond this upper threshold are assumed erroneous events such as bad pixels.
- Using this upper threshold, the data is filtered, and create a cleaned exposure map for the month.
- The exposure map from each month from the Sep 1999 is added up to create a cumulative exposure map for each month.
- Using fimgstatistic, we compute count rate statistics for each CCDs.
- For observations with high data drop rates (e.g., Crab nebula, Cas A), we corrected the observations by adding events.
Please check more detail plots at Telemetered Photon Dose Trend page.
)
)
)
Statistics:
# IMAGE     NPIX     MEAN        RMS        MIN     MAX
ACIS_feb22 6004901       3.715         6.040           0.0     4270


I2 node 0  262654	3.647941	2.170327	0.0	 51.0
I2 node 1  262654	3.785536	2.873545	0.0	898.0
I2 node 2  262654	3.778903	2.225751	0.0	 45.0
I2 node 3  262654	3.781711	8.907144	0.0	3412.0

I3 node 0  262654	4.602146	2.477694	0.0	 69.0
I3 node 1  262654	4.663451	4.146590	0.0	1685.0
I3 node 2  262654	4.542199	2.395814	0.0	 66.0
I3 node 3  262654	4.595336	2.423487	0.0	107.0

S2 node 0  262654	4.026501	2.254637	0.0	115.0
S2 node 1  262654	4.213558	2.462165	0.0	103.0
S2 node 2  262654	4.406166	2.465089	0.0	139.0
S2 node 3  262654	4.639864	10.137345	0.0	4260.0

S3 node 0  262654	6.980450	3.987319	0.0	 62.0
S3 node 1  262654	7.575860	3.867661	0.0	865.0
S3 node 2  262654	6.771783	2.840511	0.0	 41.0
S3 node 3  262654	6.061535	2.668883	0.0	 29.0
)
)
)
Statistics:
 IMAGE     NPIX      MEAN        RMS           MIN      MAX
ACIS_total   6004901       2548.545         3272.282           0.0   140763


I2 node 0  262654	2203.430731	443.022322	473.0	13291.0
I2 node 1  262654	2317.440829	630.072737	486.0	127972.0
I2 node 2  262654	2345.370039	497.428986	507.0	13818.0
I2 node 3  262654	2350.934869	607.642041	477.0	28838.0

I3 node 0  262654	2528.256399	621.643401	469.0	13649.0
I3 node 1  262654	2609.794306	1729.672753	504.0	55760.0
I3 node 2  262654	2325.684050	436.617862	474.0	13815.0
I3 node 3  262654	2310.868204	467.187601	442.0	34610.0

S2 node 0  262654	2970.155139	481.529605	1613.0	22320.0
S2 node 1  262654	3148.202540	714.587666	1801.0	17042.0
S2 node 2  262654	3482.375663	717.411354	2215.0	29670.0
S2 node 3  262654	3444.416268	570.565232	1950.0	70863.0

S3 node 0  262654	5289.643907	2898.149848	2312.0	53653.0
S3 node 1  262654	6488.672736	2353.182074	0.0	40994.0
S3 node 2  262654	5225.686910	1338.271137	2384.0	27168.0
S3 node 3  262654	4088.911154	752.144652	2464.0	26402.0
)
|
)
|
)
|
)
|
| Nov 2021 | Aug 2021 | May 2021 | Feb 2021 |
|---|
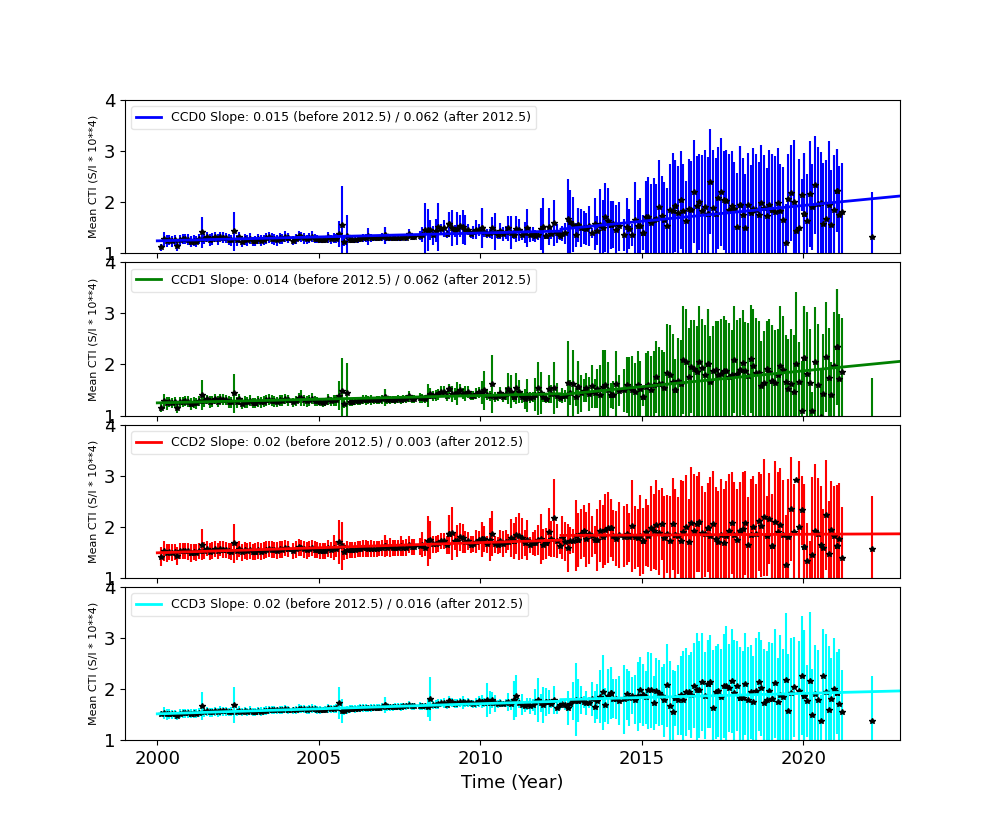
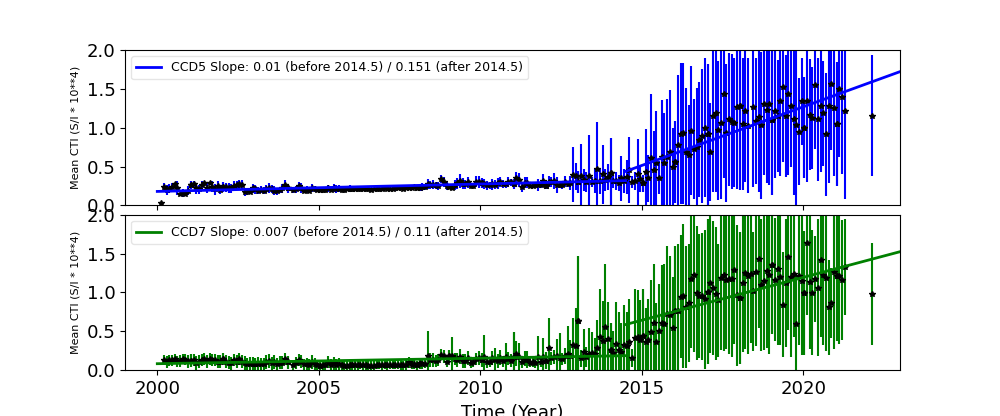
The Mean Detrended CTI
We report CTIs with a refined data definition. CTIs were computed for the temperature dependency corrected data. Please see CTI page for detailed explanation. CTI's are computed for Mn K alpha, and defined as slope/intercept x10^4 of row # vs ADU. Data file: here
Imaging CCDs
Spectral CCDs
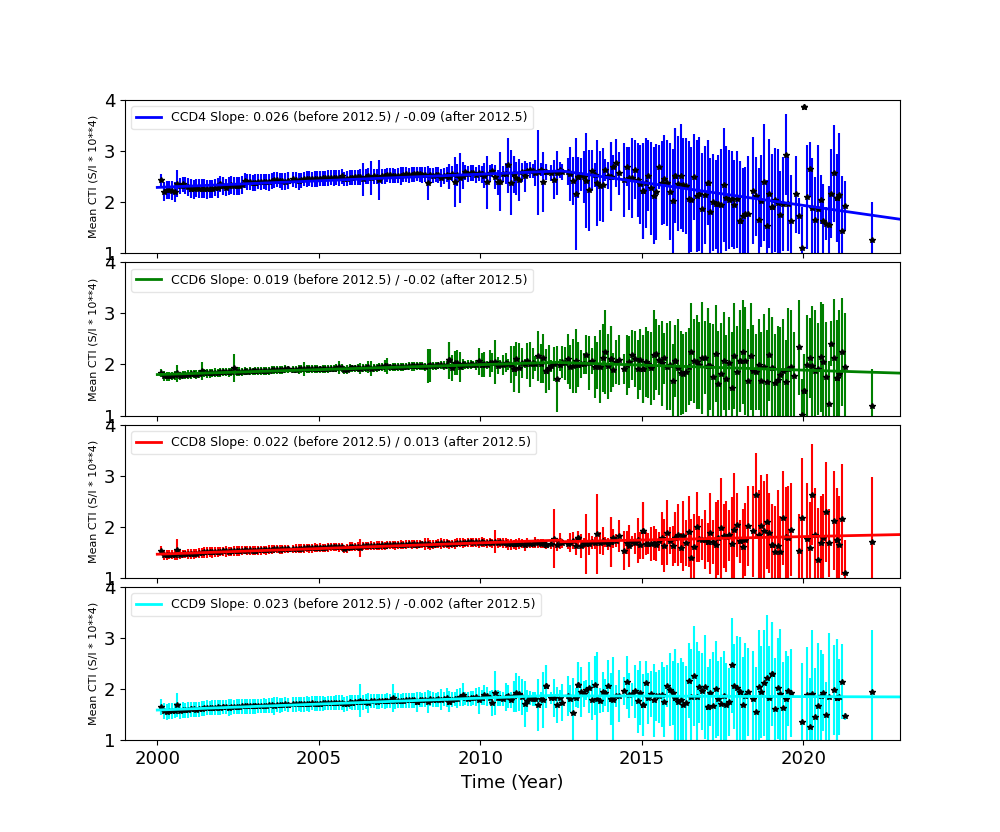
Backside CCDs
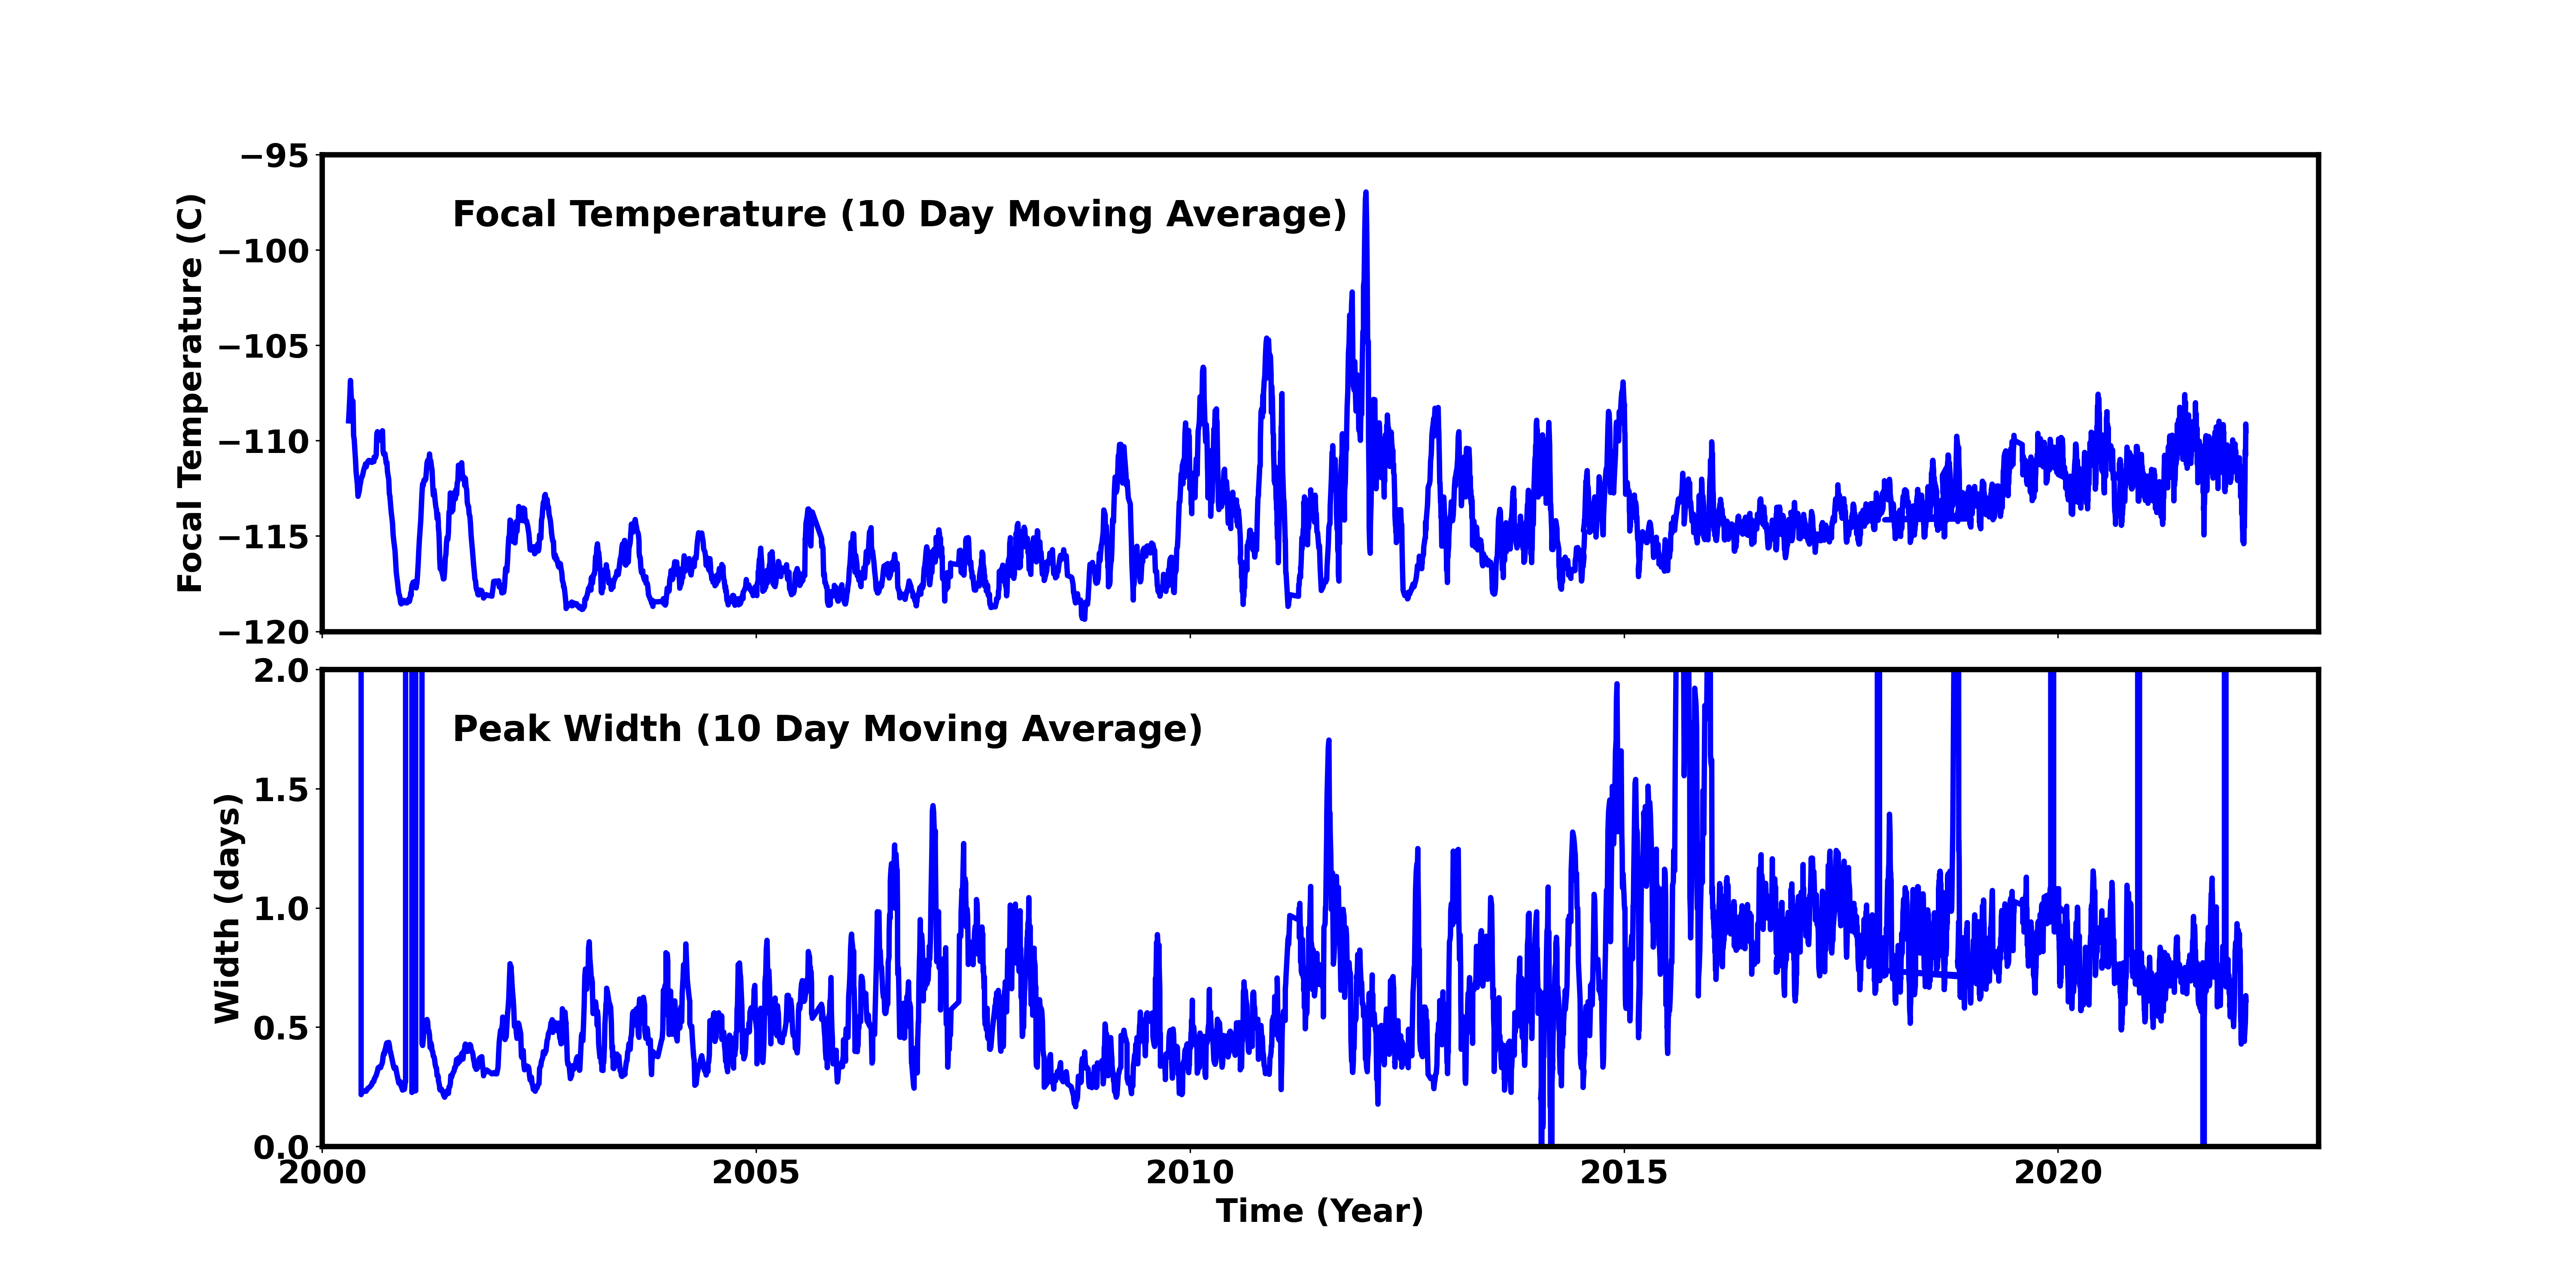
Focal Plane Temperature
Feb 2022 Focal Temperature
| The Mean (max) FPT: | |
|---|---|
| -112.65 | +/- 4.32 C |
| Mean Width: | |
| 0.54 | +/- 0.22 days |
Averaged Focal Plane Temperature
We are using 10 period moving averages to show trends of peak temperatures and peak widths. Note, the gaps in the width plot are due to missing/corrupted data.
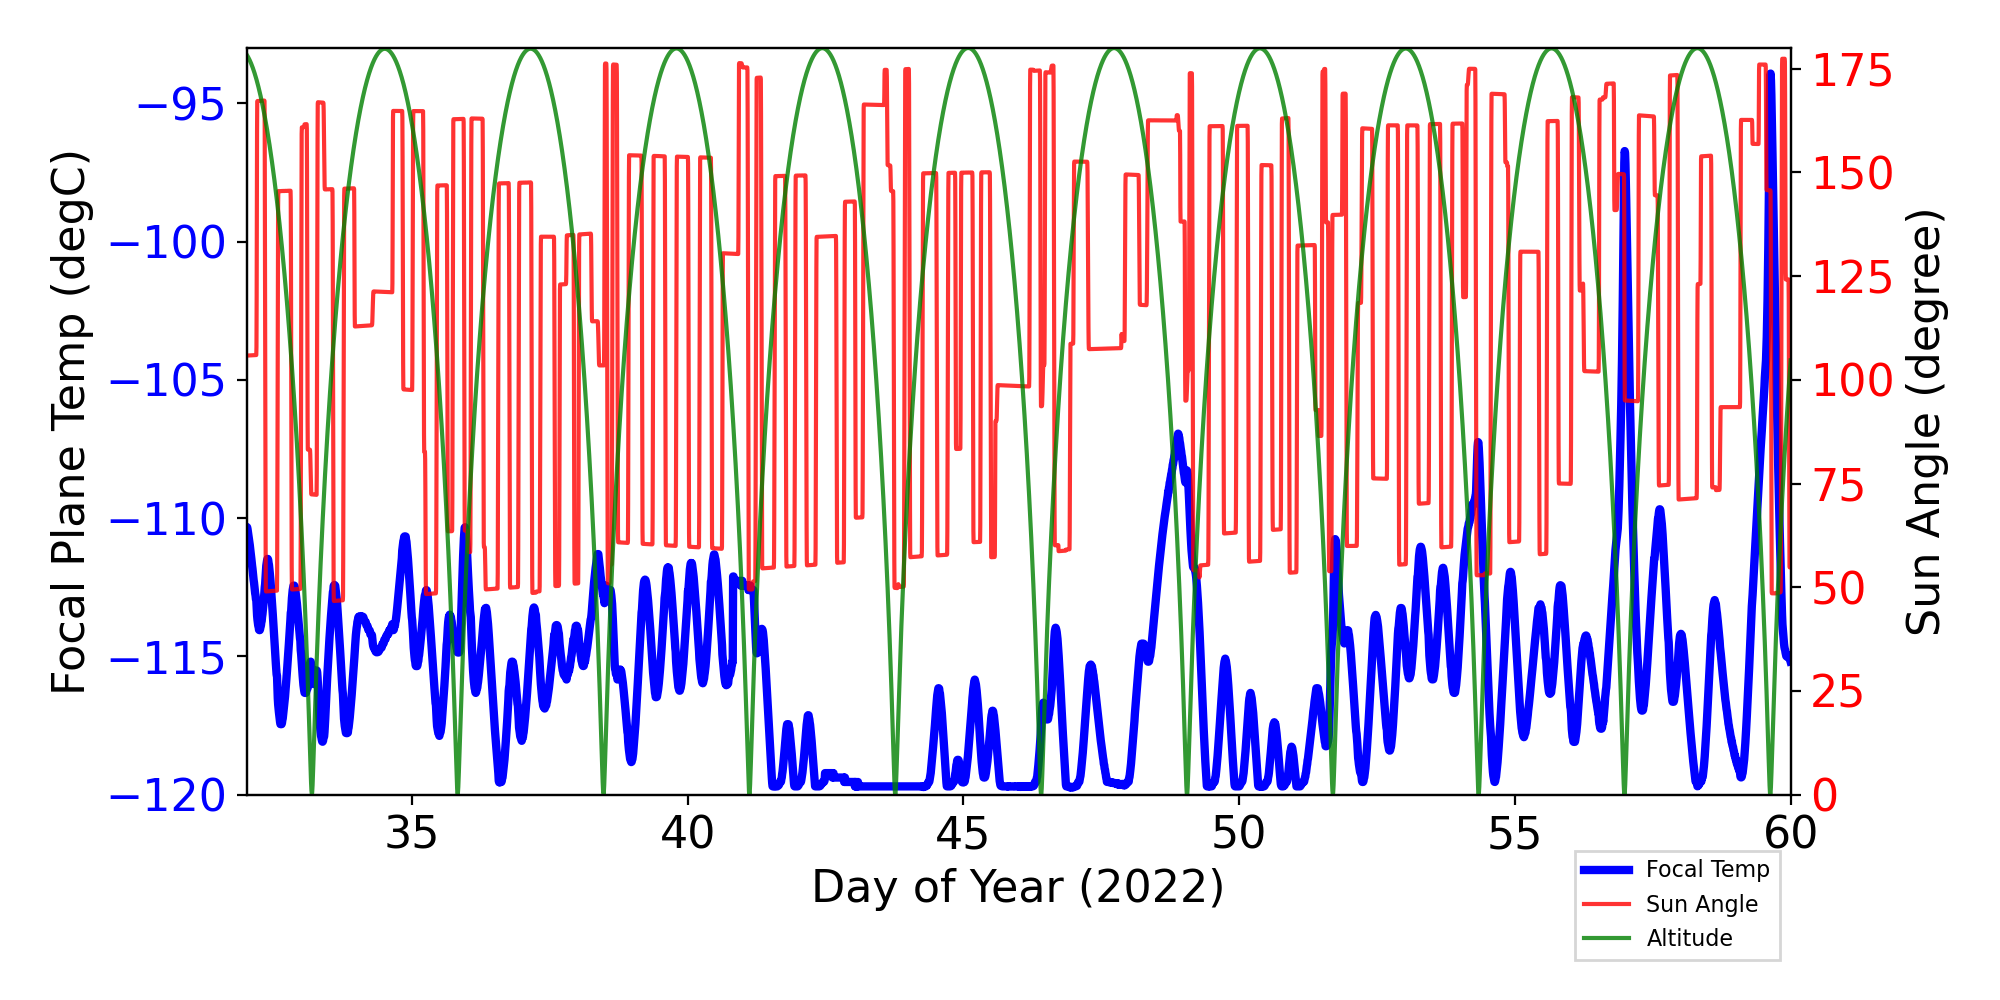
Focal Plane Temperature, Sun Angle and Altitude
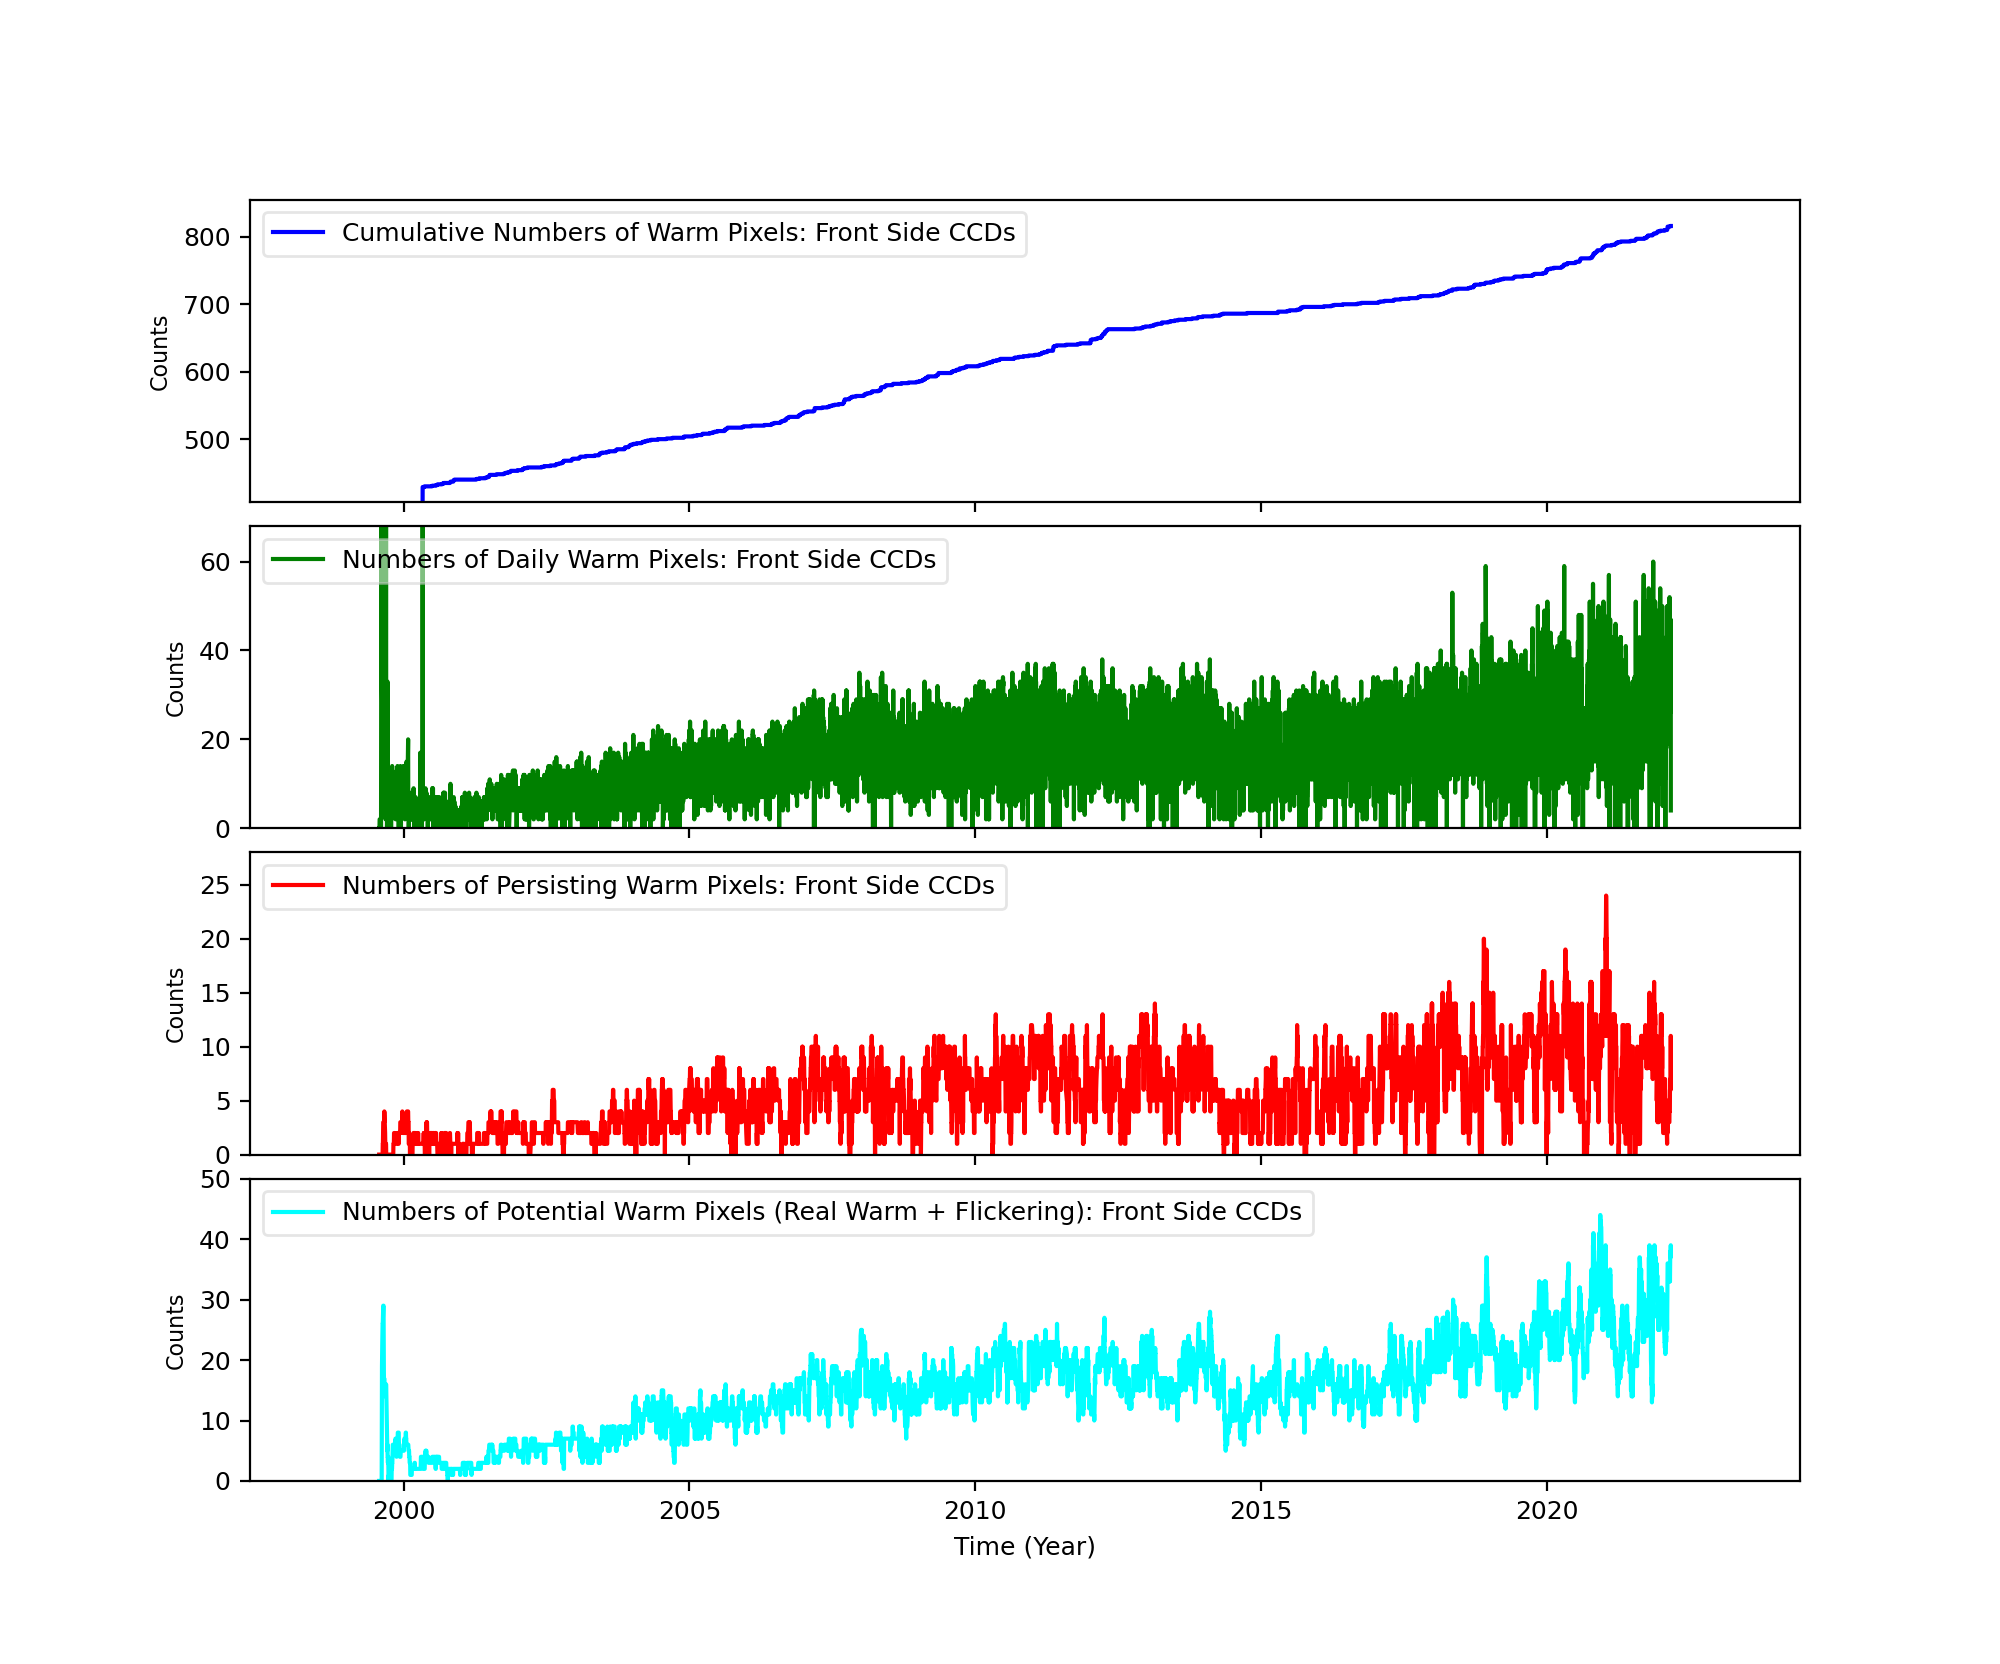
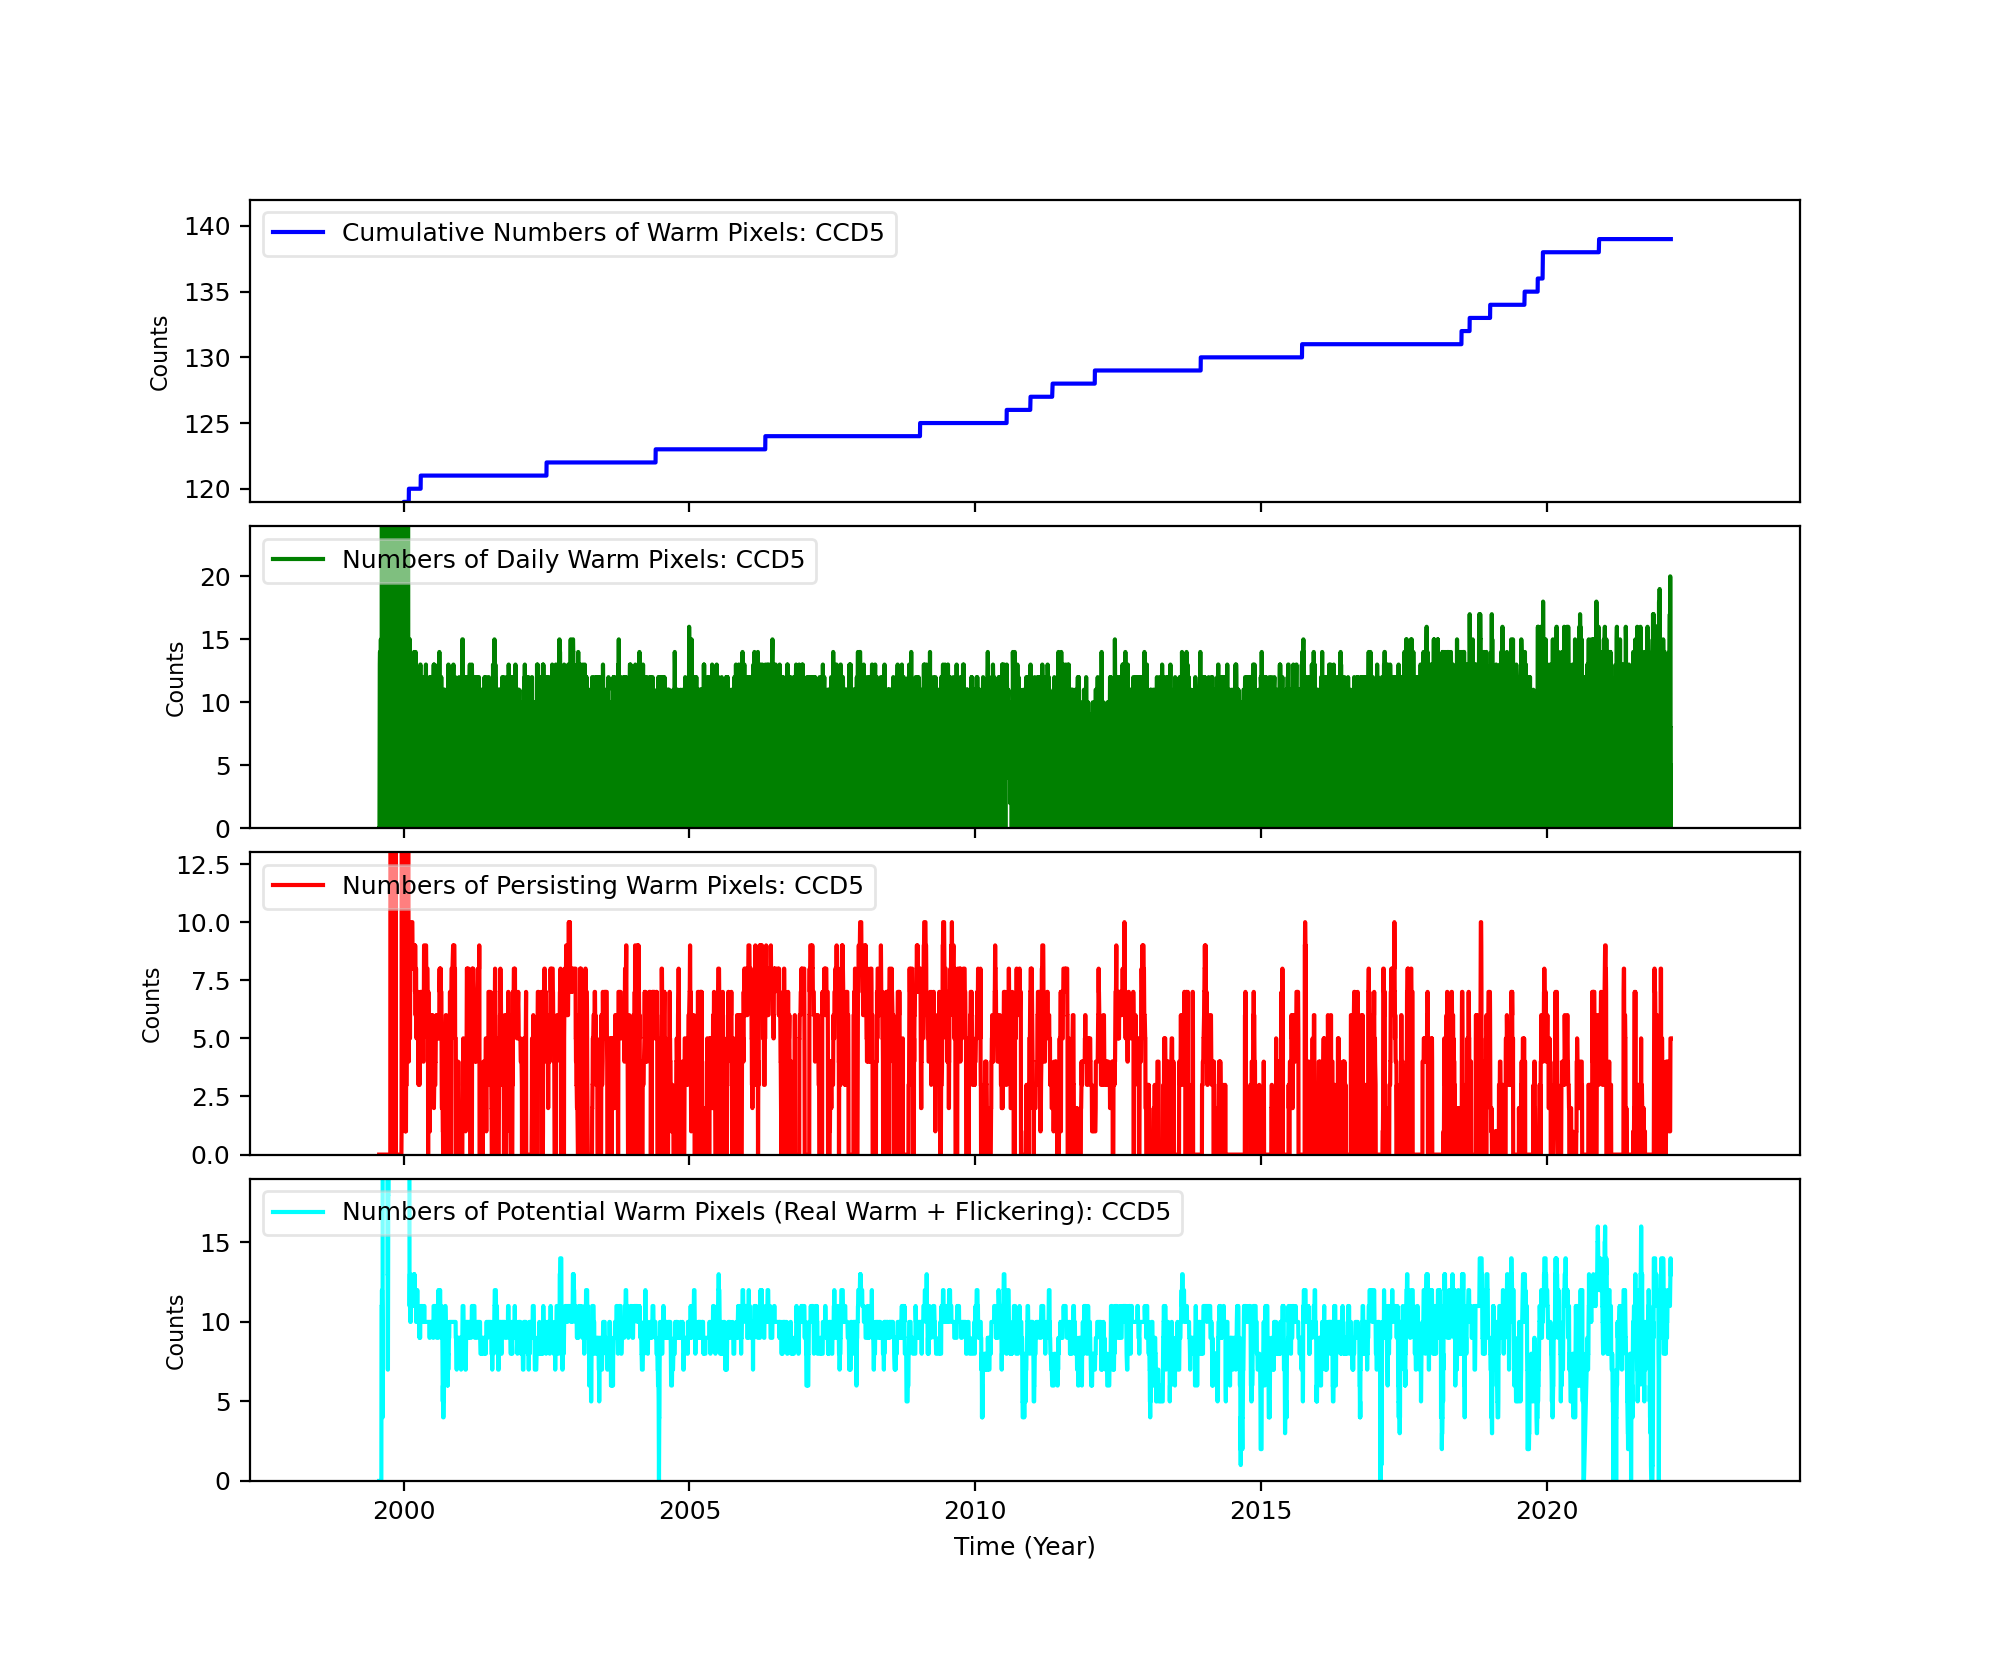
Bad Pixels
The plots below were generated with a new warm pixel finding script. Please see Acis Bad Pixel Page for details.
Front Side CCDs
Back Side CCD (CCD5)
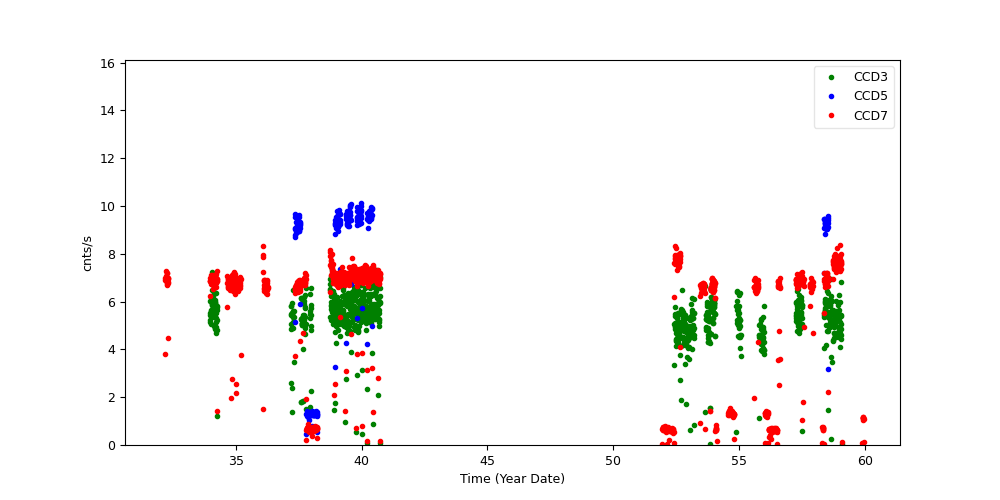
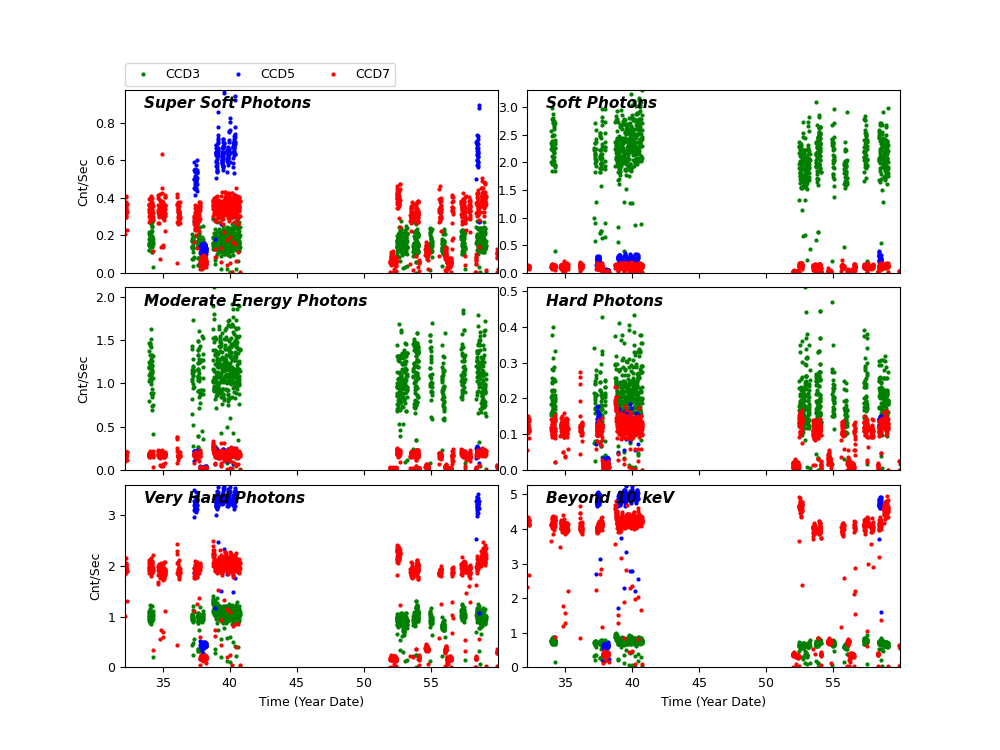
Science Instrument Background Rates
| Name | Low (keV) | High(KeV) | Description |
|---|---|---|---|
| SSoft | 0.00 | 0.50 | Super soft photons |
| Soft | 0.50 | 1.00 | Soft photons |
| Med | 1.00 | 3.00 | Moderate energy photons |
| Hard | 3.00 | 5.00 | Hard Photons |
| Harder | 5.00 | 10.00 | Very Hard photons |
| Hardest | 10.00 | Beyond 10 keV |
HRC
DOSE of Central 4K Pore-Pairs
Please refer to Maximum Dose Trends for more details.
No Data
)
IMAGE                       NPIX      MEAN    STDDEV      MIN       MAX
HRCI_08_1999_02_2022.fits  16777216	na	na	na	na
No Data
)
IMAGE                       NPIX      MEAN    STDDEV      MIN       MAX
HRCS_08_1999_02_2022.fits  16777216	na	na	na	na
|
|
Max dose trend plots corrected for events that "pile-up"
in the center of the taps due to bad position information.
|
)
|
)
|
)
|
)
|
| Nov 2021 | Aug 2021 | May 2021 | Feb 2021 |
|---|
)
|
)
|
)
|
)
|
| Nov 2021 | Aug 2021 | May 2021 | Feb 2021 |
|---|
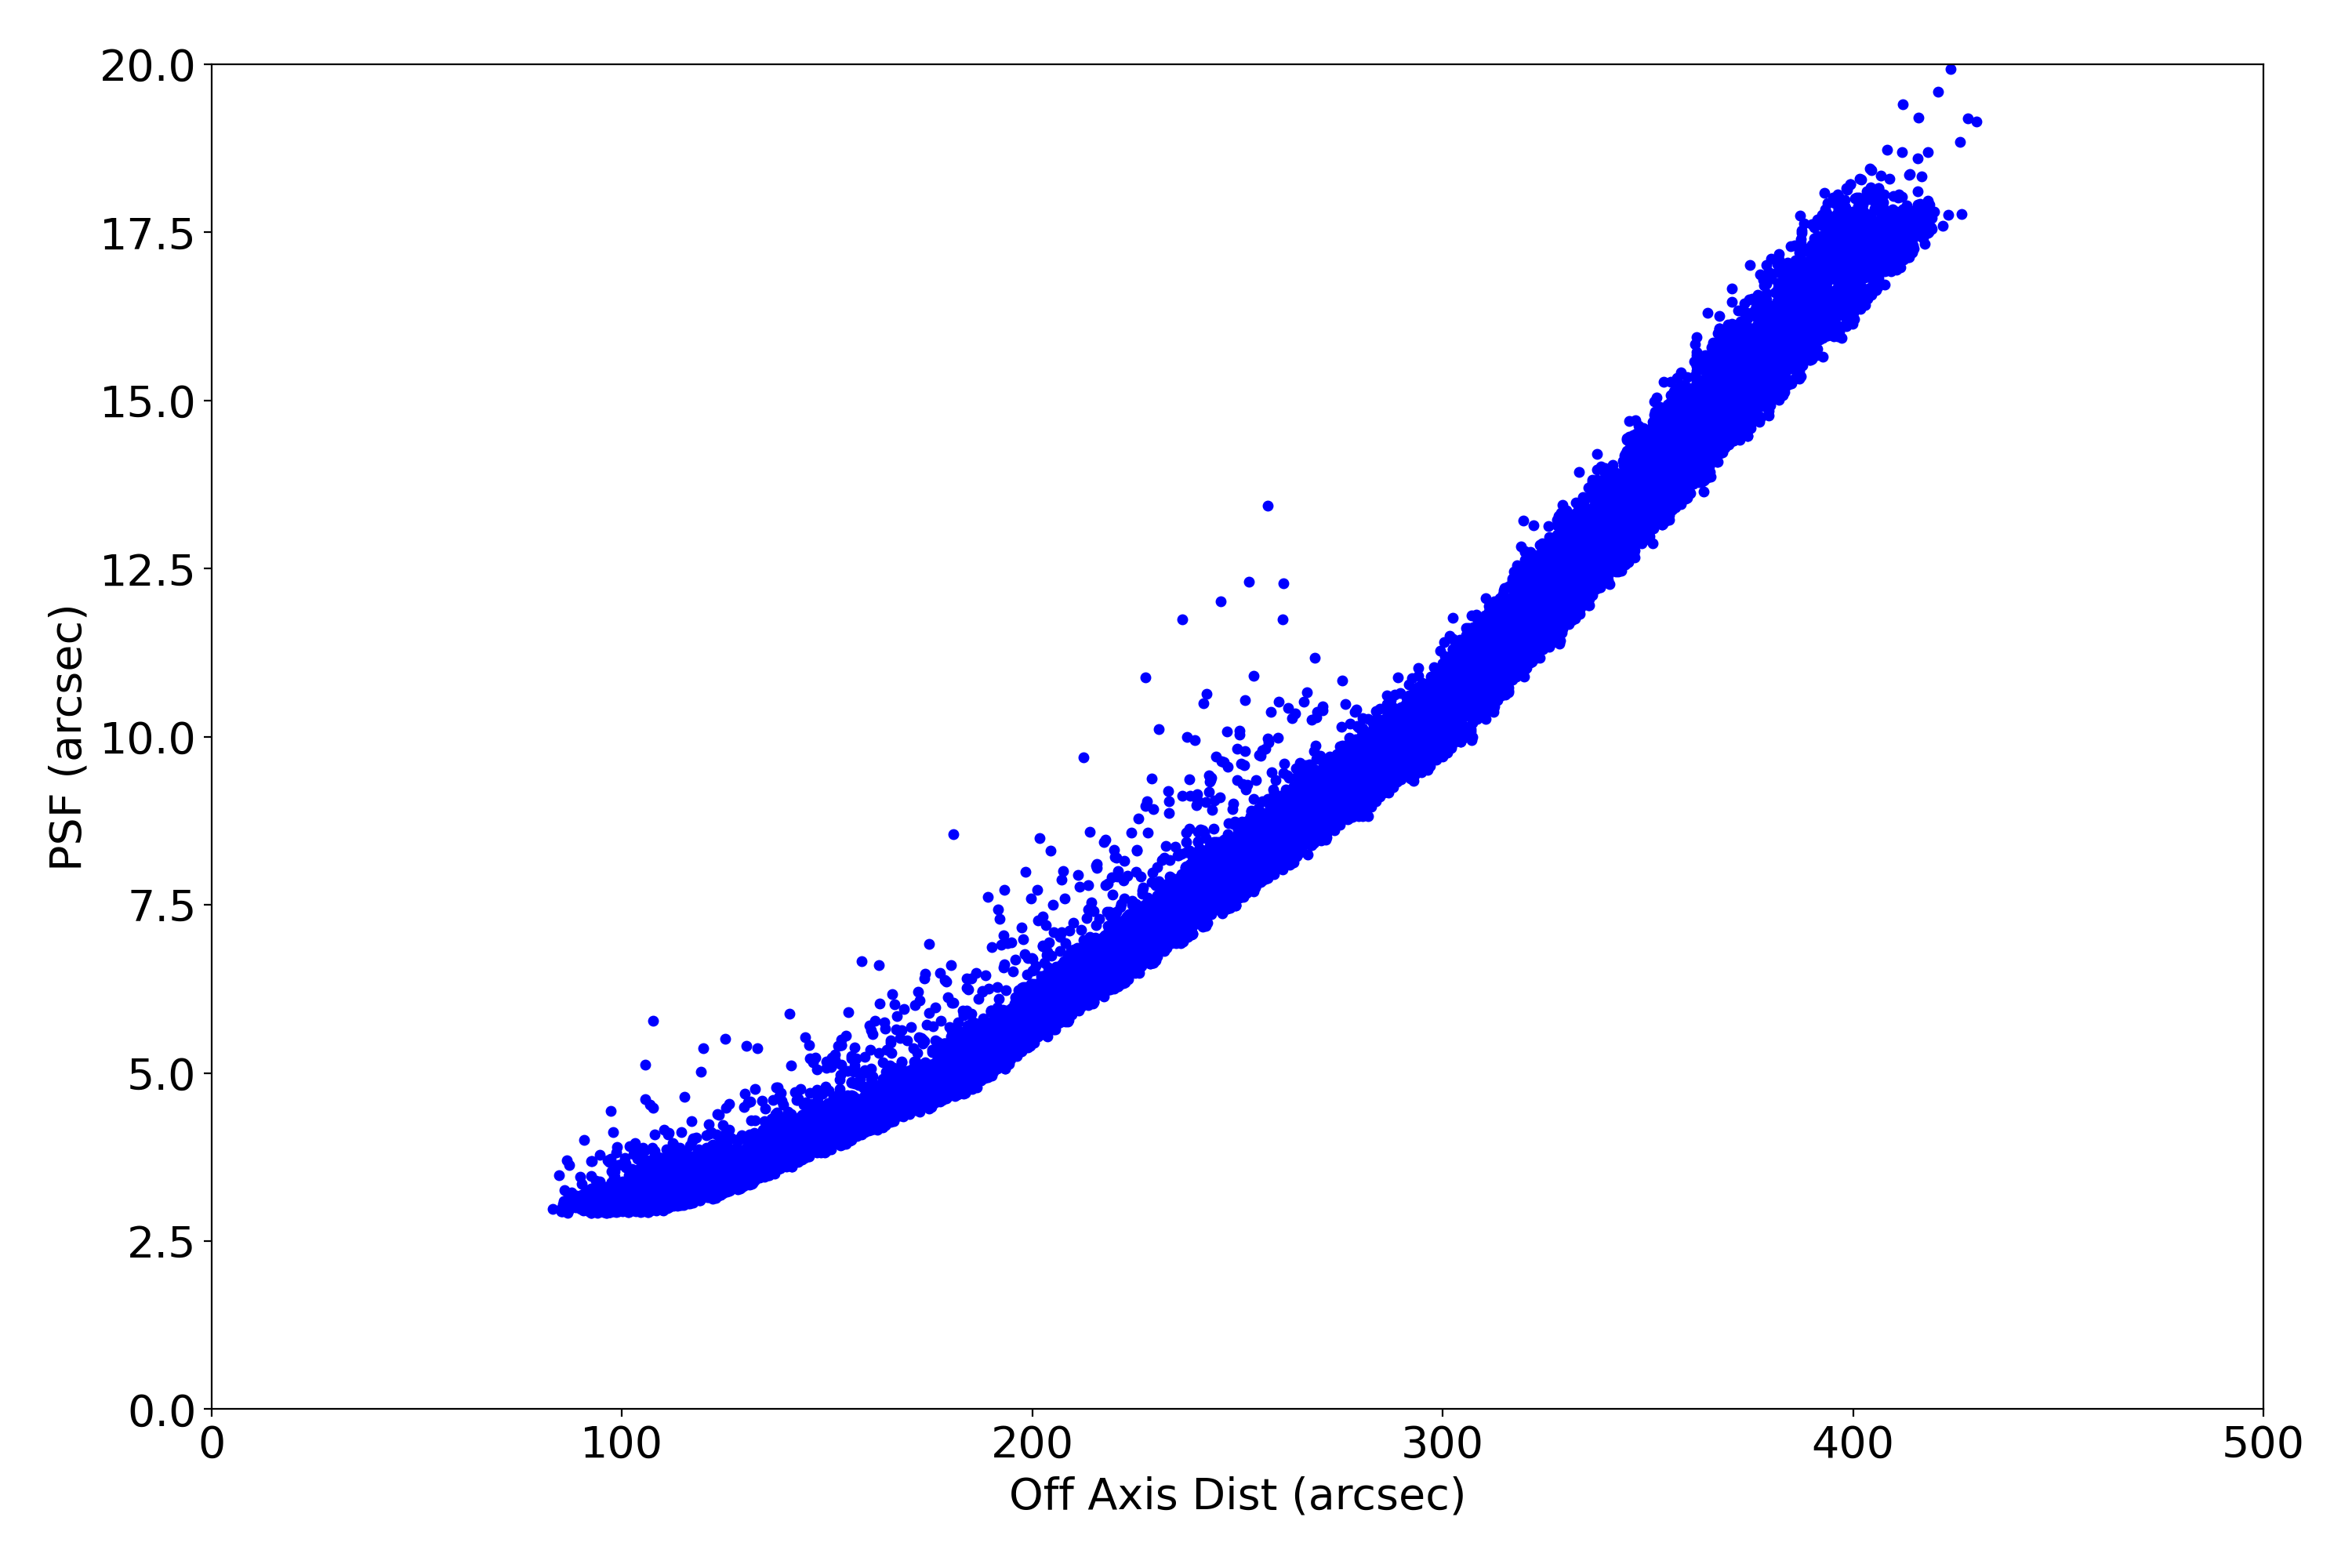
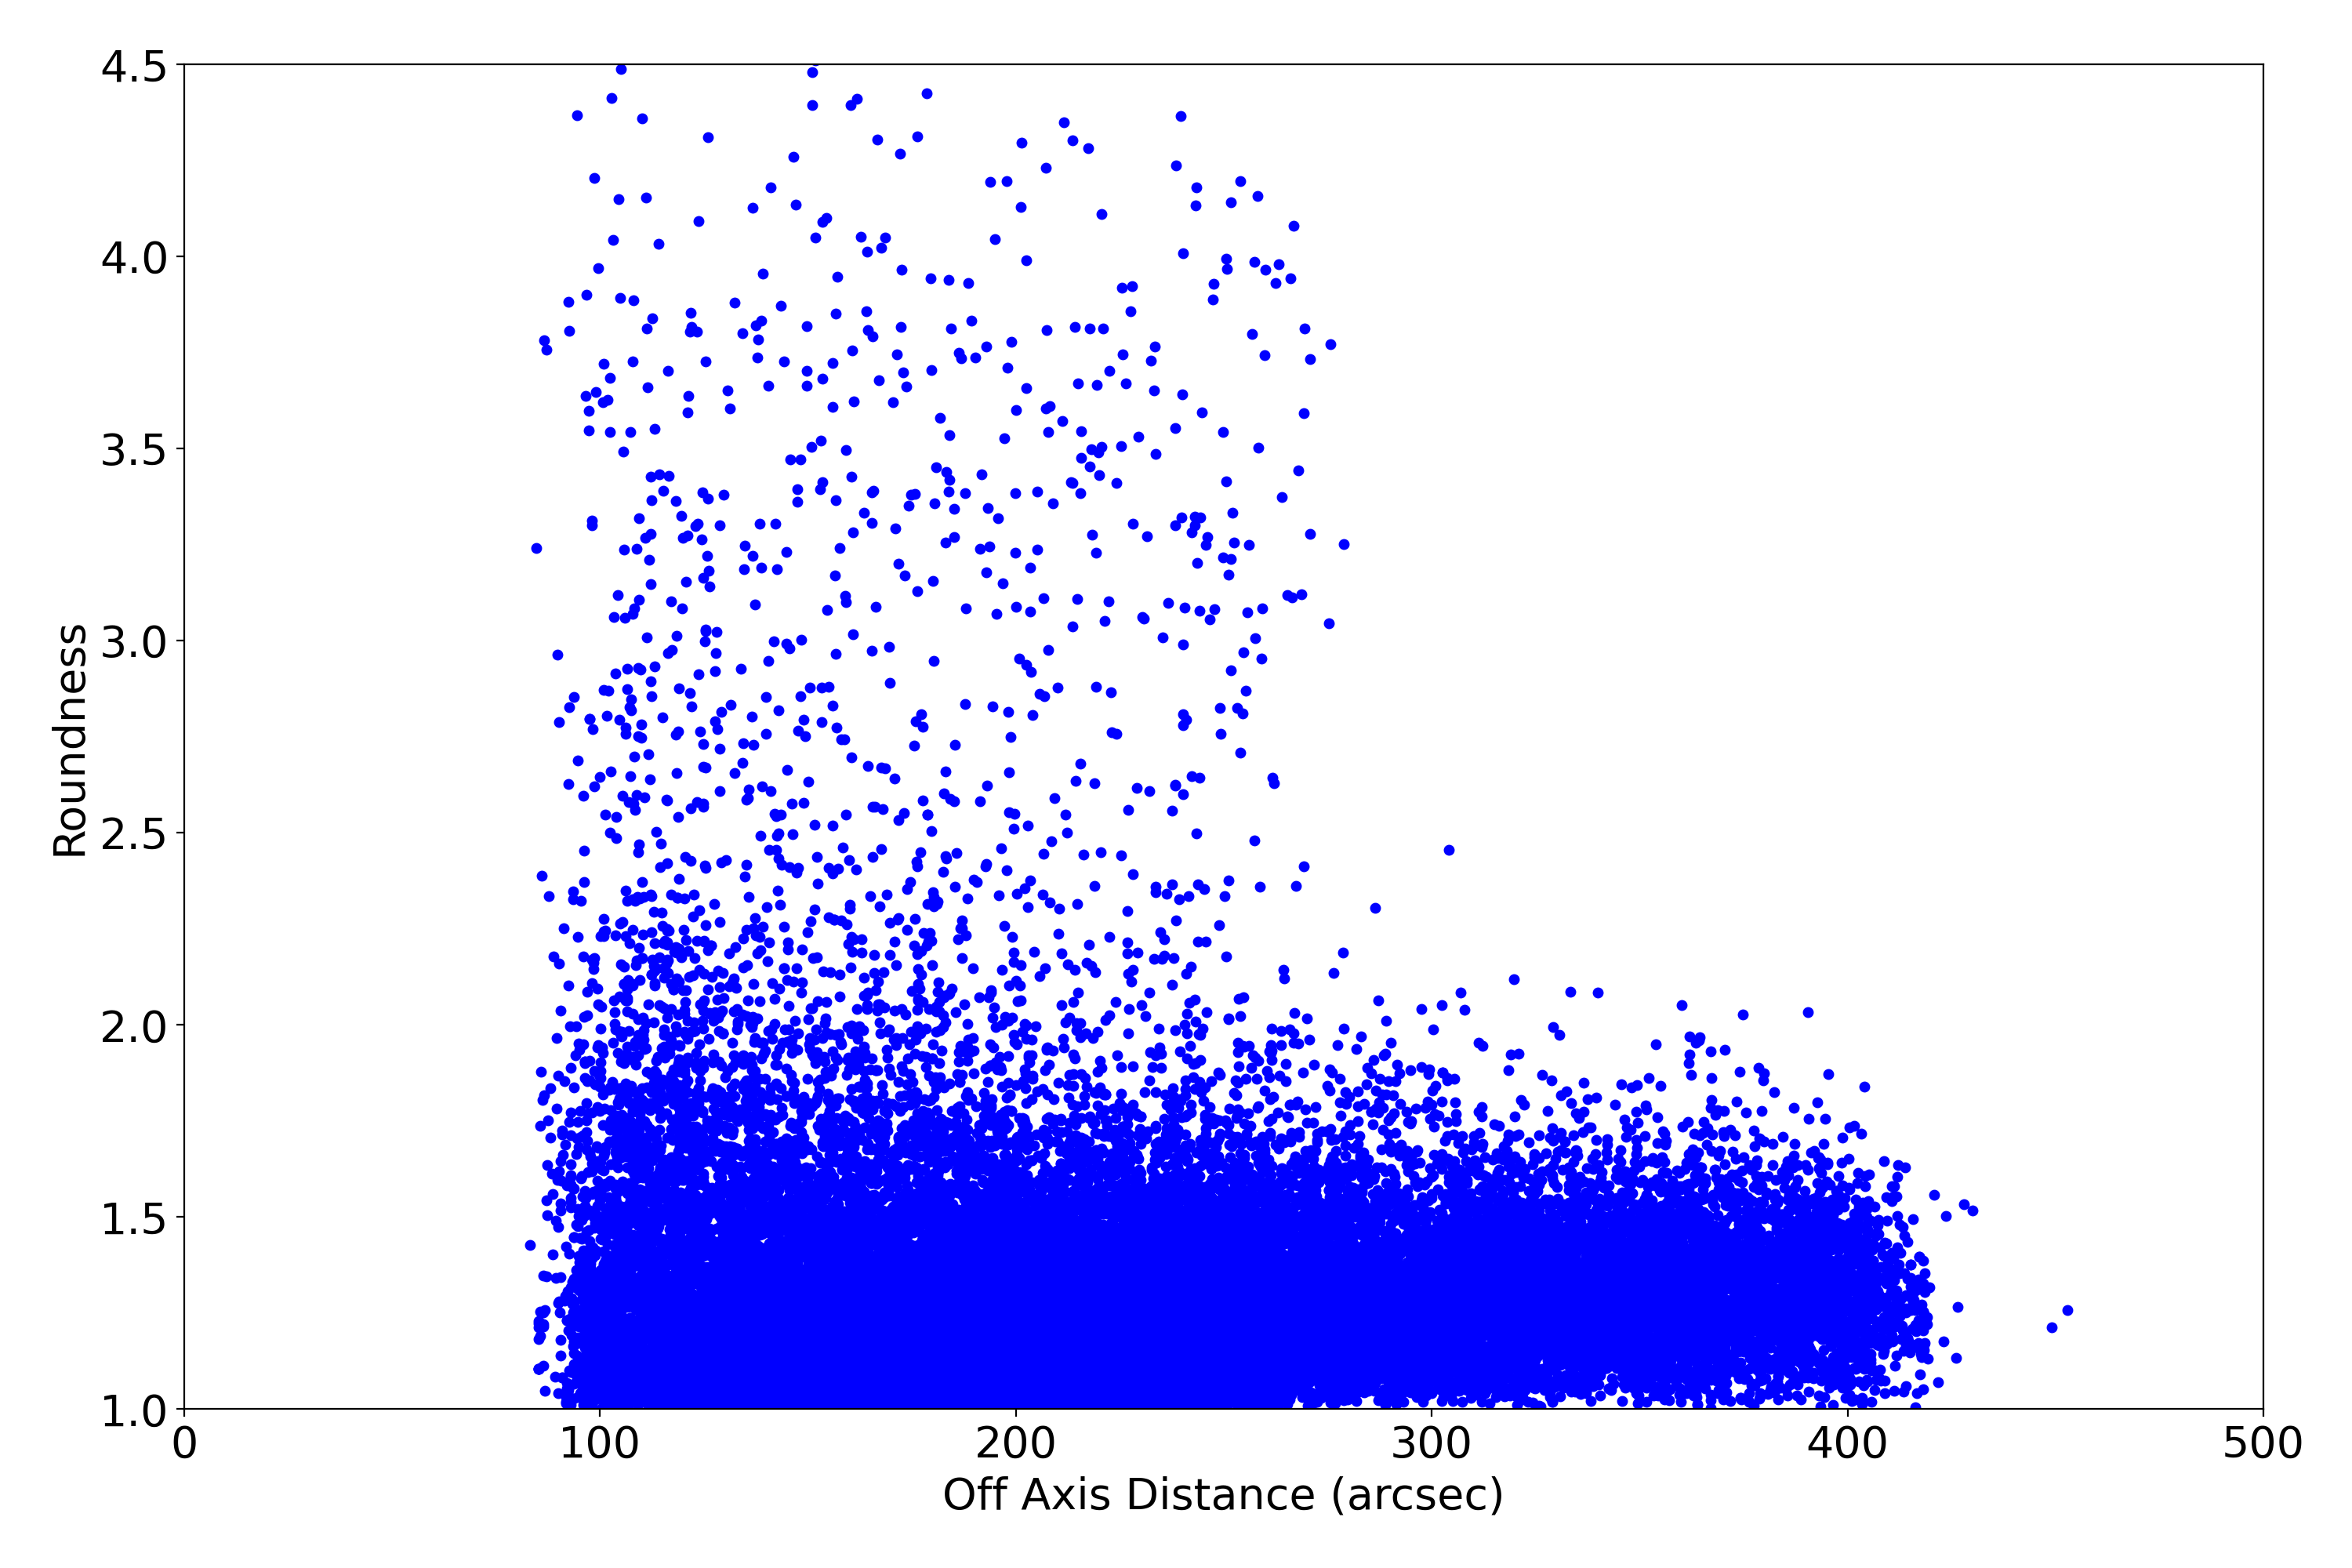
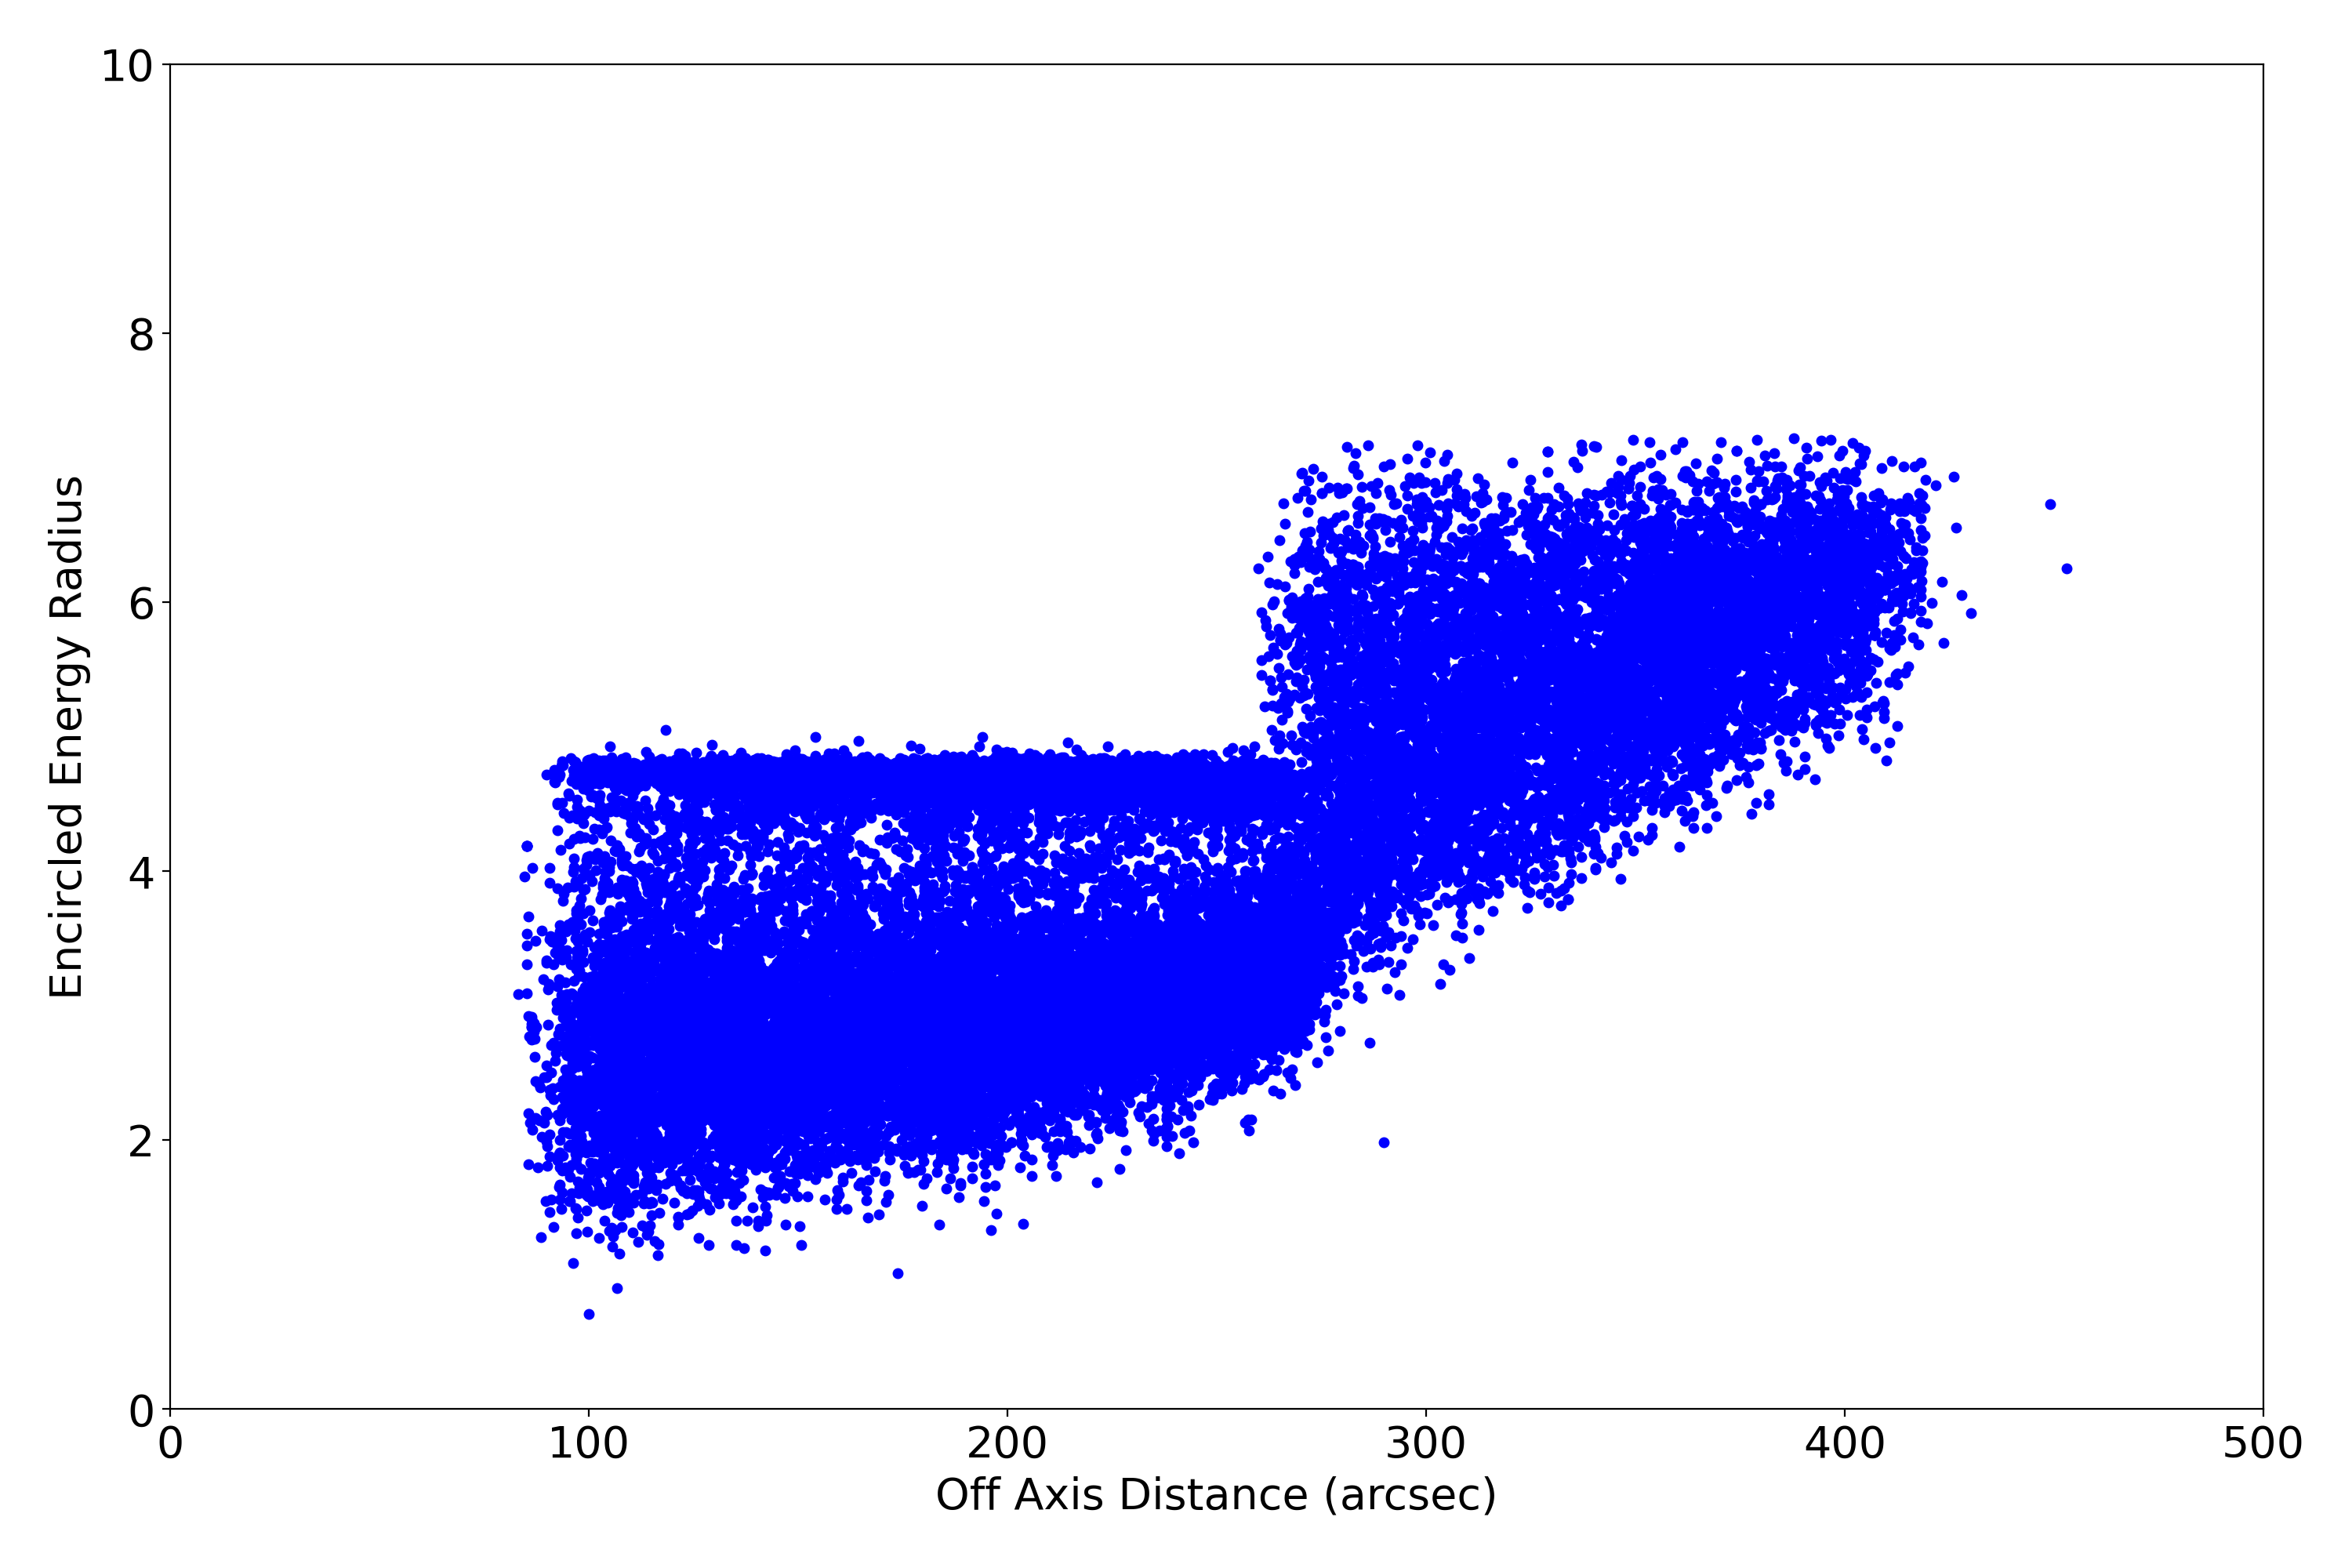
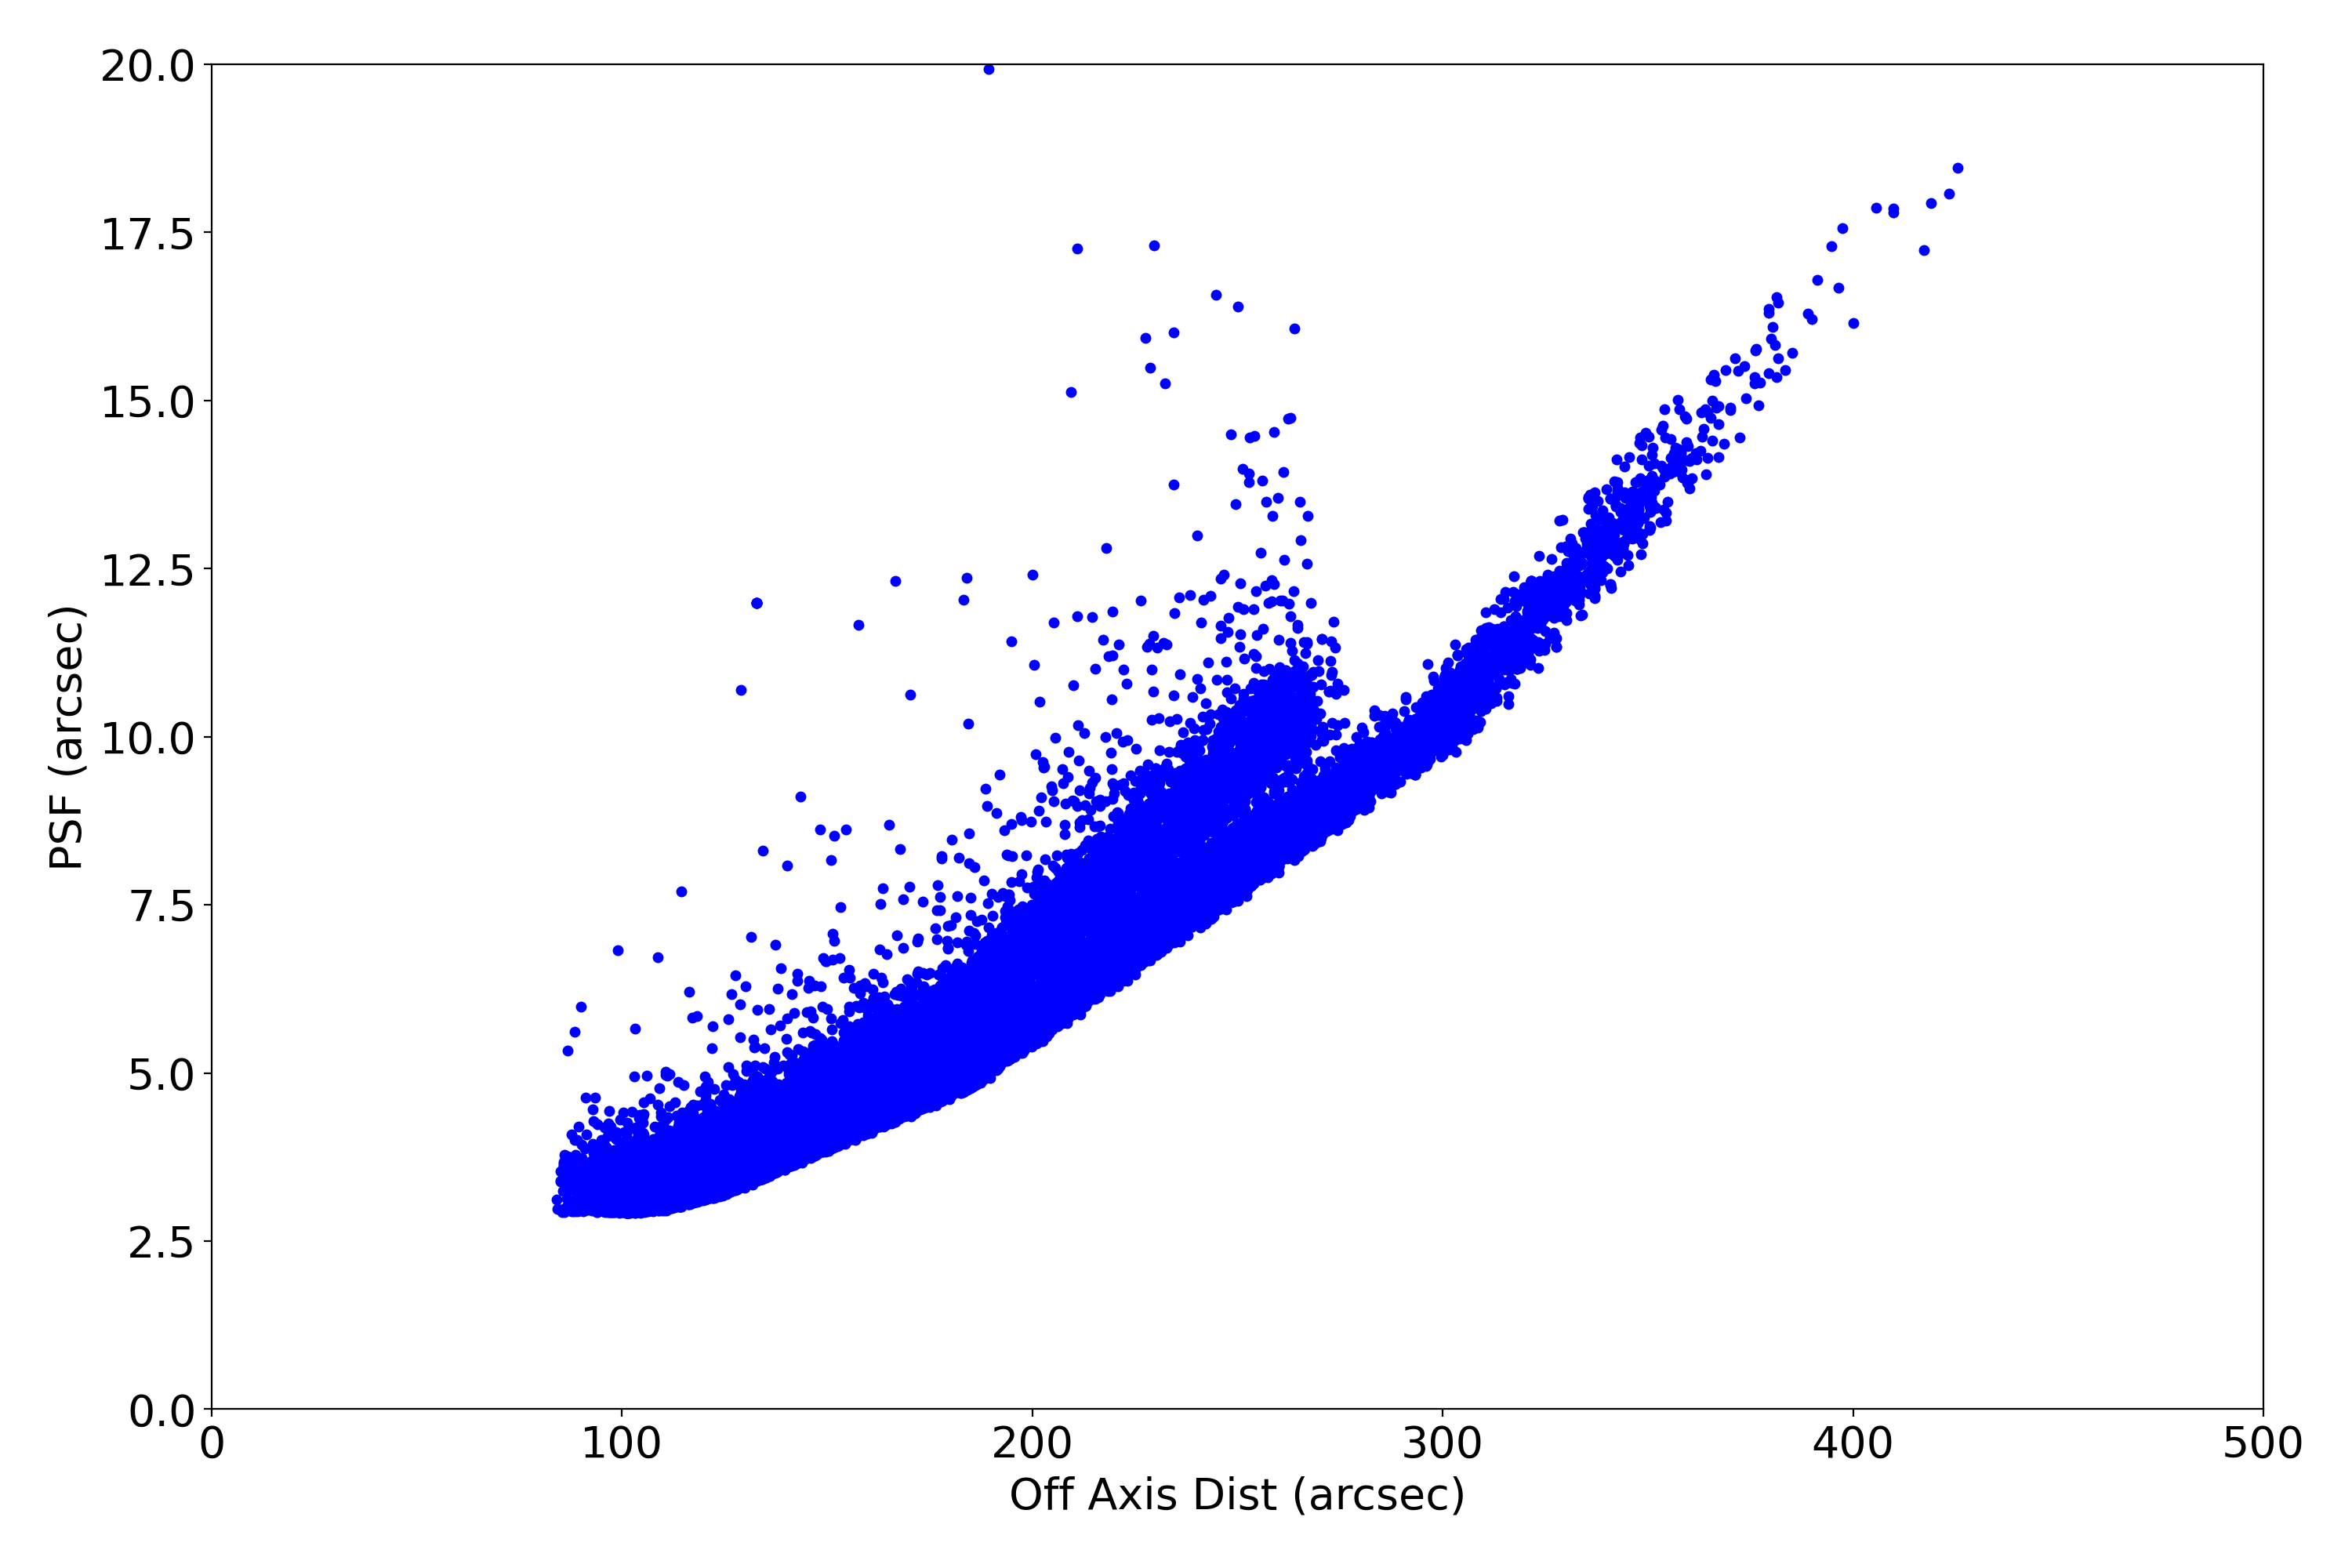
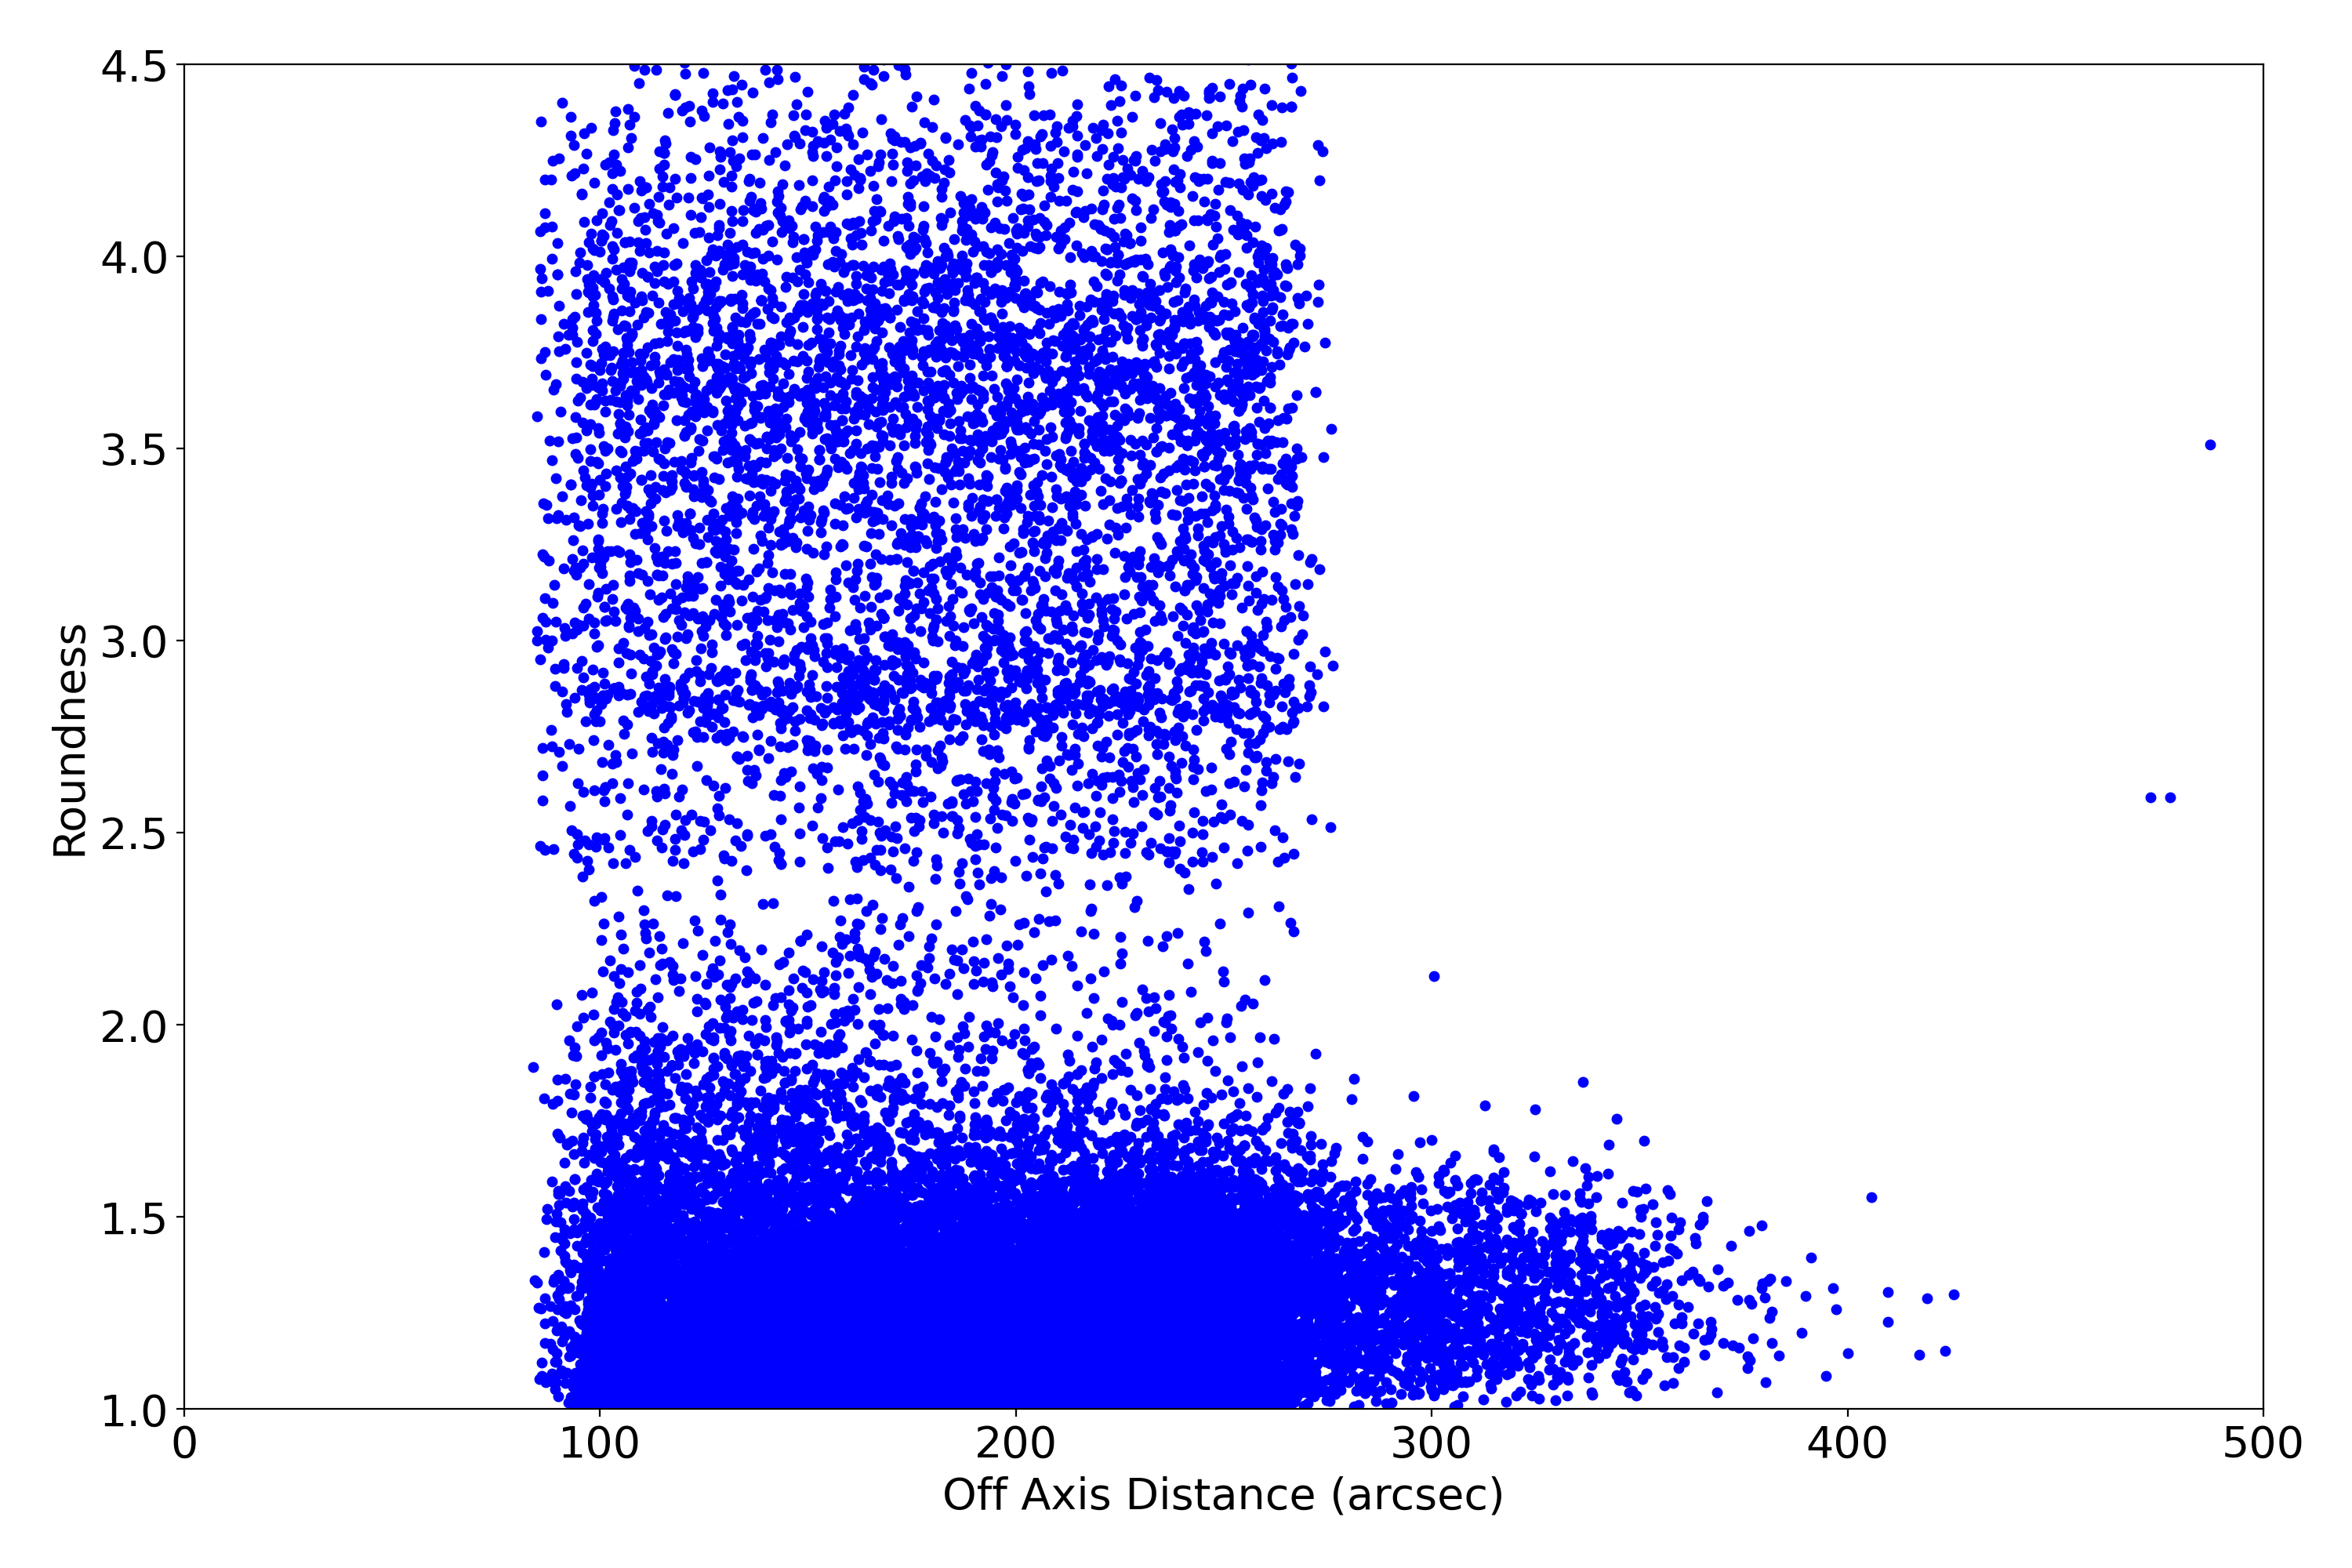
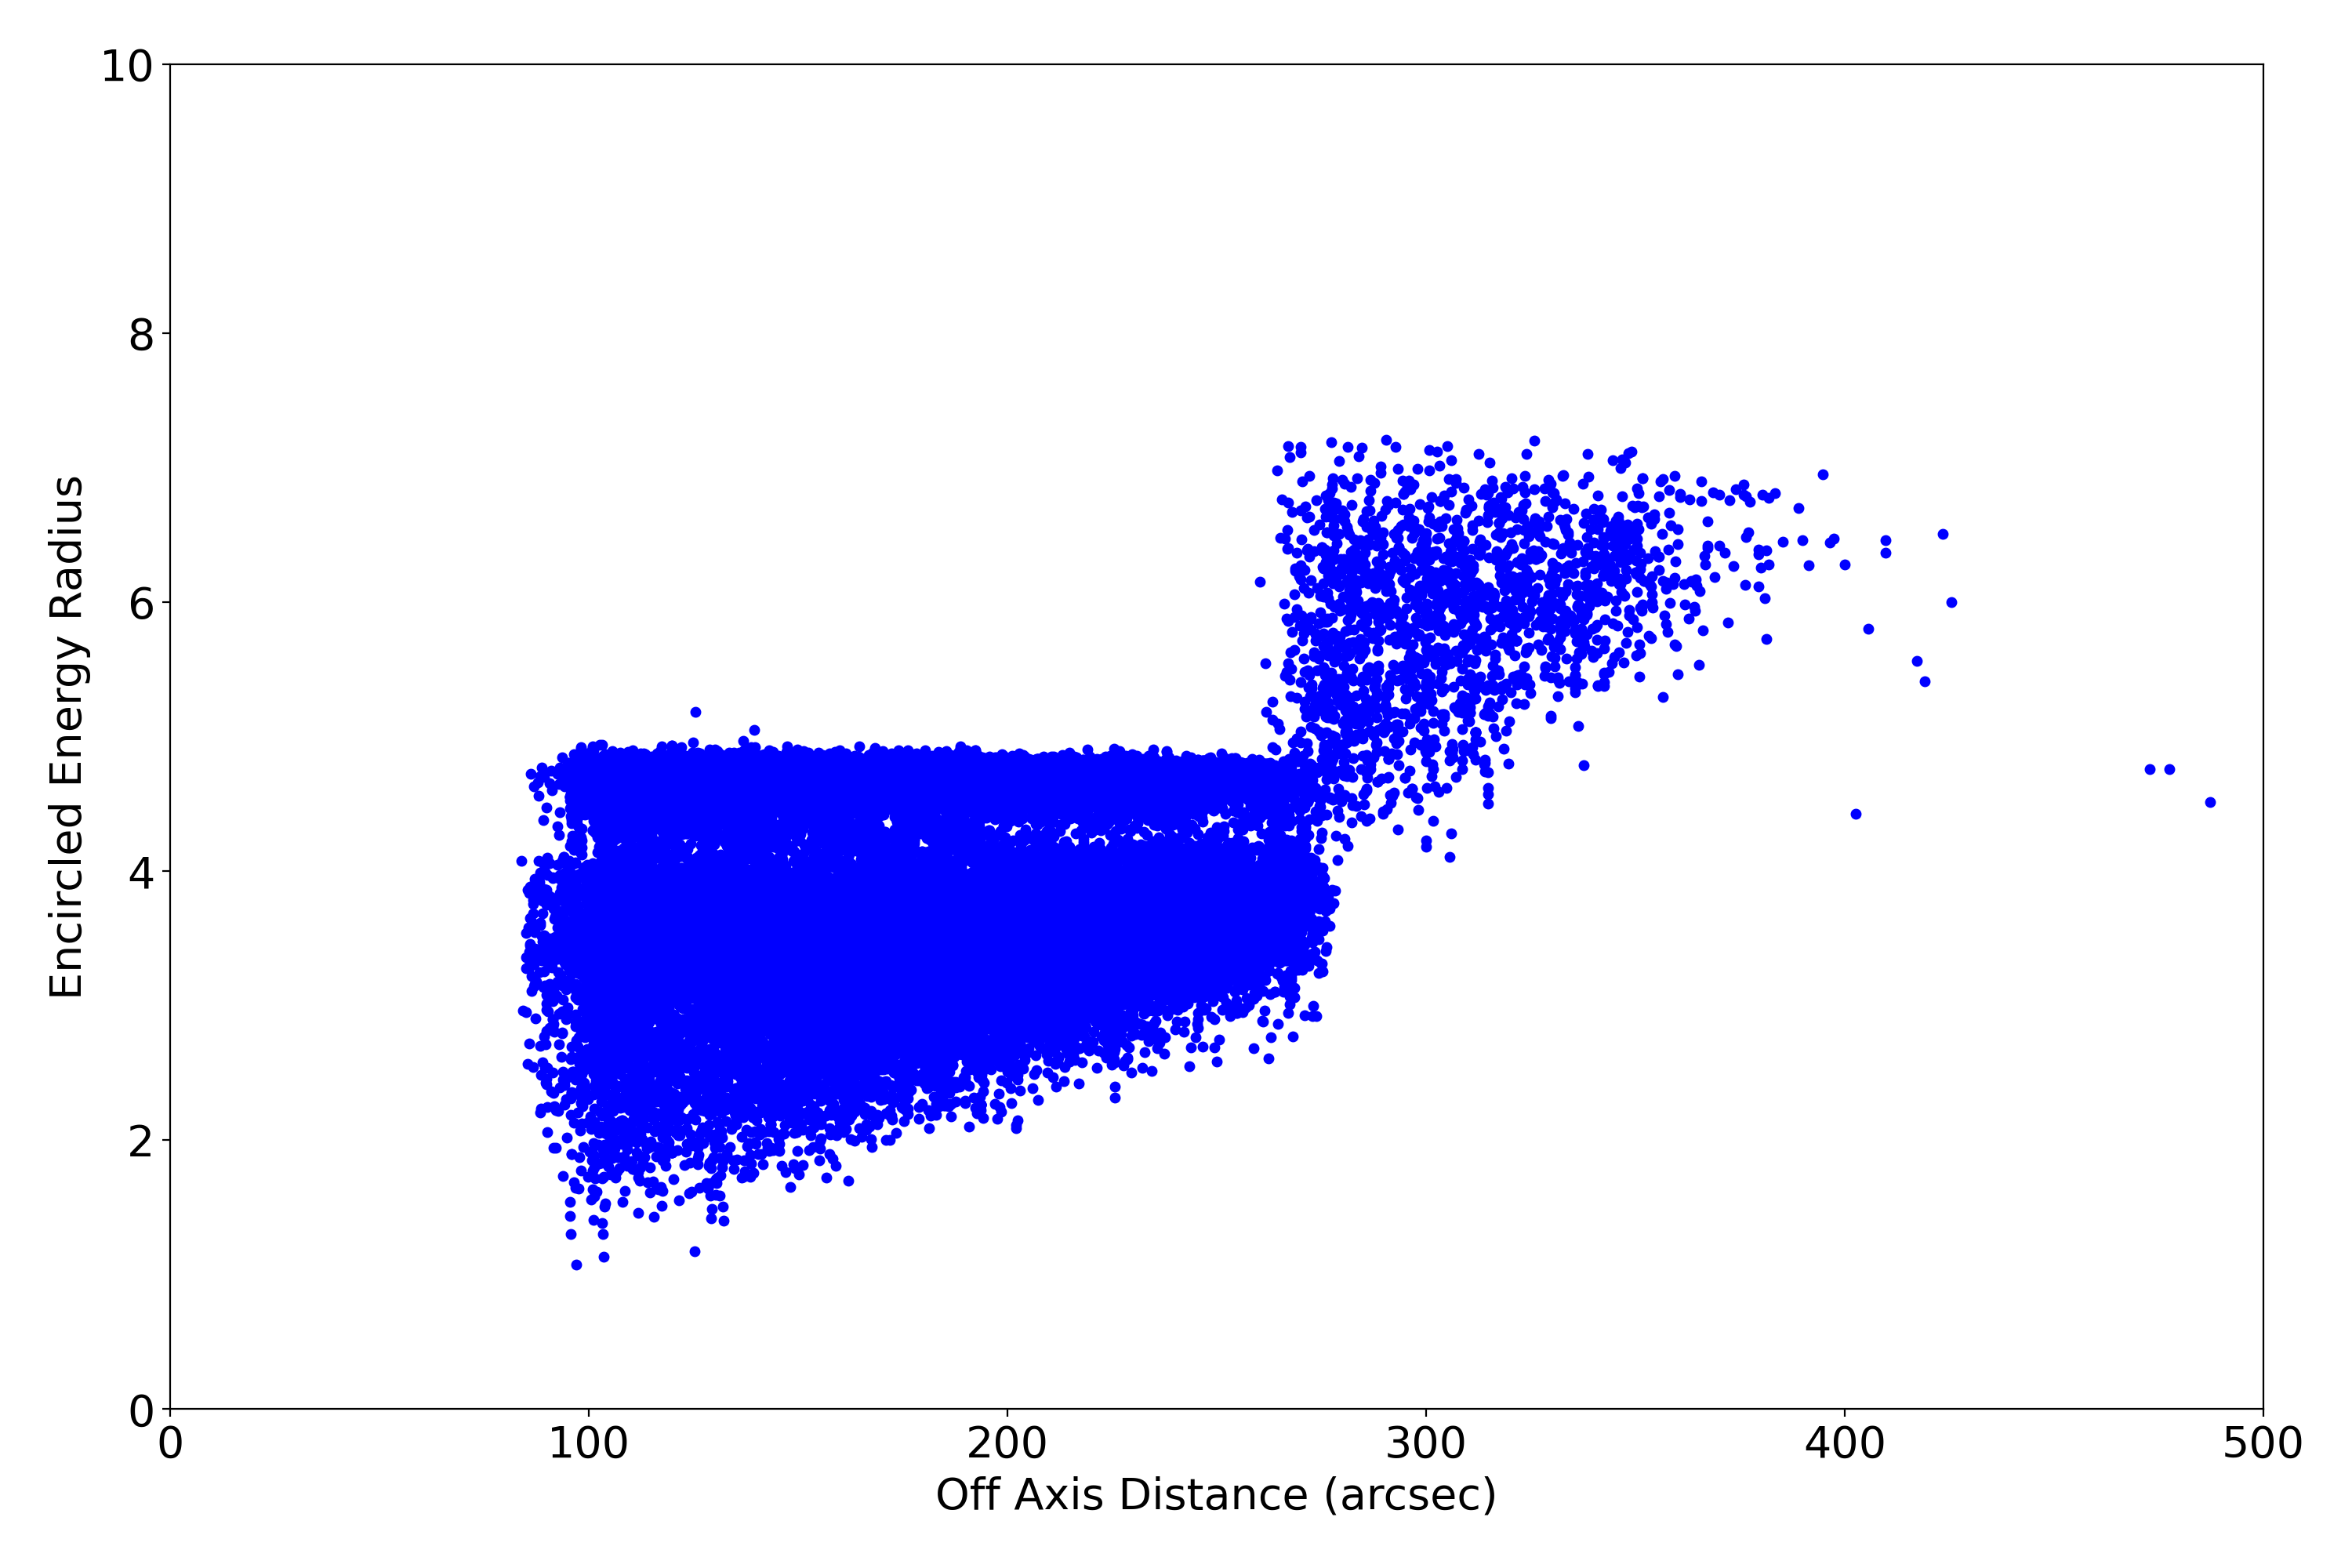
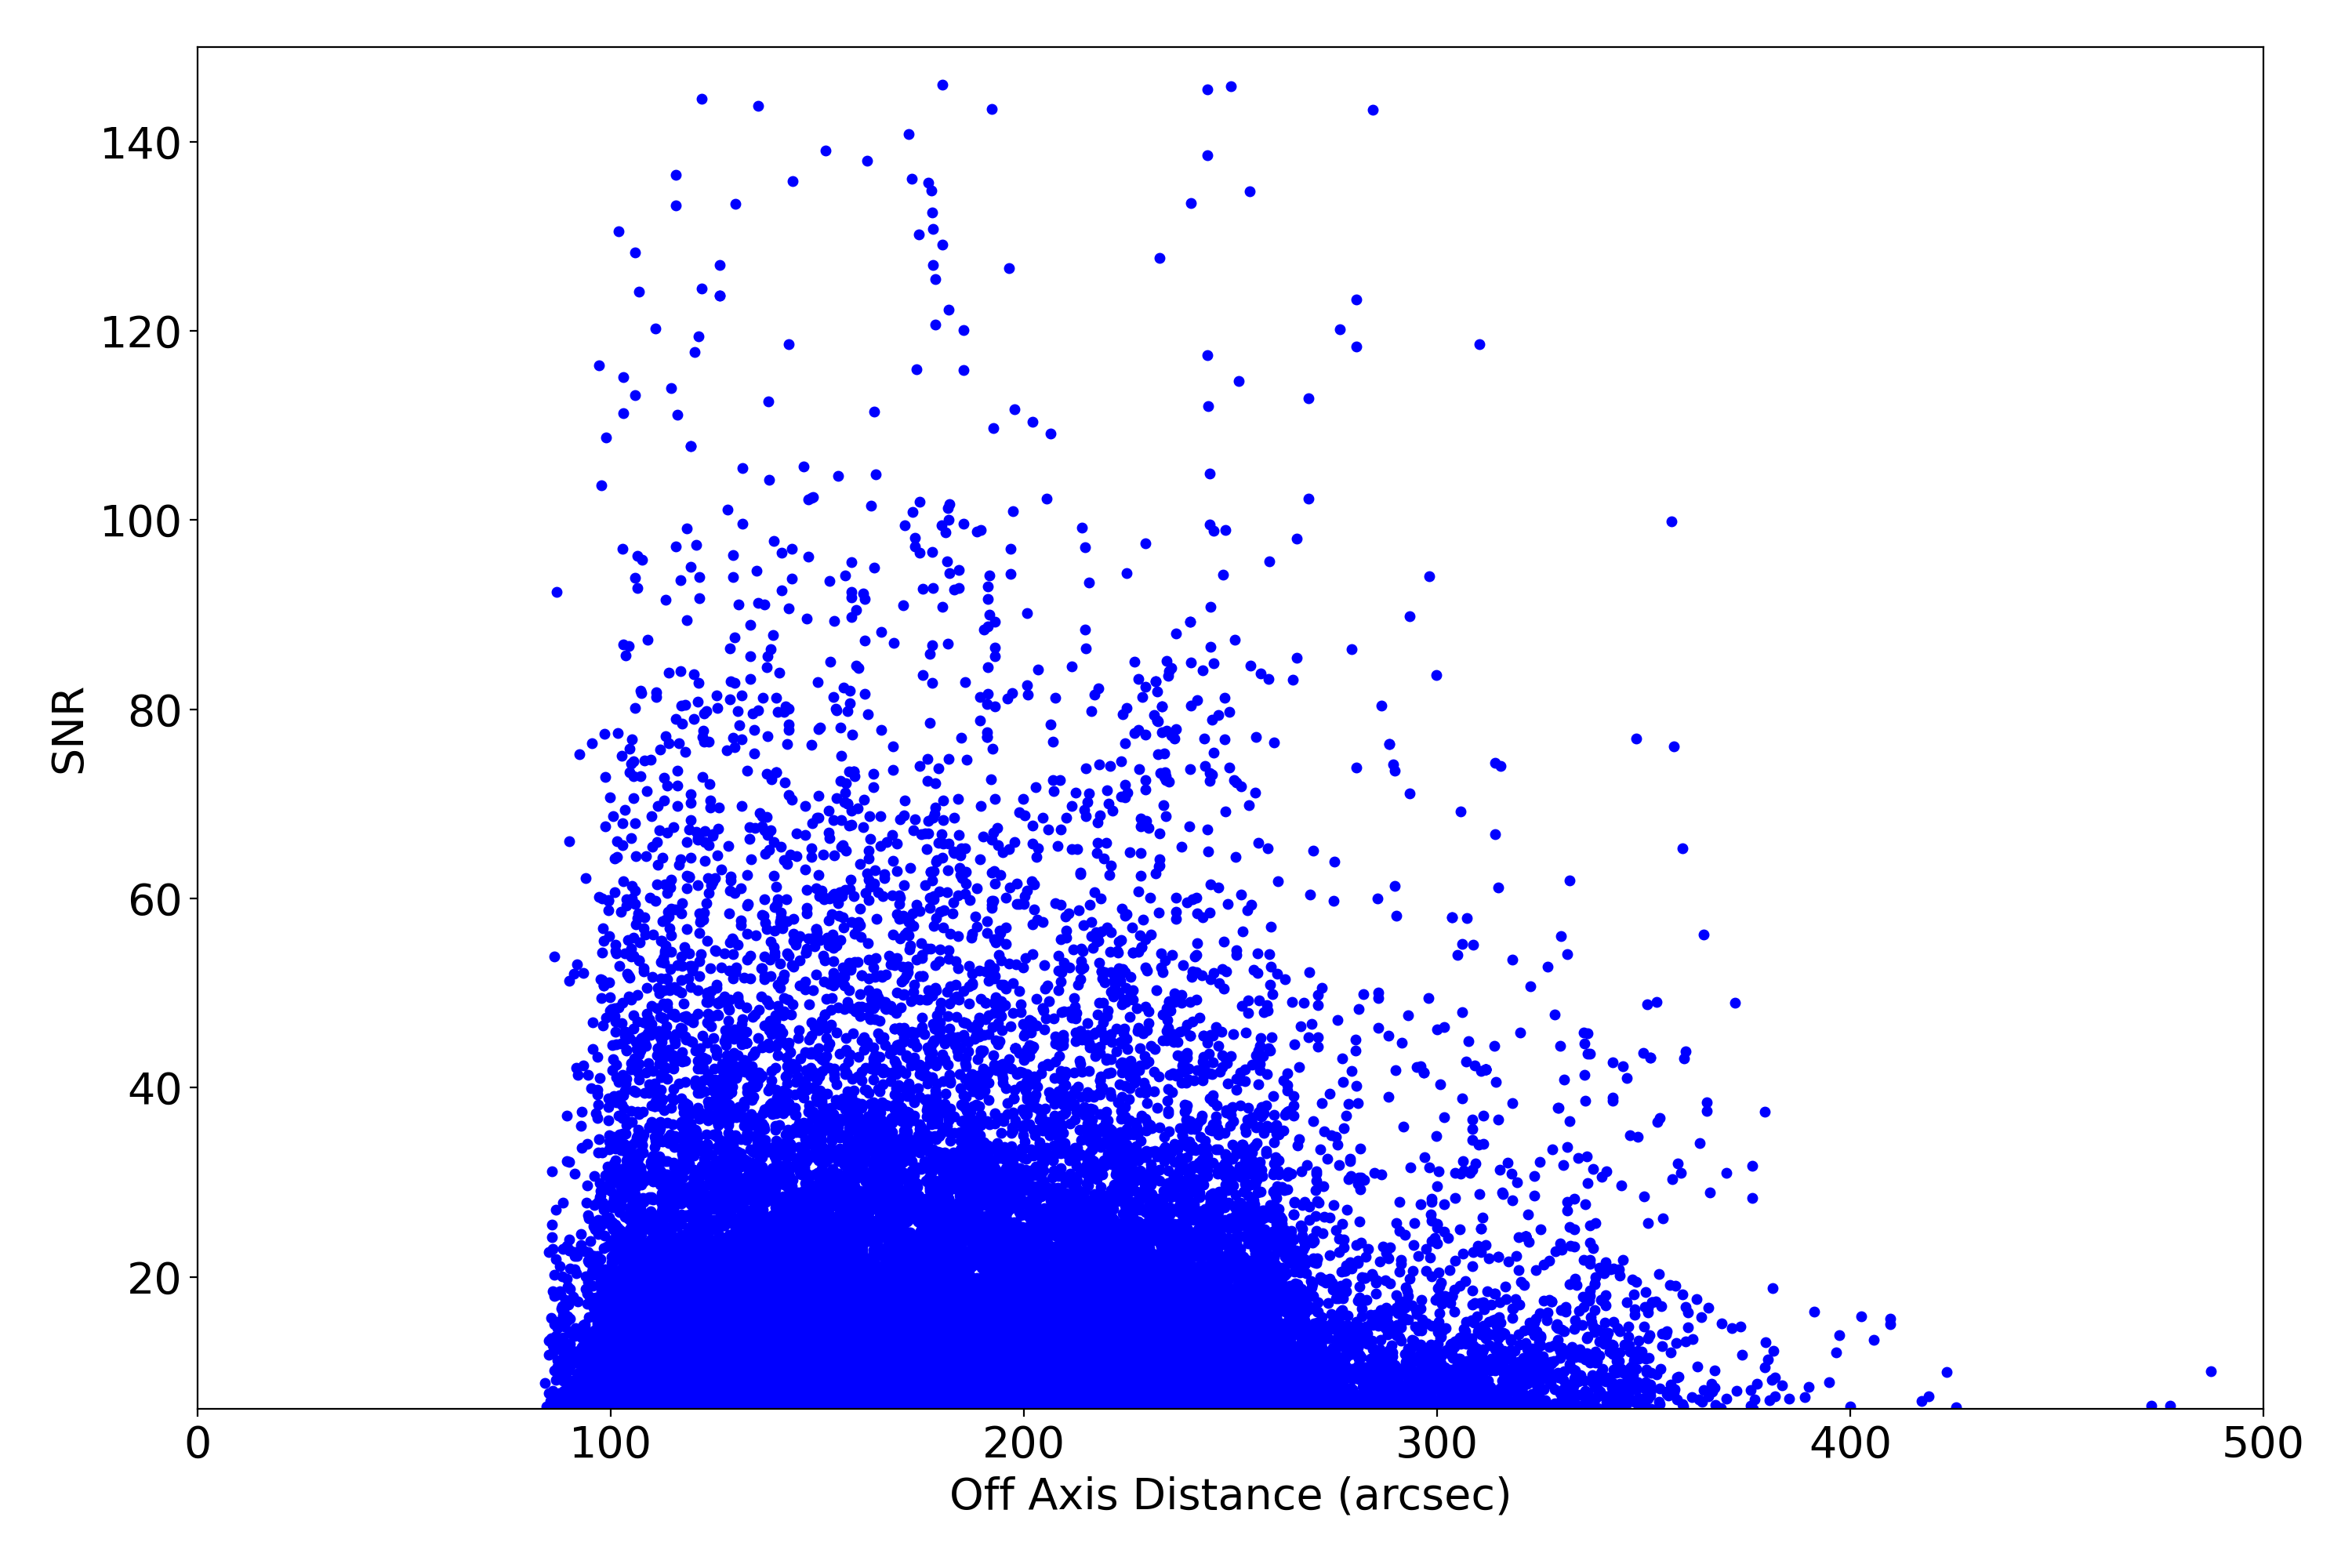
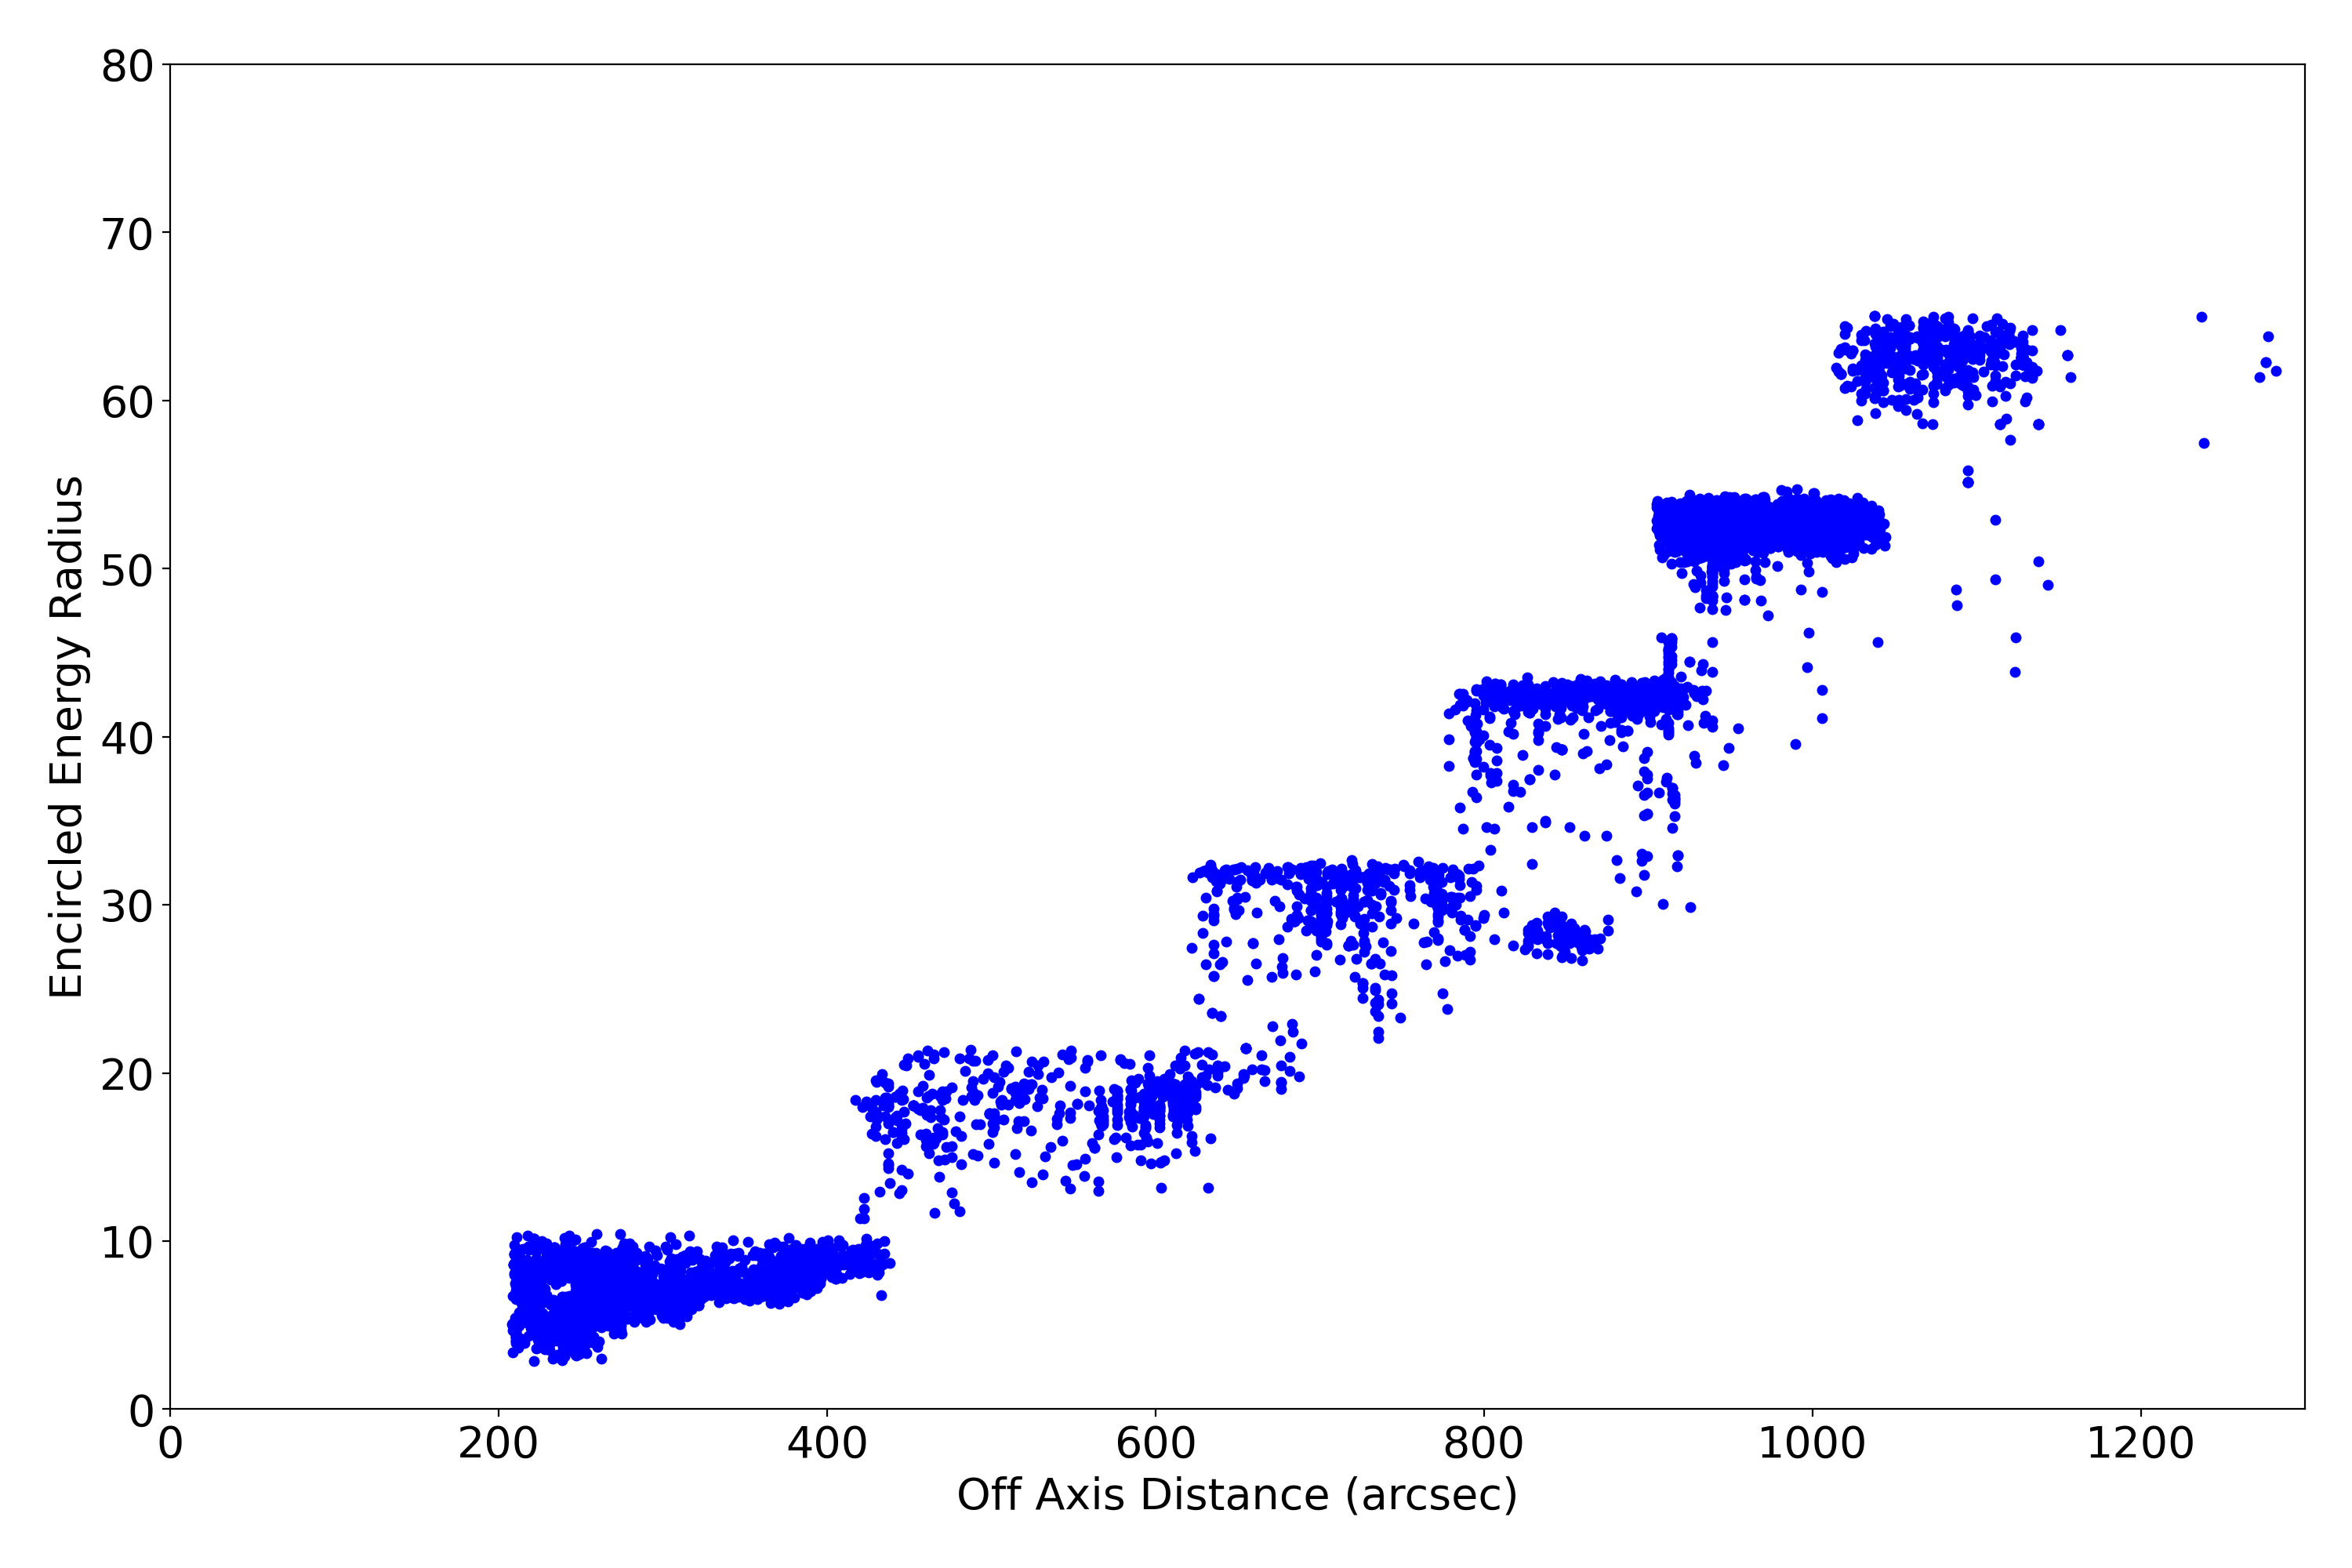
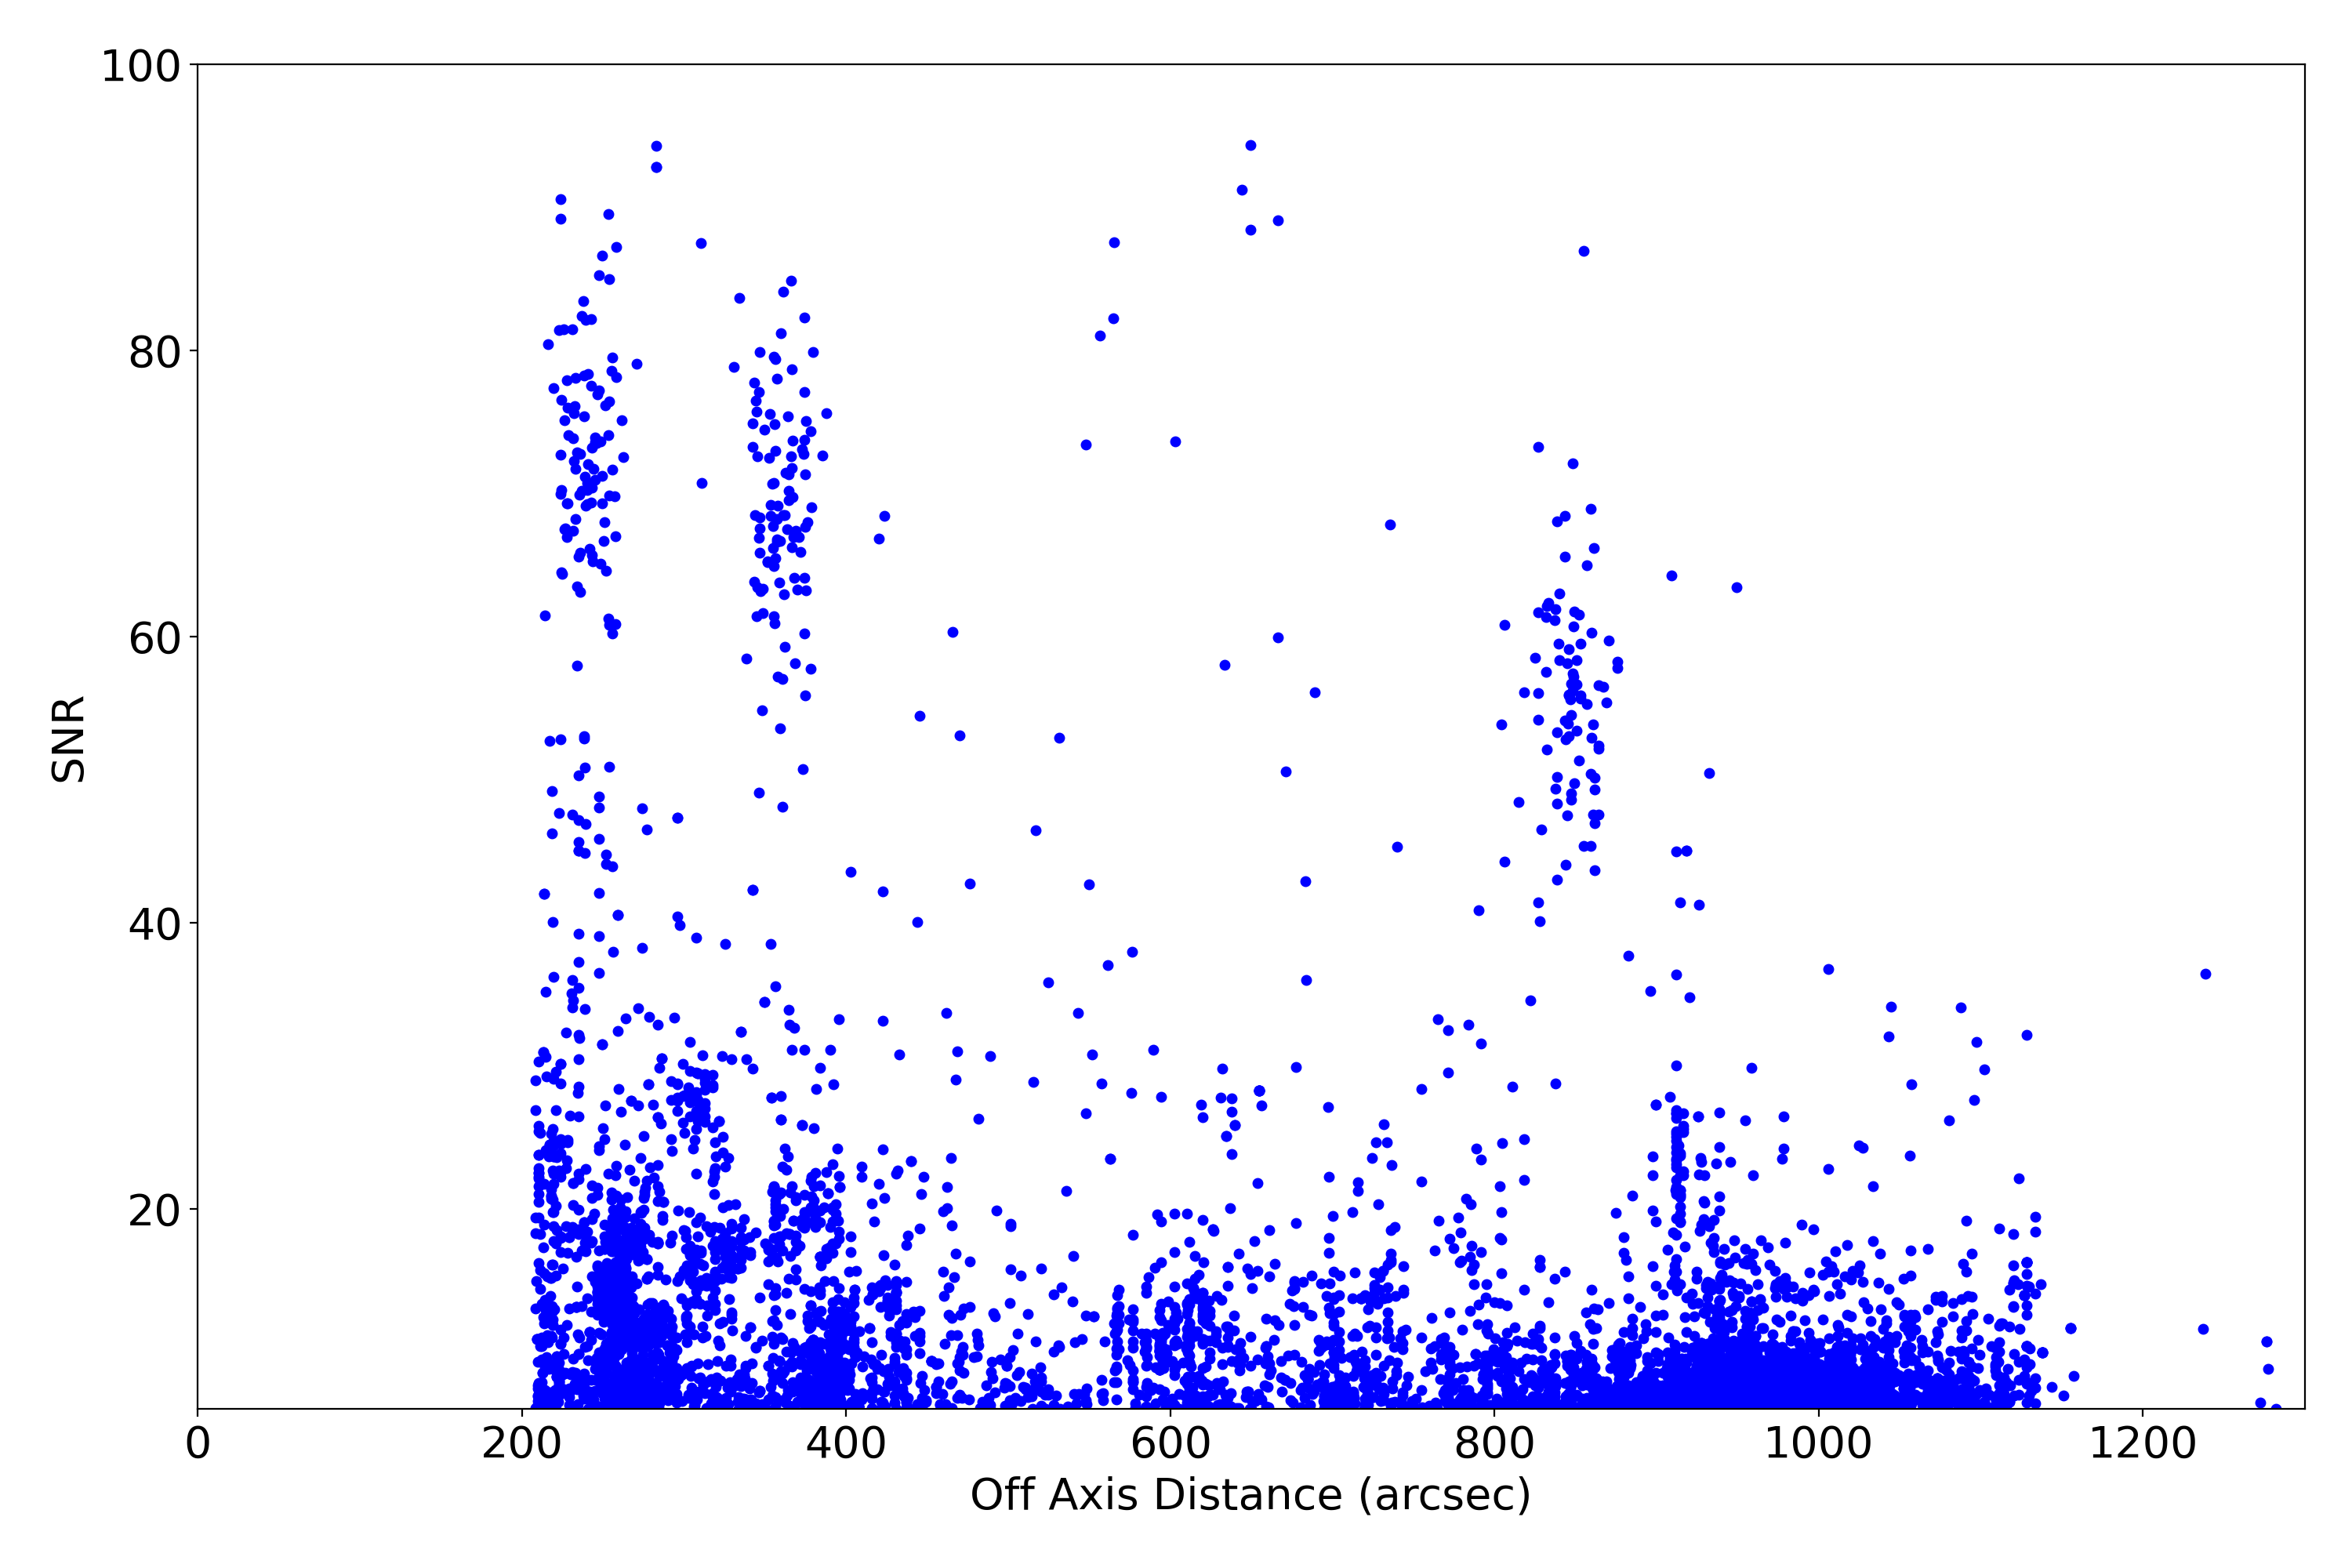
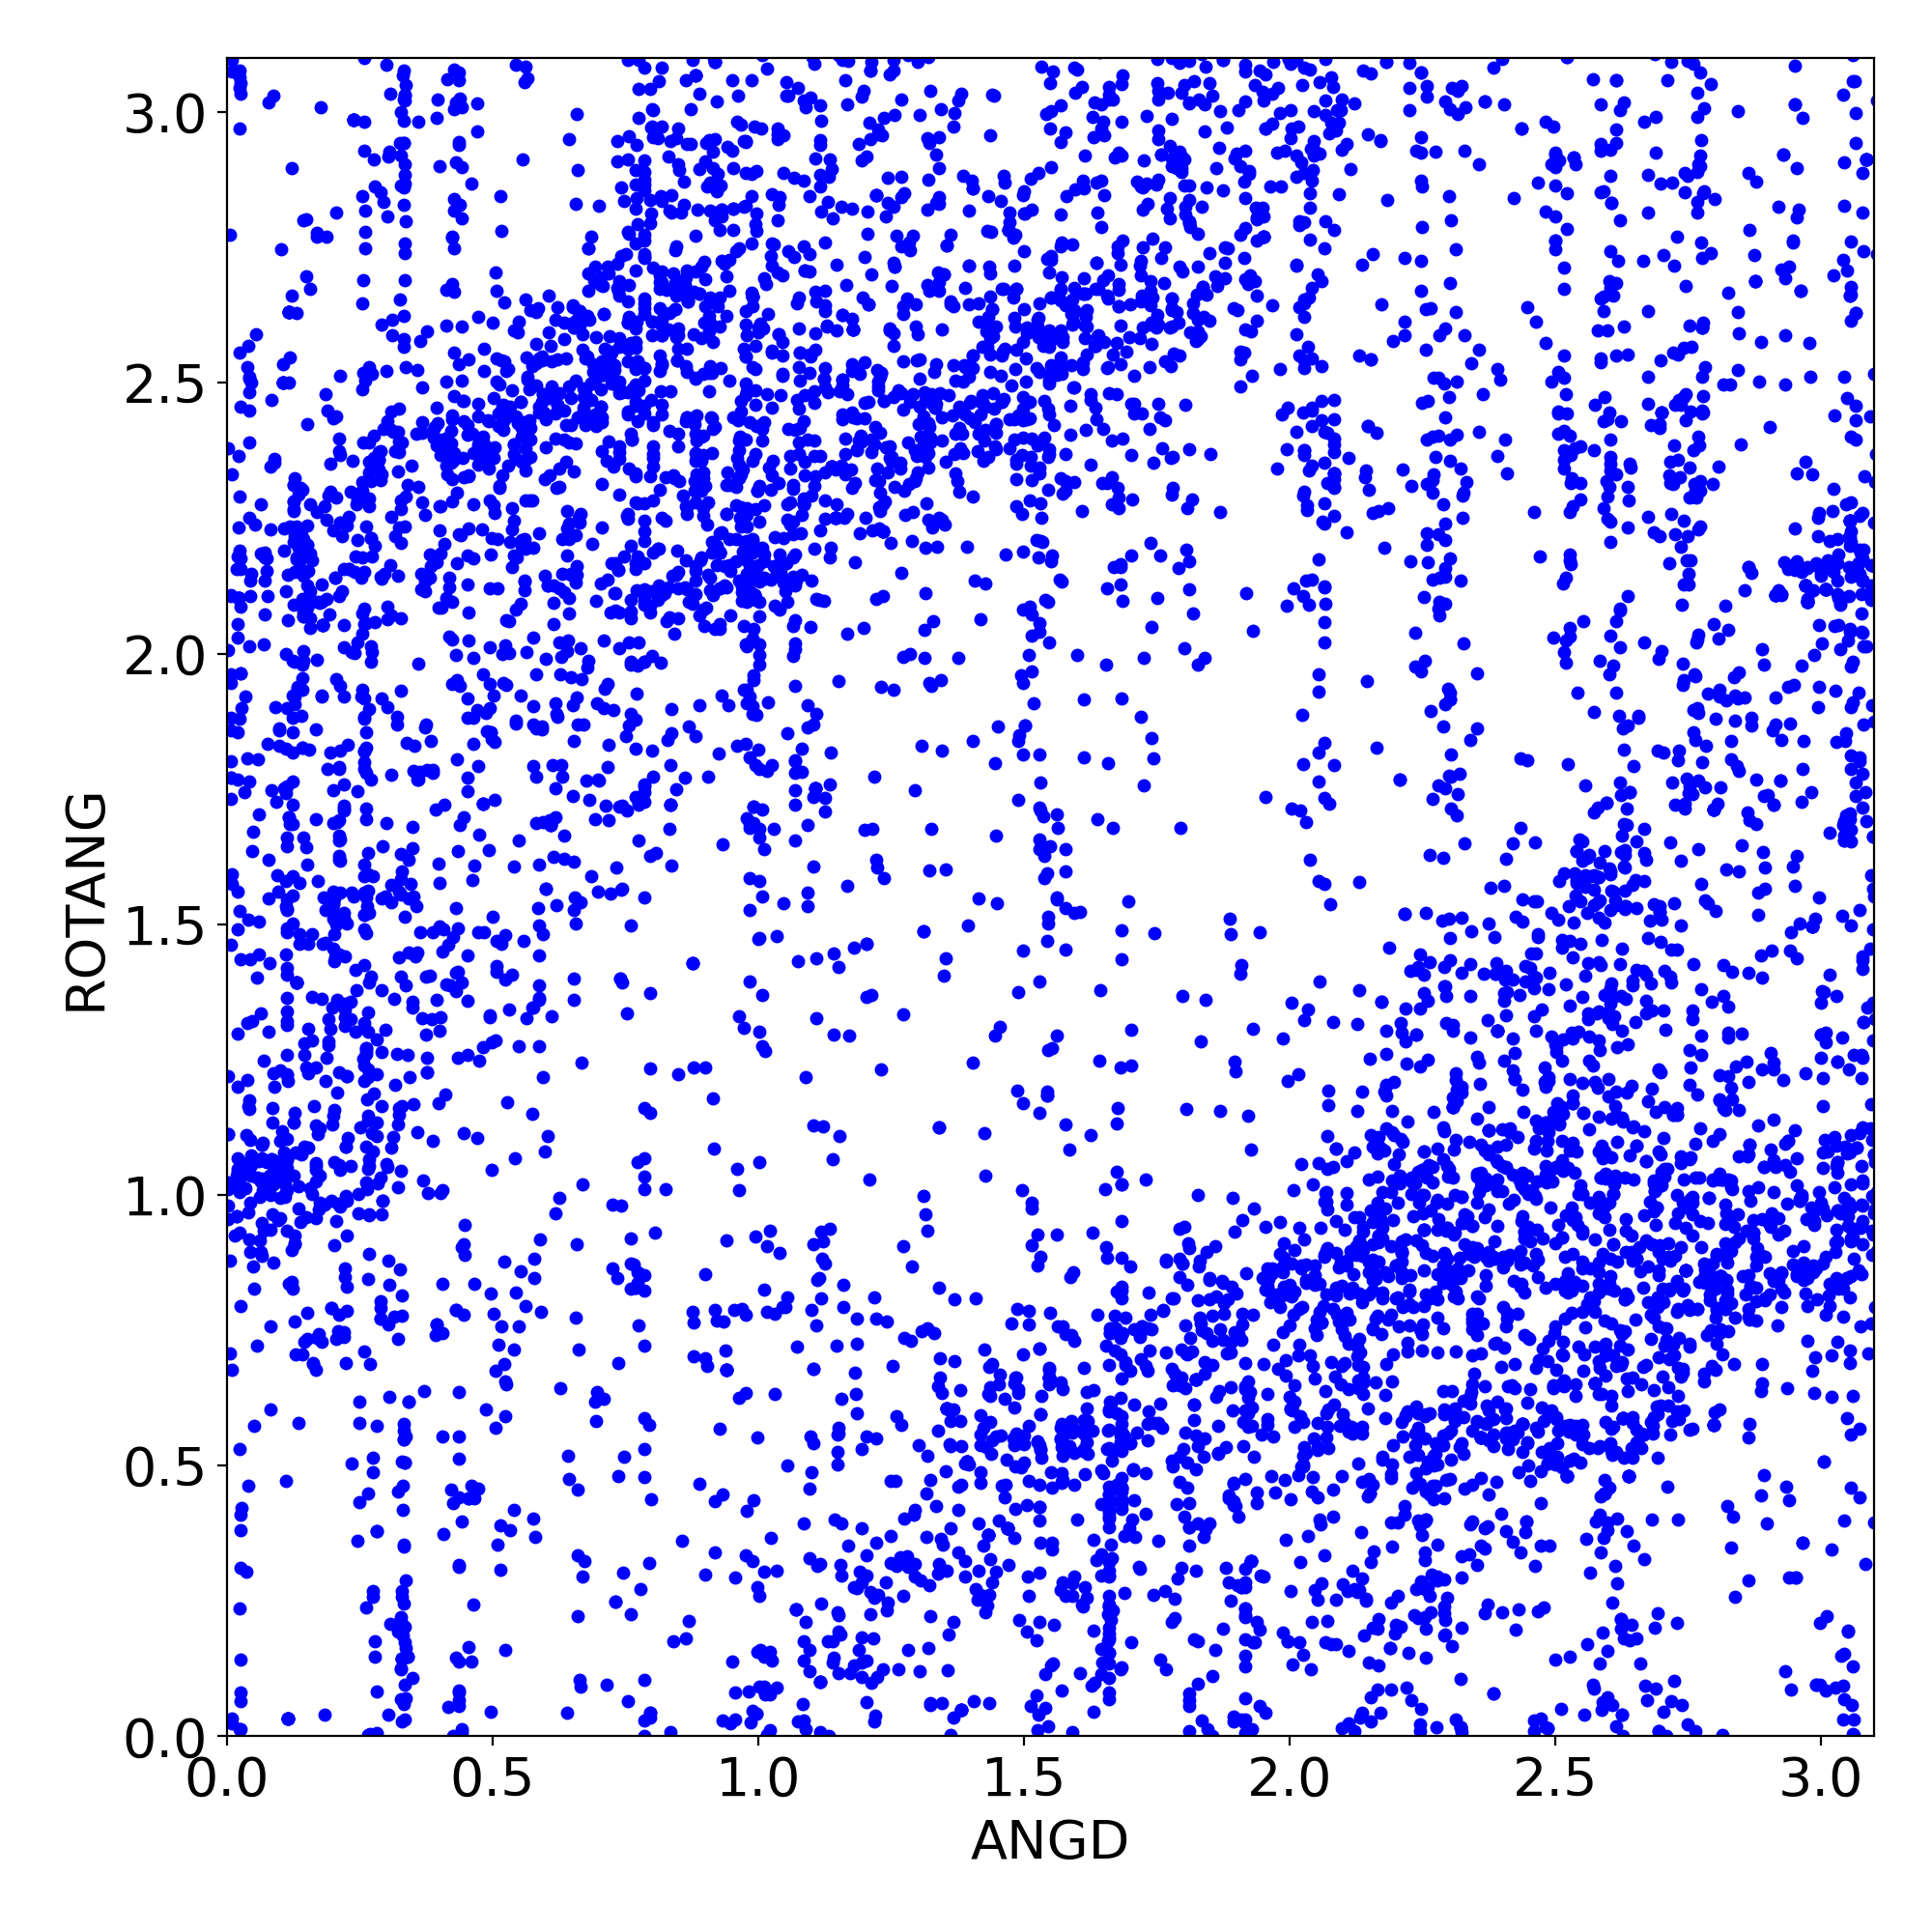
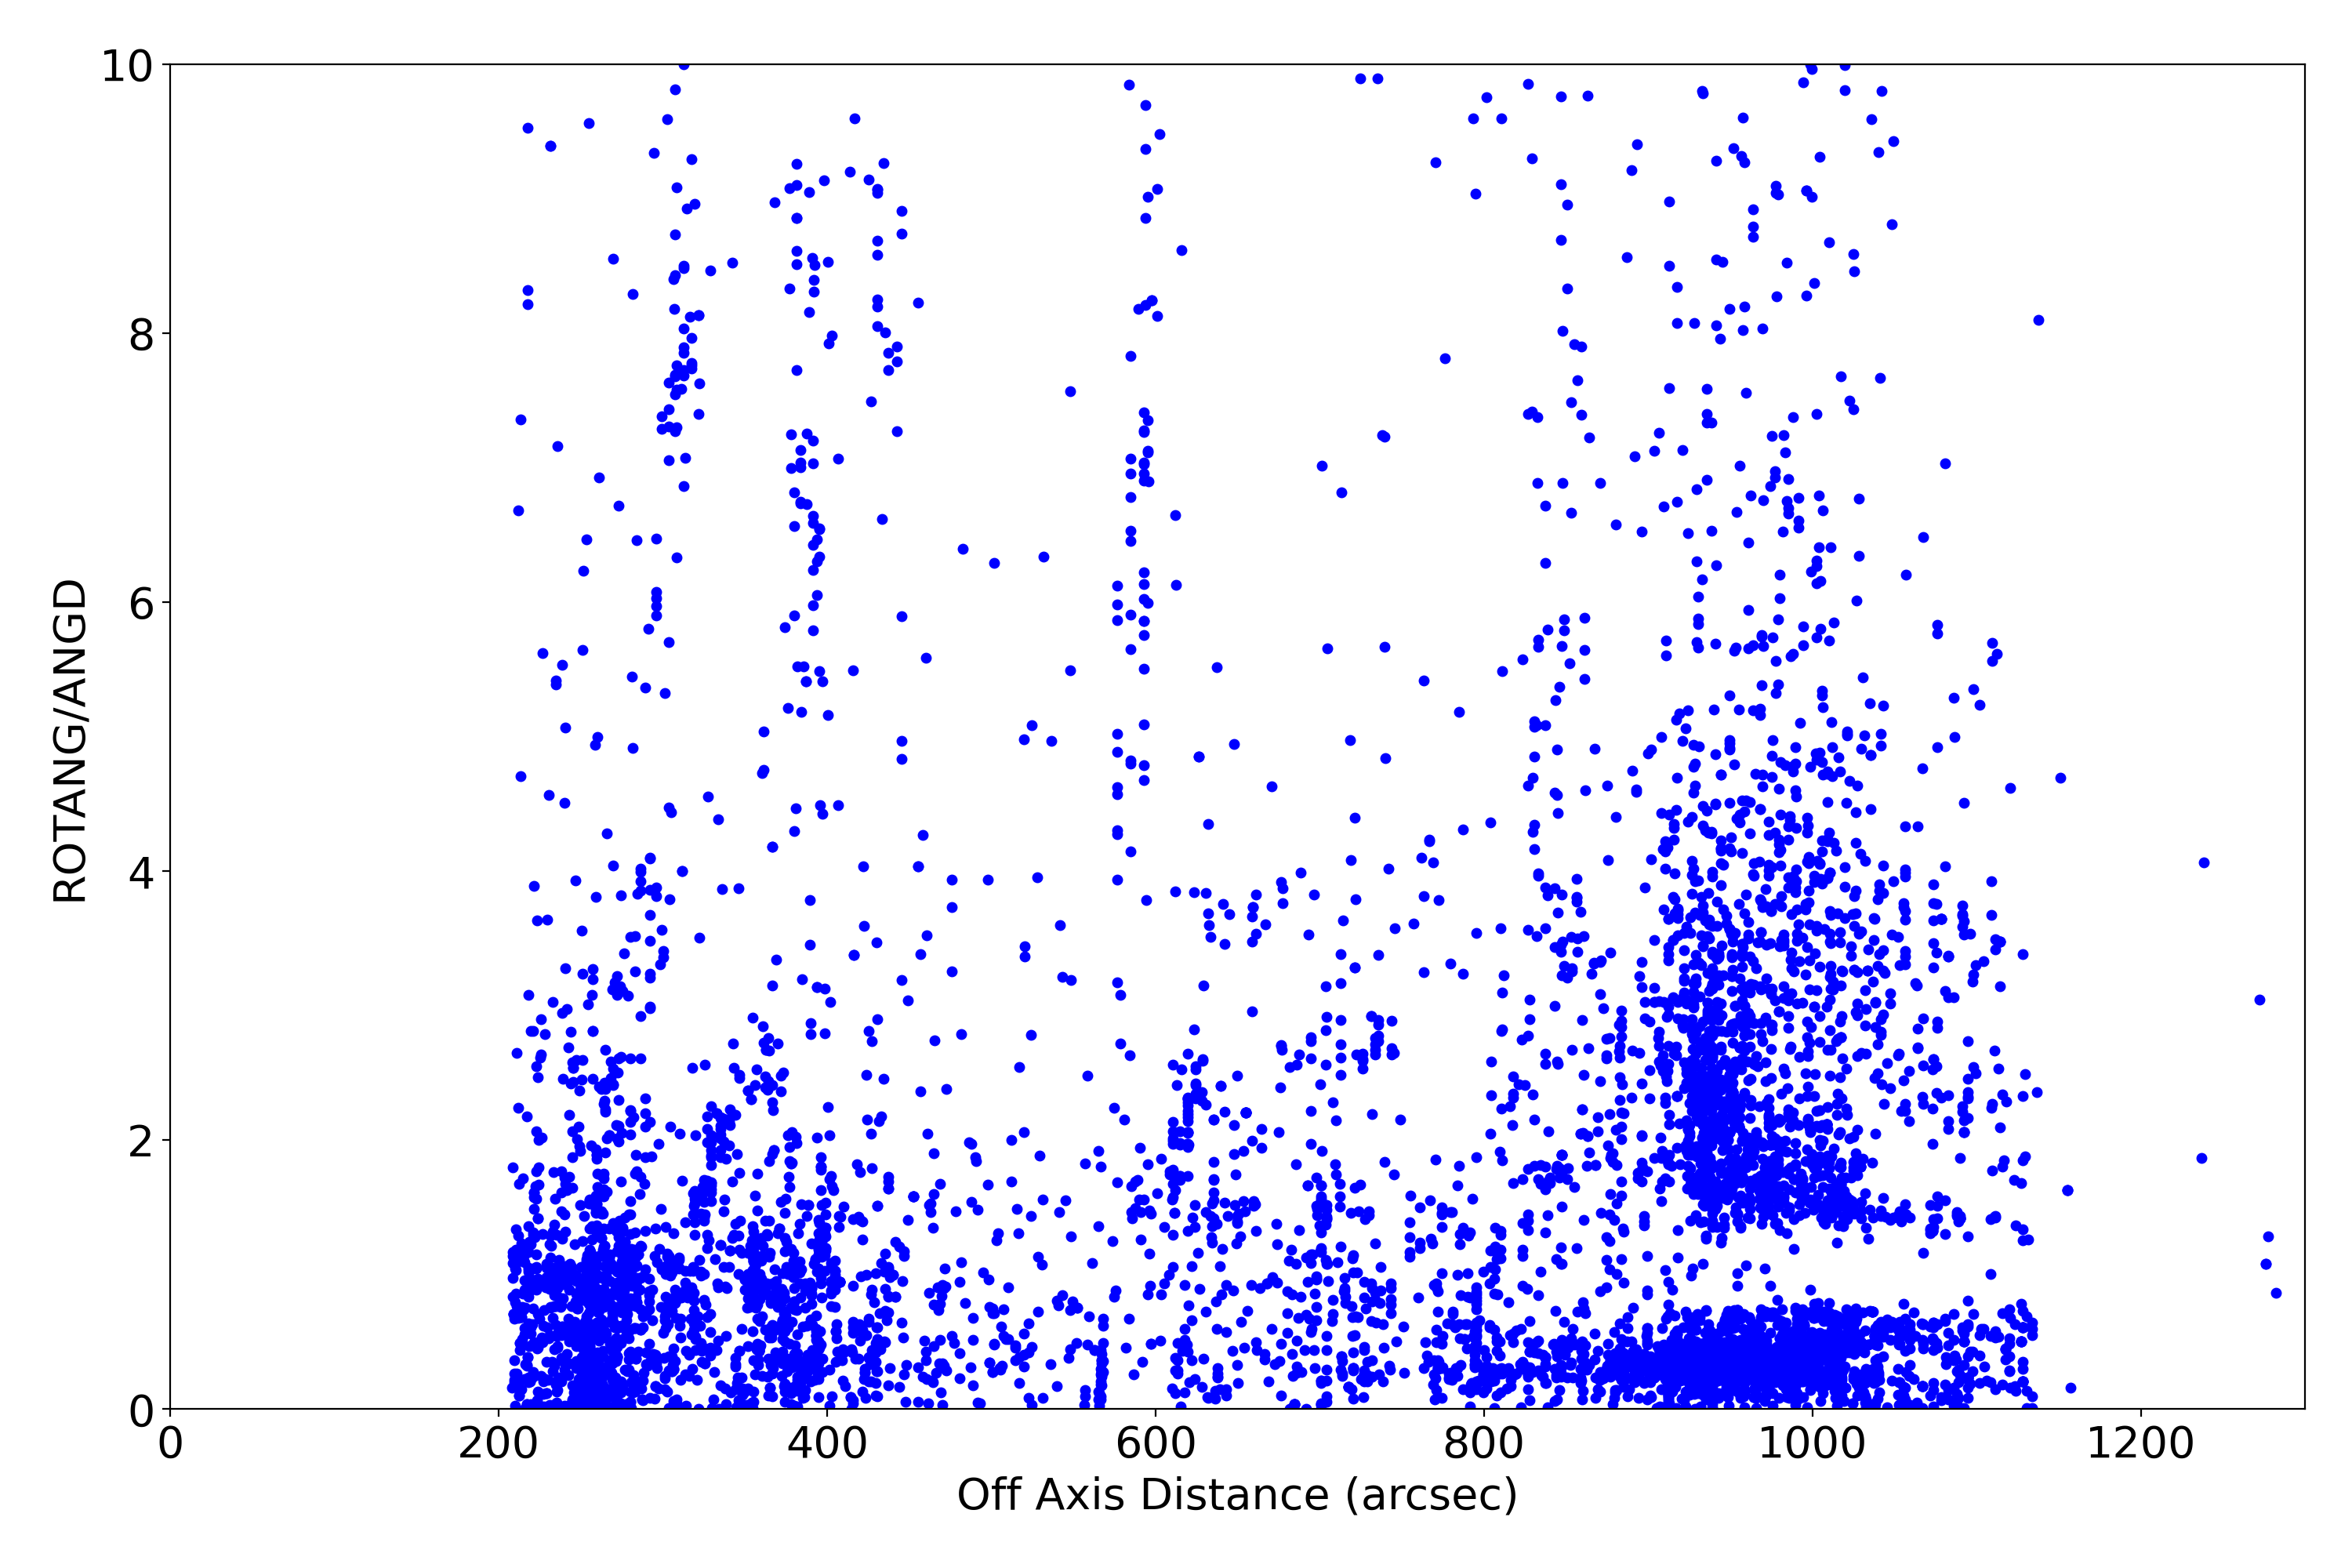
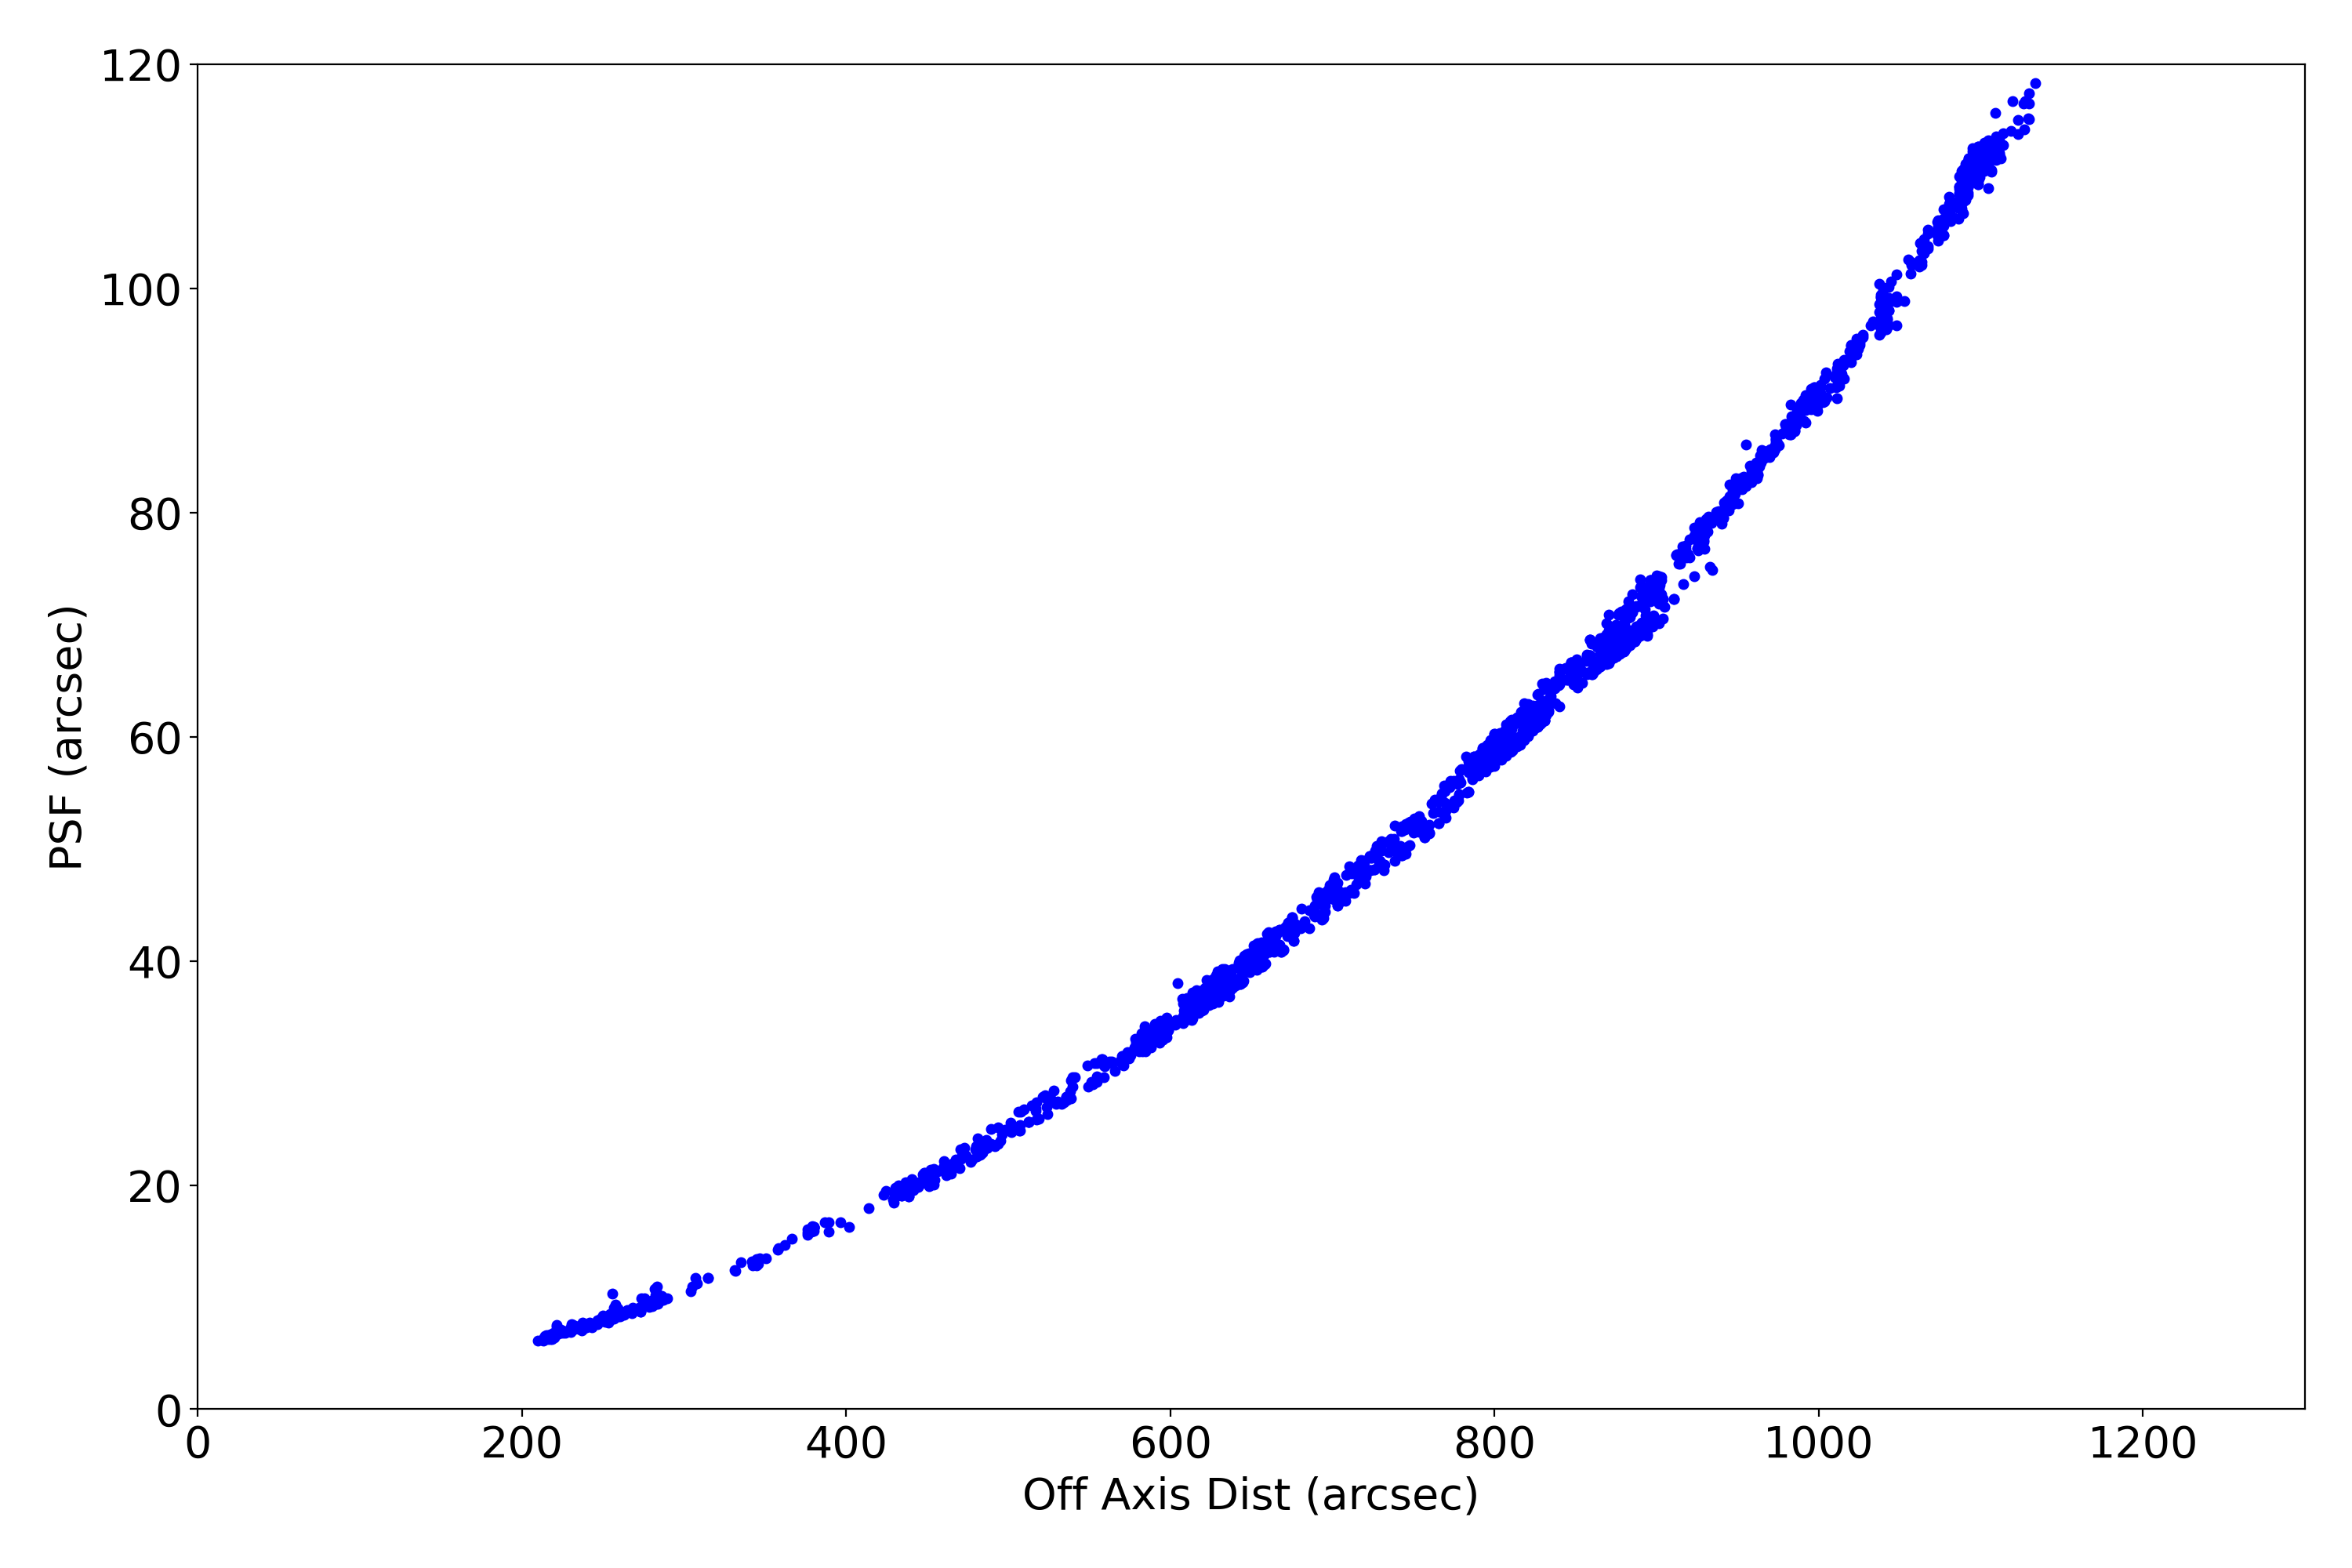
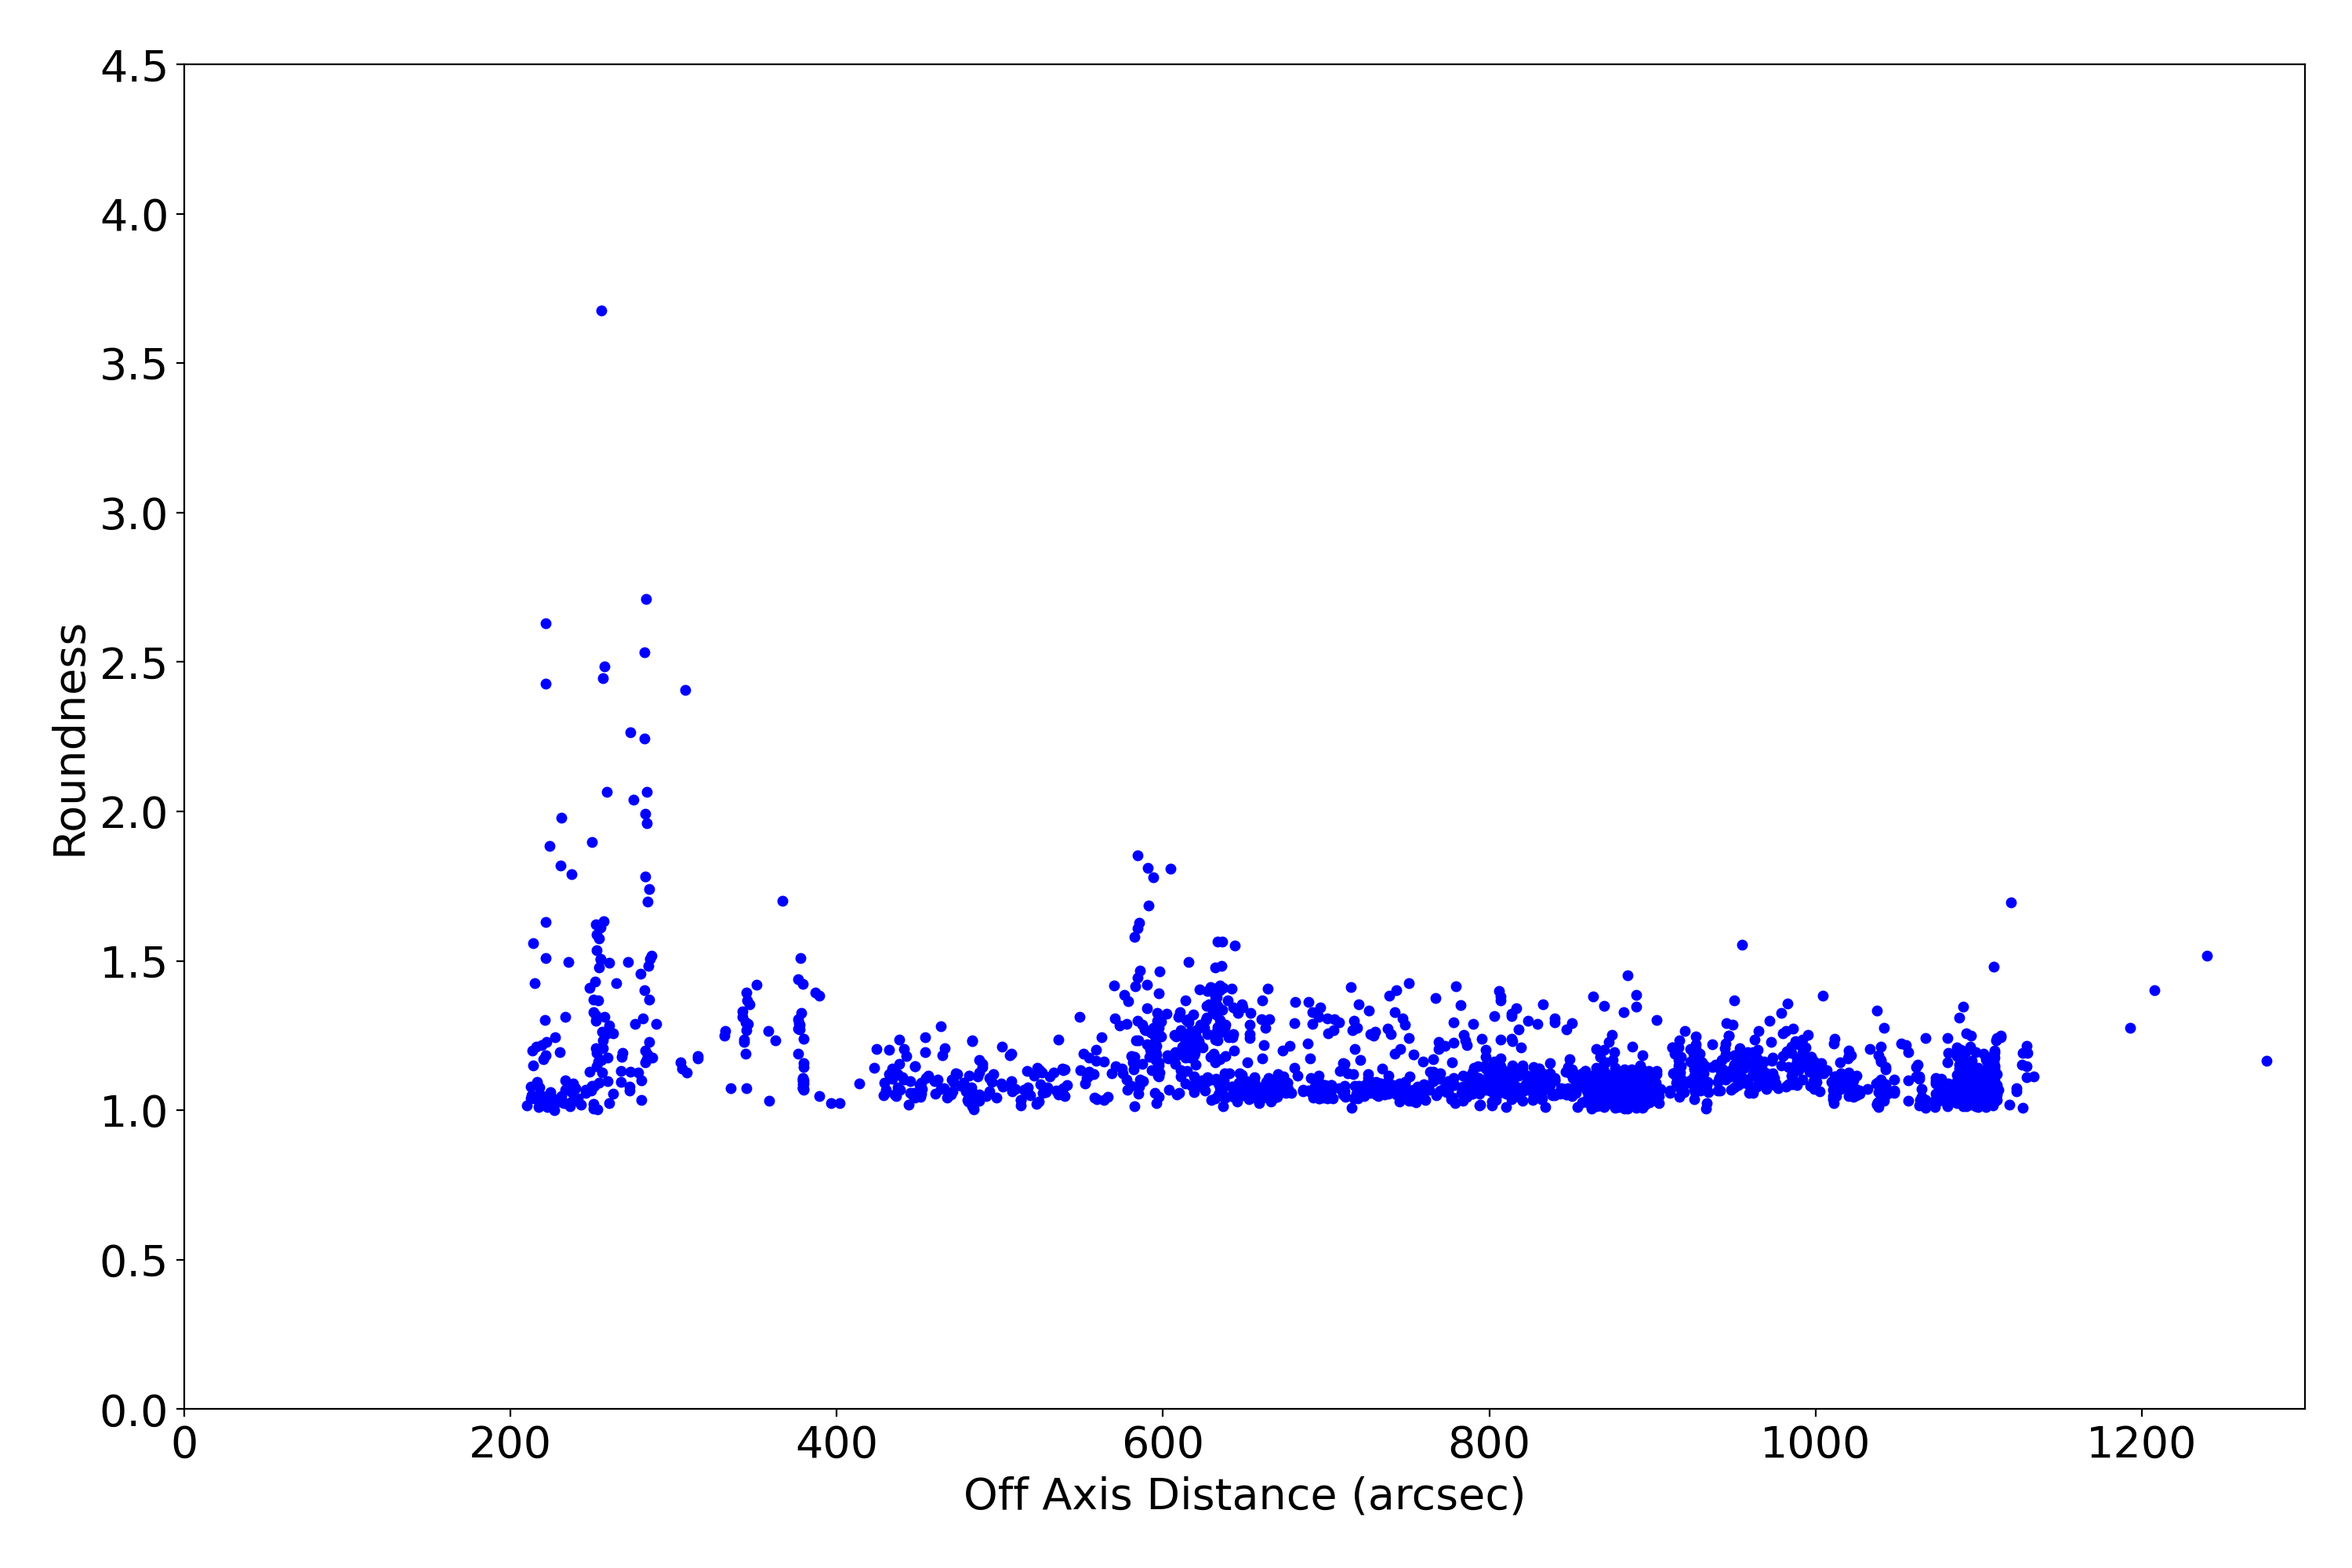
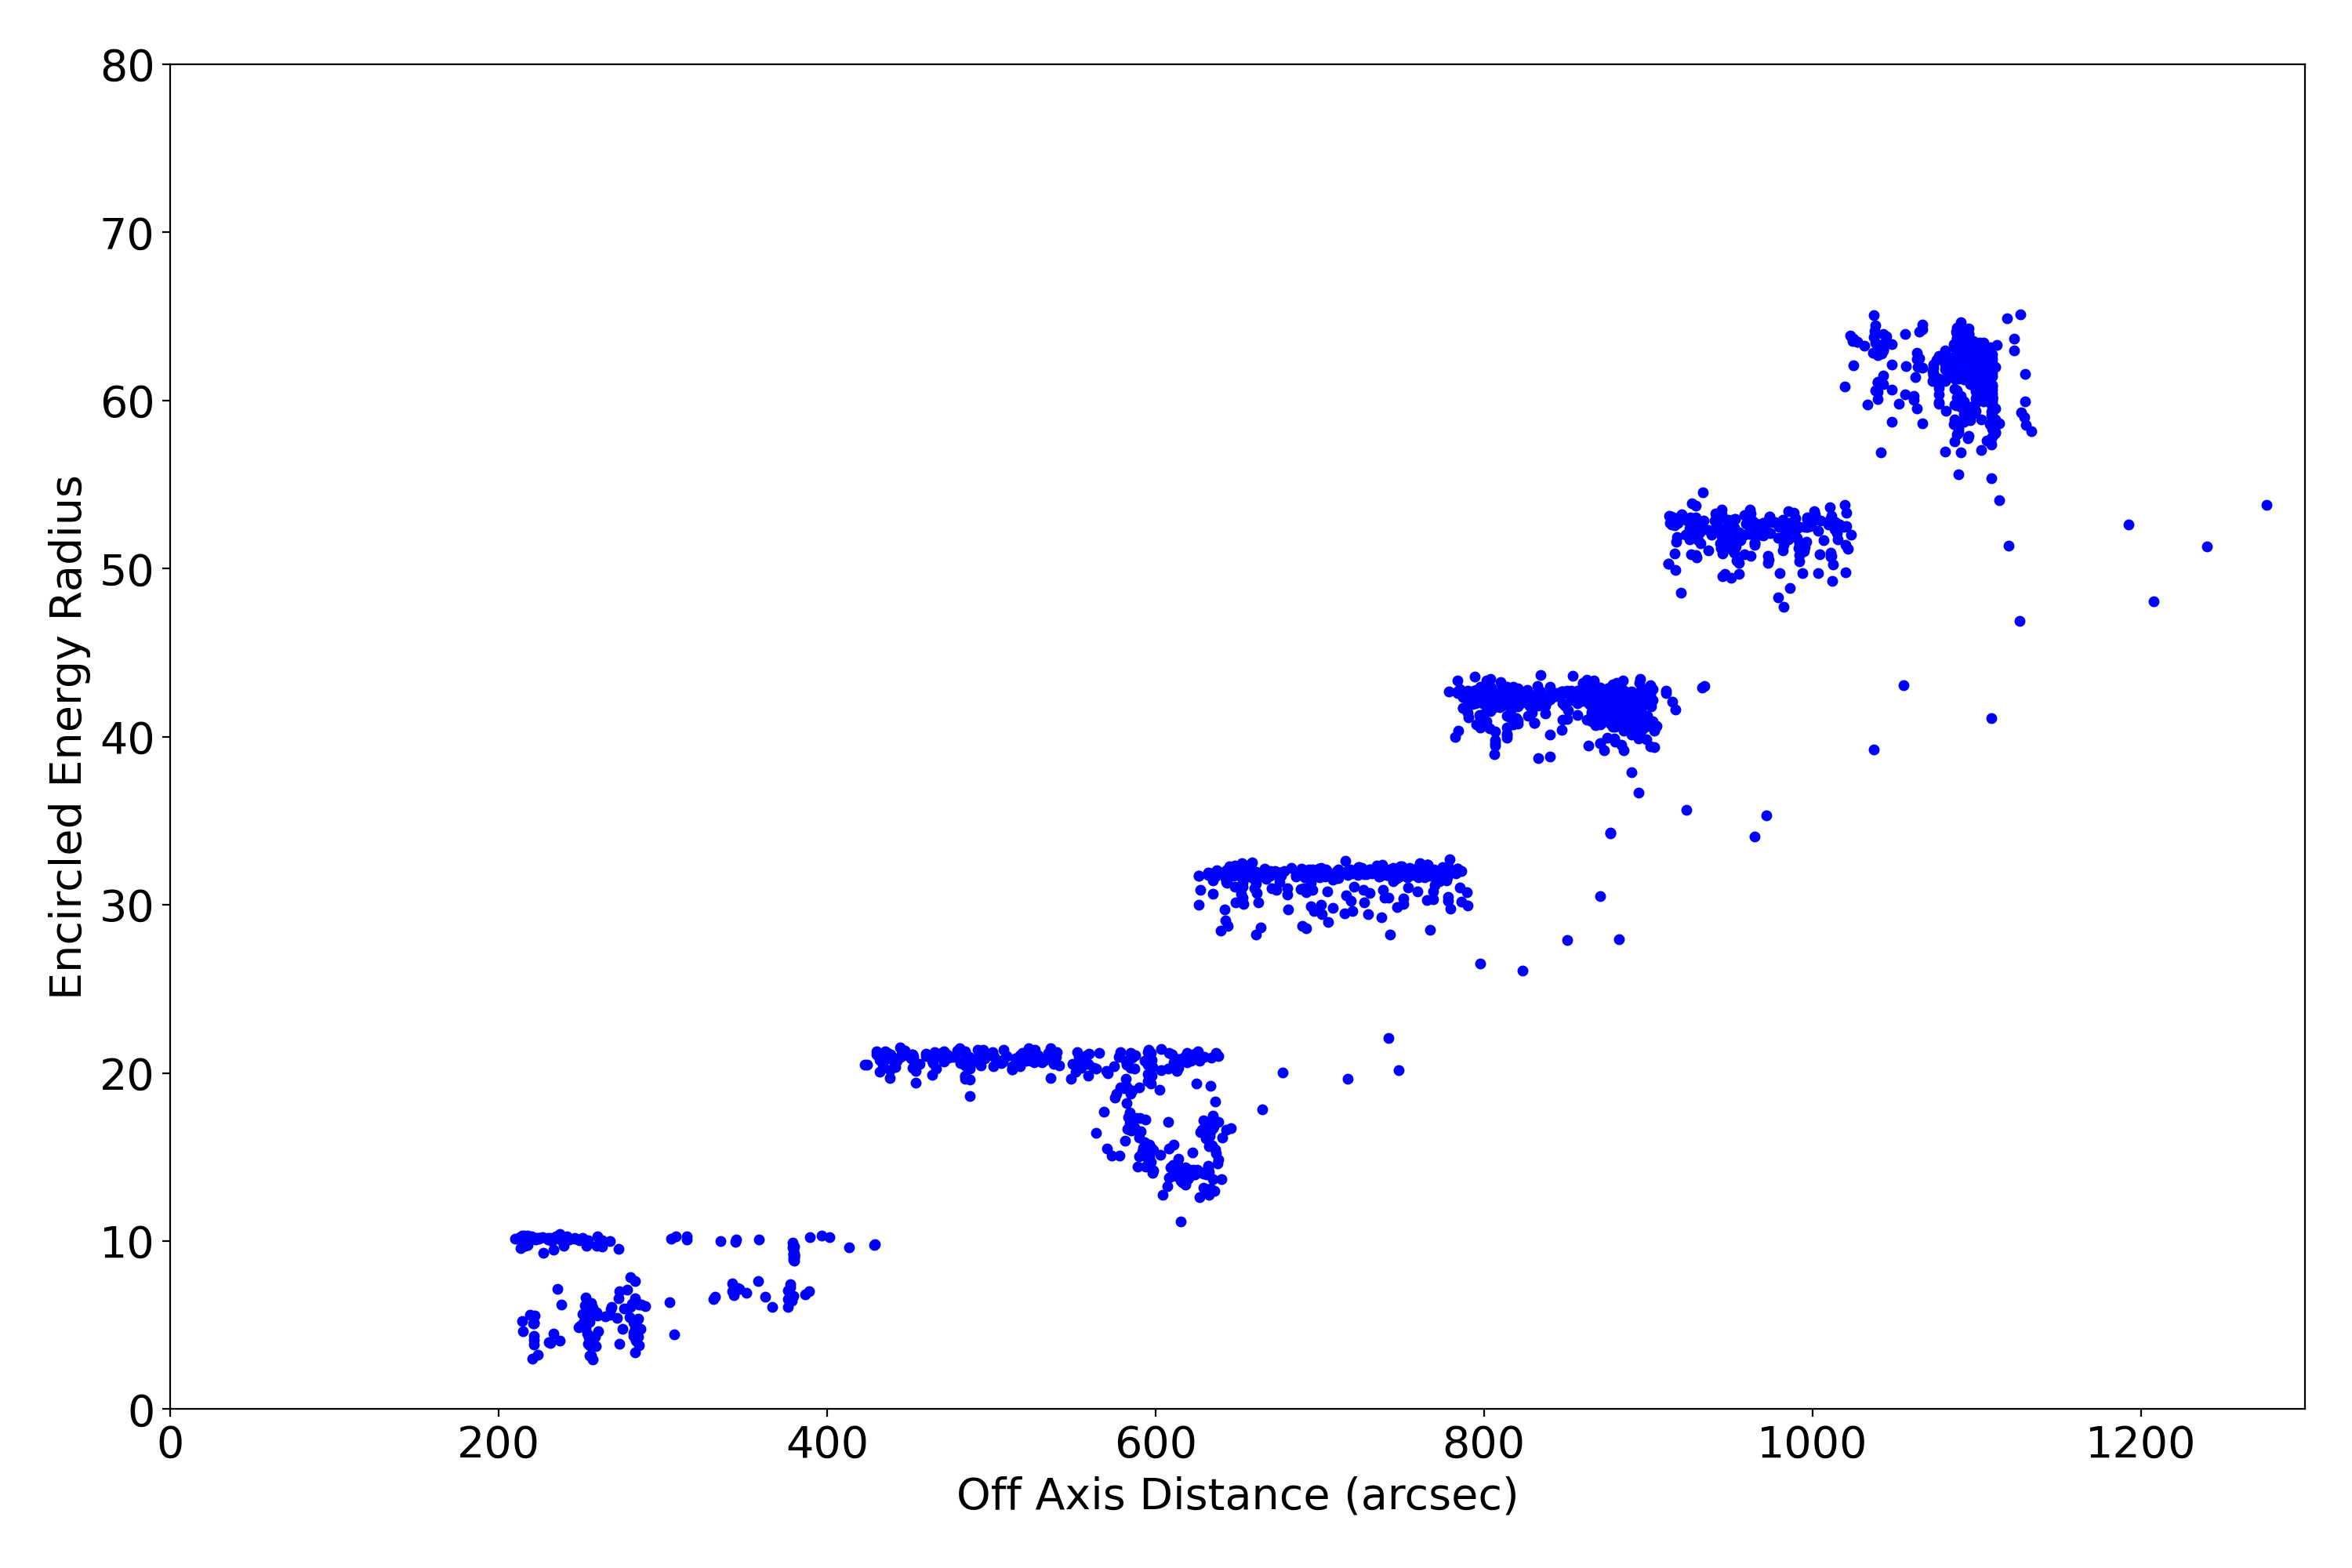
HRMA Focus
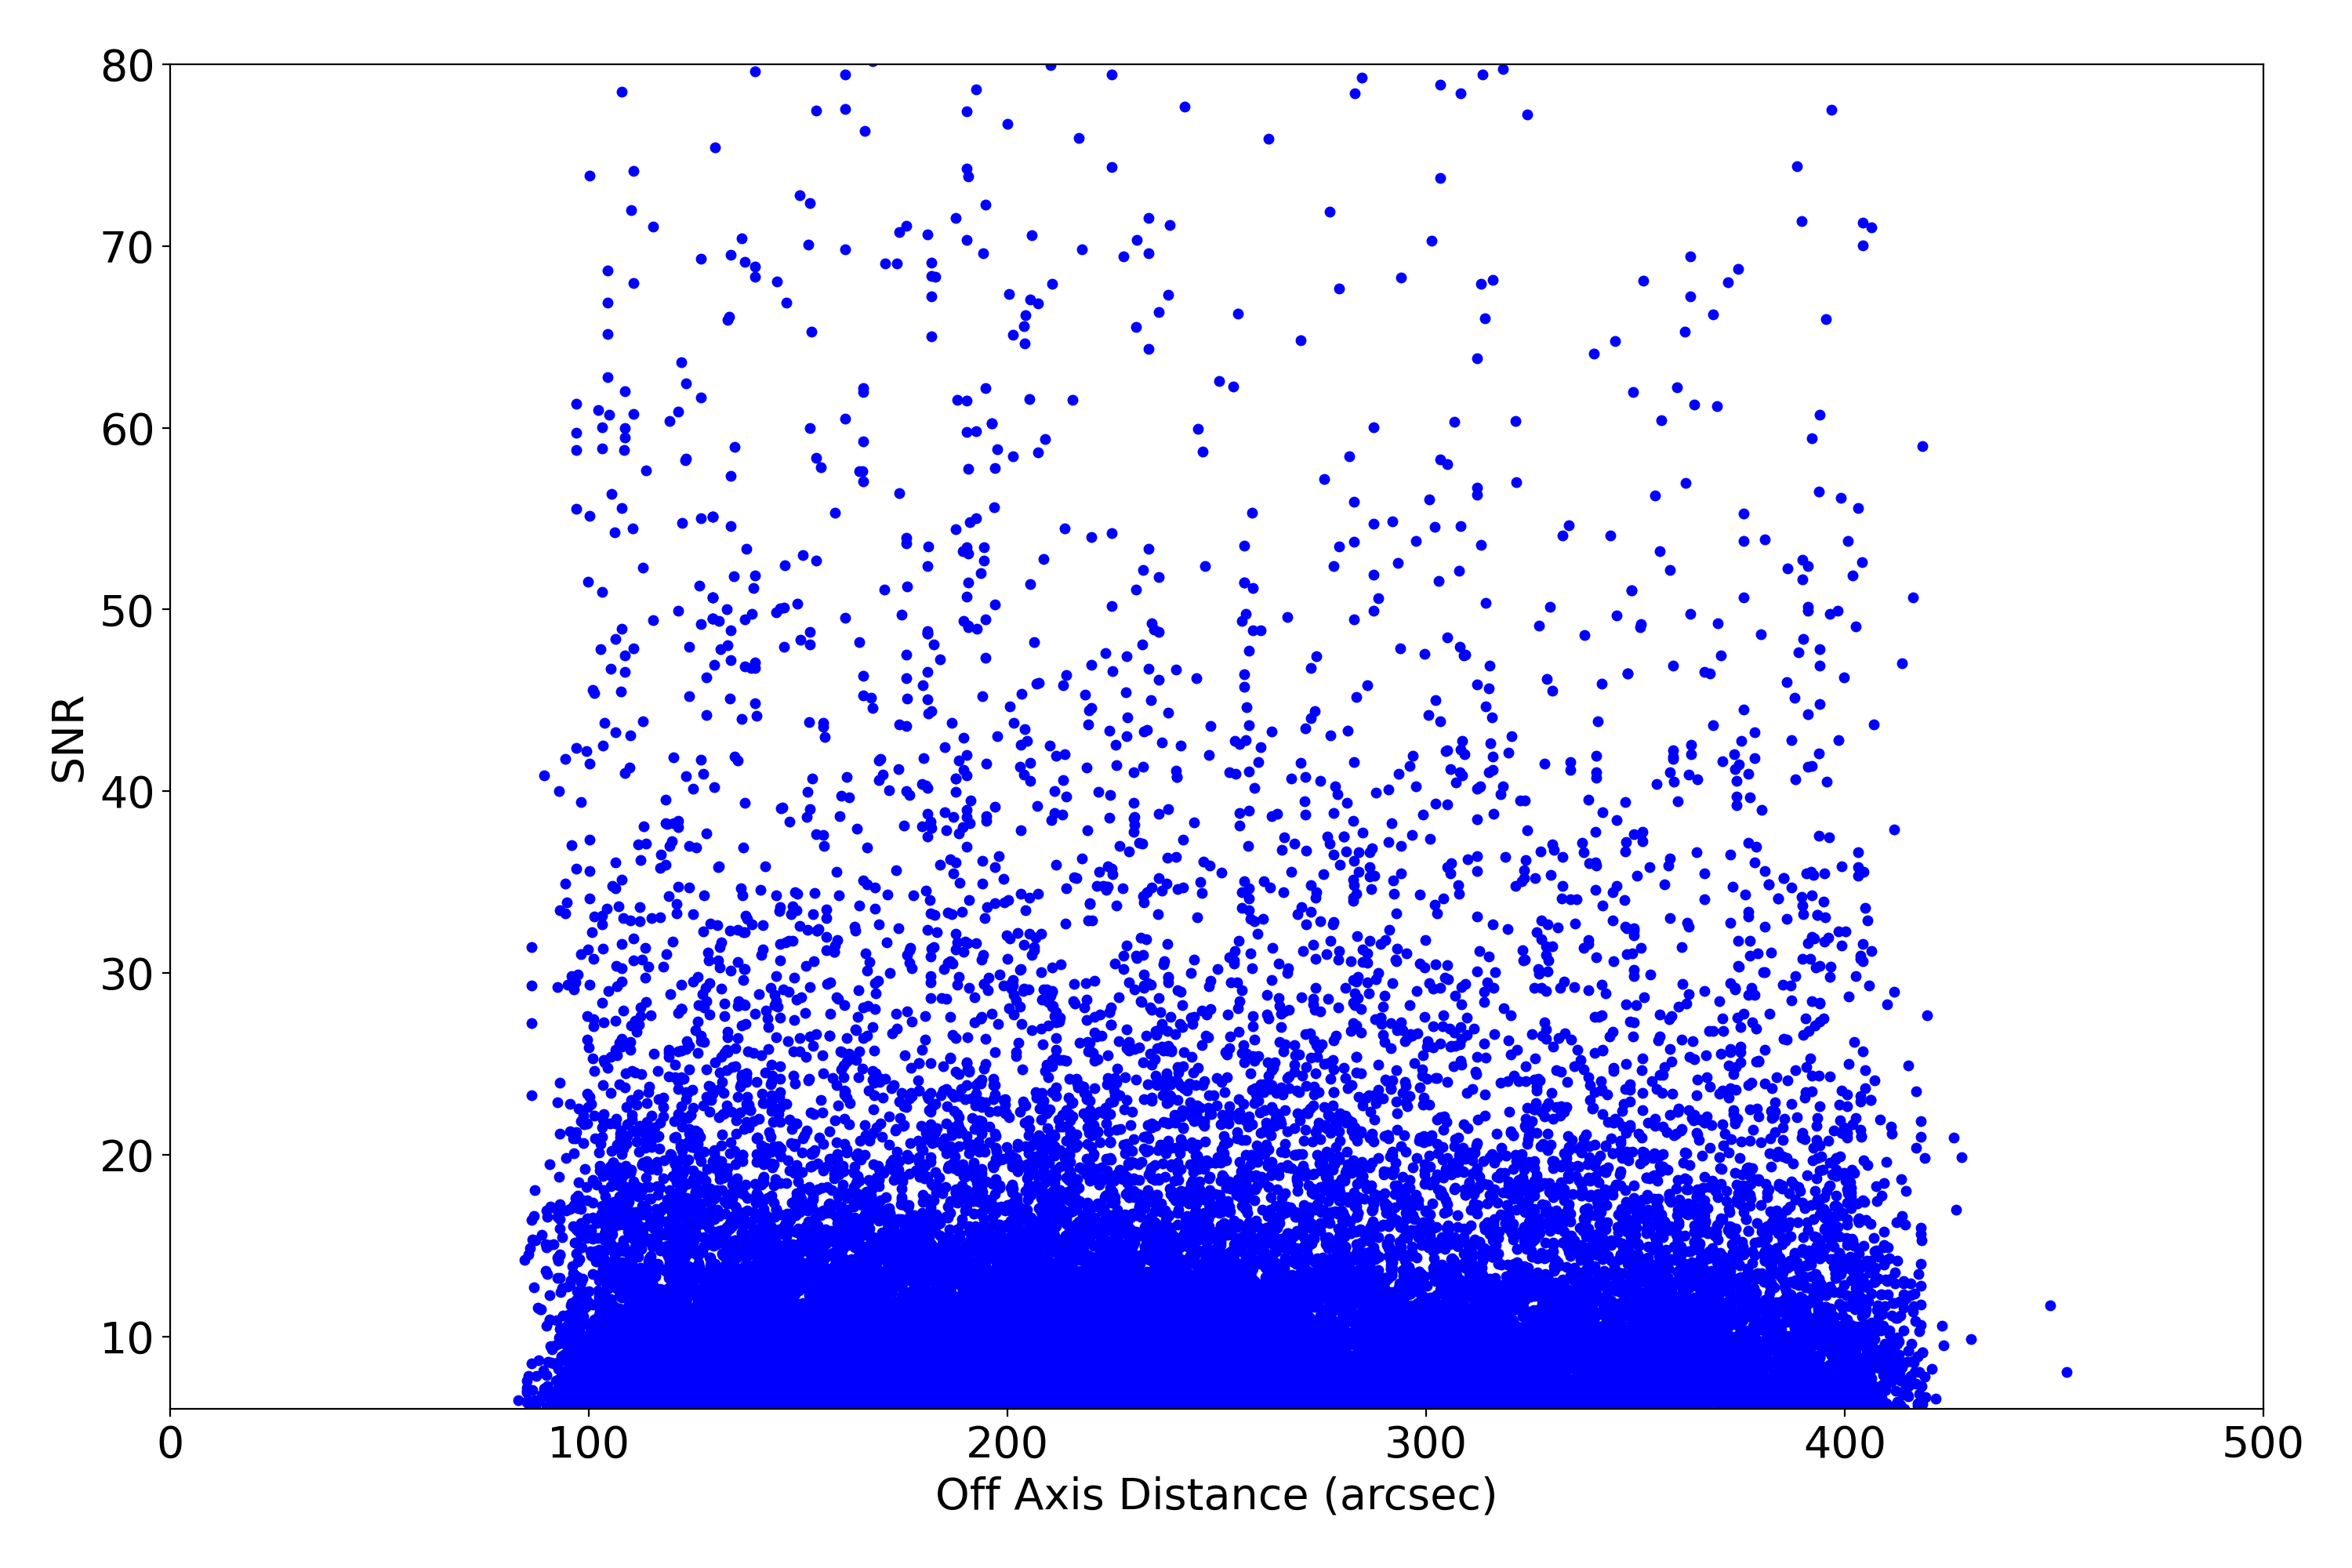
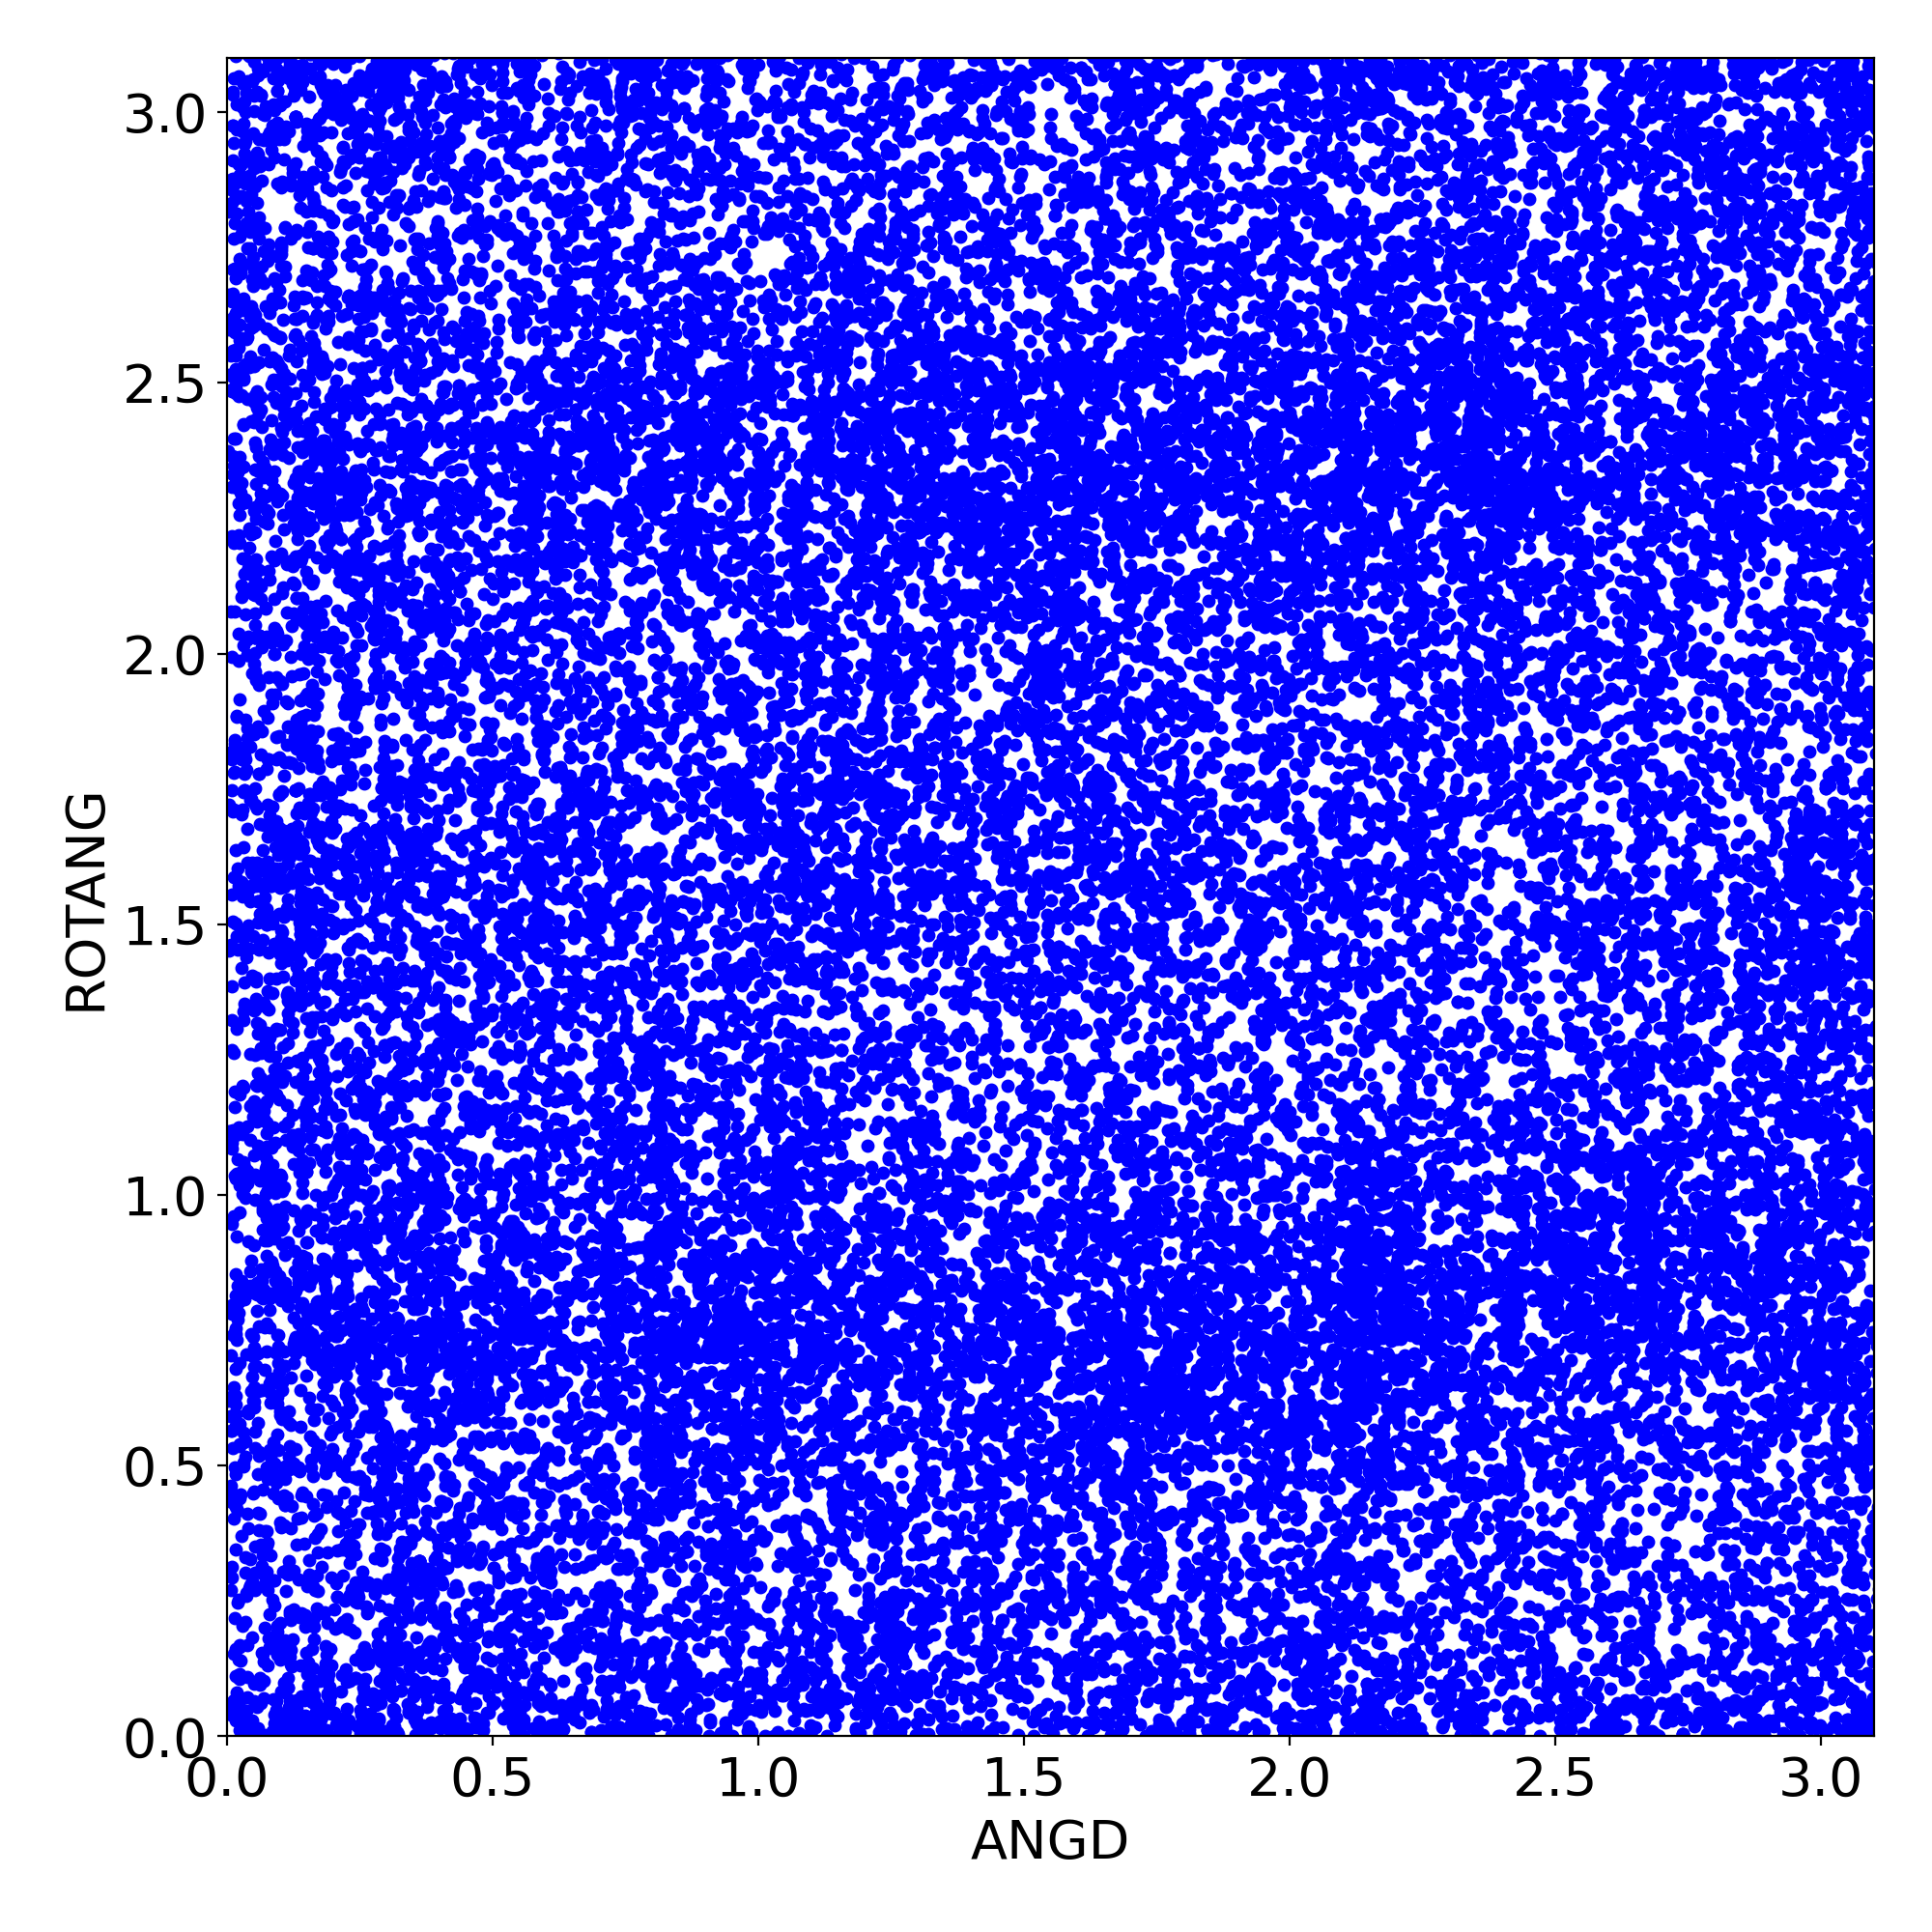
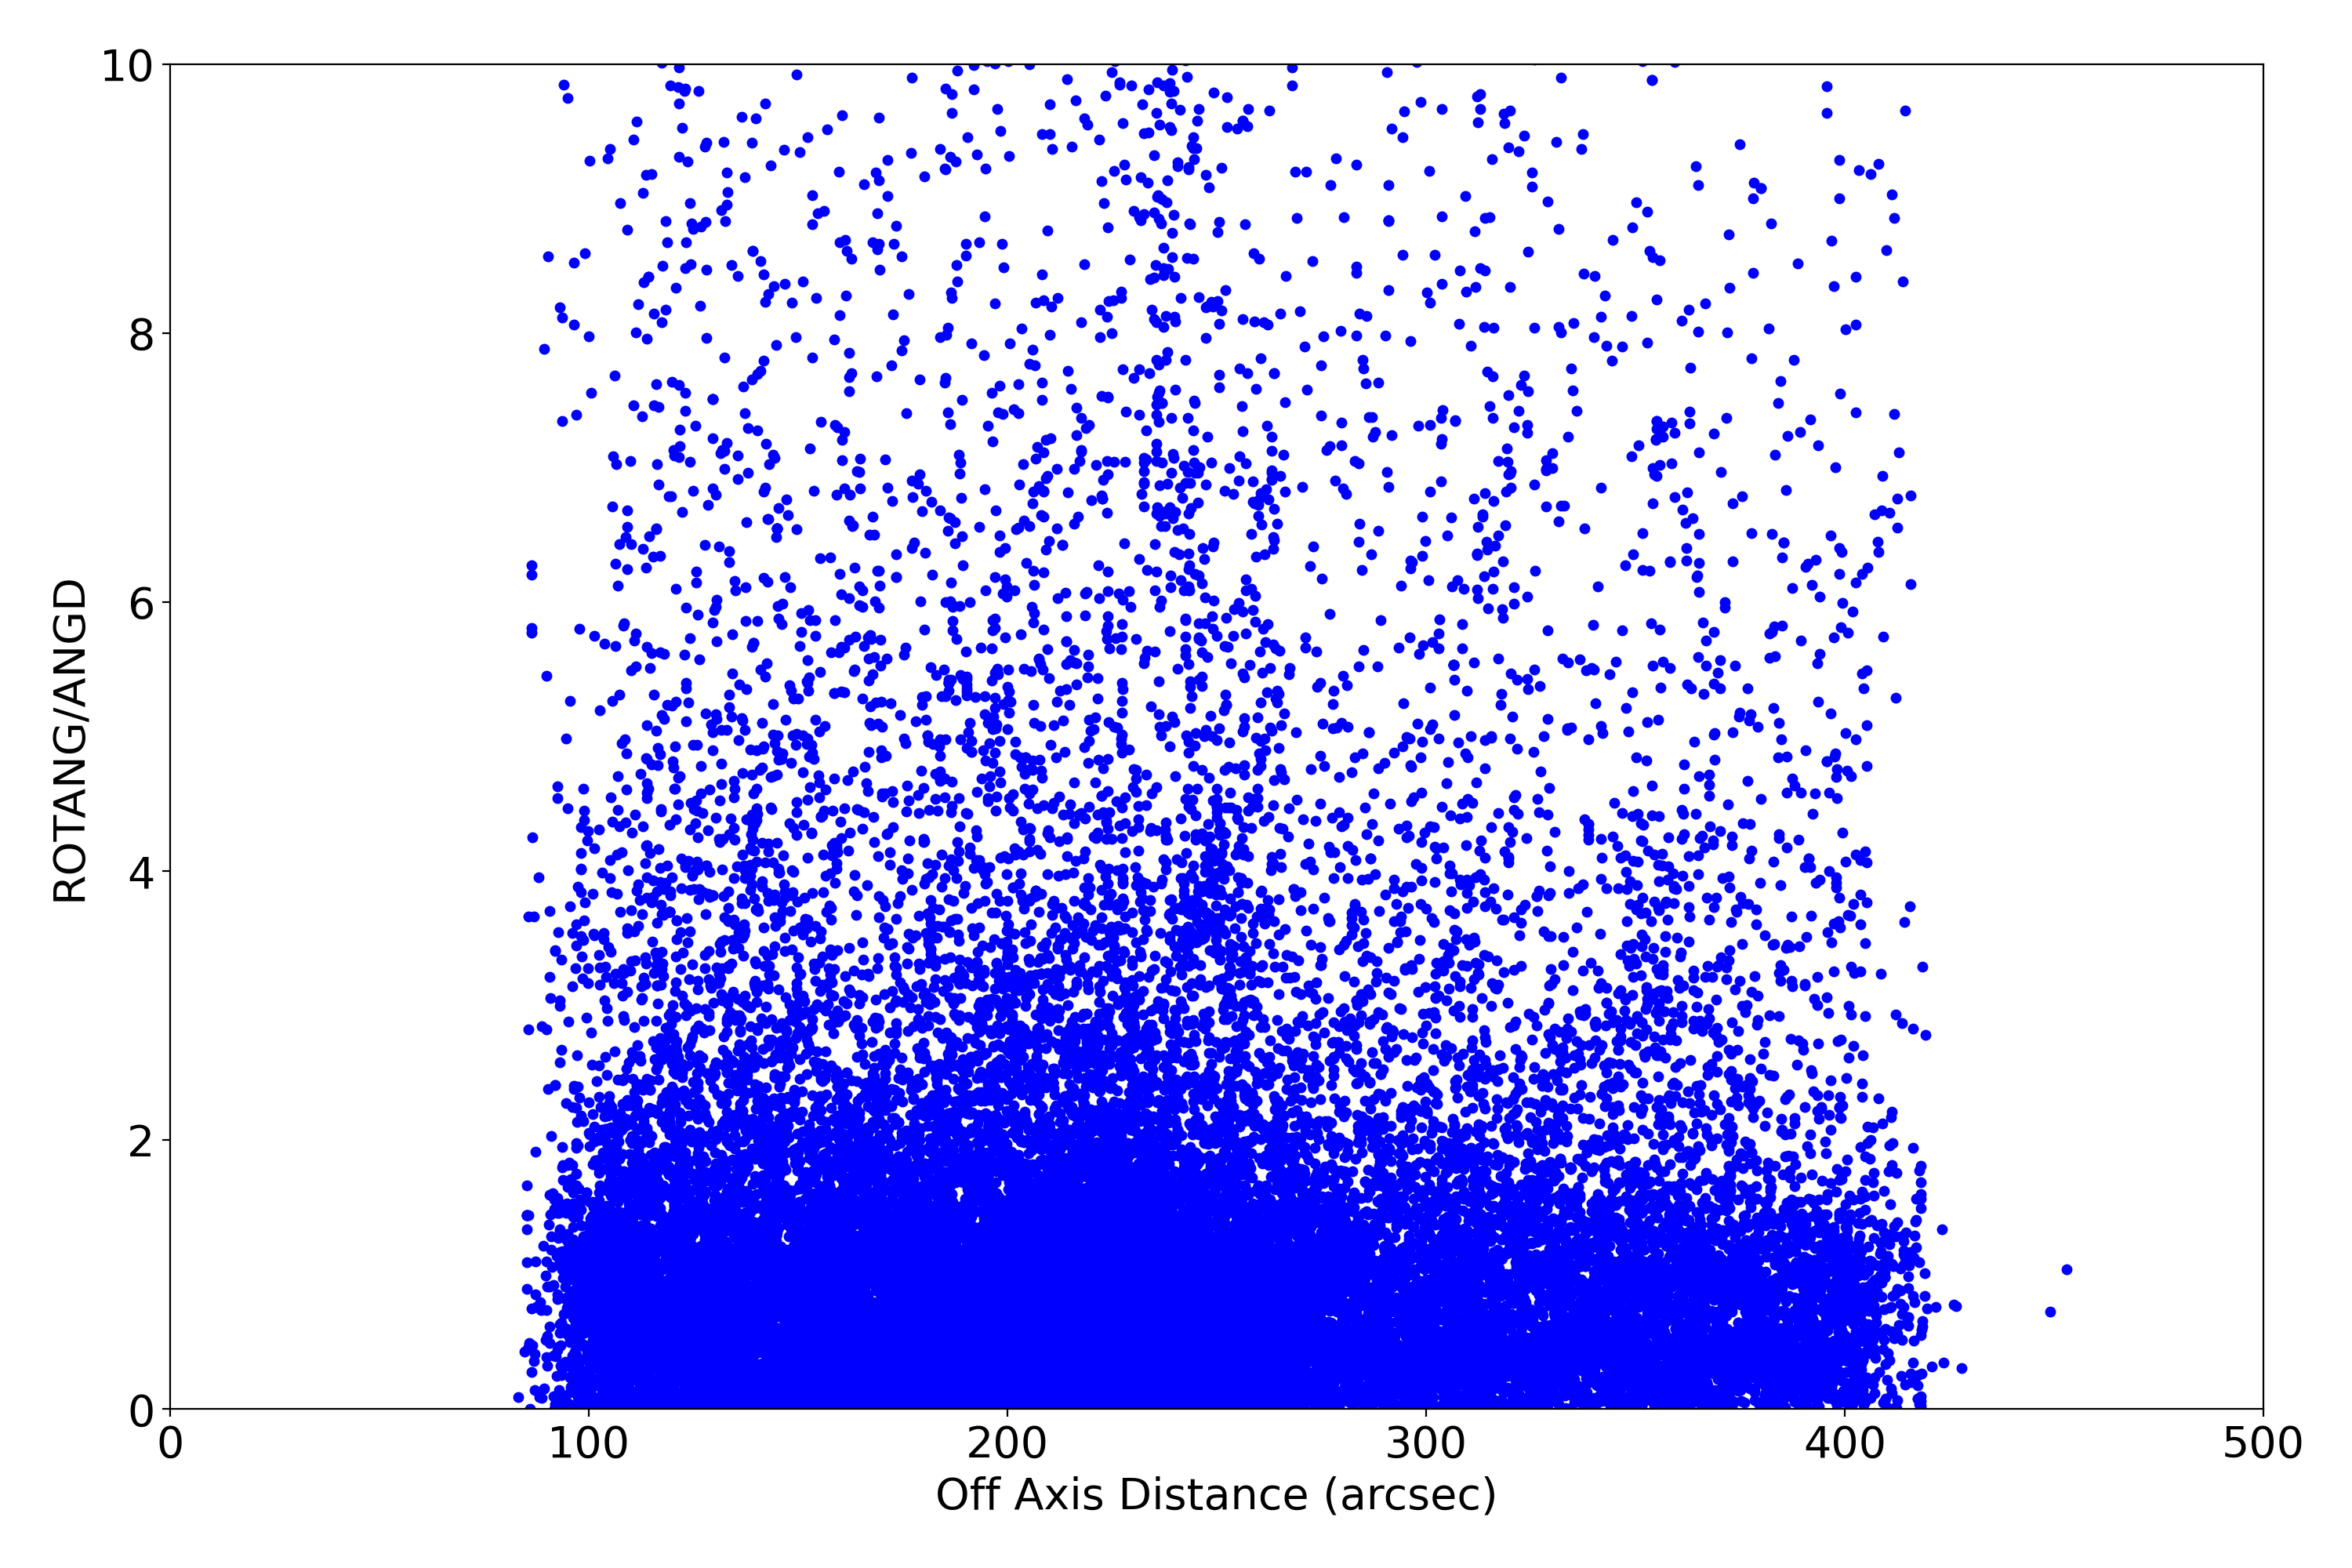
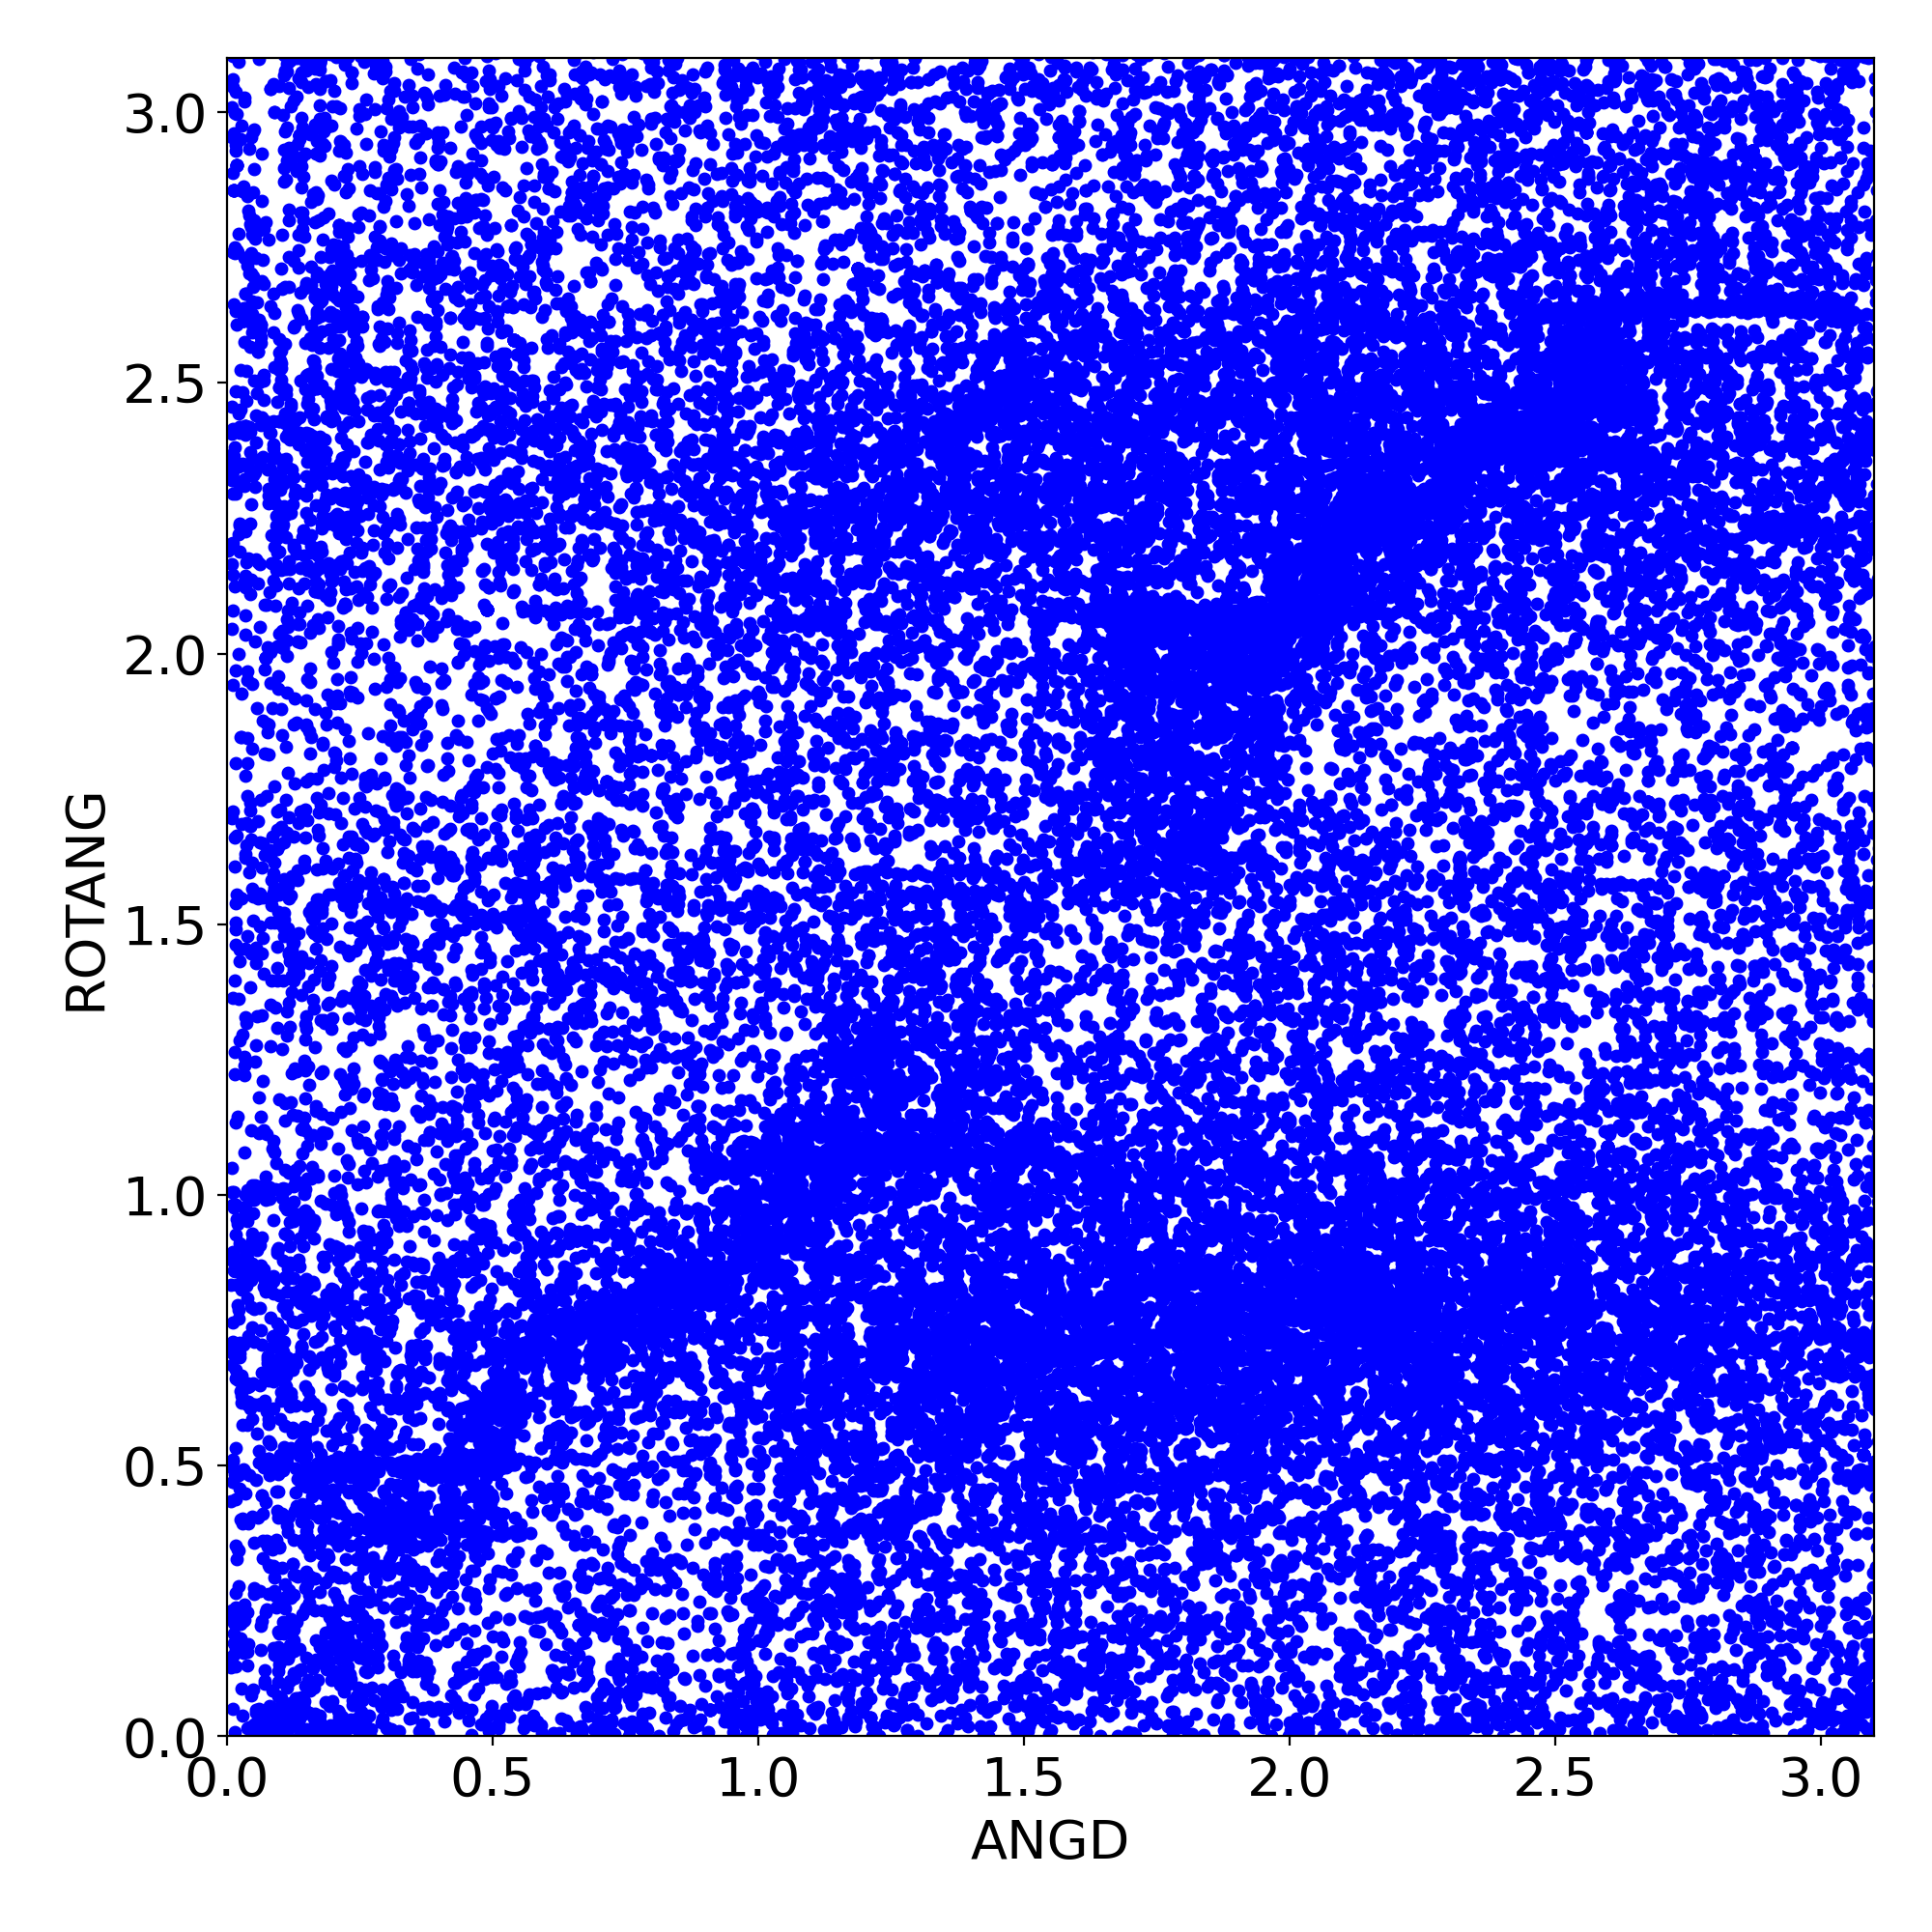
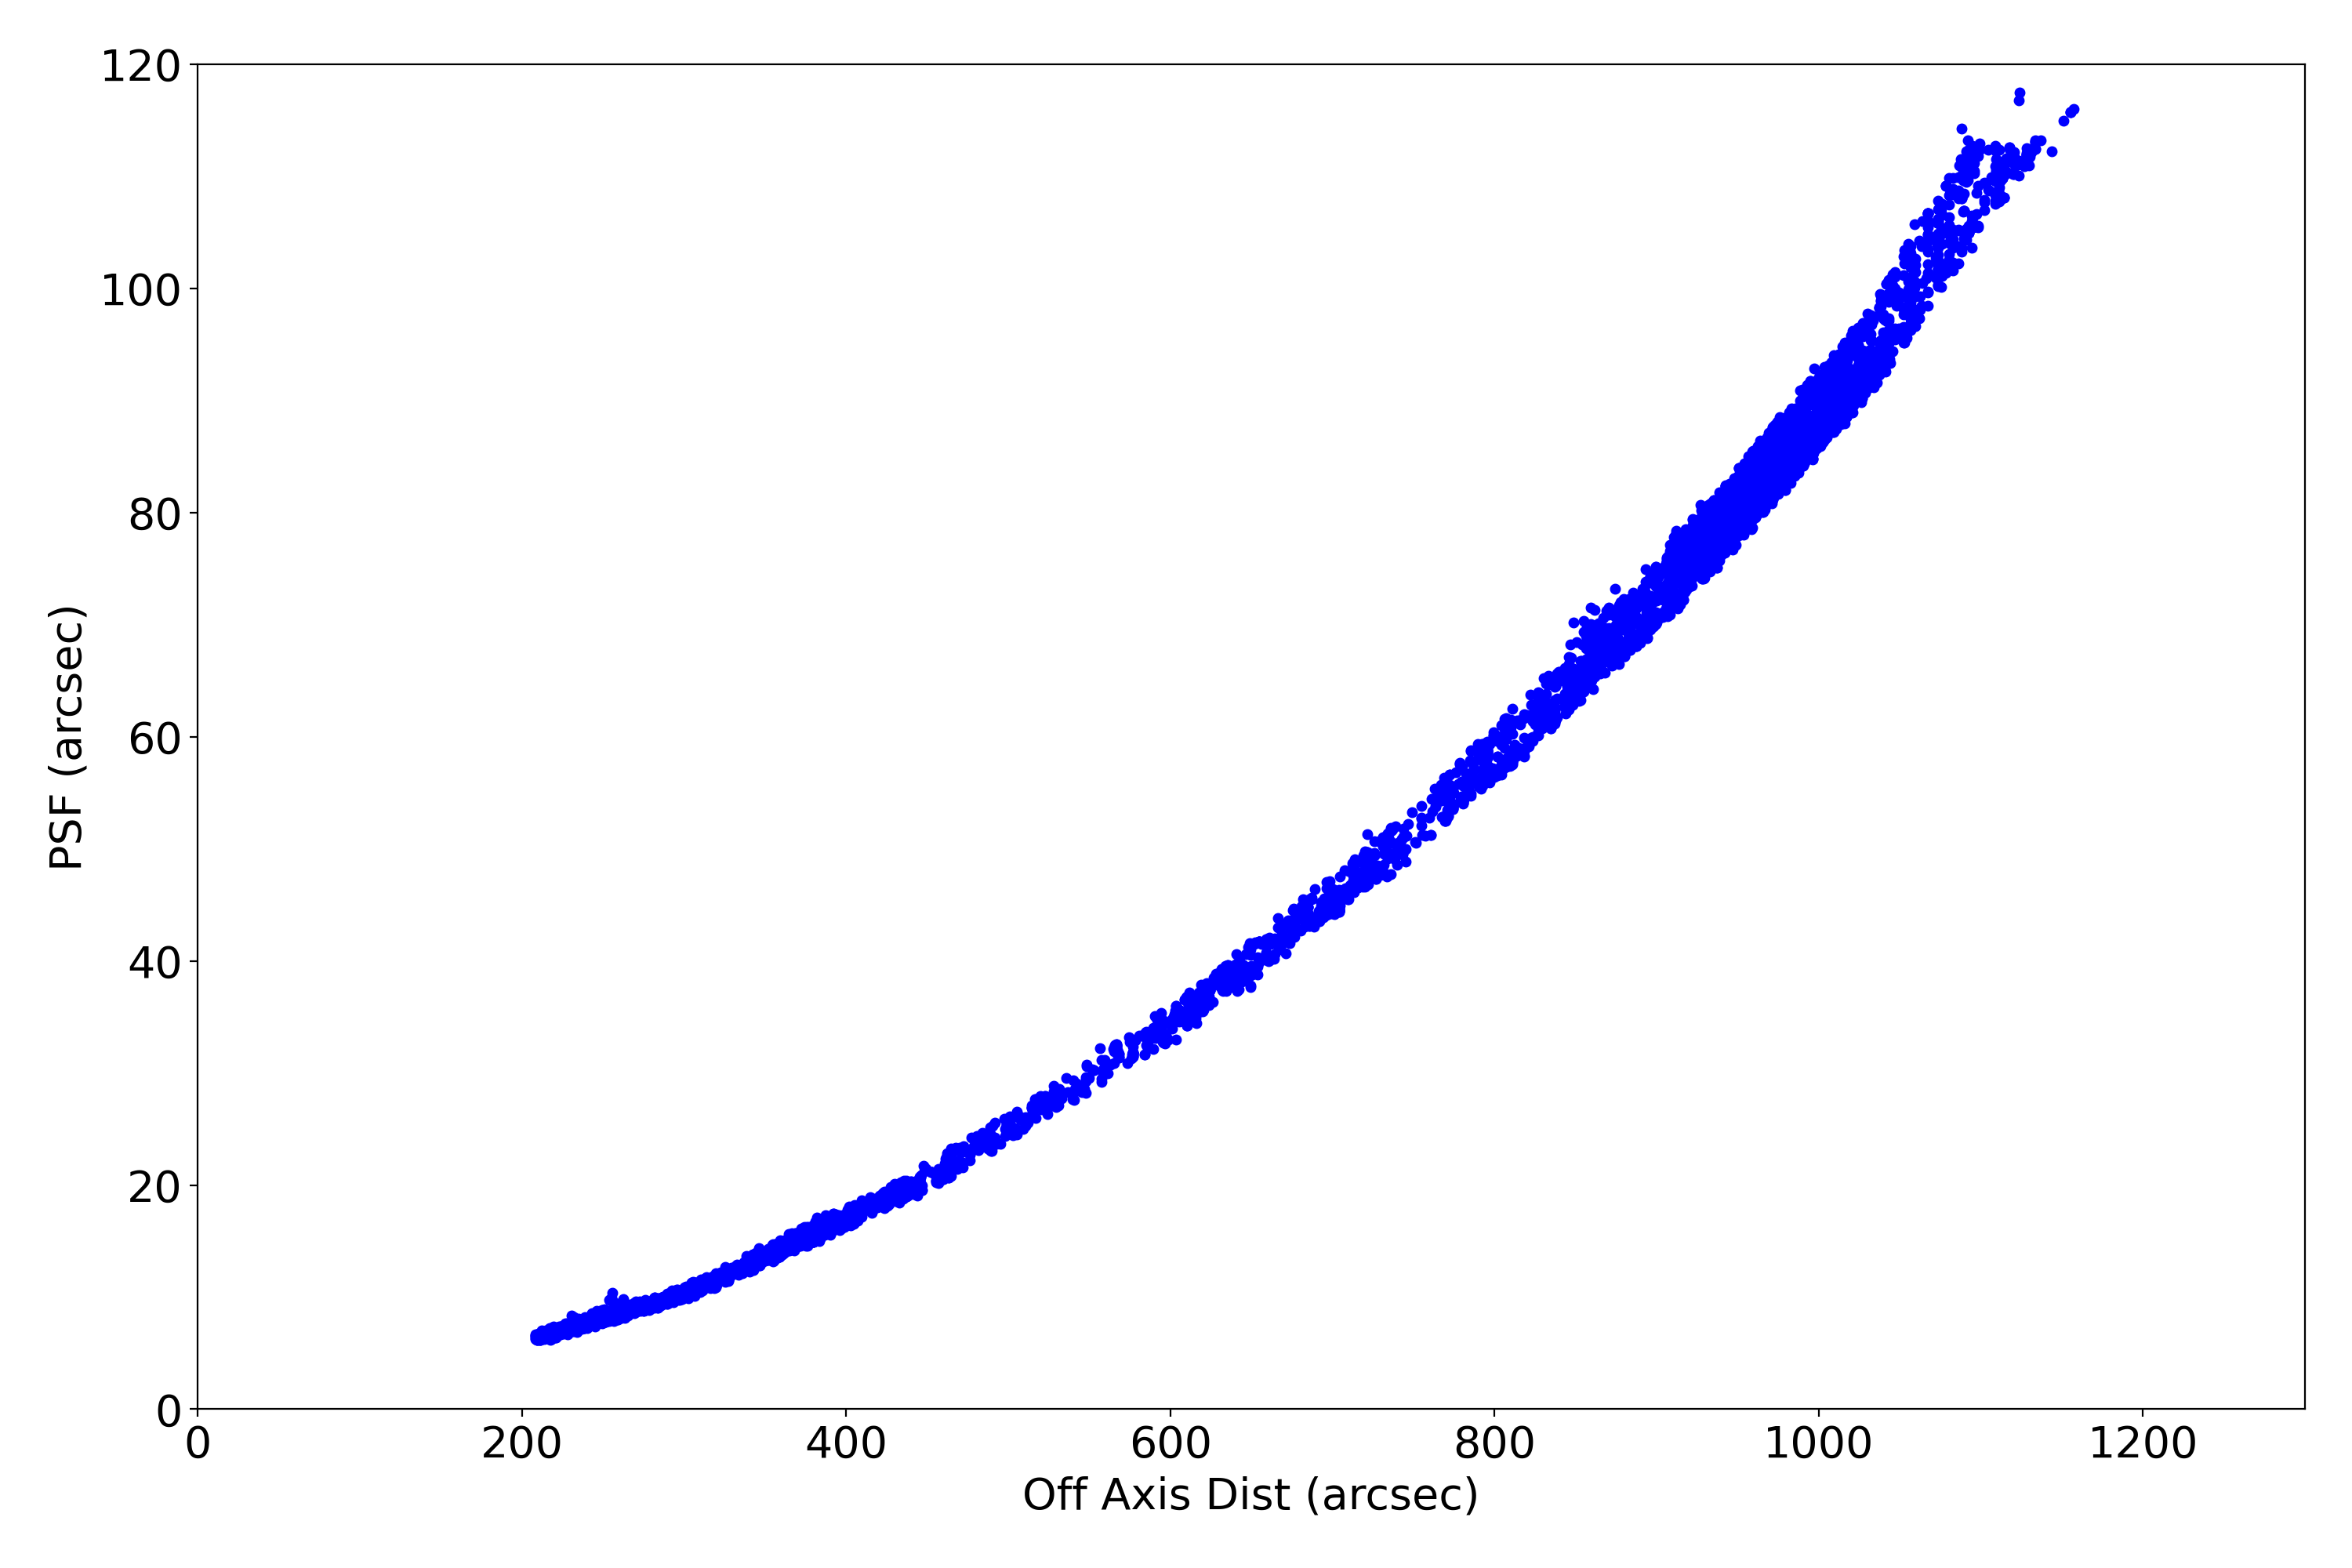
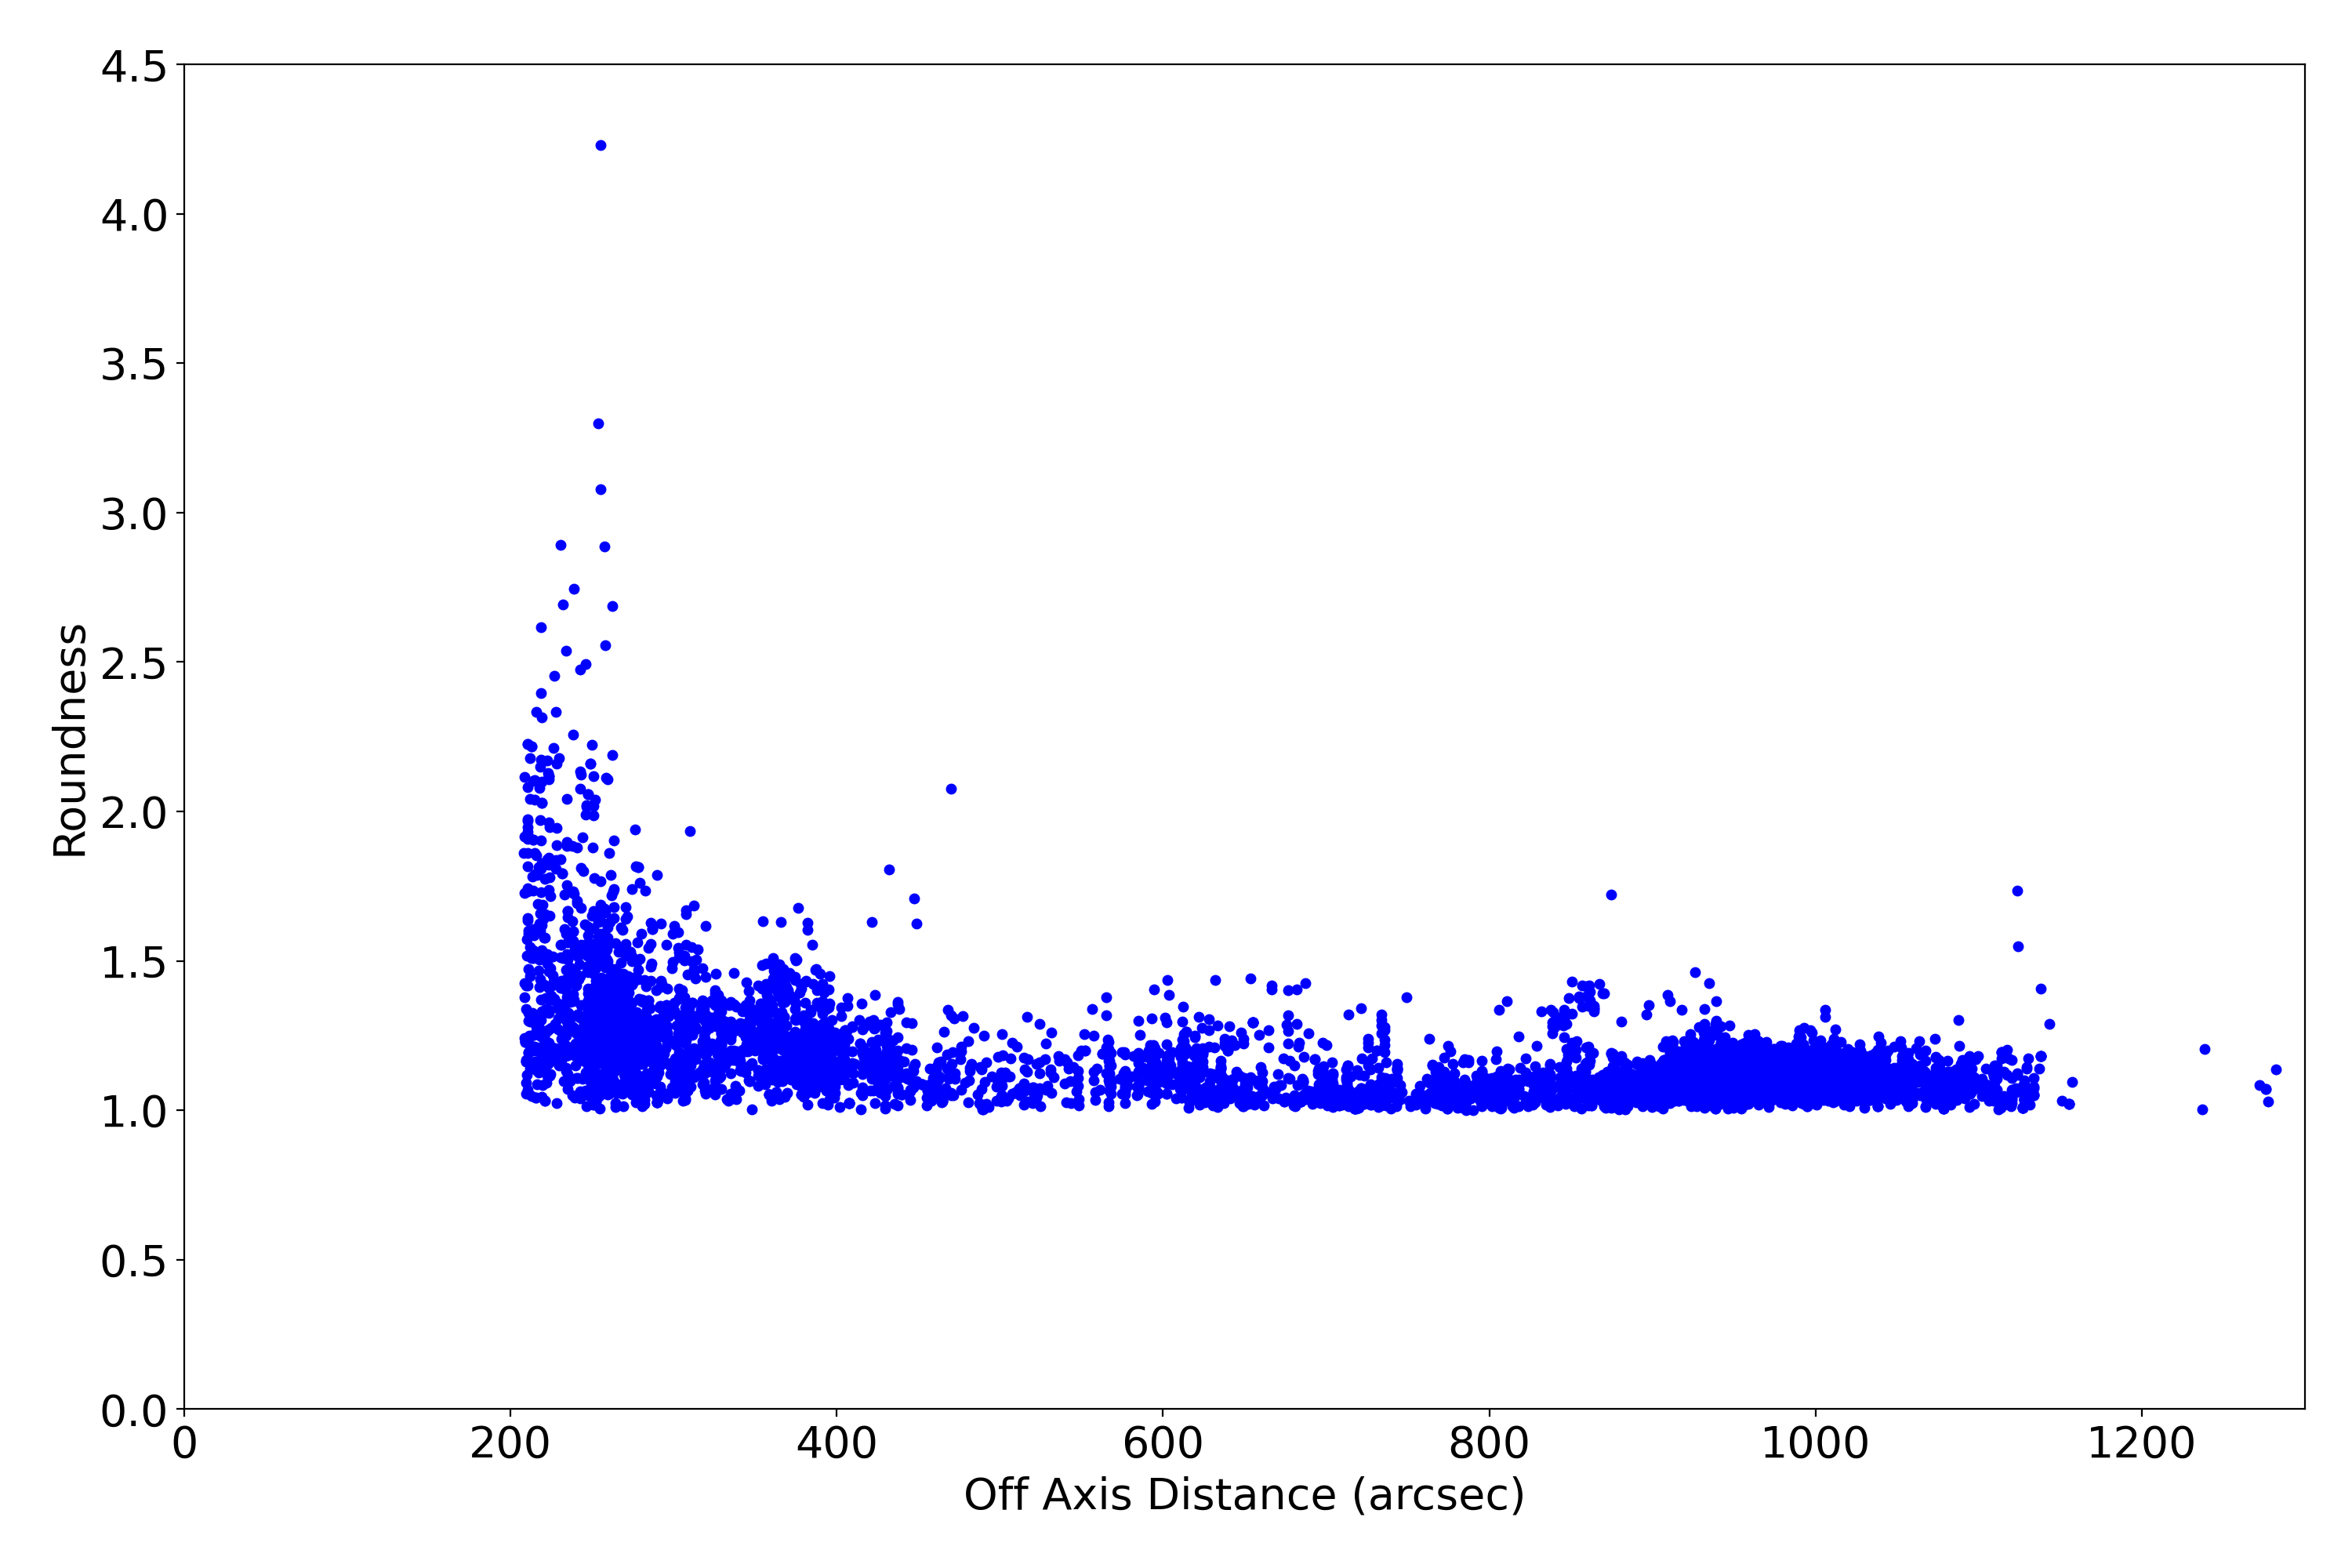
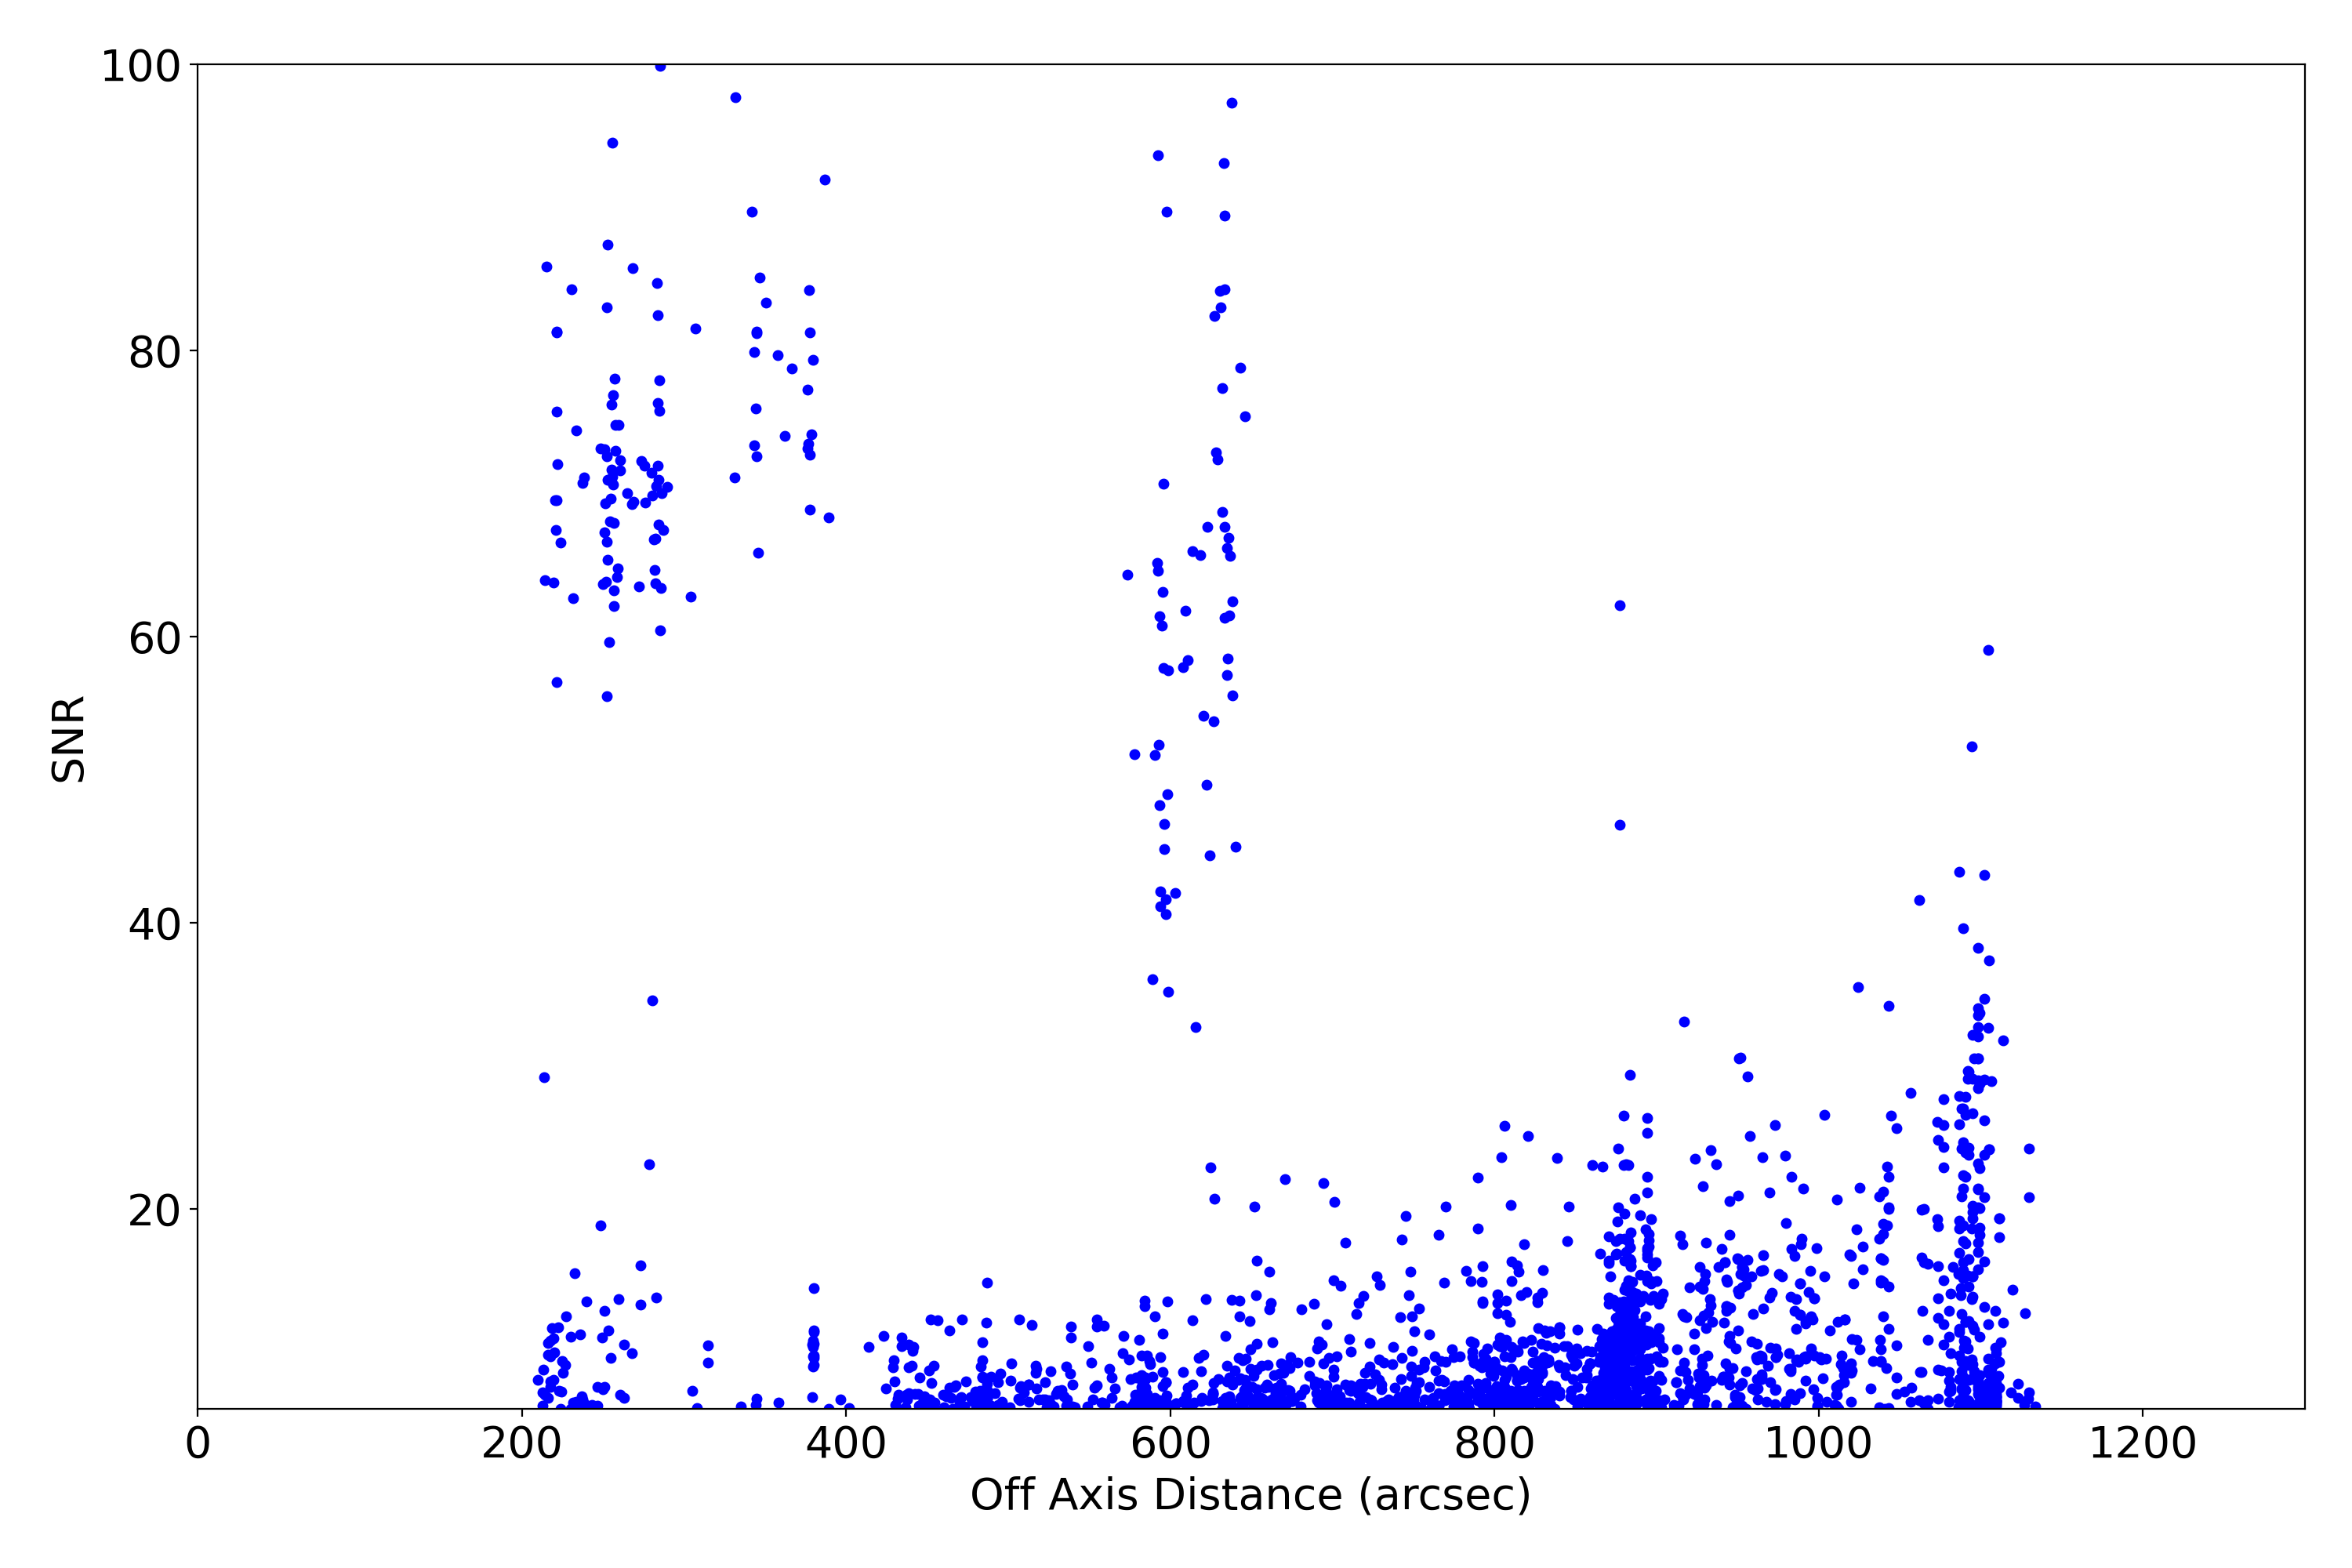
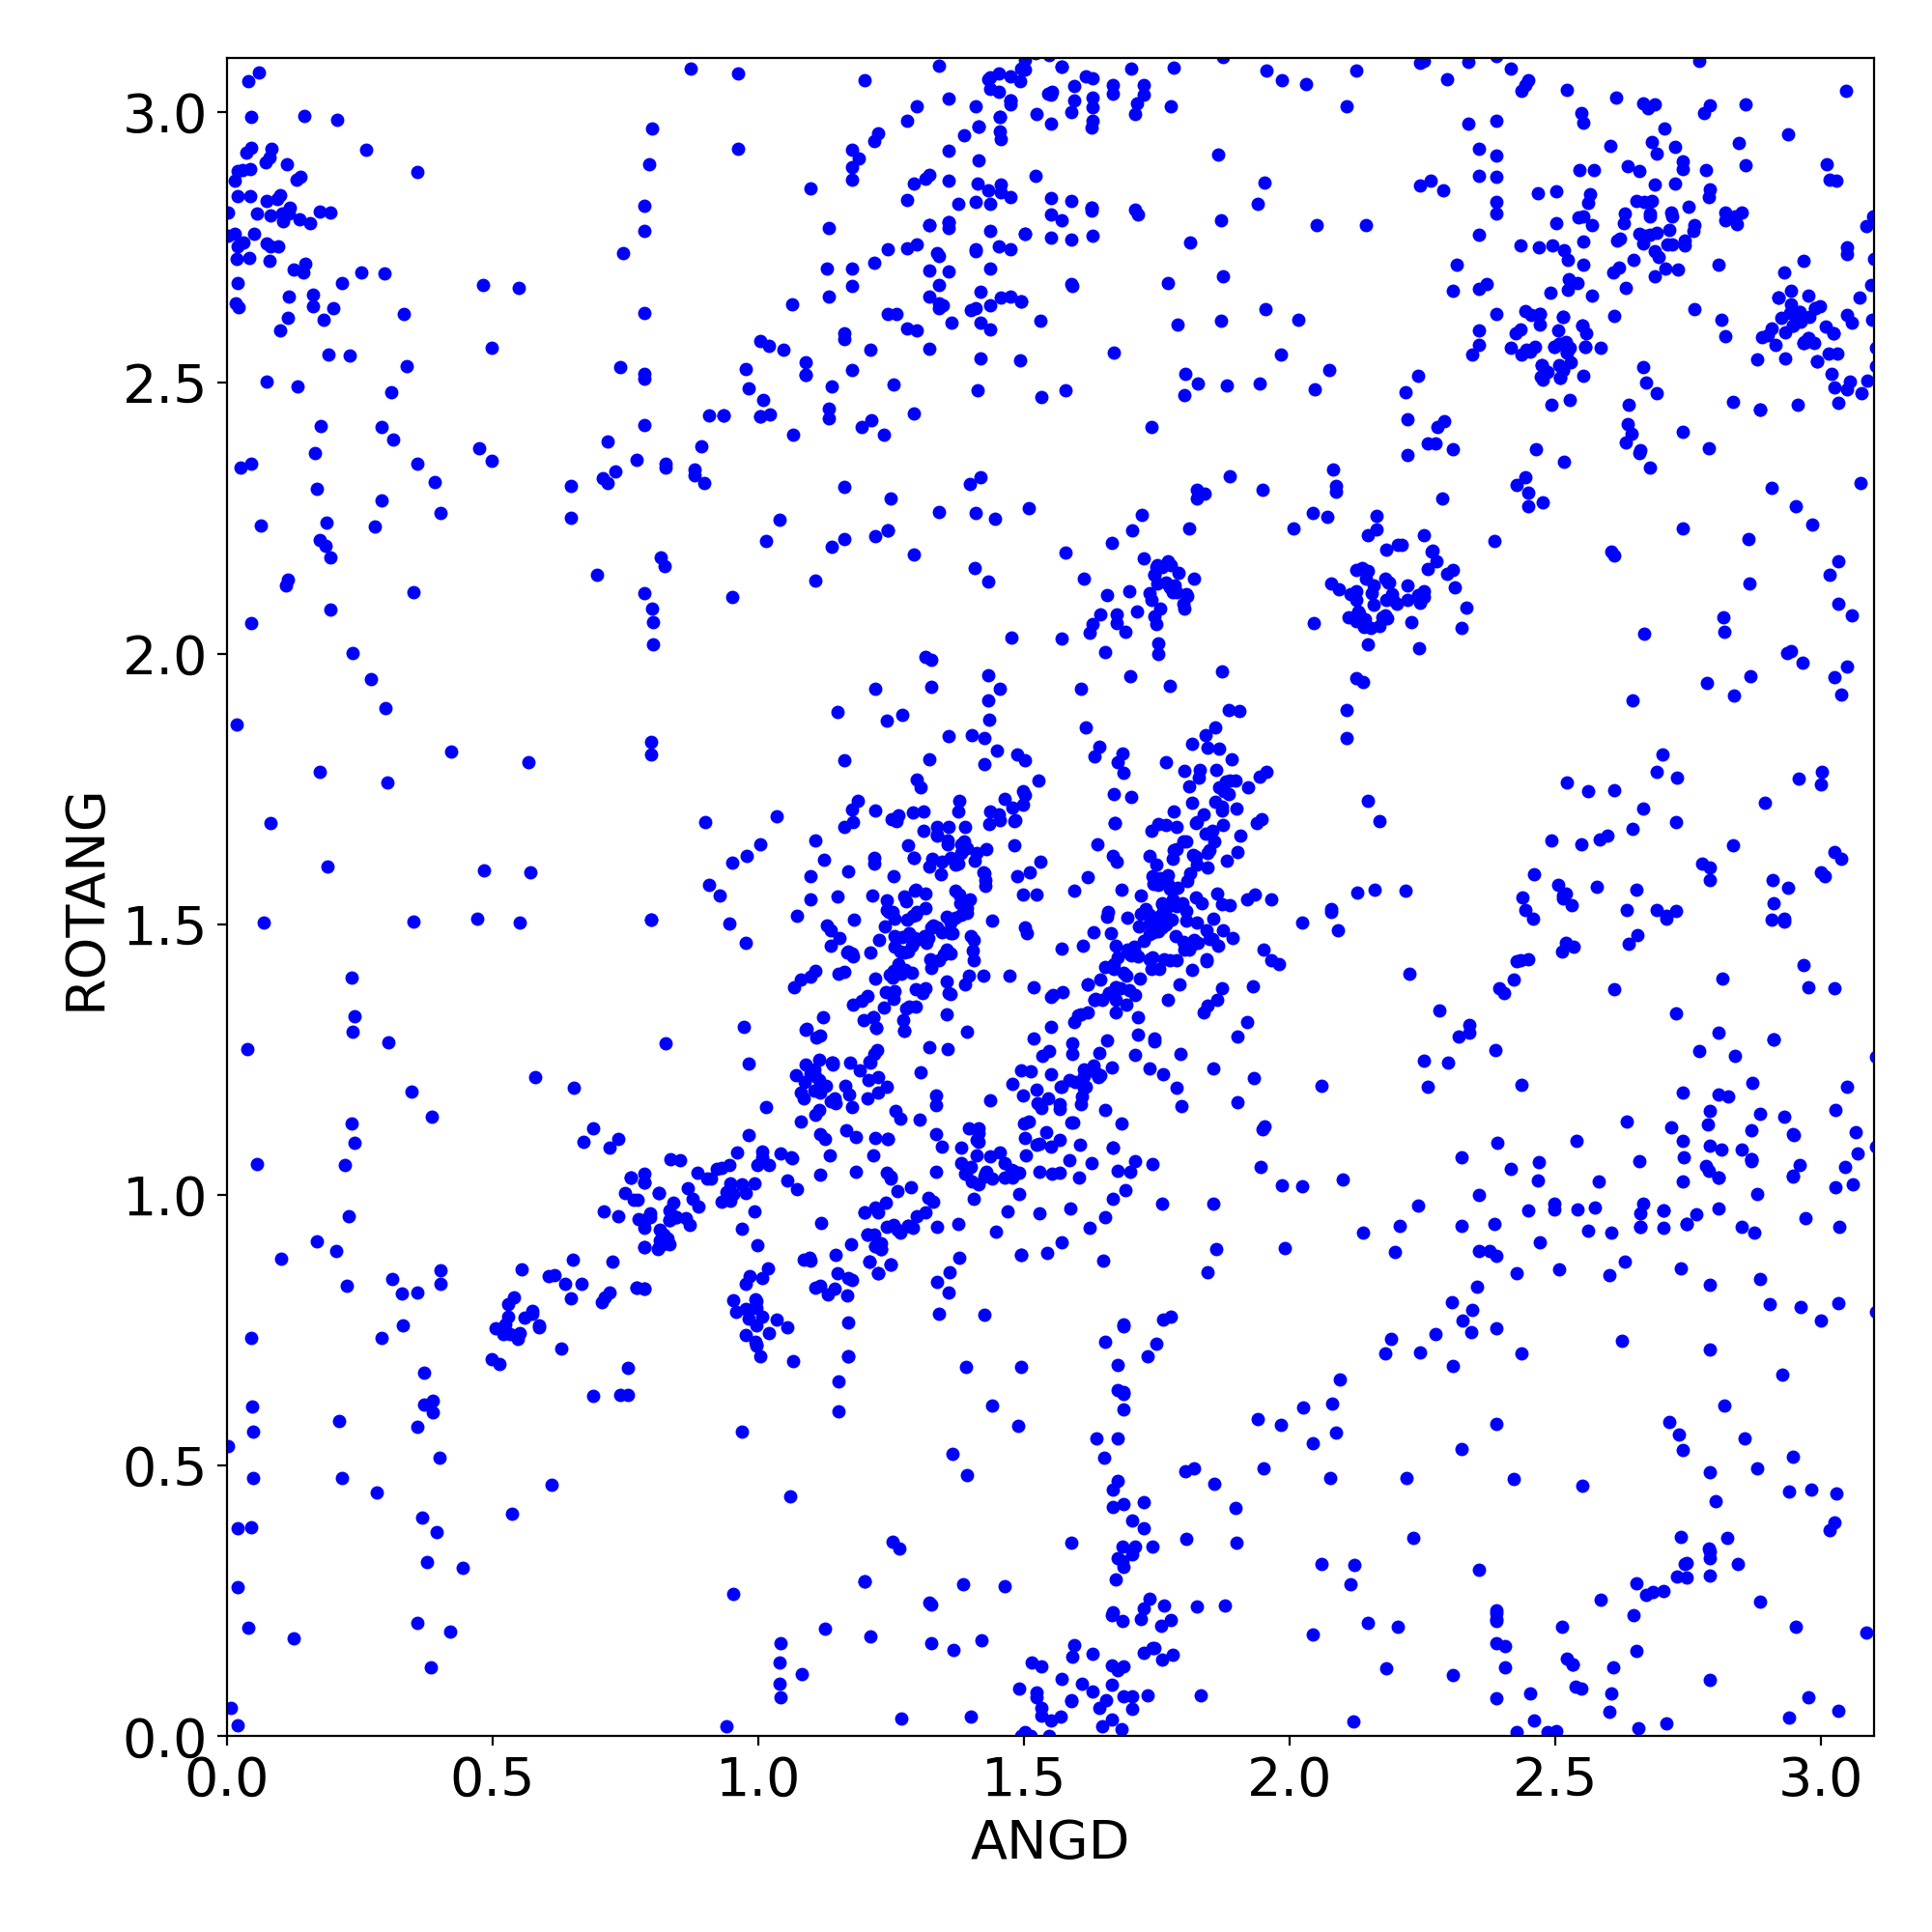
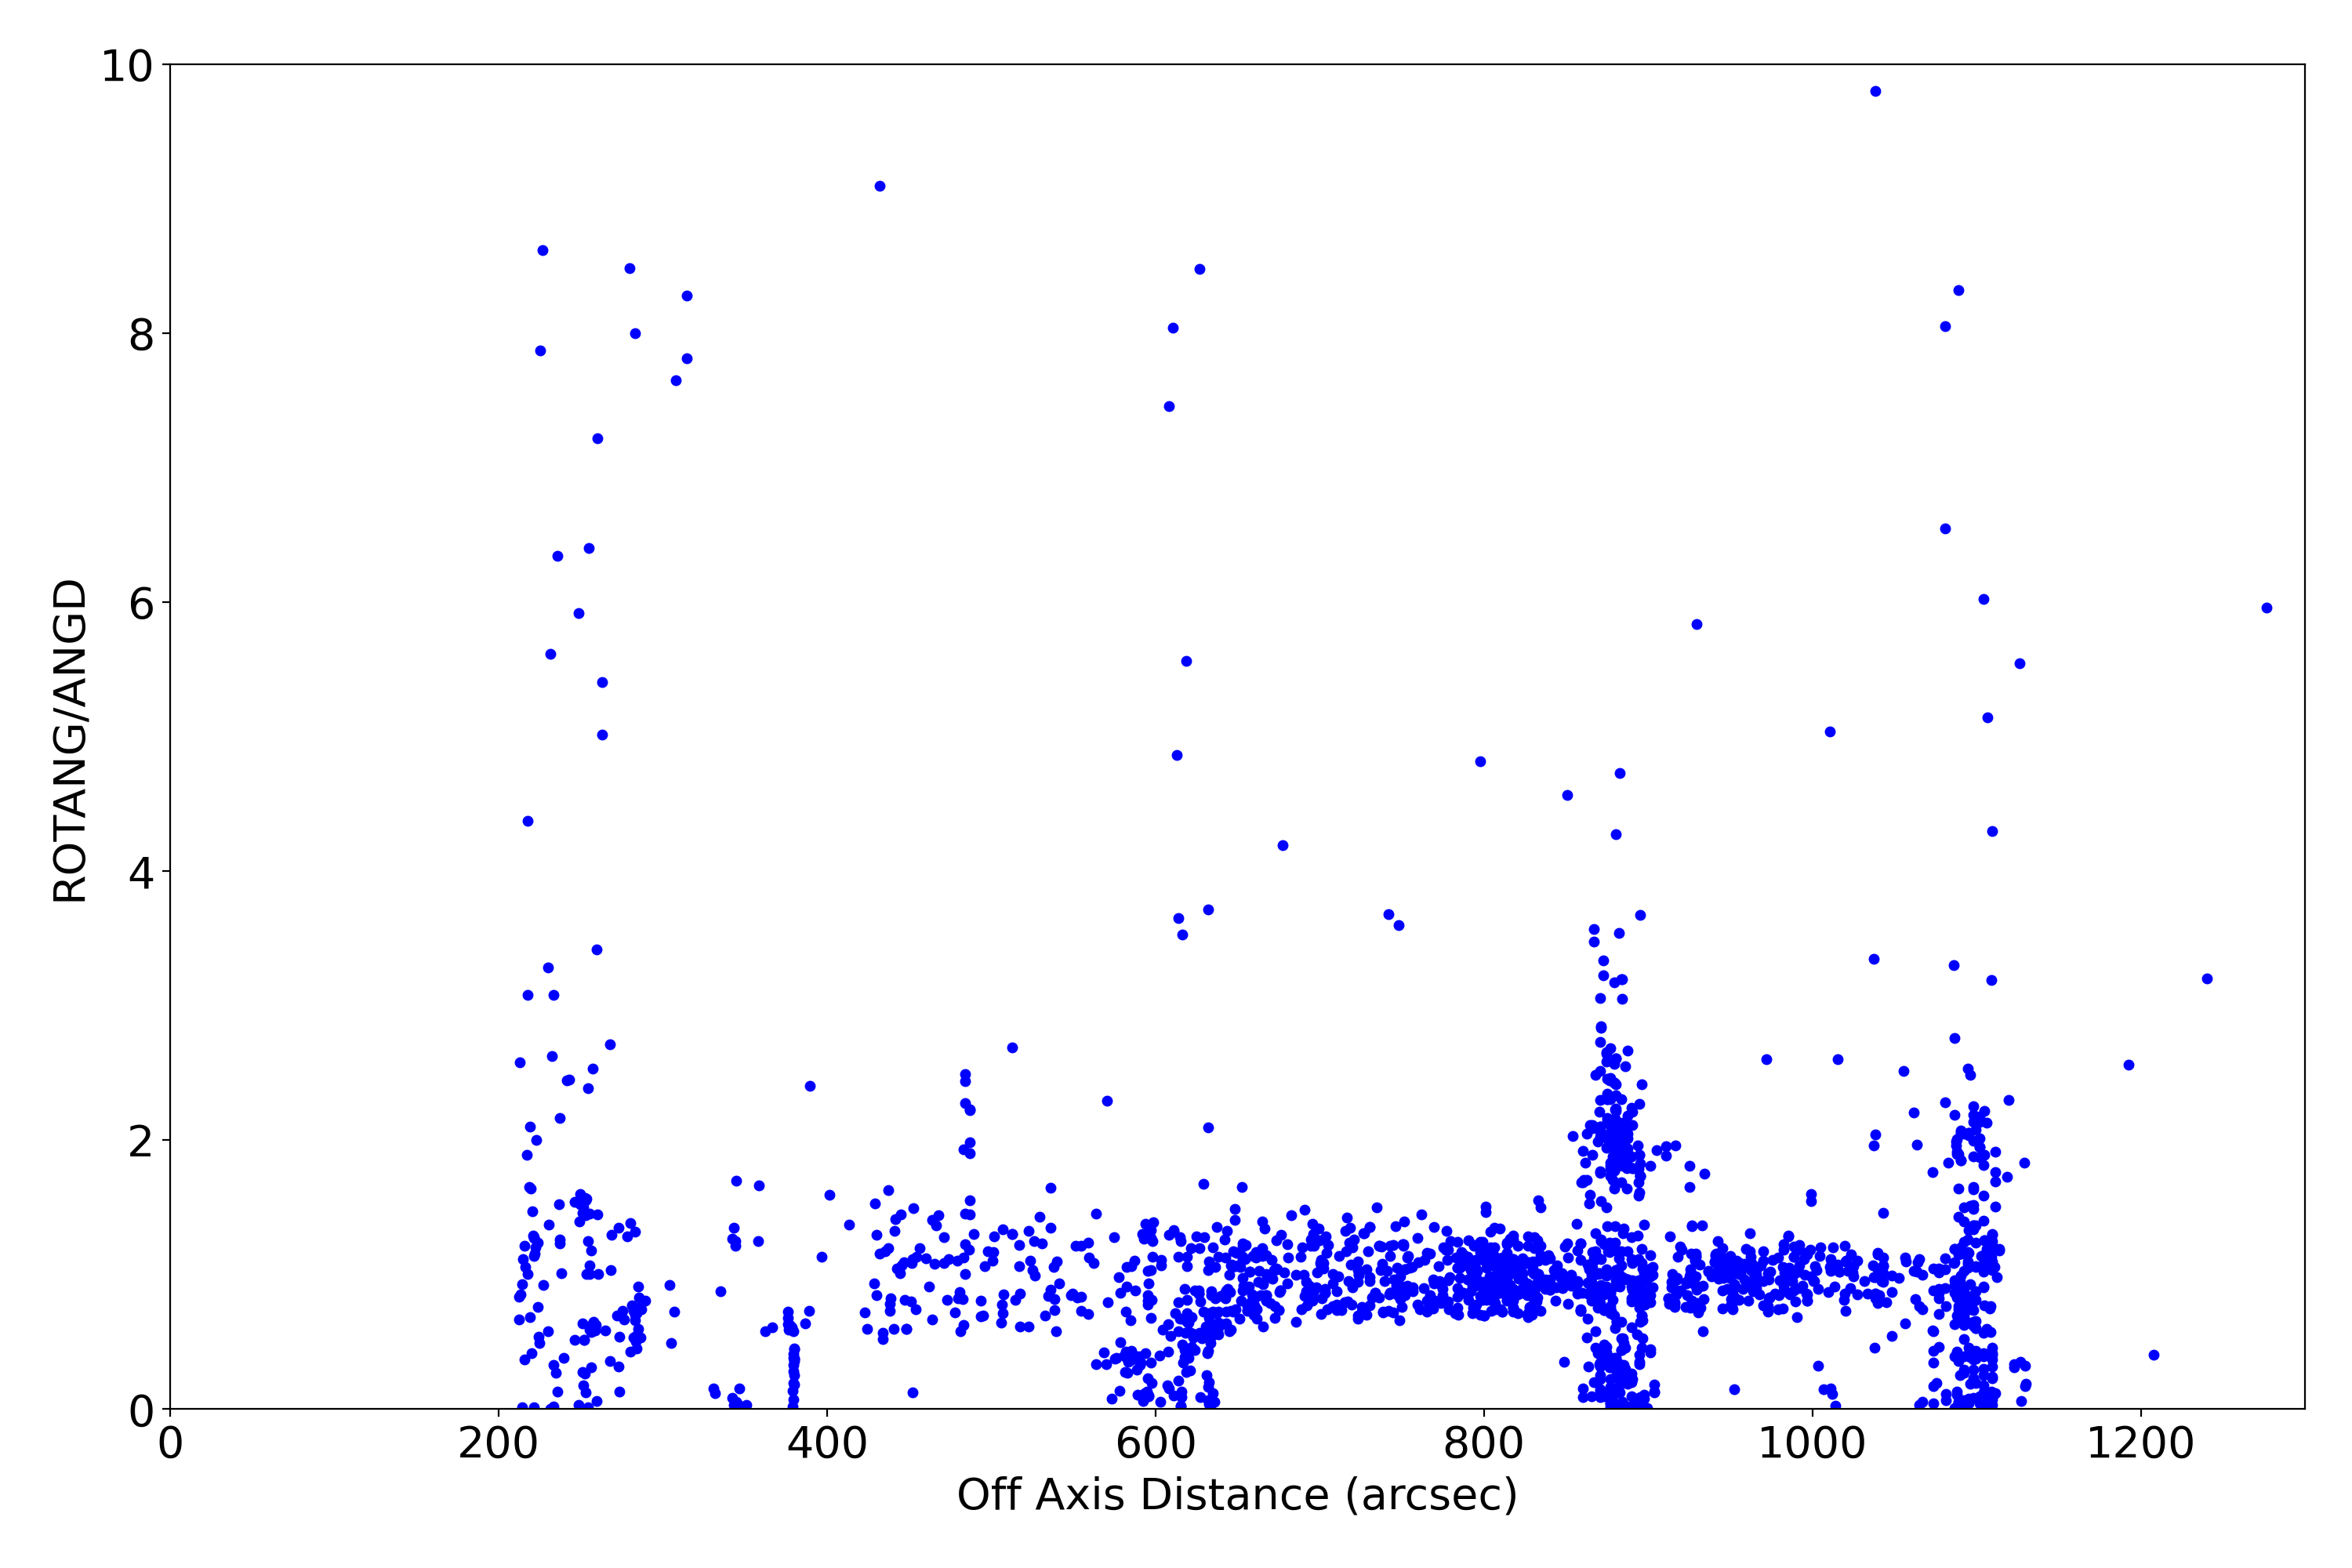
Plots below show various characteristics of detected imaging sources. Standard level 2 data products (*src2.fits) are used. Only observations with focus (sim_x) within 0.01 mm of nominal value for given SI configuration are used. Sources are also filtered for strength (SNR > 15).
| XY | PSF | Roundness | EE Radius | SNR | Rotation | Rotation2 | |
|---|---|---|---|---|---|---|---|
| ACIS I | 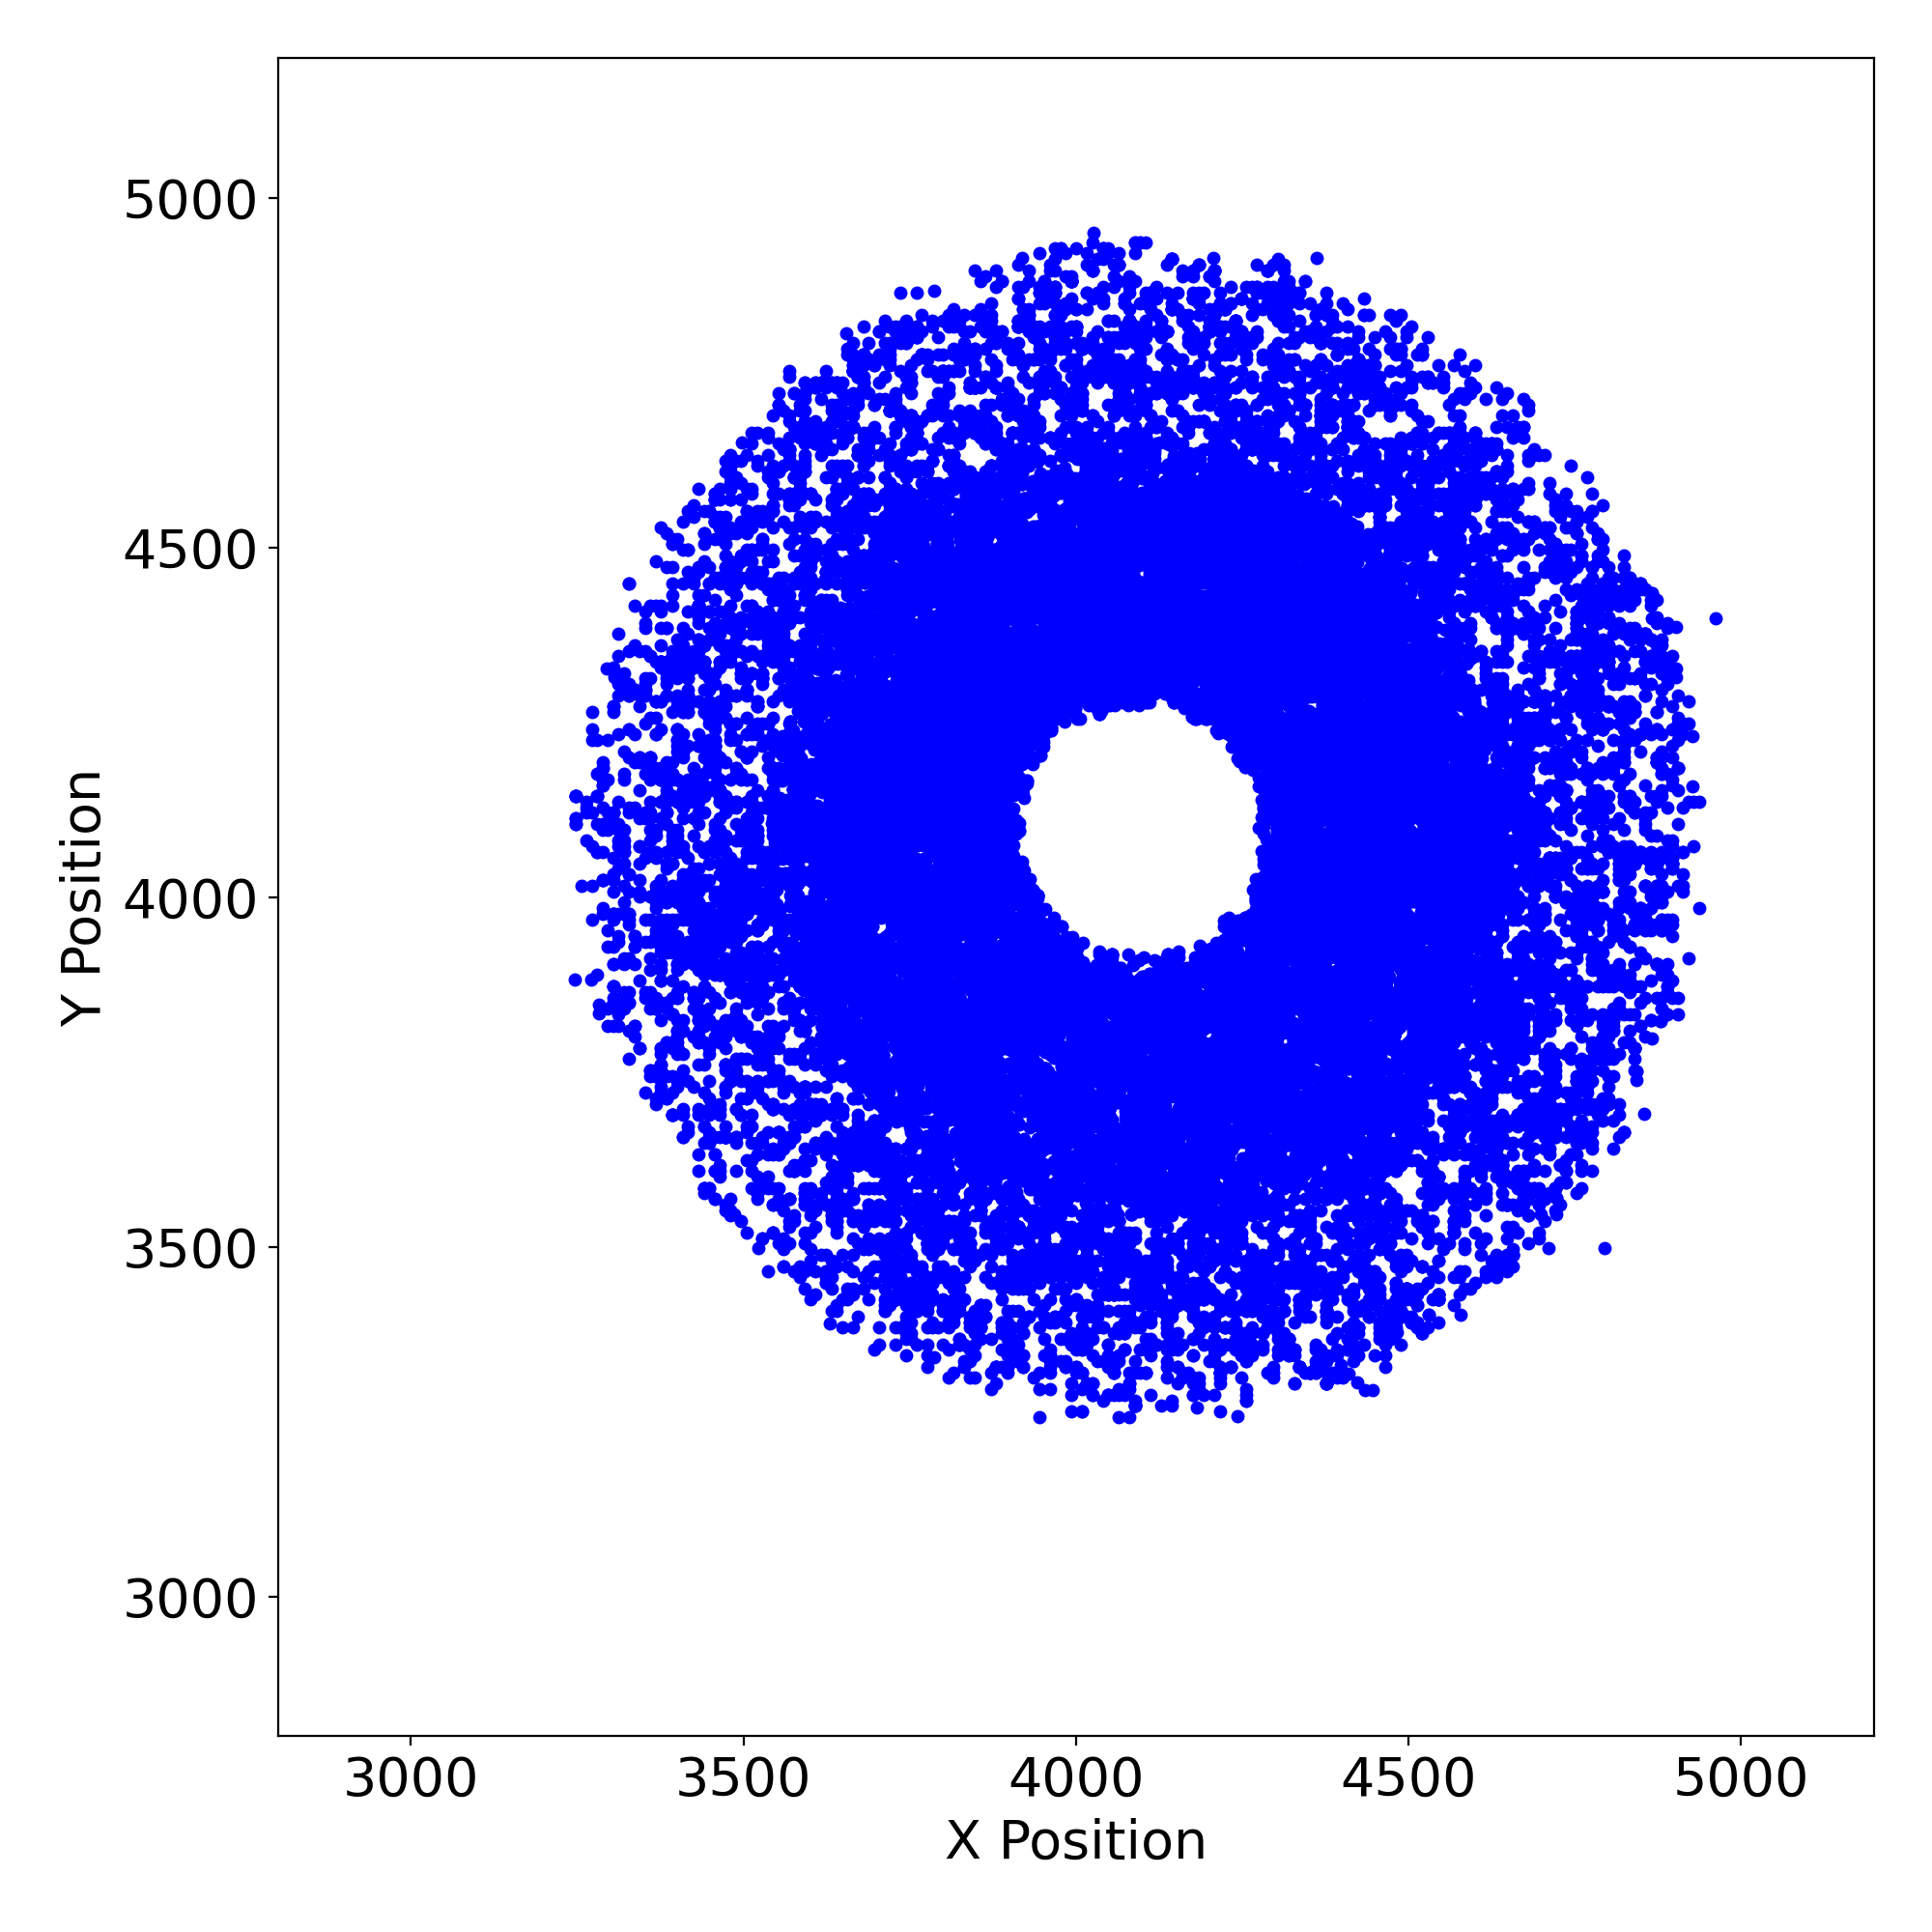 |
 |
 |
 |
 |
 |
 |
| ACIS S | 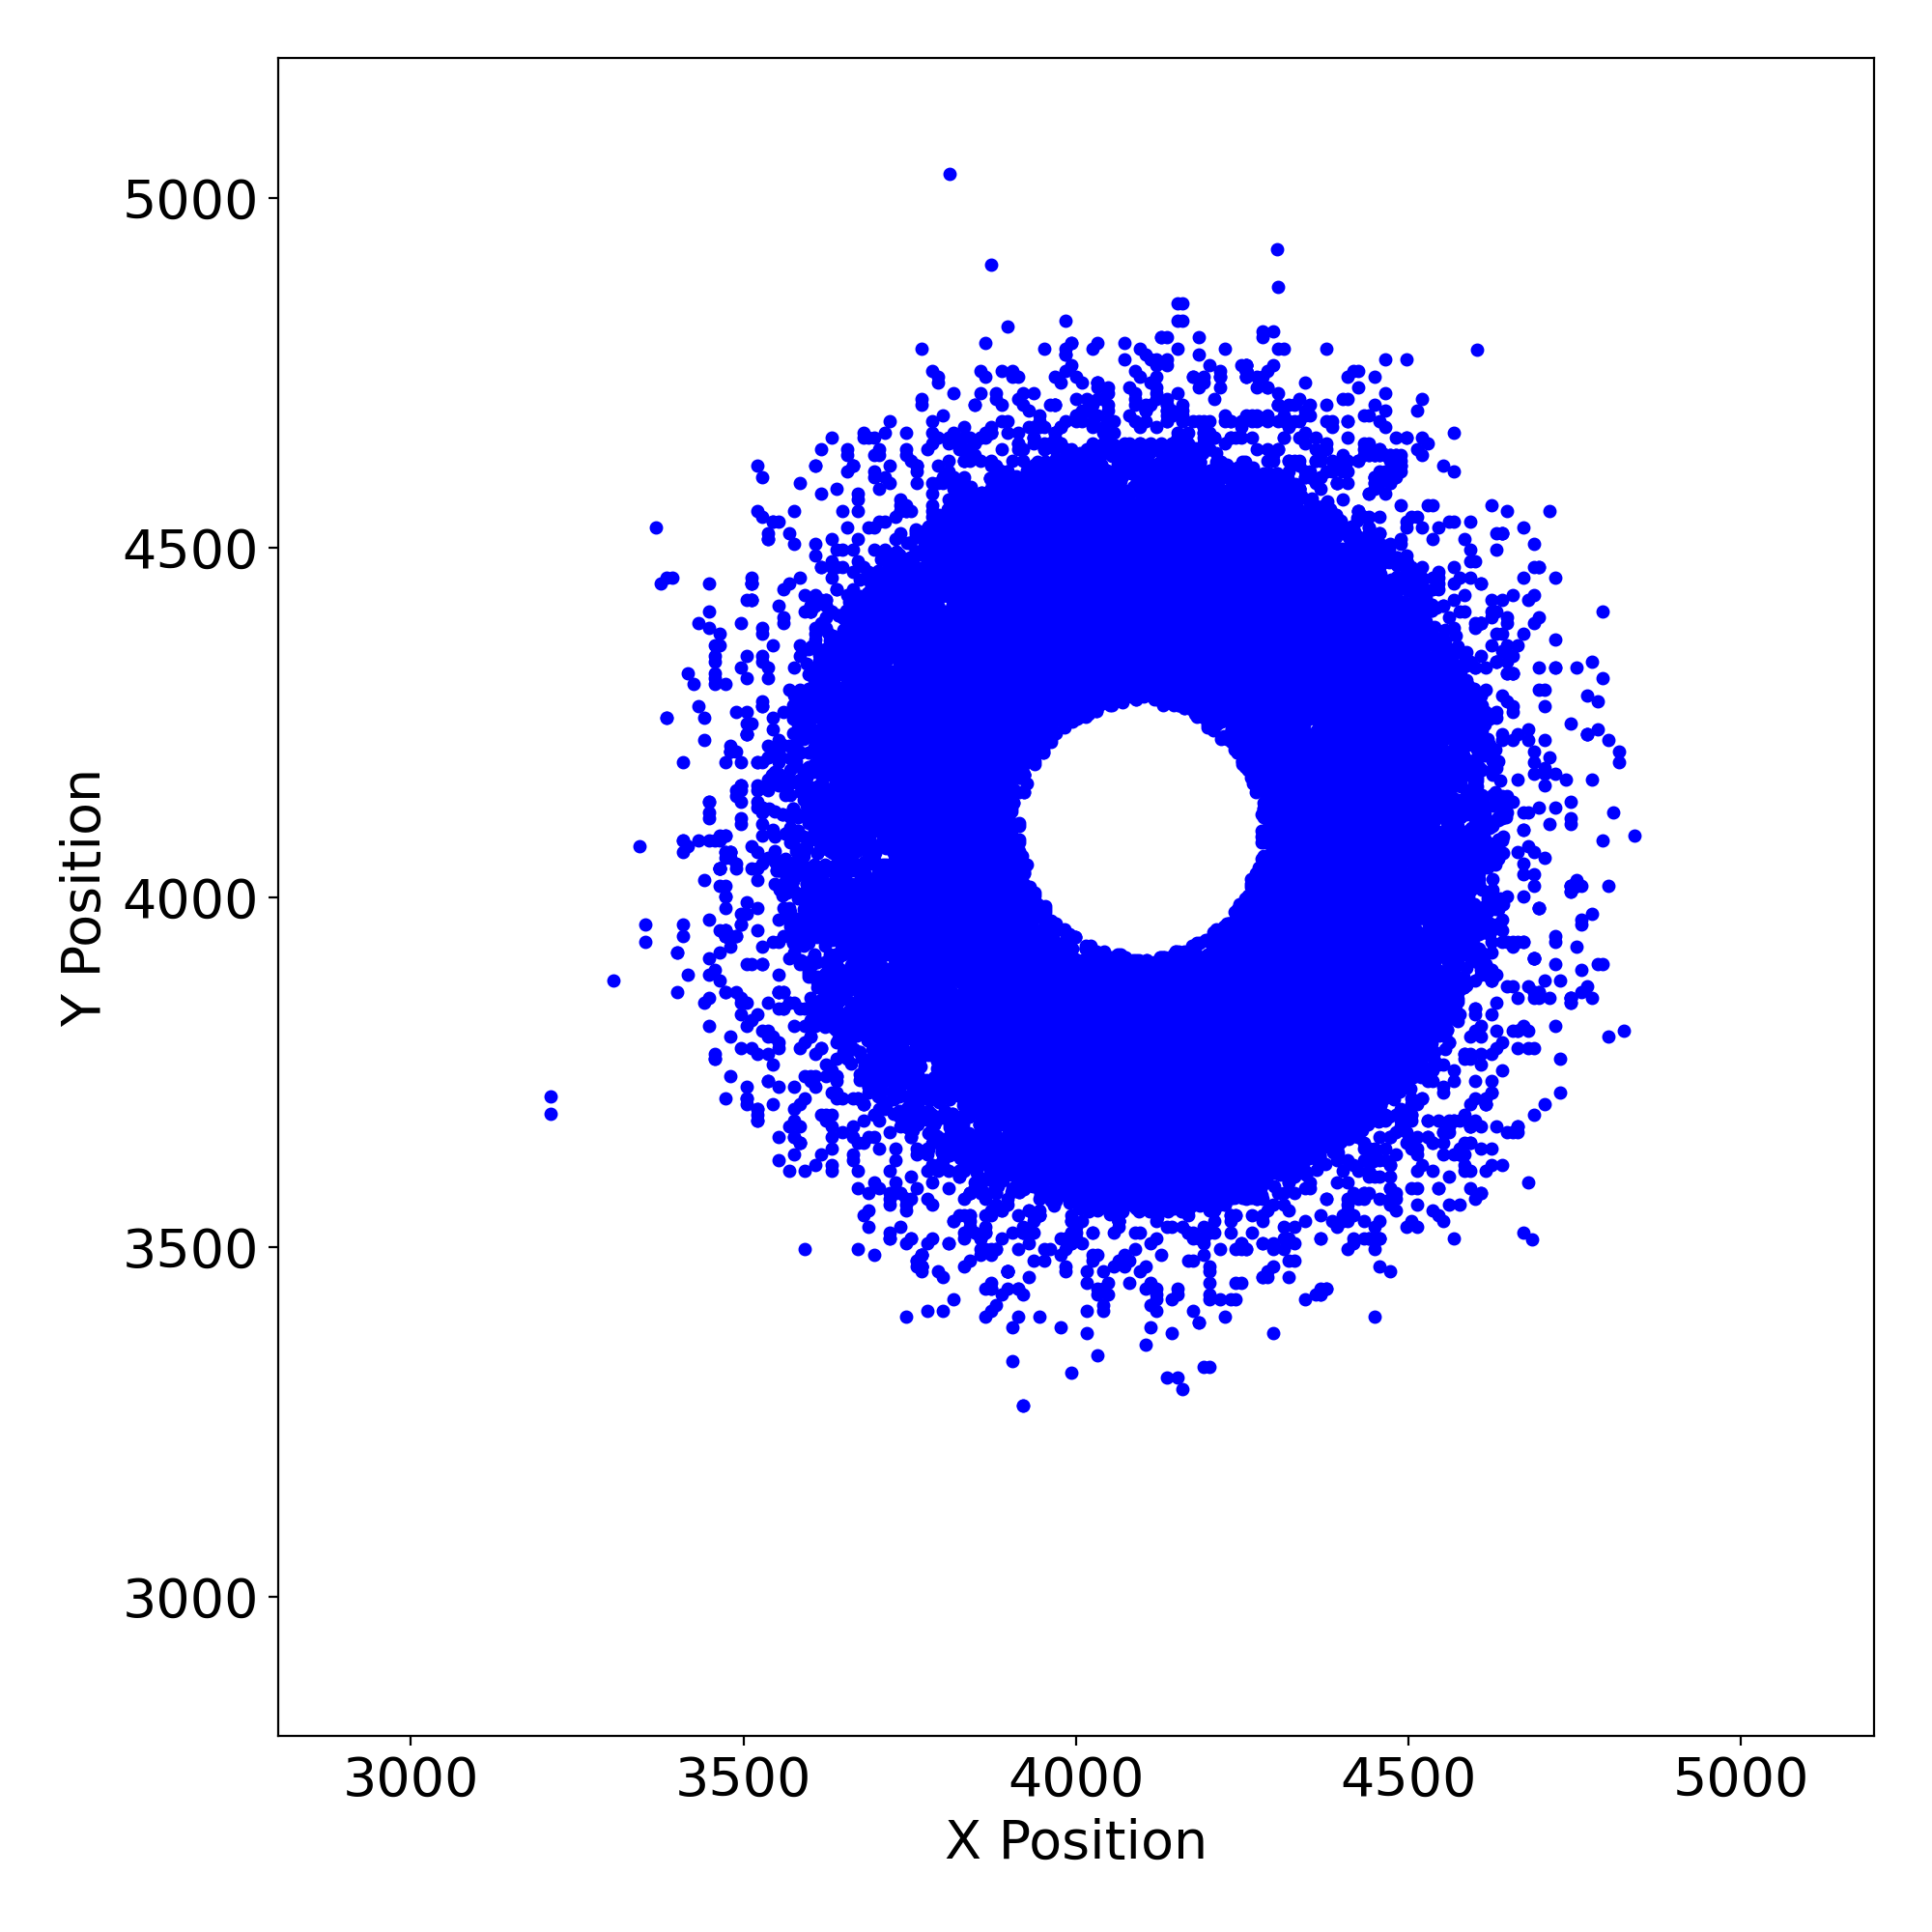 |
 |
 |
 |
 |
 |
 |
| HRC I | 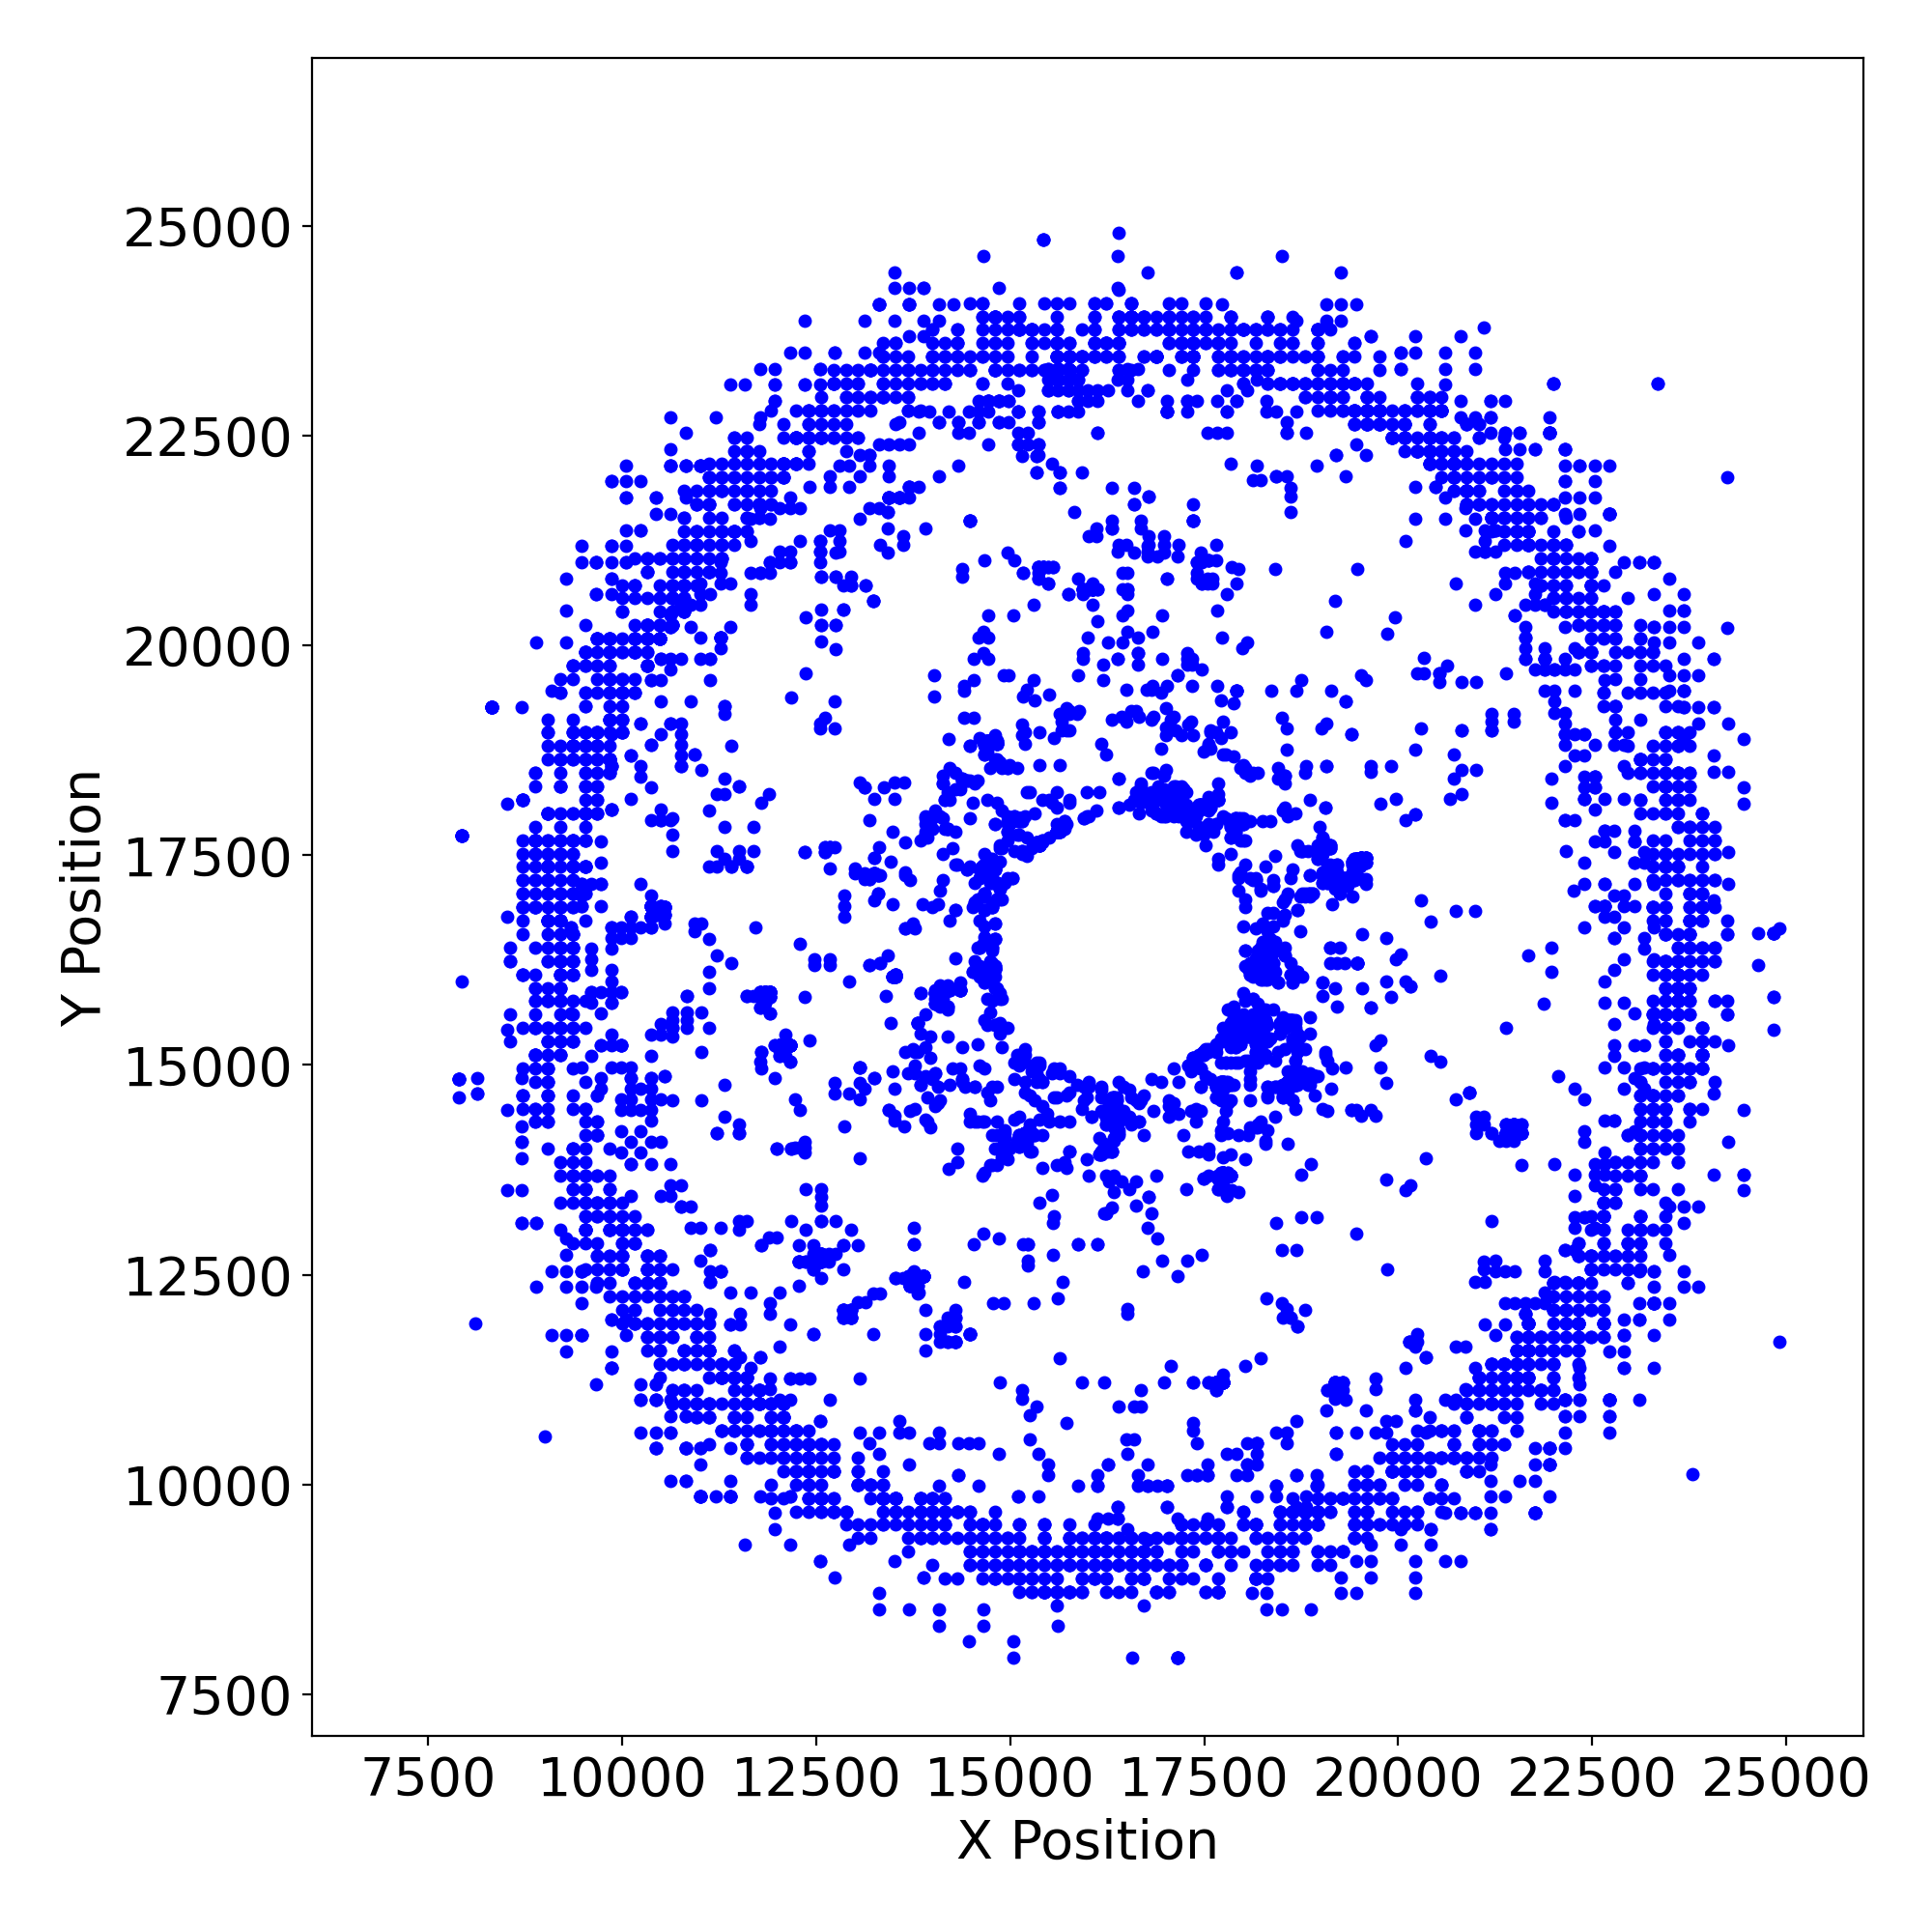 |
 |
 |
 |
 |
 |
 |
| HRC S | 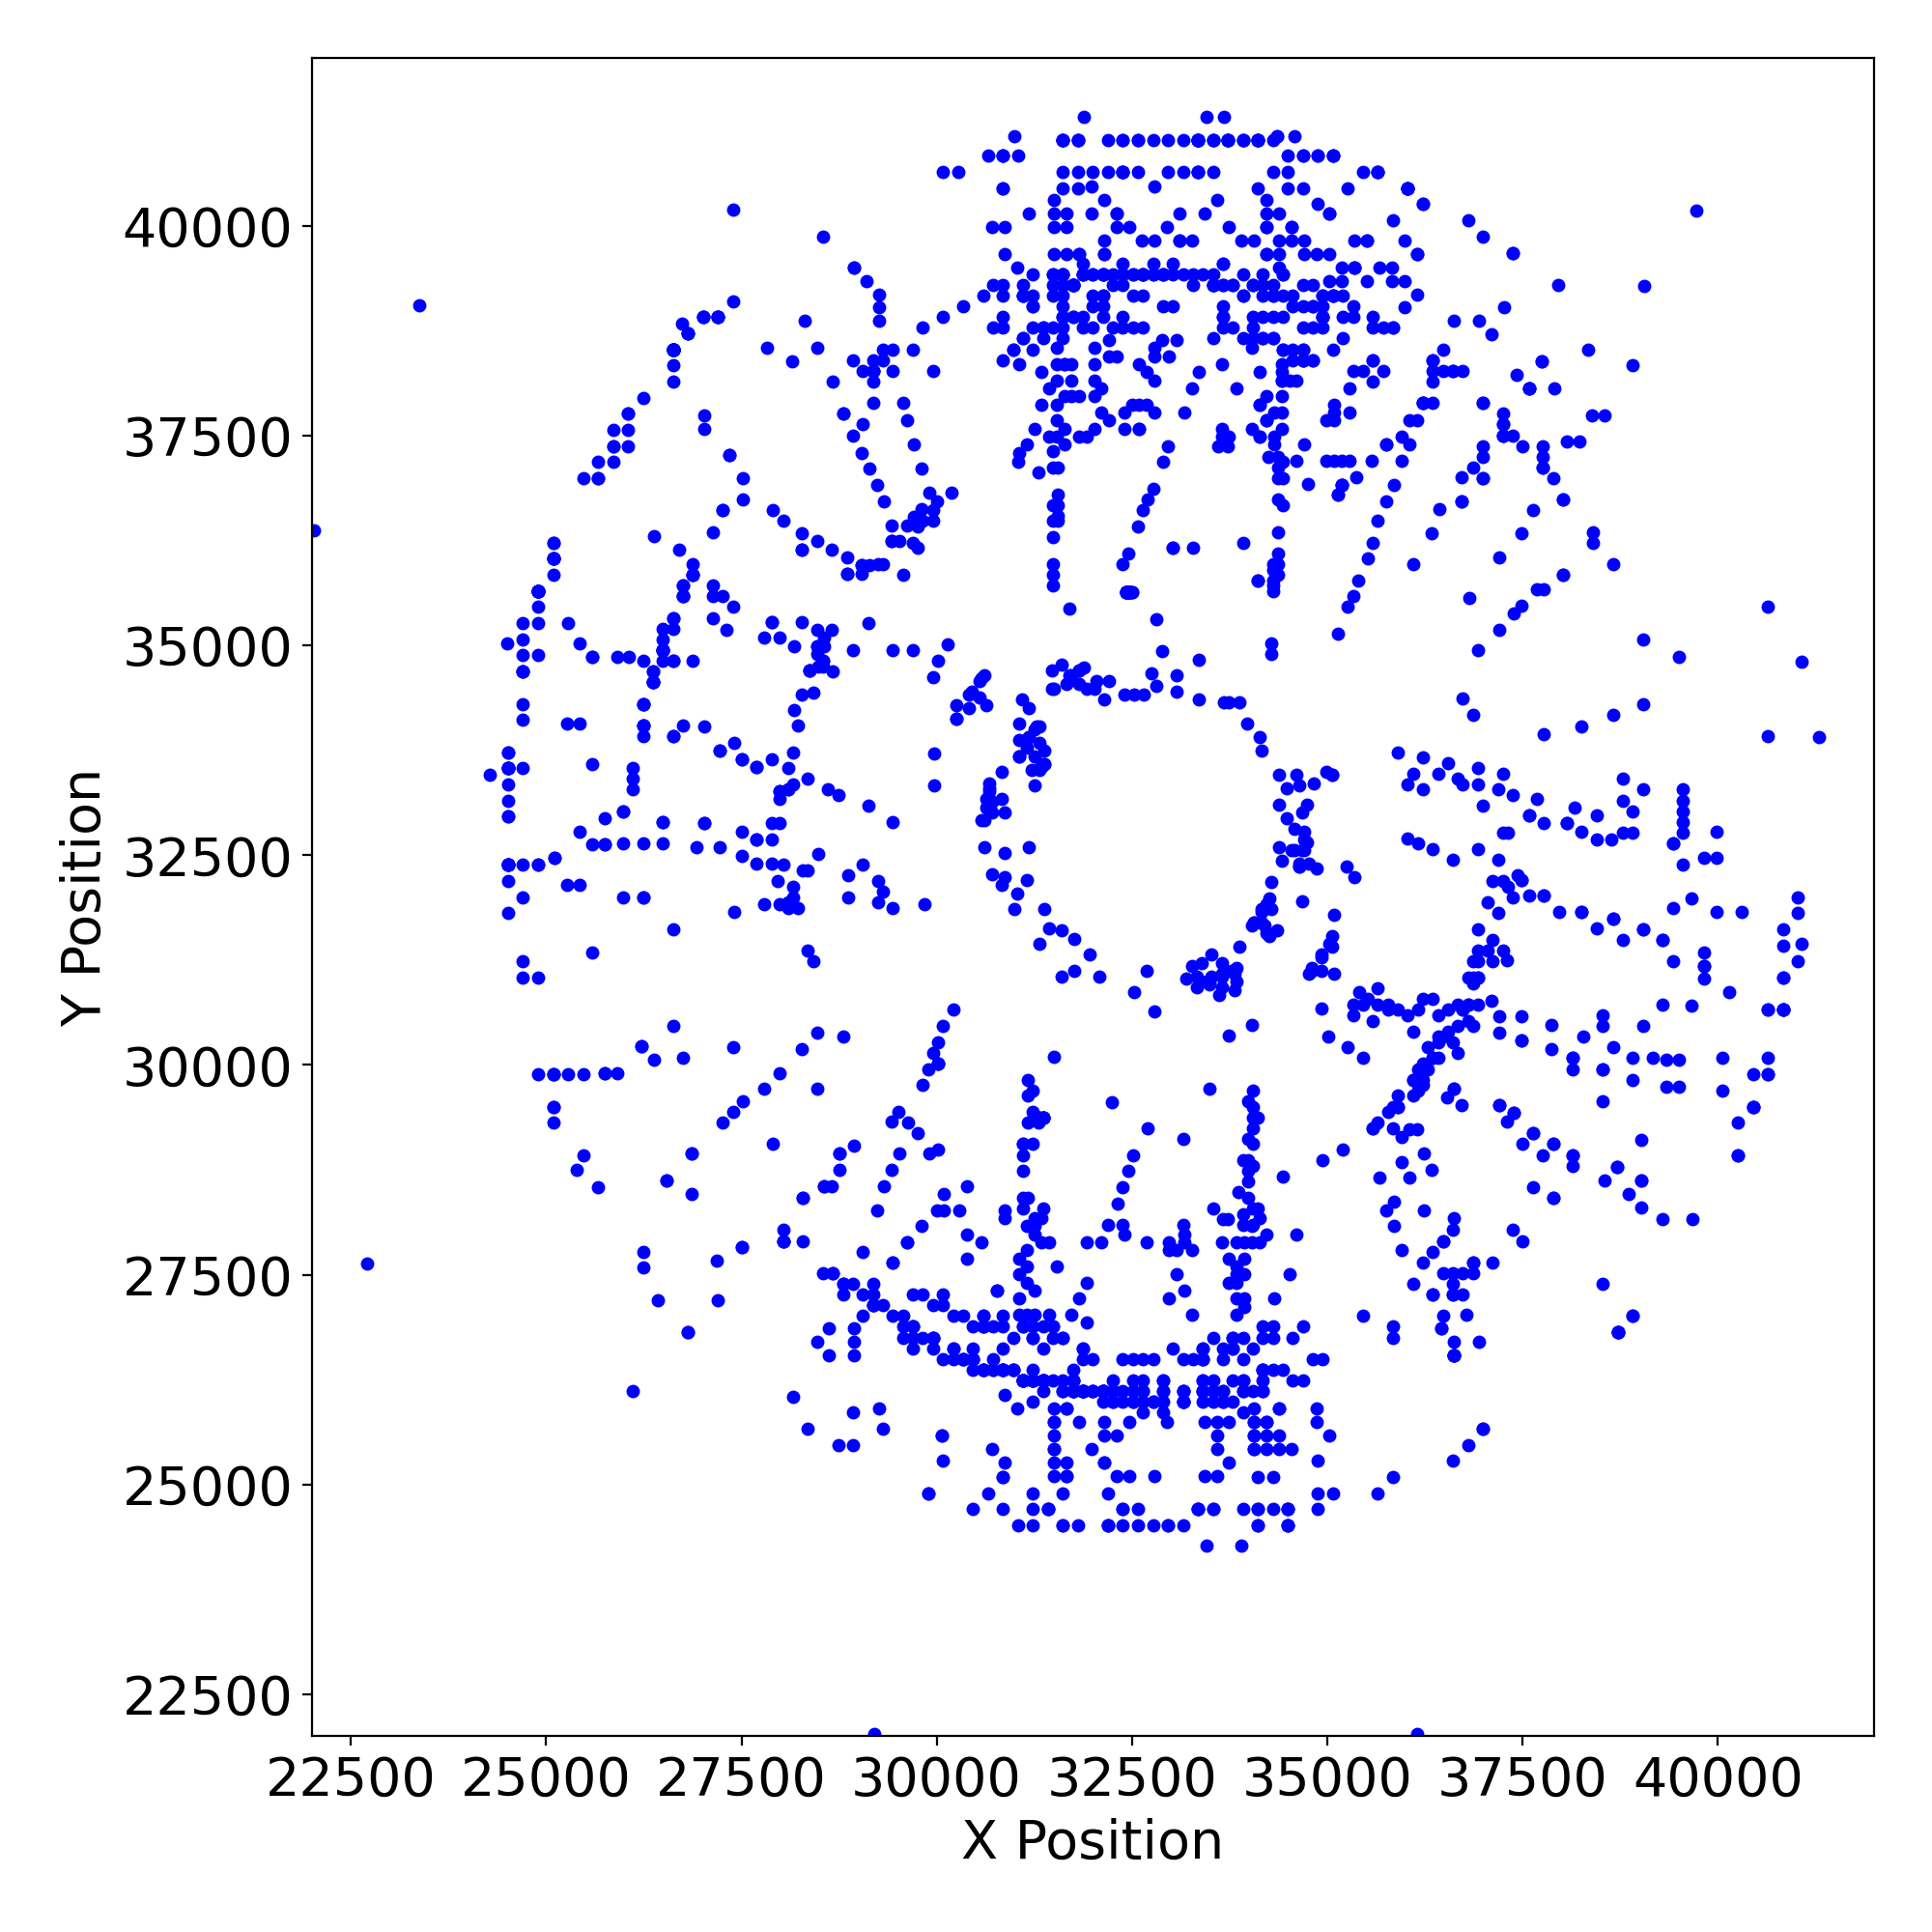 |
 |
 |
 |
 |
 |
 |
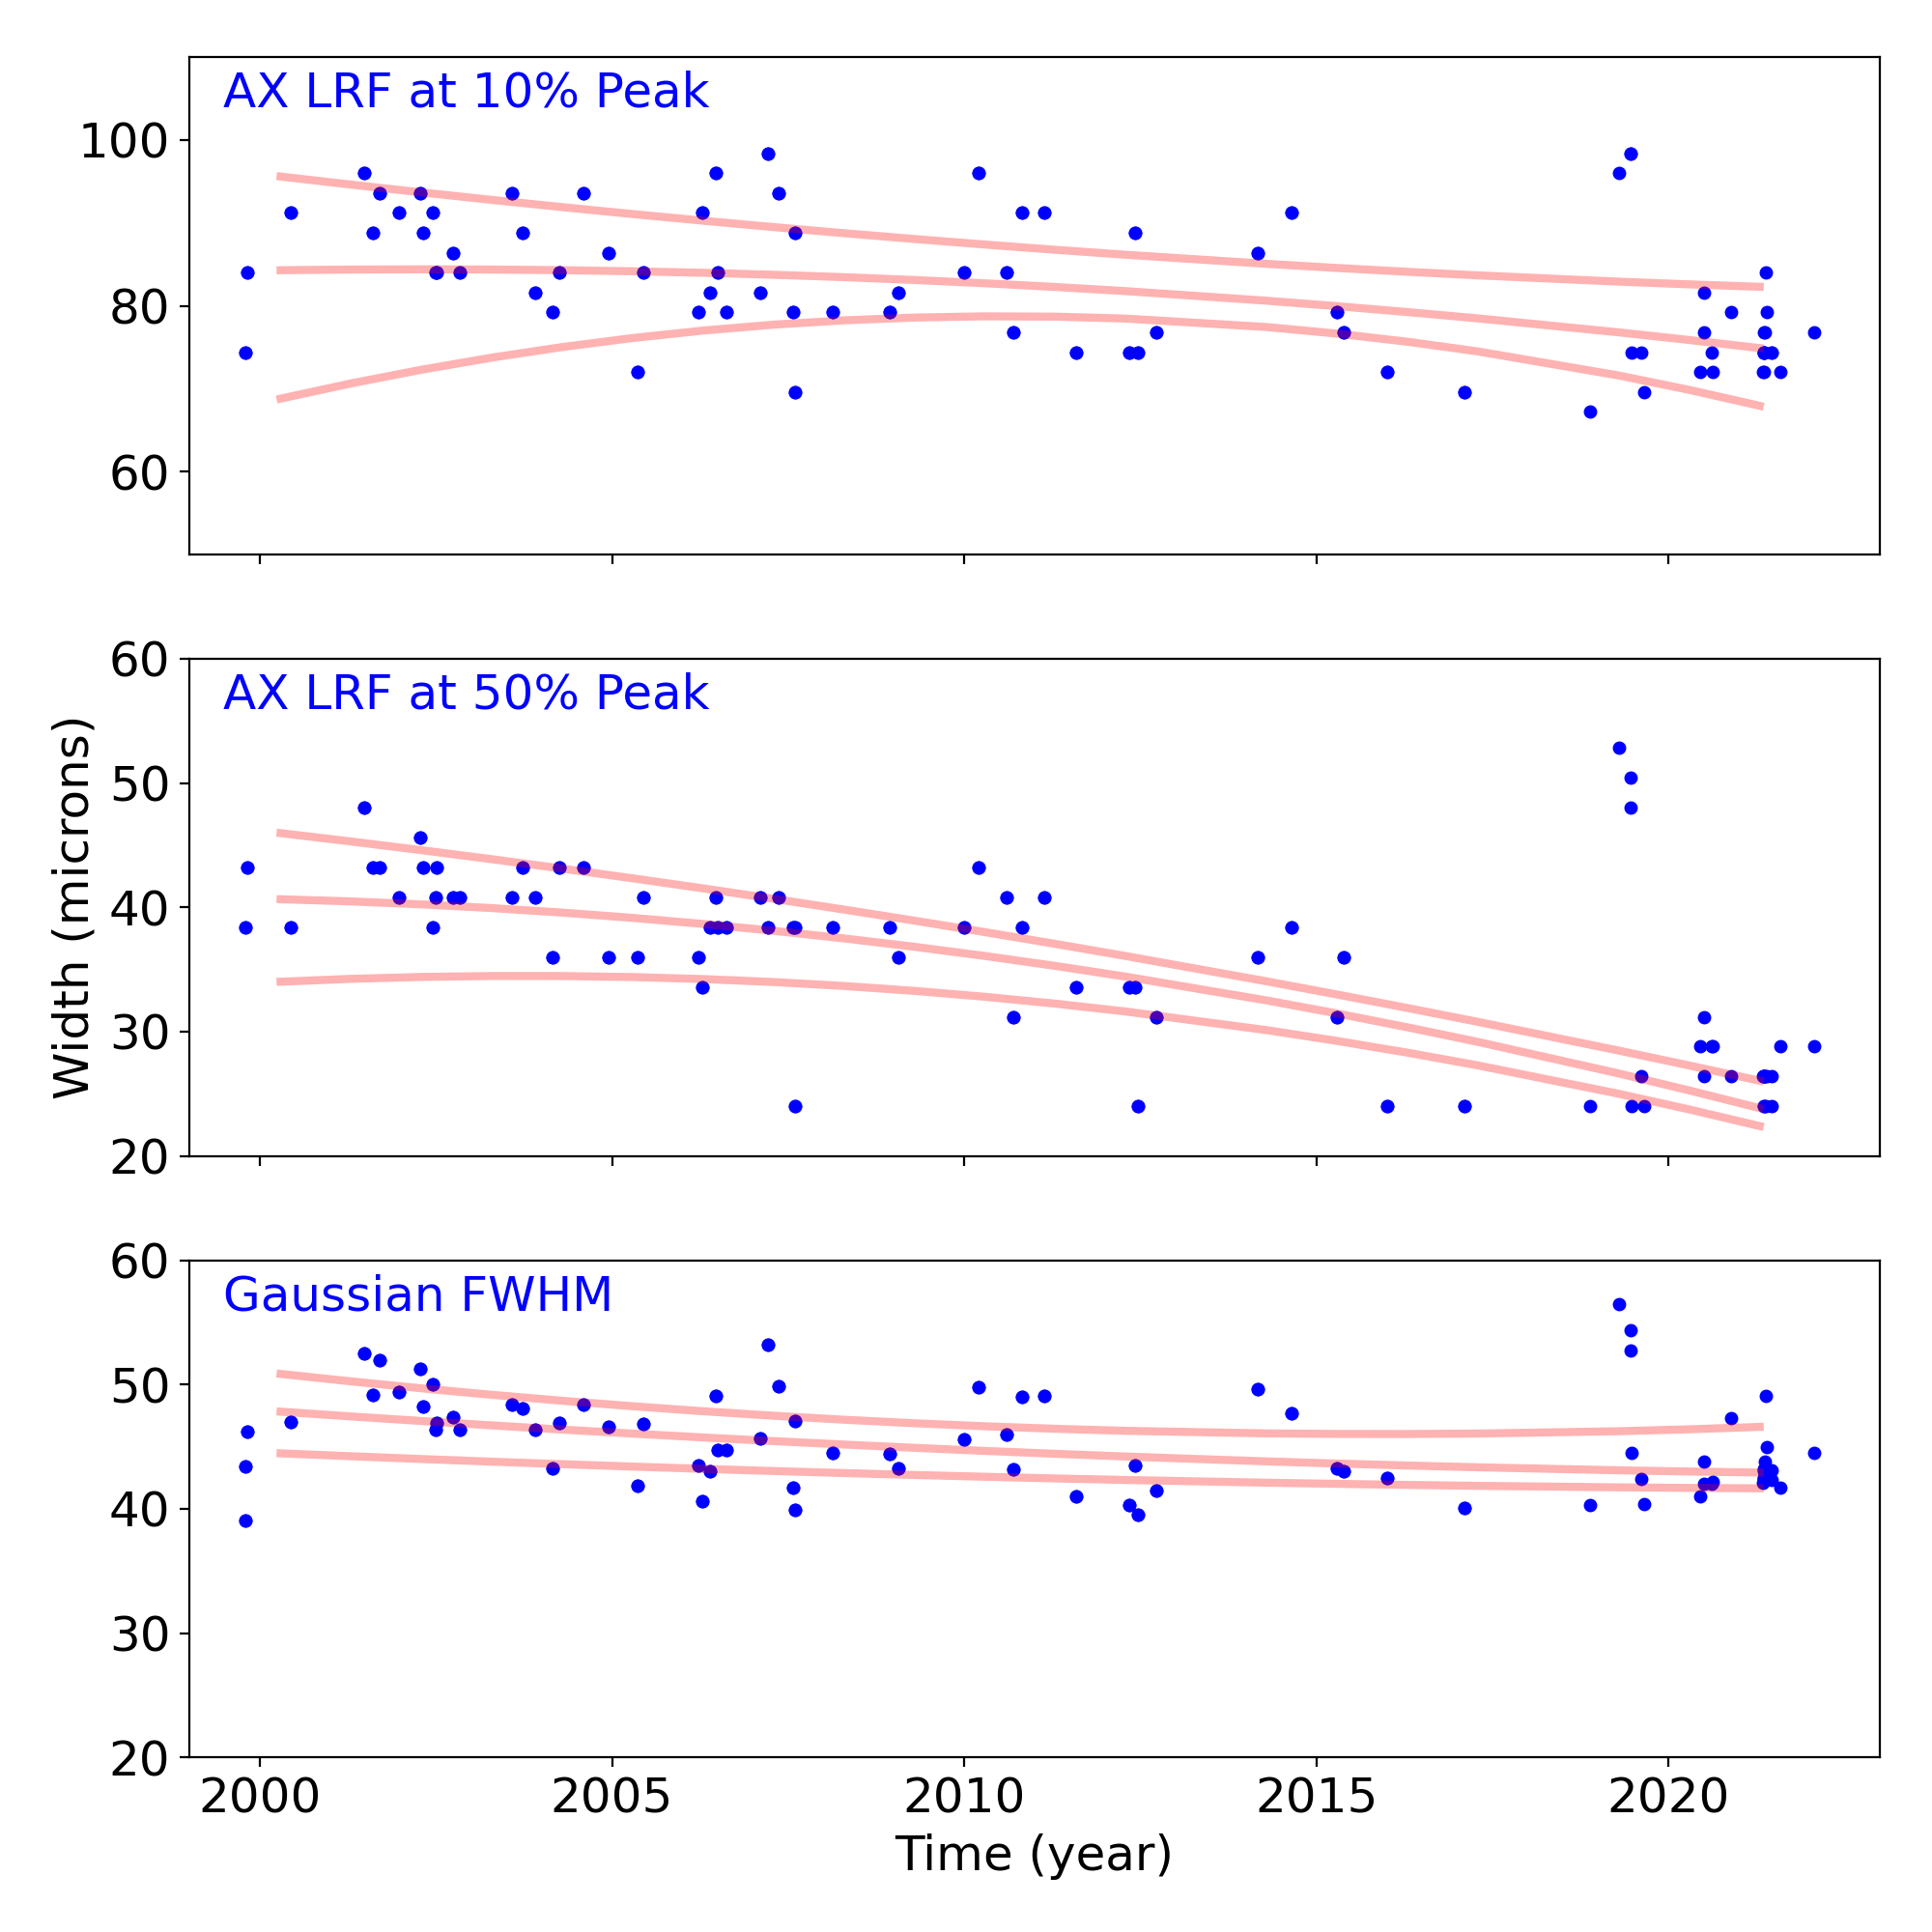
Gratings
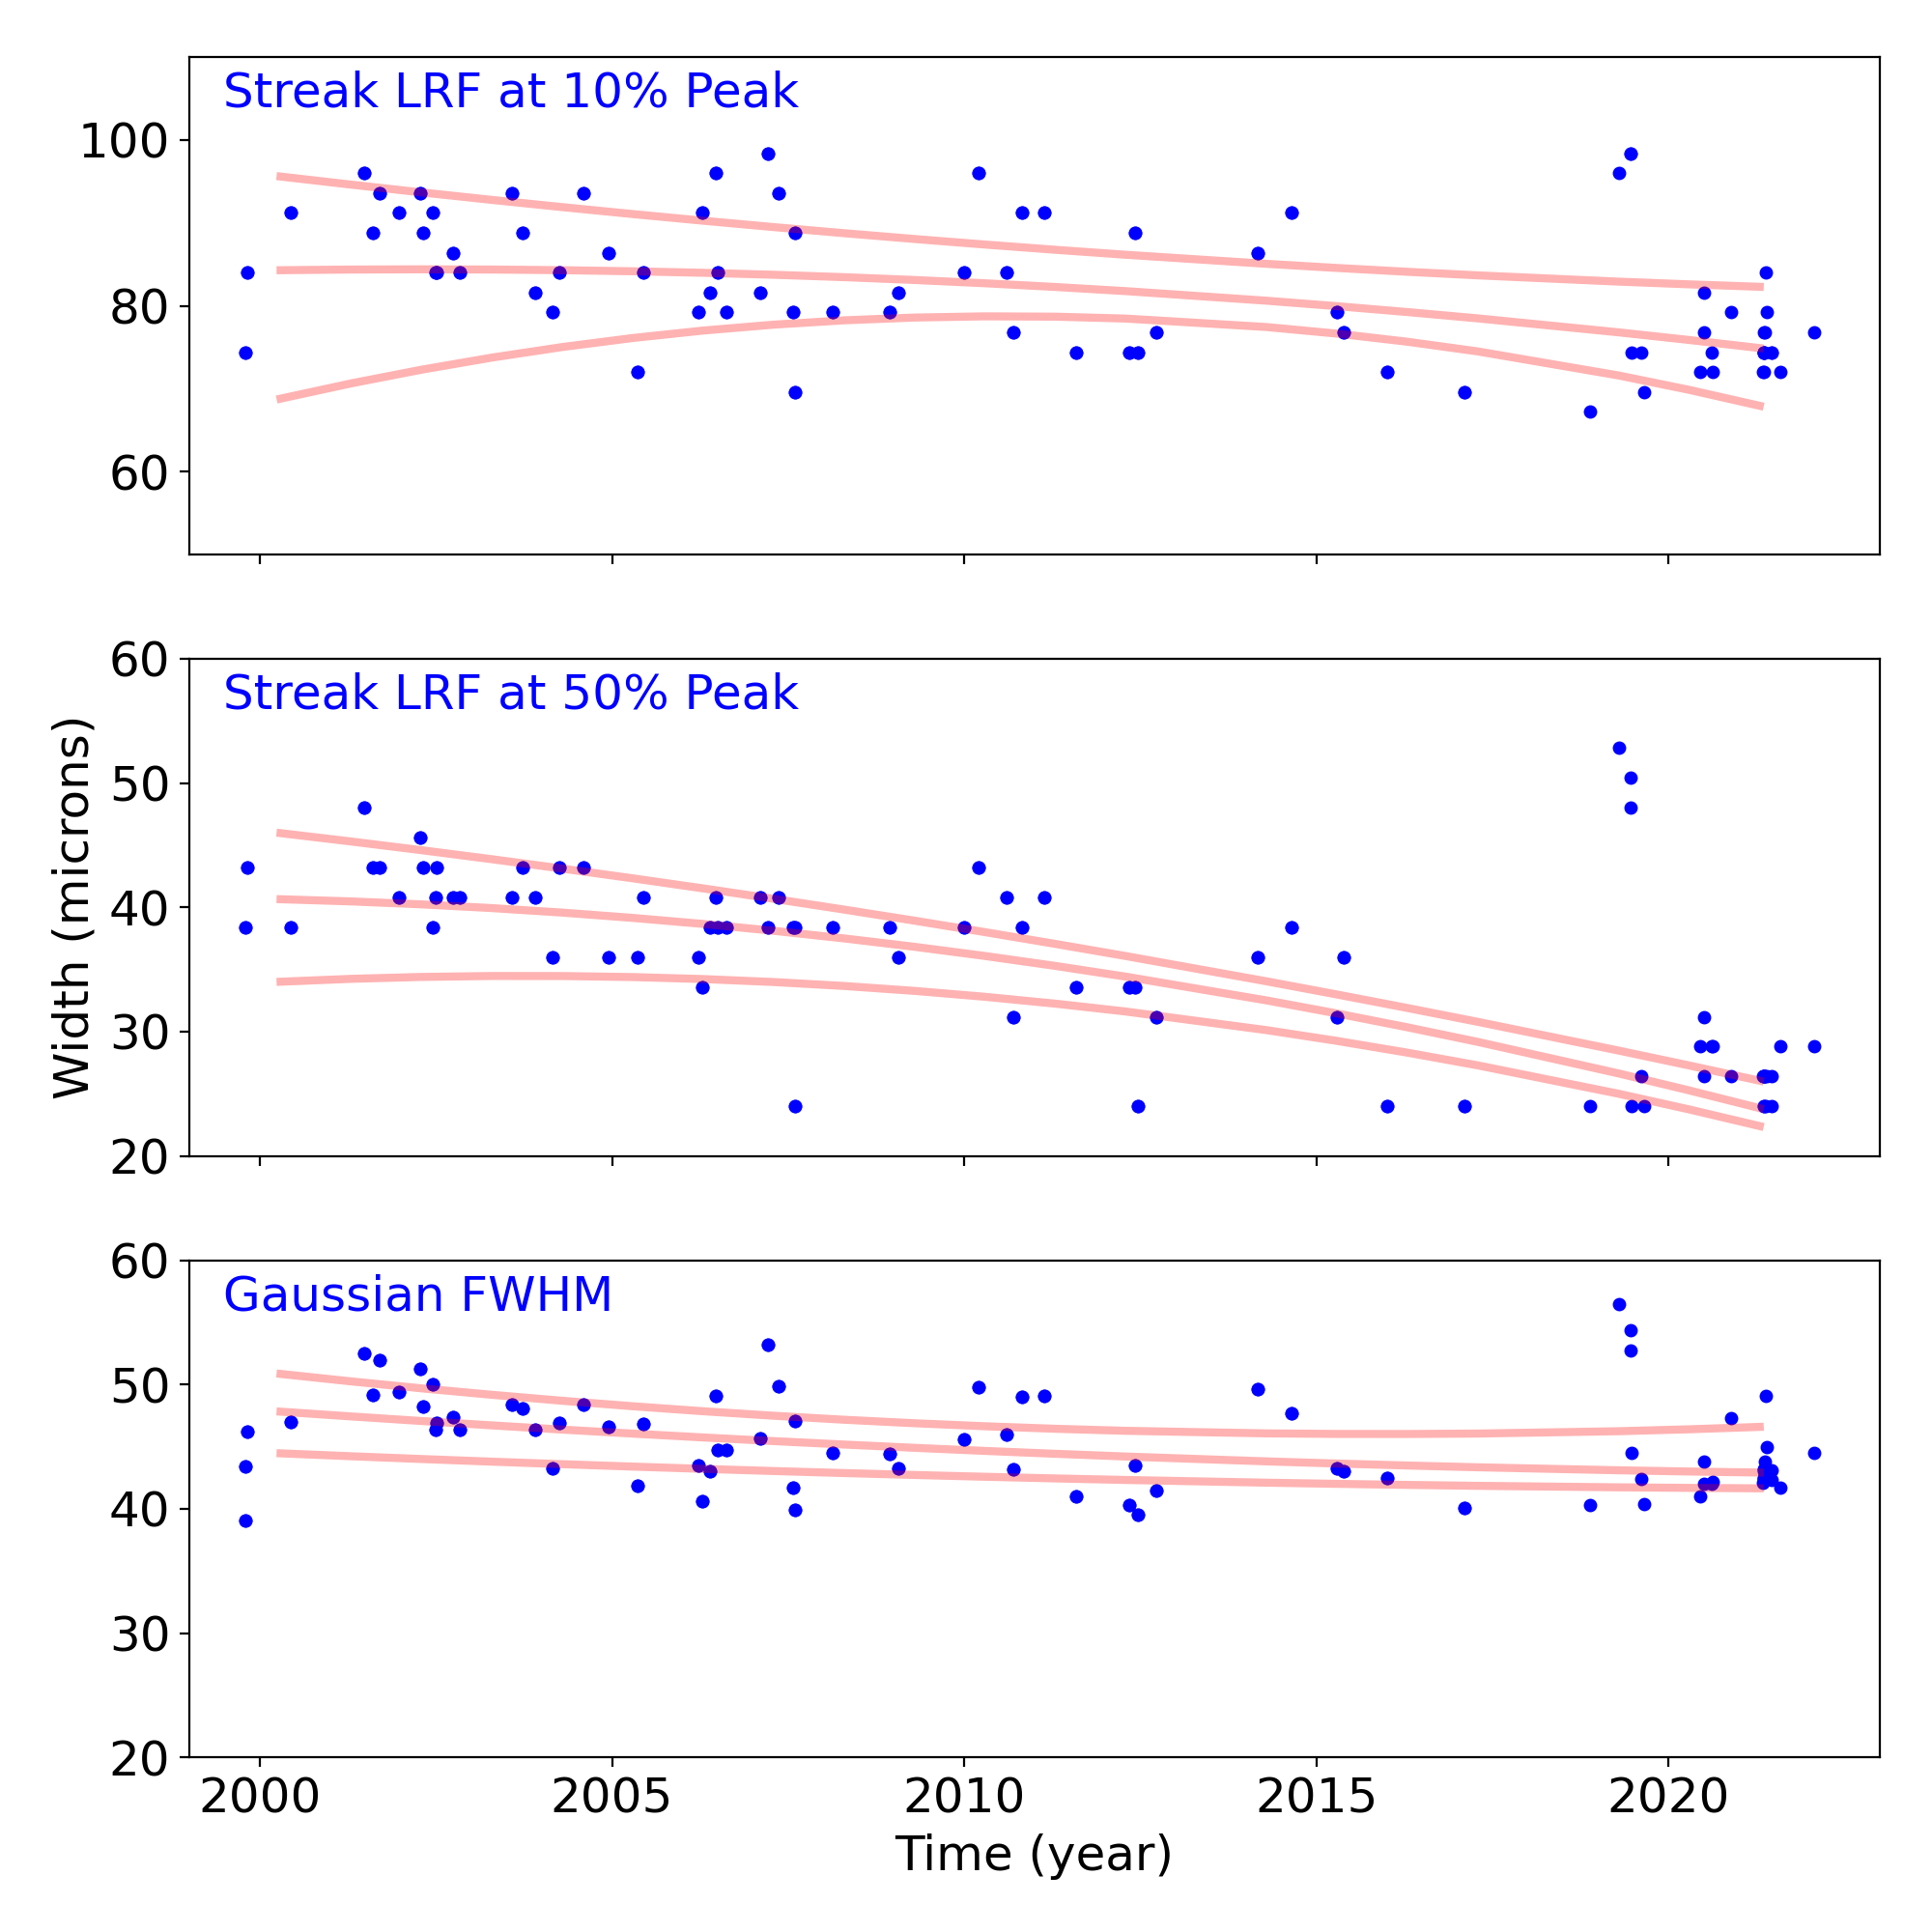
Grating Trends/Focus
We plot the width of the zero order streak of ACIS/HETG observations and the width of the zero order image for HRC/LETG observations of point sources. No significant defocusing trend is seen at this time. See Gratings Trends pages.
PCAD
ACA Trending
| ACIS |
)
|
)
|
)
|
|
|---|---|---|---|---|
)
|
)
|
)
| ||
| HRCI |
)
|
)
|
)
|
)
|
| HRCI |
)
|
)
|
)
|
)
|
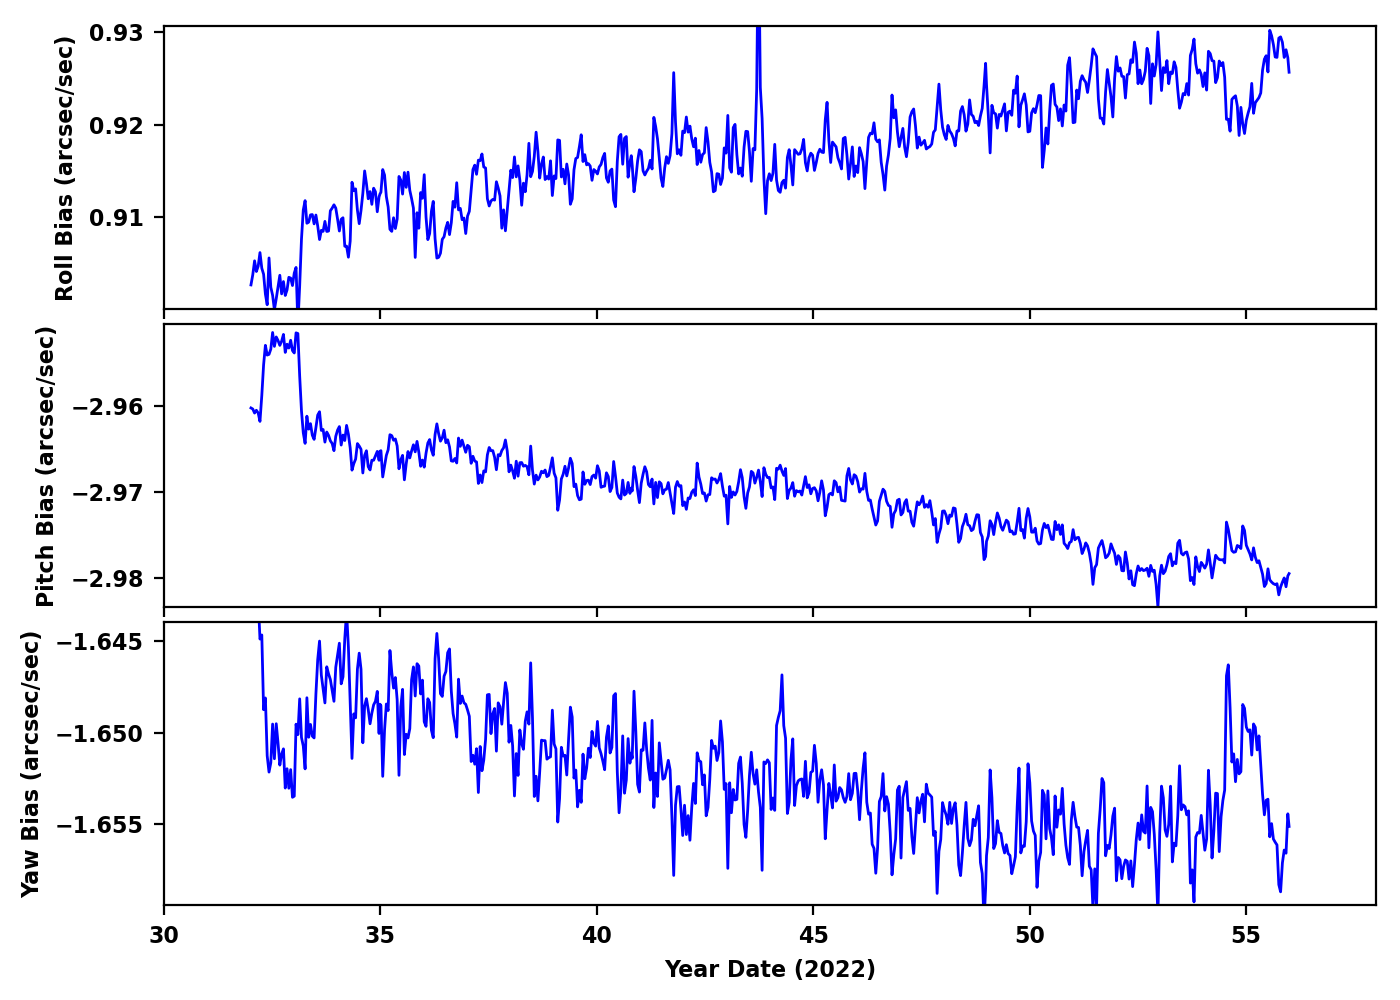
Gyro Bias Drift
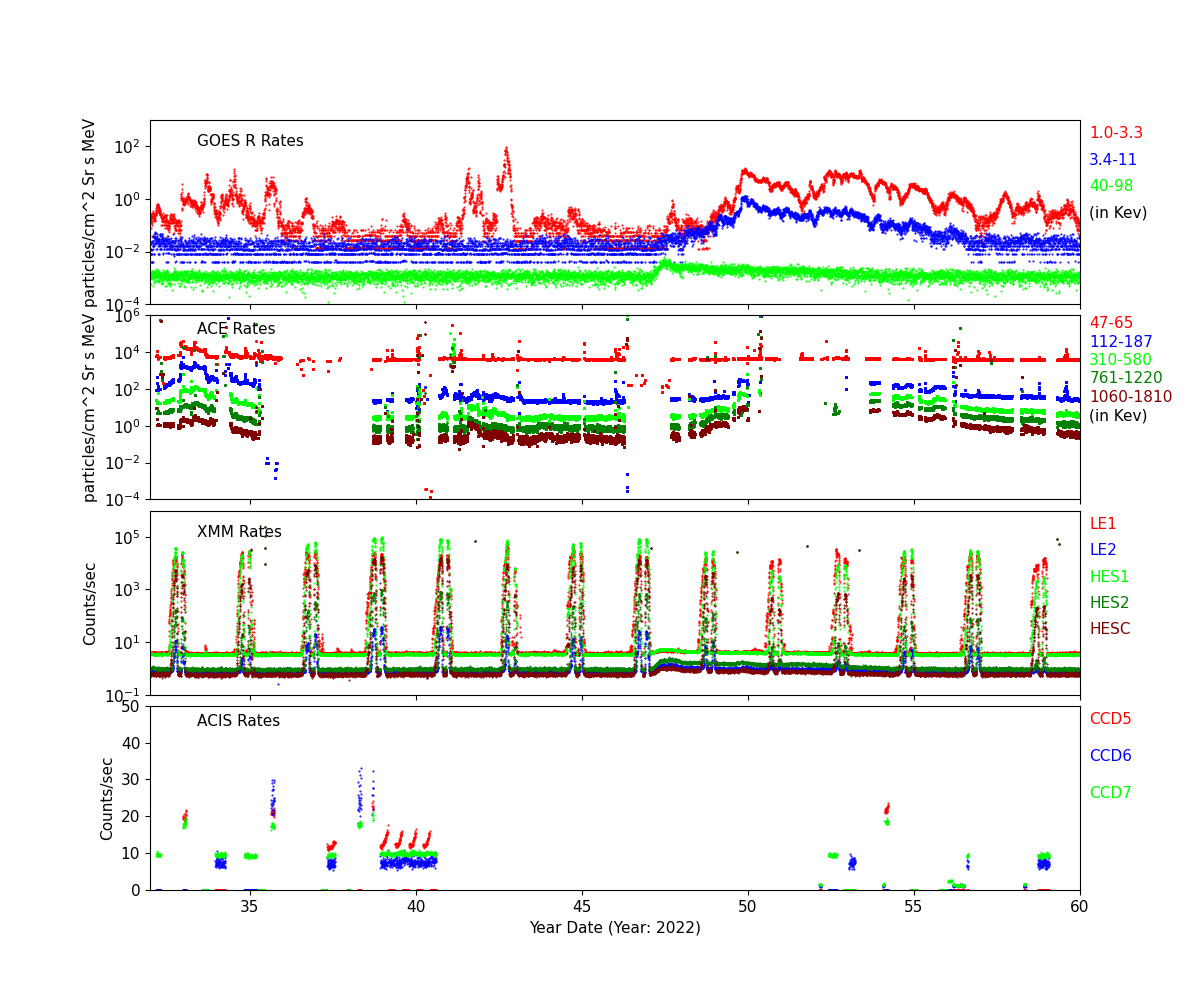
Radiation History
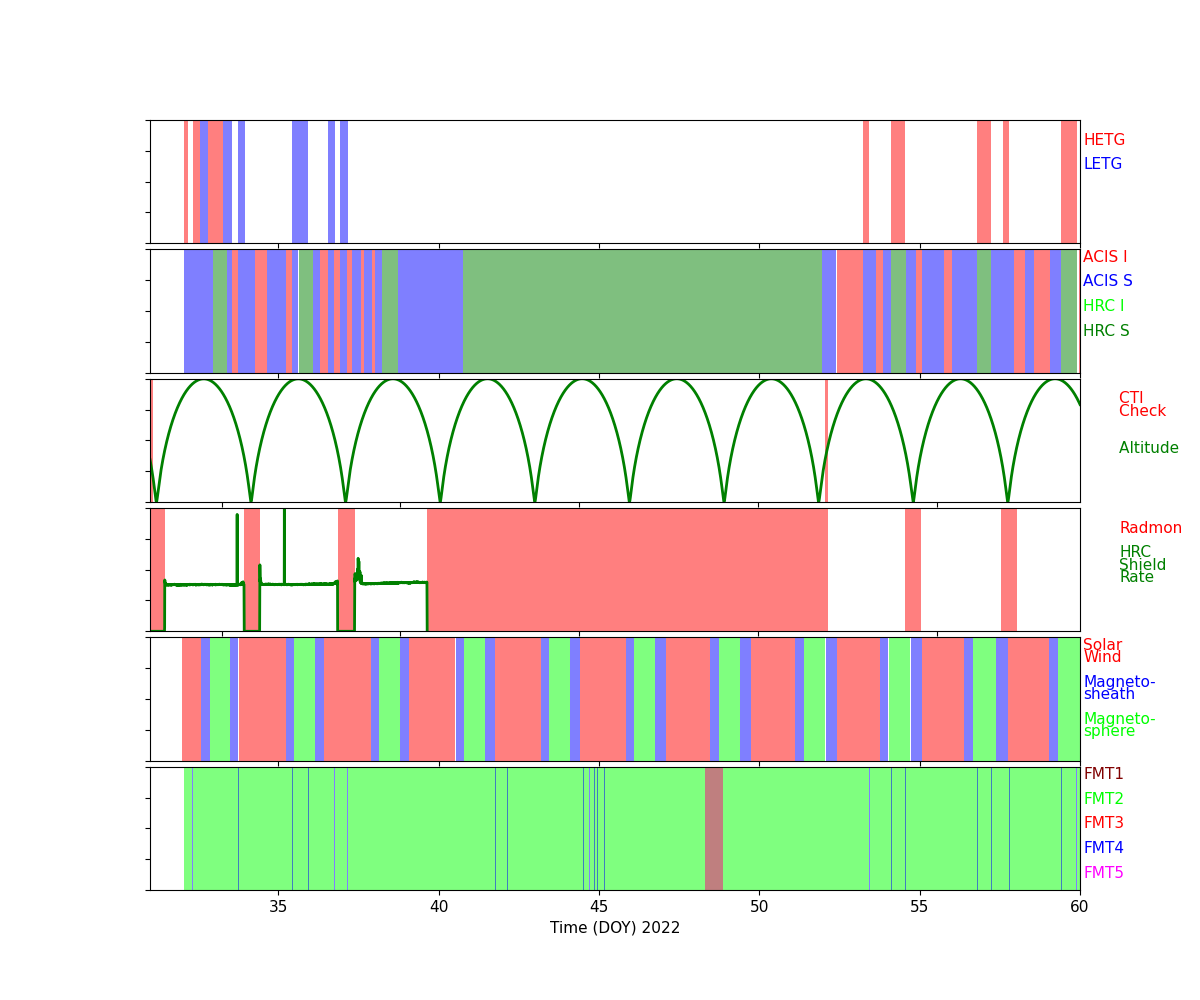
Radiation Count Rates of Feb 2022
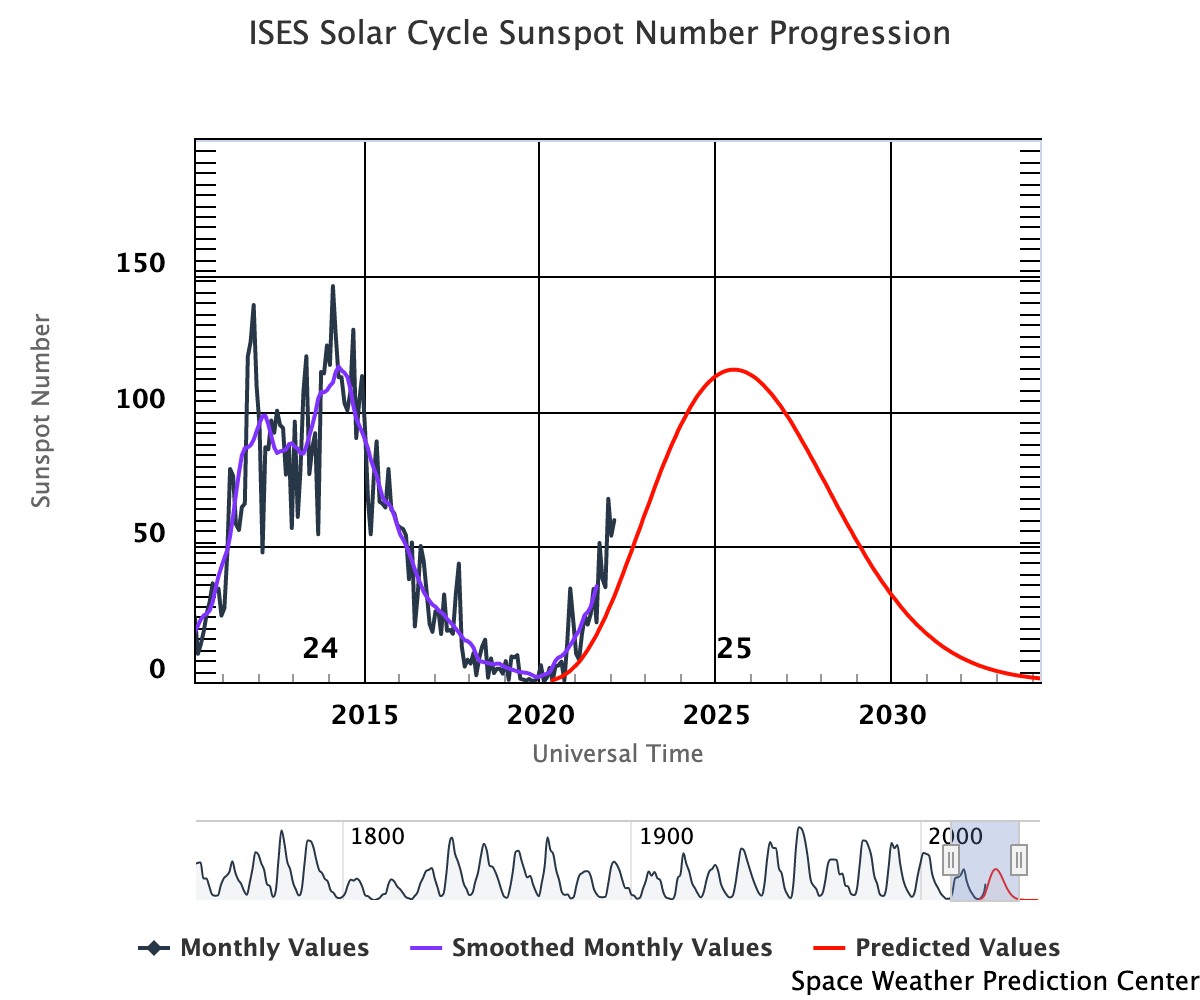
Sun Spot History (See:NOAA Page)
Trending
Quarterly Trends
- HRC Temperature
| Previous Quarter | |||||||
| MSID | MEAN | RMS | DELTA/YR | DELTA/YR/YR | UNITS | DESCRIPTION | |
| 2ceahvpt | -0.109 | 0.003 | (2.97+/-0.08)e2 | -1.03 +/- 0.55 | K | CEA RADIATOR TEMPERATURE AT CENTER | |
|---|---|---|---|---|---|---|---|
| 2chtrpzt | -0.107 | 0.003 | (2.94+/-0.08)e2 | -0.93 +/- 0.55 | K | CENTRAL ELECTRONICS BOX TEMP | |
| 2condmxt | -0.108 | 0.003 | (2.91+/-0.08)e2 | -0.63 +/- 0.59 | K | CONDUIT -X FACE TEMPERATURE | |
| 2dcentrt | -0.088 | 0.002 | (2.90+/-0.07)e2 | 0.62 +/- 0.53 | K | DETECTOR HOUSING TEMP 2 | |
| 2dtstatt | -0.108 | 0.003 | (2.91+/-0.08)e2 | 0.57 +/- 0.59 | K | DETECTOR HOUSING TEMP 1 | |
| 2fhtrmzt | -0.143 | 0.004 | (2.92+/-0.11)e2 | -0.28 +/- 0.75 | K | FRONT END ELECTRONICS BOX TEMPERATURE | |
| 2fradpyt | -0.129 | 0.004 | (2.88+/-0.10)e2 | -0.16 +/- 0.77 | K | FRONT END ASSEMBLY +Y AT RADIATOR CENTER TEMP | |
| 2pmt1t | -0.037 | 0.002 | (2.93+/-0.04)e2 | 0.07 +/- 0.69 | K | PMT 1 TEMPERATURE | |
| 2pmt2t | -0.048 | 0.002 | (2.96+/-0.05)e2 | 0.20 +/- 0.82 | K | PMT 2 TEMPERATURE | |
| 2uvlspxt | -0.064 | 0.002 | (2.87+/-0.05)e2 | 0.62 +/- 0.61 | K | UV LIGHT SHIELD NEXT TO SNOUT TEMP | |
- HRC HK
| Previous Quarter | |||||||
| MSID | MEAN | RMS | DELTA/YR | DELTA/YR/YR | UNITS | DESCRIPTION | |
| 2fe00atm | 0.013 | 8.522e-04 | 23.06 +/- 1.69 | 0.73 +/- 0.57 | C | Front end temperature | |
|---|---|---|---|---|---|---|---|
| 2fepratm | on | 0.013 | 9.545e-04 | 24.96 +/- 1.88 | 0.60 +/- 0.64 | C | FE temp card temperature | off | 2.727 | 0.576 | 29.68 +/- 0.38 | (0.00+/-0.00)e0 |
| 2imhvatm | on | 0.003 | 6.687e-04 | 31.62 +/- 1.28 | -0.31 +/- 0.41 | C | Imaging det HVPS temperature | off | 3.148 | 0.702 | 34.12 +/- 0.45 | (0.00+/-0.00)e0 |
| 2iminatm | on | 0.010 | 8.212e-04 | 20.37 +/- 1.61 | 0.29 +/- 0.56 | C | Imaging det temperature | off | -1.626e-10 | 1.260e-06 | 24.62 +/- 0.00 | (0.00+/-0.00)e0 |
| 2lvplatm | on | 0.006 | 6.560e-04 | 27.90 +/- 1.27 | -0.41 +/- 0.40 | C | LVPS plate temperature | off | 3.031 | 1.278 | 30.47 +/- 0.56 | (0.00+/-0.00)e0 |
| 2prbscr | on | 3.846e-04 | 2.824e-05 | 1.75 +/- 0.06 | -0.01 +/- 0.02 | AMP | Primary bus current | off | 0.081 | 0.070 | 1.87 +/- 0.03 | (0.00+/-0.00)e0 |
| 2prbsvl | -0.004 | 8.149e-05 | 26.78 +/- 0.20 | 0.03 +/- 0.02 | V | Primary bus voltage | |
| 2smtratm | on | -8.132e-07 | 6.948e-07 | 5.94 +/- 0.00 | -(9.86+/-18.04)e-7 | C | Selected motor temperature | off | 2.032e-11 | 0.000e+00 | 5.94 +/- 0.00 | (0.00+/-0.00)e0 |
| 2sphvatm | on | 0.006 | 8.288e-04 | 31.59 +/- 1.59 | -0.64 +/- 0.50 | C | Spect det HVPS temperature | off | 3.005 | 0.728 | 33.33 +/- 0.44 | (0.00+/-0.00)e0 |
| 2spinatm | on | 0.009 | 8.012e-04 | 18.99 +/- 1.56 | 0.18 +/- 0.54 | C | Spect det temperature | off | 1.197 | 0.496 | 23.02 +/- 0.22 | (0.00+/-0.00)e0 |
- PCAD Temperature
| Previous Quarter | |||||||
| MSID | MEAN | RMS | DELTA/YR | DELTA/YR/YR | UNITS | DESCRIPTION | |
| aacccdpt | -0.006 | 7.167e-04 | (2.64+/-0.02)e2 | 0.90 +/- 0.52 | K | AC CCD TEMP (PRI) | |
|---|---|---|---|---|---|---|---|
| aacccdrt | -0.007 | 7.718e-04 | (3.08+/-0.02)e2 | 1.00 +/- 0.56 | K | AC CCD TEMP (RDNT) | |
| aach1t | -0.007 | 7.808e-04 | (3.06+/-0.02)e2 | 1.08 +/- 0.56 | K | AC HOUSING TEMP (ACH1) | |
| aach2t | -0.007 | 7.828e-04 | (3.06+/-0.02)e2 | 1.07 +/- 0.57 | K | AC HOUSING TEMP (ACH2) | |
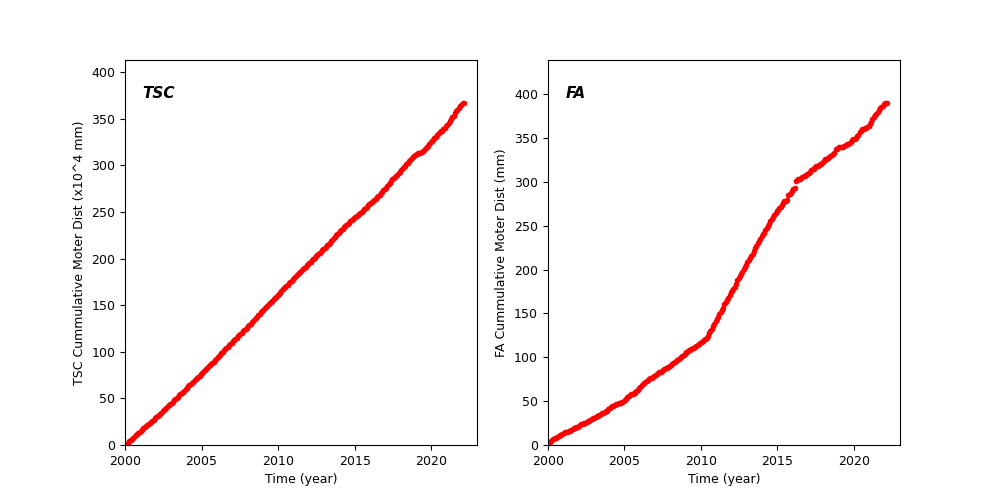
Spacecraft Motions
TSC and FA Cummulative Moter Distance
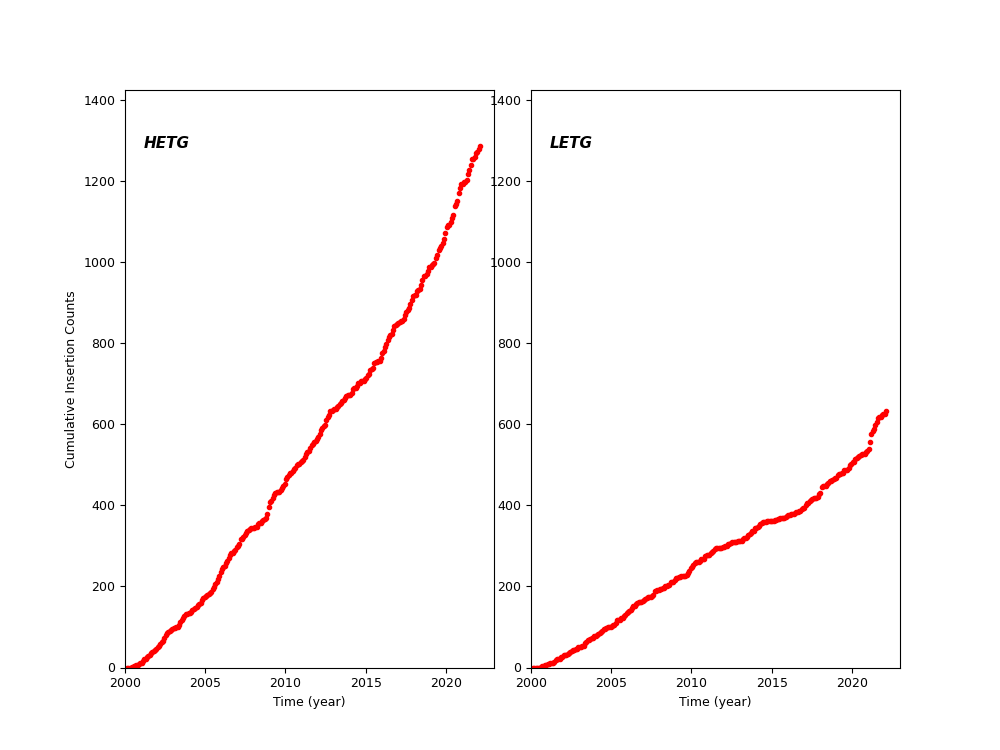
HETG and LETG Cummulative Insertion Counts
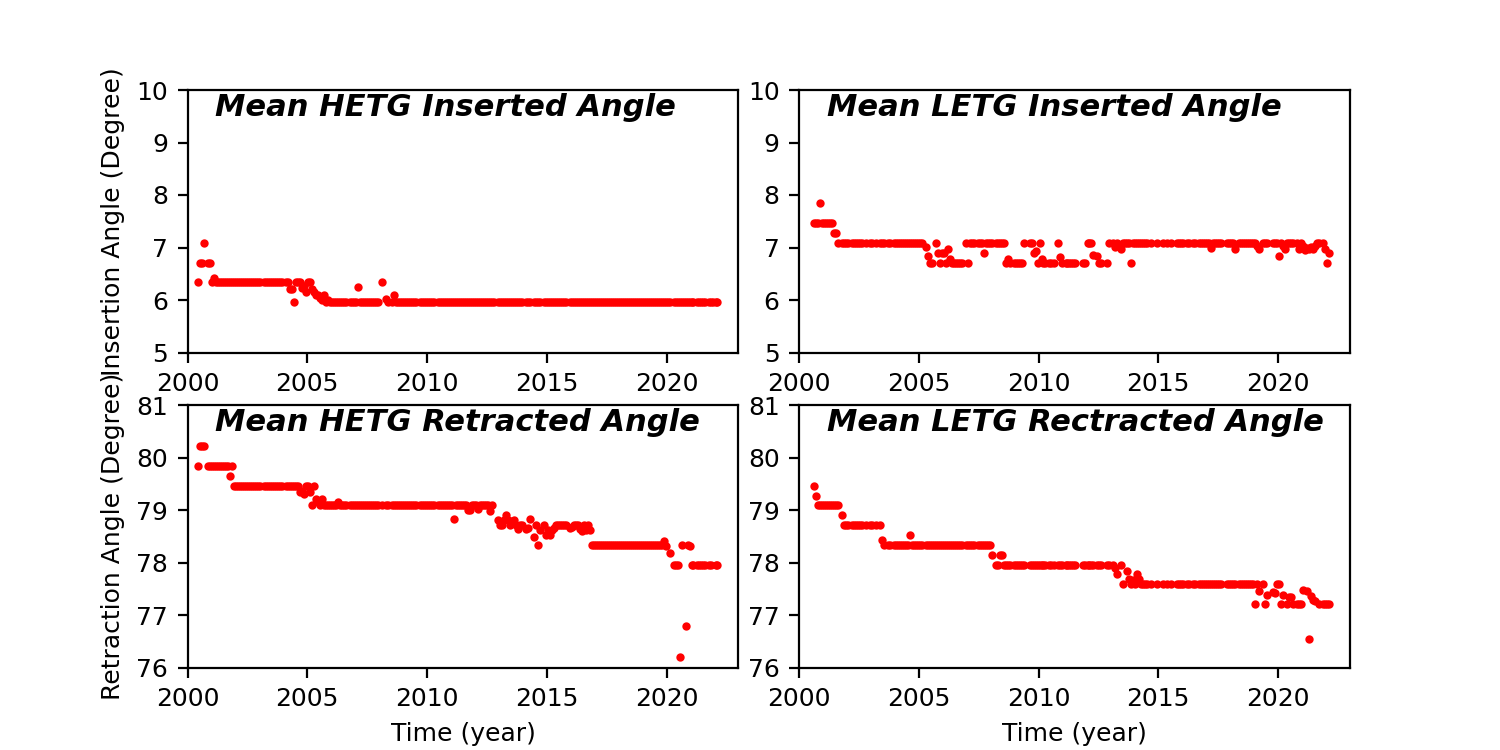
HETG/LETG Insertion/Retraction Angle
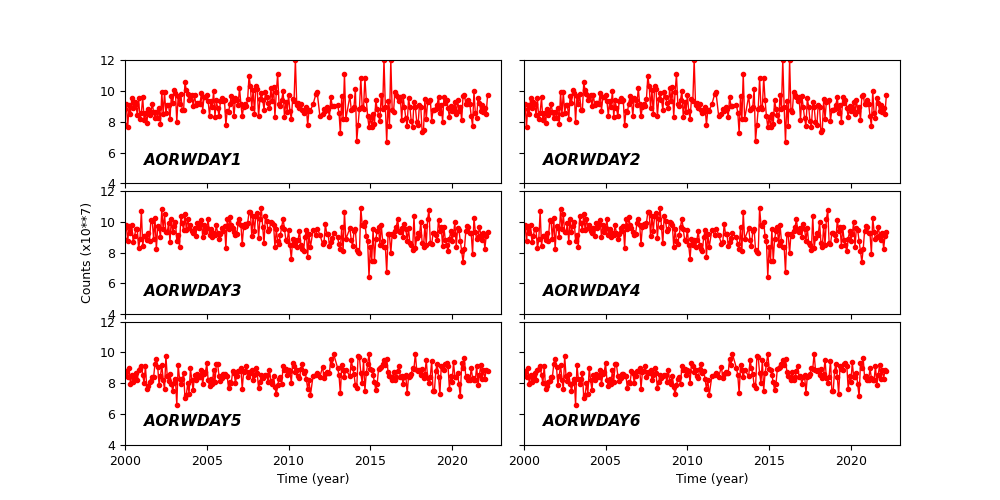
Reaction Wheel Rotations