ACIS
ACIS DOSE Registered-Photon-Map
The steps we took to compute the dose map are;
- Level 1 Event files for a specified month are obtained from archive.
- Image data including I2, I3, S2, S3 CCDs are extracted from all event files.
- All the extracted image data were merged to create a month long exposure map for the month.
- The exposure map is opened with ds9, and check a distribution of count rates against energy. From this, estimate the upper threshold value. Any events beyond this upper threshold are assumed erroneous events such as bad pixels.
- Using this upper threshold, the data is filtered, and create a cleaned exposure map for the month.
- The exposure map from each month from the Sep 1999 is added up to create a cumulative exposure map for each month.
- Using fimgstatistic, we compute count rate statistics for each CCDs.
- For observations with high data drop rates (e.g., Crab nebula, Cas A), we corrected the observations by adding events.
Please check more detail plots at Telemetered Photon Dose Trend page.
)
)
)
Statistics:
# IMAGE     NPIX     MEAN        RMS        MIN     MAX
ACIS_apr22 6004901       5.806         8.350           0.0     5522


I2 node 0  262654	8.047853	3.519108	0.0	124.0
I2 node 1  262654	8.725037	3.828240	0.0	214.0
I2 node 2  262654	8.972266	4.254000	0.0	142.0
I2 node 3  262654	9.048601	6.454863	0.0	2508.0

I3 node 0  262654	9.168468	4.185954	0.0	129.0
I3 node 1  262654	9.211194	8.413883	0.0	2874.0
I3 node 2  262654	8.834487	3.633036	0.0	110.0
I3 node 3  262654	8.250340	4.209055	0.0	1197.0

S2 node 0  262654	5.868015	11.133769	0.0	5522.0
S2 node 1  262654	6.086516	3.052825	0.0	232.0
S2 node 2  262654	6.268876	6.808293	0.0	2493.0
S2 node 3  262654	6.118495	3.830268	0.0	903.0

S3 node 0  262654	7.057215	4.753786	0.0	121.0
S3 node 1  262654	8.505423	3.812340	0.0	723.0
S3 node 2  262654	7.792249	3.074433	0.0	 32.0
S3 node 3  262654	6.616608	2.822019	0.0	 29.0
)
)
)
Statistics:
 IMAGE     NPIX      MEAN        RMS           MIN      MAX
ACIS_total   6004901       2560.662         3285.389           0.0   141217


I2 node 0  262654	2217.763894	446.233112	475.0	13475.0
I2 node 1  262654	2332.753545	634.729712	492.0	129664.0
I2 node 2  262654	2360.740208	500.339337	512.0	14033.0
I2 node 3  262654	2366.474319	611.640189	480.0	28852.0

I3 node 0  262654	2544.389599	625.863338	478.0	13720.0
I3 node 1  262654	2625.733312	1732.613472	507.0	55800.0
I3 node 2  262654	2341.045732	439.574493	477.0	13916.0
I3 node 3  262654	2325.841564	470.101802	445.0	34738.0

S2 node 0  262654	2982.410386	483.308890	1618.0	22340.0
S2 node 1  262654	3161.032653	717.402110	1803.0	17115.0
S2 node 2  262654	3496.658548	719.093413	2220.0	29881.0
S2 node 3  262654	3458.481134	572.298430	1955.0	71613.0

S3 node 0  262654	5313.773116	2908.414194	2322.0	53762.0
S3 node 1  262654	6513.227292	2358.591857	0.0	42144.0
S3 node 2  262654	5244.834298	1337.938787	2398.0	27184.0
S3 node 3  262654	4104.612842	752.558530	2475.0	26417.0
)
|
)
|
)
|
)
|
| Jan 2022 | Oct 2021 | Jul 2021 | Apr 2021 |
|---|
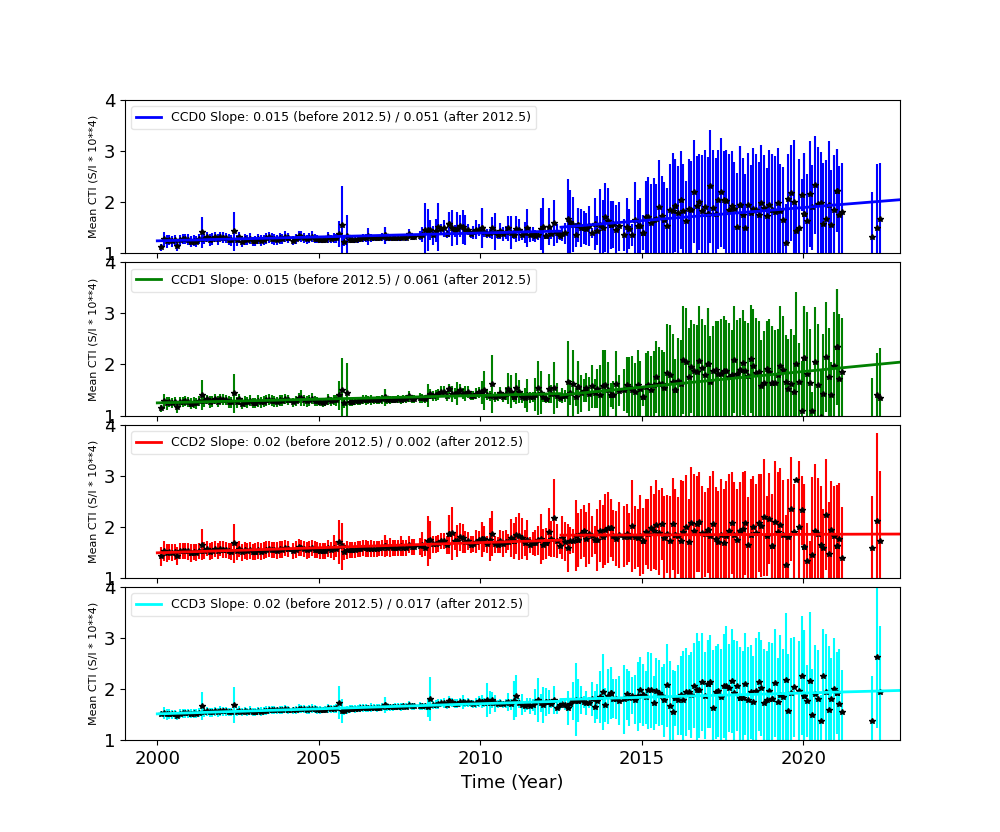
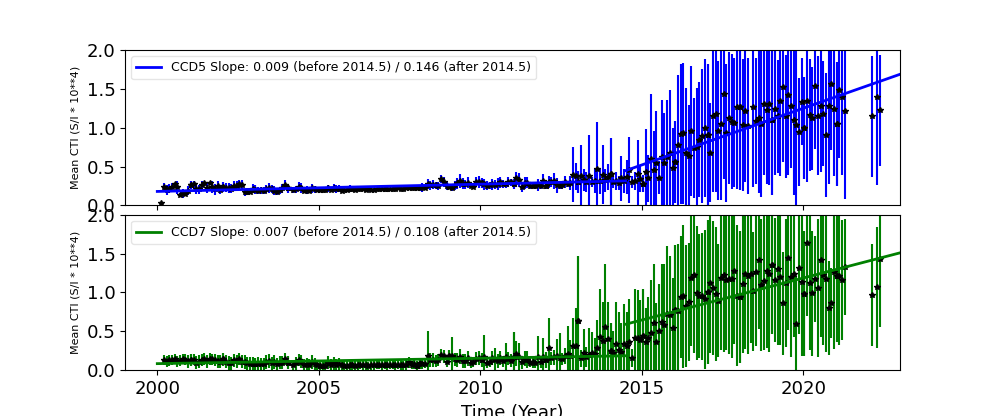
The Mean Detrended CTI
We report CTIs with a refined data definition. CTIs were computed for the temperature dependency corrected data. Please see CTI page for detailed explanation. CTI's are computed for Mn K alpha, and defined as slope/intercept x10^4 of row # vs ADU. Data file: here
Imaging CCDs
Spectral CCDs
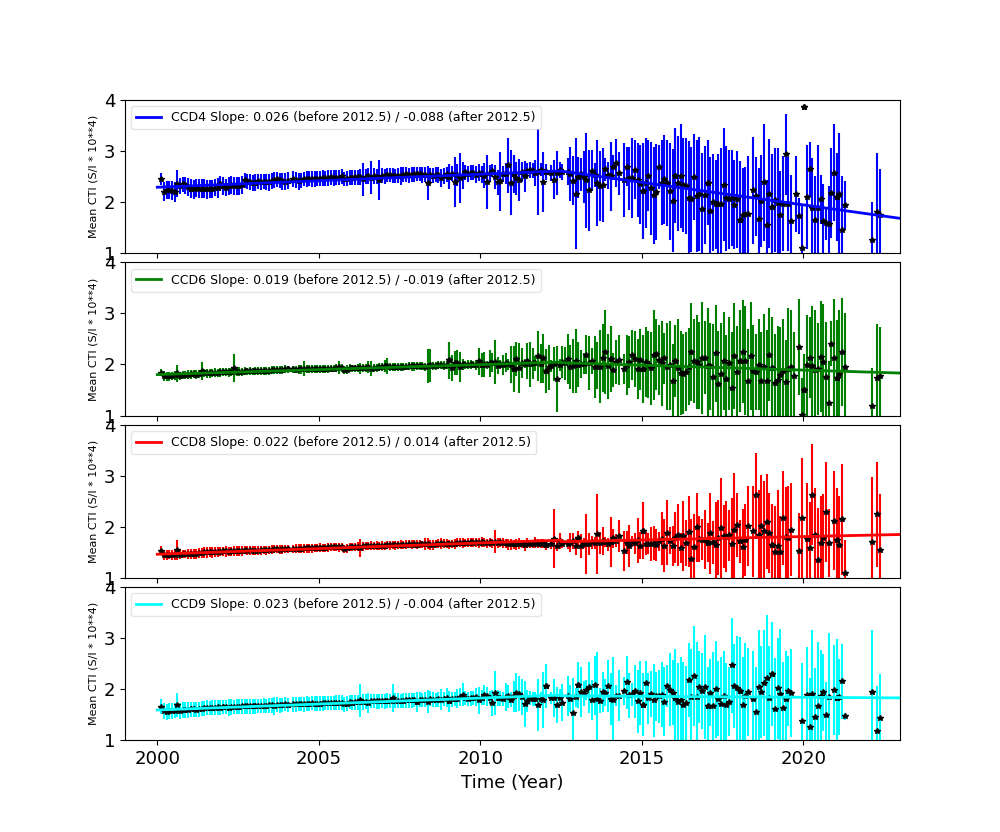
Backside CCDs
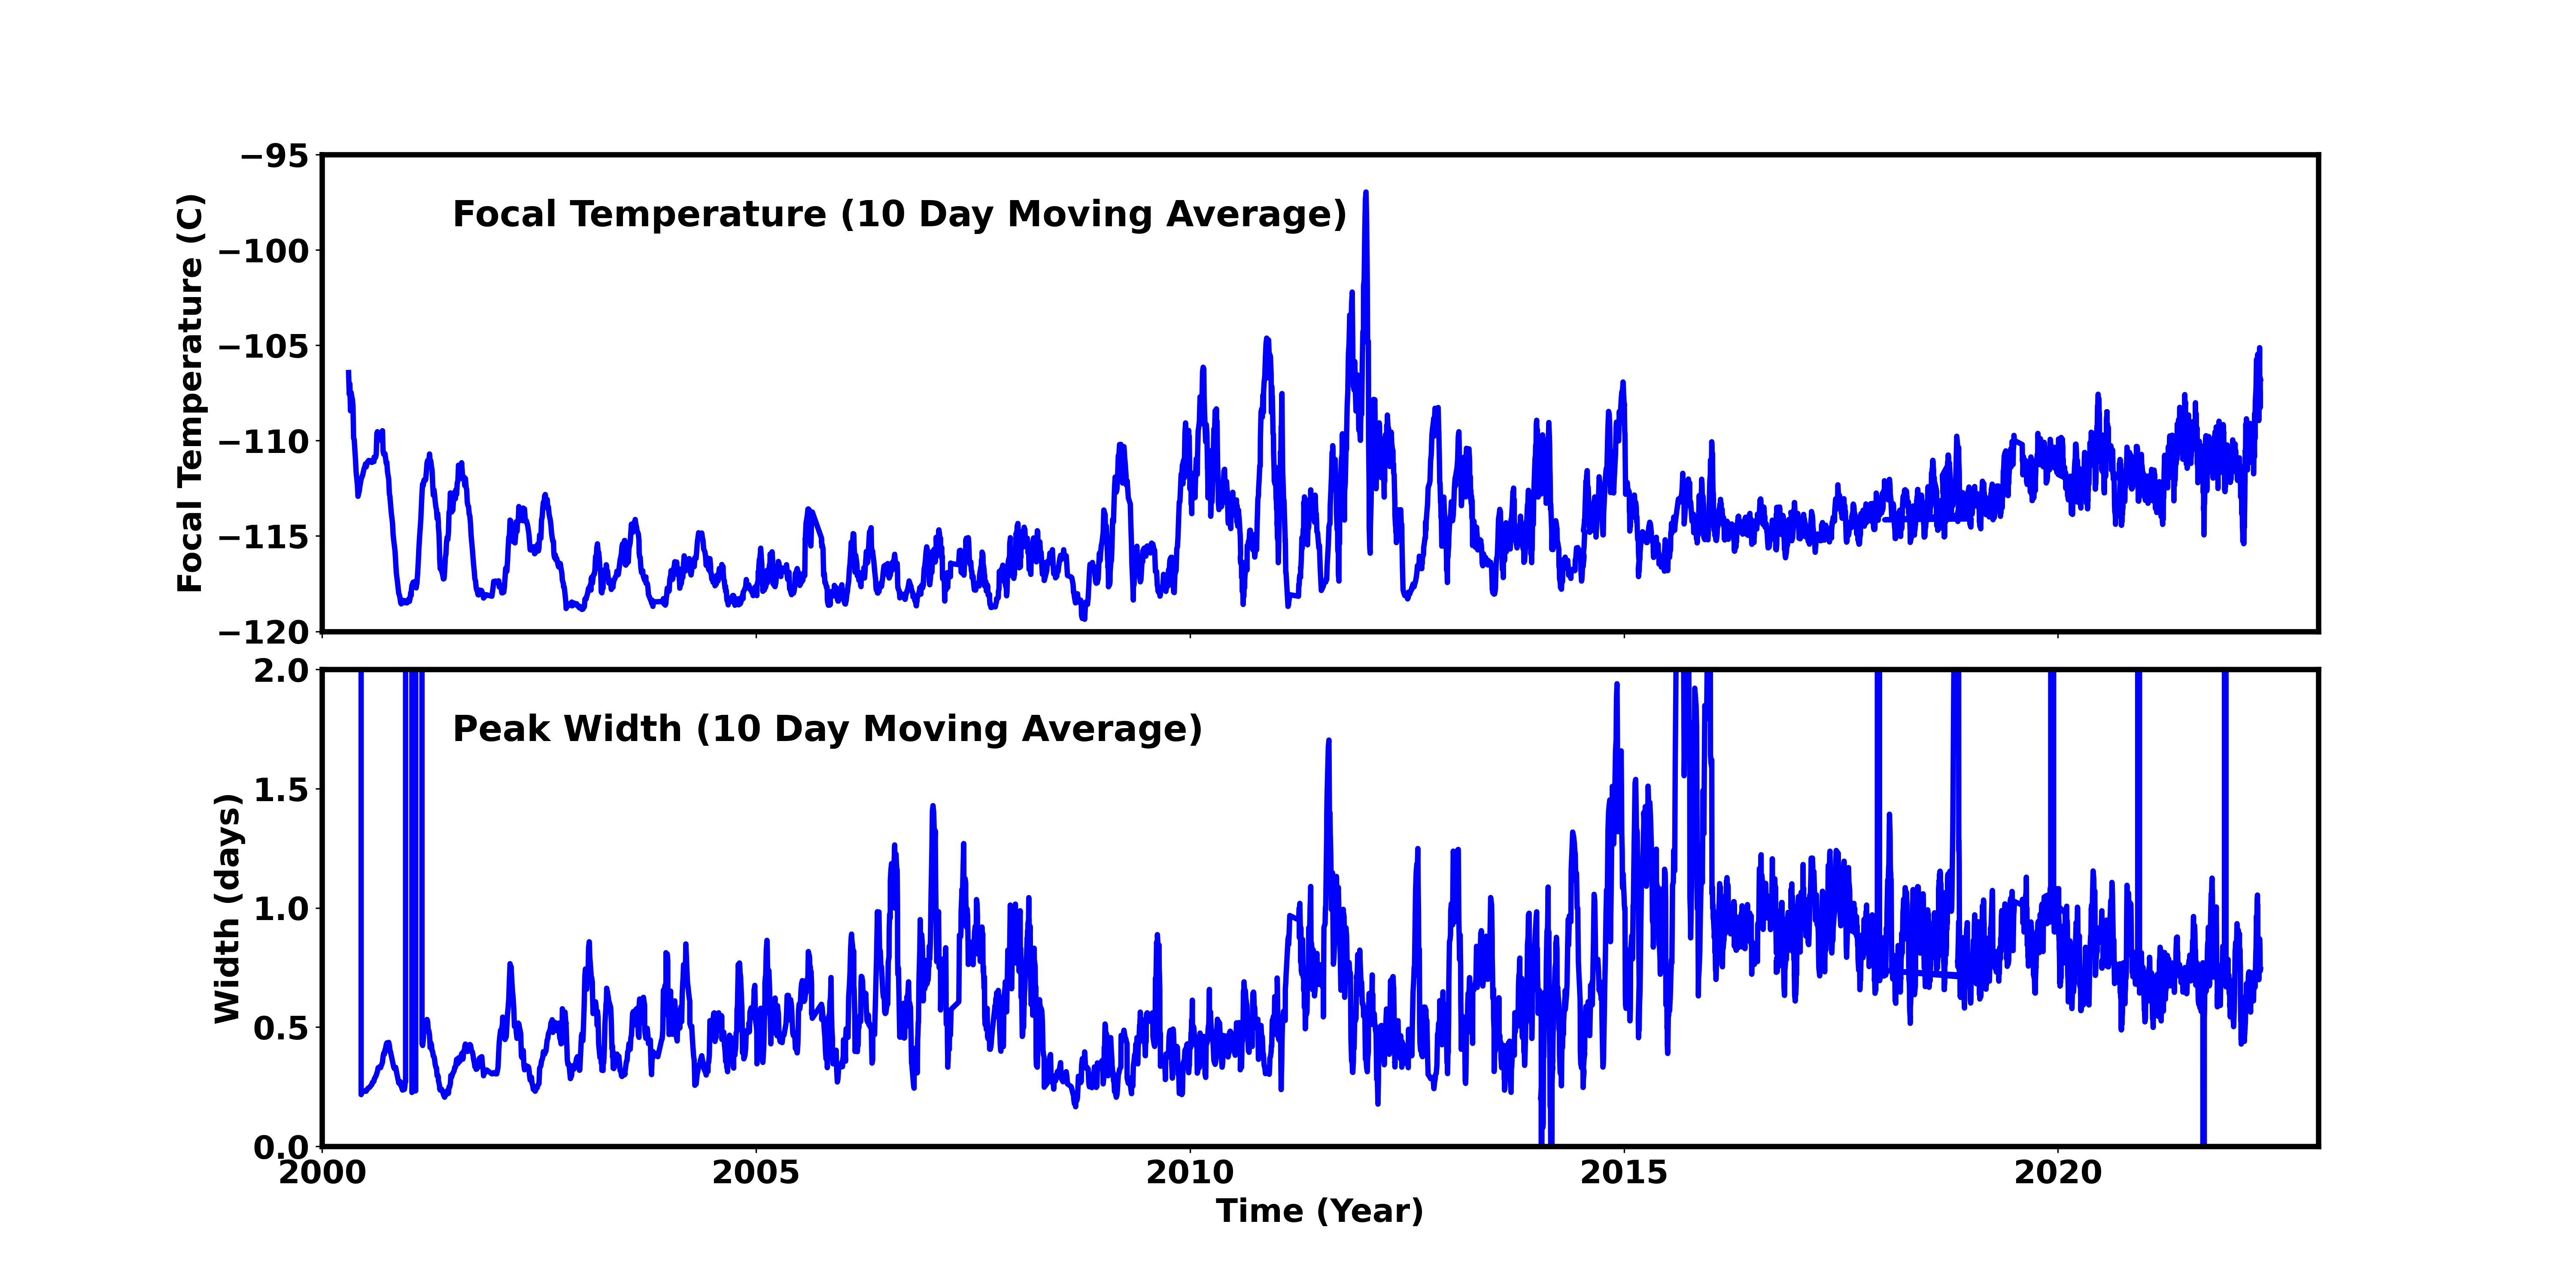
Focal Plane Temperature
Apr 2022 Focal Temperature
| The Mean (max) FPT: | |
|---|---|
| -107.53 | +/- 7.43 C |
| Mean Width: | |
| 0.8 | +/- 0.46 days |
Averaged Focal Plane Temperature
We are using 10 period moving averages to show trends of peak temperatures and peak widths. Note, the gaps in the width plot are due to missing/corrupted data.
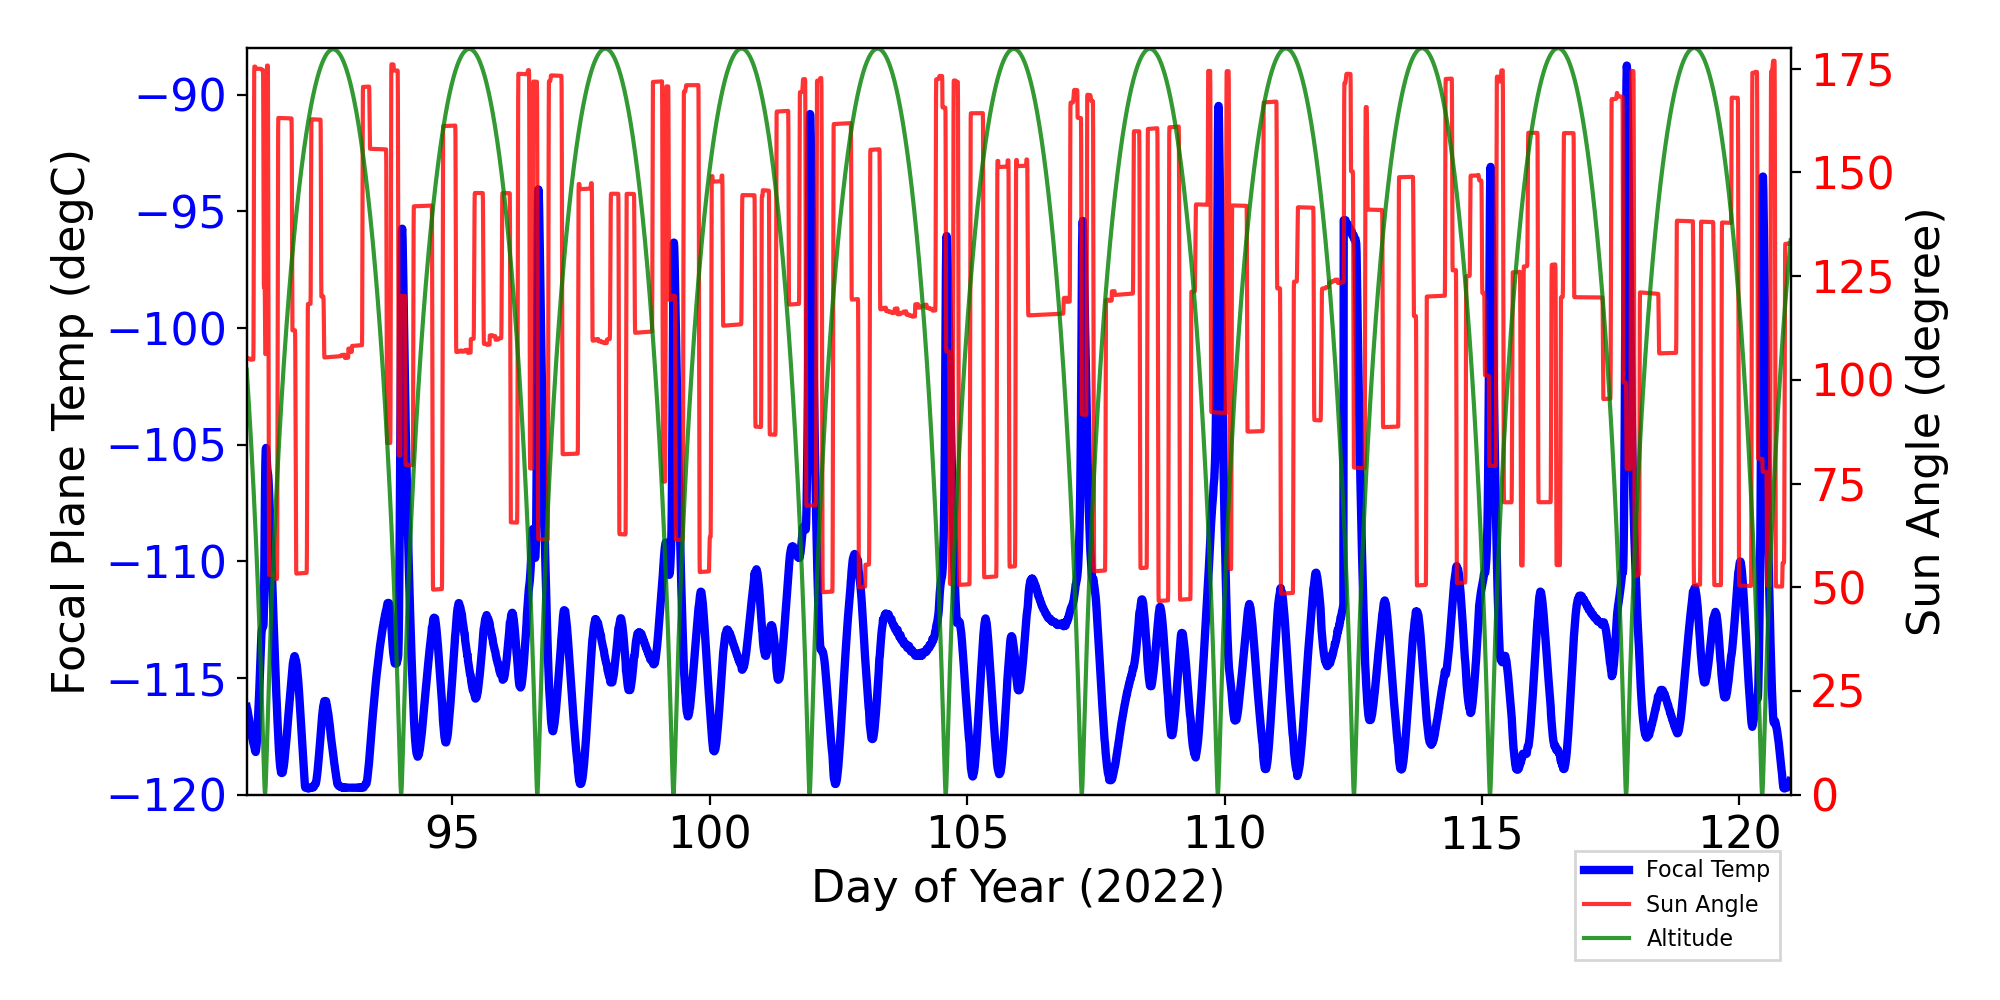
Focal Plane Temperature, Sun Angle and Altitude
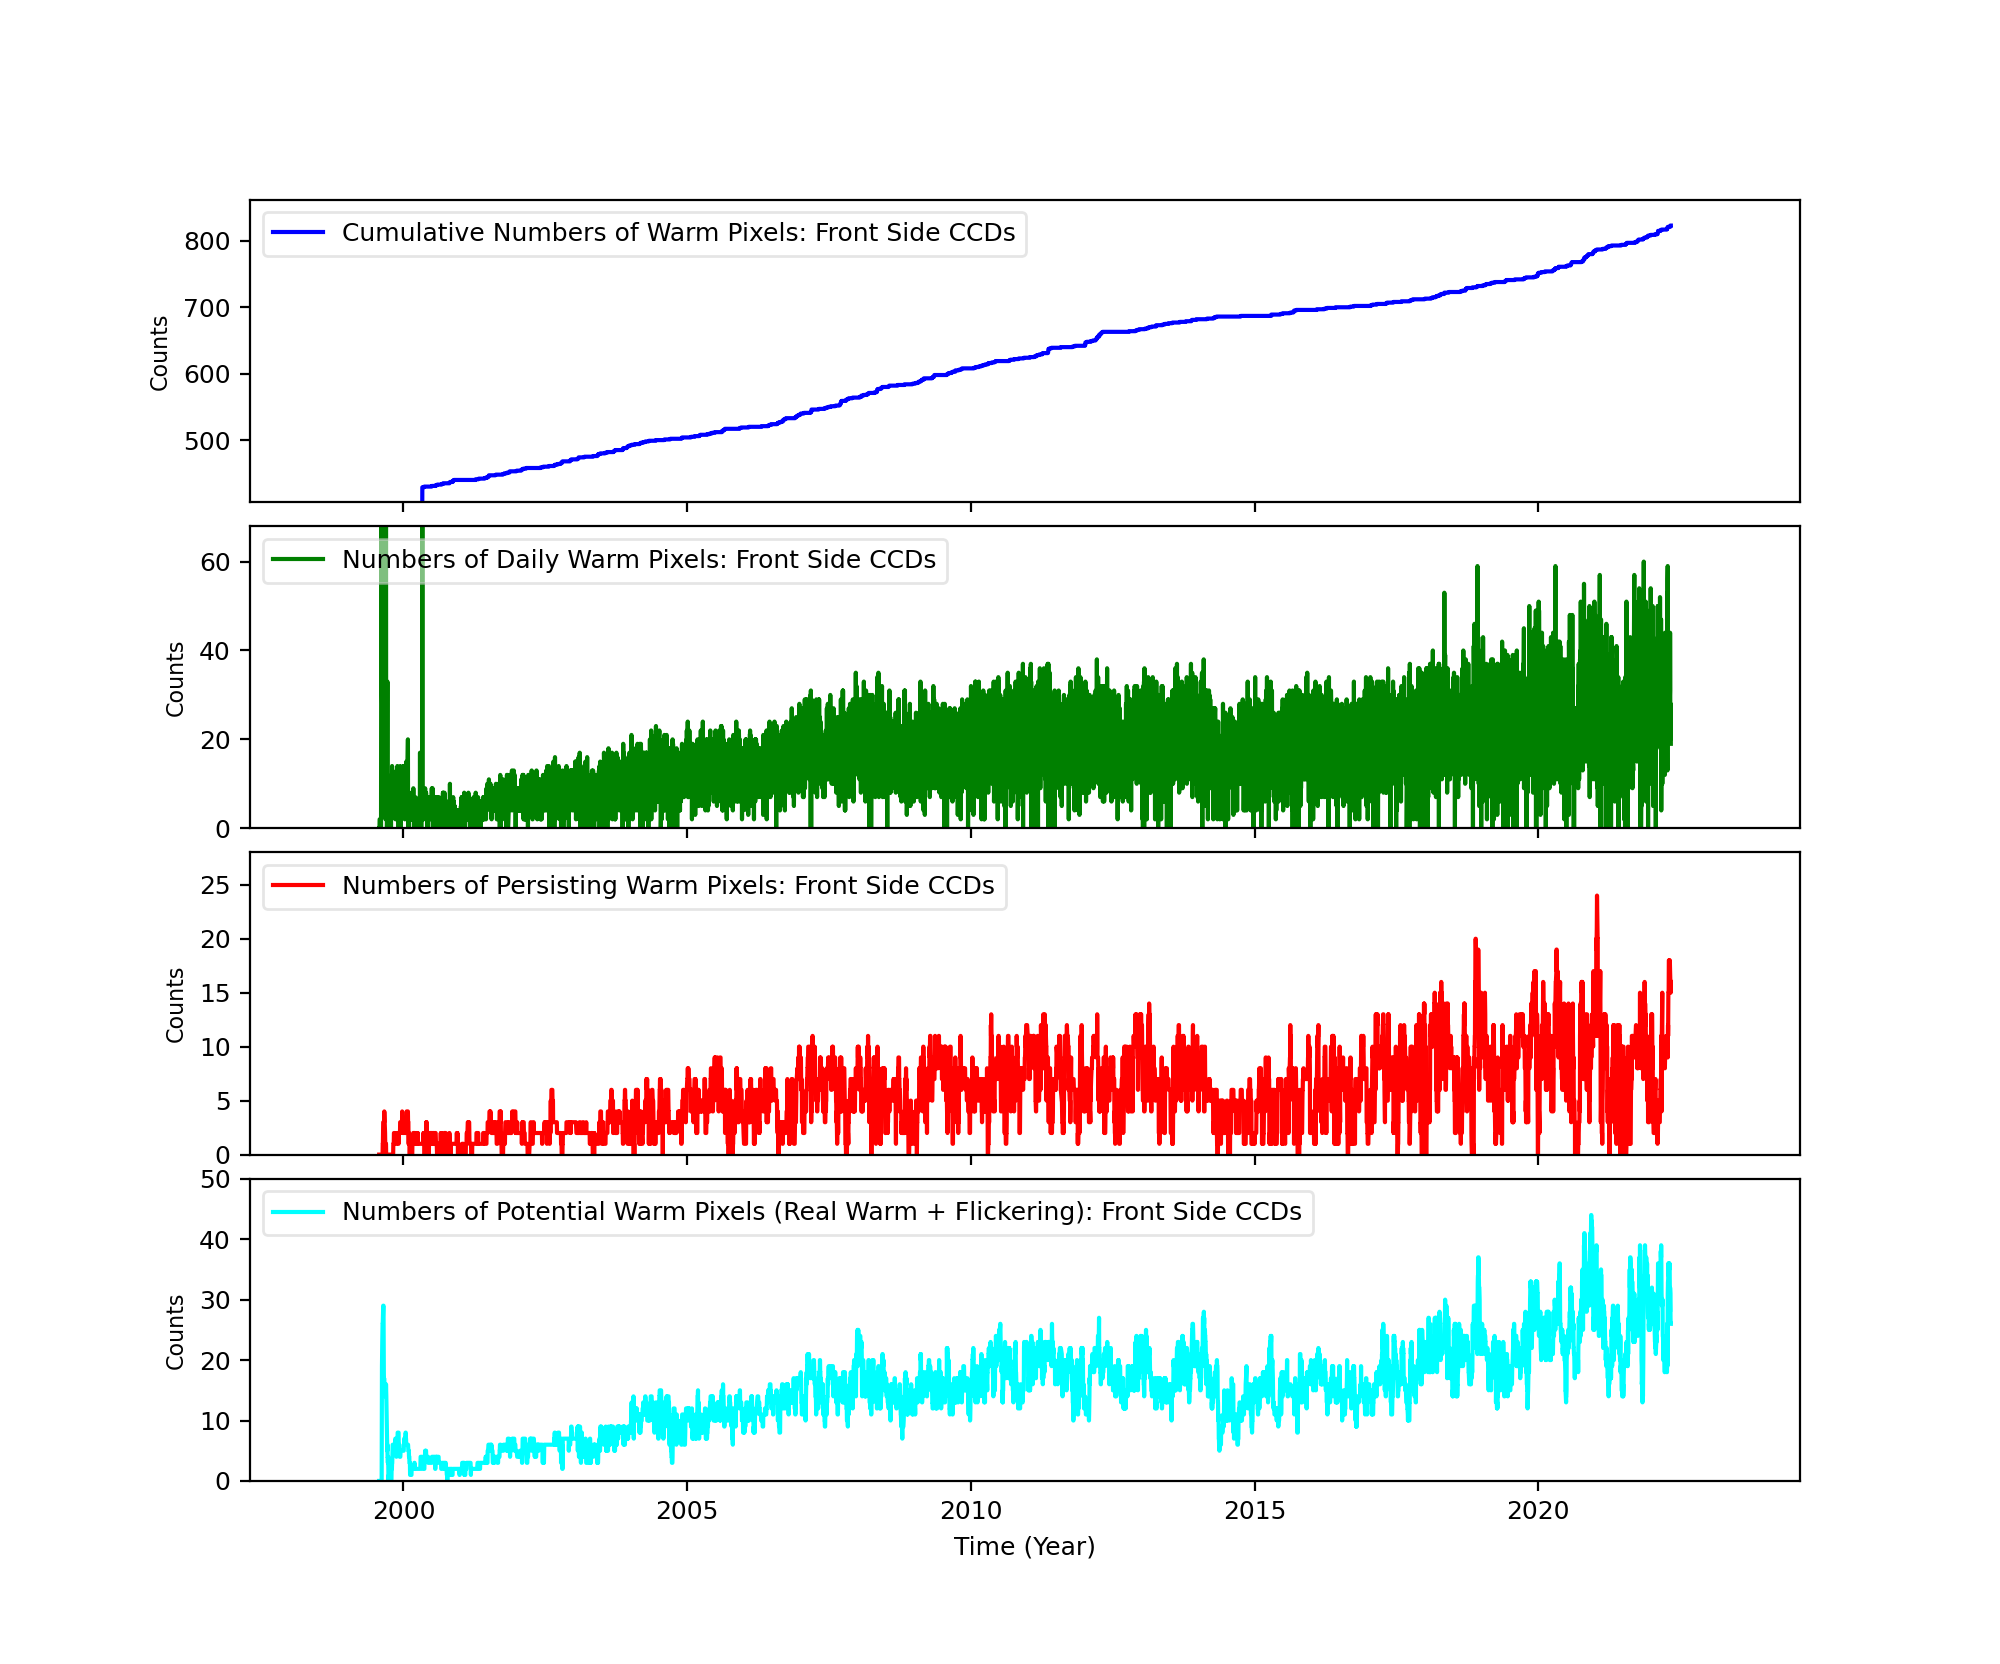
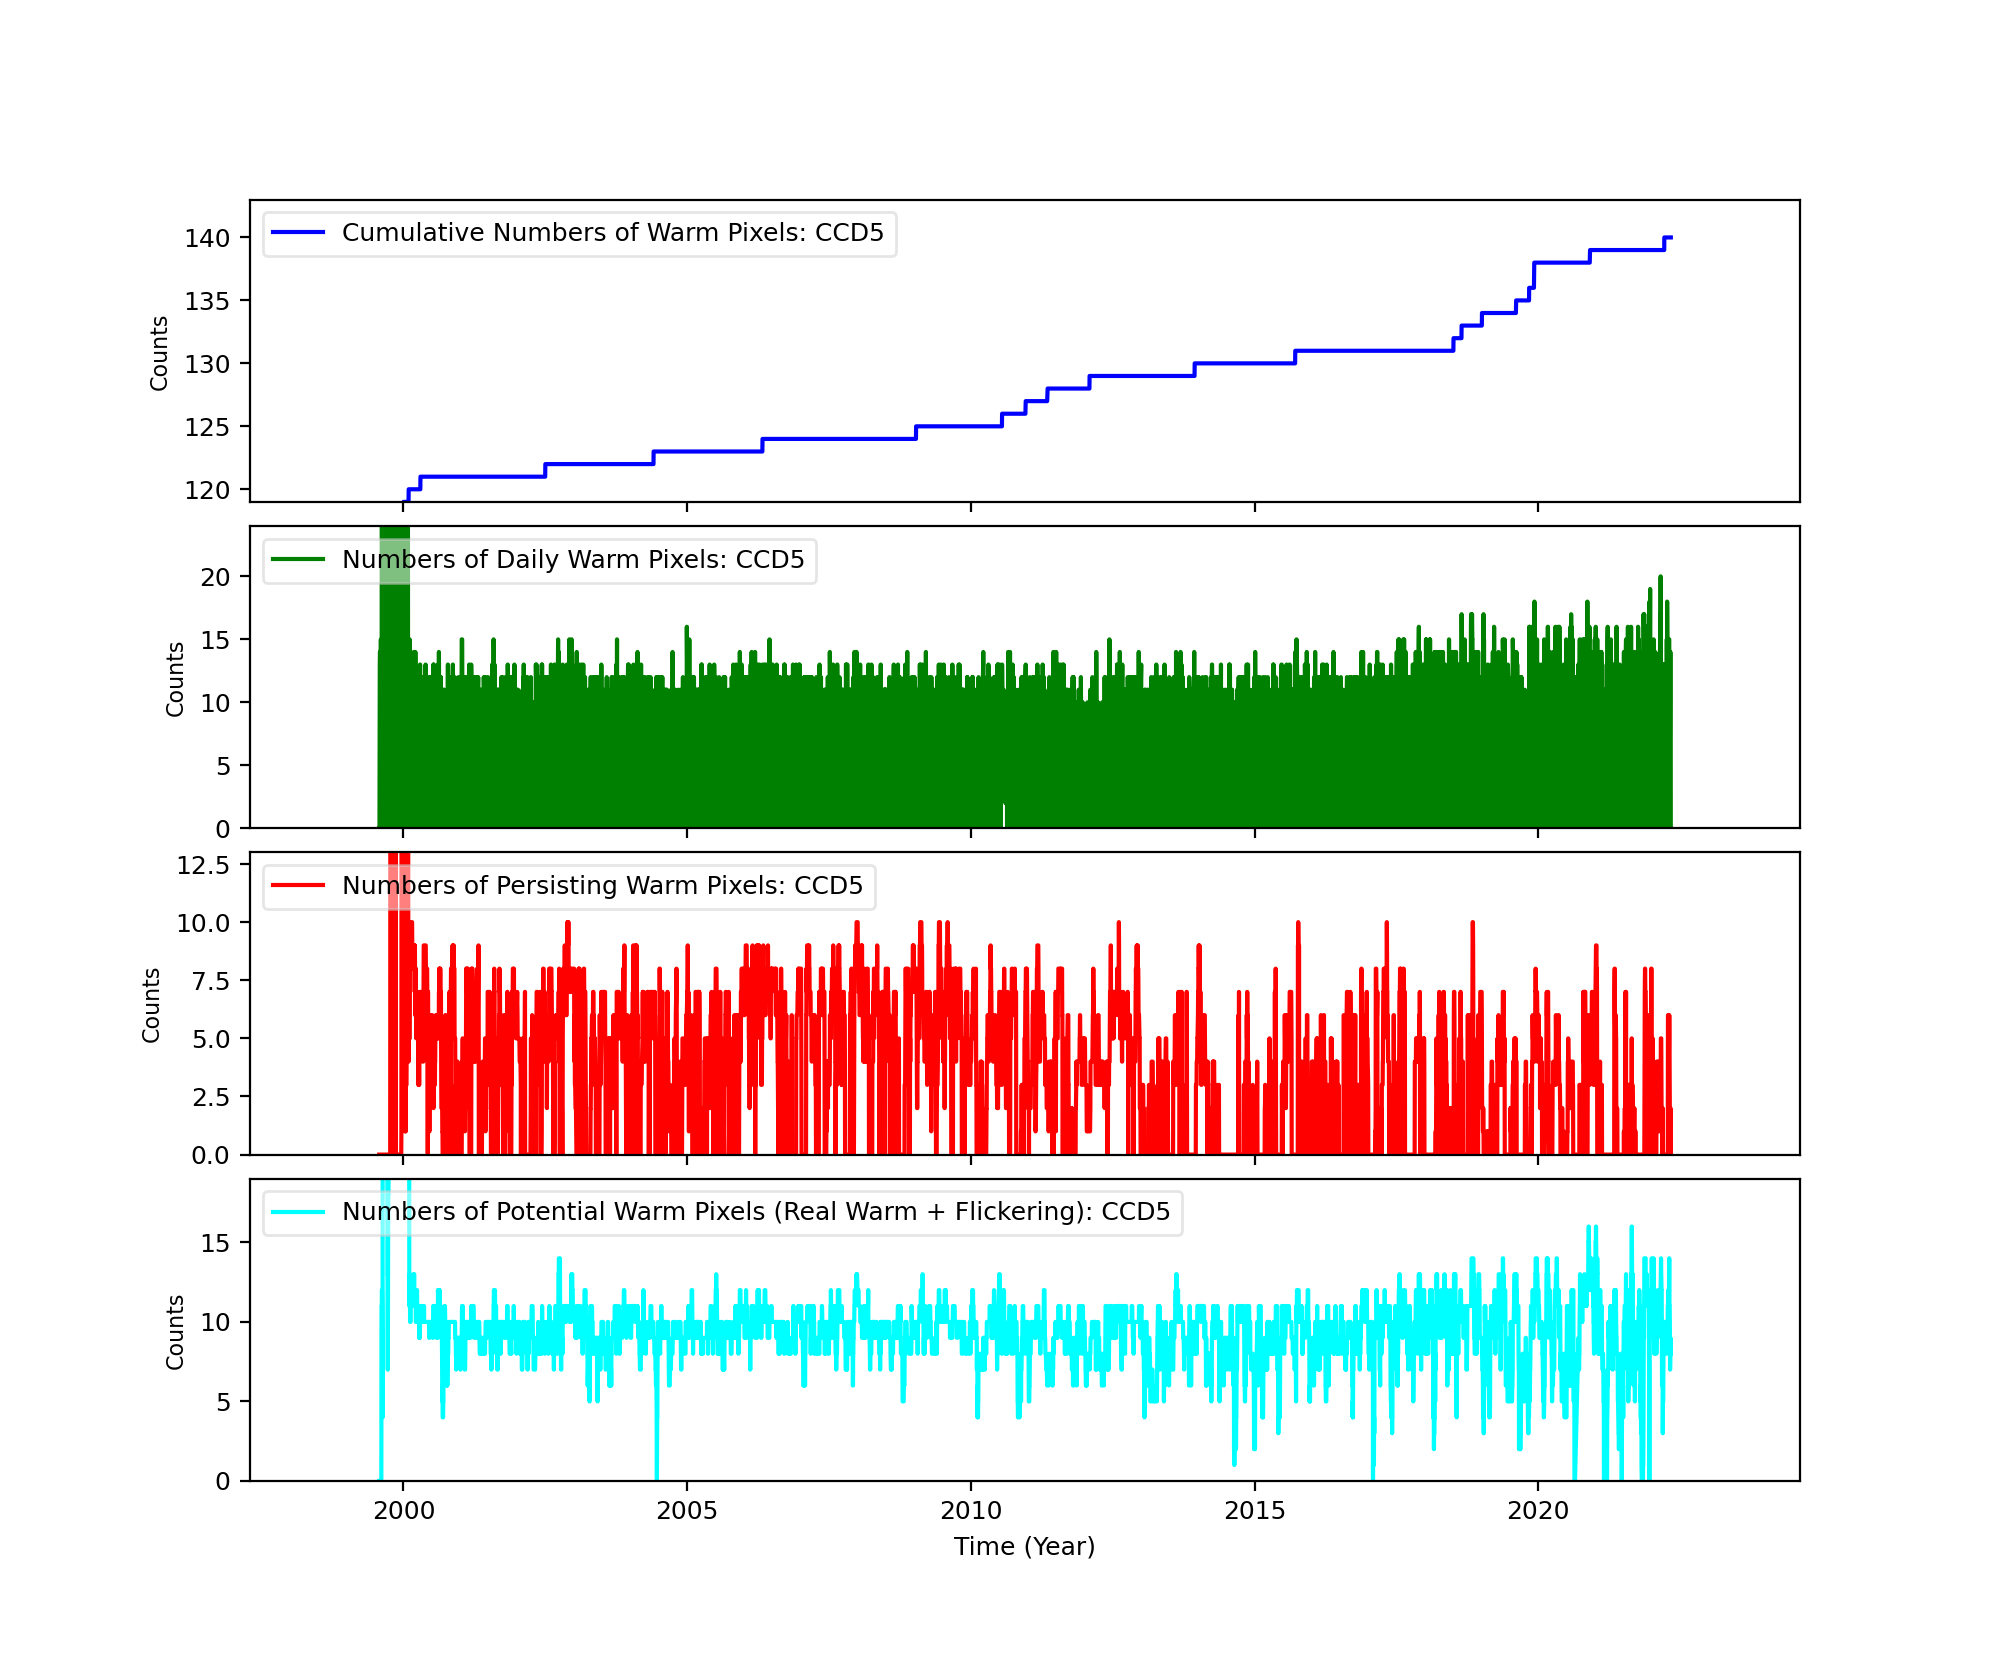
Bad Pixels
The plots below were generated with a new warm pixel finding script. Please see Acis Bad Pixel Page for details.
Front Side CCDs
Back Side CCD (CCD5)
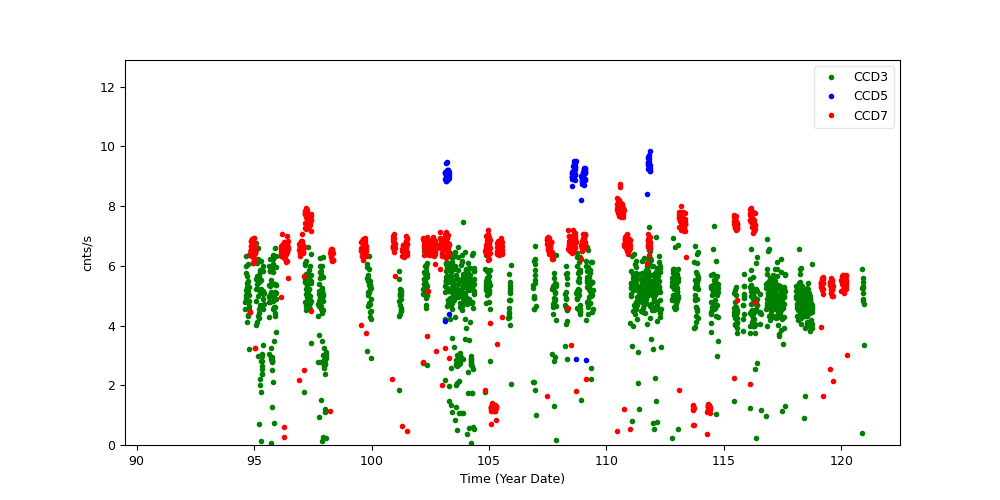
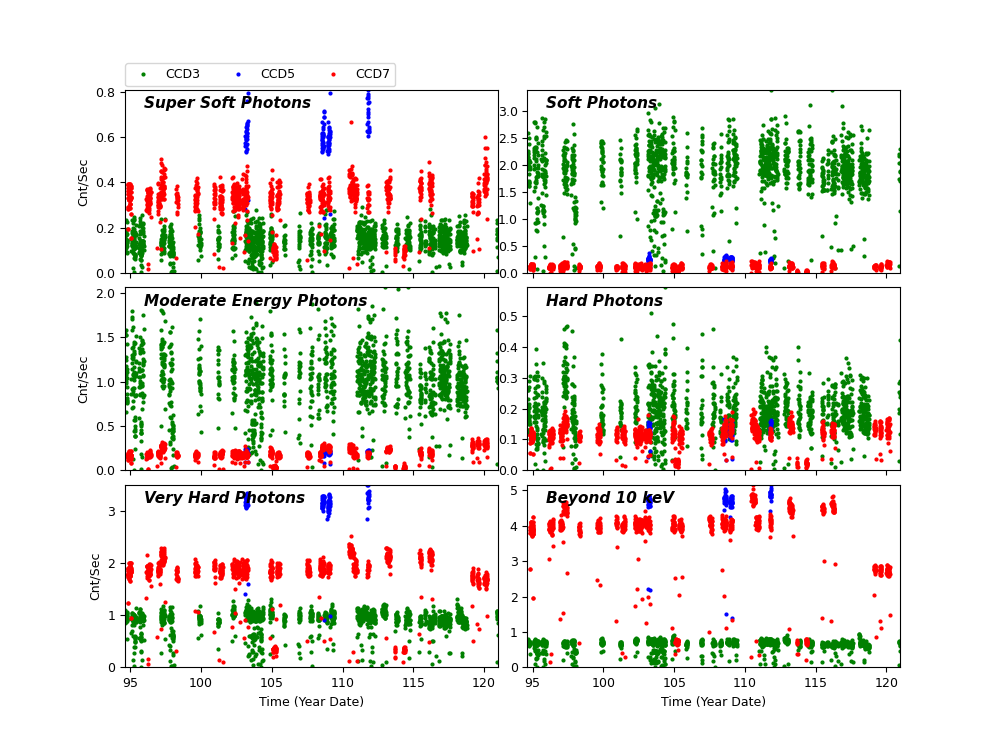
Science Instrument Background Rates
| Name | Low (keV) | High(KeV) | Description |
|---|---|---|---|
| SSoft | 0.00 | 0.50 | Super soft photons |
| Soft | 0.50 | 1.00 | Soft photons |
| Med | 1.00 | 3.00 | Moderate energy photons |
| Hard | 3.00 | 5.00 | Hard Photons |
| Harder | 5.00 | 10.00 | Very Hard photons |
| Hardest | 10.00 | Beyond 10 keV |
HRC
DOSE of Central 4K Pore-Pairs
Please refer to Maximum Dose Trends for more details.
No Data
)
IMAGE                       NPIX      MEAN    STDDEV      MIN       MAX
HRCI_08_1999_04_2022.fits  16777216	na	na	na	na
No Data
)
IMAGE                       NPIX      MEAN    STDDEV      MIN       MAX
HRCS_08_1999_04_2022.fits  16777216	na	na	na	na
|
|
Max dose trend plots corrected for events that "pile-up"
in the center of the taps due to bad position information.
|
)
|
)
|
)
|
)
|
| Jan 2022 | Oct 2021 | Jul 2021 | Apr 2021 |
|---|
)
|
)
|
)
|
)
|
| Jan 2022 | Oct 2021 | Jul 2021 | Apr 2021 |
|---|
Gratings
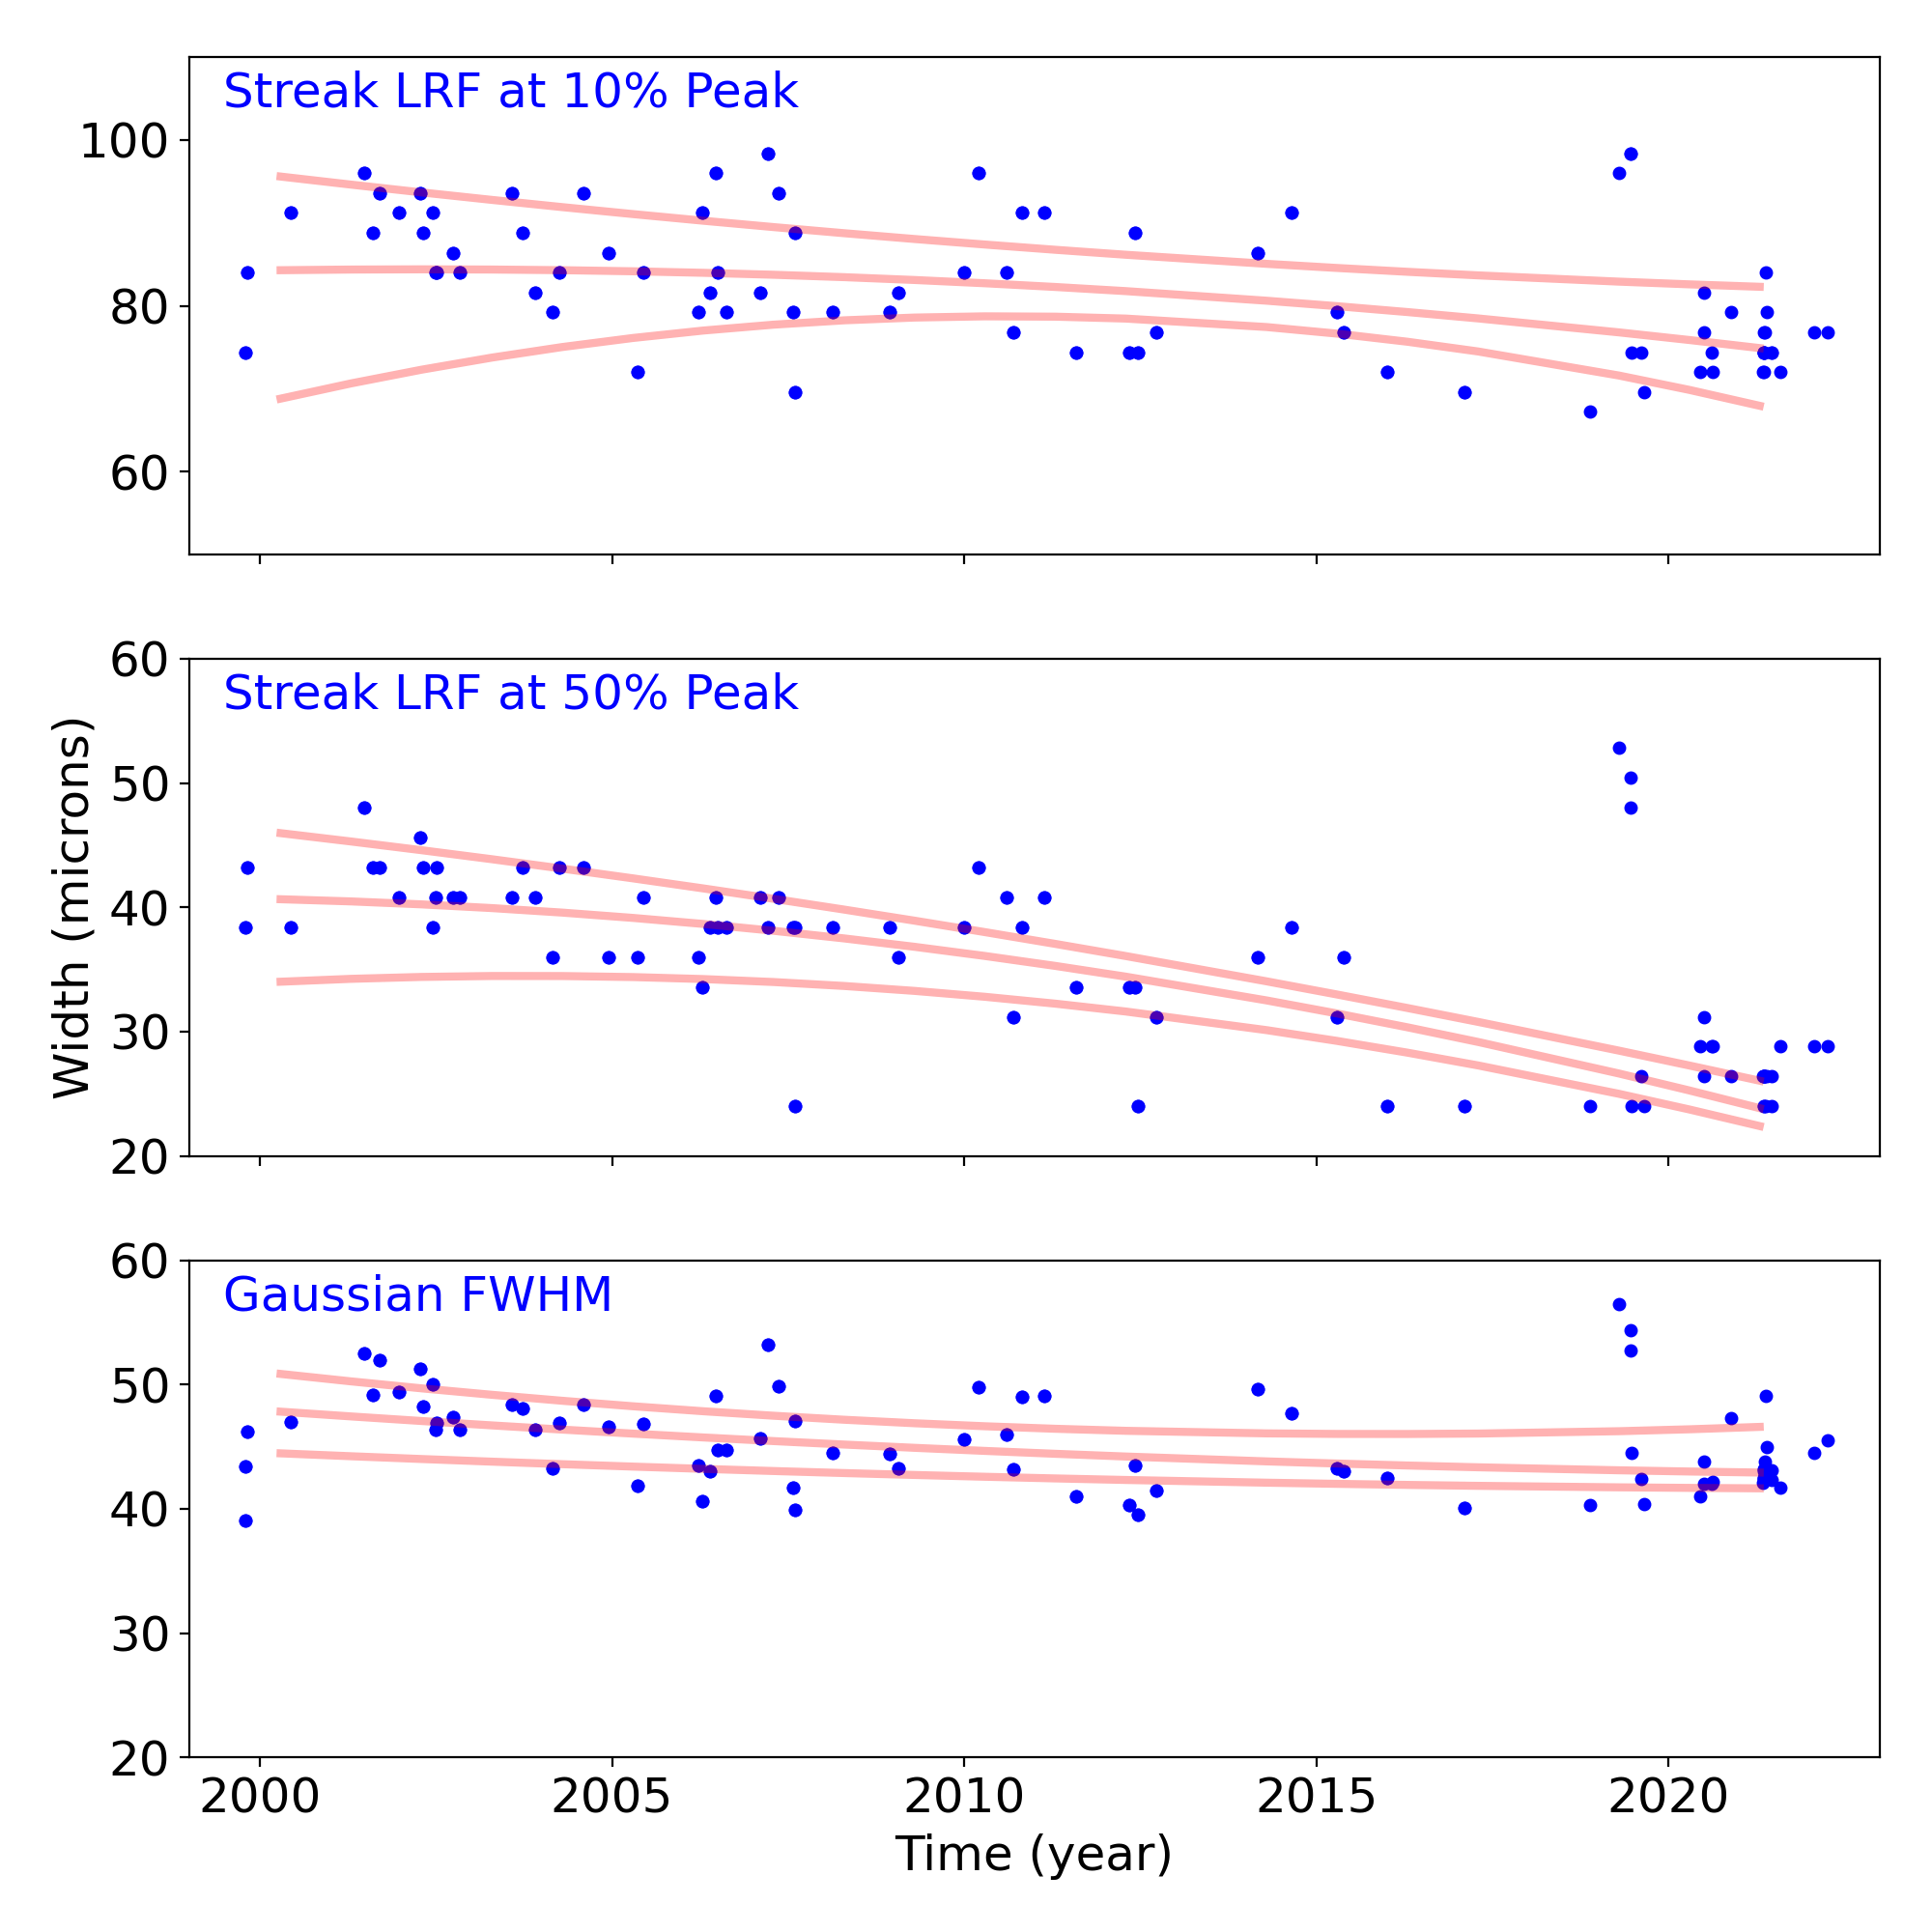
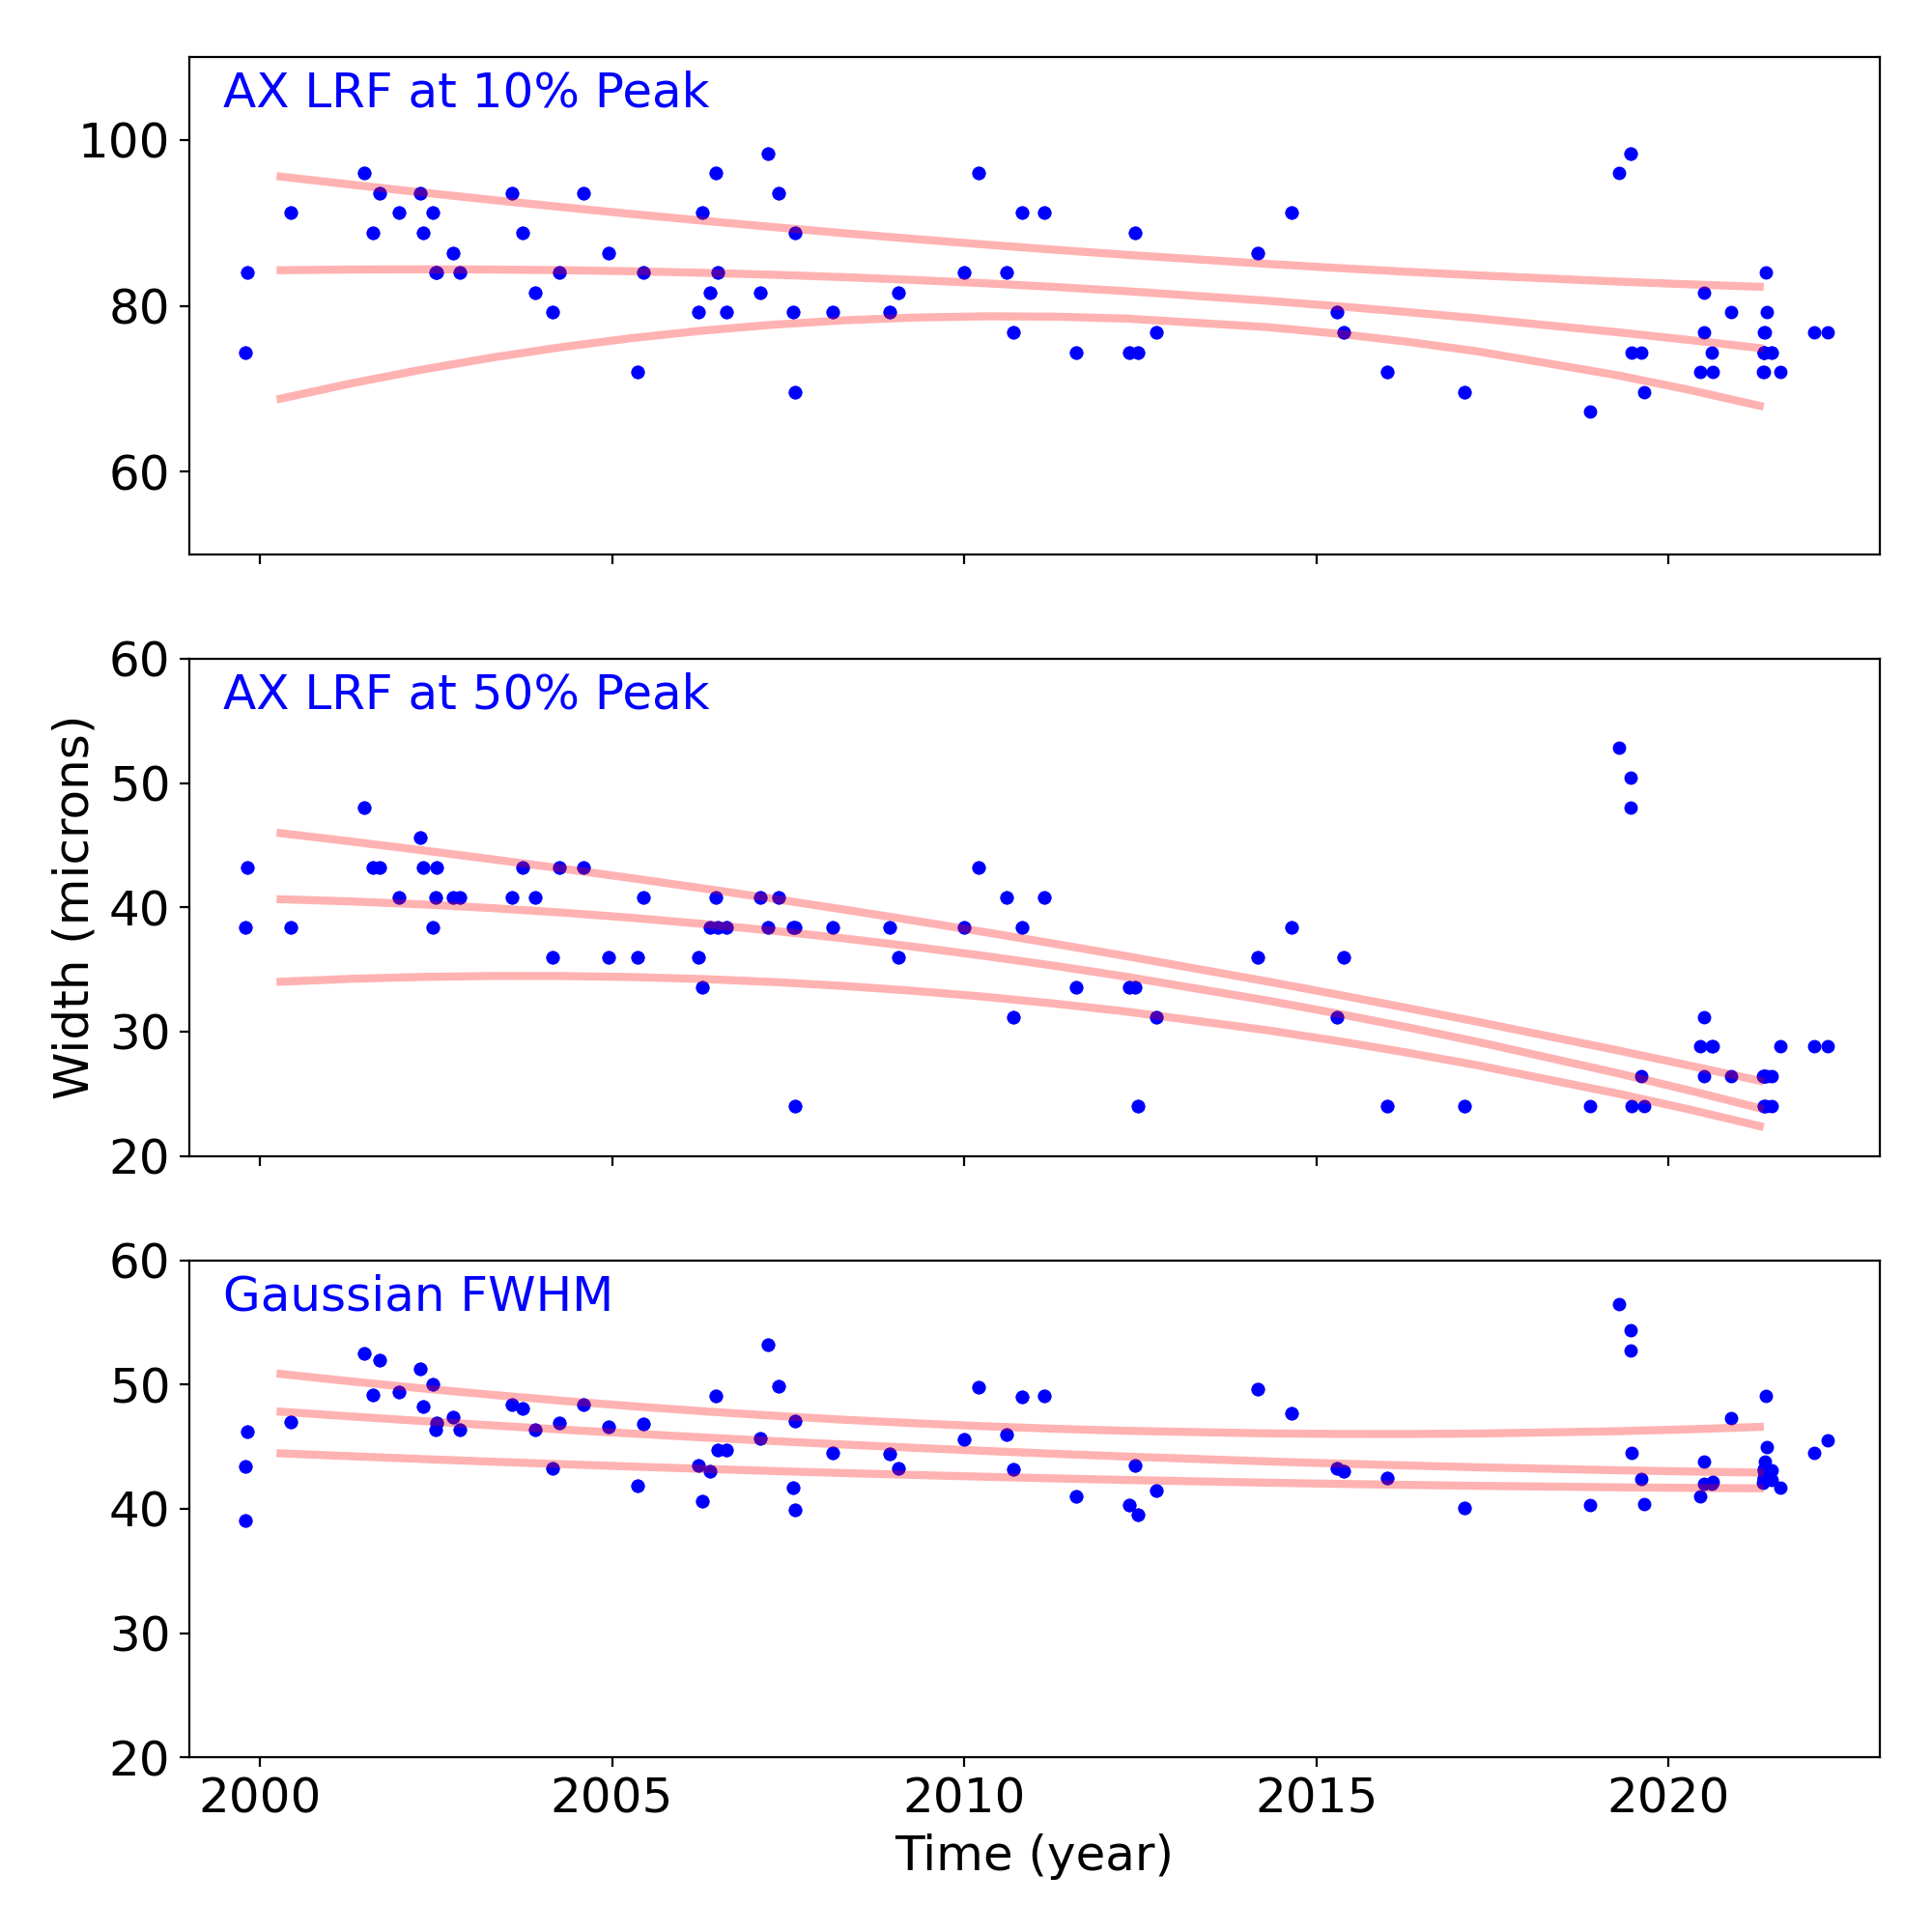
Grating Trends/Focus
We plot the width of the zero order streak of ACIS/HETG observations and the width of the zero order image for HRC/LETG observations of point sources. No significant defocusing trend is seen at this time. See Gratings Trends pages.
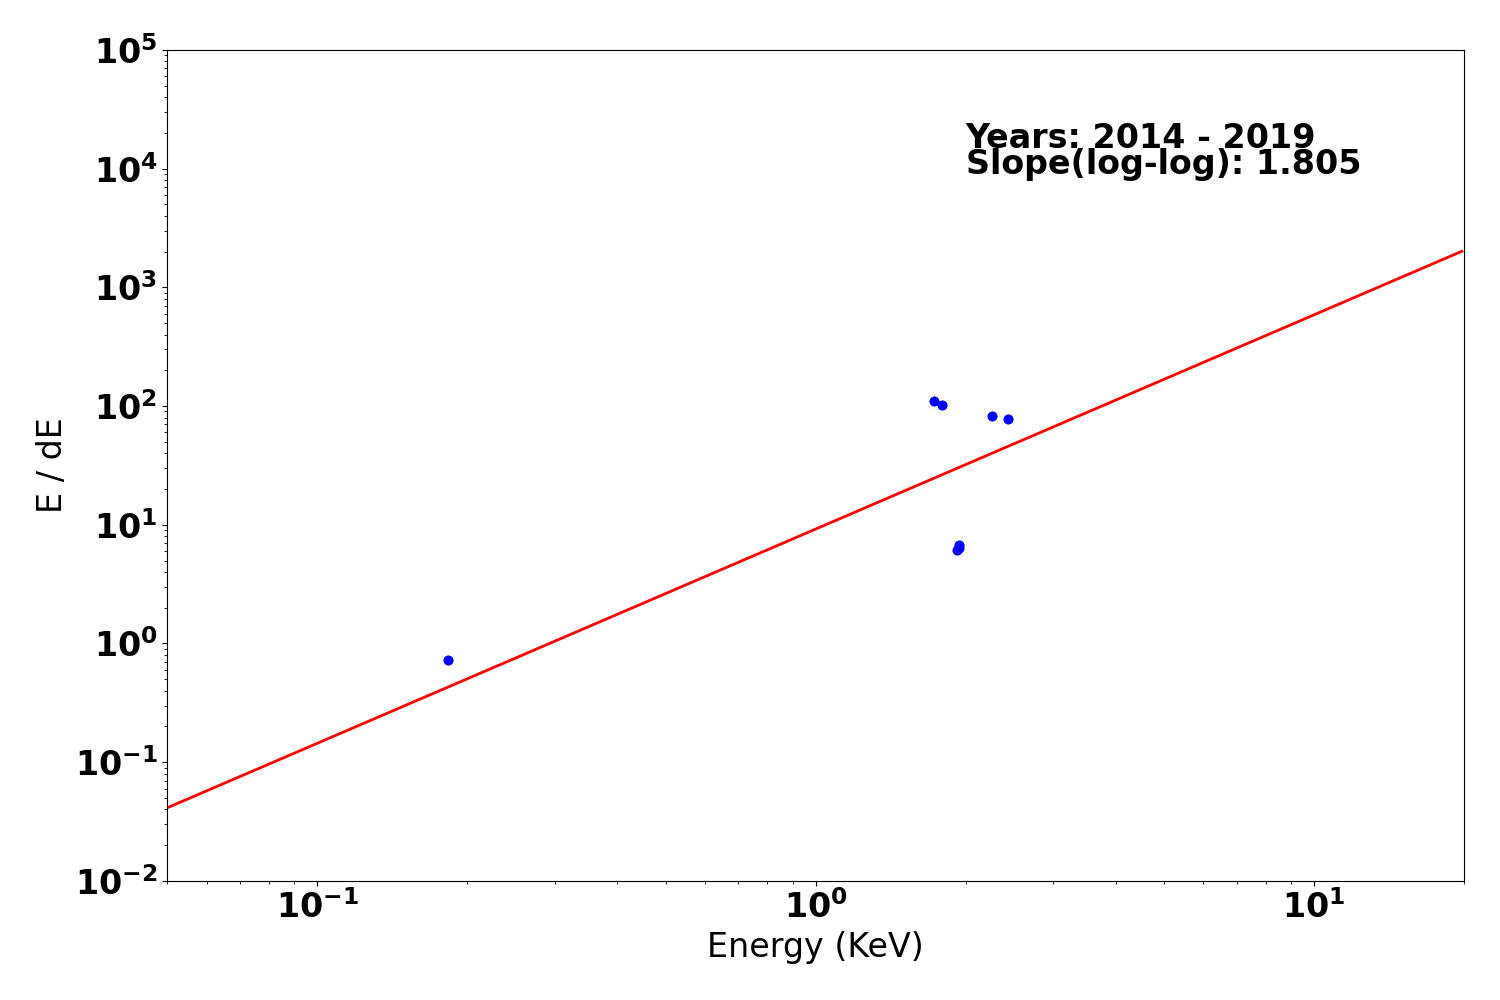
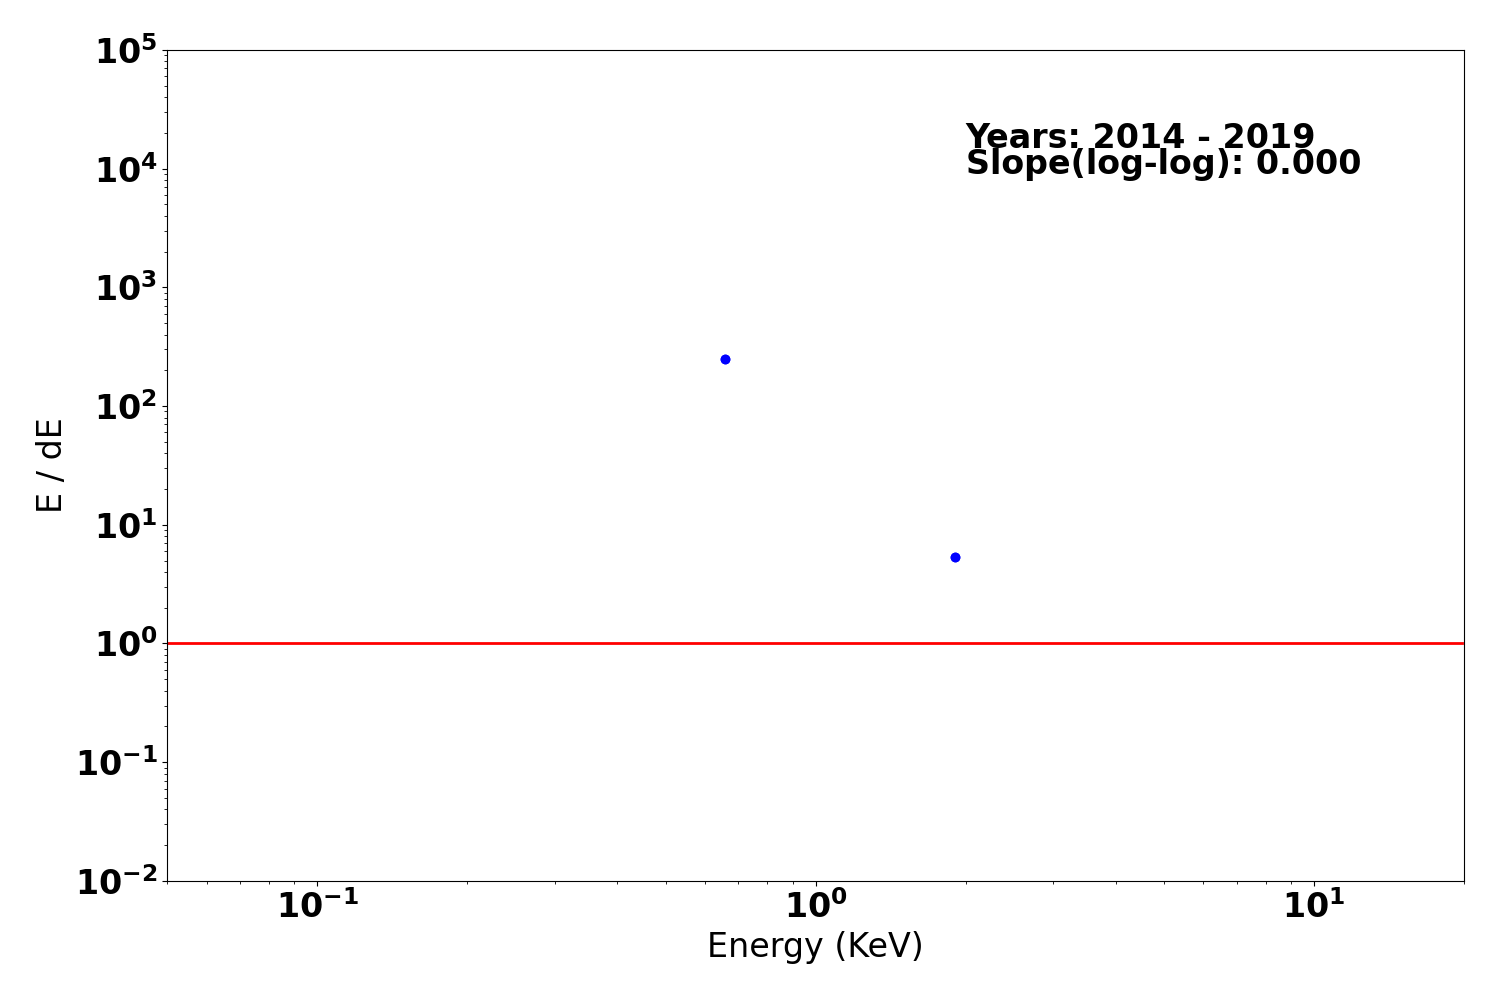
Gratings Resolving Power
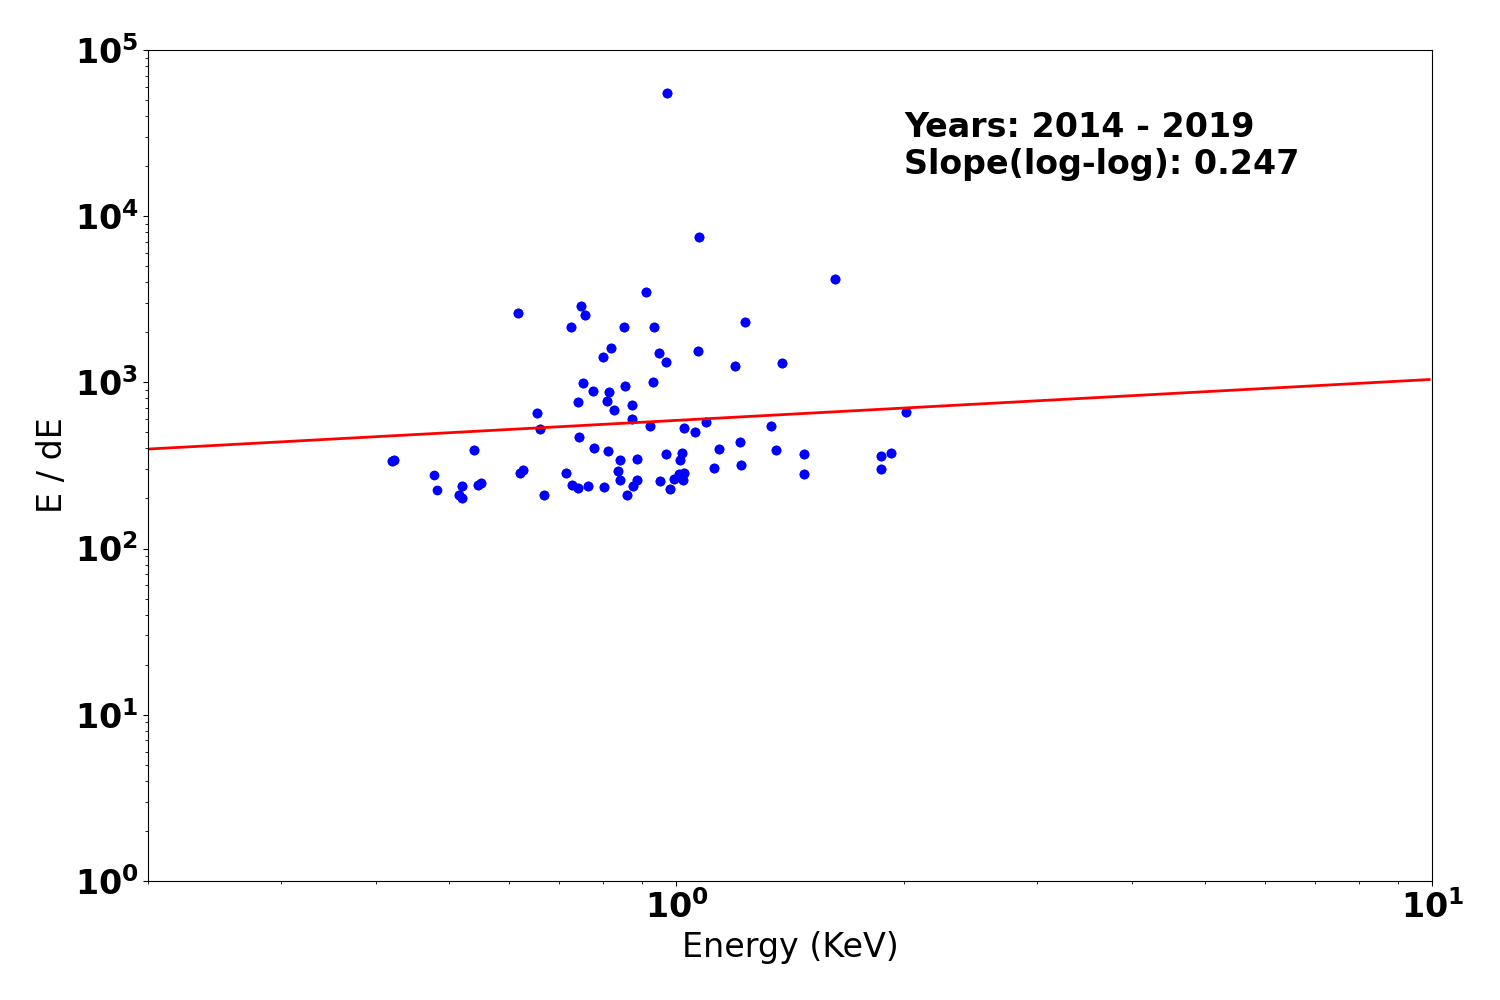
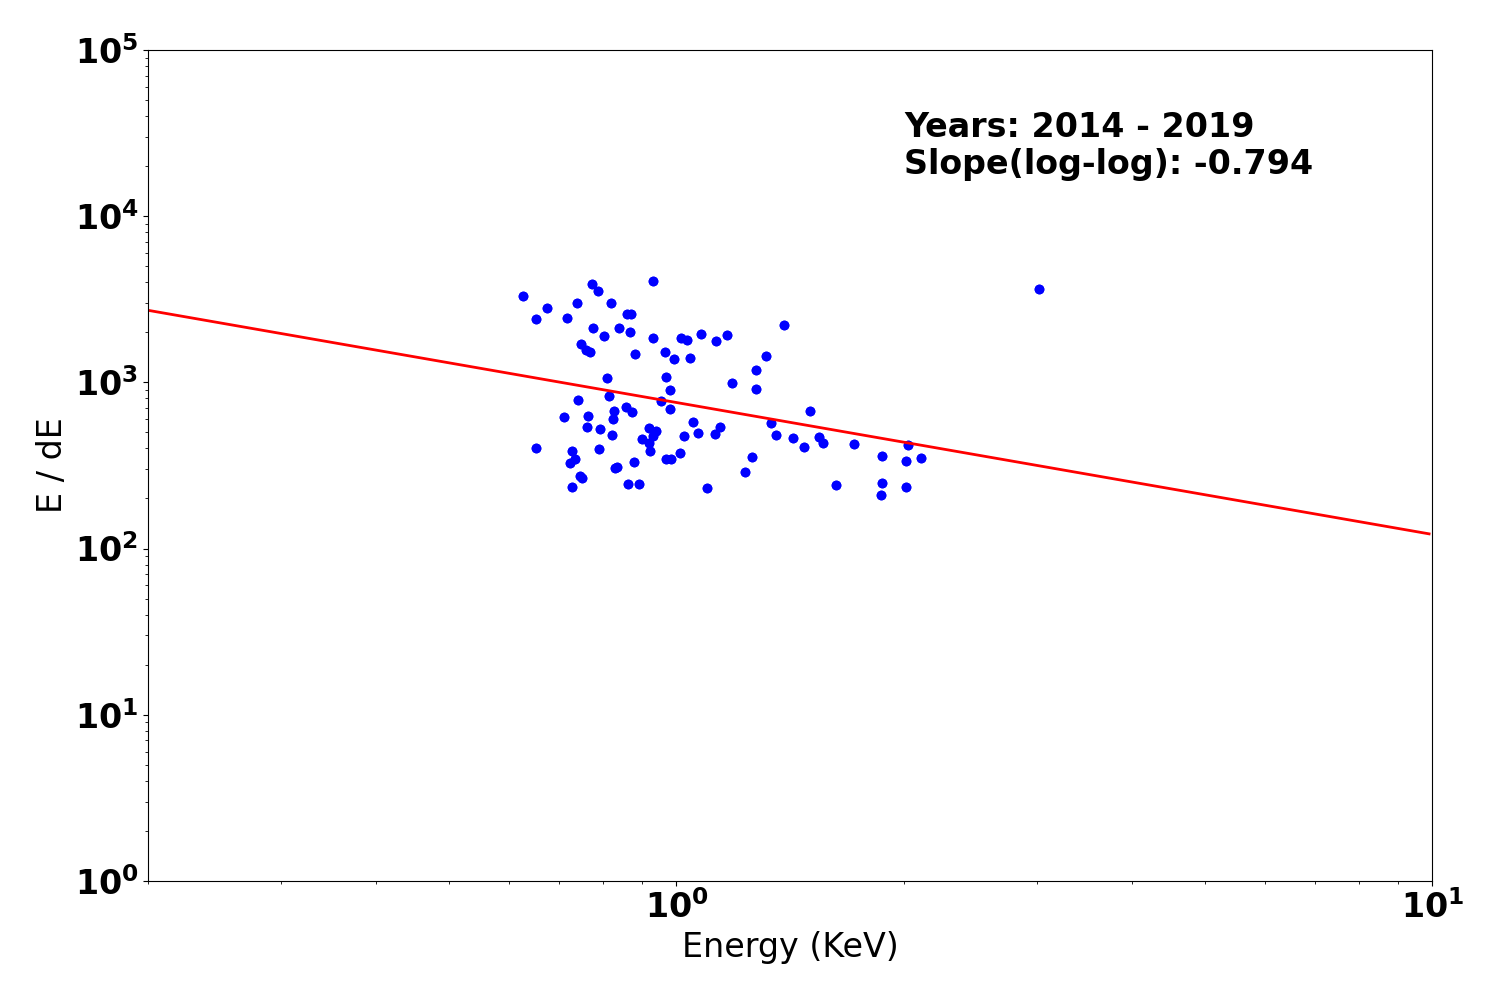
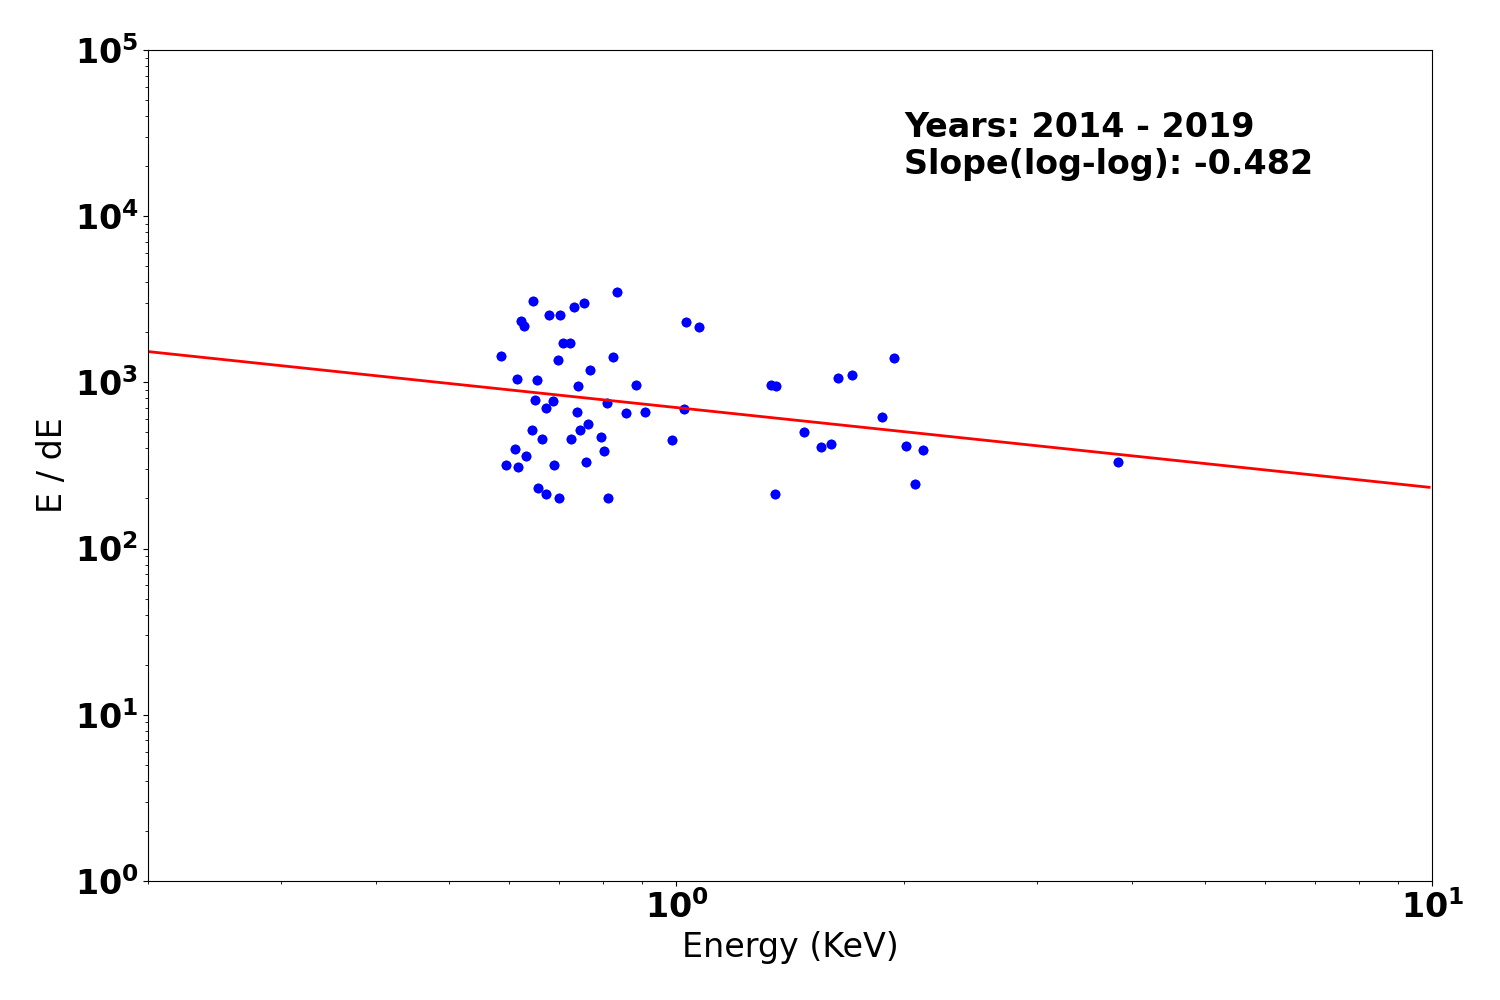
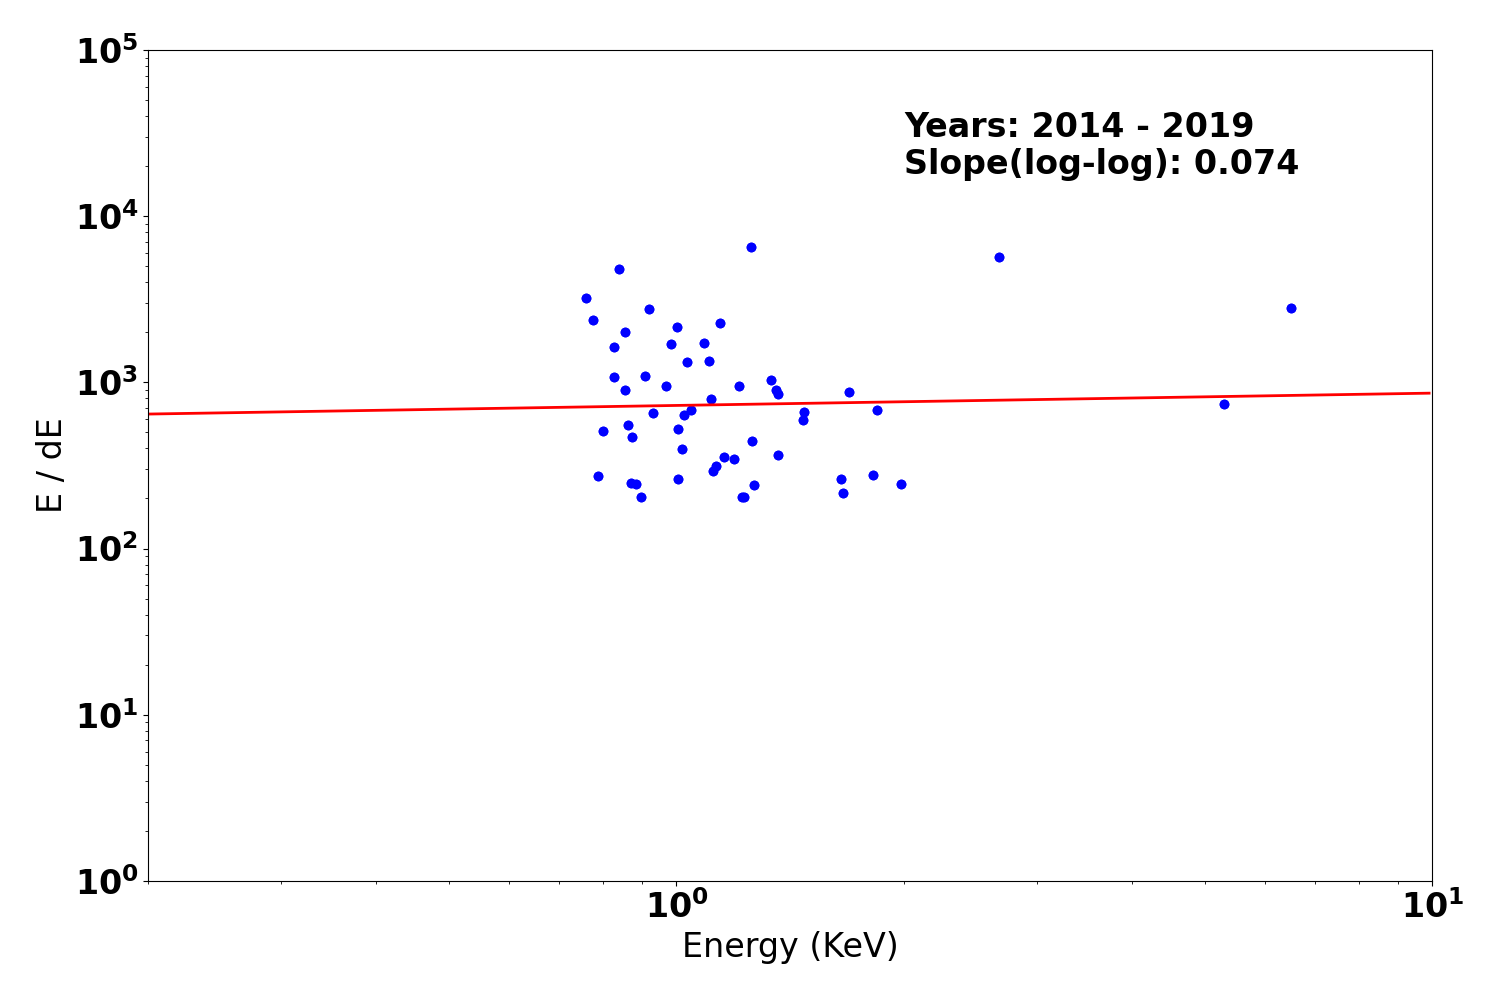
We plot E/dE vs. E for fits to detected lines with fwhm_error/fwhm less than 0.15 for the plus and minus arms of HEG, MEG, and LEG. Also shown are conservative (dotted line) and optimistic (dashed line) pre-launch resolving power expectations.
We have selected only calibration observations of Capella, HR1099, and Sigma Gem. See MIT technotes for a parallel analysis.
| Year 2014 - | |
|---|---|
| Letg minus side | Letg plus side |
 |
 |
| Metg minus side | Metg plus side |
 |
 |
| Hetg minus side | Hetg plus side |
 |
 |
PCAD
ACA Trending
| ACIS |
)
|
)
|
)
|
|
|---|---|---|---|---|
)
|
)
|
)
| ||
| HRCI |
)
|
)
|
)
|
)
|
| HRCI |
)
|
)
|
)
|
)
|
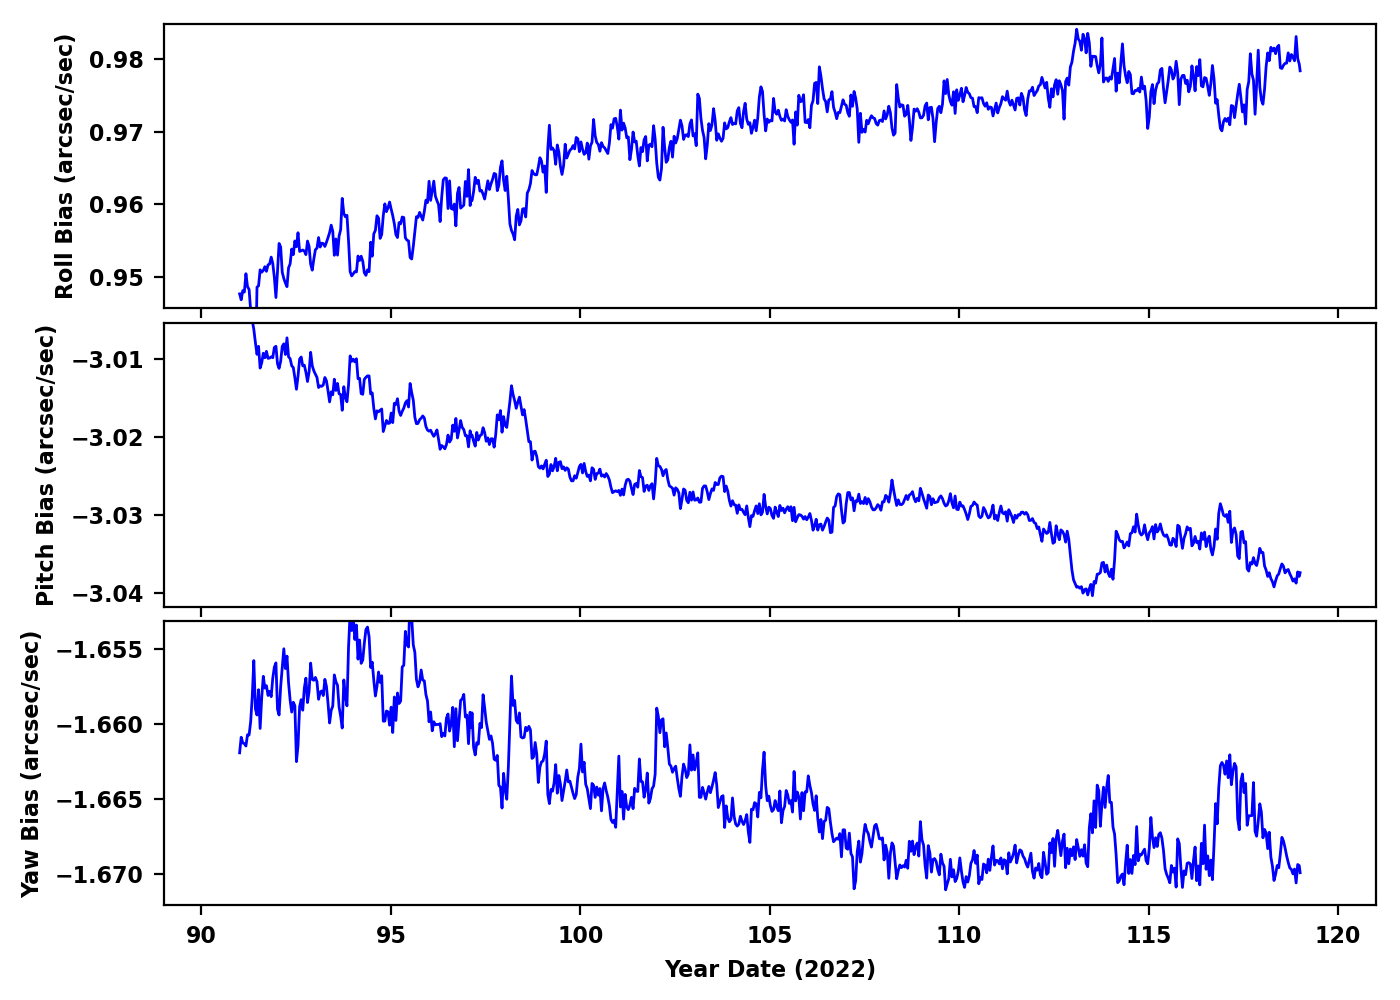
Gyro Bias Drift
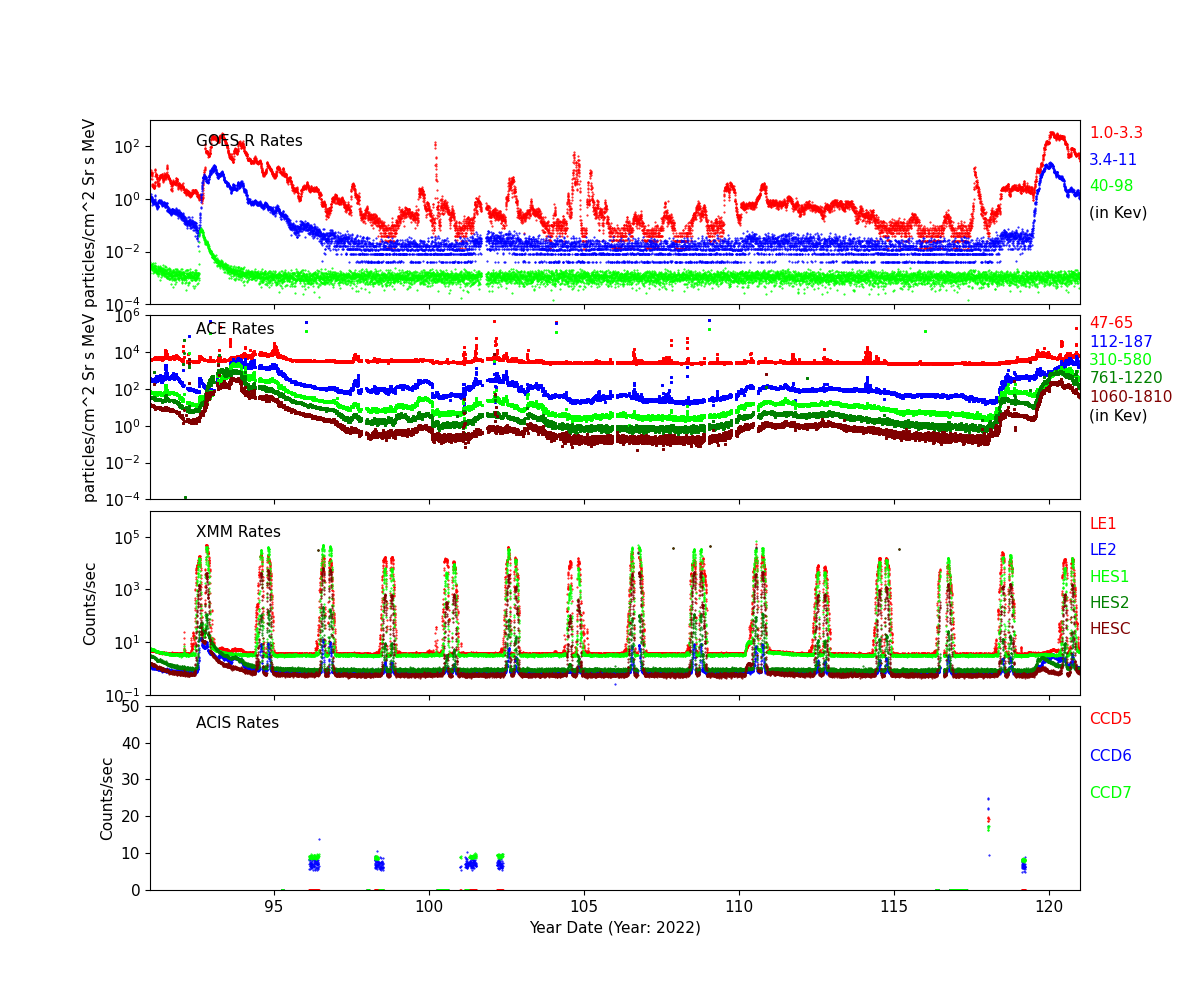
Radiation History
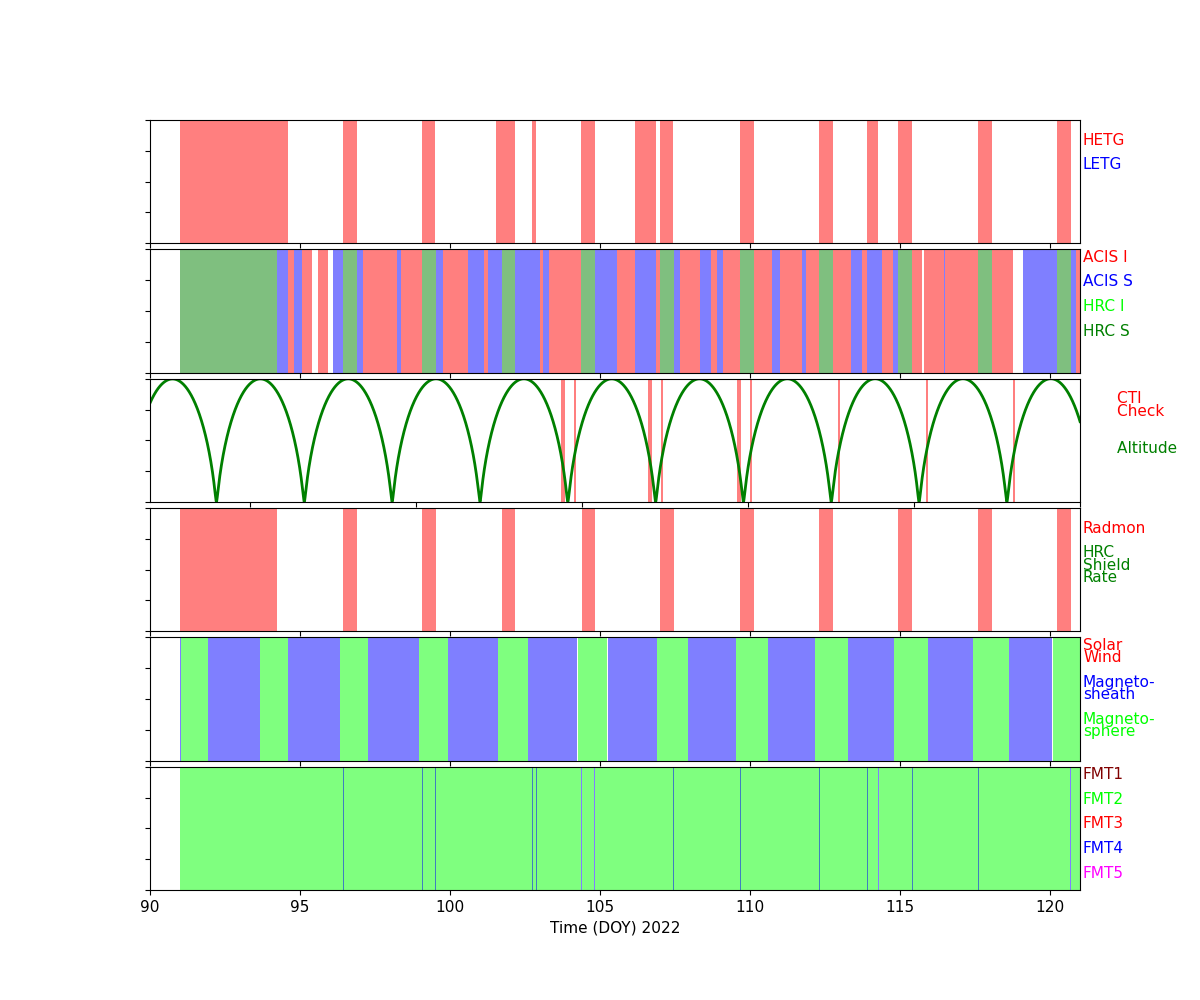
Radiation Count Rates of Apr 2022
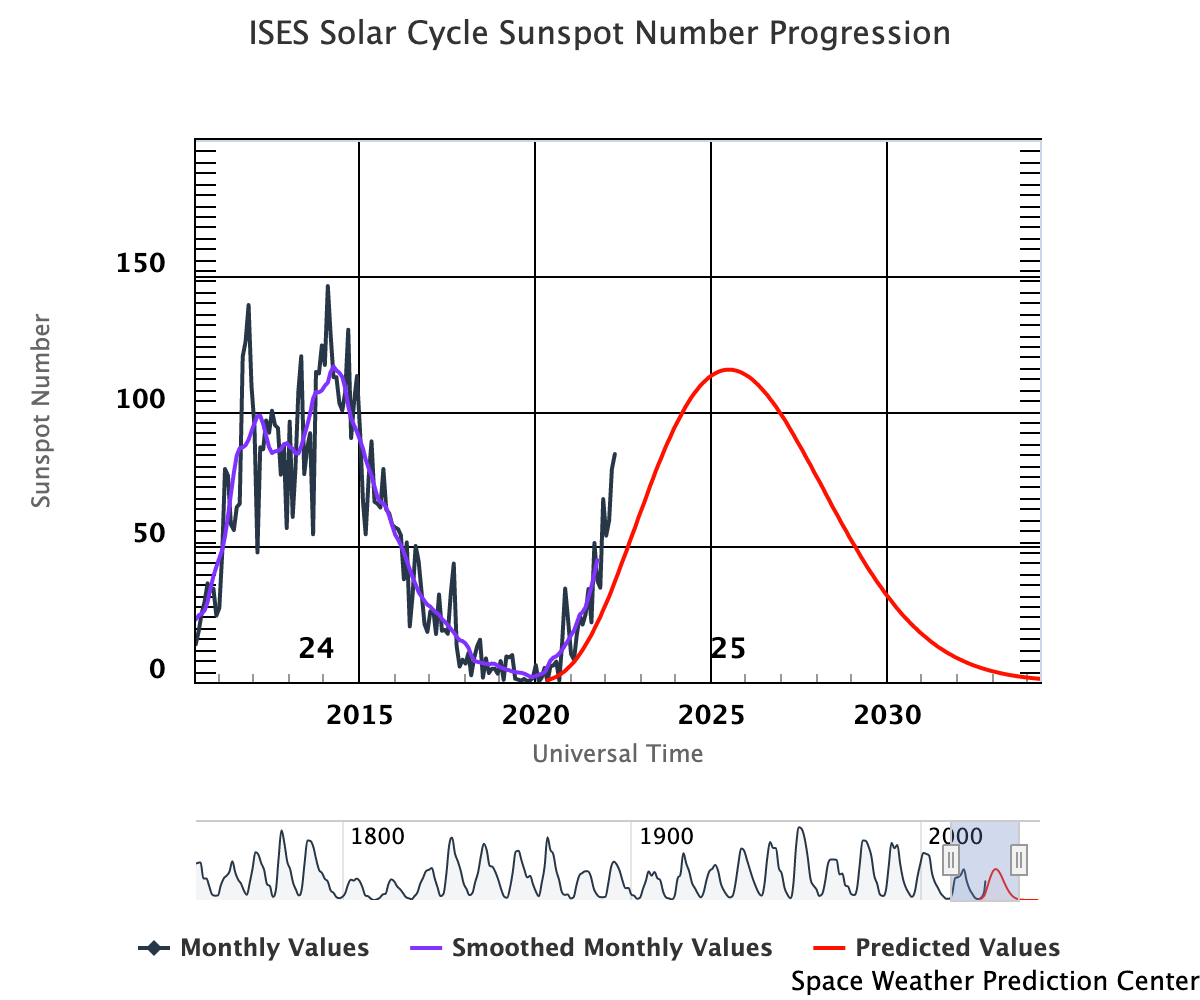
Sun Spot History (See:NOAA Page)
SIM
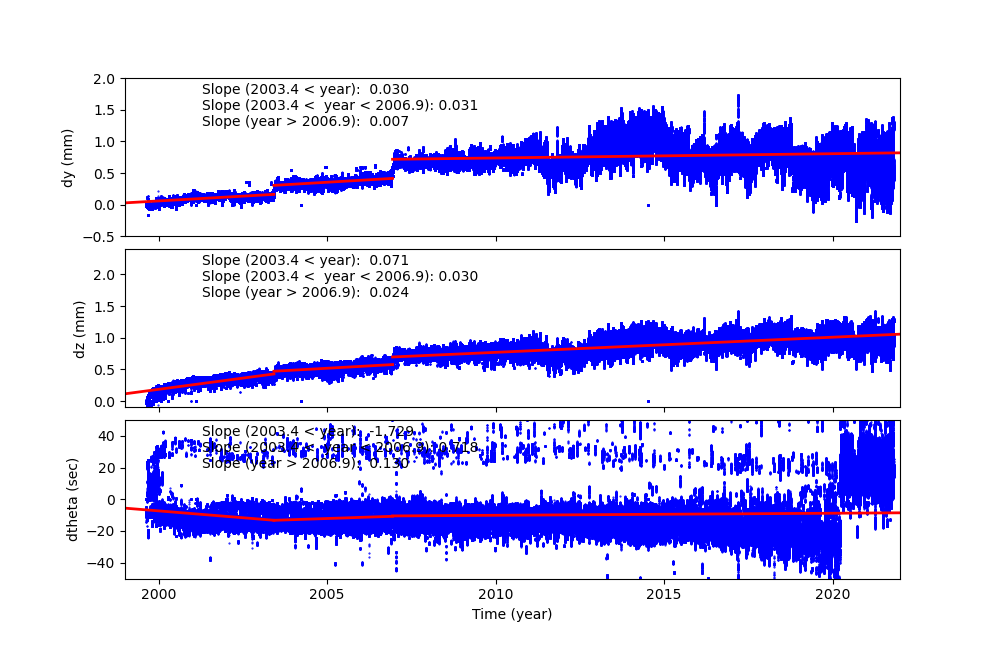
SIM Shift and Twist
SIM Shift and Twist Trend The following plots show trends of SIM shifts (dy and dz) and twist (dtheta). All quantities are directly taken from pcaf*_asol1.fits files. The units are mm for dy and dz, and degree for dtheta. We fit three lines separated before and after (Days of Mission)= 1400 (May 21, 2003), 2700 (Dec 11, 2006), and 4400 (Aug 07, 2011). The unit of slopes are mm per day or degree per day.
The sudden shift around DOM = 1400, 2700 and 4400 are due to fid light drift (see a memo by Aldcroft fiducial light drift). On the dtheta plot, two tracks are clearly observed. The track around 0.01 is due to HRC-I, and all others are clustered around -0.002. For more detail, please see SIM Shift and Twist Trend page
Trending
Quarterly Trends
- EPS Batteries
| Previous Quarter | |||||||
| MSID | MEAN | RMS | DELTA/YR | DELTA/YR/YR | UNITS | DESCRIPTION | |
| eb2ci | off | -3.212e-04 | 3.211e-05 | 0.34 +/- 0.08 | -0.00 +/- 0.00 | AMP | BATT 2 CHARGE CURRENT | on | 9.548e-04 | 9.034e-04 | 0.34 +/- 0.05 | (0.00+/-0.00)e0 |
|---|---|---|---|---|---|---|---|
| eb2di | off | -4.117e-04 | 7.588e-05 | 0.02 +/- 0.18 | -(9.81+/-50.19)e-6 | AMP | BATT 2 DISCHARGE CURRENT | on | -0.003 | 0.022 | 0.28 +/- 1.15 | (0.00+/-0.00)e0 |
| eb2v | off | 0.001 | 3.538e-05 | 32.43 +/- 0.09 | 0.00 +/- 0.00 | V | BATT 2 VOLTAGE | on | 0.006 | 0.011 | 32.20 +/- 0.56 | (0.00+/-0.00)e0 |
| ecnv1v | -1.992e-05 | 2.942e-06 | 14.89 +/- 0.01 | (9.12+/-4.91)e-4 | V | CONV 1 +15V OUTPUT | |
| ecnv2v | -6.000e-05 | 3.549e-06 | 14.84 +/- 0.01 | 0.00 +/- 0.00 | V | CONV 2 +15V OUTPUT | |
| ecnv3v | -1.979e-05 | 2.253e-06 | 15.29 +/- 0.01 | (4.55+/-4.72)e-4 | V | CONV 3 +15V OUTPUT | |
- Spacecraft Electronics
| Previous Quarter | |||||||
| MSID | MEAN | RMS | DELTA/YR | DELTA/YR/YR | UNITS | DESCRIPTION | |
| elbi | -7.172e-04 | 5.955e-04 | 53.33 +/- 1.39 | 0.12 +/- 0.19 | AMP | LOAD BUS CURRENT | |
|---|---|---|---|---|---|---|---|
| elbv | off | 0.003 | 5.441e-05 | 27.90 +/- 0.17 | 0.01 +/- 0.02 | V | LOAD BUS VOLTAGE | on | 0.005 | 0.004 | 28.71 +/- 0.22 | (0.00+/-0.00)e0 |
- OBA Heater
| Previous Quarter | |||||||
| MSID | MEAN | RMS | DELTA/YR | DELTA/YR/YR | UNITS | DESCRIPTION | |
| oobthr04 | 0.009 | 5.810e-04 | (3.02+/-0.01)e2 | -0.30 +/- 0.44 | K | RT 27: HRMA STRUT | |
|---|---|---|---|---|---|---|---|
| oobthr12 | 0.013 | 8.932e-04 | (3.00+/-0.02)e2 | -0.15 +/- 0.68 | K | RT 35: OBA CONE | |
| oobthr26 | 0.018 | 0.001 | (3.03+/-0.03)e2 | -0.45 +/- 0.99 | K | RT 48: OBA CONE | |
| oobthr38 | 4.551e-05 | 5.767e-06 | (2.83+/-0.00)e2 | 0.01 +/- 0.00 | K | RT 60: TFTE CONE | |
| oobthr44 | 0.012 | 9.449e-04 | (3.03+/-0.02)e2 | -0.59 +/- 0.76 | K | RT 66: TFTE COVER | |
| oobthr50 | 0.007 | 7.403e-04 | (2.98+/-0.02)e2 | -0.55 +/- 0.61 | K | RT 76: S/C STRUT | |
Spacecraft Motions
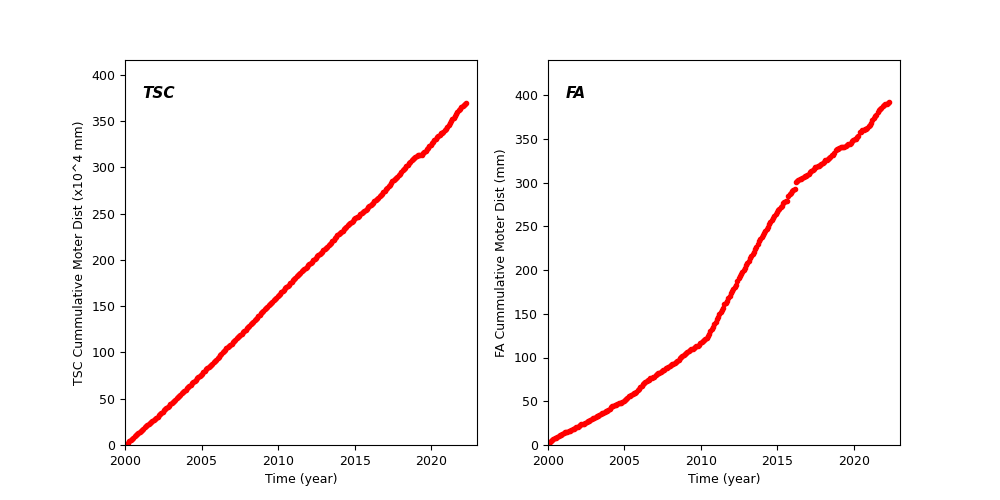
TSC and FA Cummulative Moter Distance
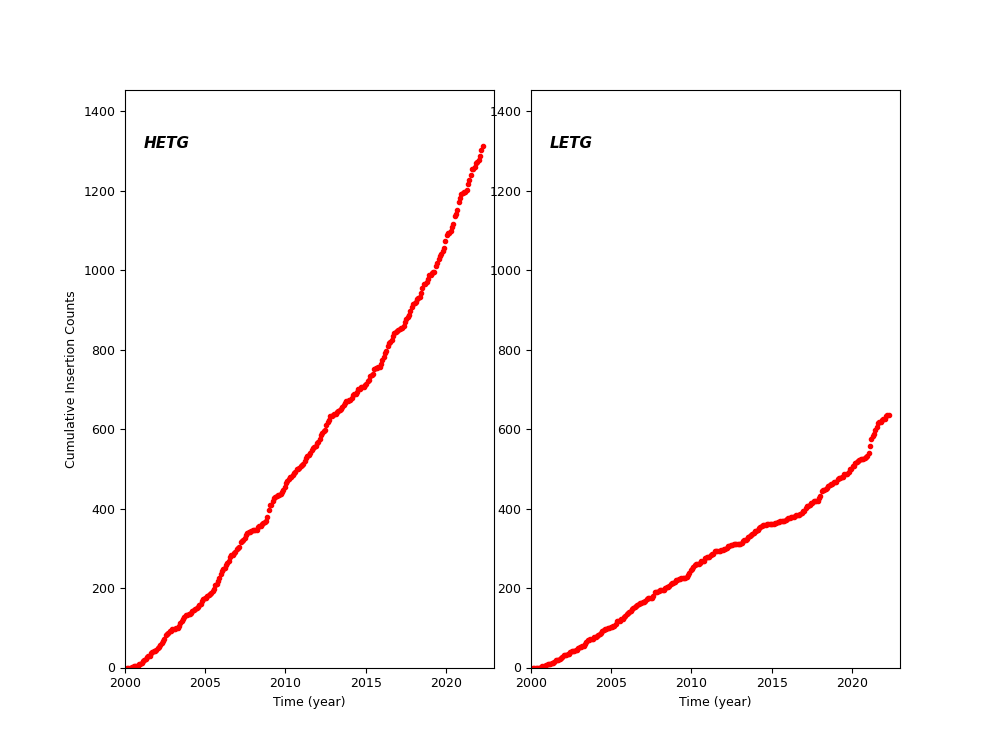
HETG and LETG Cummulative Insertion Counts
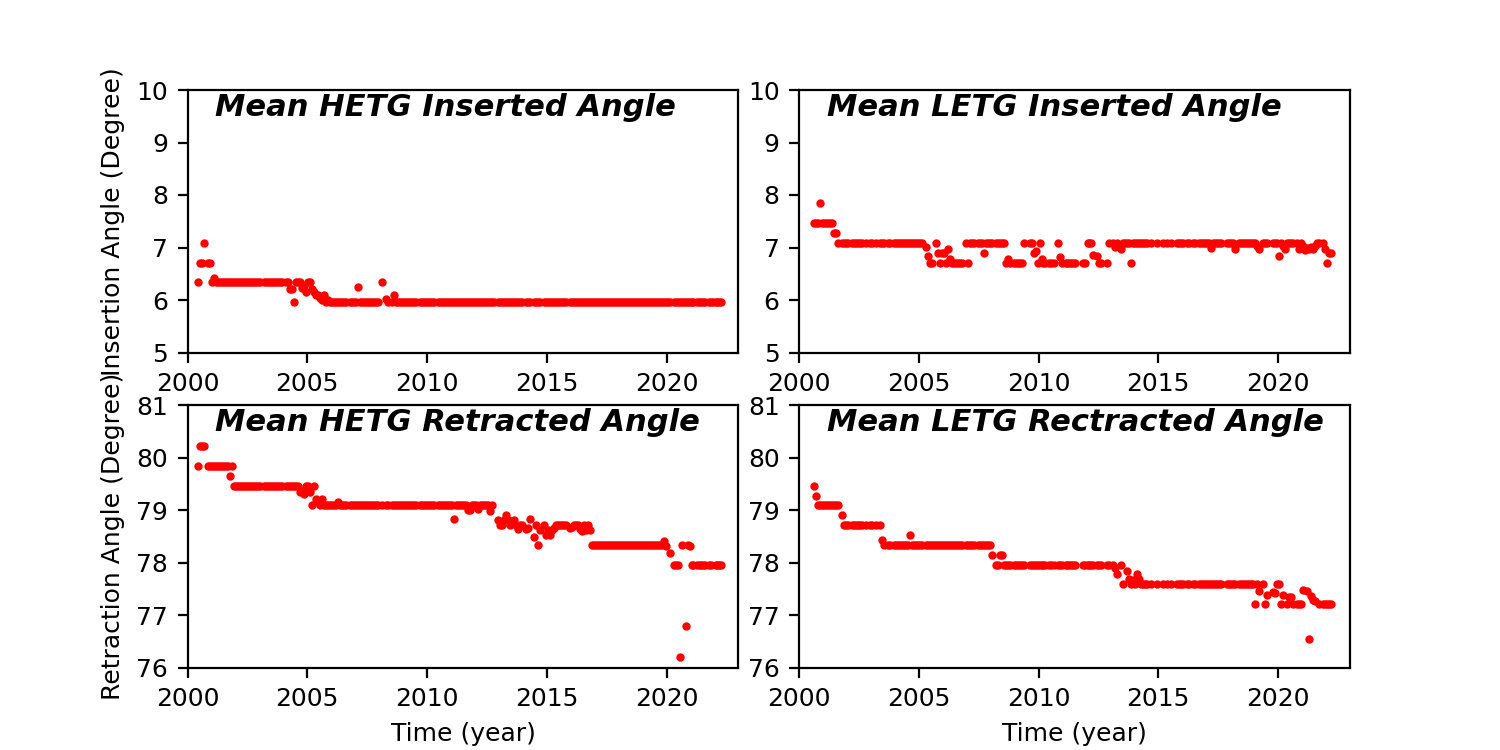
HETG/LETG Insertion/Retraction Angle
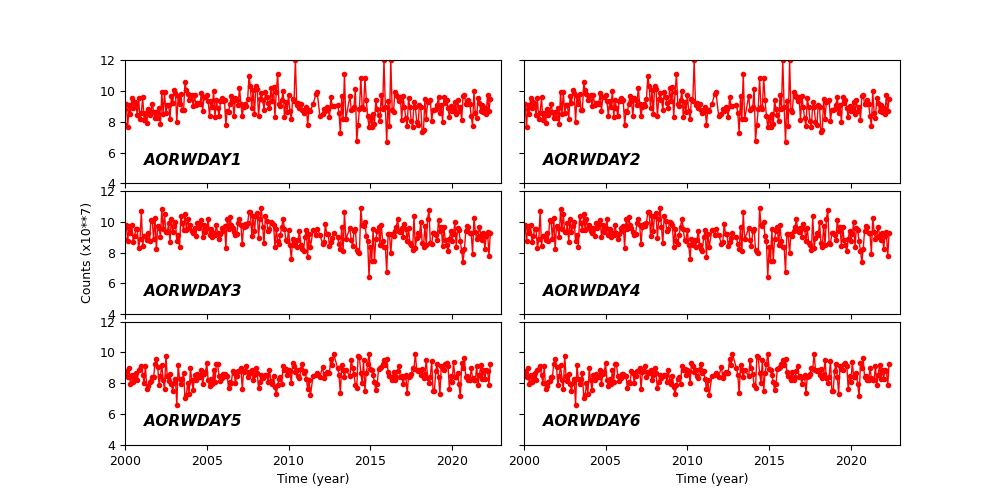
Reaction Wheel Rotations