ACIS
ACIS DOSE Registered-Photon-Map
The steps we took to compute the dose map are;
- Level 1 Event files for a specified month are obtained from archive.
- Image data including I2, I3, S2, S3 CCDs are extracted from all event files.
- All the extracted image data were merged to create a month long exposure map for the month.
- The exposure map is opened with ds9, and check a distribution of count rates against energy. From this, estimate the upper threshold value. Any events beyond this upper threshold are assumed erroneous events such as bad pixels.
- Using this upper threshold, the data is filtered, and create a cleaned exposure map for the month.
- The exposure map from each month from the Sep 1999 is added up to create a cumulative exposure map for each month.
- Using fimgstatistic, we compute count rate statistics for each CCDs.
- For observations with high data drop rates (e.g., Crab nebula, Cas A), we corrected the observations by adding events.
Please check more detail plots at Telemetered Photon Dose Trend page.
)
)
)
Statistics:
# IMAGE     NPIX     MEAN        RMS        MIN     MAX
ACIS_jun22 6004901       7.029         11.238           0.0     3828


I2 node 0  262654	7.002519	3.240552	0.0	 73.0
I2 node 1  262654	7.465812	6.496832	0.0	2785.0
I2 node 2  262654	8.063536	7.006701	0.0	288.0
I2 node 3  262654	8.538234	13.040895	0.0	1839.0

I3 node 0  262654	7.202408	7.038865	0.0	3168.0
I3 node 1  262654	7.316968	3.689007	0.0	138.0
I3 node 2  262654	6.977868	3.152394	0.0	 60.0
I3 node 3  262654	7.437313	8.667792	0.0	3760.0

S2 node 0  262654	7.106353	7.605181	0.0	2518.0
S2 node 1  262654	7.838819	5.312921	0.0	190.0
S2 node 2  262654	10.576651	16.355635	0.0	3828.0
S2 node 3  262654	12.192879	16.509346	0.0	2434.0

S3 node 0  262654	13.549728	15.744950	0.0	260.0
S3 node 1  262654	13.814861	12.392184	0.0	380.0
S3 node 2  262654	13.051222	14.941213	0.0	165.0
S3 node 3  262654	11.085967	11.783555	0.0	140.0
)
)
)
Statistics:
 IMAGE     NPIX      MEAN        RMS           MIN      MAX
ACIS_total   6004901       2574.802         3300.156           0.0   141807


I2 node 0  262654	2231.005959	449.238354	477.0	13621.0
I2 node 1  262654	2347.435770	642.044606	493.0	134793.0
I2 node 2  262654	2376.556935	502.906376	512.0	14219.0
I2 node 3  262654	2382.317616	614.782185	482.0	28874.0

I3 node 0  262654	2559.821343	630.187870	479.0	13798.0
I3 node 1  262654	2640.988904	1736.622683	508.0	55832.0
I3 node 2  262654	2355.003619	442.564399	478.0	14040.0
I3 node 3  262654	2340.272253	473.127820	446.0	34843.0

S2 node 0  262654	2999.324789	486.143505	1625.0	22368.0
S2 node 1  262654	3179.669511	722.089026	1810.0	17193.0
S2 node 2  262654	3517.861278	724.472212	2230.0	30143.0
S2 node 3  262654	3480.694204	579.694324	1964.0	72487.0

S3 node 0  262654	5339.769750	2920.601345	2338.0	53924.0
S3 node 1  262654	6540.923409	2362.813719	0.0	45915.0
S3 node 2  262654	5271.001965	1339.694739	2421.0	27221.0
S3 node 3  262654	4127.254645	755.773854	2488.0	26447.0
)
|
)
|
)
|
)
|
| Mar 2022 | Dec 2021 | Sep 2021 | Jun 2021 |
|---|
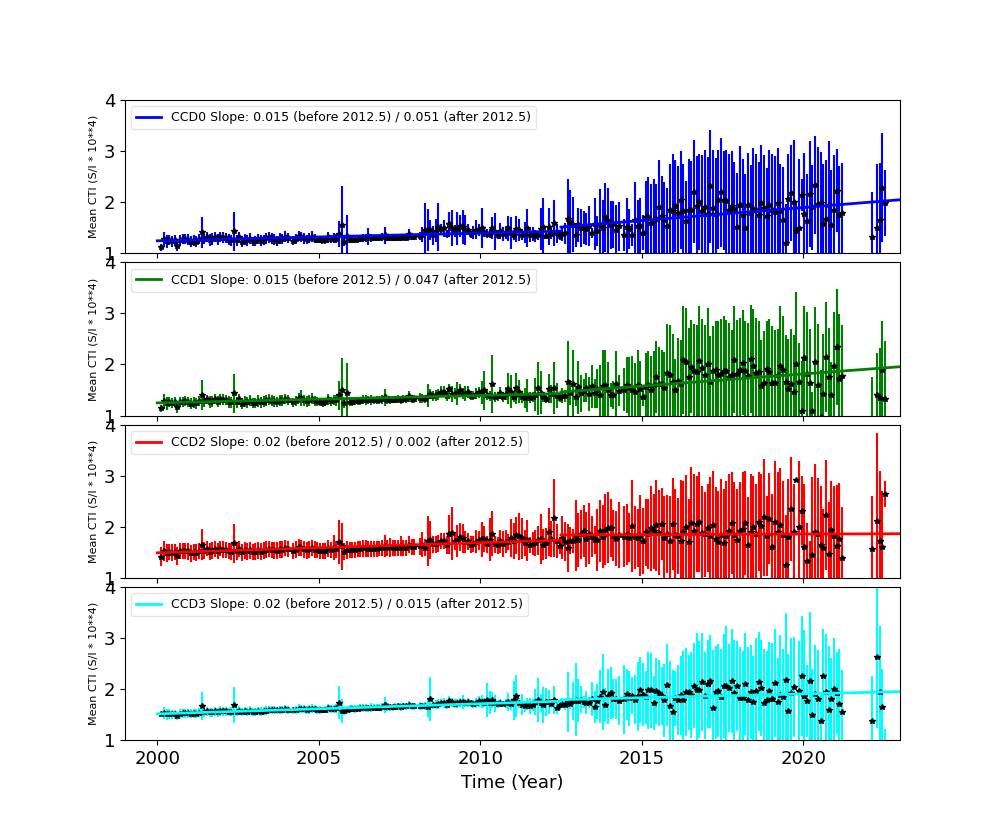
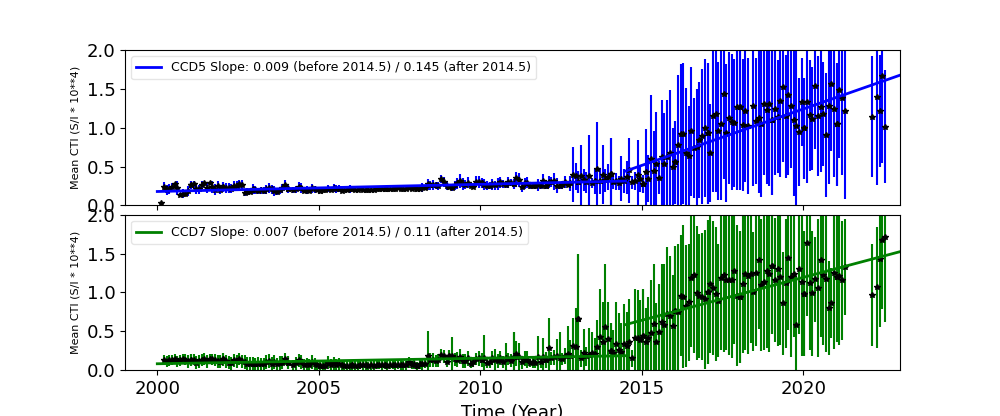
The Mean Detrended CTI
We report CTIs with a refined data definition. CTIs were computed for the temperature dependency corrected data. Please see CTI page for detailed explanation. CTI's are computed for Mn K alpha, and defined as slope/intercept x10^4 of row # vs ADU. Data file: here
Imaging CCDs
Spectral CCDs
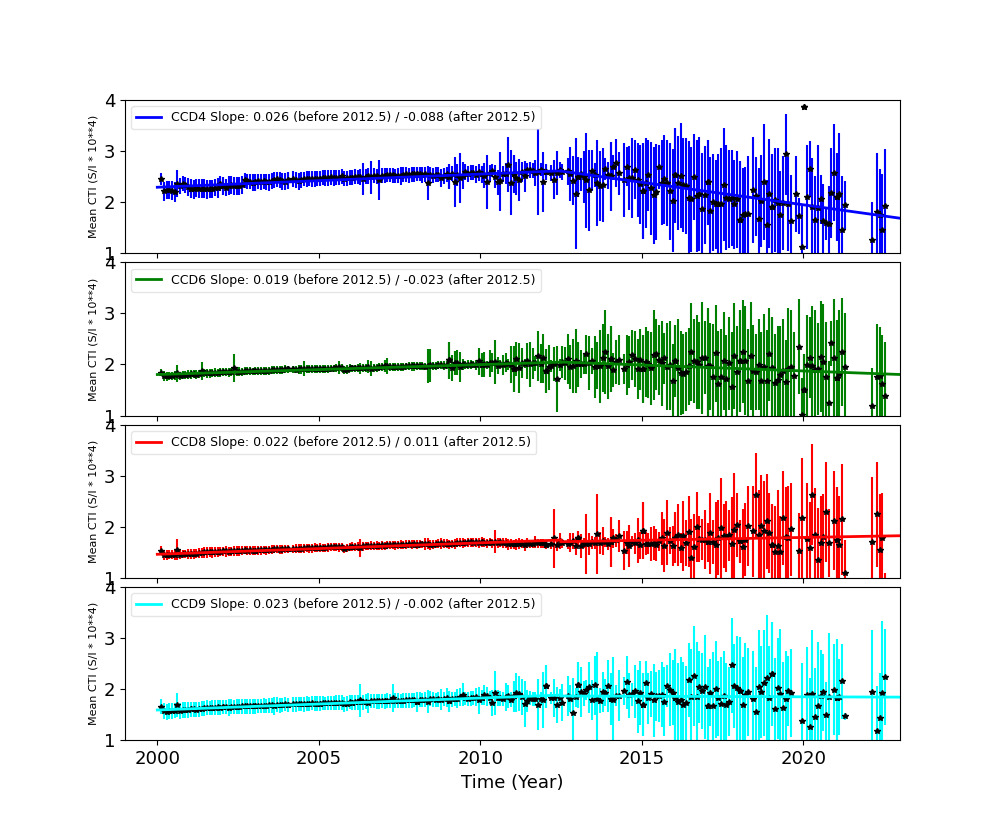
Backside CCDs
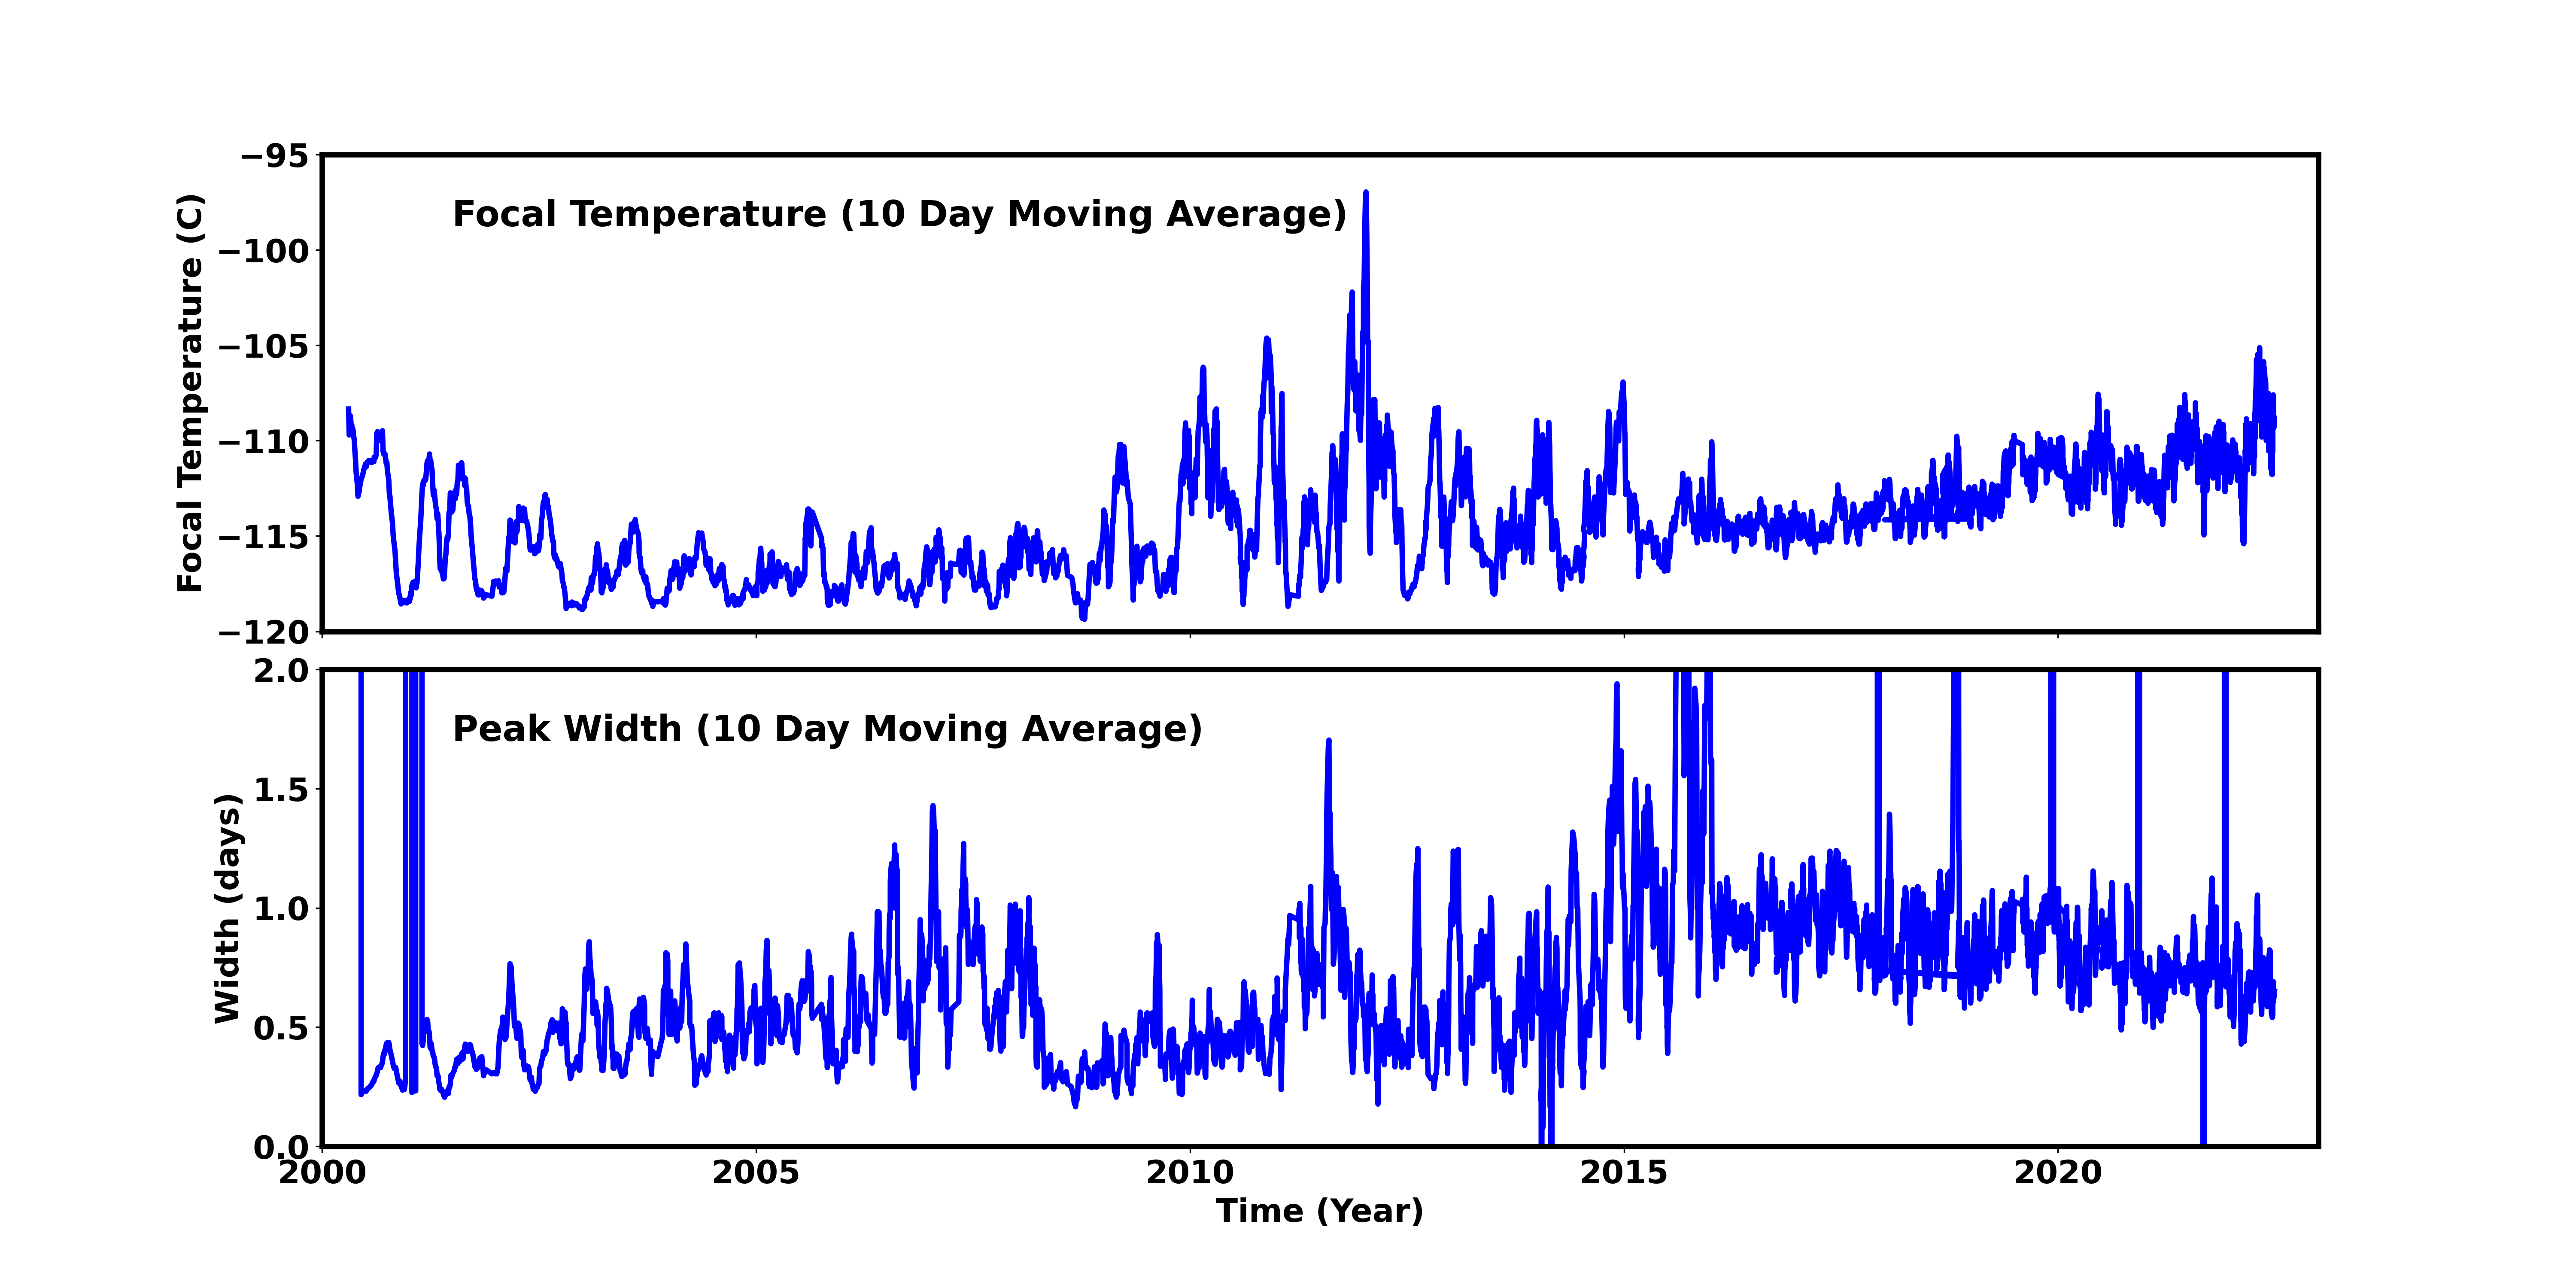
Focal Plane Temperature
Jun 2022 Focal Temperature
| The Mean (max) FPT: | |
|---|---|
| -109.5 | +/- 5.96 C |
| Mean Width: | |
| 0.66 | +/- 0.27 days |
Averaged Focal Plane Temperature
We are using 10 period moving averages to show trends of peak temperatures and peak widths. Note, the gaps in the width plot are due to missing/corrupted data.
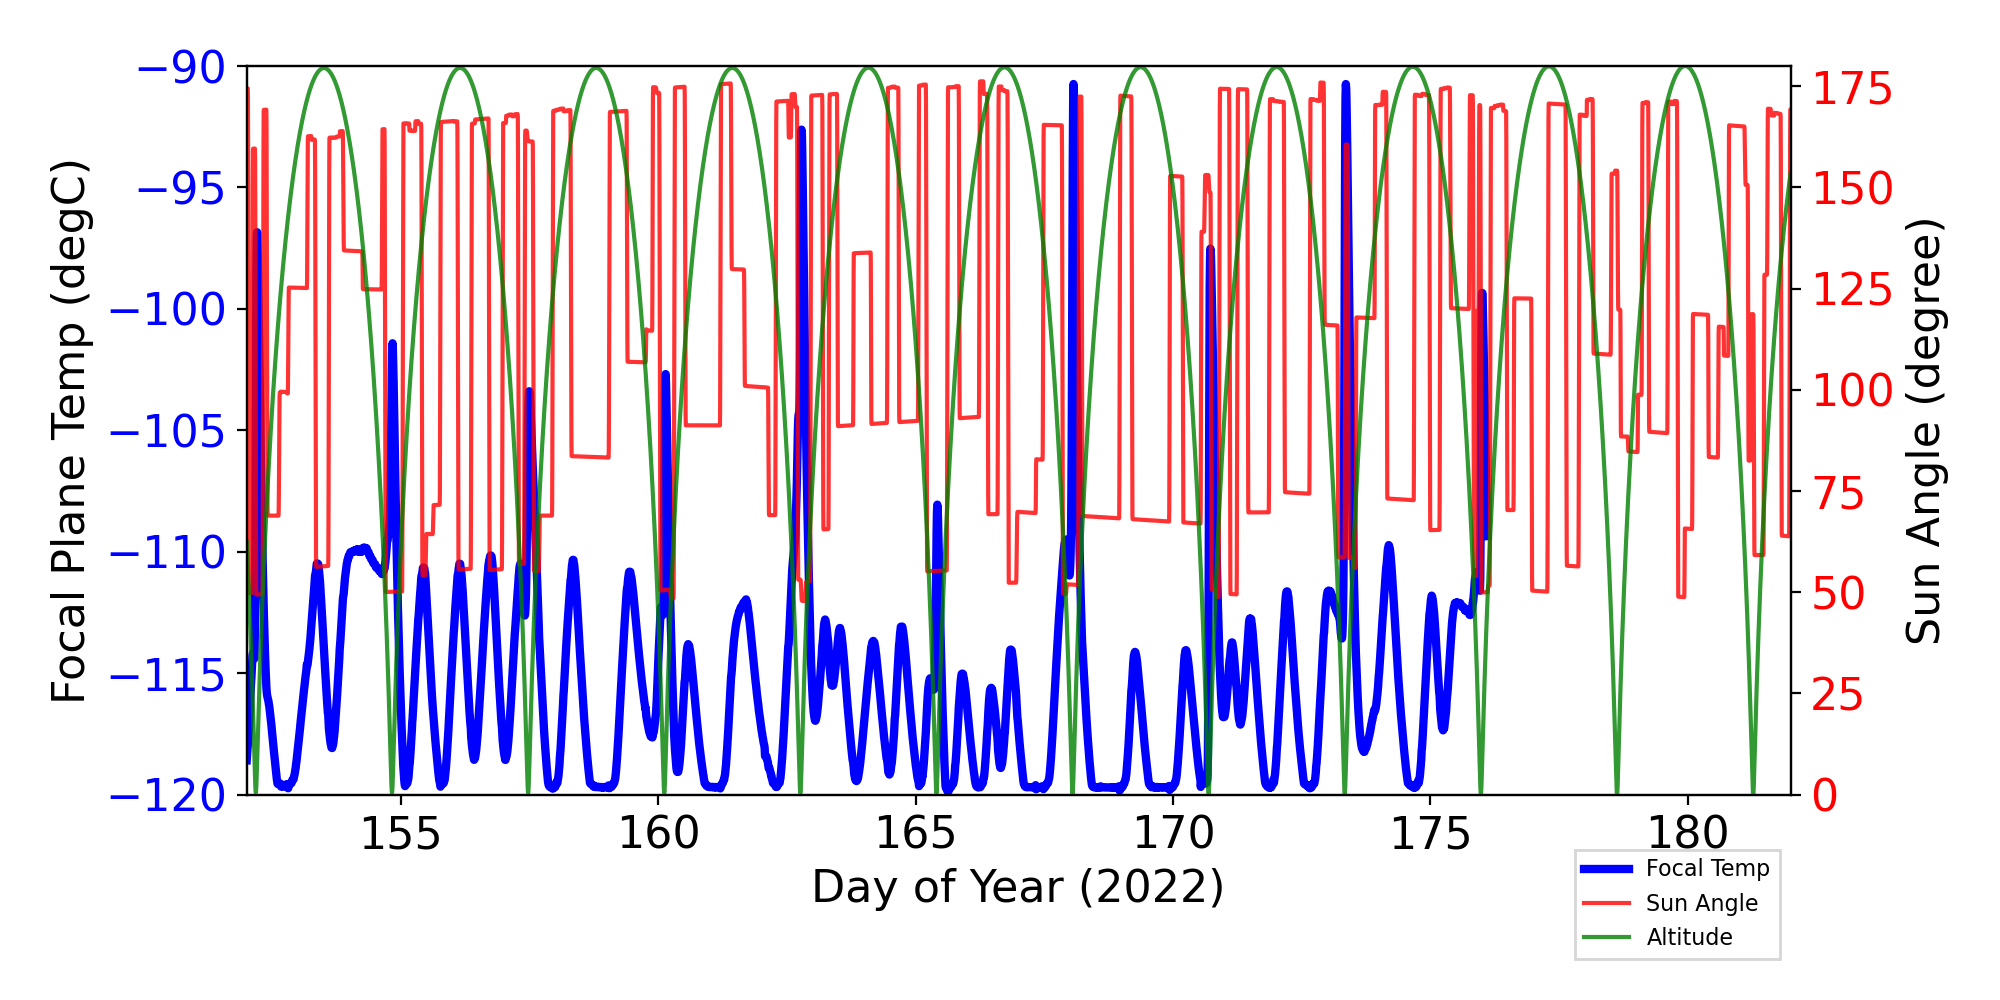
Focal Plane Temperature, Sun Angle and Altitude
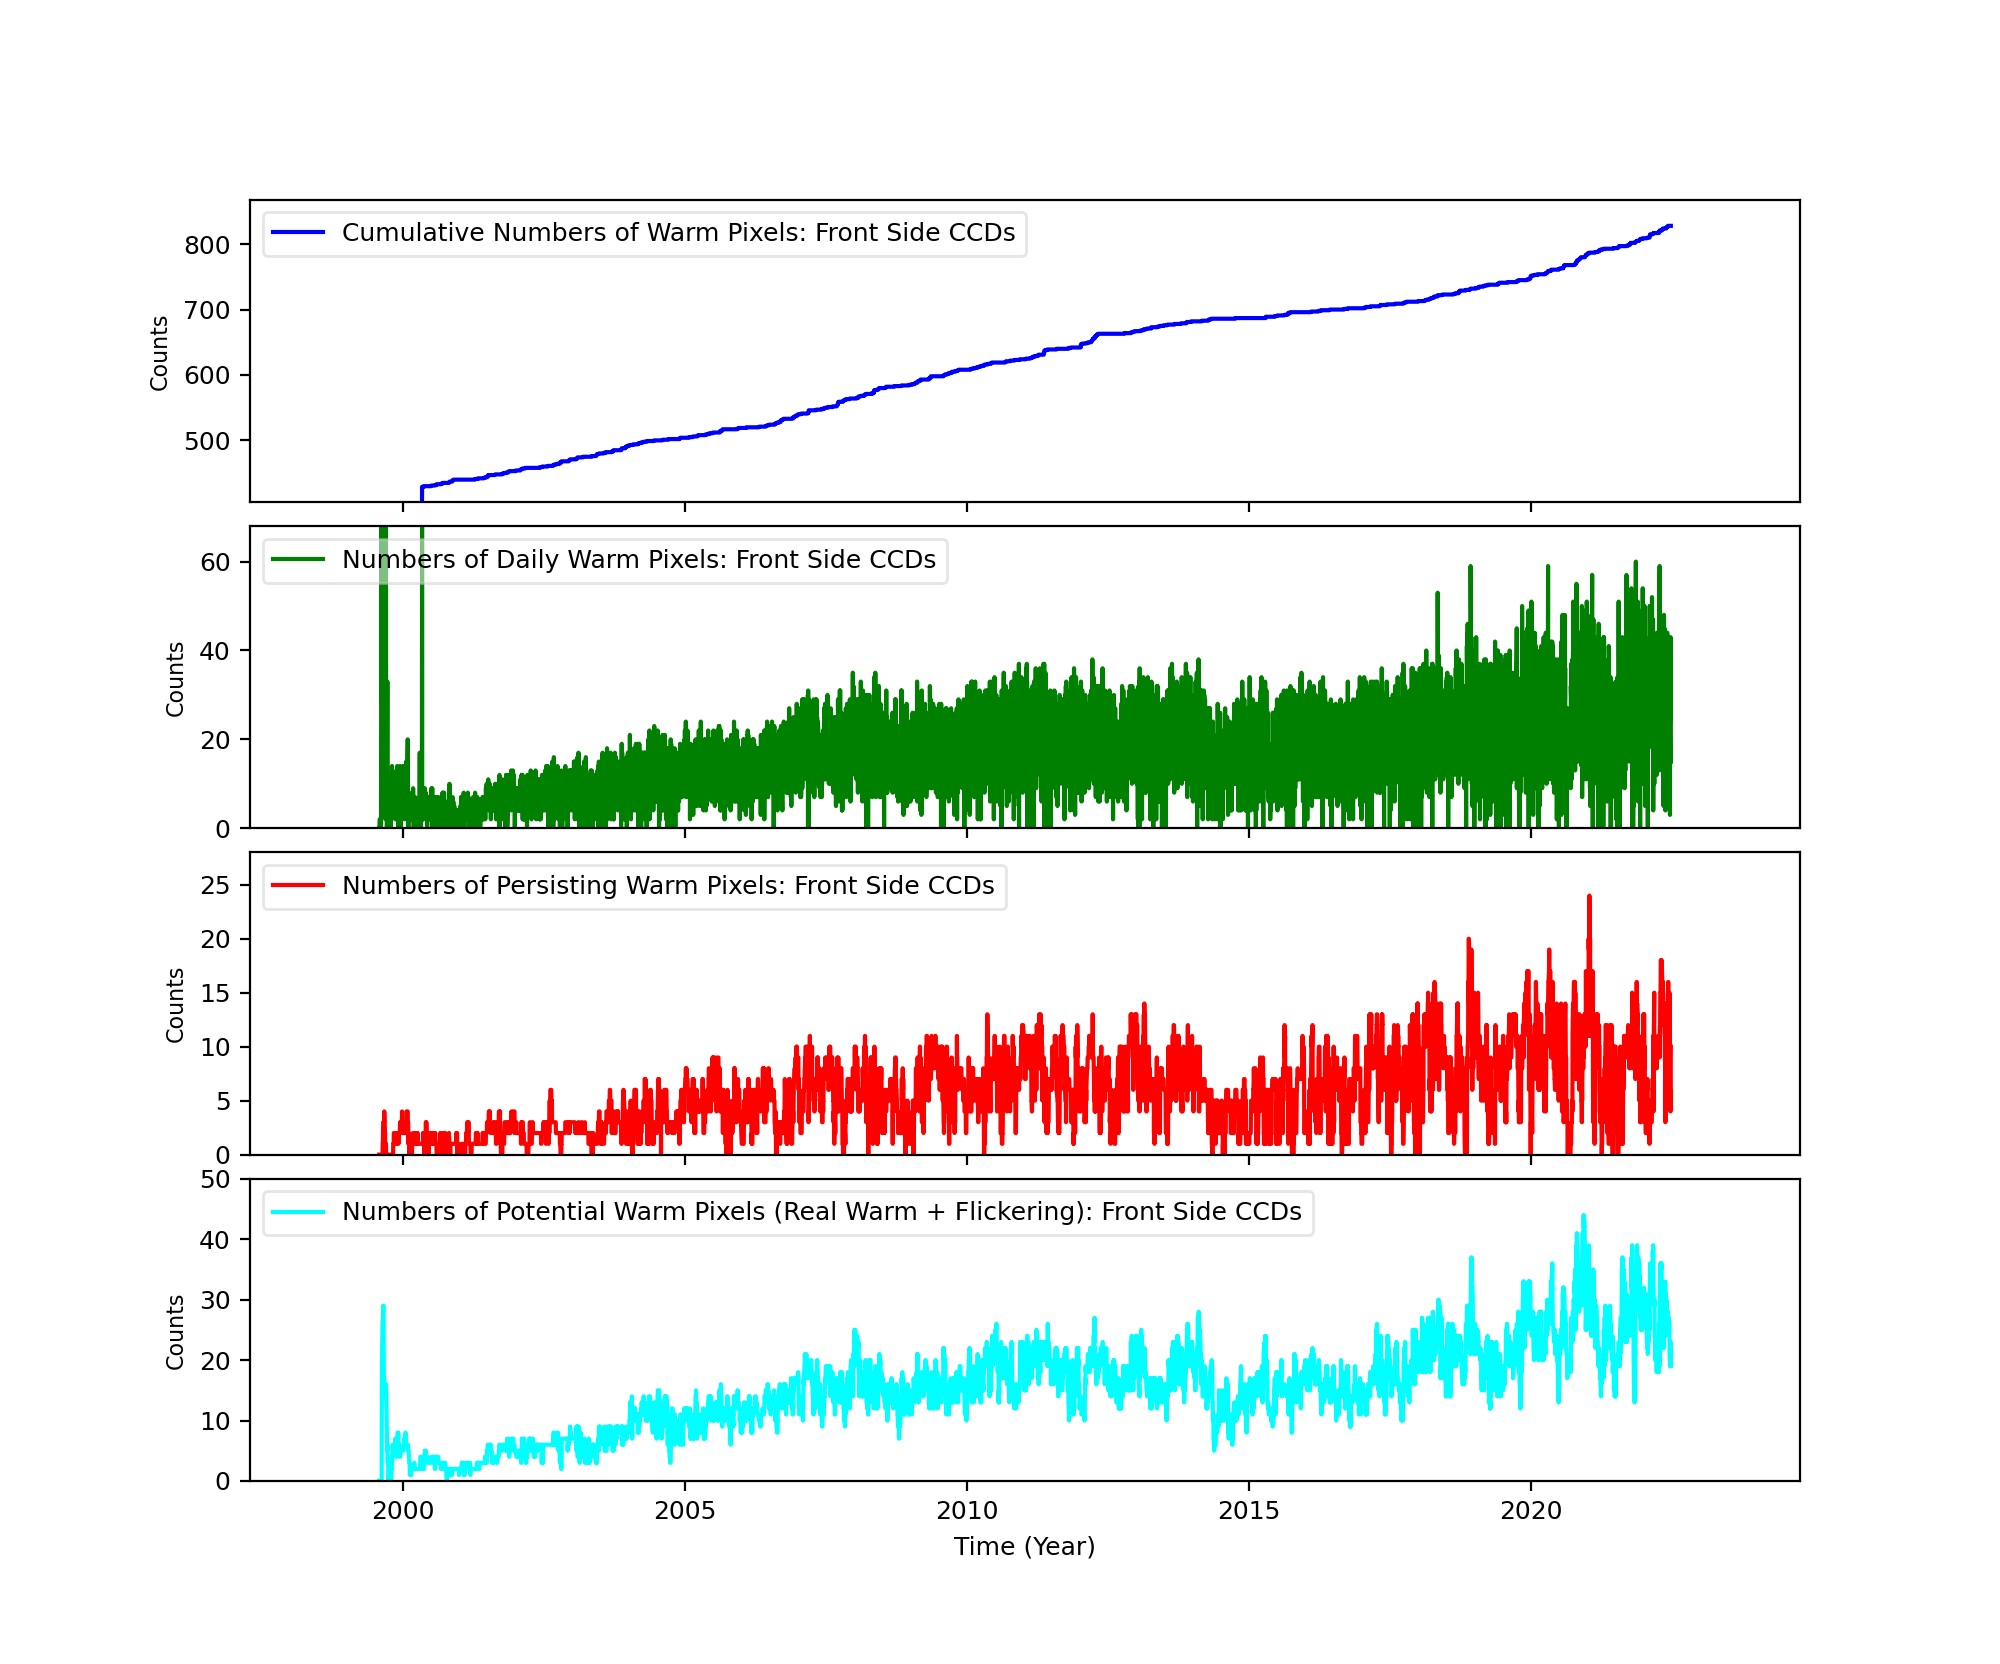
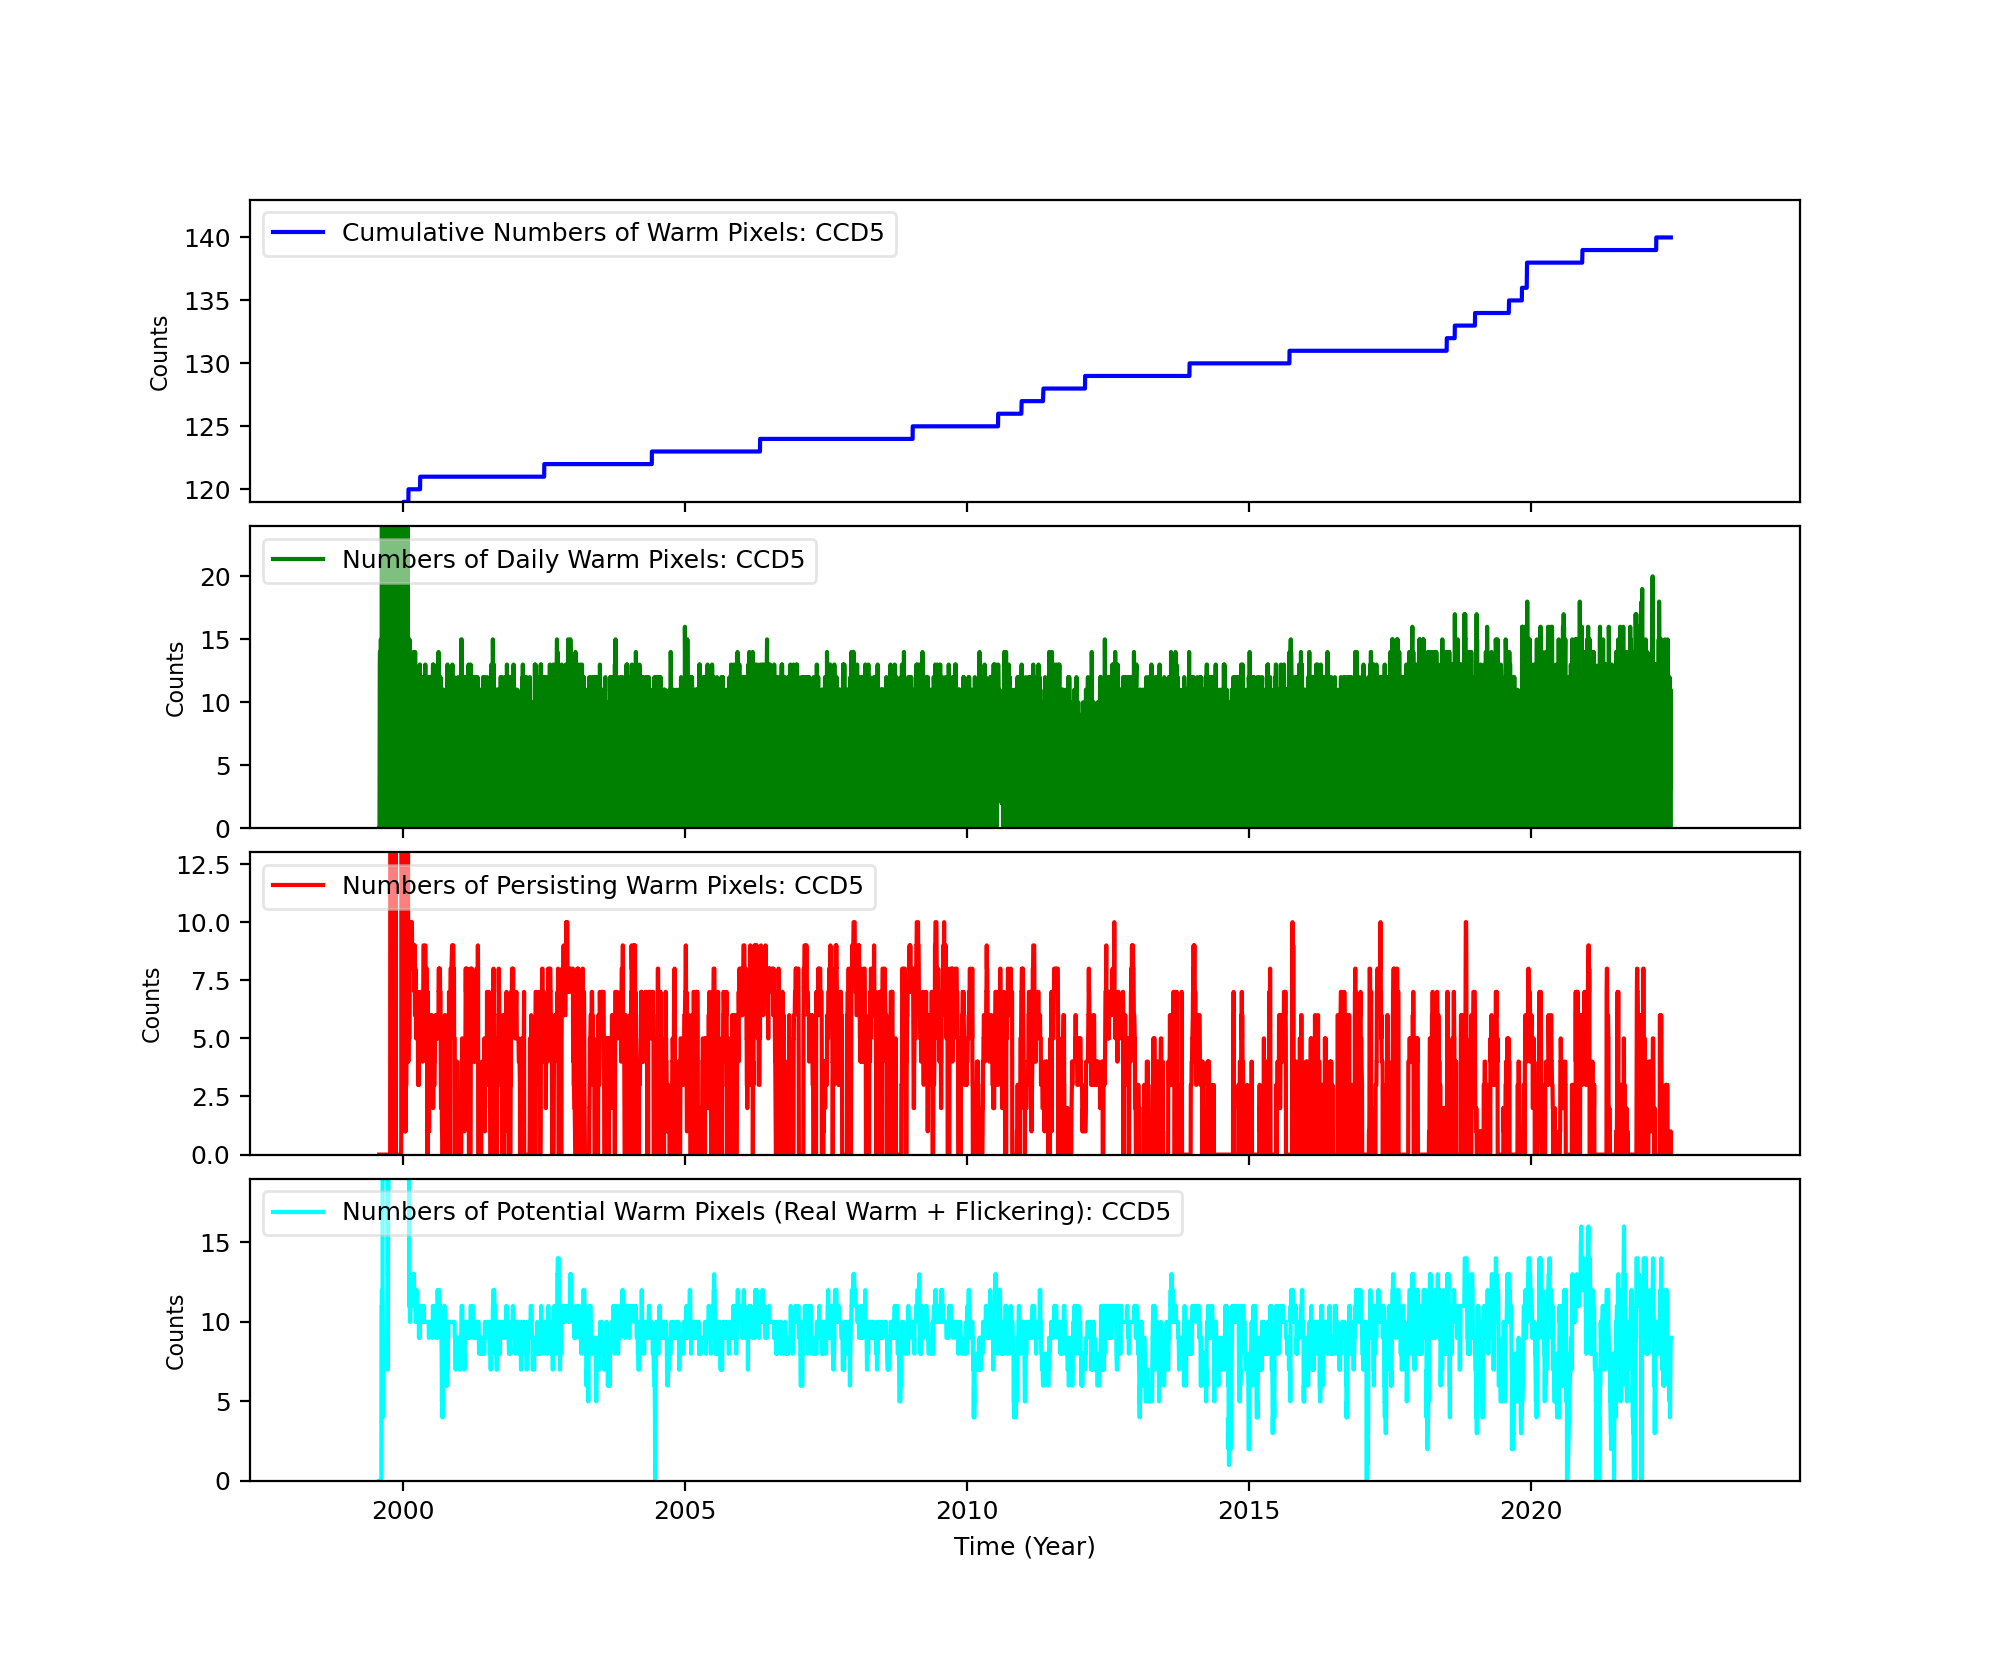
Bad Pixels
The plots below were generated with a new warm pixel finding script. Please see Acis Bad Pixel Page for details.
Front Side CCDs
Back Side CCD (CCD5)
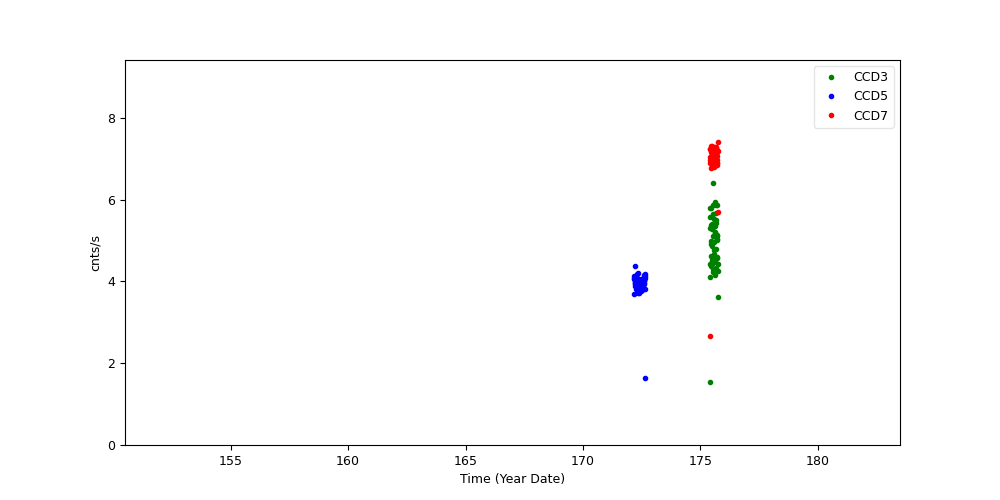
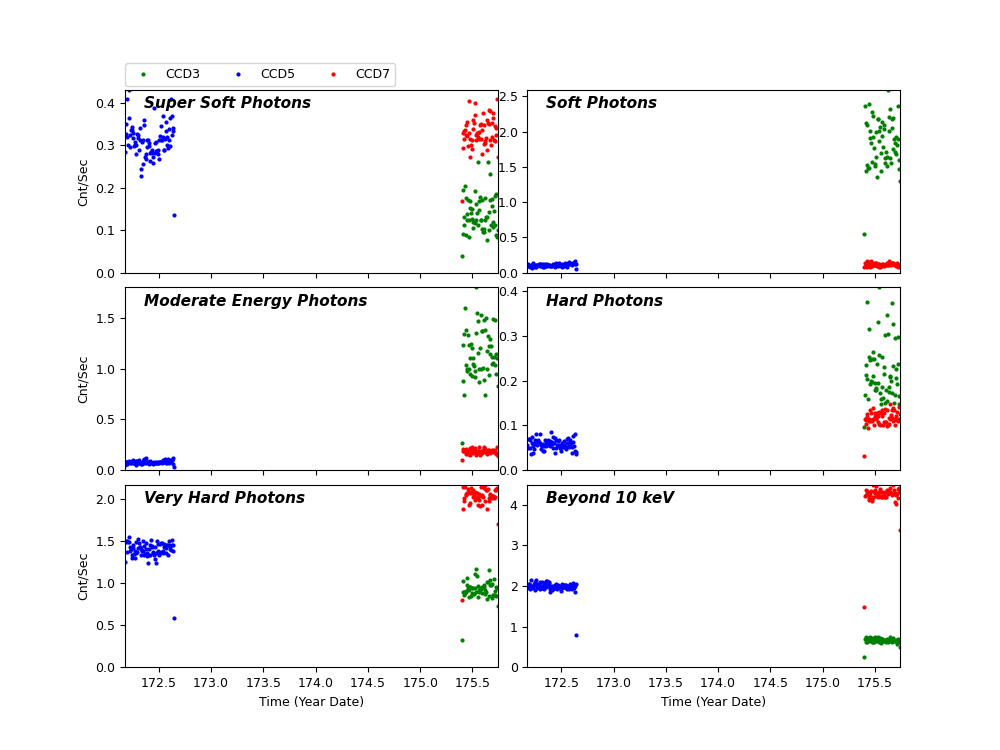
Science Instrument Background Rates
| Name | Low (keV) | High(KeV) | Description |
|---|---|---|---|
| SSoft | 0.00 | 0.50 | Super soft photons |
| Soft | 0.50 | 1.00 | Soft photons |
| Med | 1.00 | 3.00 | Moderate energy photons |
| Hard | 3.00 | 5.00 | Hard Photons |
| Harder | 5.00 | 10.00 | Very Hard photons |
| Hardest | 10.00 | Beyond 10 keV |
HRC
DOSE of Central 4K Pore-Pairs
Please refer to Maximum Dose Trends for more details.
No Data
)
IMAGE                       NPIX      MEAN    STDDEV      MIN       MAX
HRCI_08_1999_06_2022.fits  16777216	na	na	na	na
No Data
)
IMAGE                       NPIX      MEAN    STDDEV      MIN       MAX
HRCS_08_1999_06_2022.fits  16777216	na	na	na	na
|
|
Max dose trend plots corrected for events that "pile-up"
in the center of the taps due to bad position information.
|
)
|
)
|
)
|
)
|
| Mar 2022 | Dec 2021 | Sep 2021 | Jun 2021 |
|---|
)
|
)
|
)
|
)
|
| Mar 2022 | Dec 2021 | Sep 2021 | Jun 2021 |
|---|
Gratings
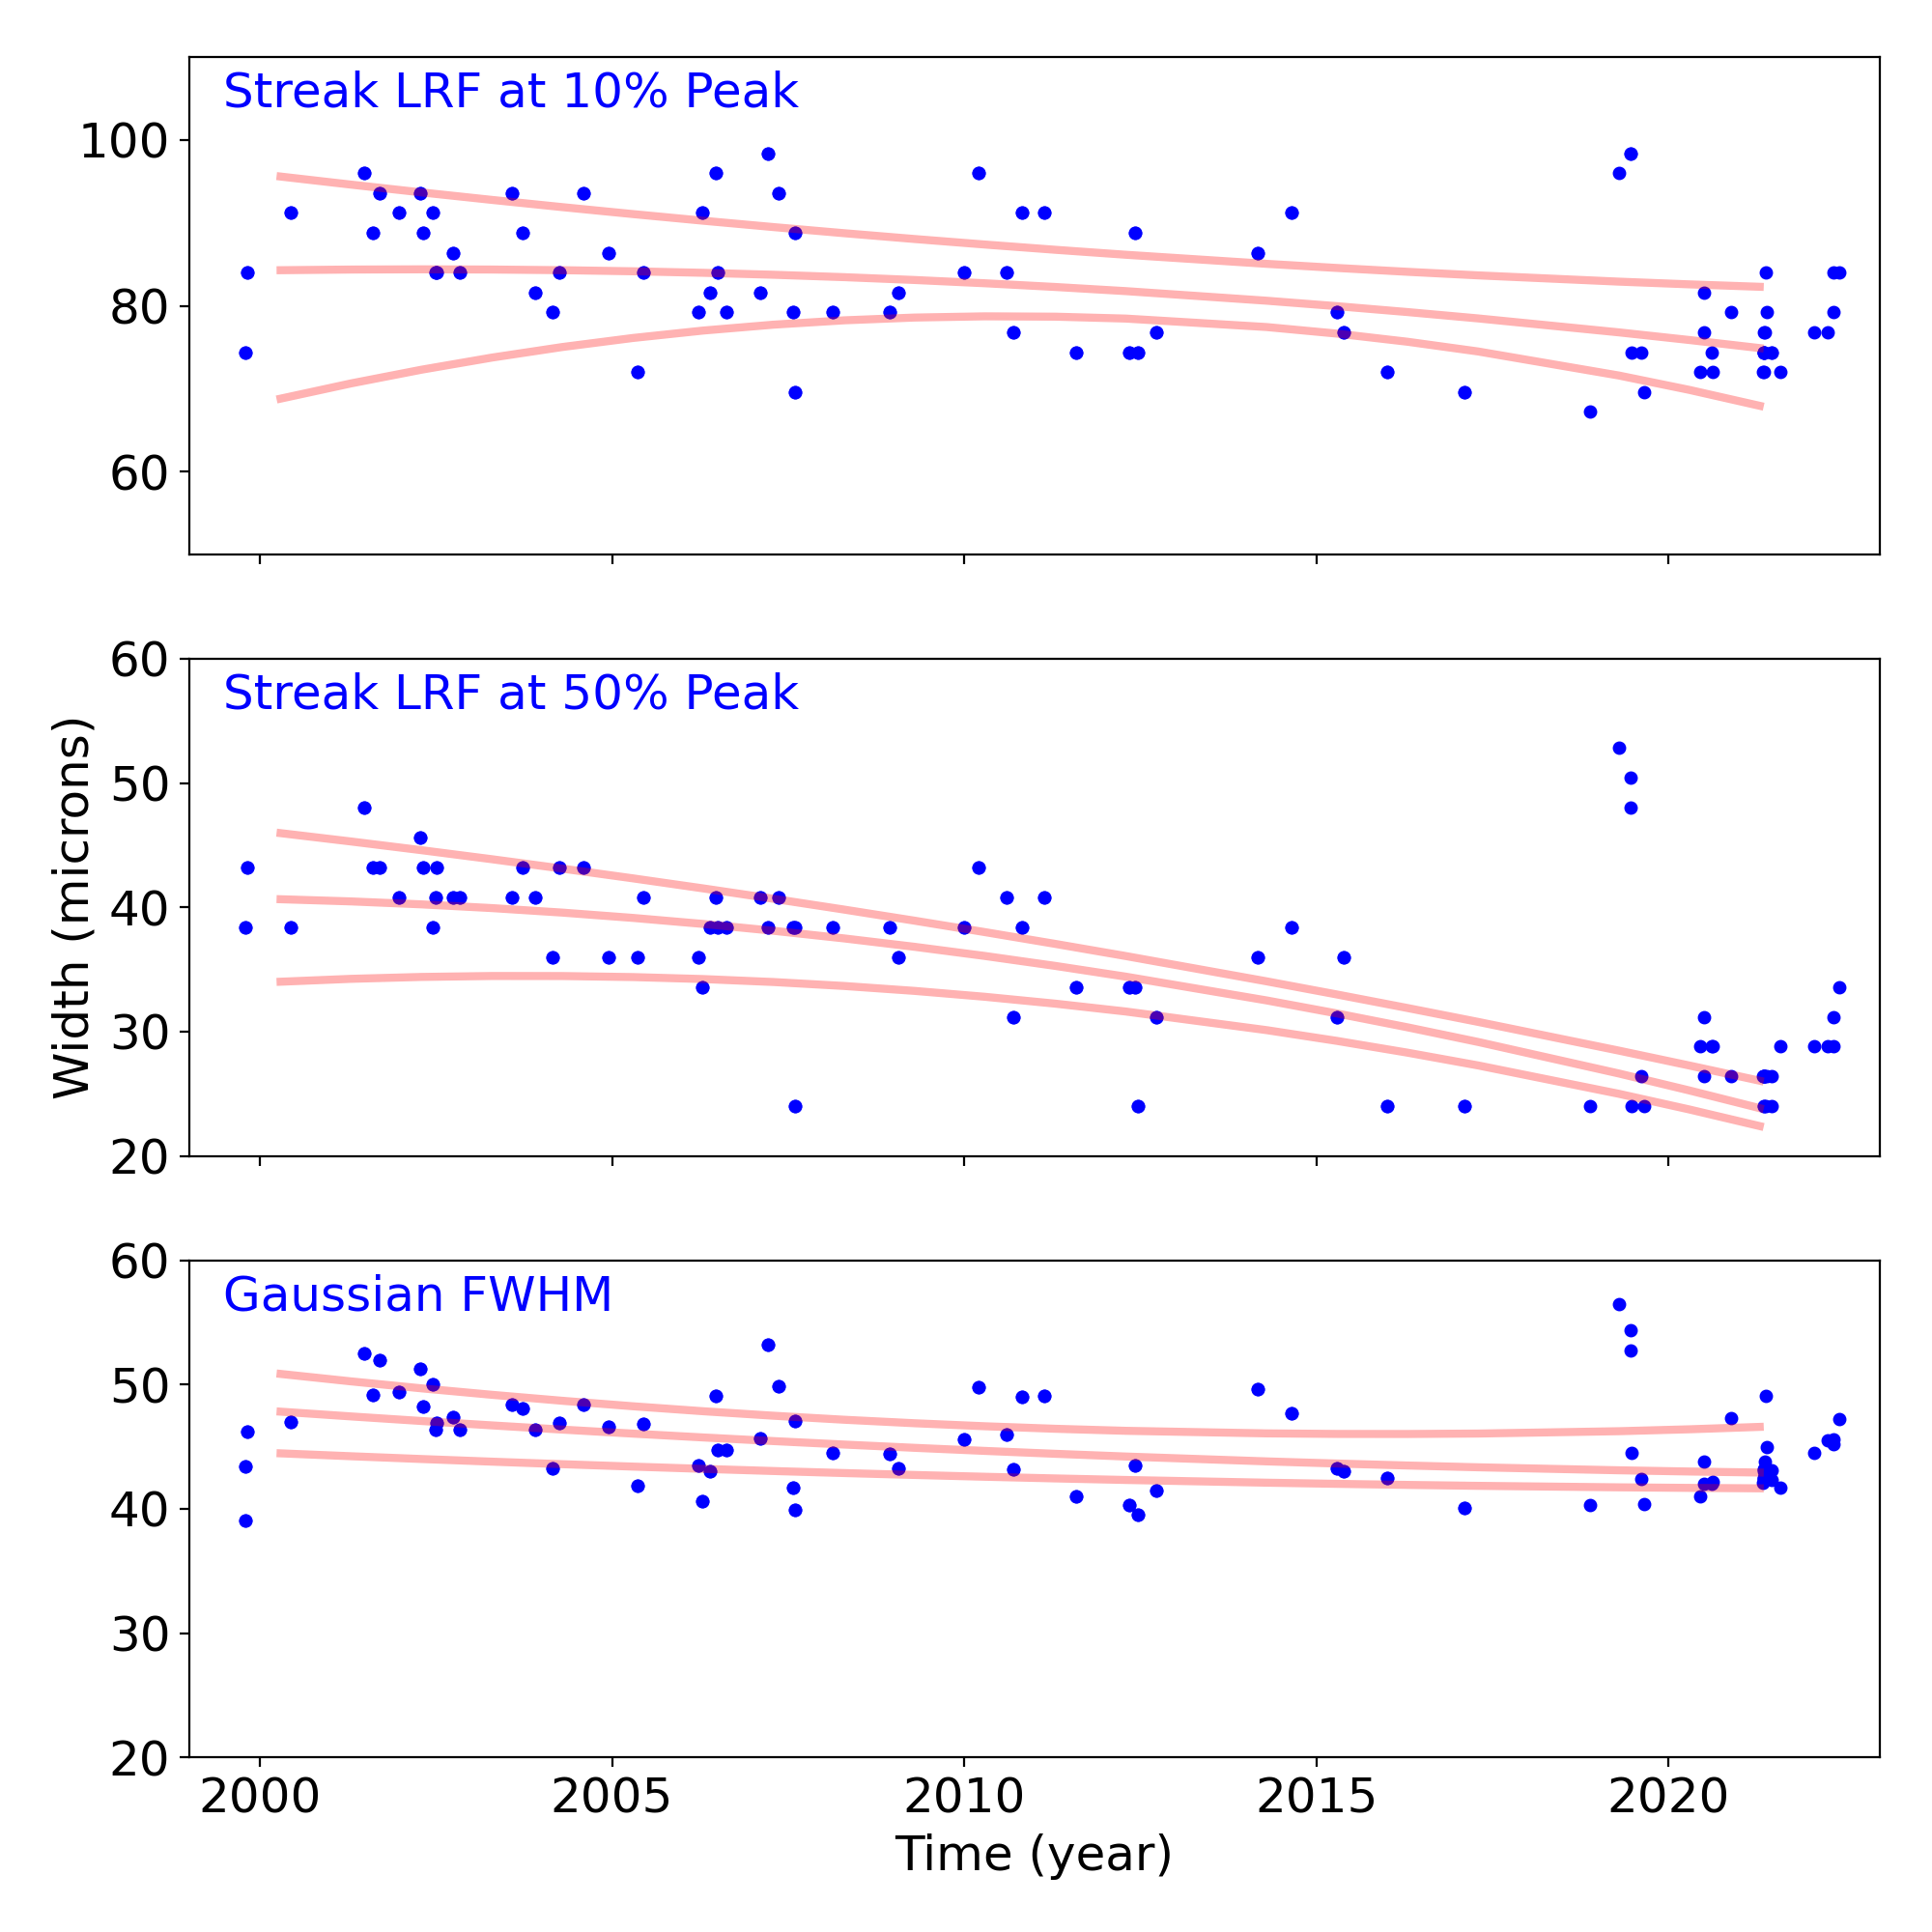
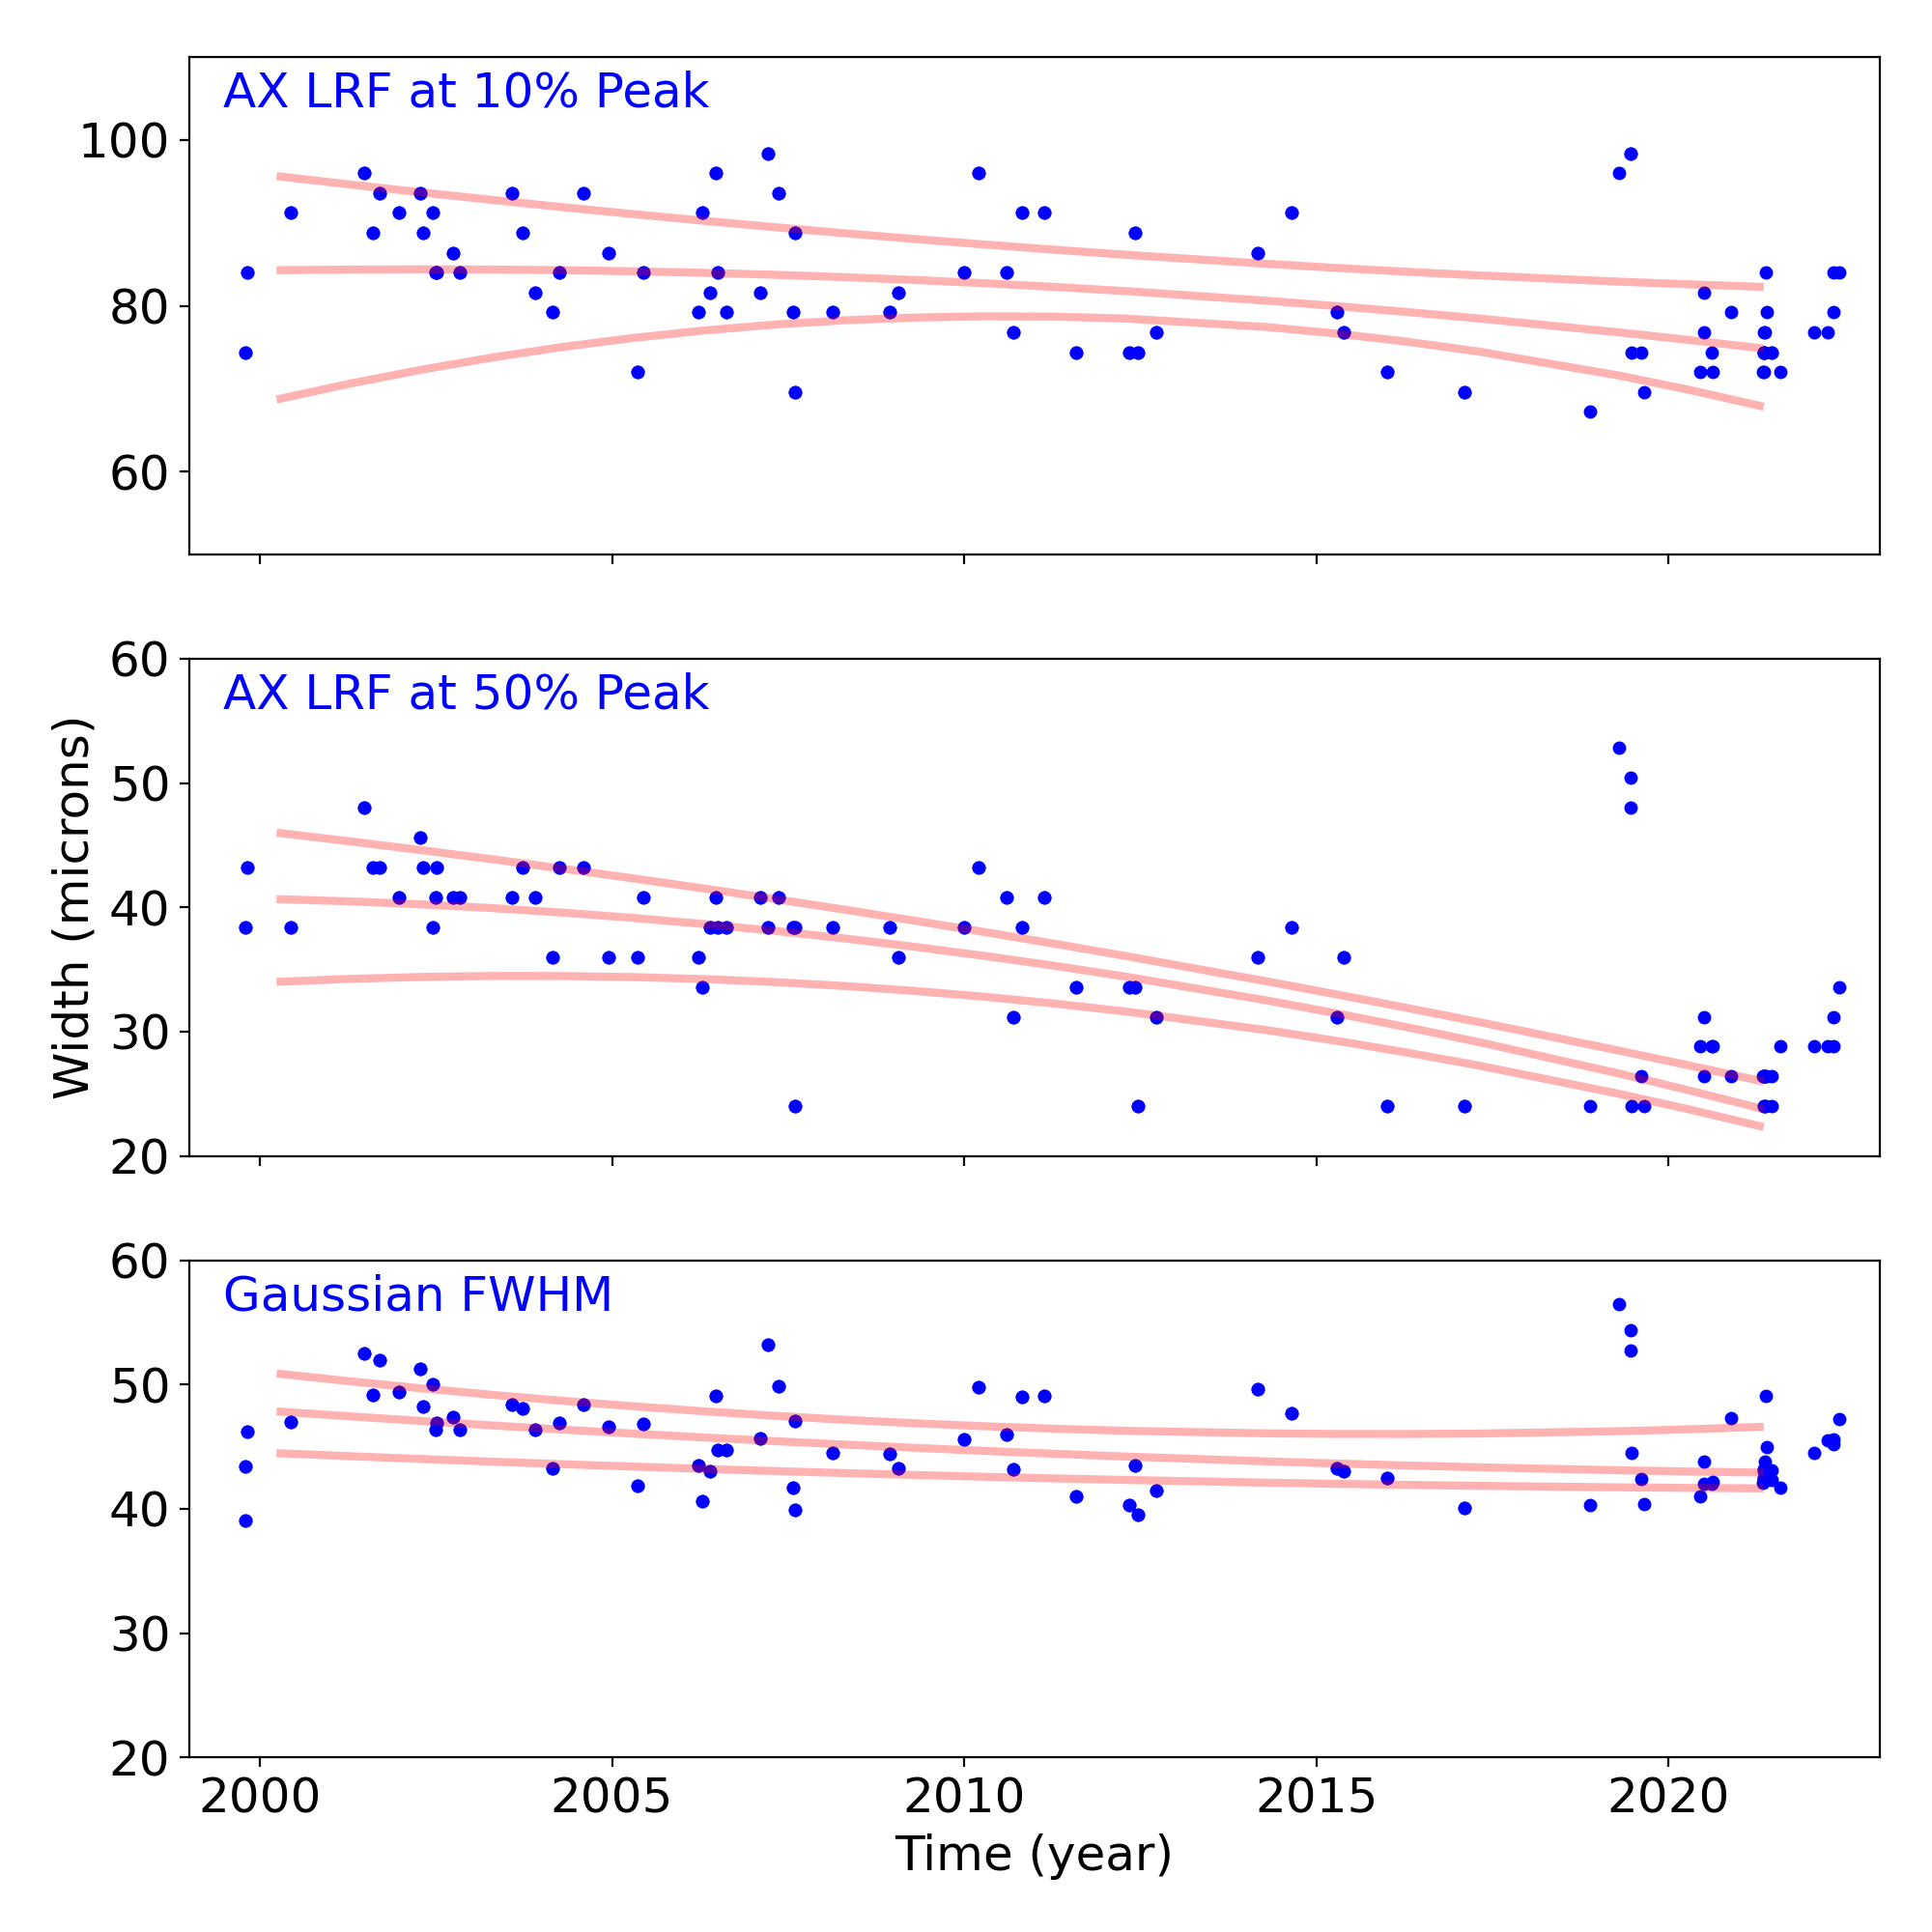
Grating Trends/Focus
We plot the width of the zero order streak of ACIS/HETG observations and the width of the zero order image for HRC/LETG observations of point sources. No significant defocusing trend is seen at this time. See Gratings Trends pages.
PCAD
ACA Trending
| ACIS |
)
|
)
|
)
|
|
|---|---|---|---|---|
)
|
)
|
)
| ||
| HRCI |
)
|
)
|
)
|
)
|
| HRCI |
)
|
)
|
)
|
)
|
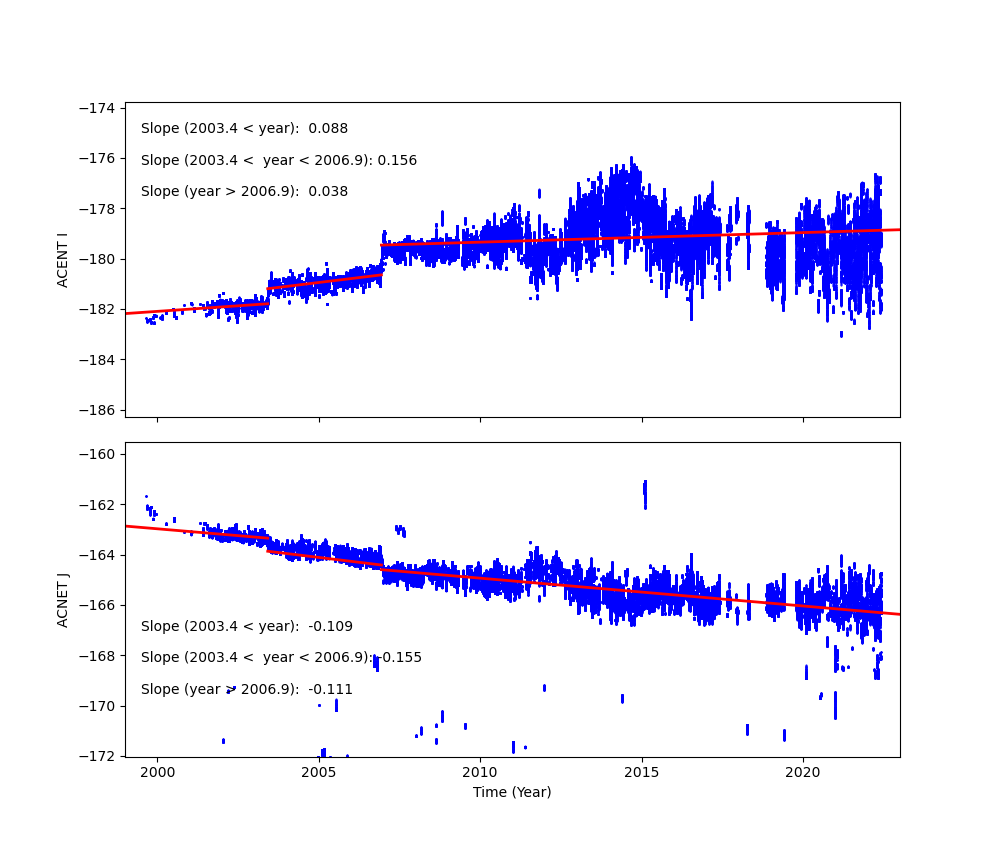
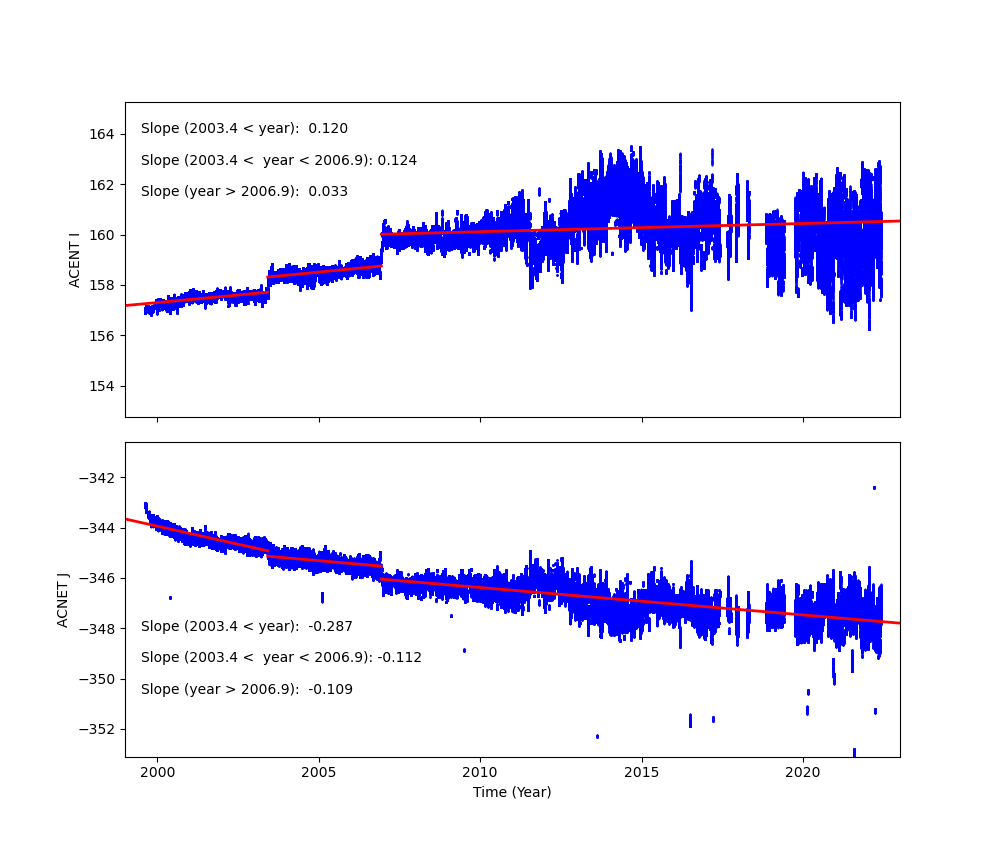
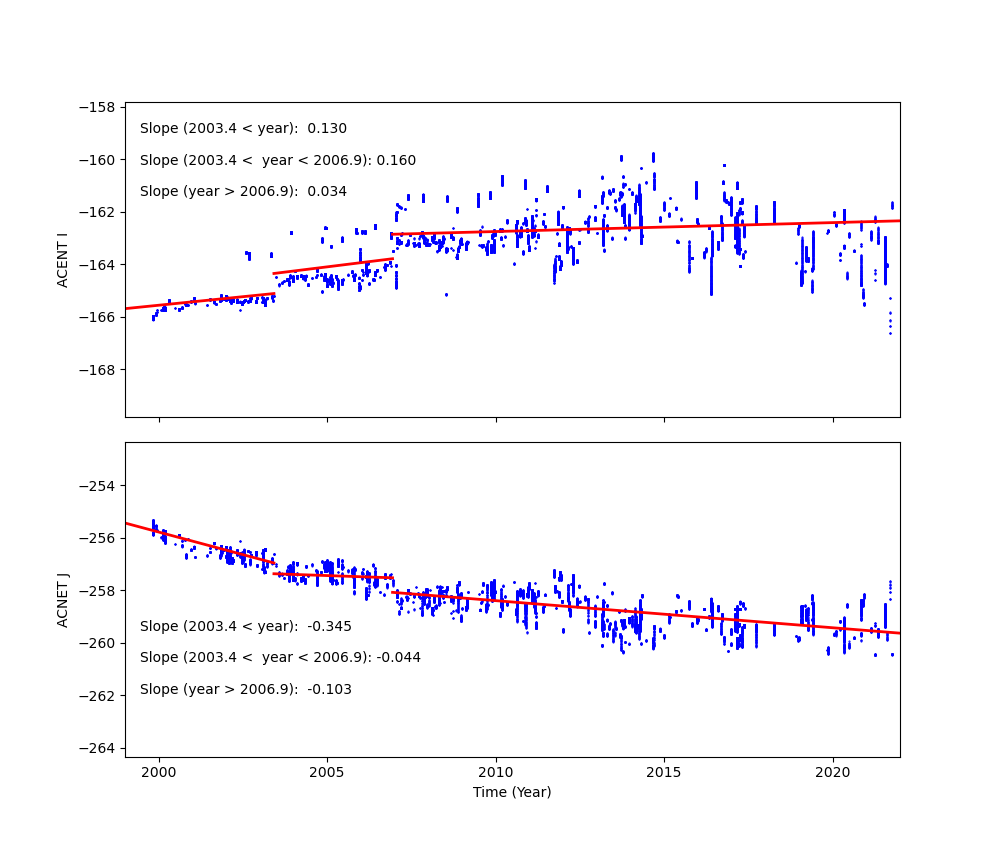
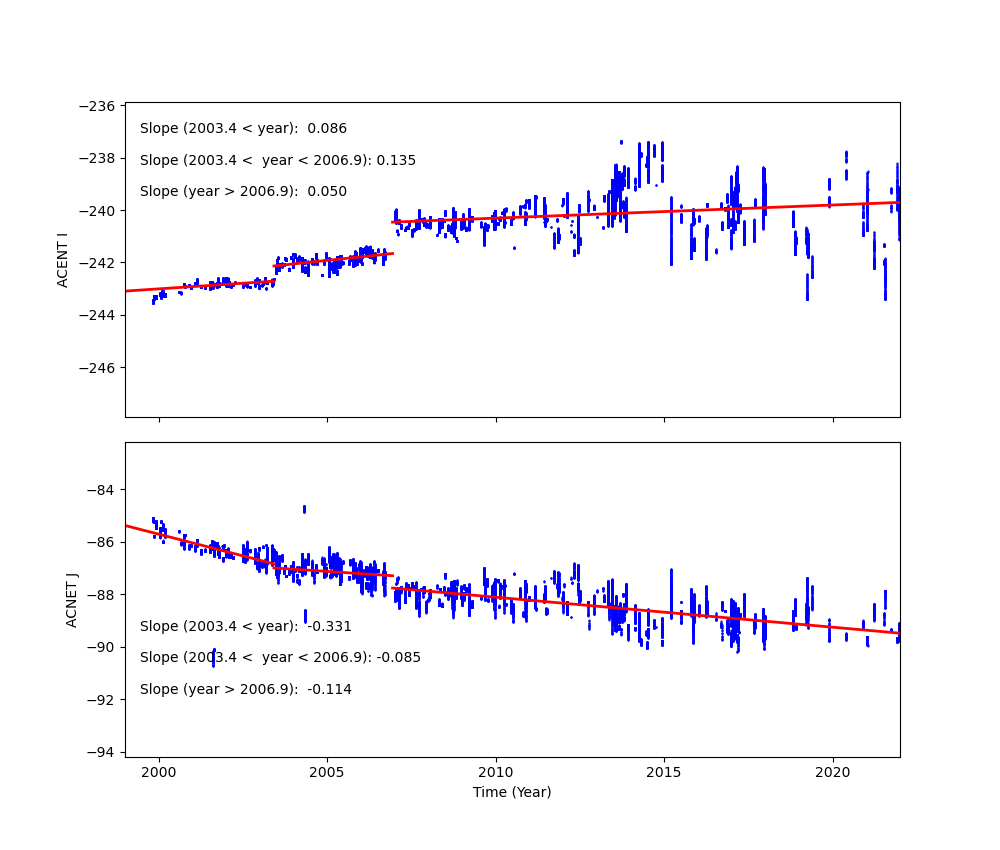
Fid Light Drift
Fid light positions on ACA drift with time. The drift trends of Fid light 2 with ACIS-I and ACIS-S configurations are shown below.
The top panel shows Fid light 2 drift in ACENT I (app. along with -Y axis), and the
bottom panel shows that in ACENT J (app. along with Z axis). The unit is a pixel, and
one pixel is approximately 0.5 arcsec. The slope listed at the top right corner is
the change in a position per year (arcsec/yr). The vertical line on DOM = 1411 (Jun 1, 2003)
indicates a transition date of use of IRU-1 to IRU-2.
See also Tom Aldcroft's updated page:
https://cxc.cfa.harvard.edu/mta/ASPECT/fid_drift
Fid 2 (ACIS-I)
Fid 2 (ACIS-S)
Fid 8 (HRC-I)
Fid 12 (HRC-S)
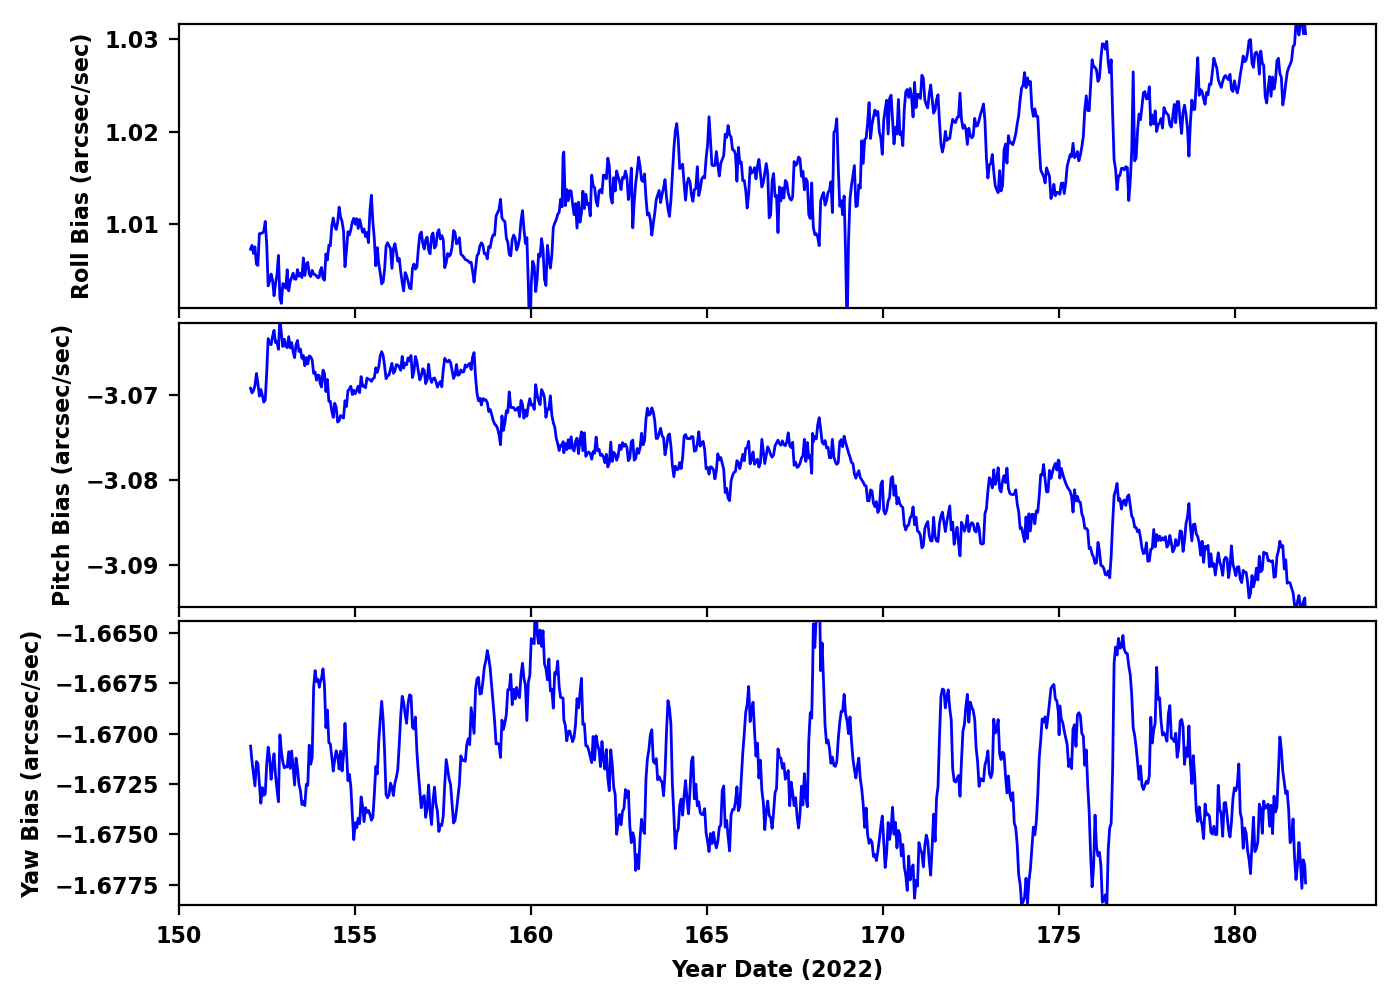
Gyro Bias Drift
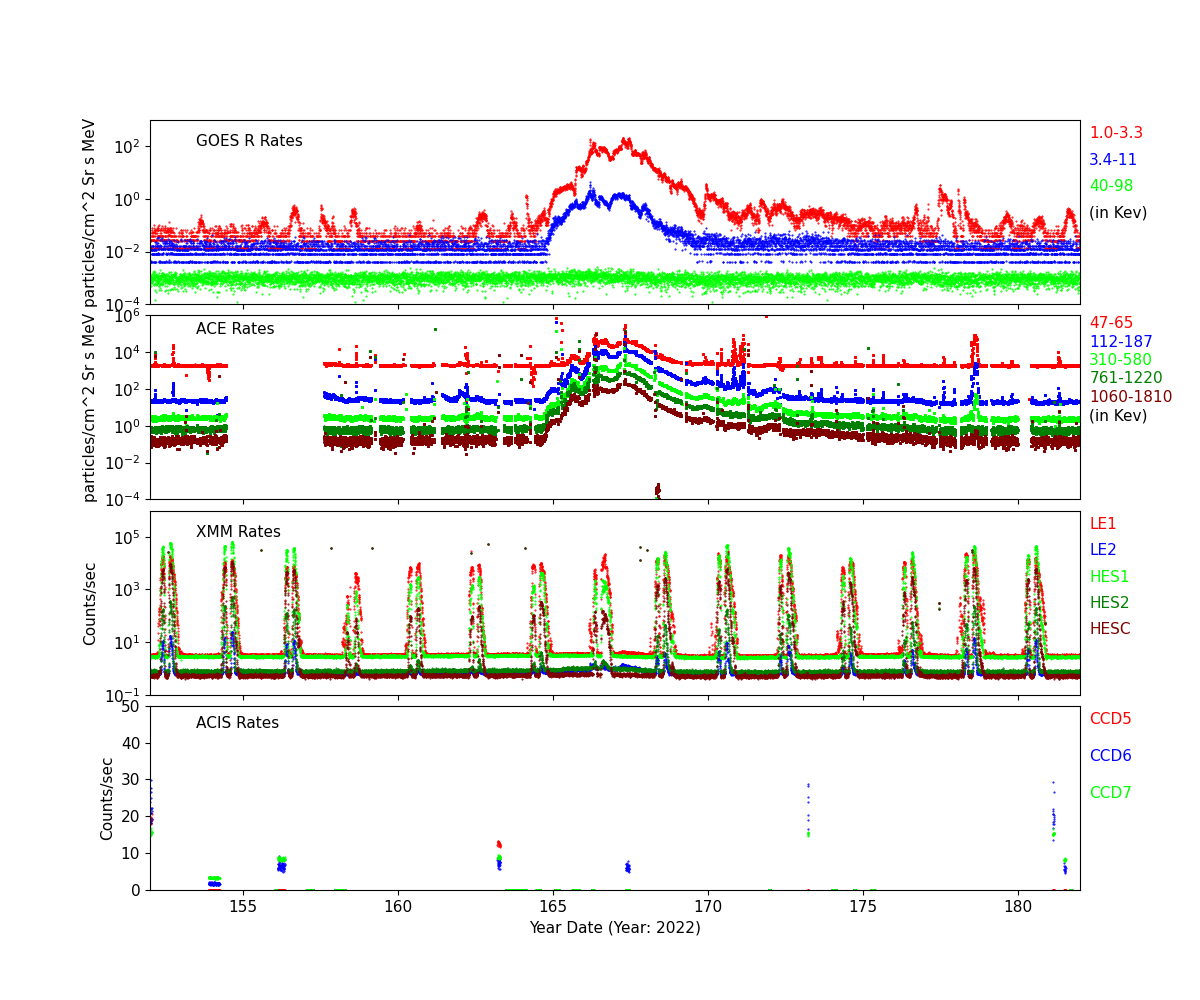
Radiation History
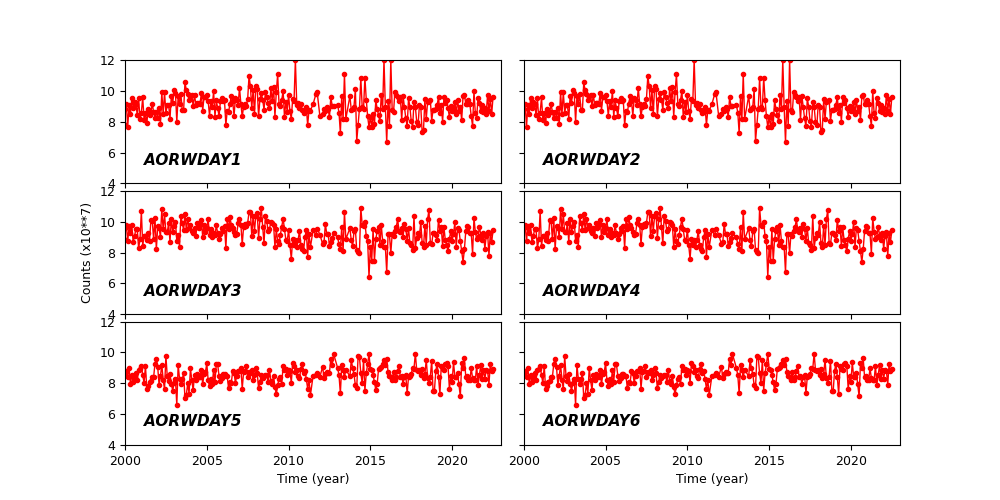
Radiation Count Rates of Jun 2022
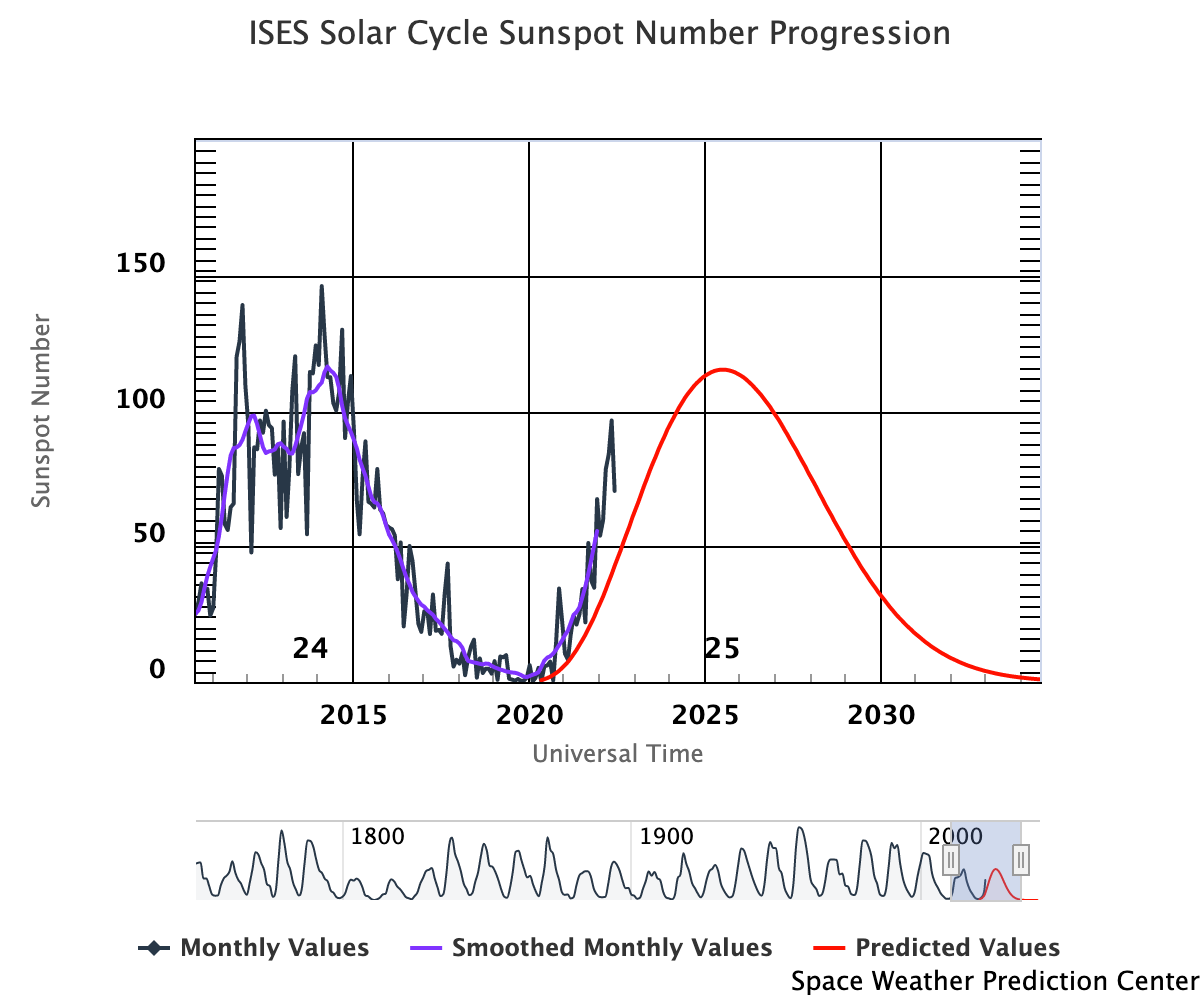
Sun Spot History (See:NOAA Page)
Trending
Critical Trends
| ACIS Temperatures - Daily Maximums | |||||||
|---|---|---|---|---|---|---|---|
| MSID | MEAN | RMS | DELTA/YR | DELTA/YR/YR | UNITS | DESCRIPTION | |
| 1pdeaat | 0.004 | 0.003 | (3.02+/-0.06)e2 | -0.40 +/- 1.80 | K | PSMC DEA PS A TEMP | |
| HRMA Computed Averages - Daily Maximums | |||||||
|---|---|---|---|---|---|---|---|
| MSID | MEAN | RMS | DELTA/YR | DELTA/YR/YR | UNITS | DESCRIPTION | |
| obaavg | -0.015 | 9.958e-04 | (2.99+/-0.02)e2 | 0.78 +/- 0.74 | TEMP | OBA/TFTE | |
| EPHIN Temperatures - Daily Maximums | |||||||
|---|---|---|---|---|---|---|---|
| MSID | MEAN | RMS | DELTA/YR | DELTA/YR/YR | UNITS | DESCRIPTION | |
| teio | -0.002 | 0.010 | (3.26+/-0.23)e2 | -1.98 +/- 4.31 | K | EPHIN ELECTRONICS HOUSING TEMP | |
| tephin | -0.038 | 0.004 | (3.35+/-0.09)e2 | -3.50 +/- 3.11 | K | EPHIN SENSOR HOUSING TEMP | |
| S/C Main Temperatures - Daily Maximums | |||||||
|---|---|---|---|---|---|---|---|
| MSID | MEAN | RMS | DELTA/YR | DELTA/YR/YR | UNITS | DESCRIPTION | |
| tcylfmzm | 0.027 | 0.006 | (3.15+/-0.13)e2 | -1.78 +/- 2.49 | K | CNT CYL TEMP:-Z SIDE UNDER LAE-1 | |
| tcylfmzp | 0.015 | 0.005 | (3.18+/-0.12)e2 | -1.55 +/- 2.22 | K | CNT CYL TEMP:-Z SIDE UNDER LAE-2 | |
| S/C Ancillary Temperatures - Daily Maximums | |||||||
|---|---|---|---|---|---|---|---|
| MSID | MEAN | RMS | DELTA/YR | DELTA/YR/YR | UNITS | DESCRIPTION | |
| tfssbkt1 | -0.006 | 0.013 | (3.46+/-0.28)e2 | -1.43 +/- 4.80 | K | FSS BRAC | |
| tfssbkt2 | -0.002 | 0.013 | (3.41+/-0.30)e2 | -2.41 +/- 4.87 | K | FSS BRAC | |
| tsctsf1 | -0.036 | 0.002 | (3.21+/-0.05)e2 | 2.56 +/- 1.88 | K | SC-TS FITTING -1 TEMP | |
| tsctsf6 | -0.018 | 0.002 | (3.20+/-0.05)e2 | 1.85 +/- 1.93 | K | SC-TS FITTING -6 TEMP | |
| MUPS - Daily Maximums | |||||||
|---|---|---|---|---|---|---|---|
| MSID | MEAN | RMS | DELTA/YR | DELTA/YR/YR | UNITS | DESCRIPTION | |
| pm1thv1t | -0.046 | 0.007 | (3.52+/-0.16)e2 | 2.29 +/- 3.16 | K | MUPS 1 THRUSTER VALVE 01 TEMP | |
| pm2thv1t | -0.066 | 0.021 | (3.21+/-0.48)e2 | -5.79 +/- 8.31 | K | MUPS 2 THRUSTER VALVE 01 TEMP | |
| pm1thv2t | -0.052 | 0.007 | (3.53+/-0.17)e2 | 3.94 +/- 3.44 | K | MUPS 1 THRUSTER VALVE 02 TEMP | |
| pm2thv2t | -0.017 | 0.024 | (3.13+/-0.56)e2 | -0.46 +/- 10.36 | K | MUPS 2 THRUSTER VALVE 02 TEMP | |
| pline02t | -0.032 | 0.006 | (3.34+/-0.13)e2 | 4.22 +/- 3.00 | K | PROP LINE TEMP 02 | |
| pline03t | -0.010 | 0.007 | (3.29+/-0.15)e2 | 0.69 +/- 2.82 | K | PROP LINE TEMP 03 | |
| pline04t | -0.028 | 0.005 | (3.17+/-0.11)e2 | -0.91 +/- 2.86 | K | PROP LINE TEMP 04 | |
Quarterly Trends
- HRMA Struts
| Previous Quarter | |||||||
| MSID | MEAN | RMS | DELTA/YR | DELTA/YR/YR | UNITS | DESCRIPTION | |
| 4rt584t | -0.011 | 6.578e-04 | (3.01+/-0.02)e2 | 0.92 +/- 0.50 | K | RT 584 - STRUT TEMP | |
|---|---|---|---|---|---|---|---|
| 4rt585t | -0.013 | 6.491e-04 | (3.02+/-0.02)e2 | 0.80 +/- 0.49 | K | RT 585 - STRUT TEMP | |
| 4rt586t | -0.012 | 5.387e-04 | (2.98+/-0.01)e2 | 0.76 +/- 0.40 | K | RT 586 - STRUT TEMP | |
| 4rt587t | -0.007 | 3.882e-04 | (2.92+/-0.01)e2 | 0.58 +/- 0.28 | K | RT 587 - STRUT TEMP | |
| 4rt597t | -0.017 | 0.001 | (3.09+/-0.03)e2 | 1.21 +/- 1.13 | K | RT 597 - TFTE TEMP | |
| 4rt598t | -0.020 | 0.001 | (3.08+/-0.03)e2 | 1.01 +/- 1.11 | K | RT 598 - TFTE TEMP | |
- OB Forward Bulkhead
| Previous Quarter | |||||||
| MSID | MEAN | RMS | DELTA/YR | DELTA/YR/YR | UNITS | DESCRIPTION | |
| 4rt705t | -0.011 | 7.664e-04 | (2.93+/-0.02)e2 | 0.74 +/- 0.60 | K | RT 705 - OB BUL | |
|---|---|---|---|---|---|---|---|
| 4rt706t | -0.011 | 7.666e-04 | (2.91+/-0.02)e2 | 0.88 +/- 0.60 | K | RT 706 - OB BUL | |
| 4rt707t | -0.012 | 7.685e-04 | (2.94+/-0.02)e2 | 0.87 +/- 0.61 | K | RT 707 - OB BULKHEAD TEMP | |
| 4rt708t | -0.014 | 8.588e-04 | (2.99+/-0.02)e2 | 0.96 +/- 0.69 | K | RT 708 - OB BULKHEAD TEMP | |
| 4rt709t | -0.015 | 9.269e-04 | (3.00+/-0.02)e2 | 0.92 +/- 0.74 | K | RT 709 - OB BULKHEAD TEMP | |
| 4rt710t | -0.017 | 9.941e-04 | (3.02+/-0.02)e2 | 1.08 +/- 0.80 | K | RT 710 - OB BULKHEAD TEMP | |
- HRMA Thermal
- HRMA Thermal
| Previous Quarter | |||||||
| MSID | MEAN | RMS | DELTA/YR | DELTA/YR/YR | UNITS | DESCRIPTION | |
| 4rt568t | -0.013 | 8.327e-04 | (2.99+/-0.02)e2 | 0.92 +/- 0.65 | K | RT 568 - HRMA TEMP | |
|---|---|---|---|---|---|---|---|
| 4rt569t | -0.005 | 2.414e-04 | (2.97+/-0.01)e2 | 0.17 +/- 0.14 | K | RT 569 - HRMA TEMP | |
| 4rt570t | -0.003 | 1.231e-04 | (2.96+/-0.00)e2 | 0.06 +/- 0.06 | K | RT 570 - HRMA TEMP | |
| 4rt575t | -0.015 | 0.001 | (3.04+/-0.03)e2 | 1.14 +/- 0.87 | K | RT 575 - OB CONE TEMP | |
| 4rt576t | -0.012 | 8.338e-04 | (2.95+/-0.02)e2 | 0.89 +/- 0.66 | K | RT 576 - OB CONE TEMP | |
| 4rt578t | -0.018 | 0.001 | (3.02+/-0.03)e2 | 0.38 +/- 1.06 | K | RT 578 - OB CONE TEMP | |
Spacecraft Motions
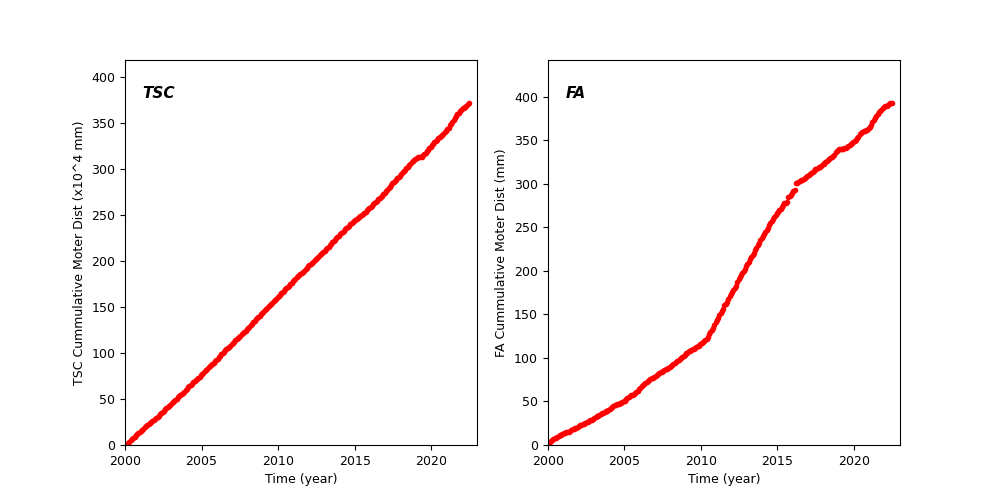
TSC and FA Cummulative Moter Distance
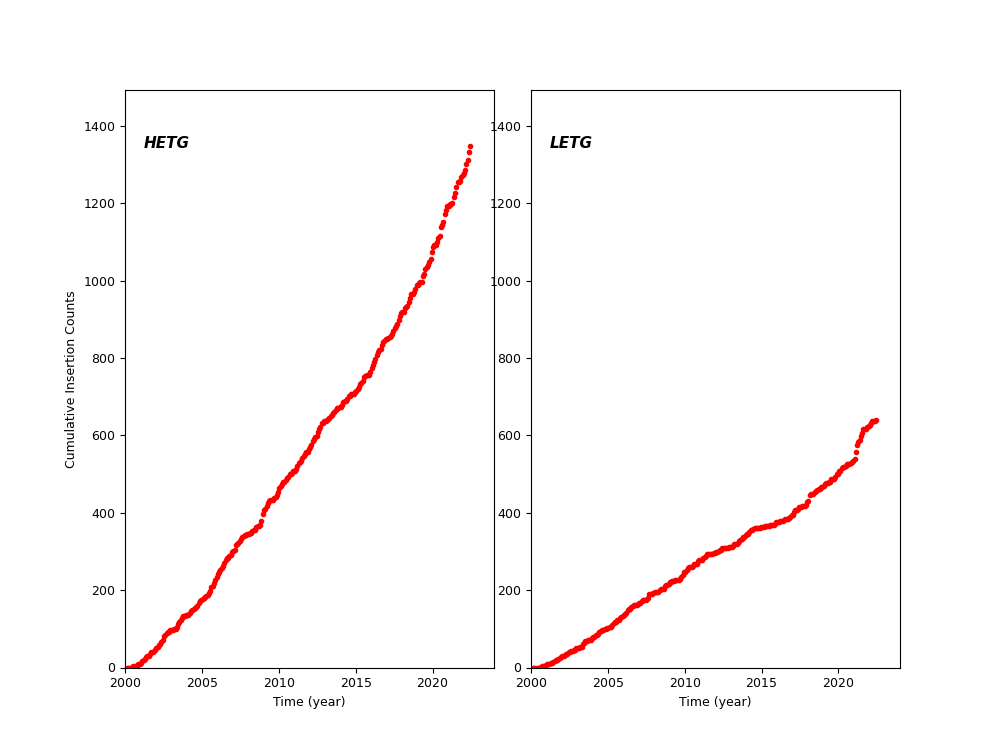
HETG and LETG Cummulative Insertion Counts
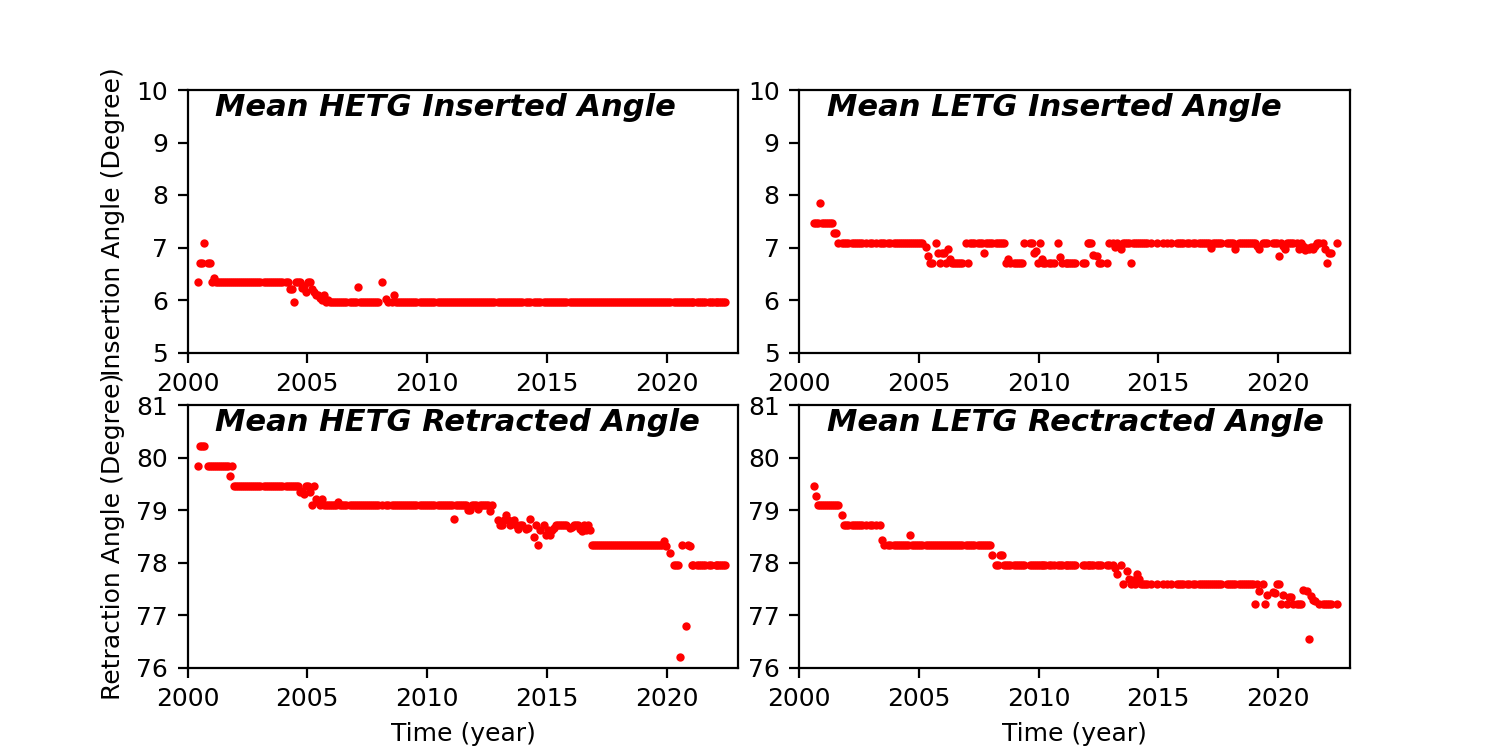
HETG/LETG Insertion/Retraction Angle
Reaction Wheel Rotations