ACIS
ACIS DOSE Registered-Photon-Map
The steps we took to compute the dose map are;
- Level 1 Event files for a specified month are obtained from archive.
- Image data including I2, I3, S2, S3 CCDs are extracted from all event files.
- All the extracted image data were merged to create a month long exposure map for the month.
- The exposure map is opened with ds9, and check a distribution of count rates against energy. From this, estimate the upper threshold value. Any events beyond this upper threshold are assumed erroneous events such as bad pixels.
- Using this upper threshold, the data is filtered, and create a cleaned exposure map for the month.
- The exposure map from each month from the Sep 1999 is added up to create a cumulative exposure map for each month.
- Using fimgstatistic, we compute count rate statistics for each CCDs.
- For observations with high data drop rates (e.g., Crab nebula, Cas A), we corrected the observations by adding events.
Please check more detail plots at Telemetered Photon Dose Trend page.
)
)
)
Statistics:
# IMAGE     NPIX     MEAN        RMS        MIN     MAX
ACIS_feb23 6004901       4.178         8.444           0.0     4256


I2 node 0  262654	2.931740	1.988156	0.0	 45.0
I2 node 1  262654	3.097024	8.667451	0.0	4256.0
I2 node 2  262654	2.986745	1.986316	0.0	 64.0
I2 node 3  262654	2.927880	2.168863	0.0	337.0

I3 node 0  262654	3.523297	3.940376	0.0	1674.0
I3 node 1  262654	3.443505	9.448731	0.0	3495.0
I3 node 2  262654	3.378265	2.065468	0.0	 67.0
I3 node 3  262654	3.431610	2.159646	0.0	191.0

S2 node 0  262654	5.103431	3.783303	0.0	 75.0
S2 node 1  262654	5.609018	4.724735	0.0	255.0
S2 node 2  262654	7.717555	9.929738	0.0	209.0
S2 node 3  262654	8.117049	12.743382	0.0	4080.0

S3 node 0  262654	9.469719	13.916714	0.0	291.0
S3 node 1  262654	10.184609	16.283198	0.0	3470.0
S3 node 2  262654	10.318919	13.887594	0.0	192.0
S3 node 3  262654	7.964107	8.078762	0.0	119.0
)
)
)
Statistics:
 IMAGE     NPIX      MEAN        RMS           MIN      MAX
ACIS_total   6004901       2624.295         3351.688           0.0   144868


I2 node 0  262654	2279.686835	460.084820	489.0	14142.0
I2 node 1  262654	2400.262907	660.206631	502.0	142862.0
I2 node 2  262654	2428.829276	514.014642	525.0	14983.0
I2 node 3  262654	2433.209661	627.753830	488.0	29569.0

I3 node 0  262654	2617.030748	641.985437	489.0	14198.0
I3 node 1  262654	2700.219927	1743.428623	514.0	55907.0
I3 node 2  262654	2412.874592	450.120027	485.0	14465.0
I3 node 3  262654	2394.068734	484.571021	457.0	35232.0

S2 node 0  262654	3056.555986	495.700672	1656.0	22457.0
S2 node 1  262654	3241.525214	736.934333	1841.0	17488.0
S2 node 2  262654	3585.977428	736.272301	2254.0	31150.0
S2 node 3  262654	3547.704683	593.771419	1990.0	76255.0

S3 node 0  262654	5431.768470	2962.986690	2383.0	54577.0
S3 node 1  262654	6643.566748	2379.158589	0.0	56100.0
S3 node 2  262654	5375.346917	1361.234103	2477.0	27363.0
S3 node 3  262654	4205.584761	761.853398	2542.0	26535.0
)
|
)
|
)
|
)
|
| Nov 2022 | Aug 2022 | May 2022 | Feb 2022 |
|---|
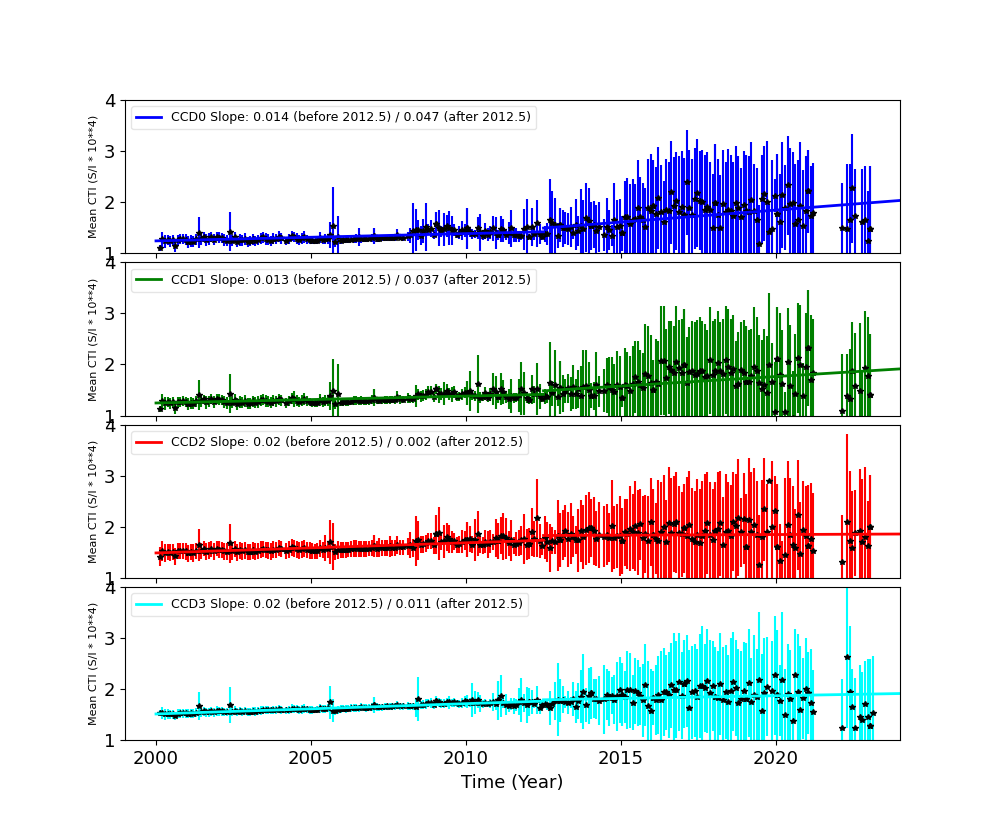
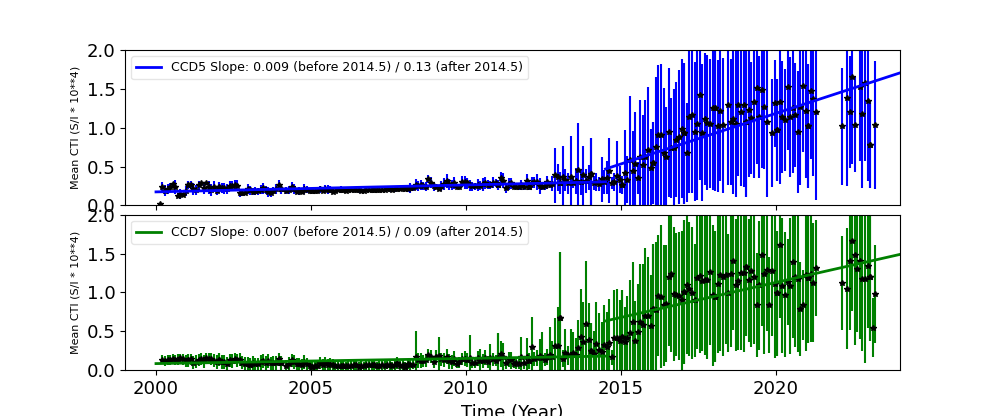
The Mean Detrended CTI
We report CTIs with a refined data definition. CTIs were computed for the temperature dependency corrected data. Please see CTI page for detailed explanation. CTI's are computed for Mn K alpha, and defined as slope/intercept x10^4 of row # vs ADU. Data file: here
Imaging CCDs
Spectral CCDs
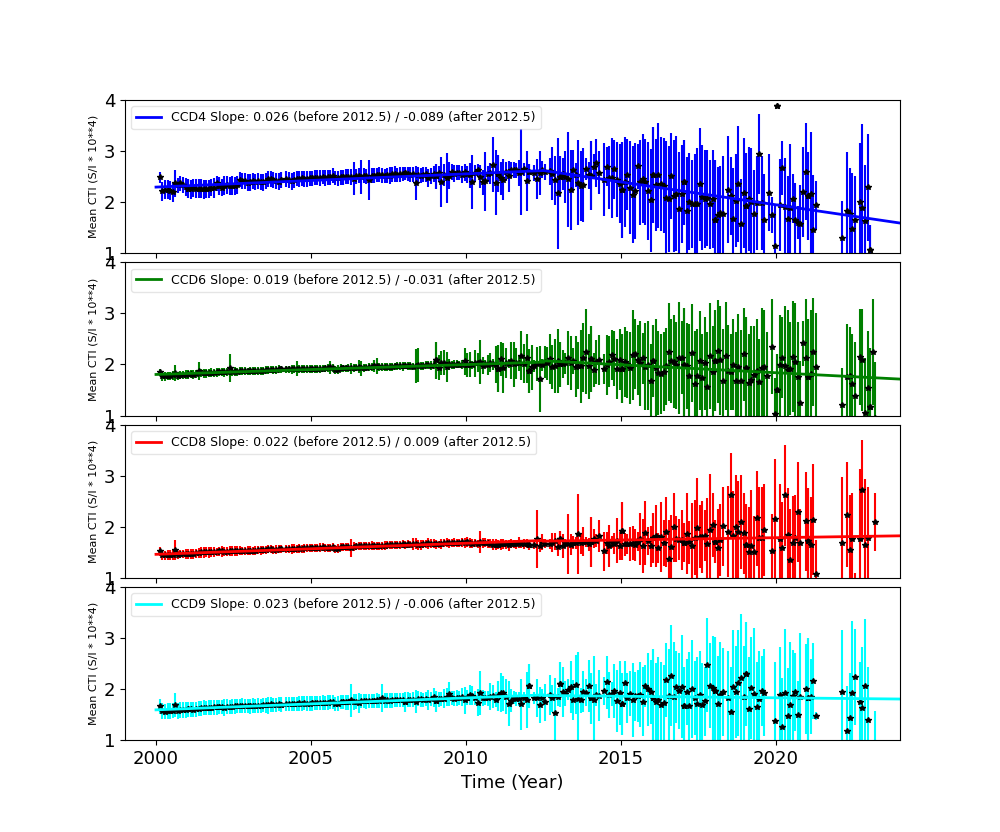
Backside CCDs
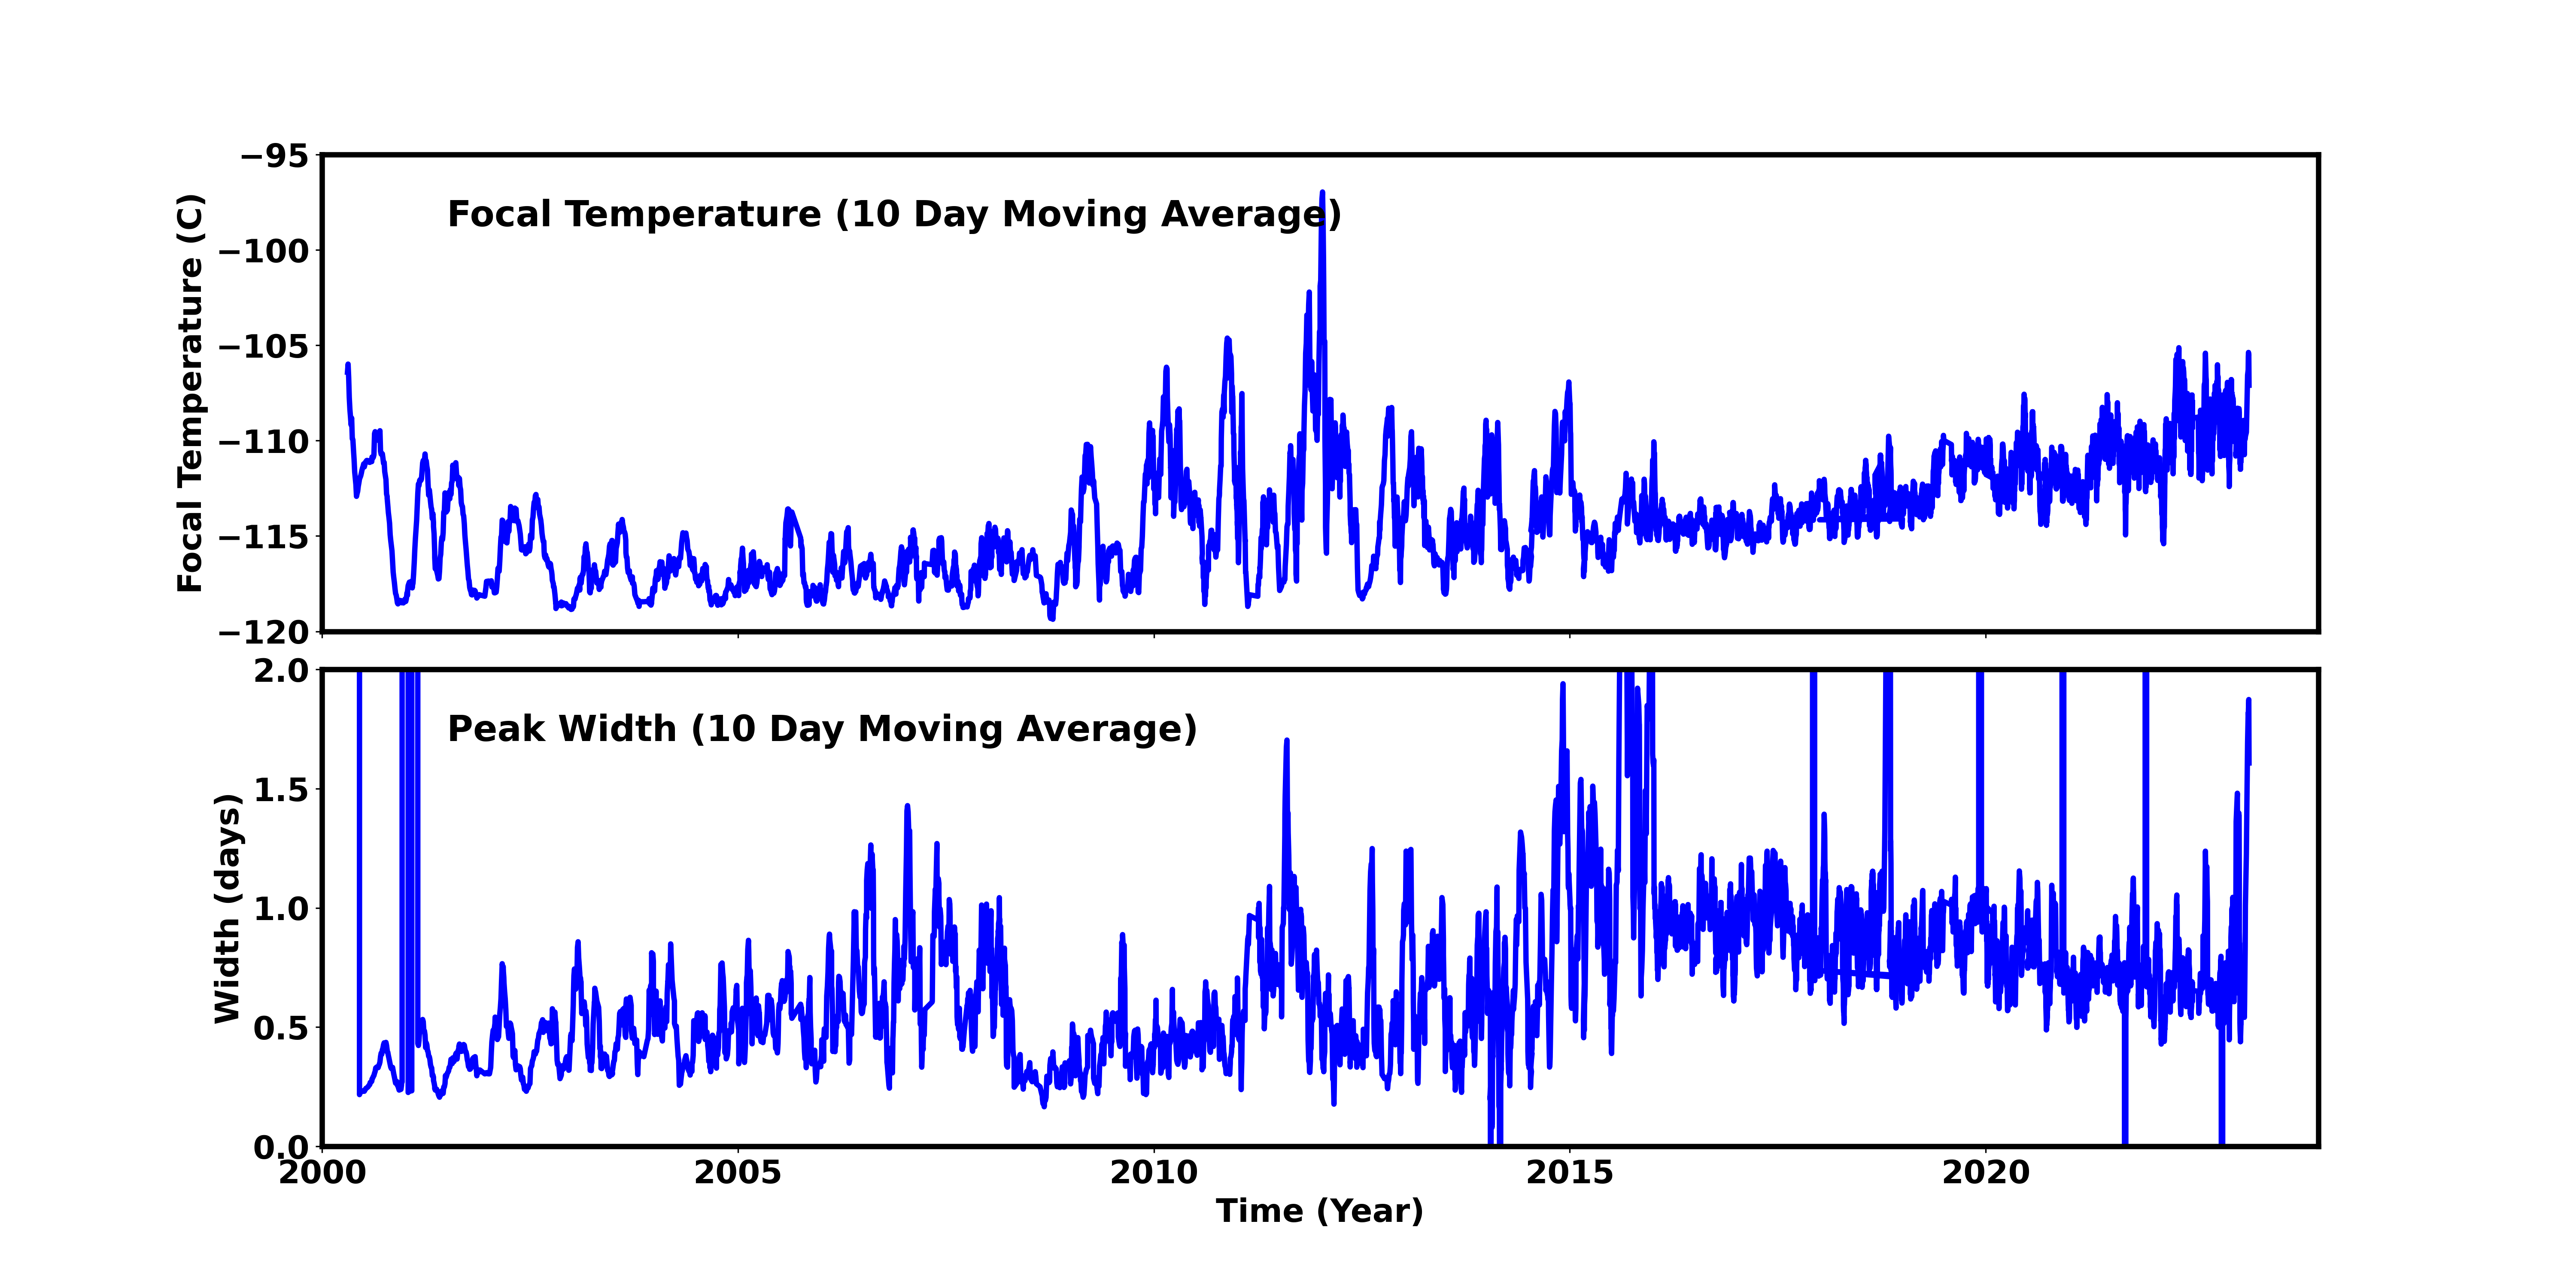
Focal Plane Temperature
Feb 2023 Focal Temperature
| The Mean (max) FPT: | |
|---|---|
| -108.25 | +/- 6.58 C |
| Mean Width: | |
| 1.17 | +/- 0.93 days |
Averaged Focal Plane Temperature
We are using 10 period moving averages to show trends of peak temperatures and peak widths. Note, the gaps in the width plot are due to missing/corrupted data.
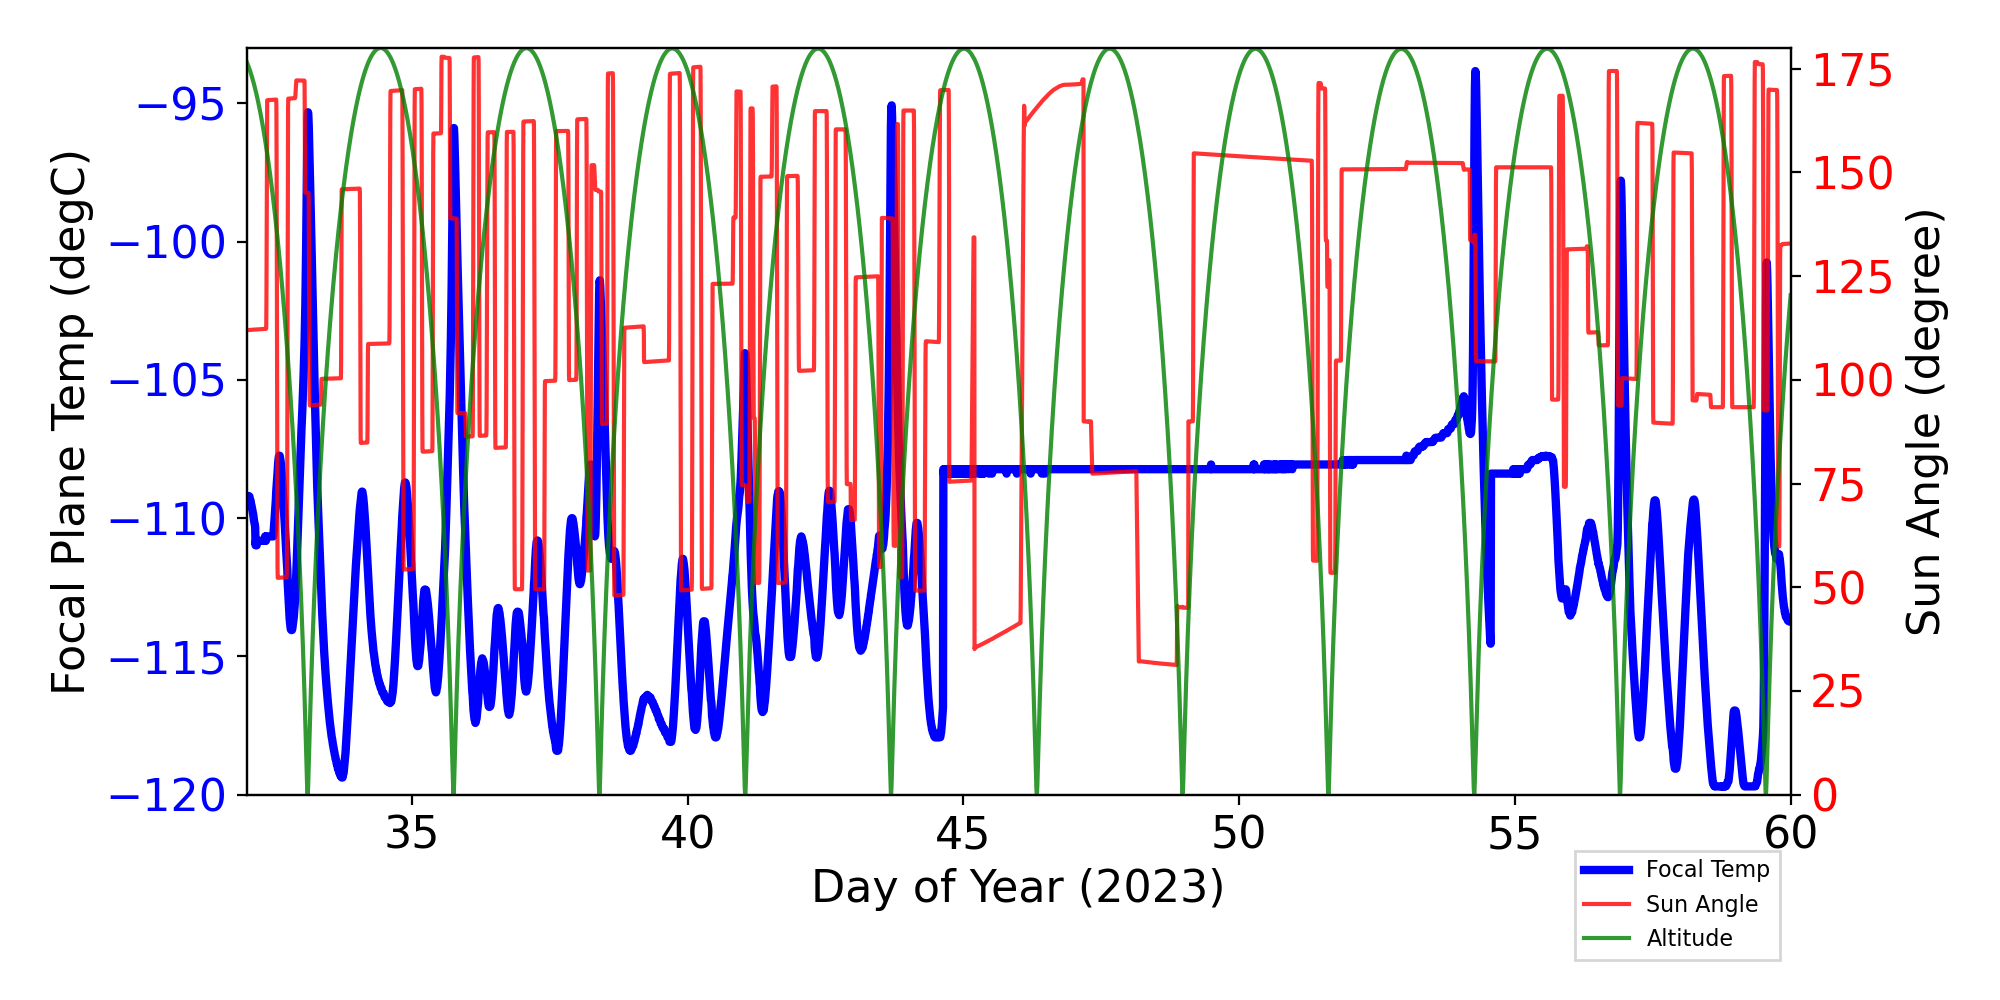
Focal Plane Temperature, Sun Angle and Altitude
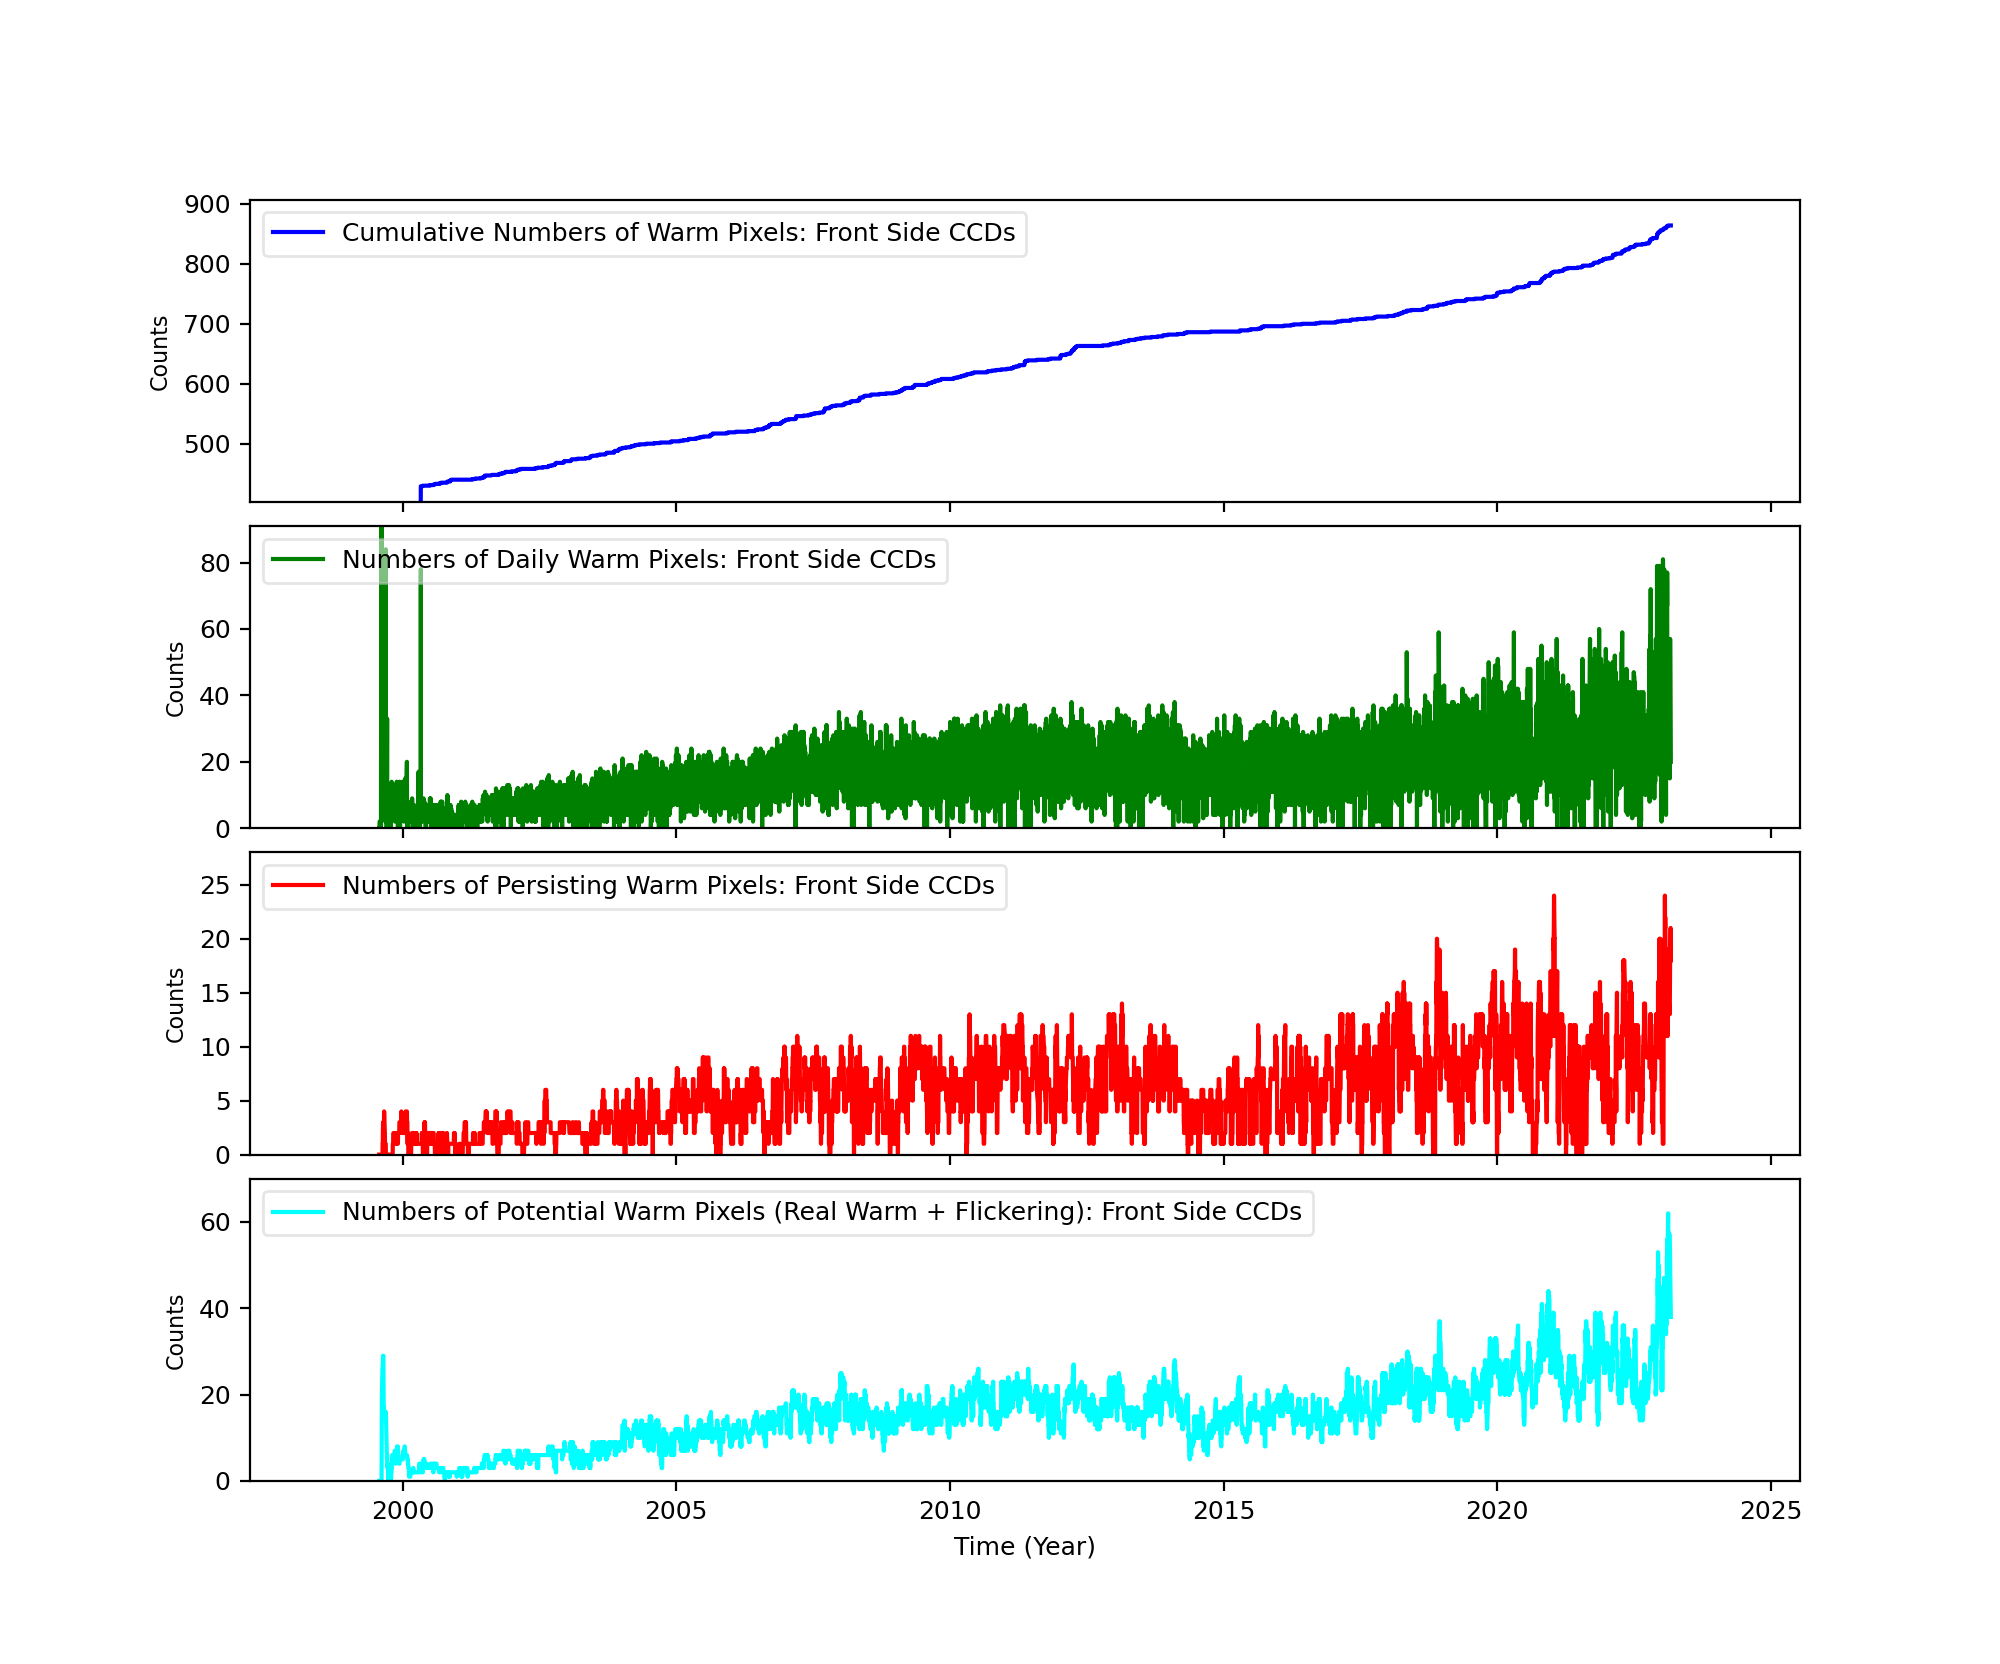
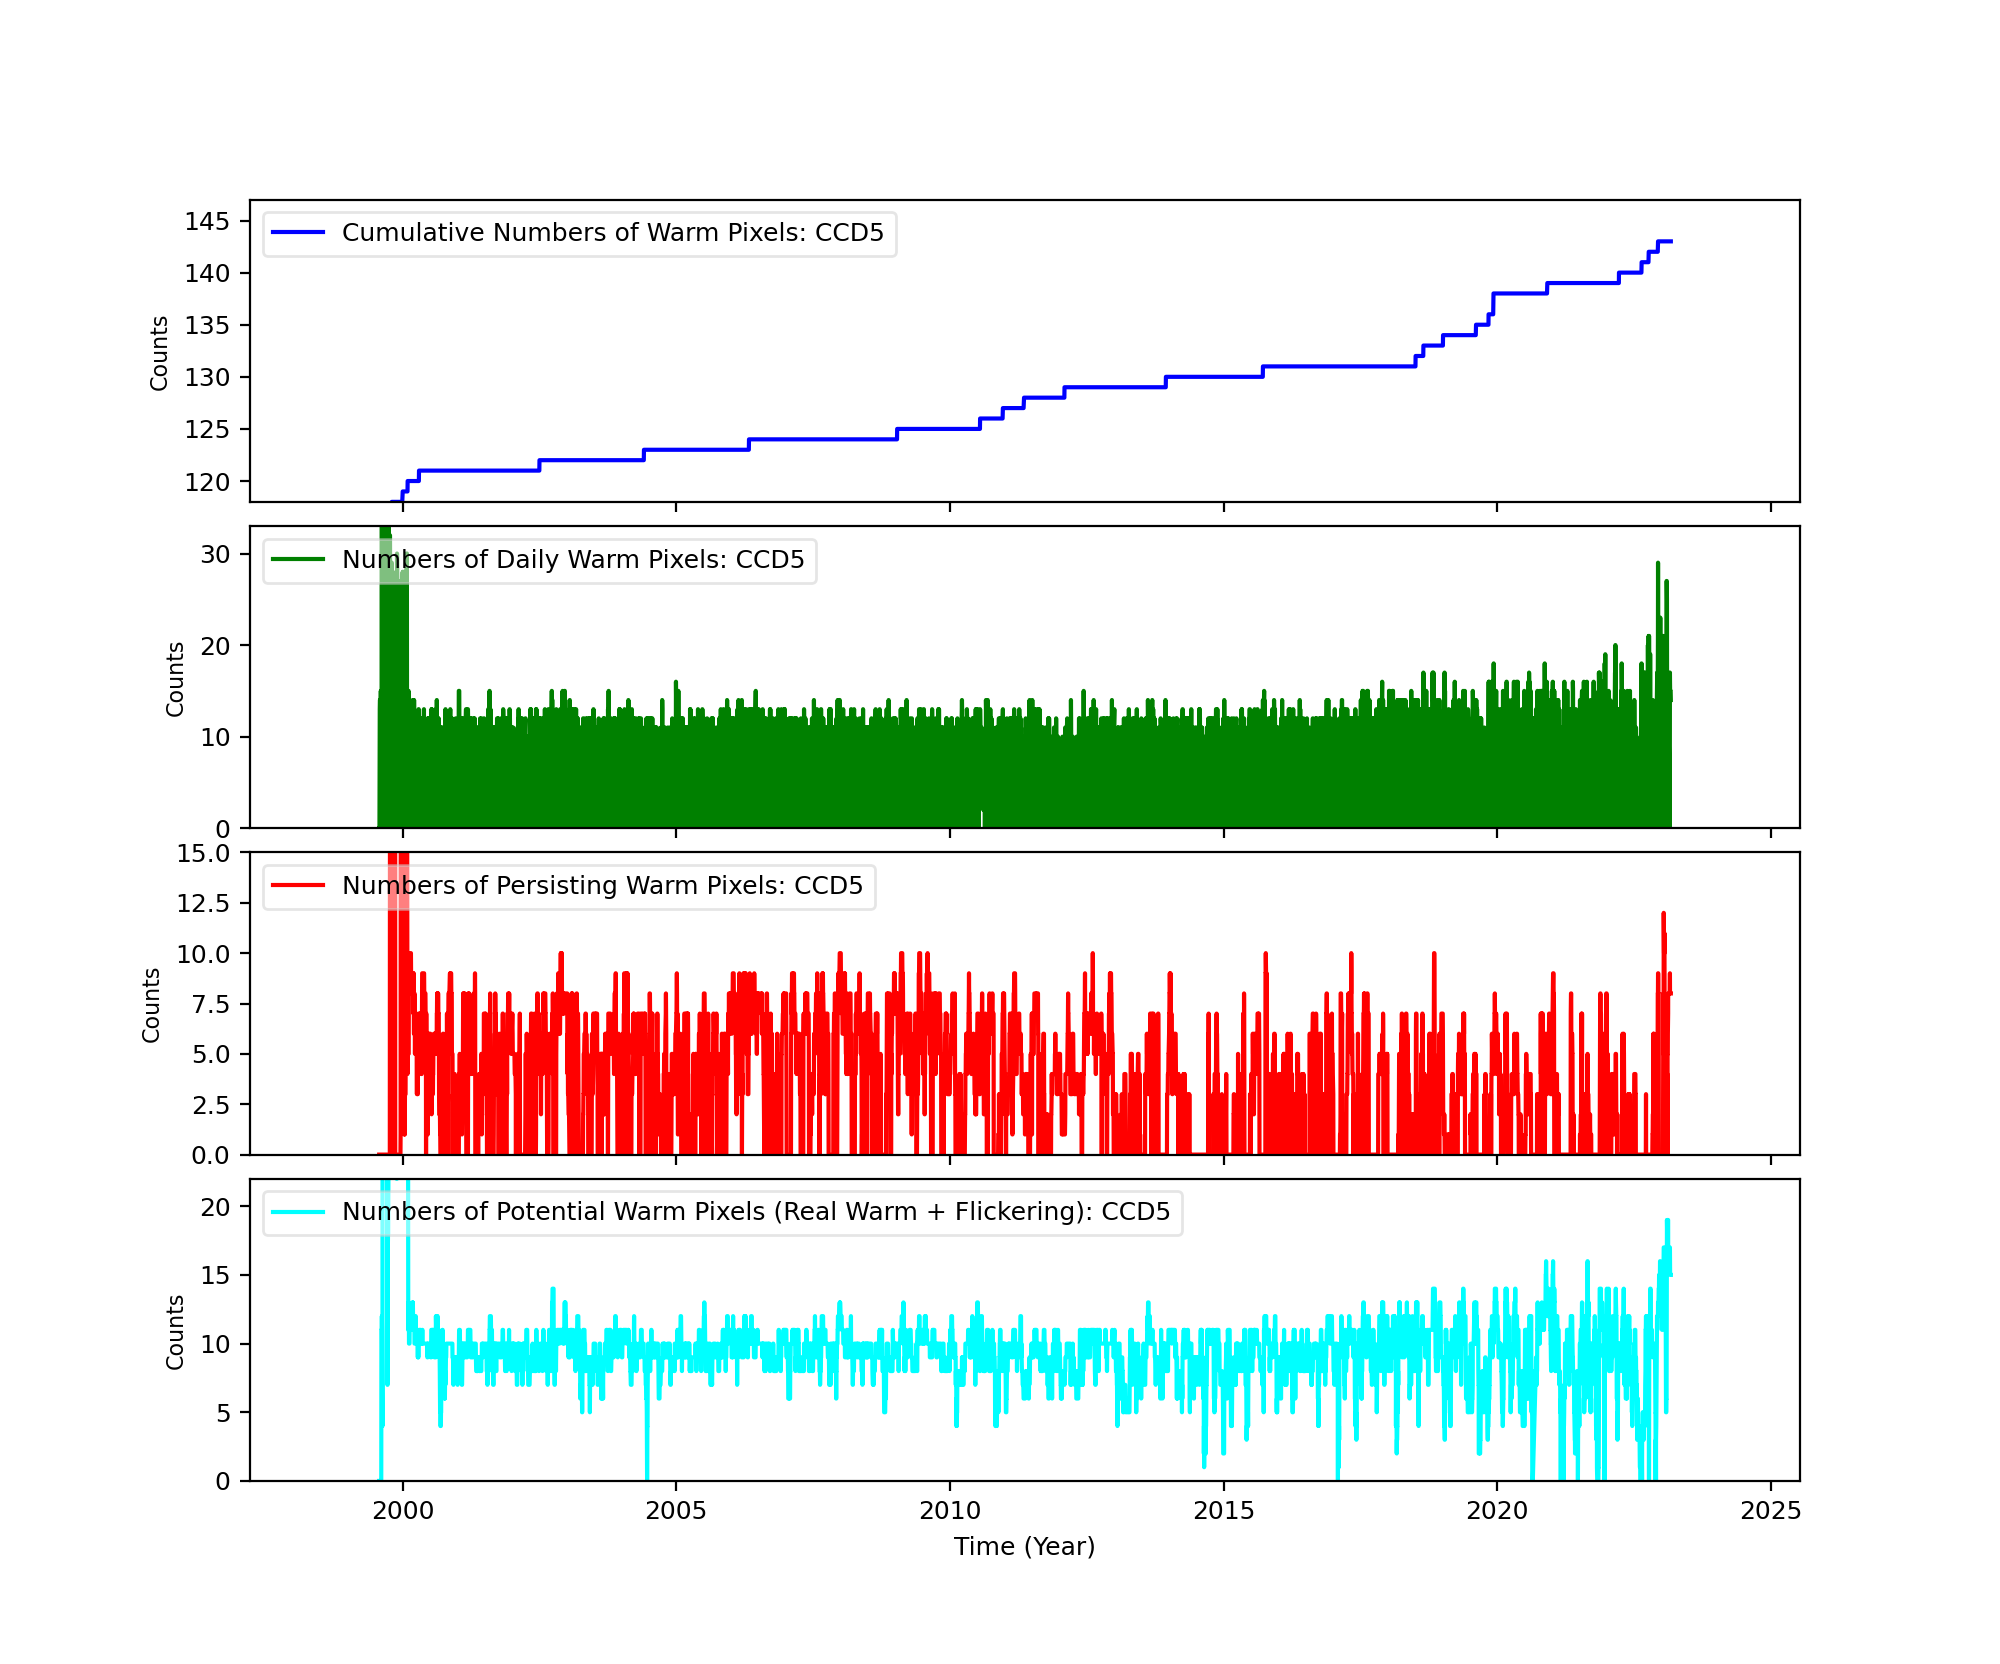
Bad Pixels
The plots below were generated with a new warm pixel finding script. Please see Acis Bad Pixel Page for details.
Front Side CCDs
Back Side CCD (CCD5)
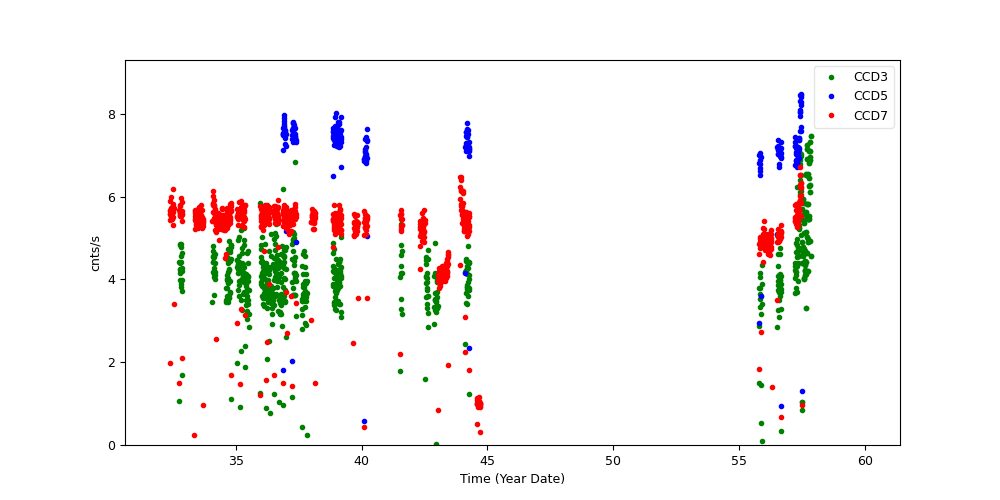
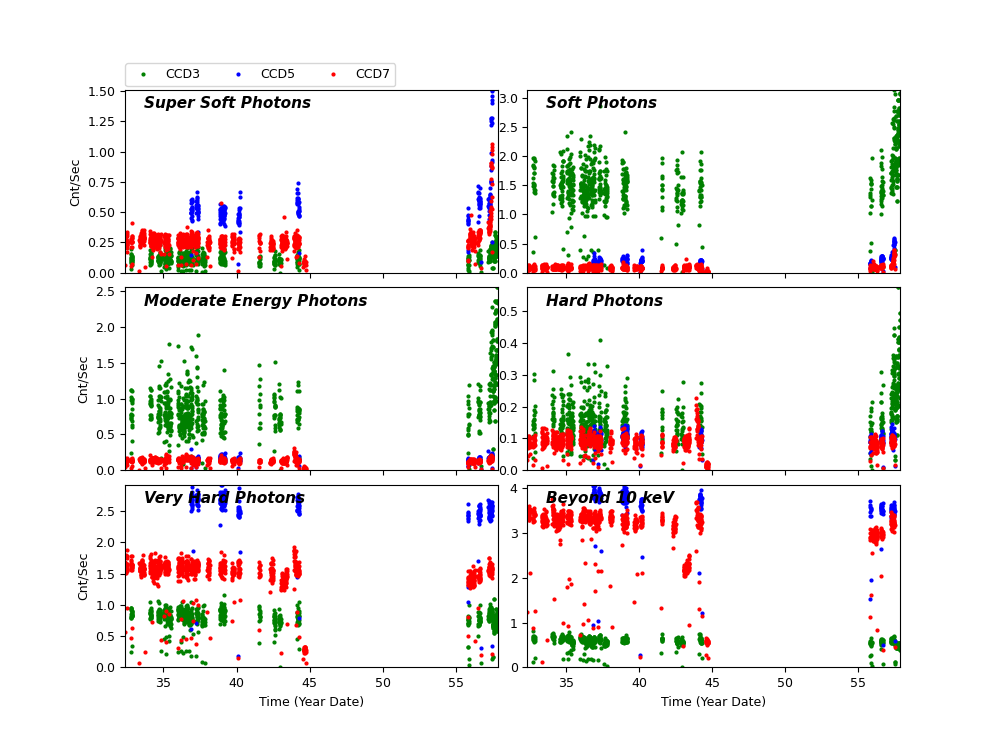
Science Instrument Background Rates
| Name | Low (keV) | High(KeV) | Description |
|---|---|---|---|
| SSoft | 0.00 | 0.50 | Super soft photons |
| Soft | 0.50 | 1.00 | Soft photons |
| Med | 1.00 | 3.00 | Moderate energy photons |
| Hard | 3.00 | 5.00 | Hard Photons |
| Harder | 5.00 | 10.00 | Very Hard photons |
| Hardest | 10.00 | Beyond 10 keV |
HRC
DOSE of Central 4K Pore-Pairs
Please refer to Maximum Dose Trends for more details.
No Data
)
IMAGE                       NPIX      MEAN    STDDEV      MIN       MAX
HRCI_08_1999_02_2023.fits  16777216	na	na	na	na
No Data
)
IMAGE                       NPIX      MEAN    STDDEV      MIN       MAX
HRCS_08_1999_02_2023.fits  16777216	na	na	na	na
|
|
Max dose trend plots corrected for events that "pile-up"
in the center of the taps due to bad position information.
|
)
|
)
|
)
|
)
|
| Nov 2022 | Aug 2022 | May 2022 | Feb 2022 |
|---|
)
|
)
|
)
|
)
|
| Nov 2022 | Aug 2022 | May 2022 | Feb 2022 |
|---|
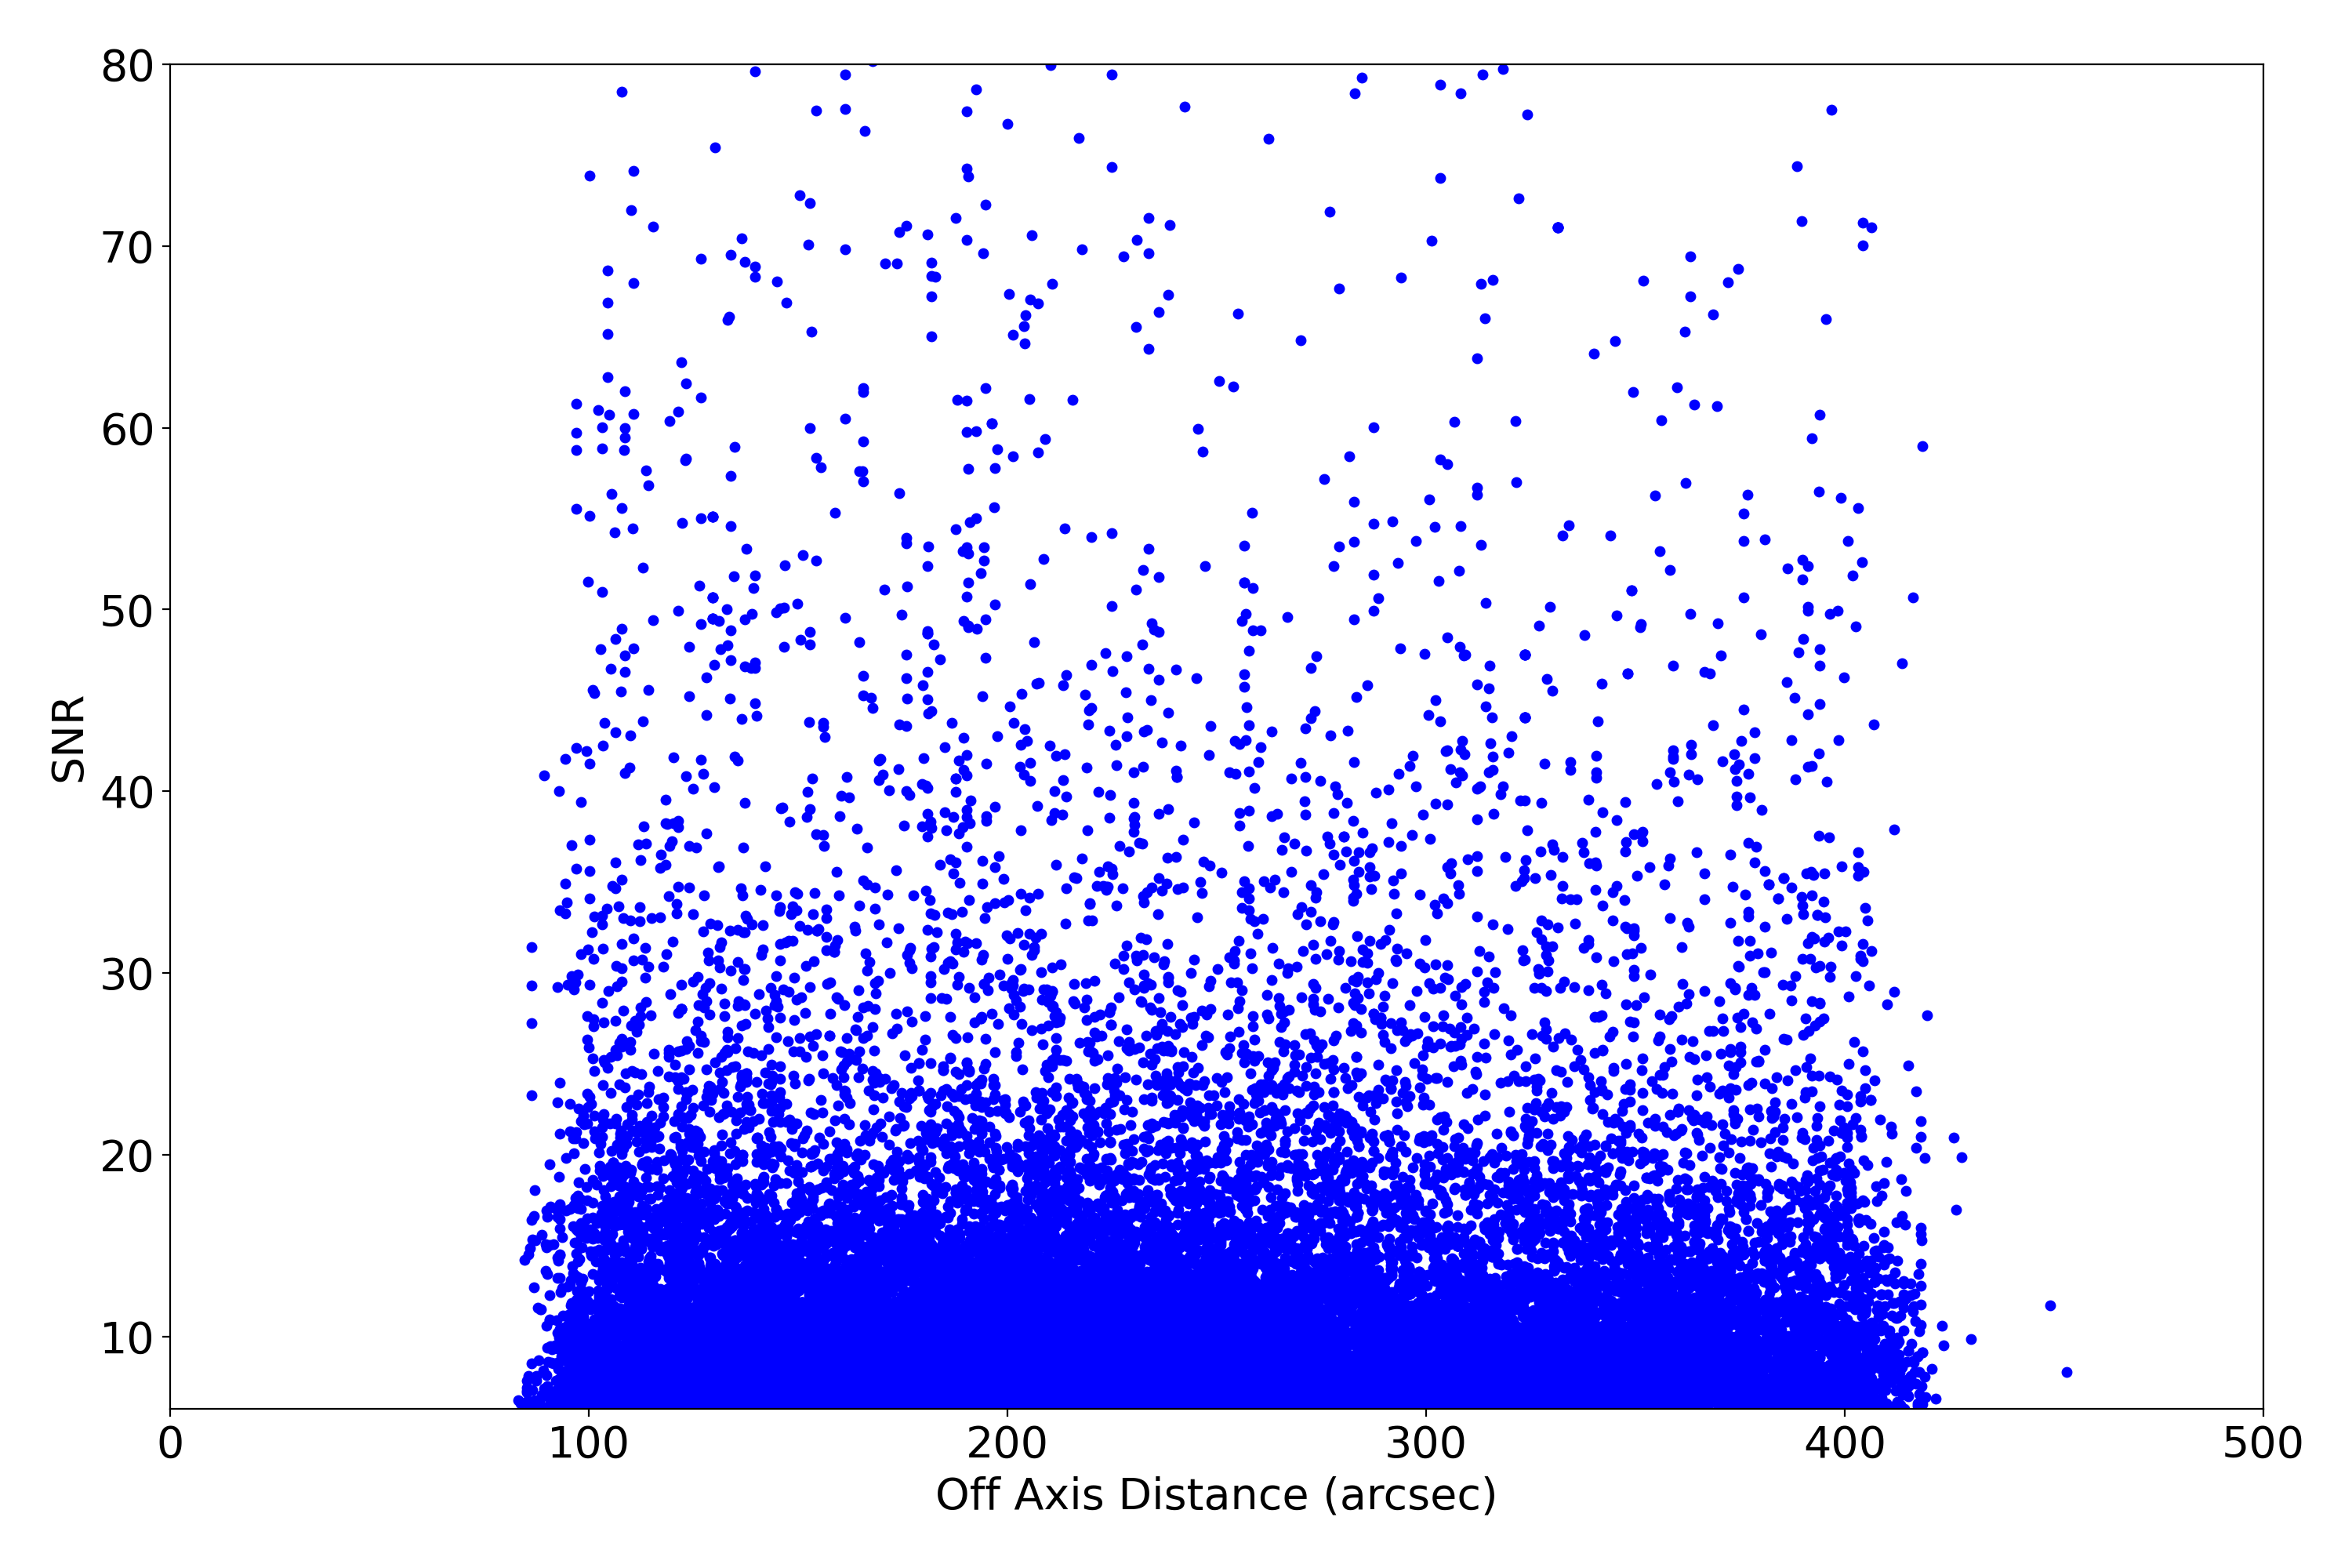
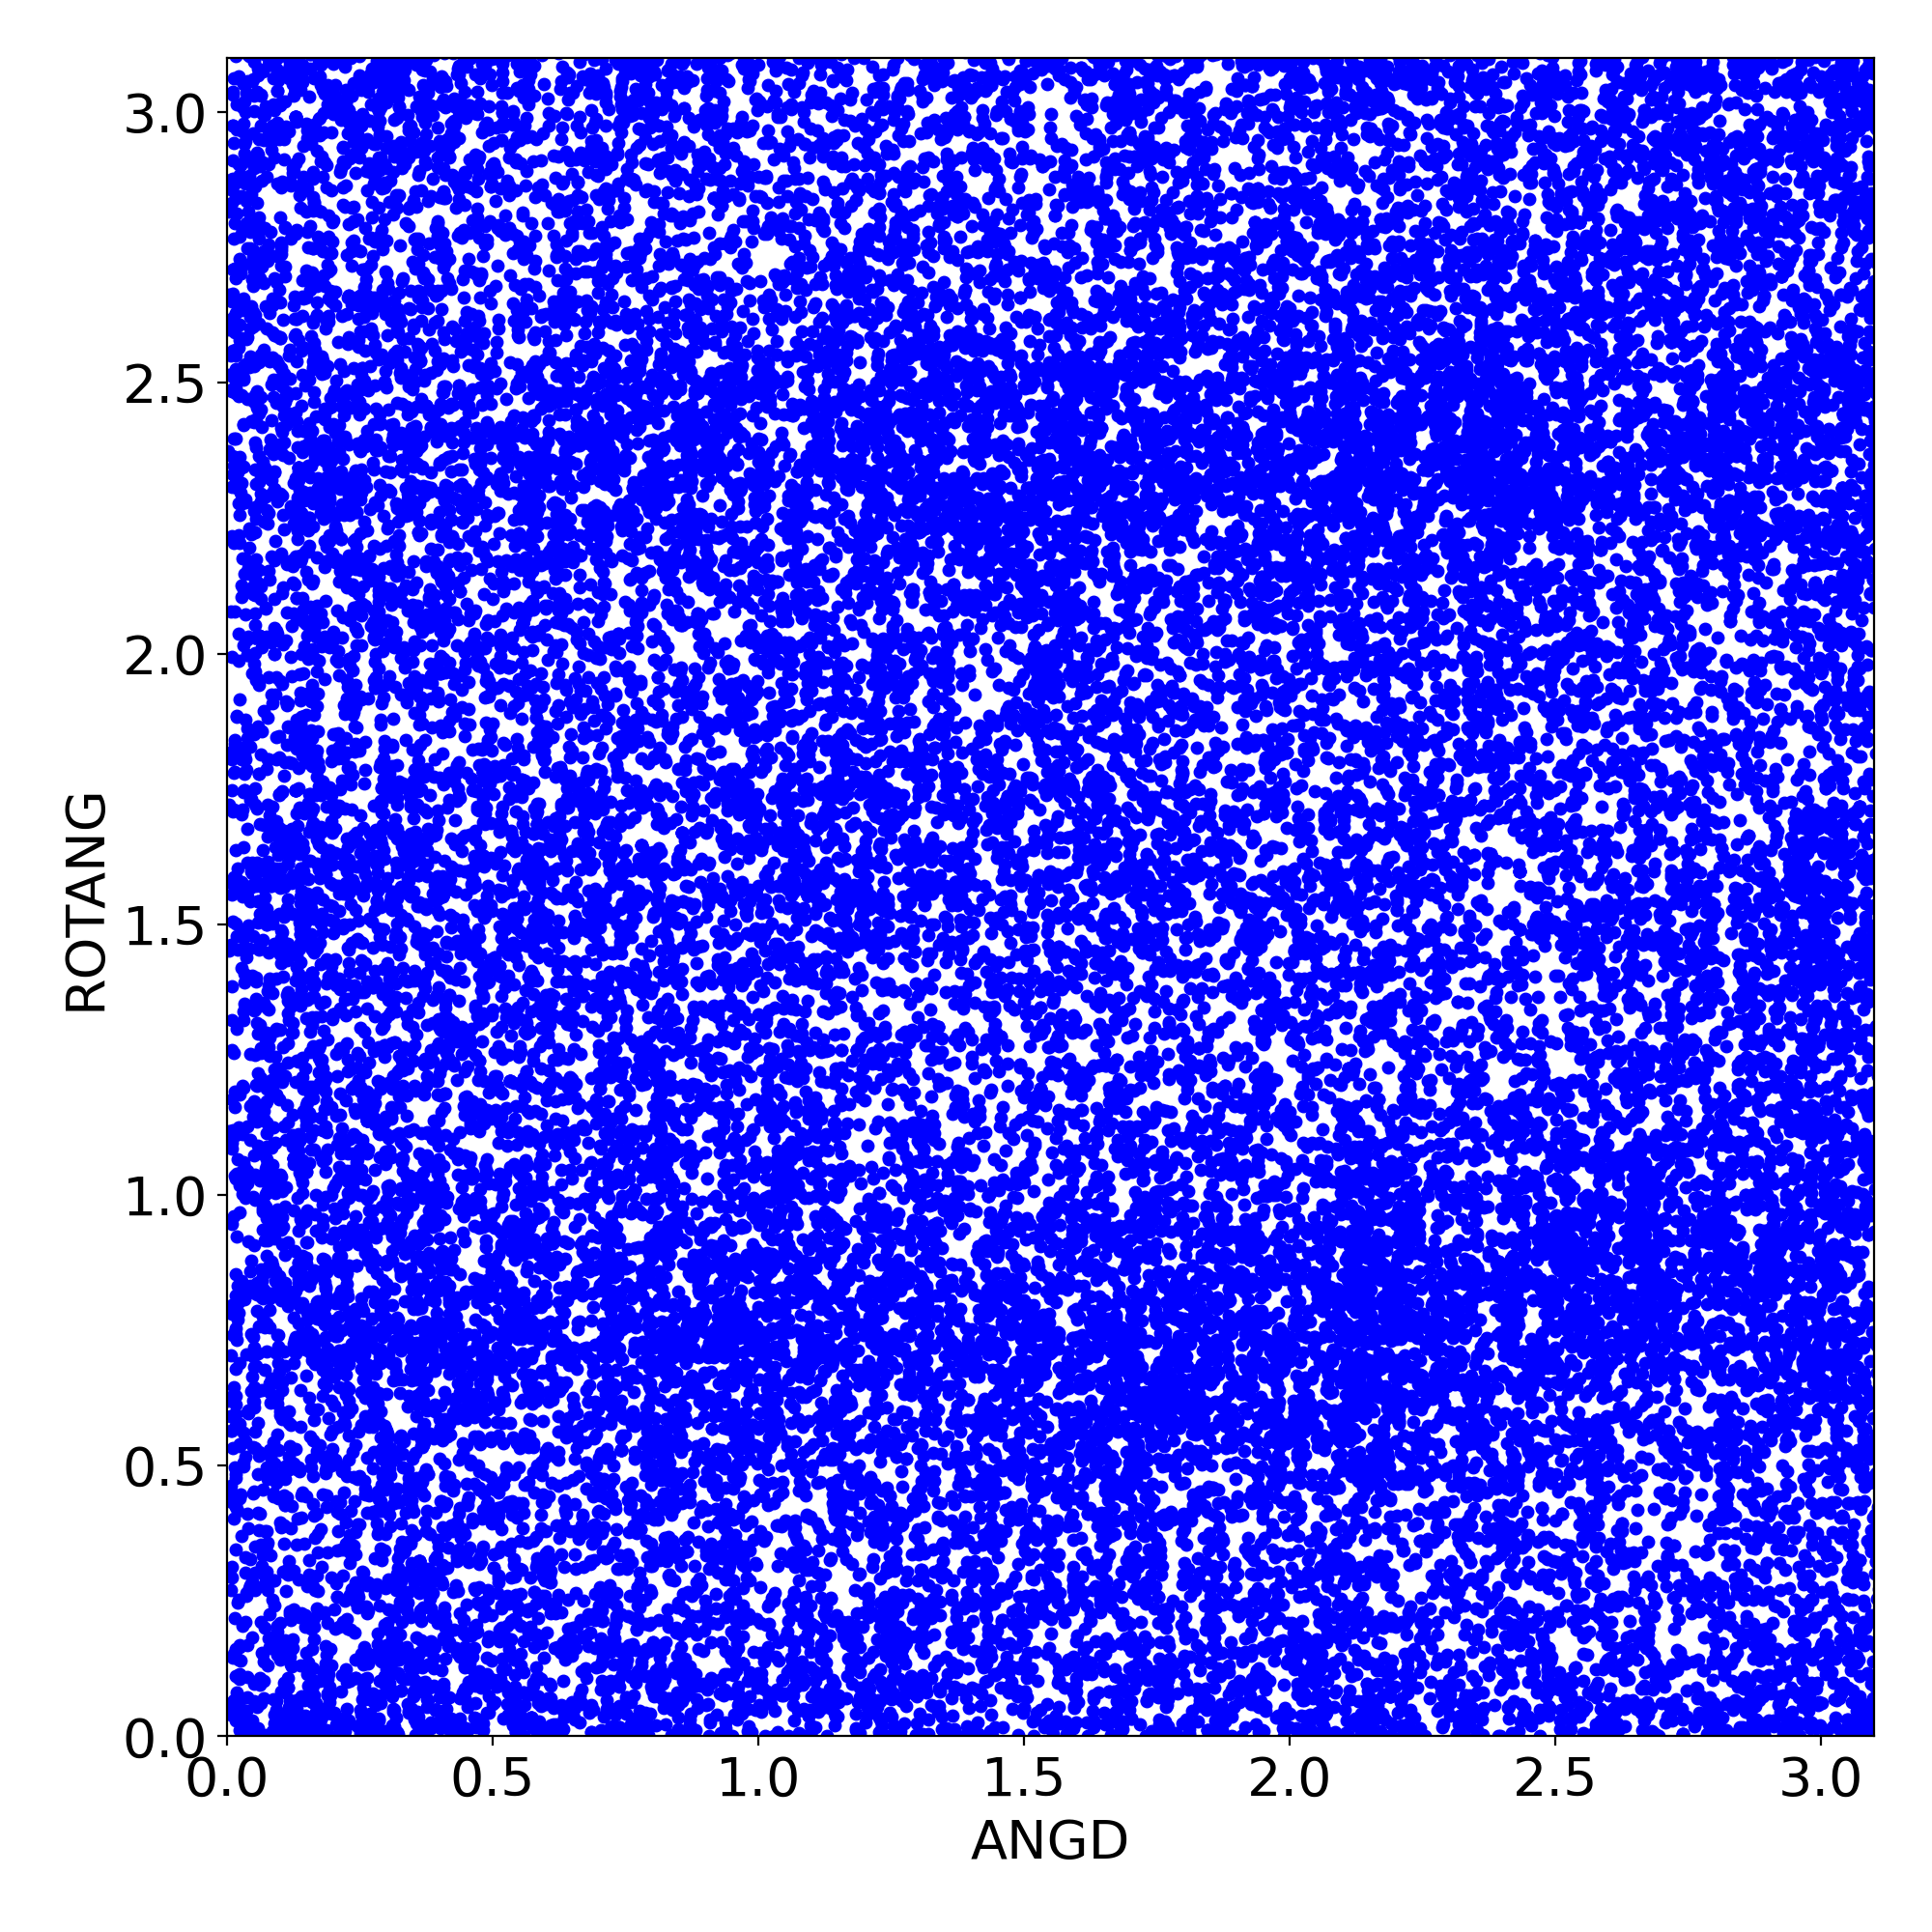
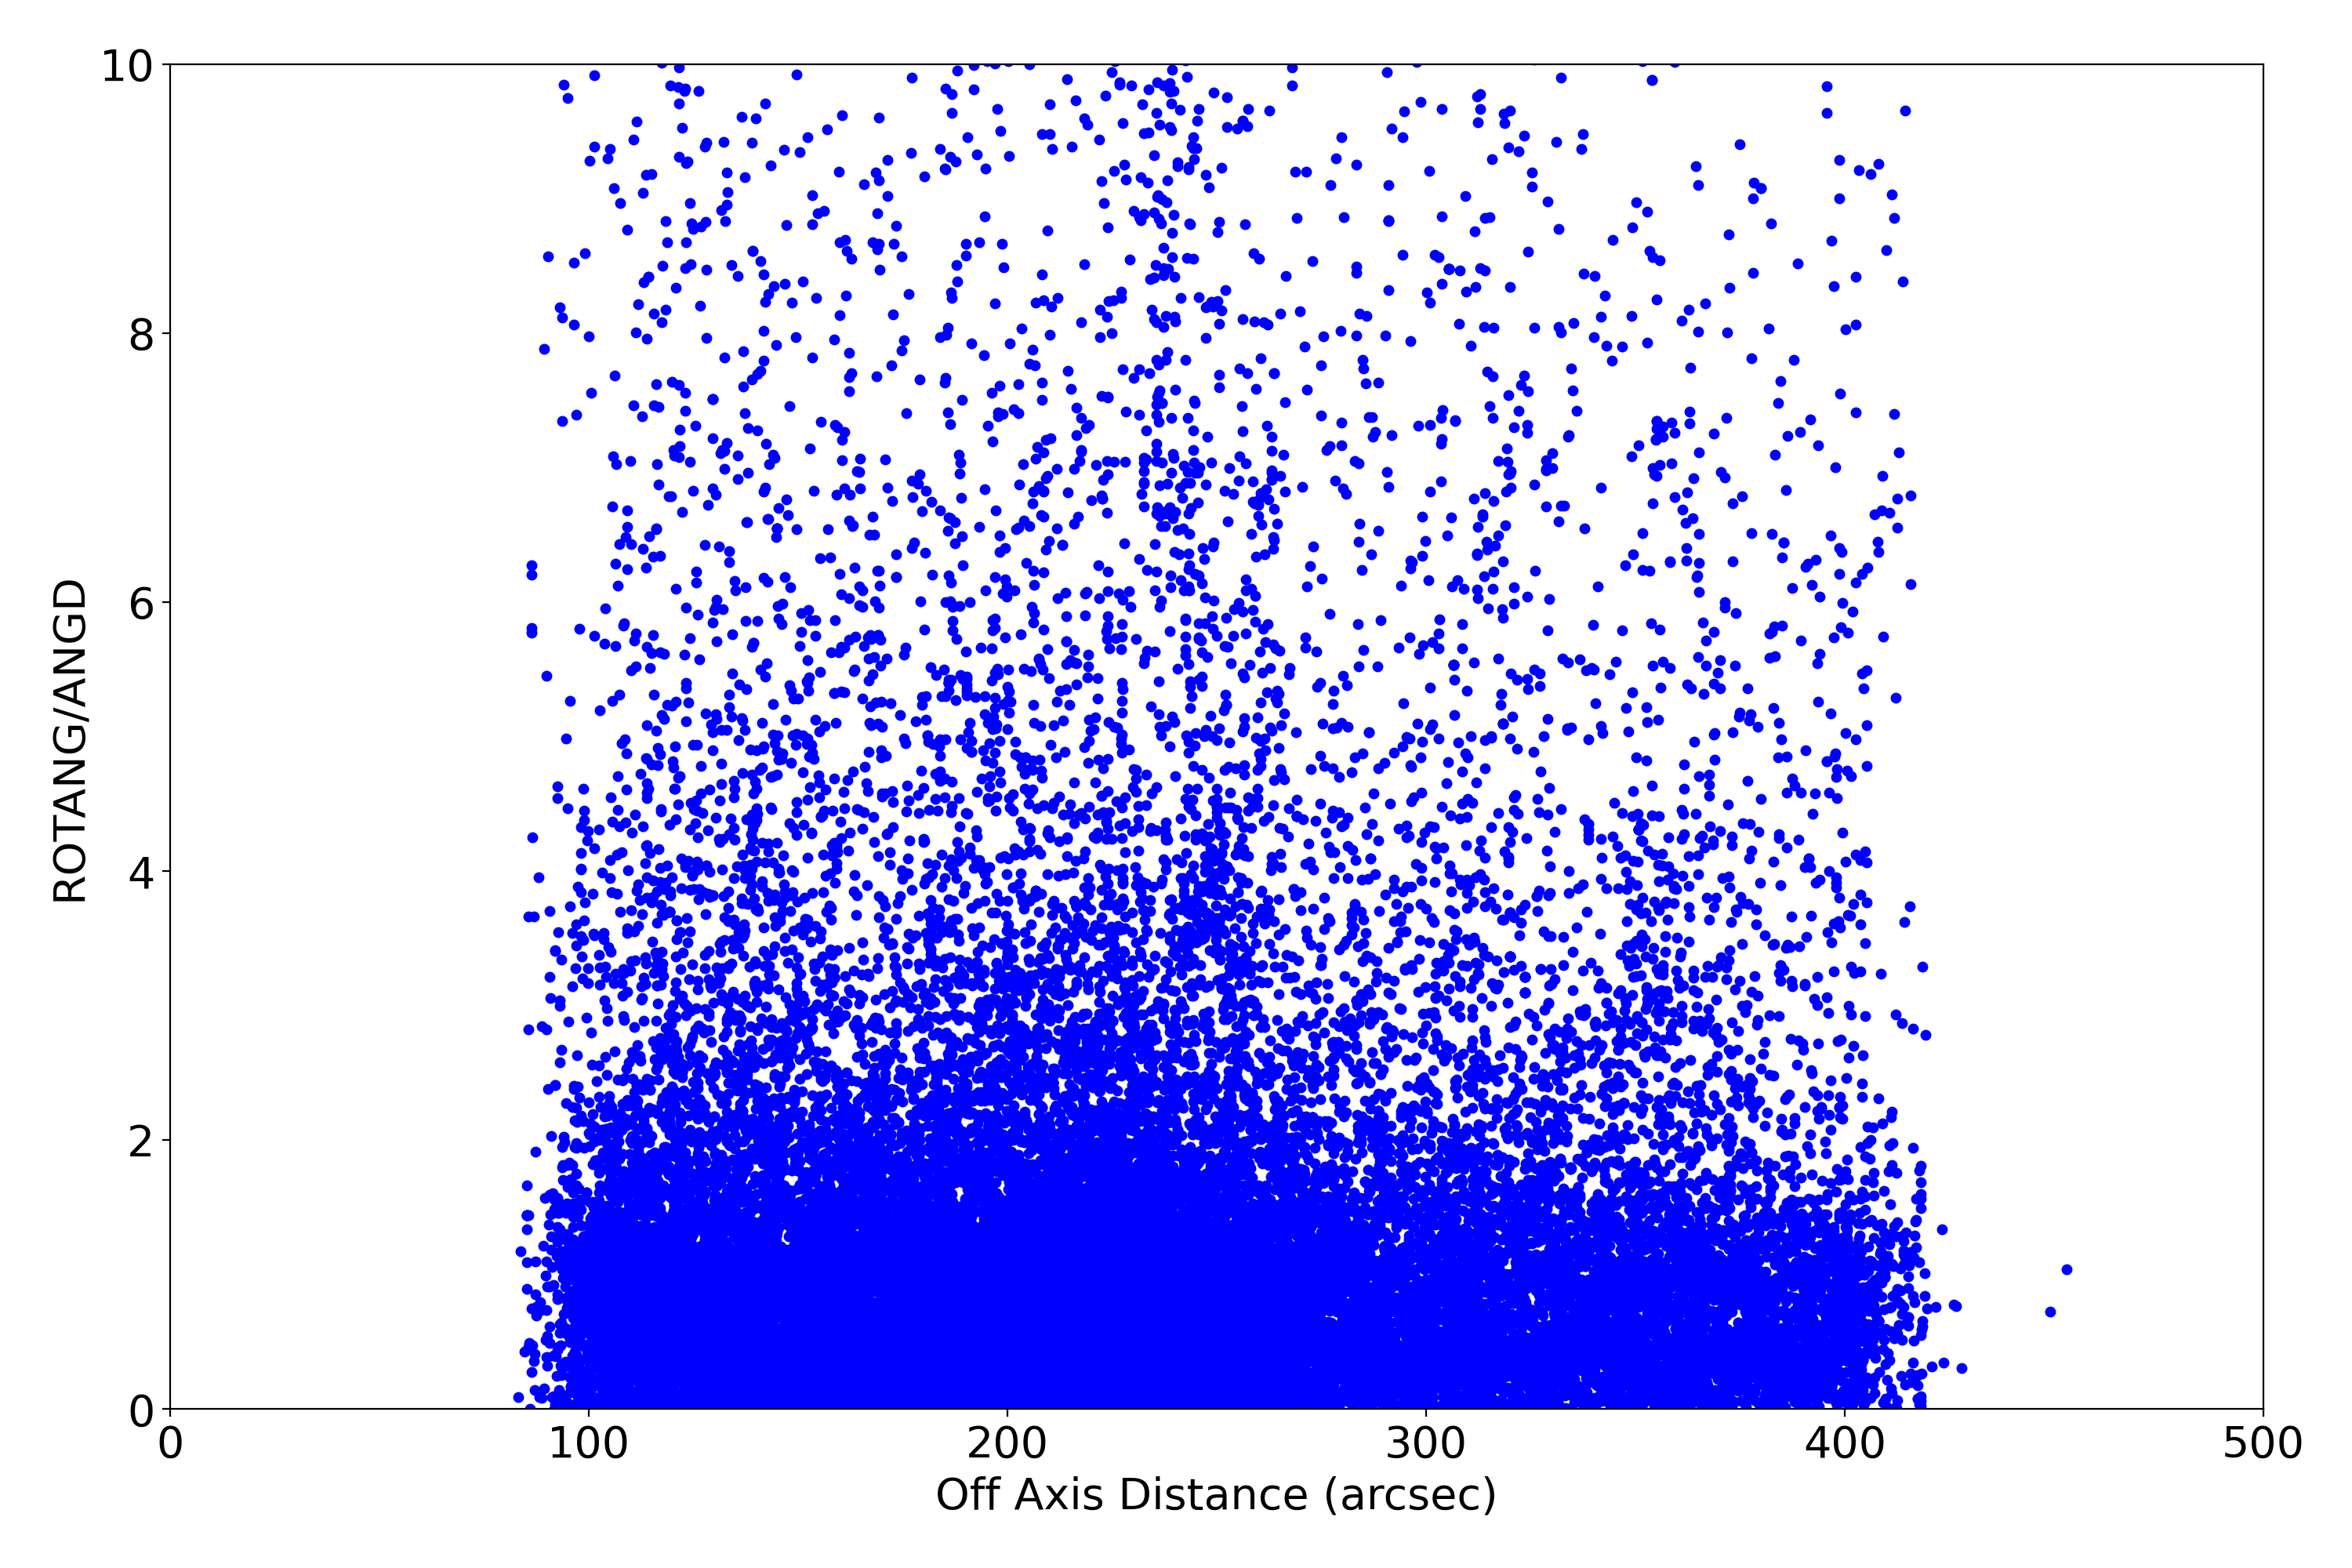
HRMA Focus
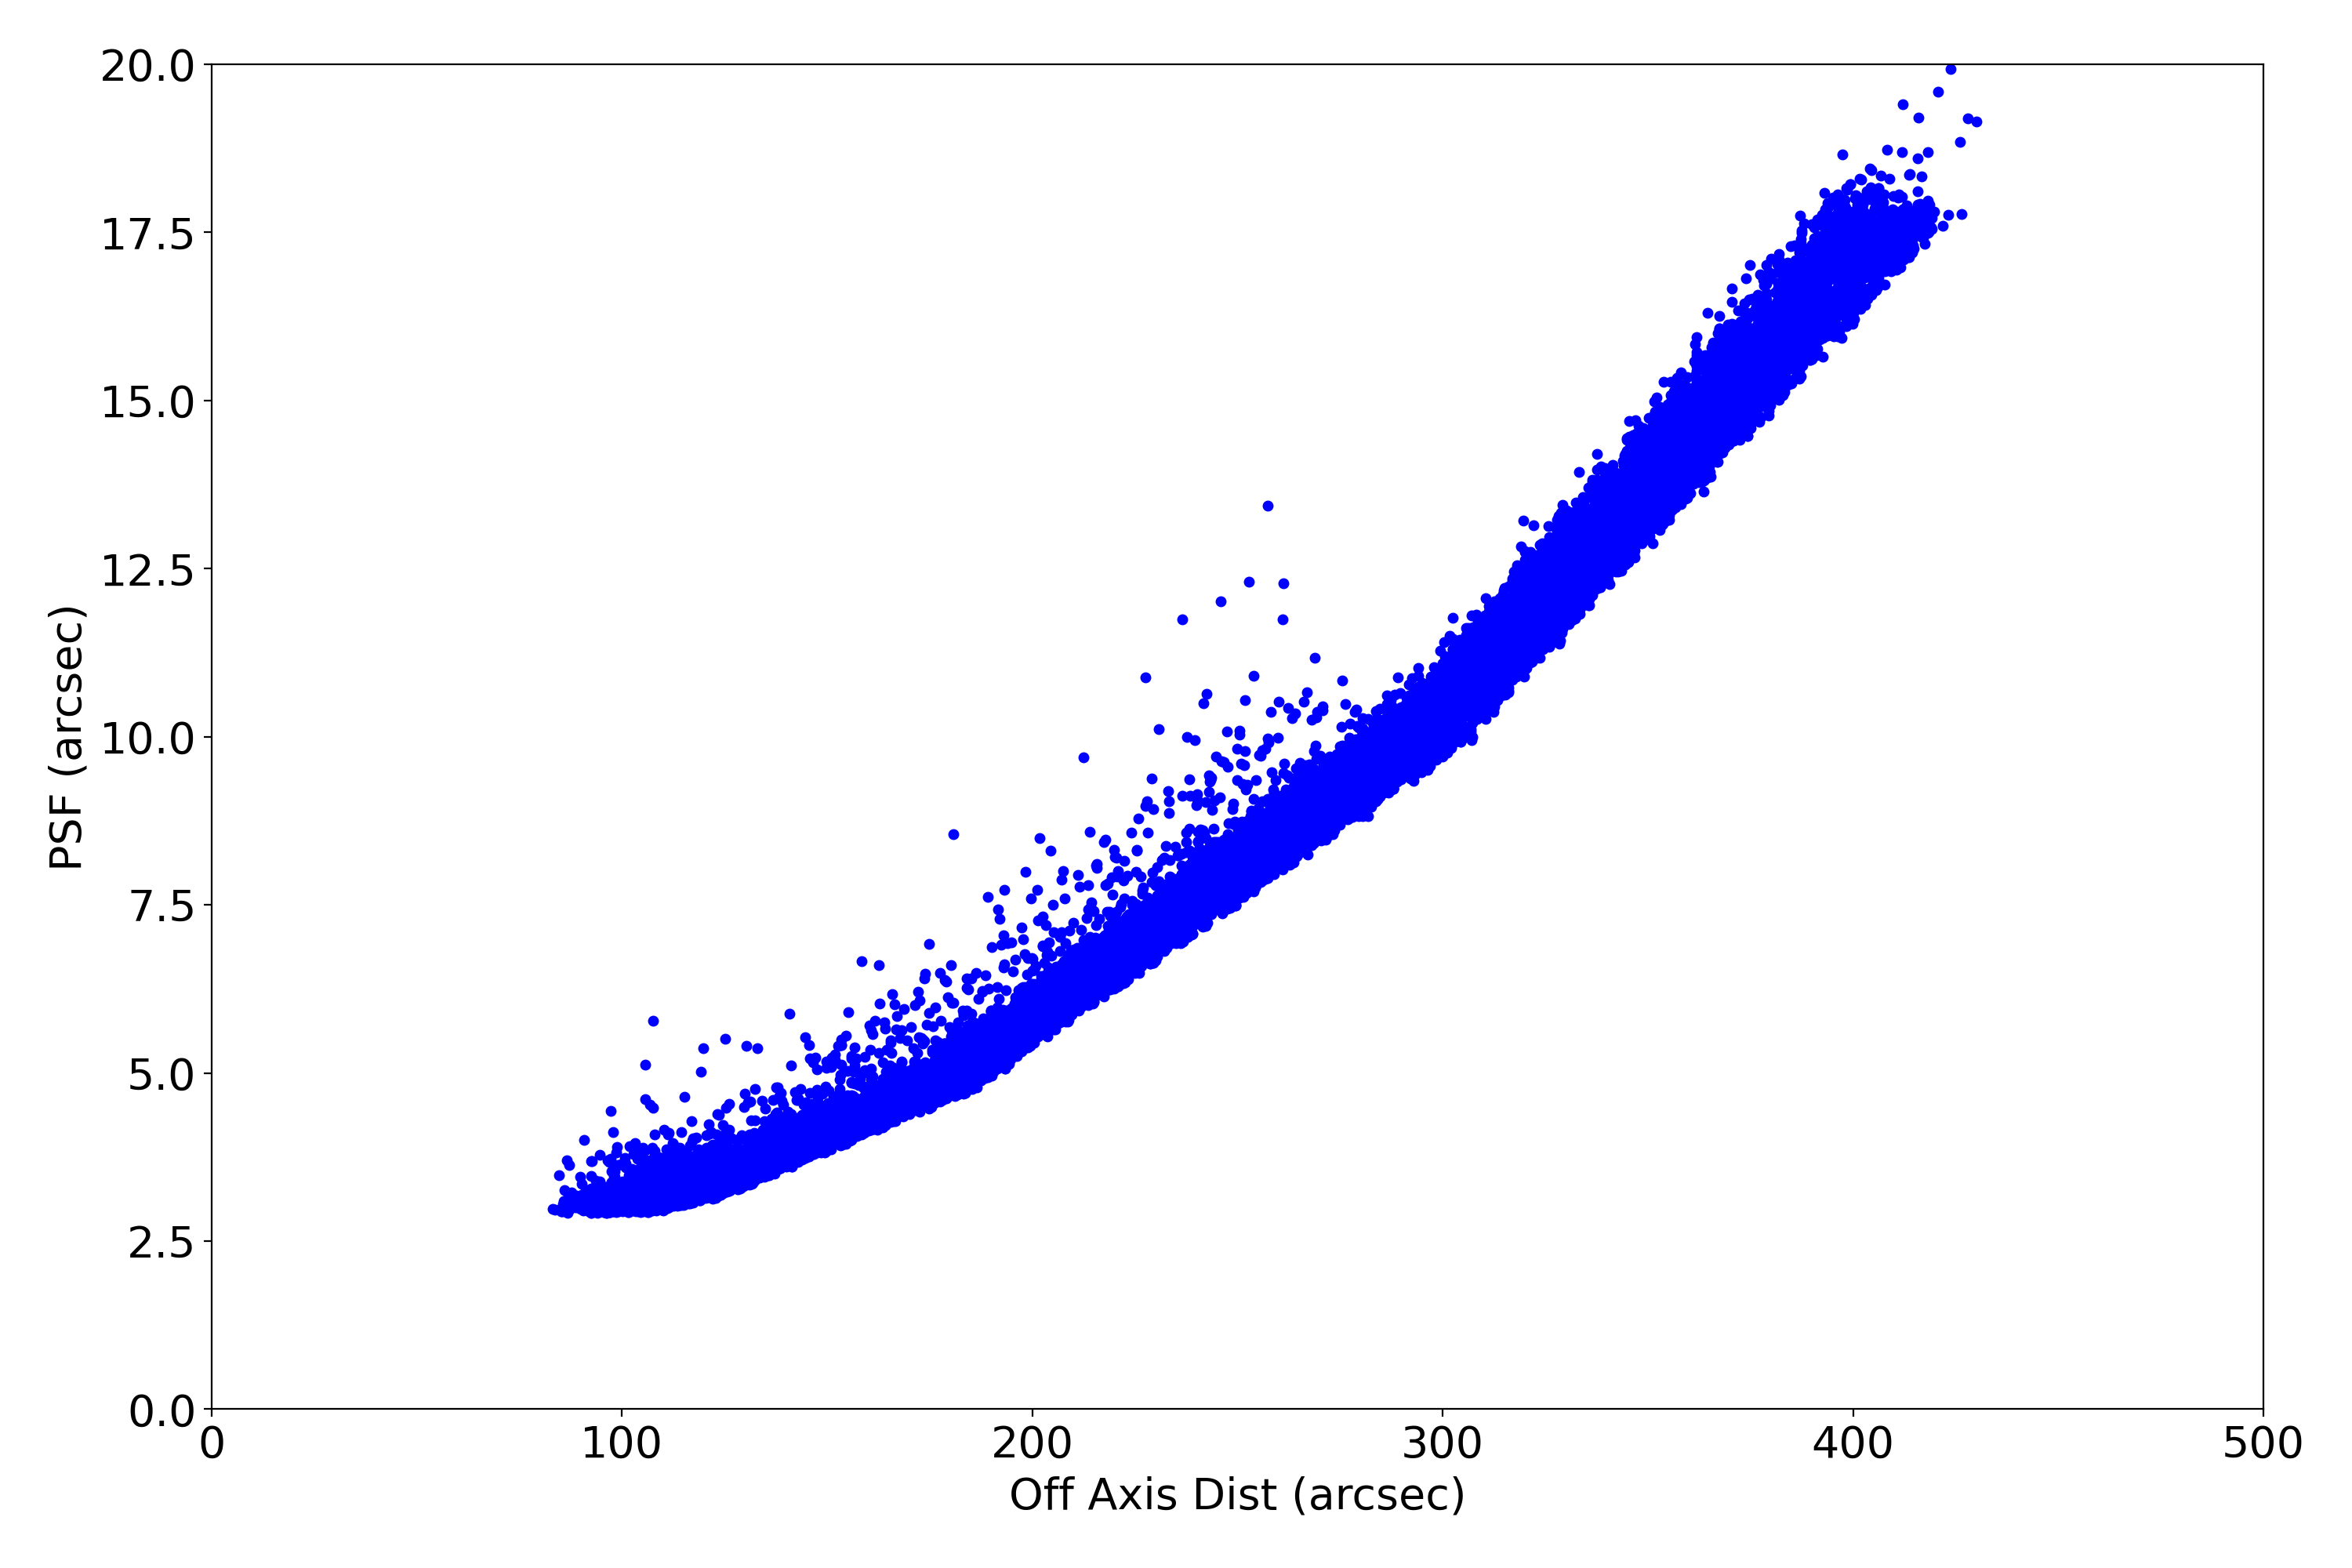
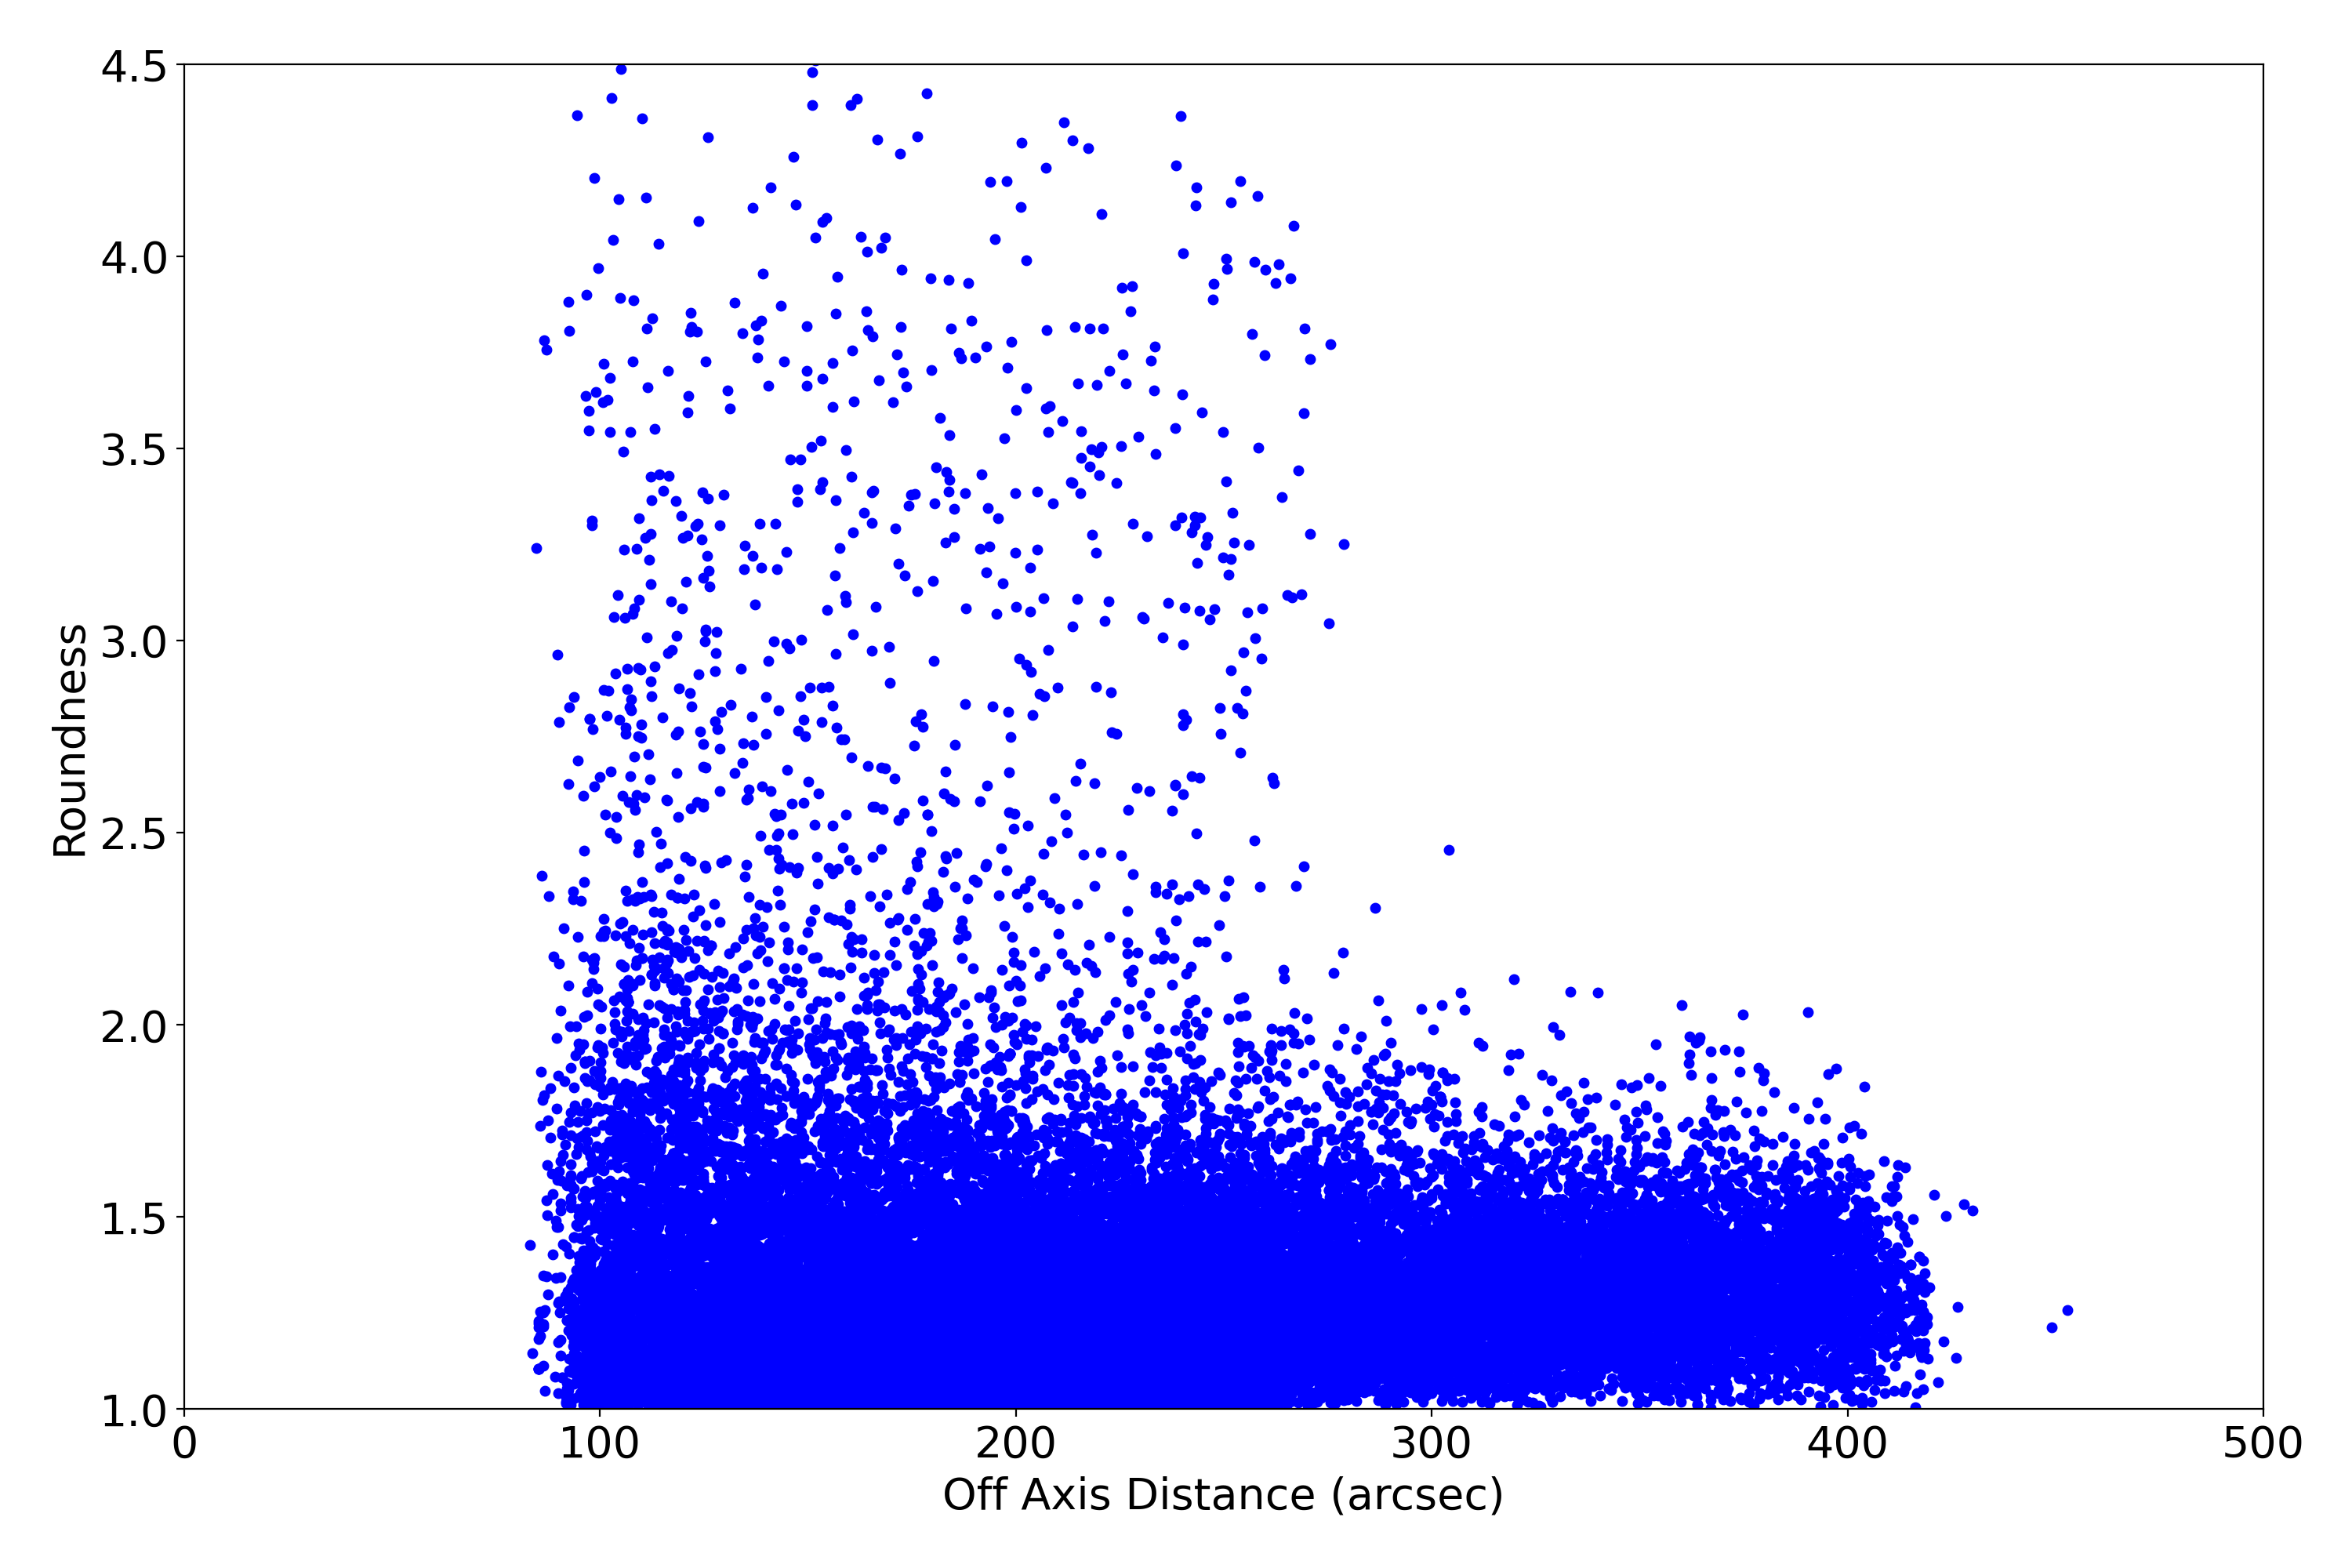
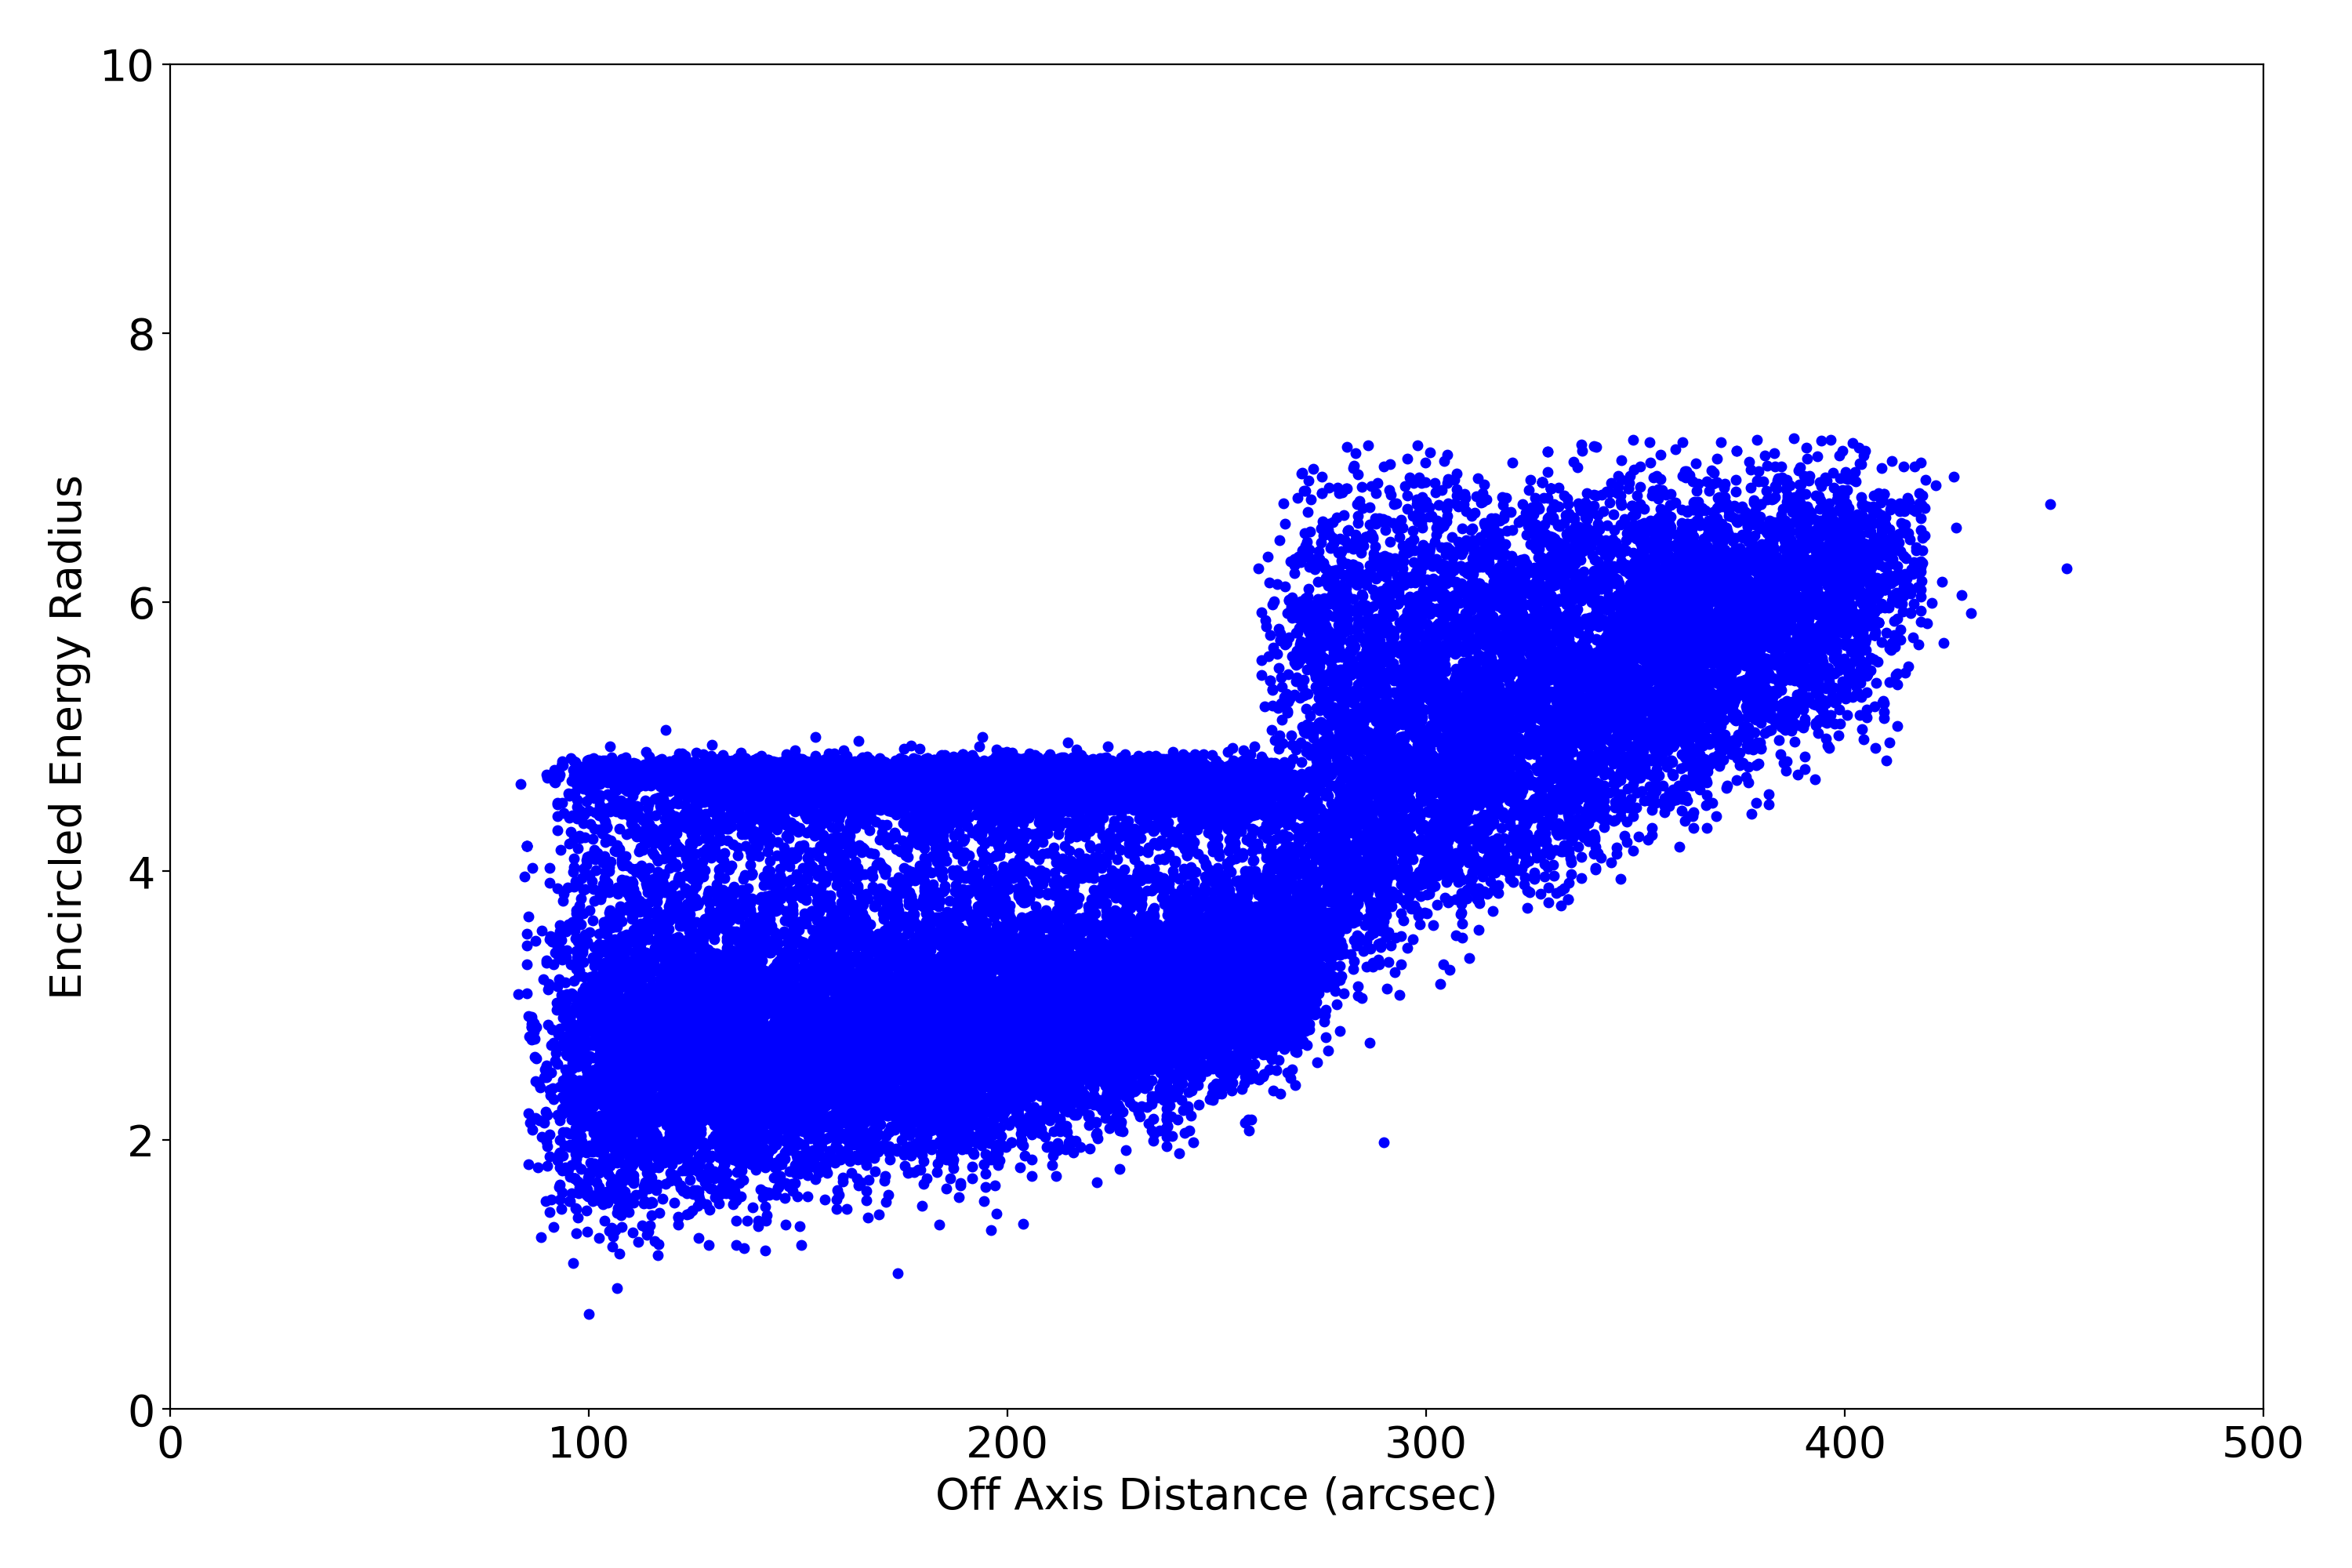
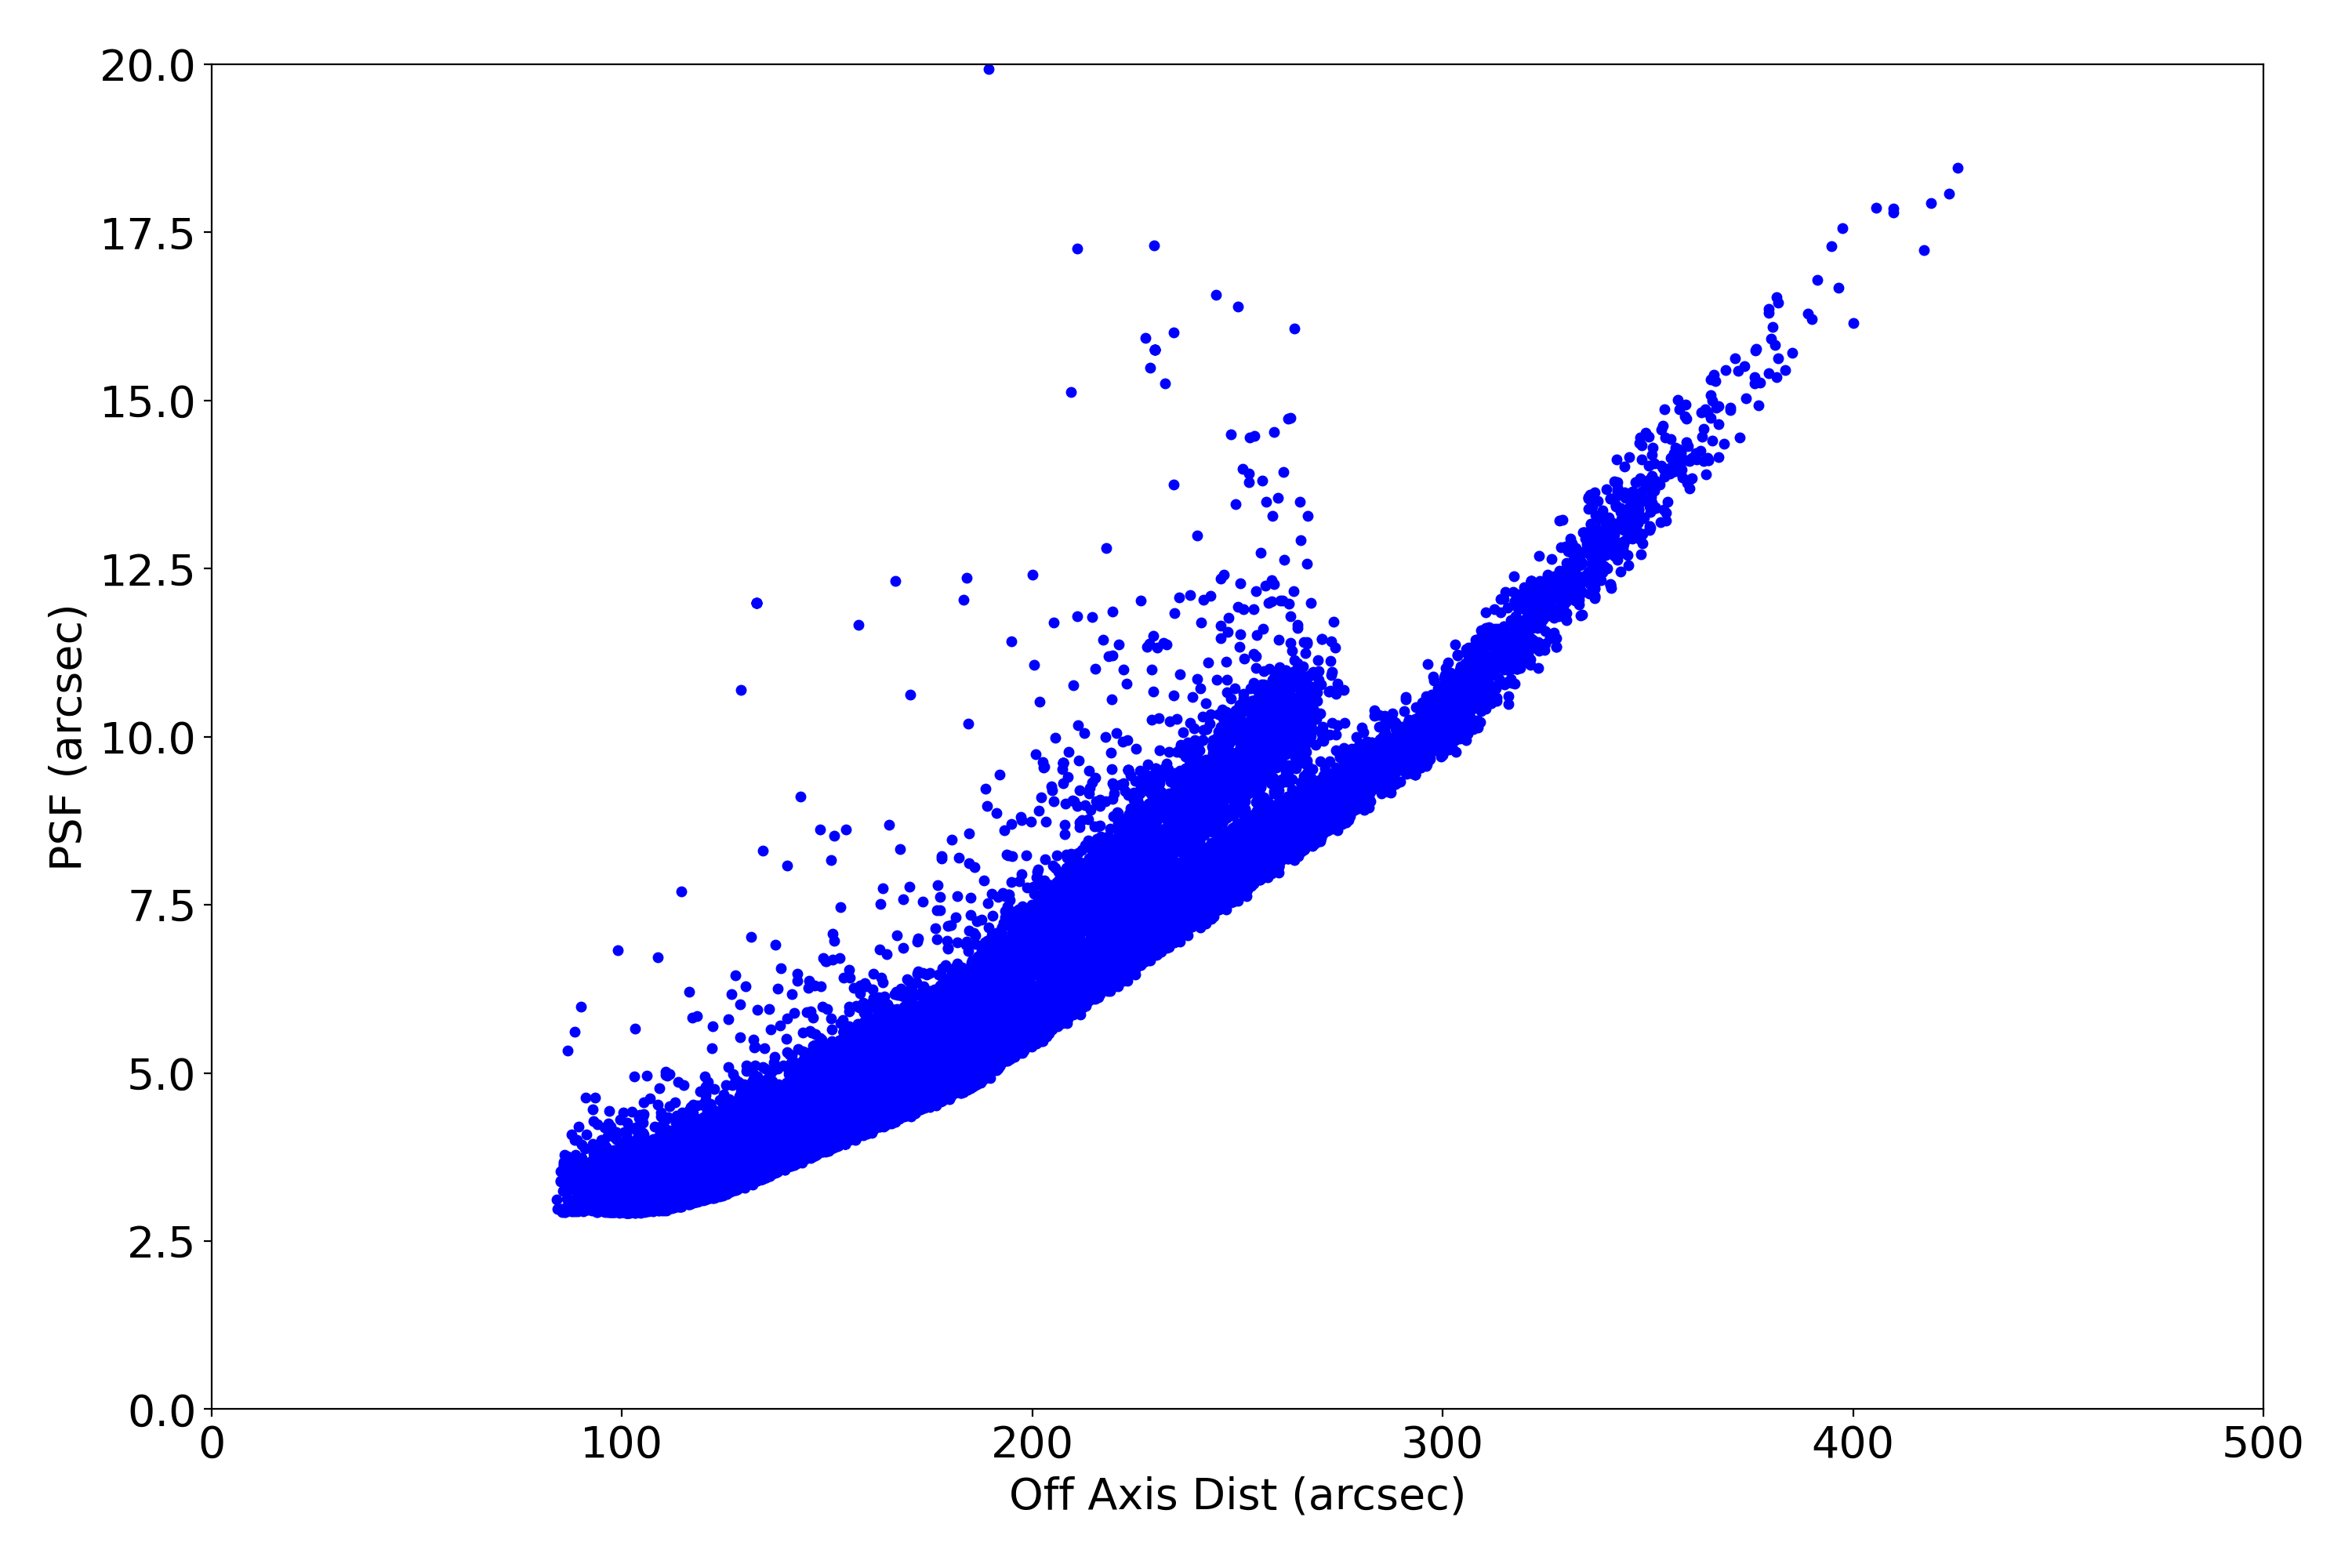
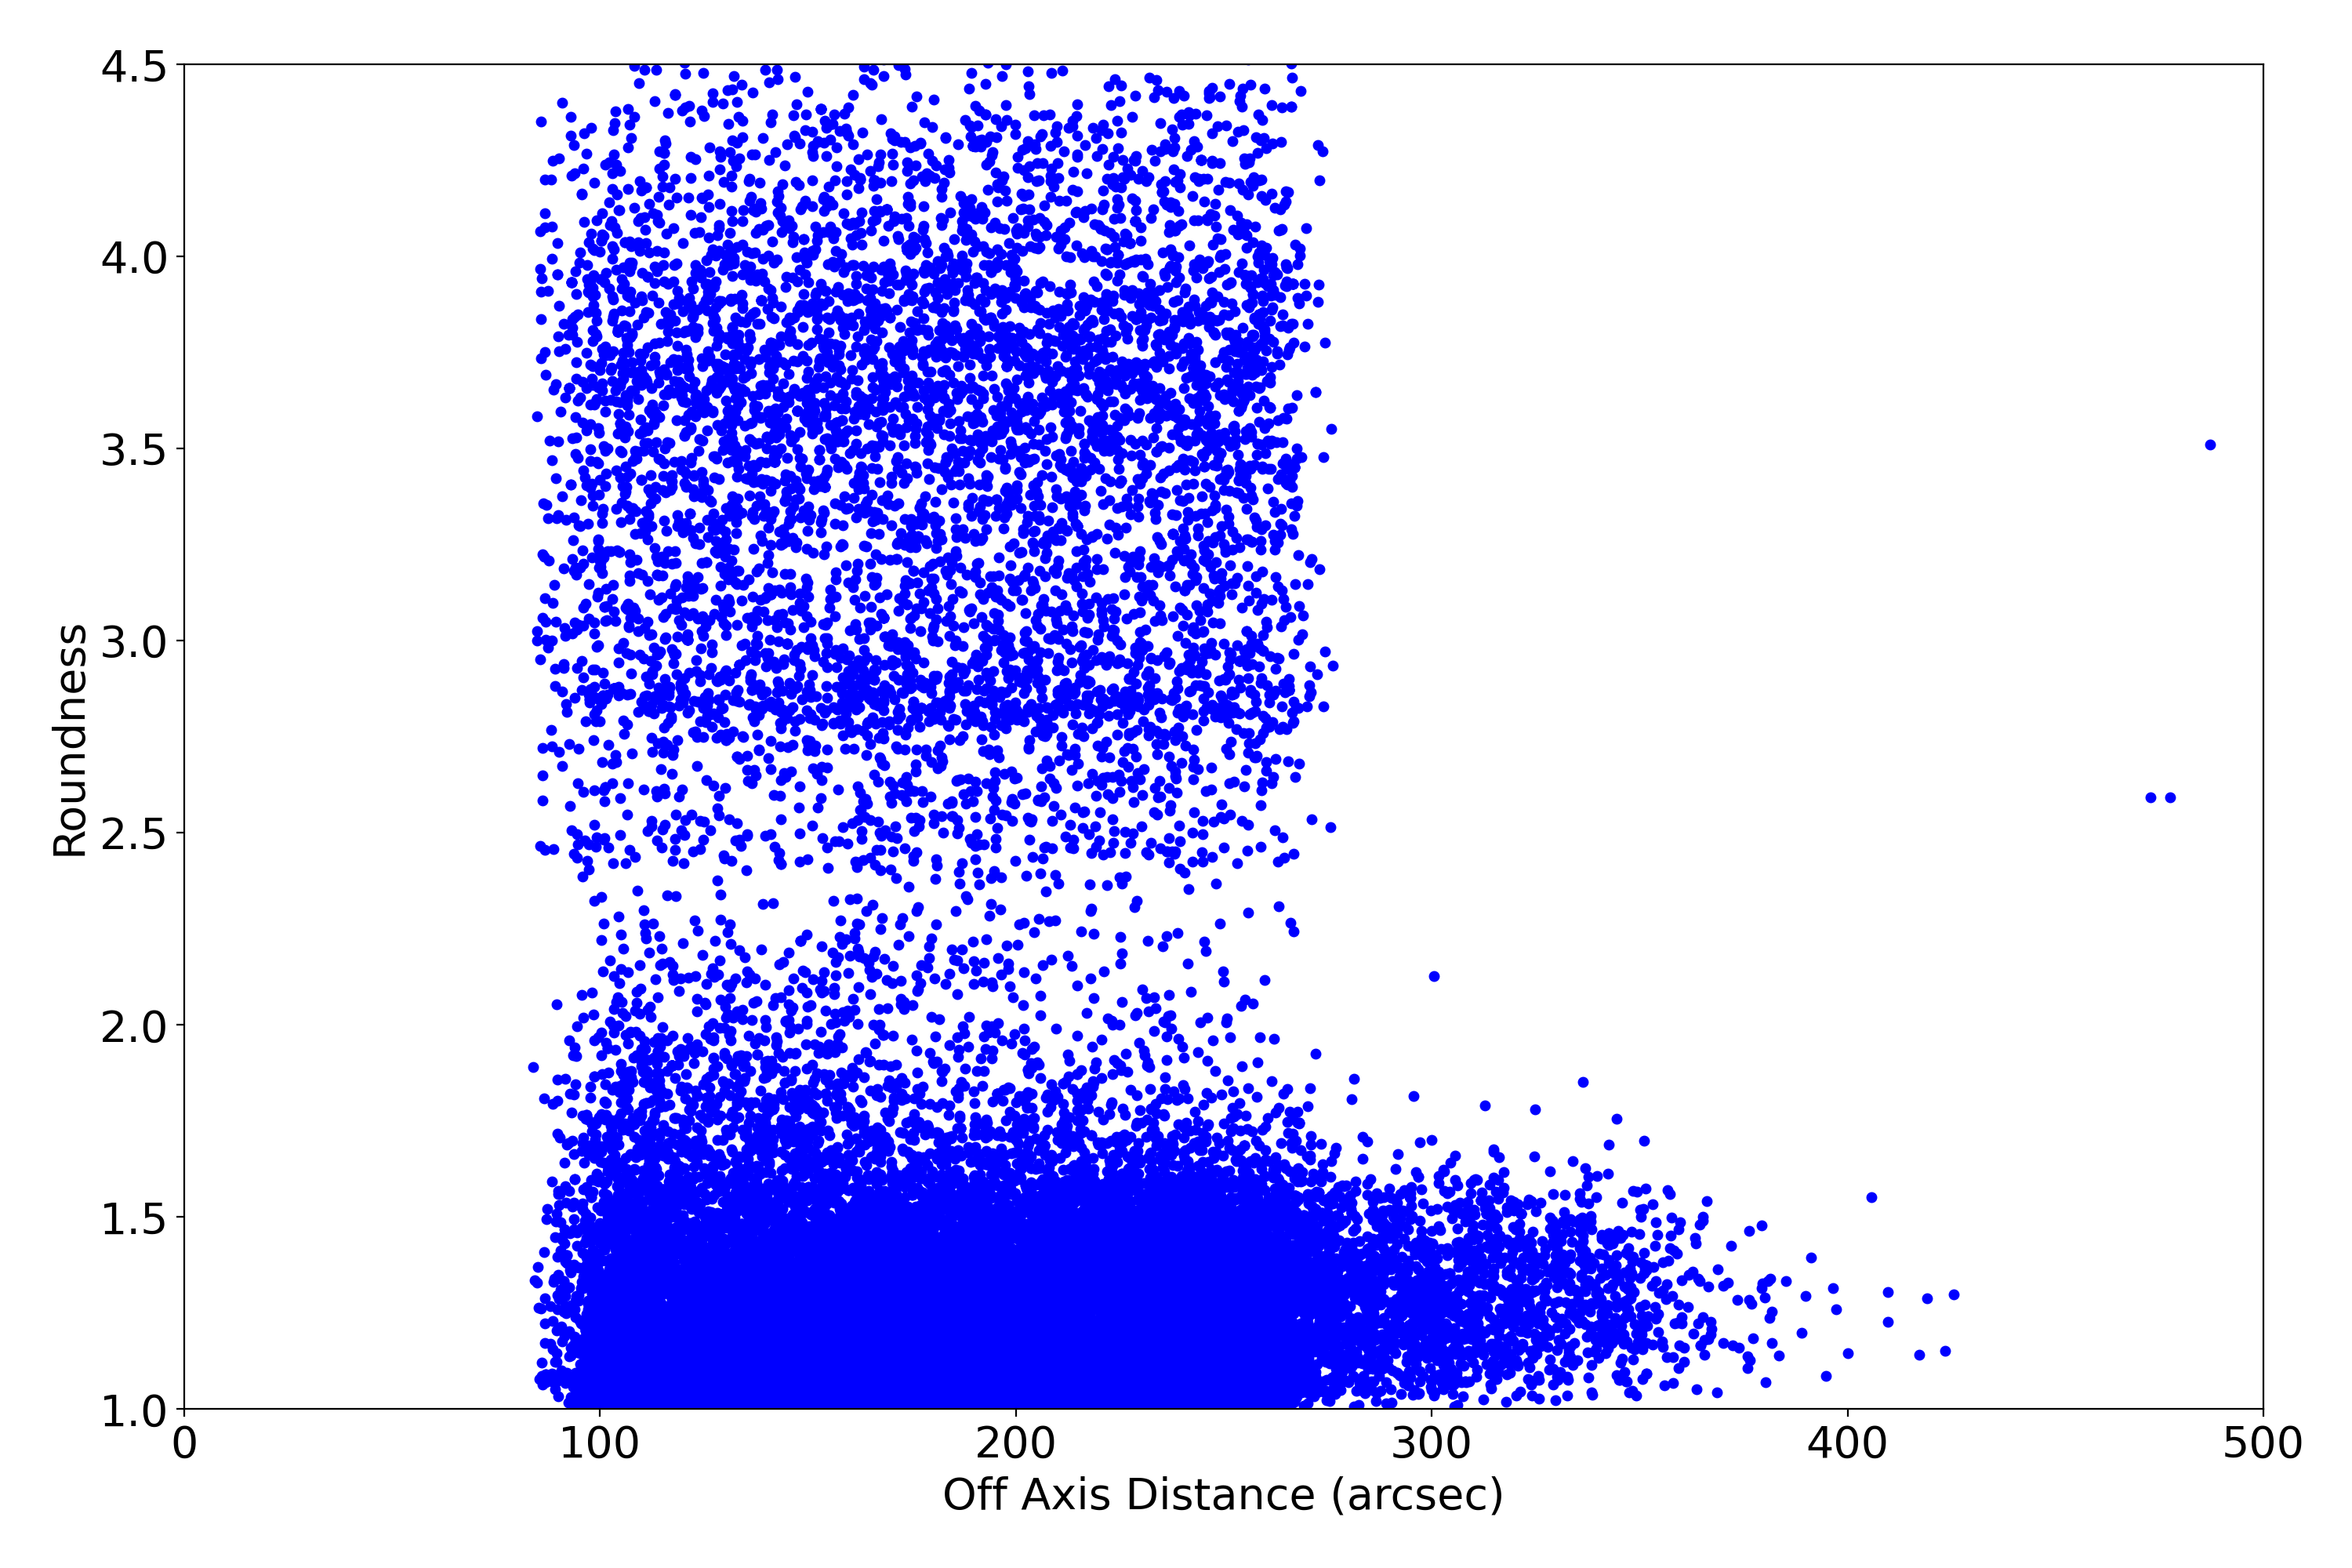
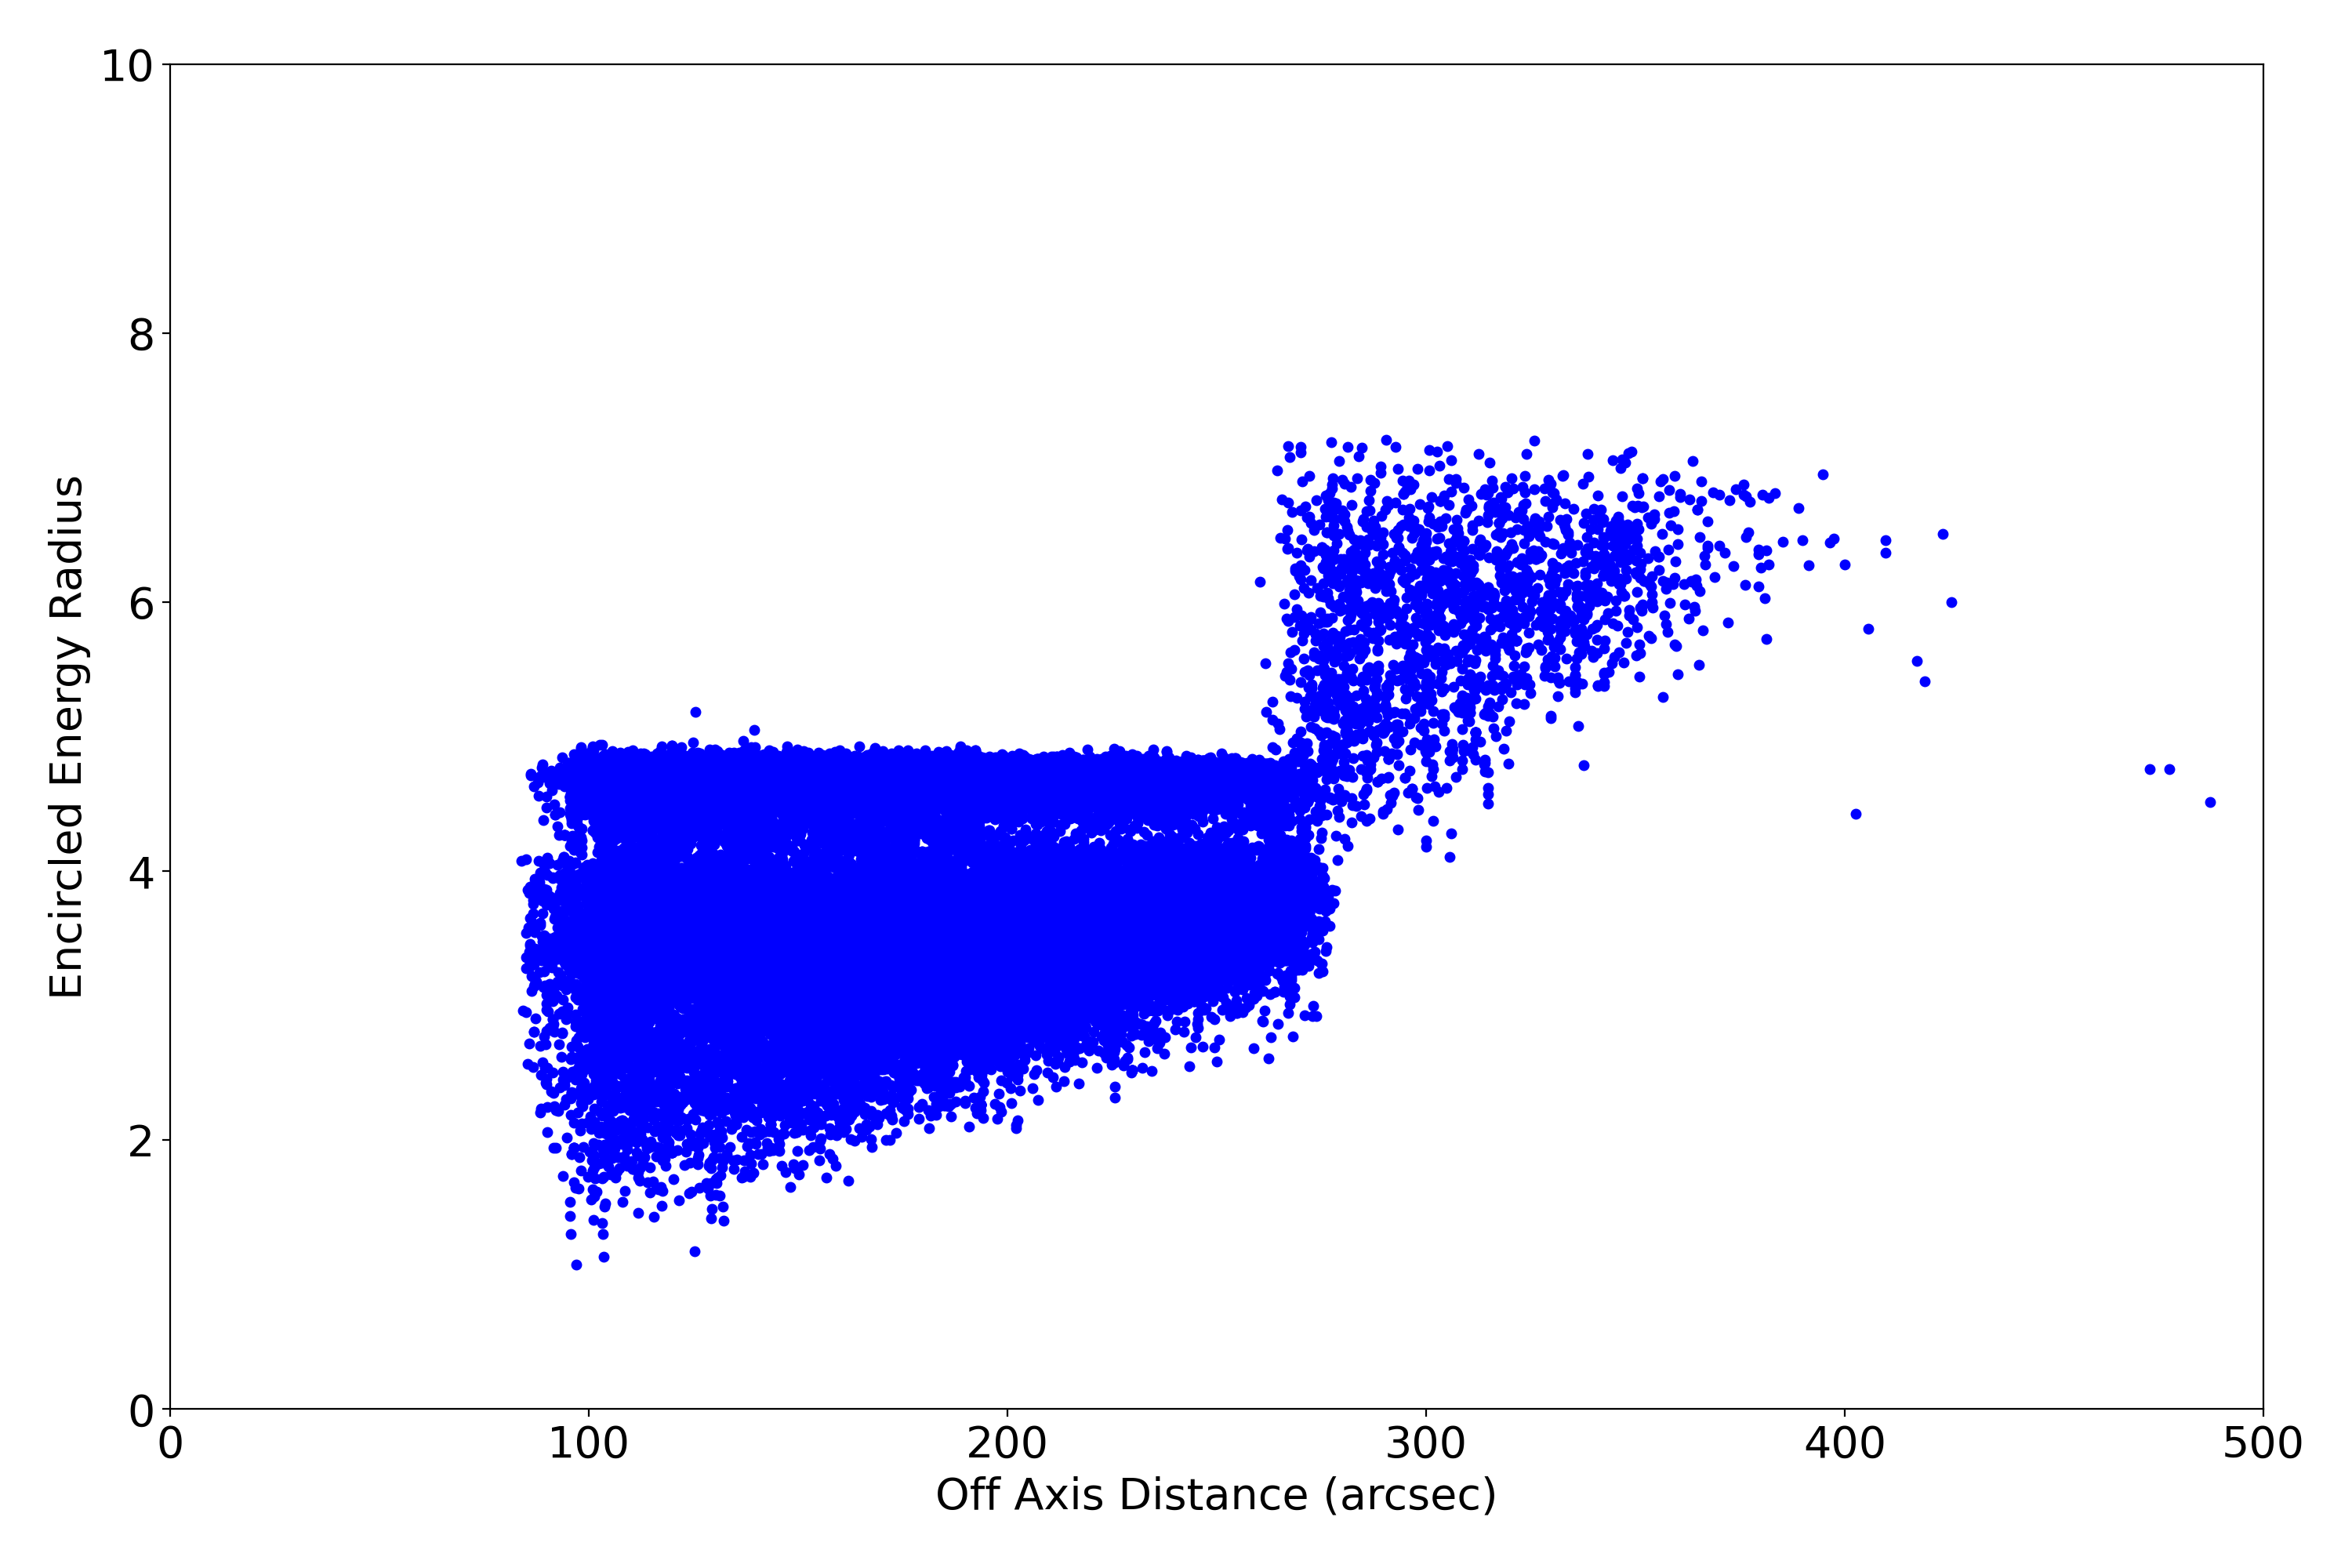
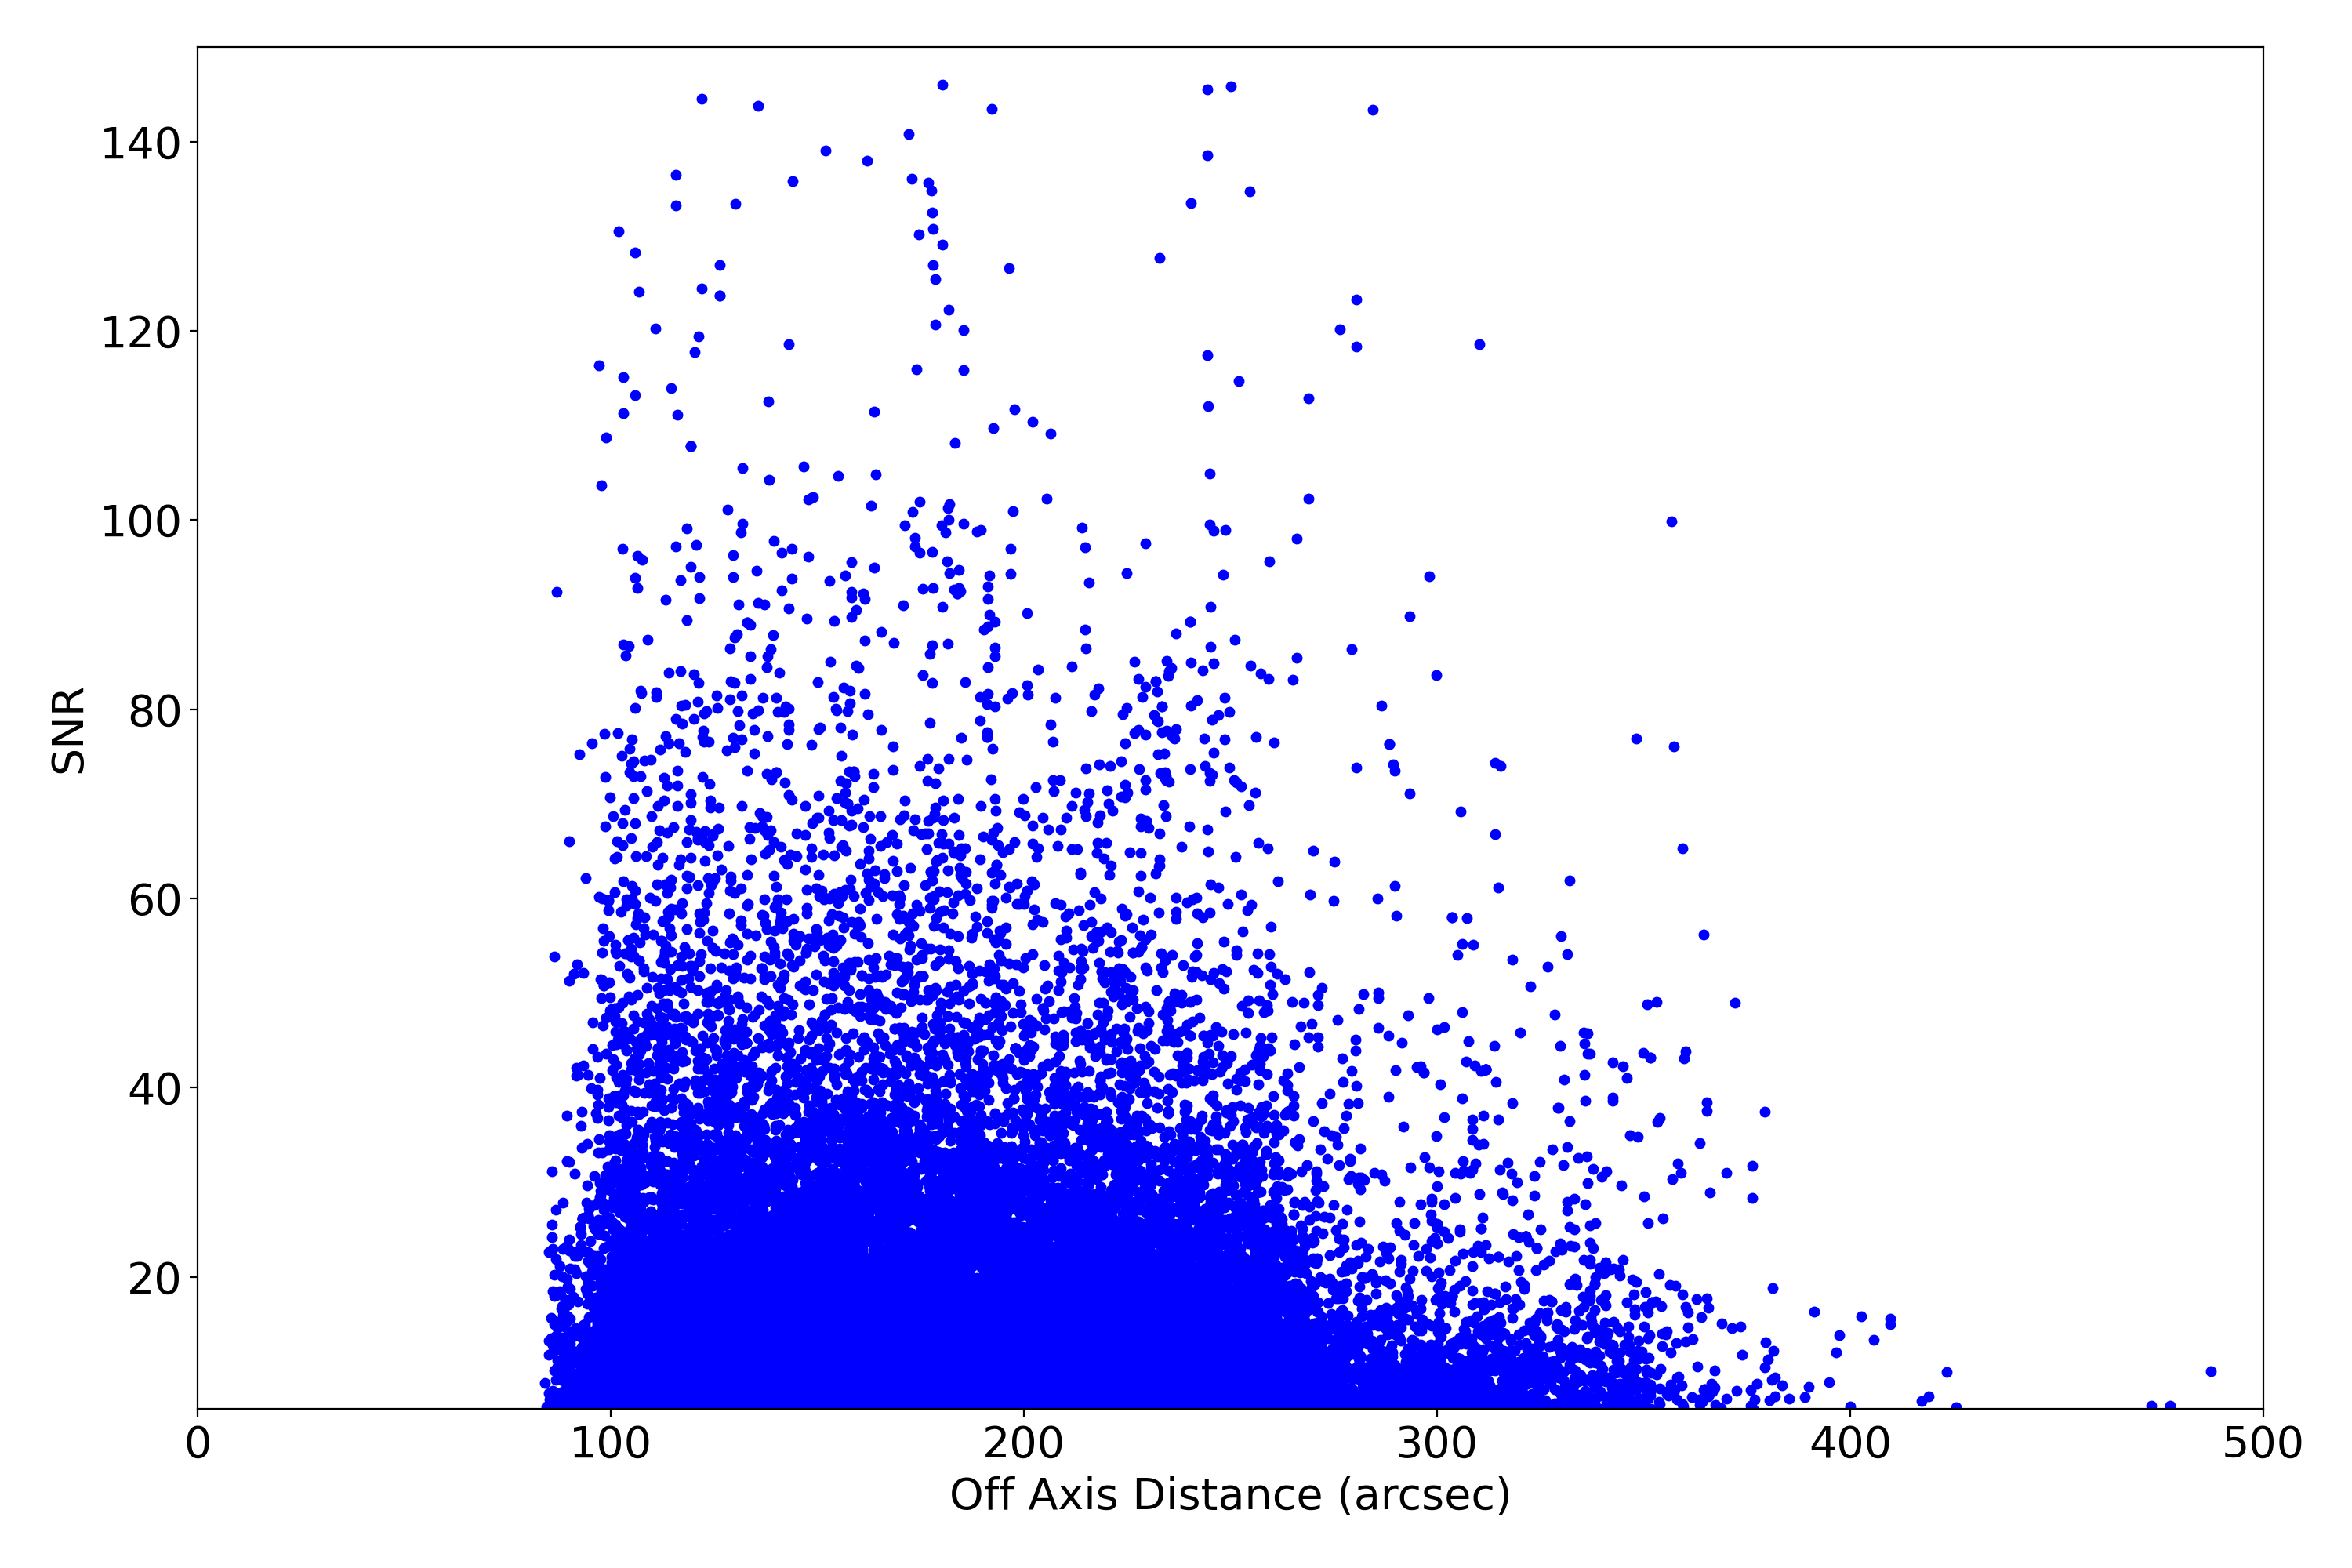
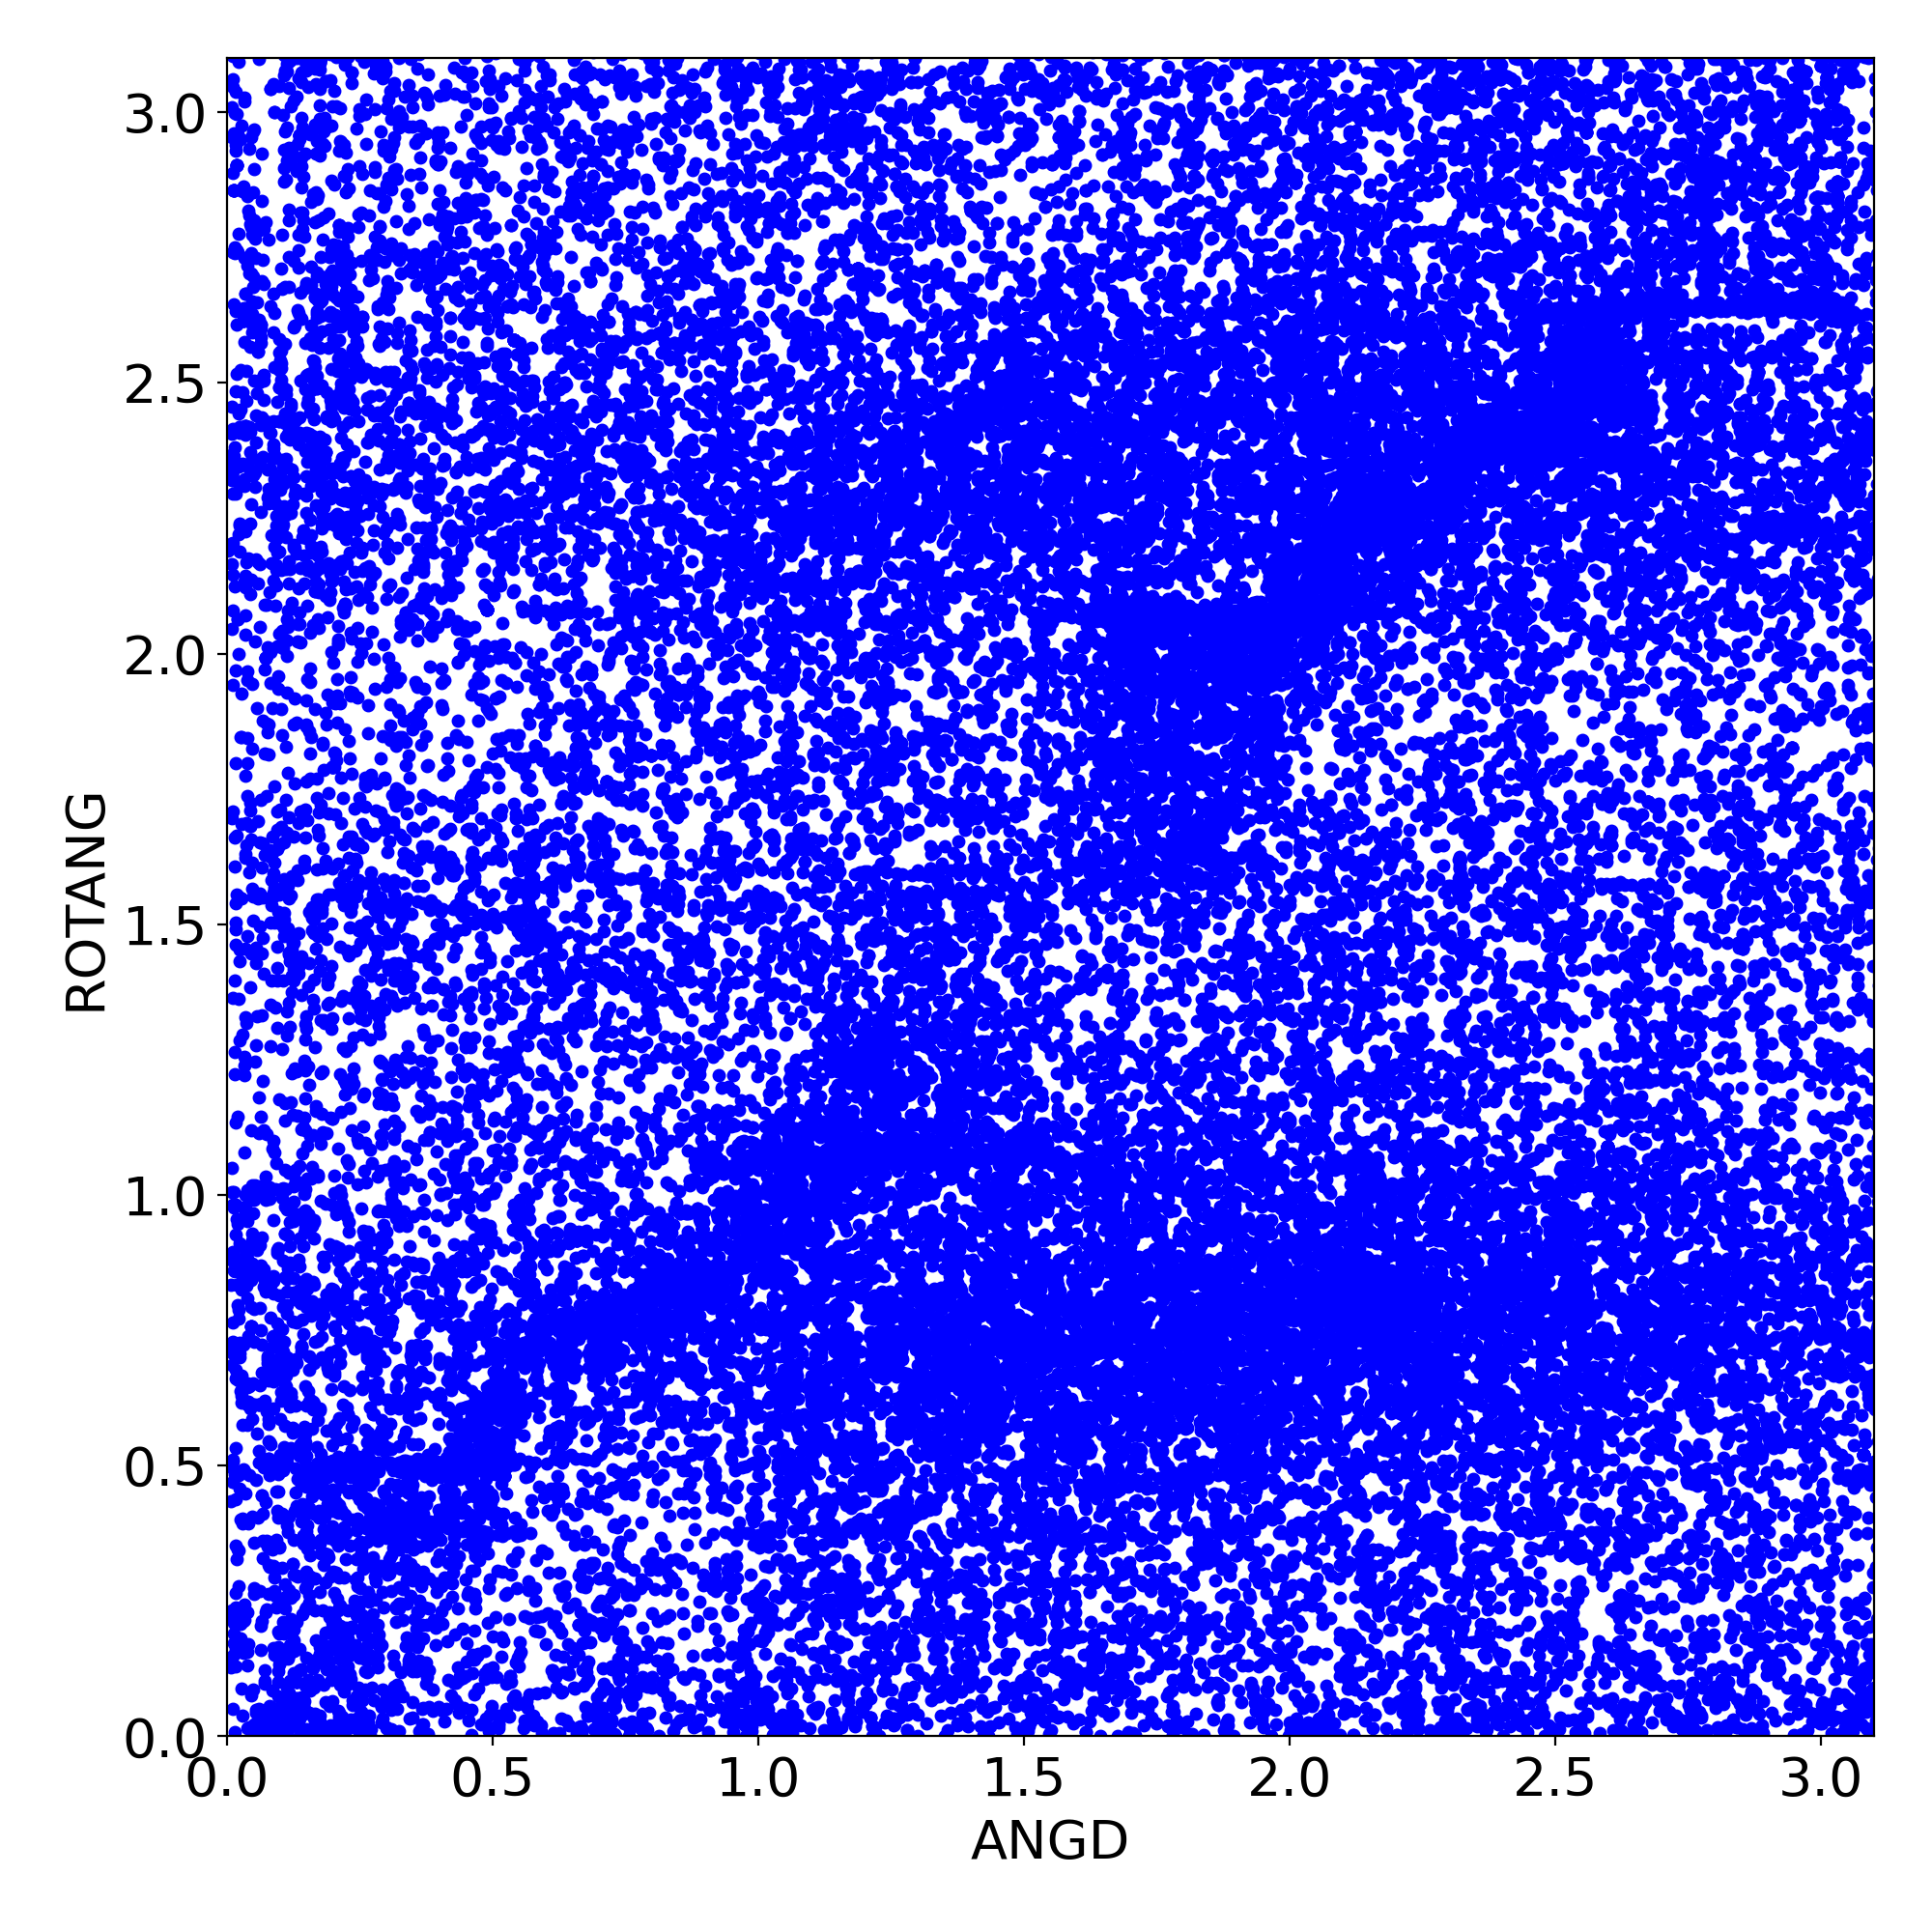
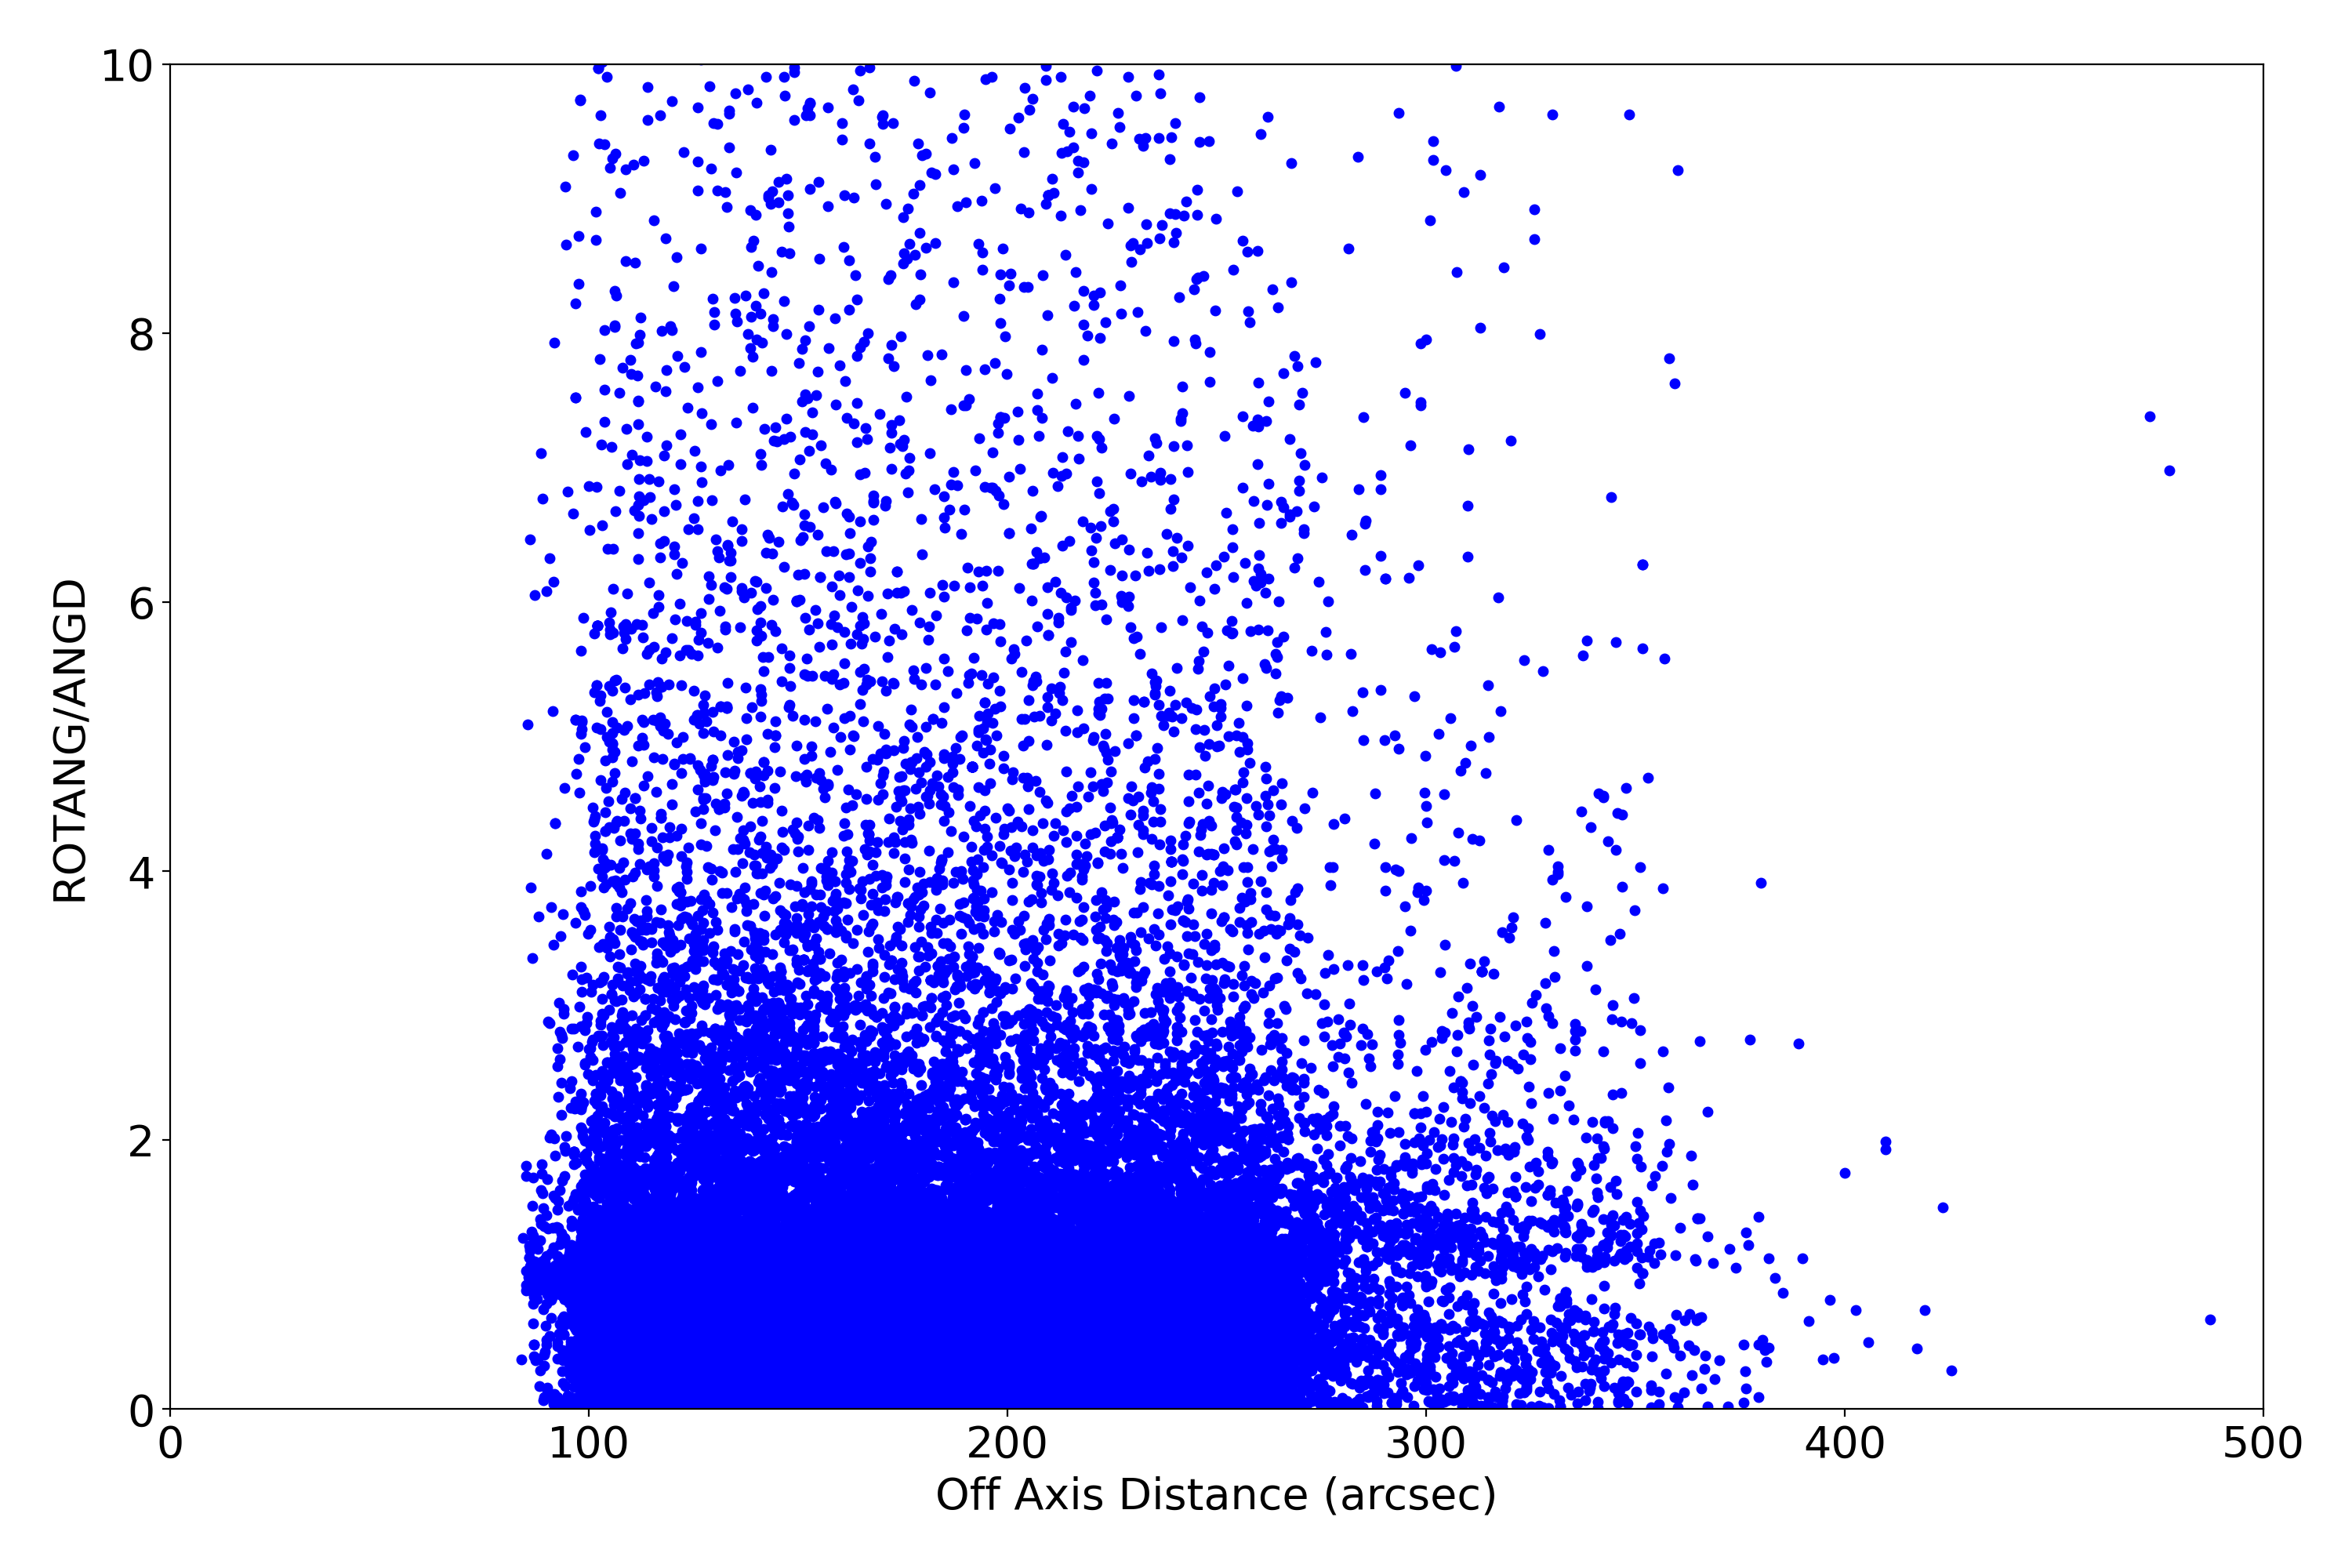
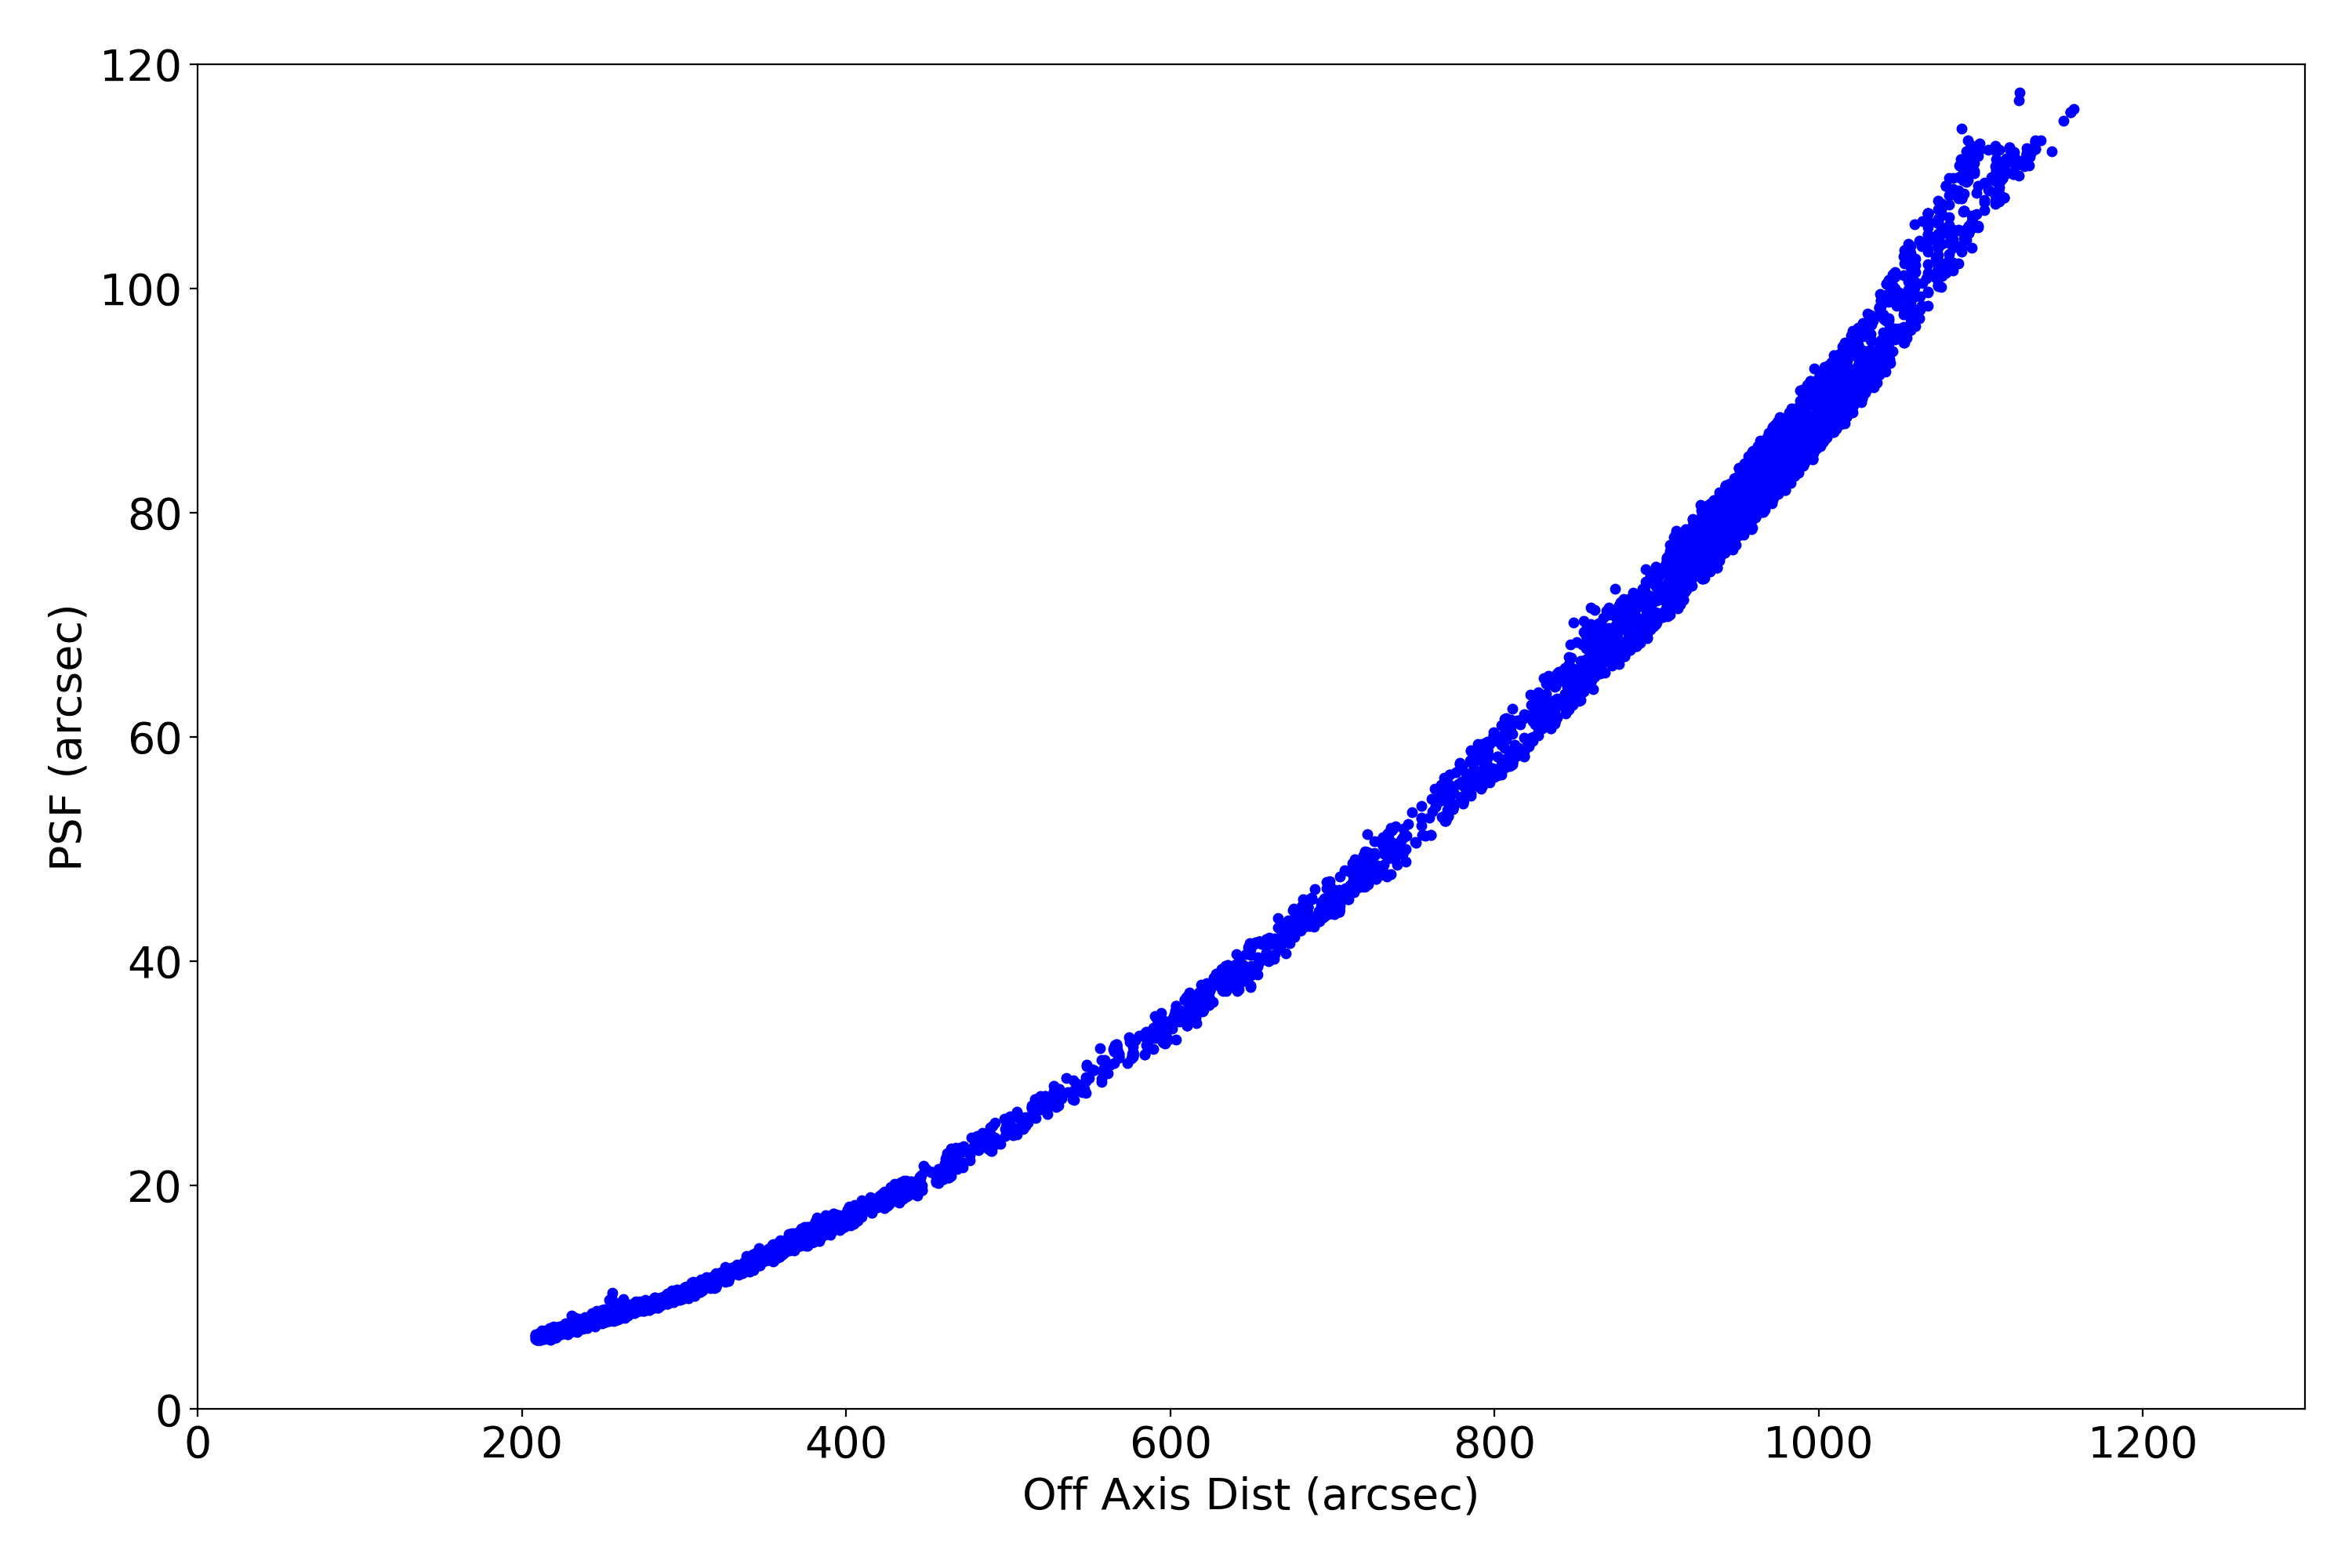
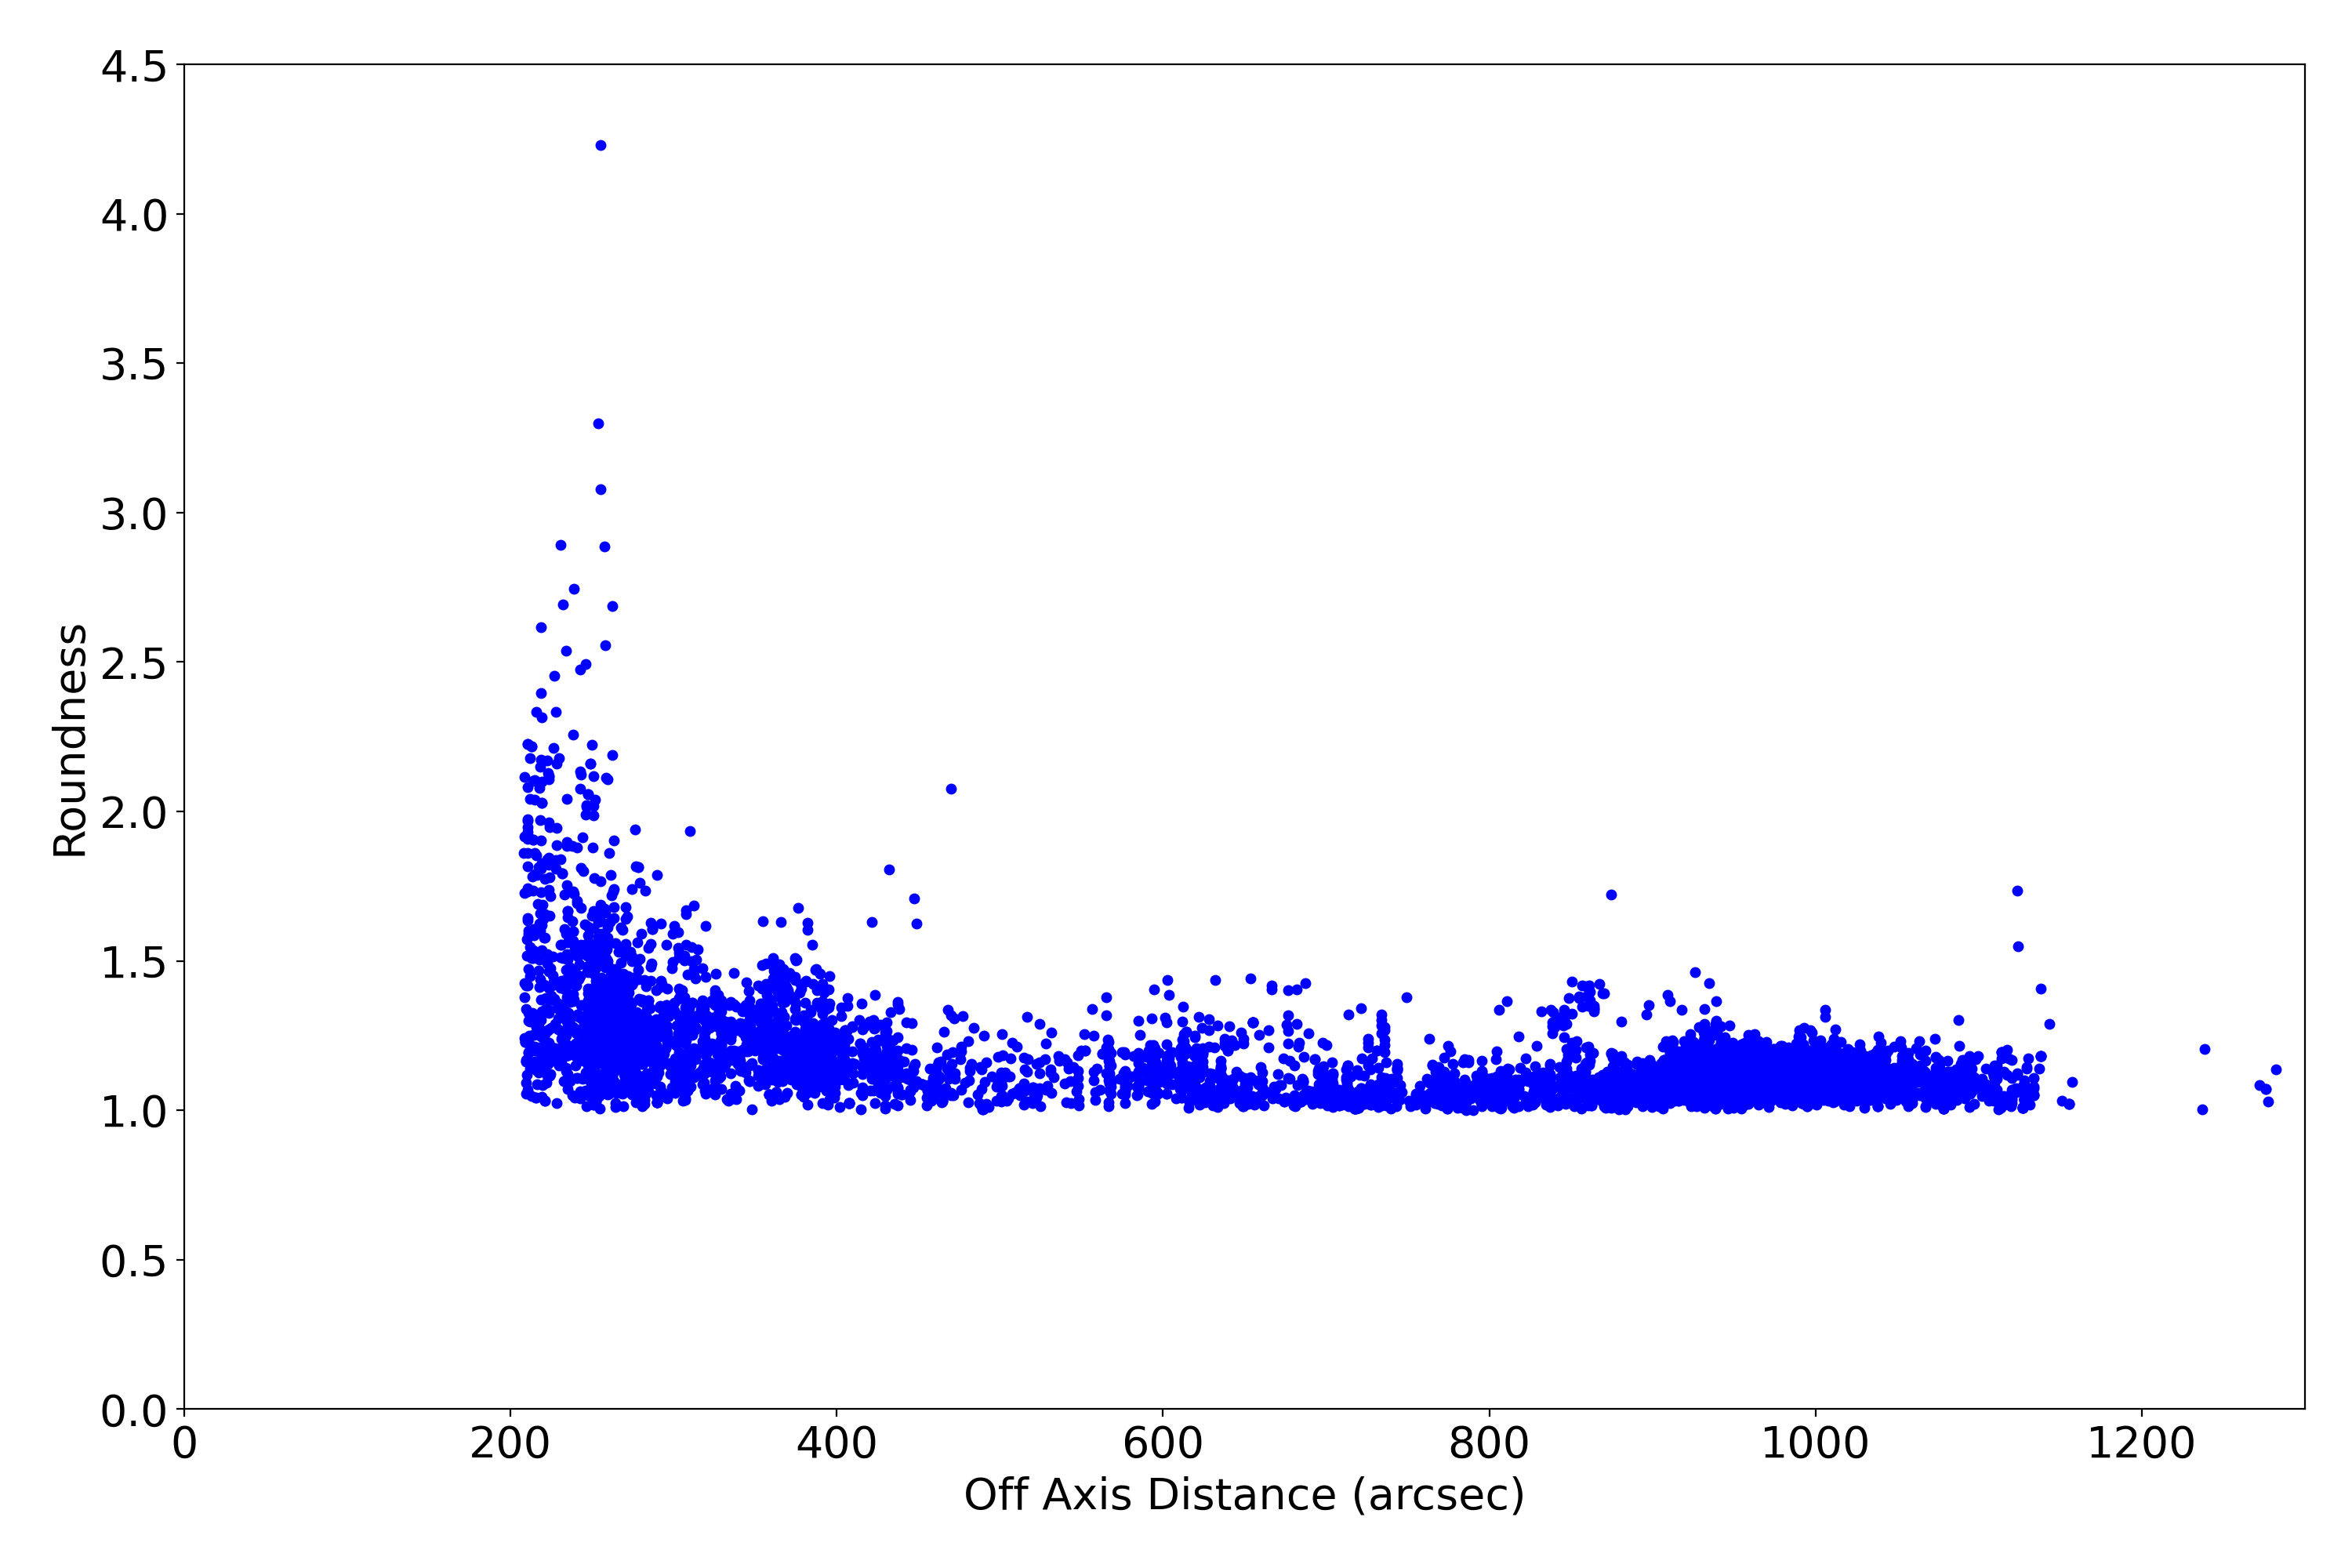
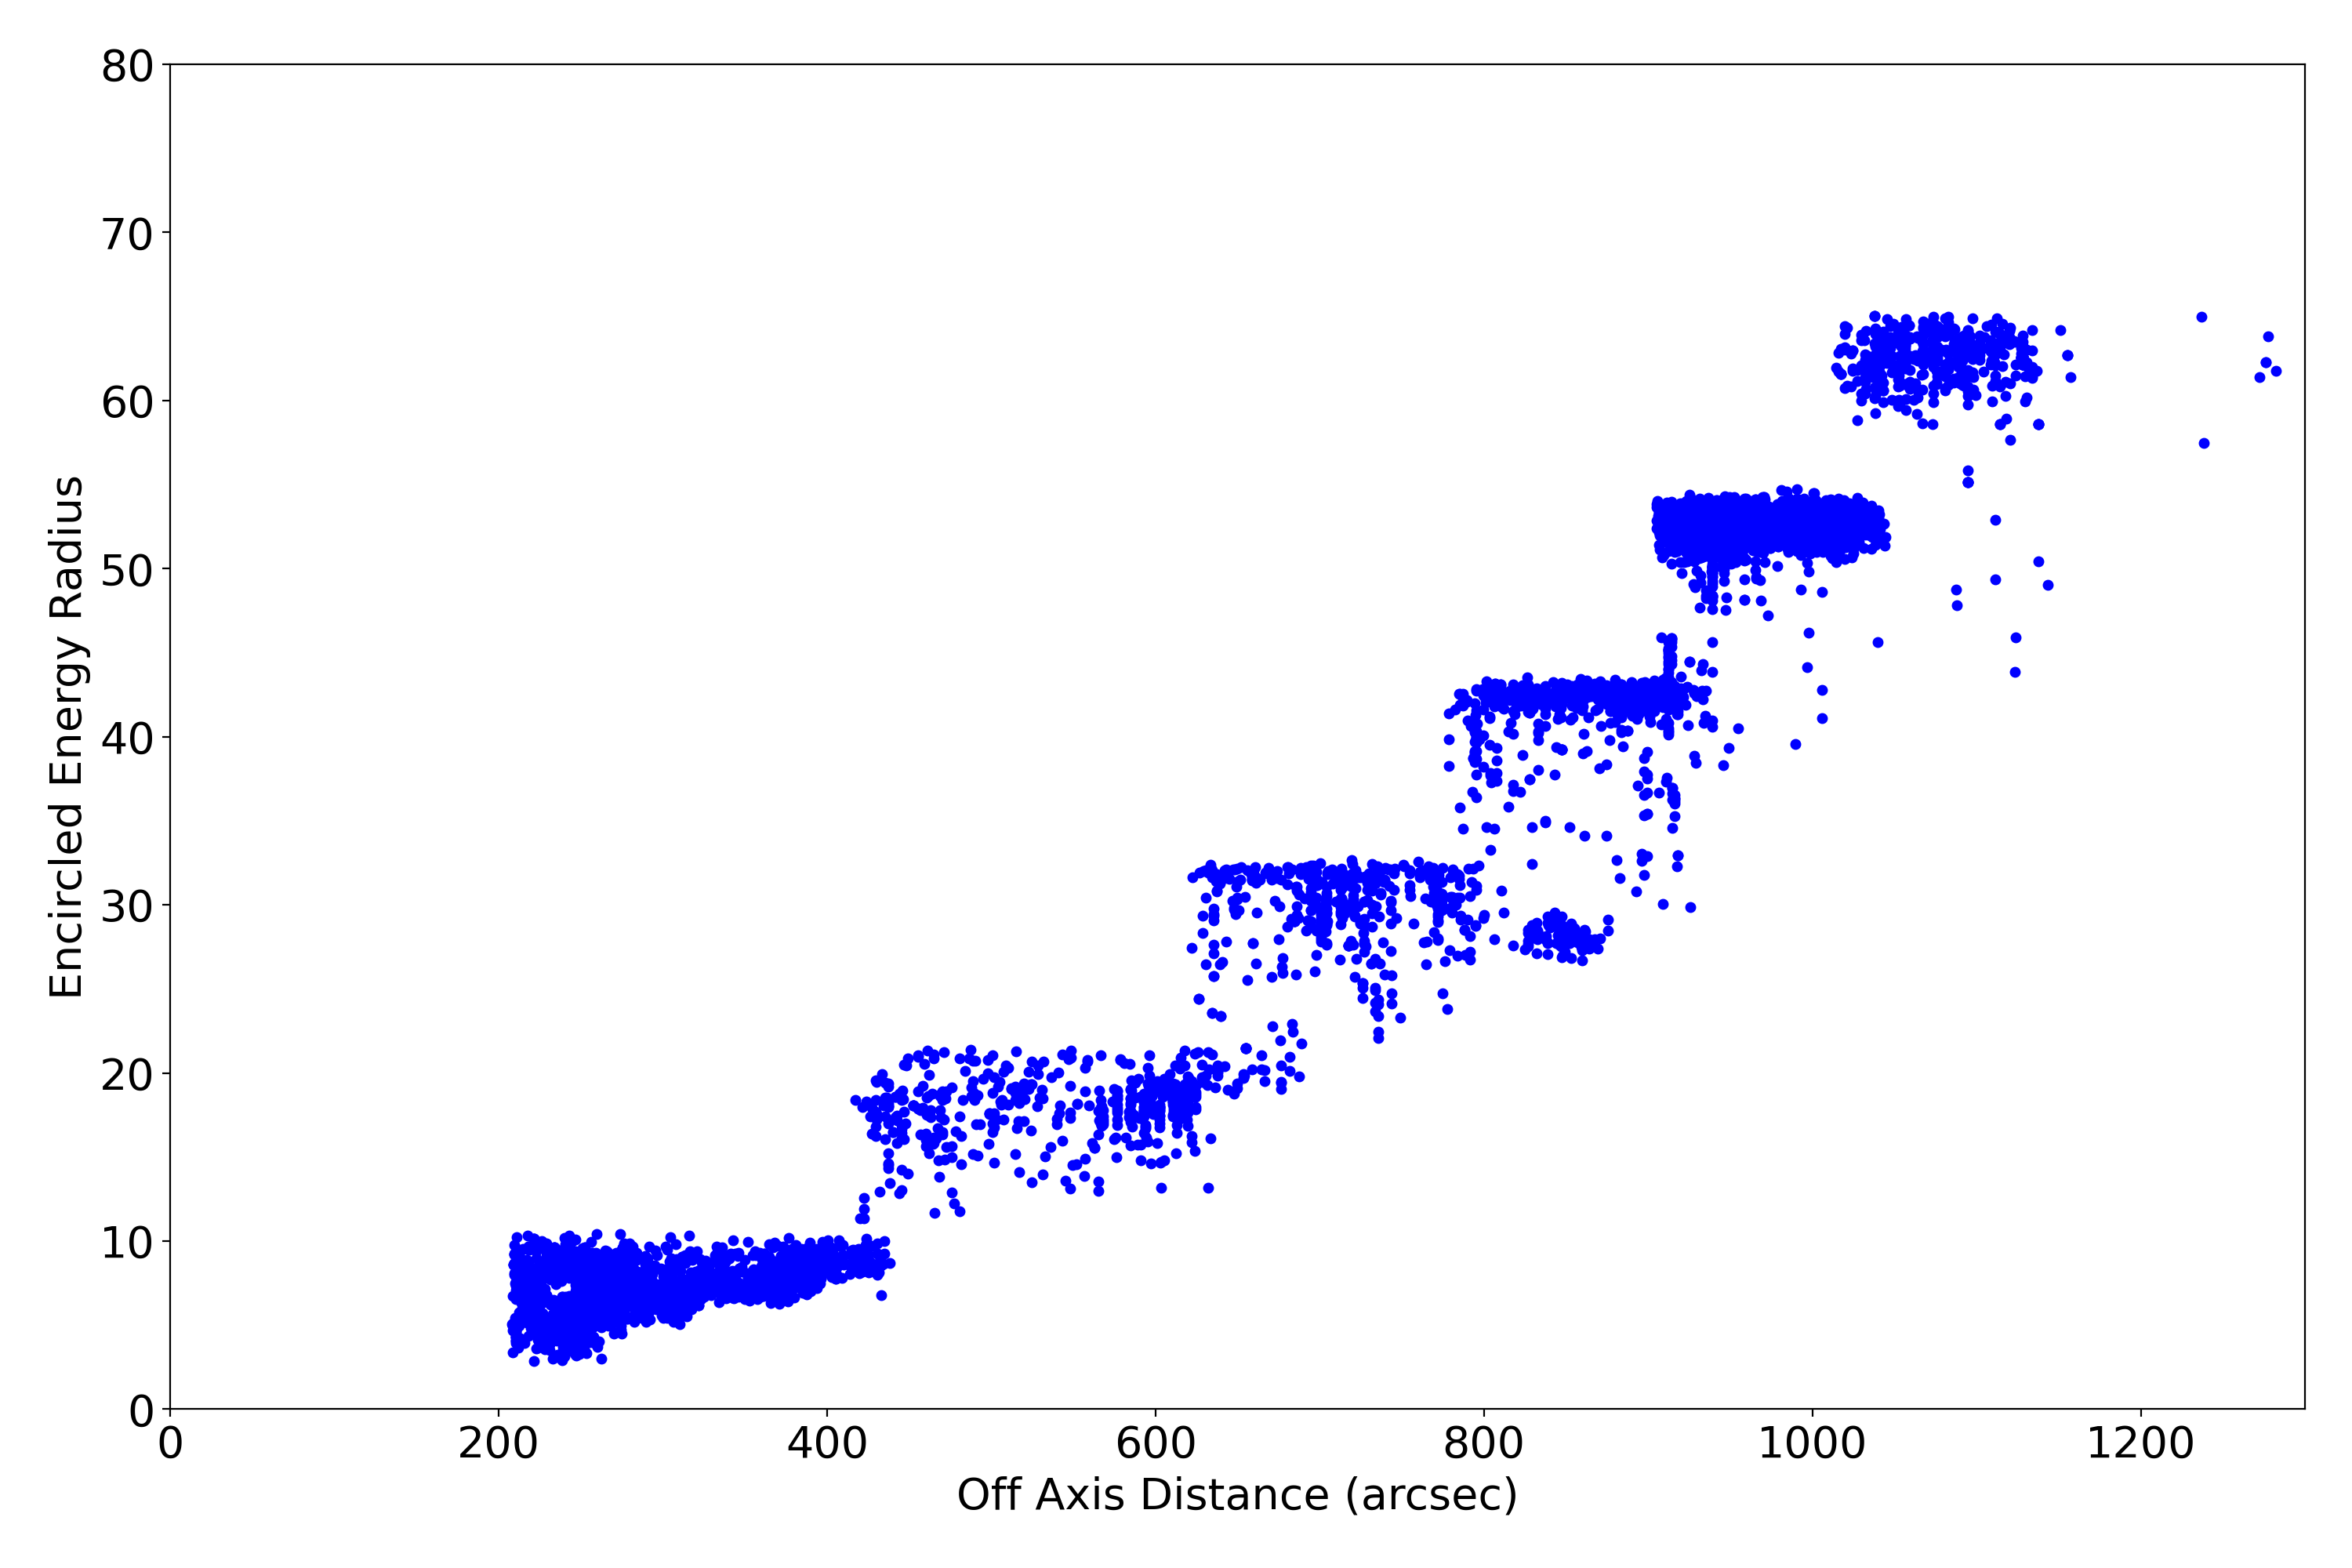
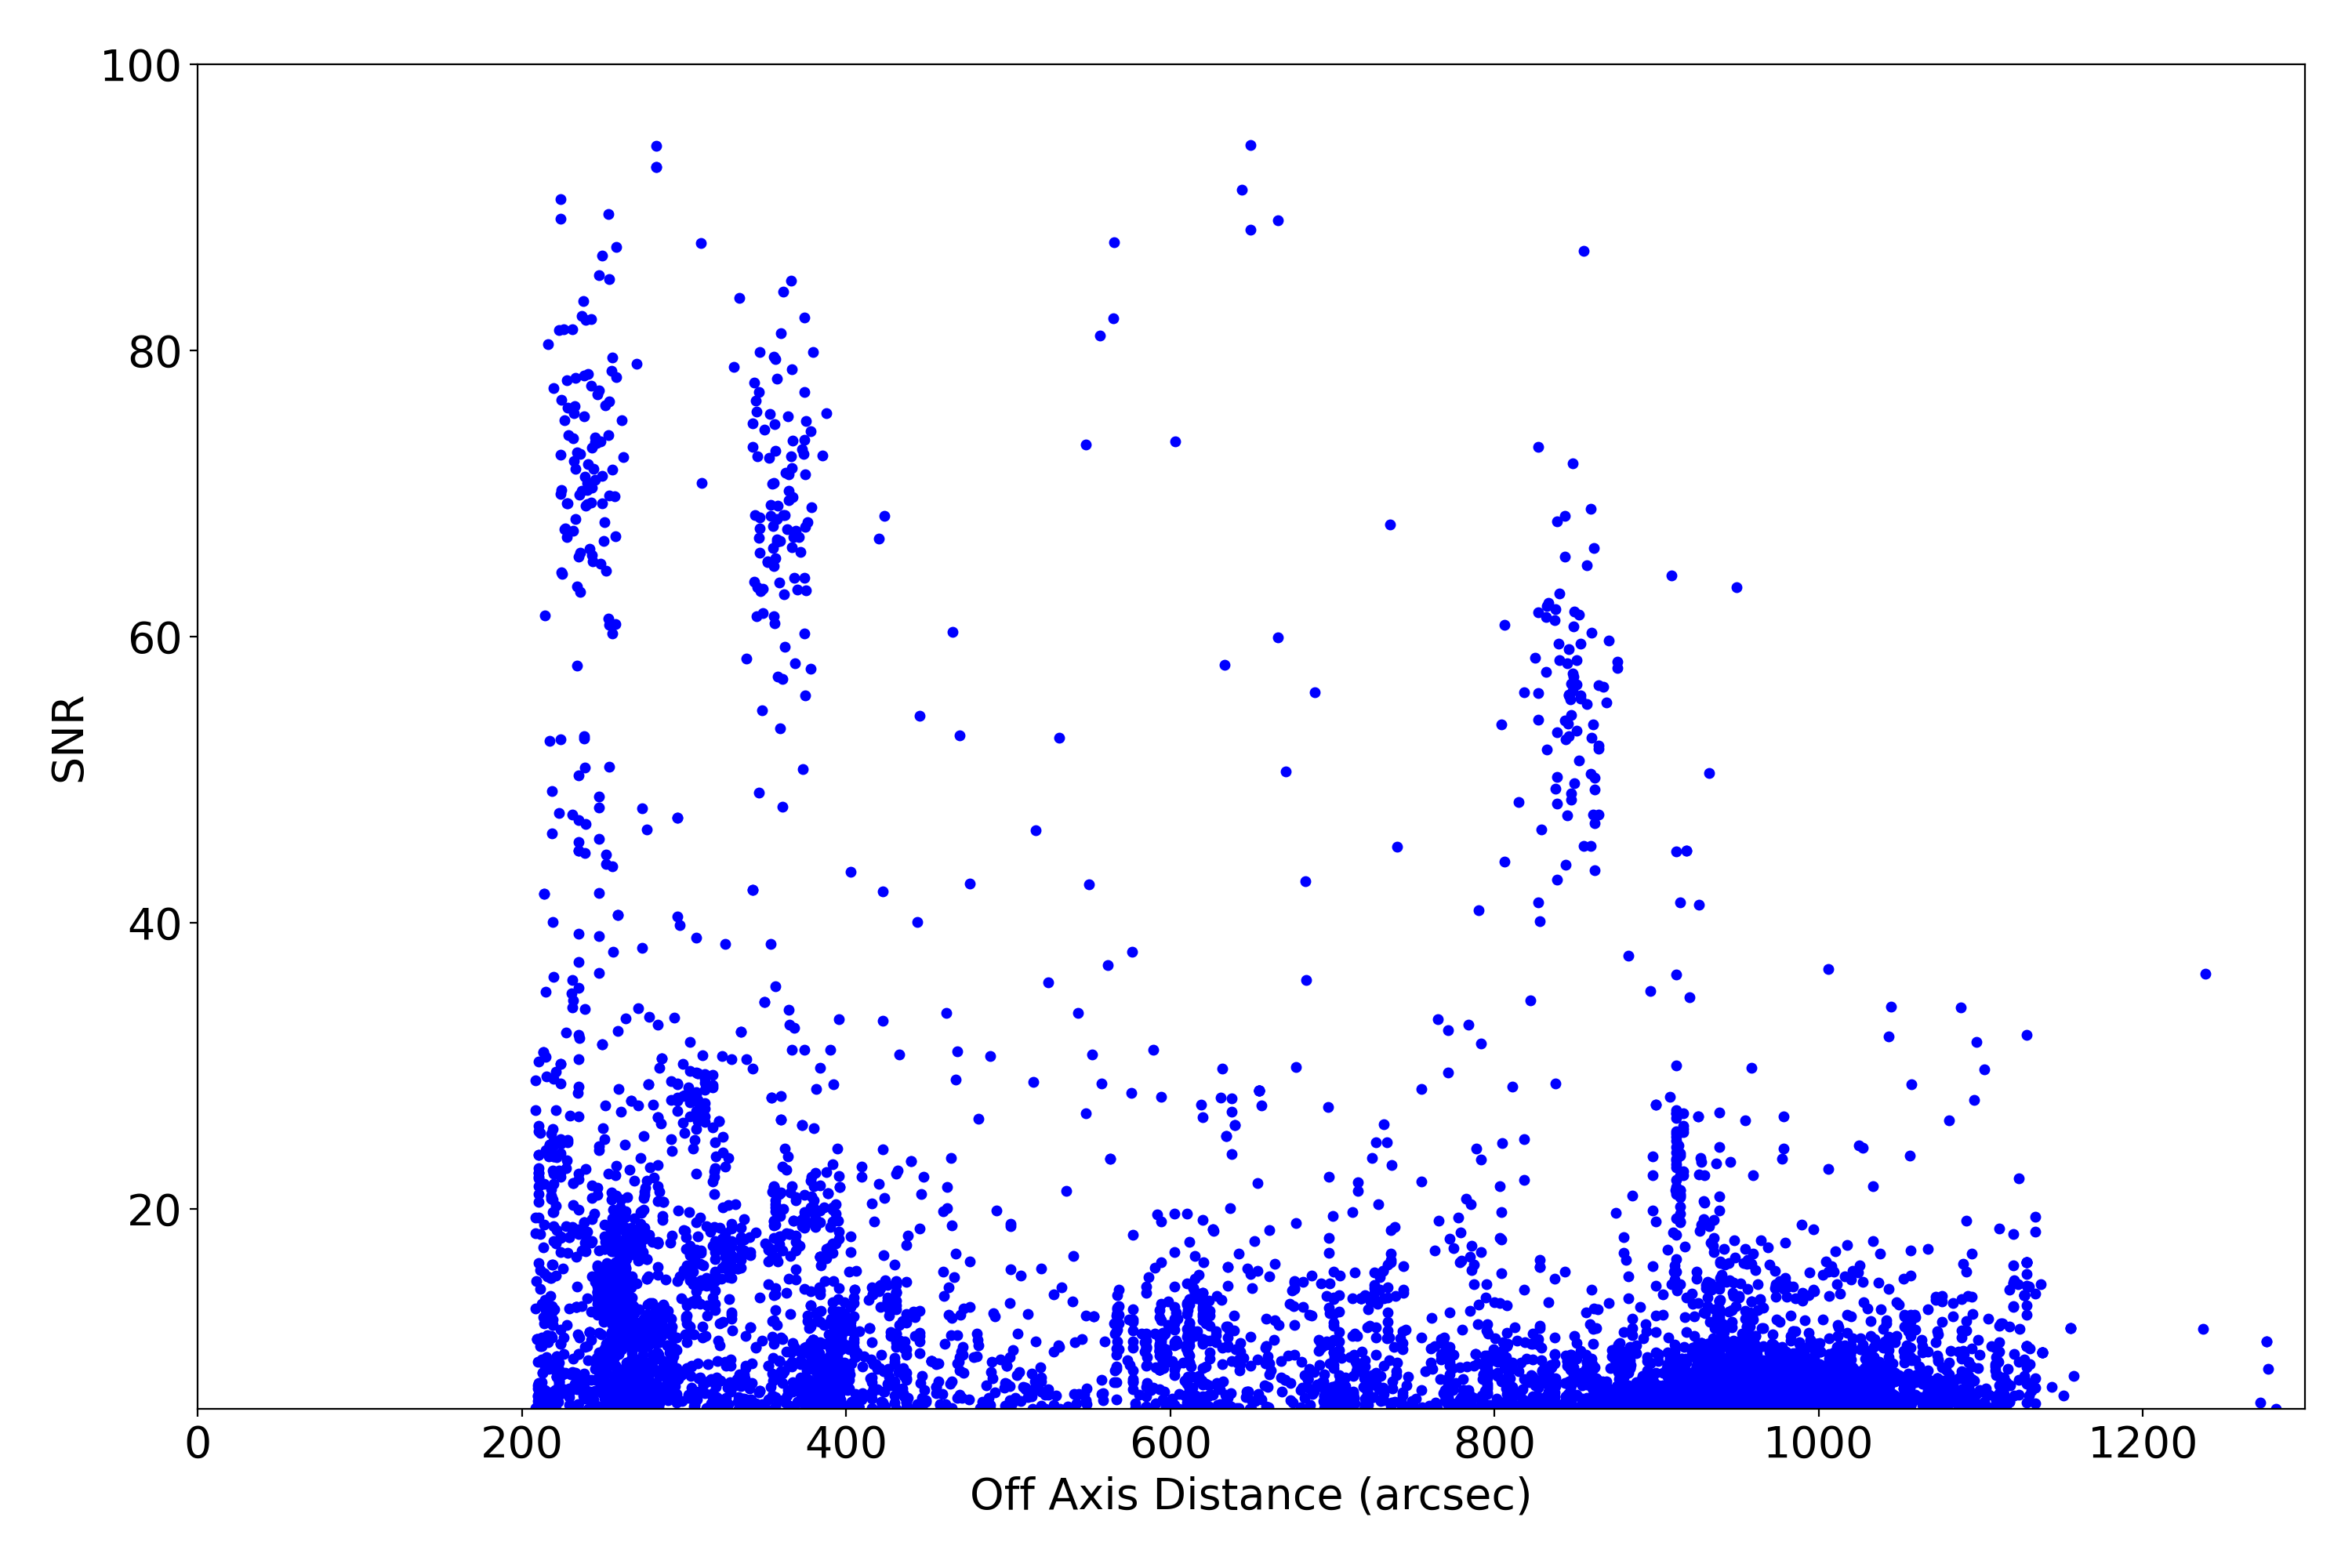
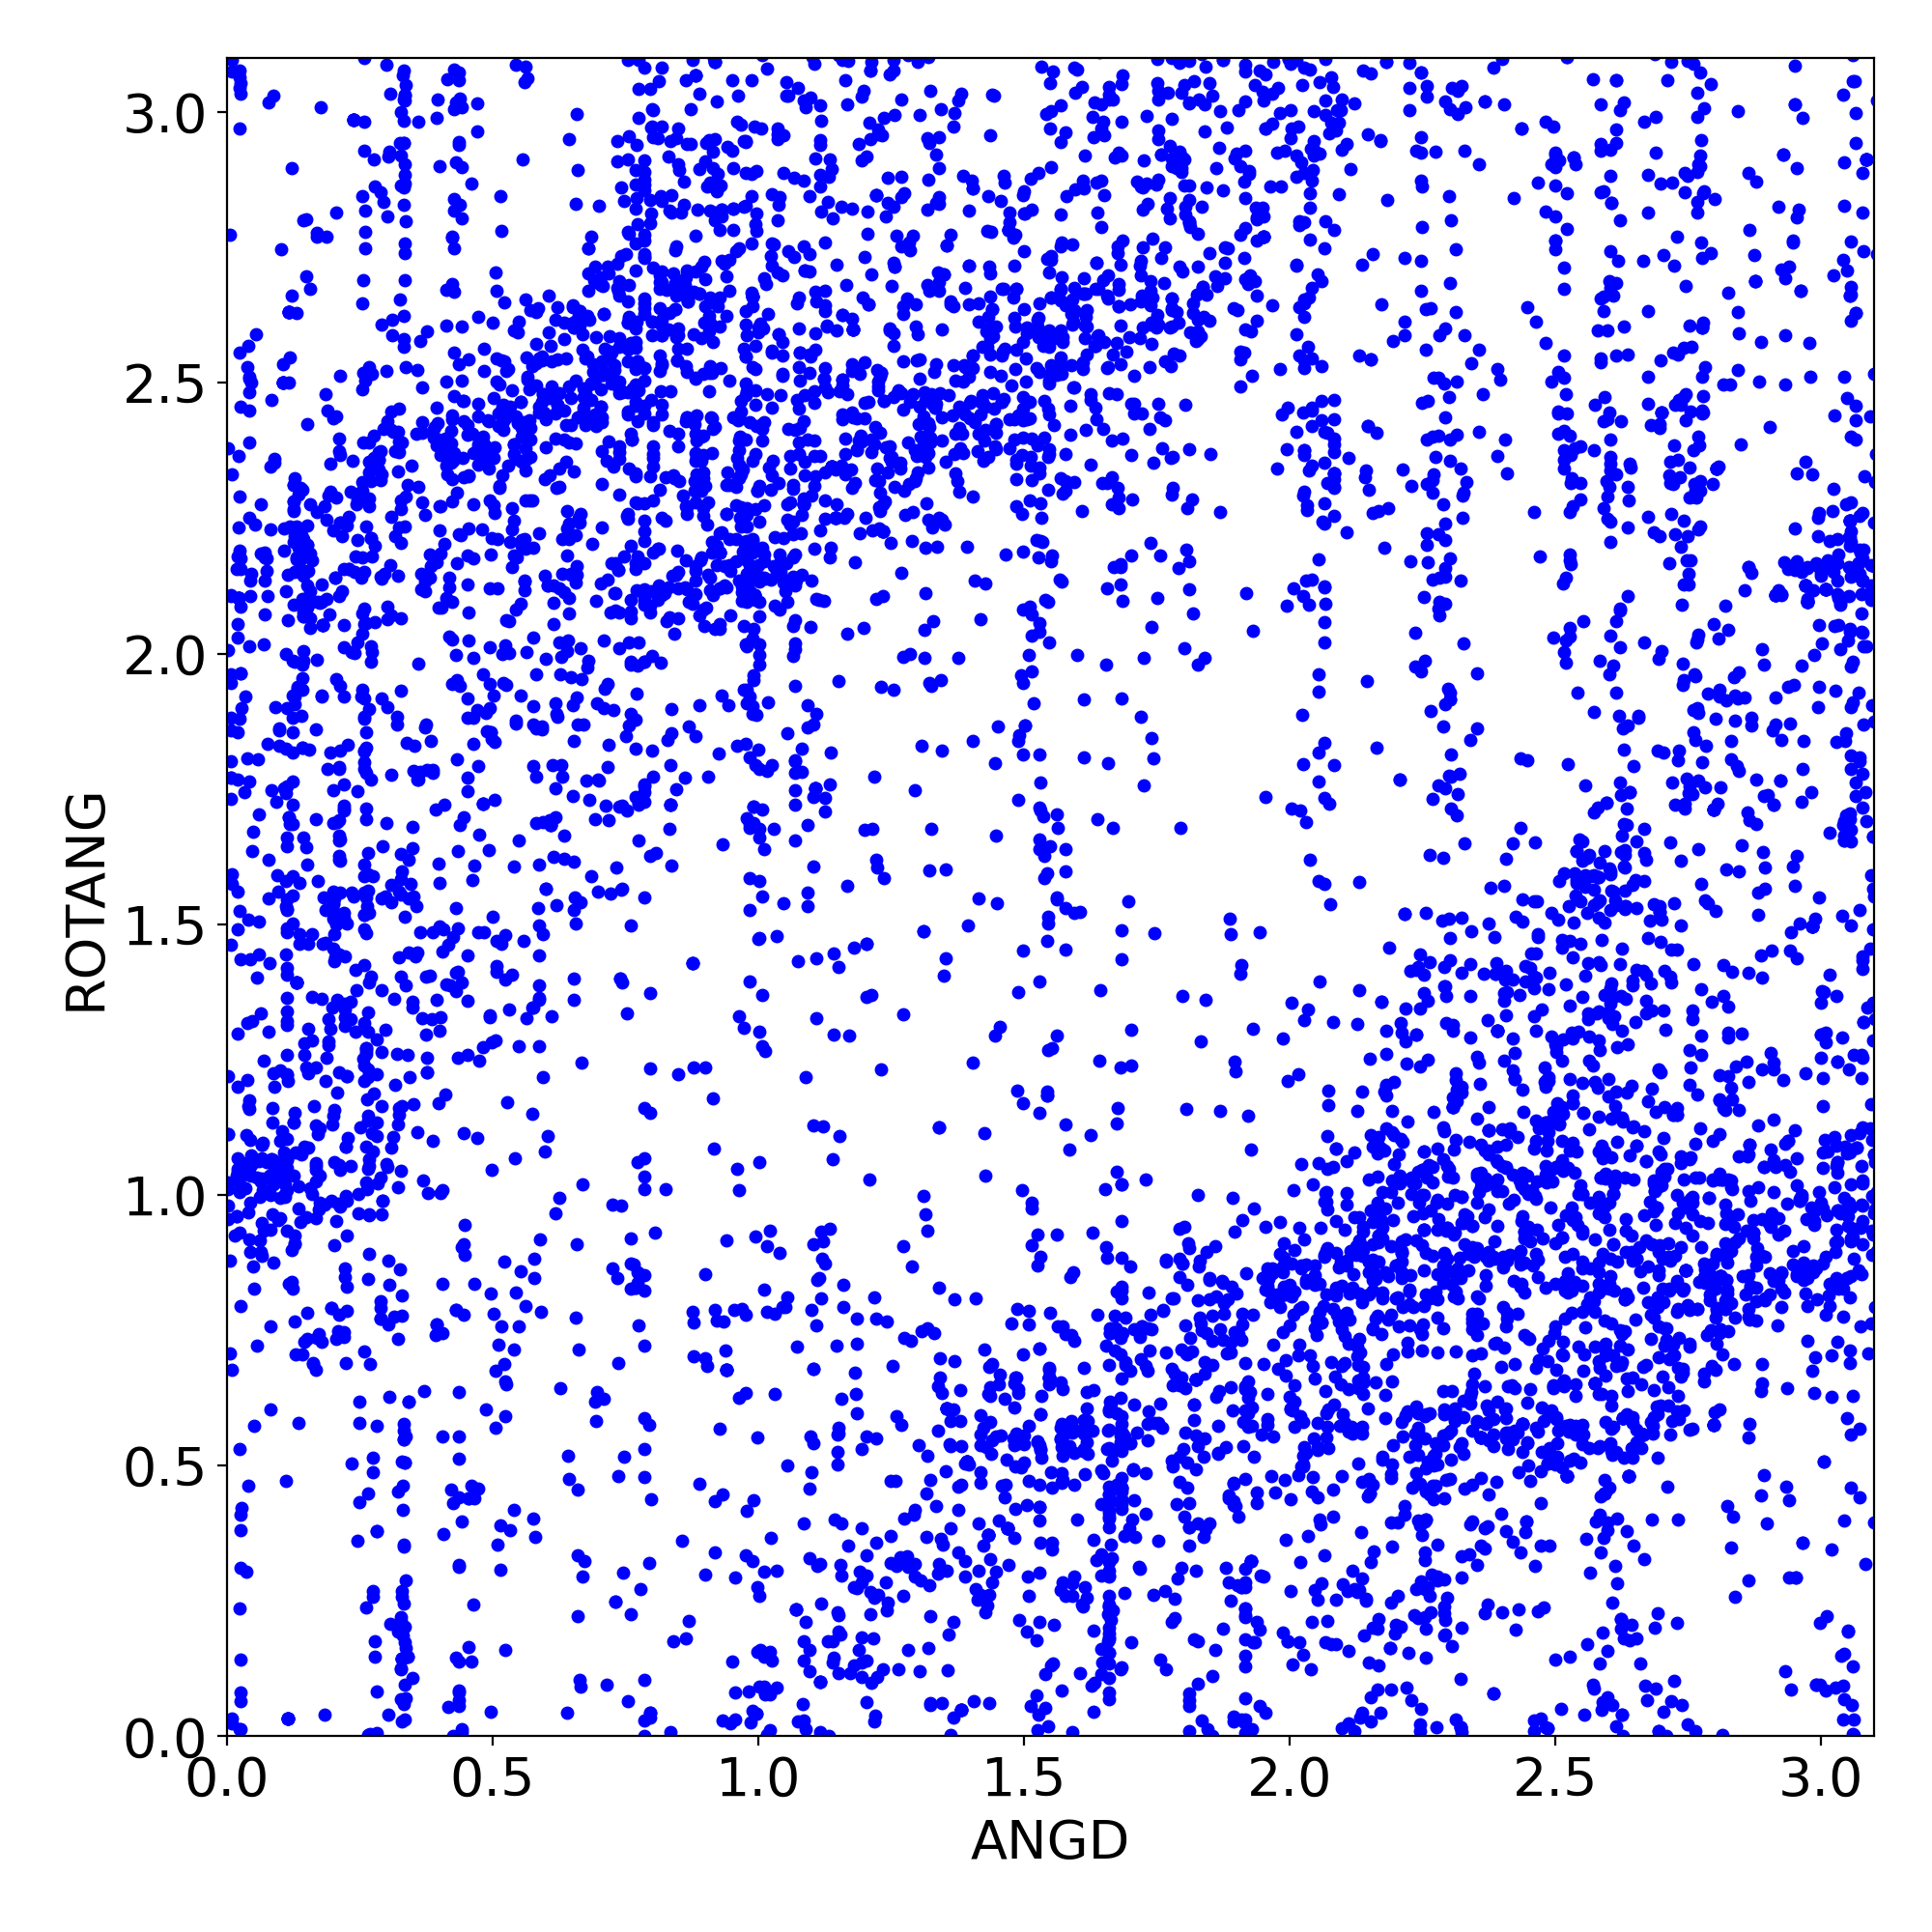
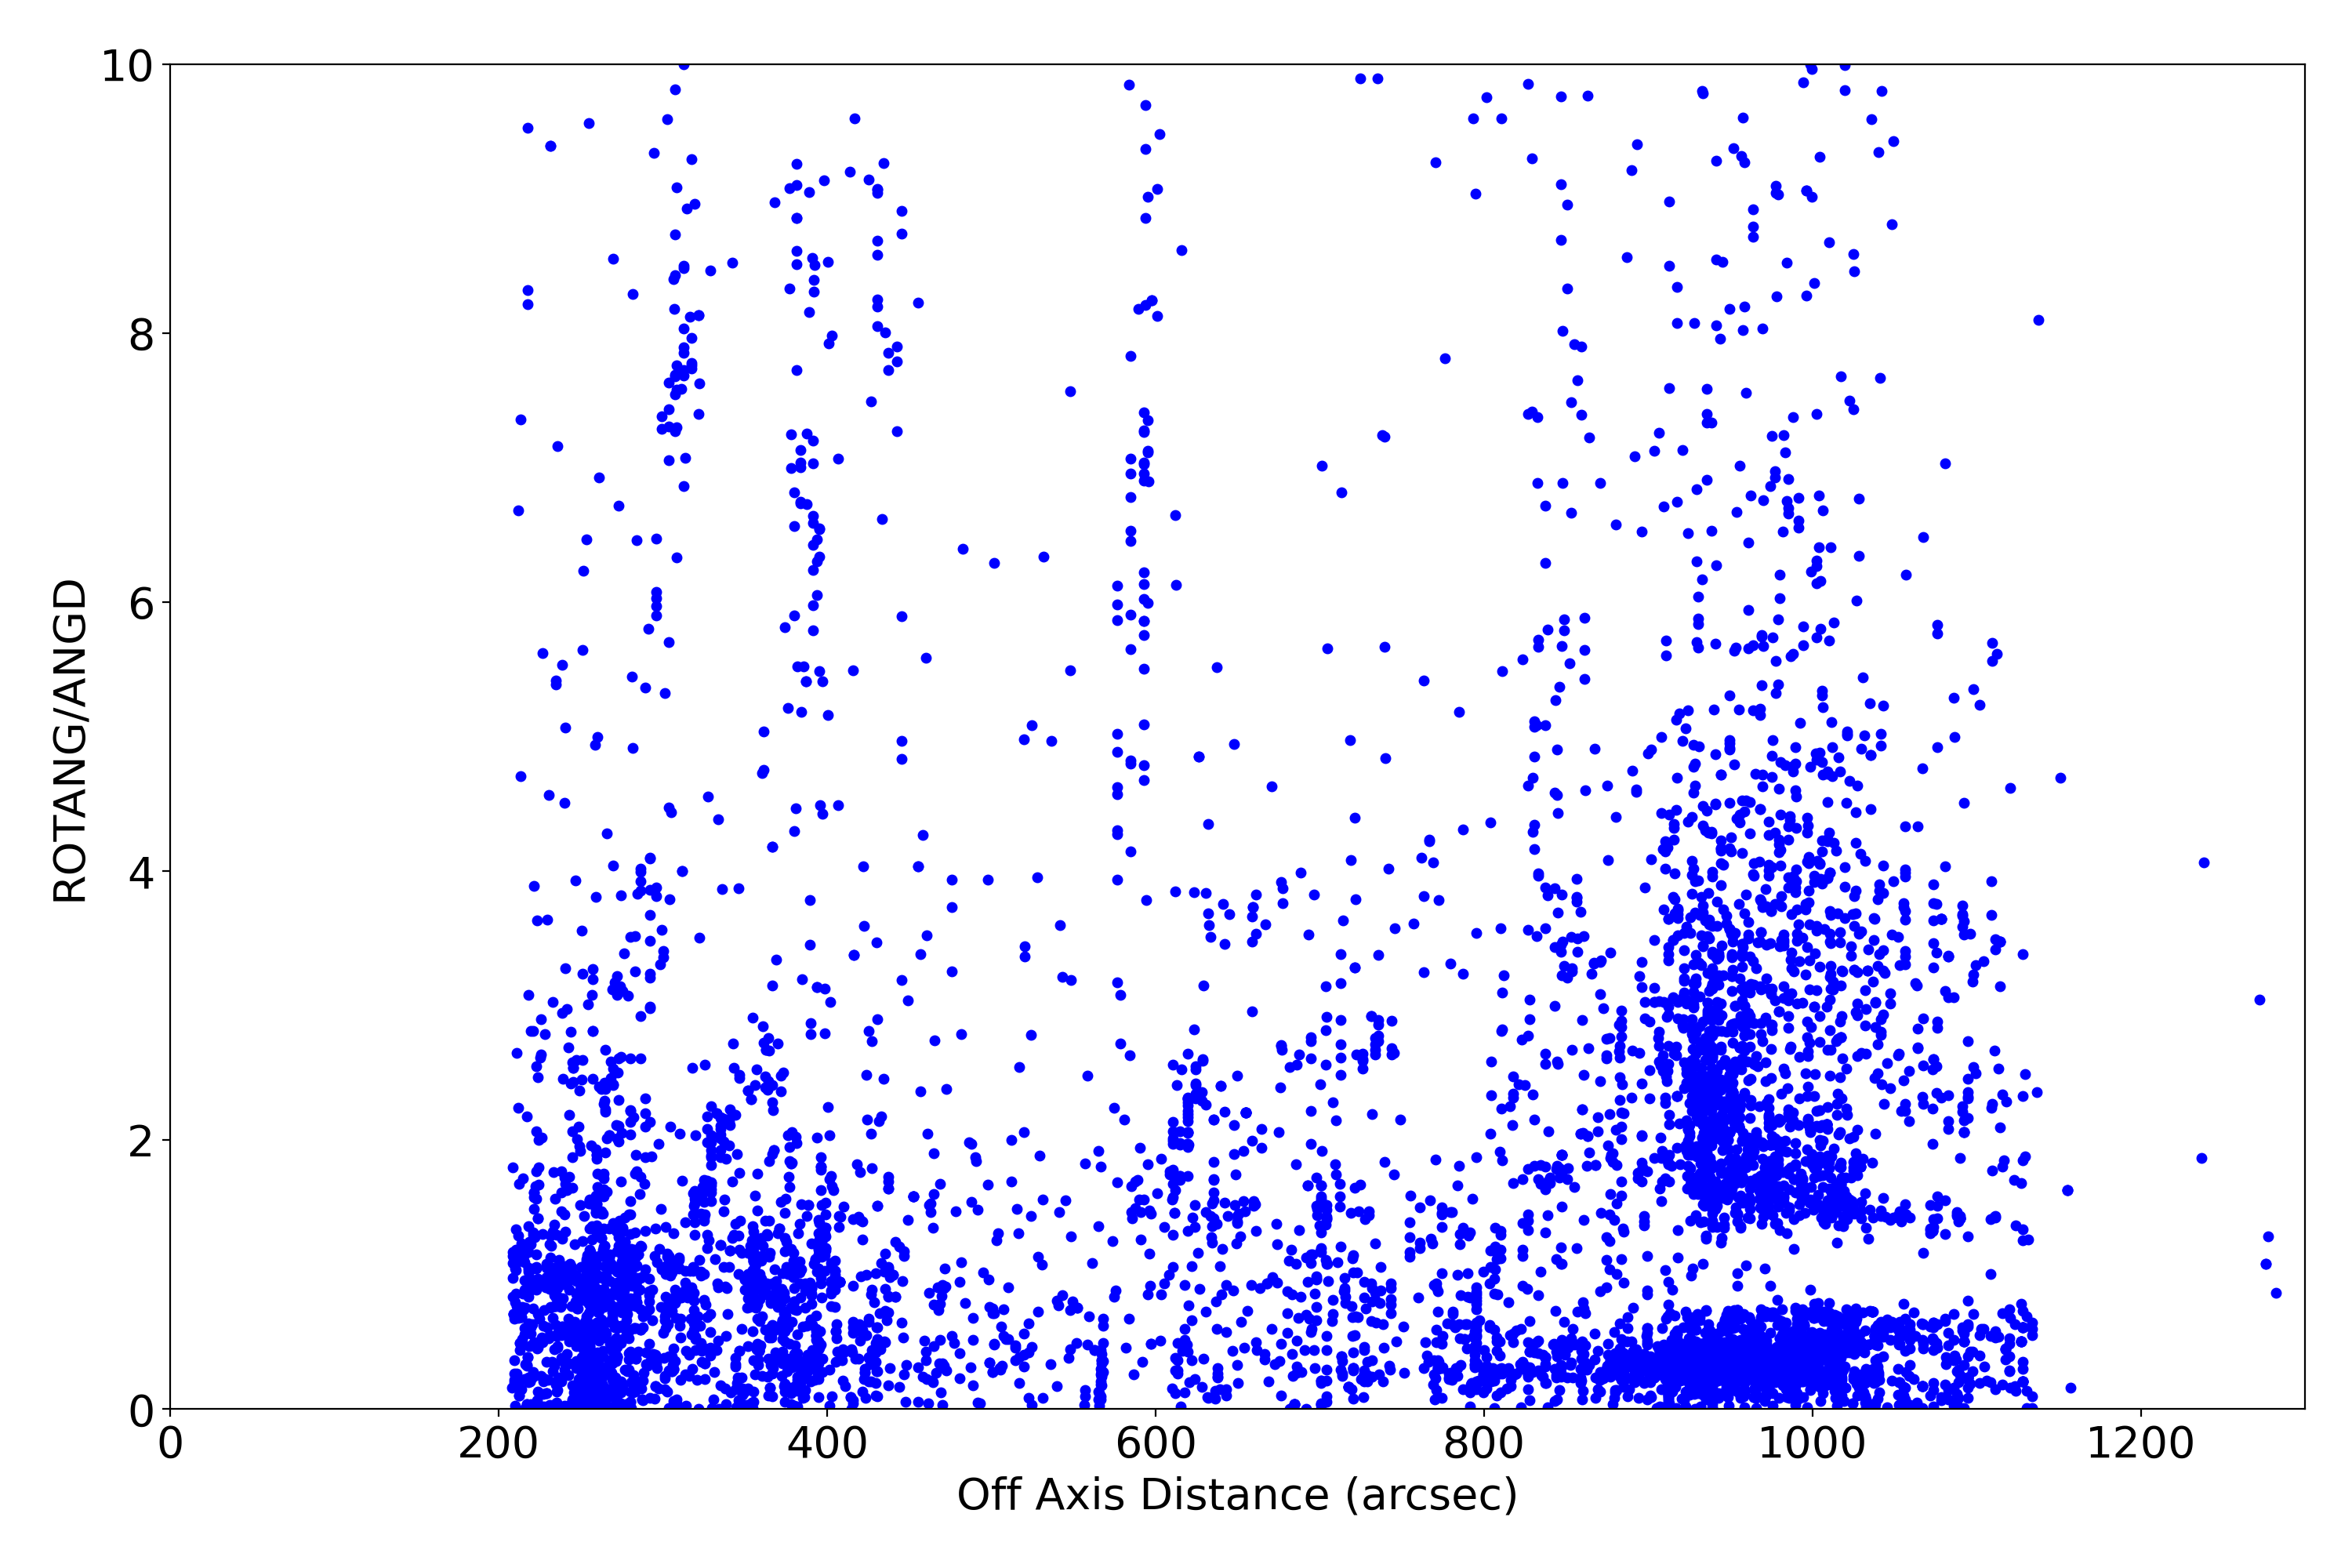
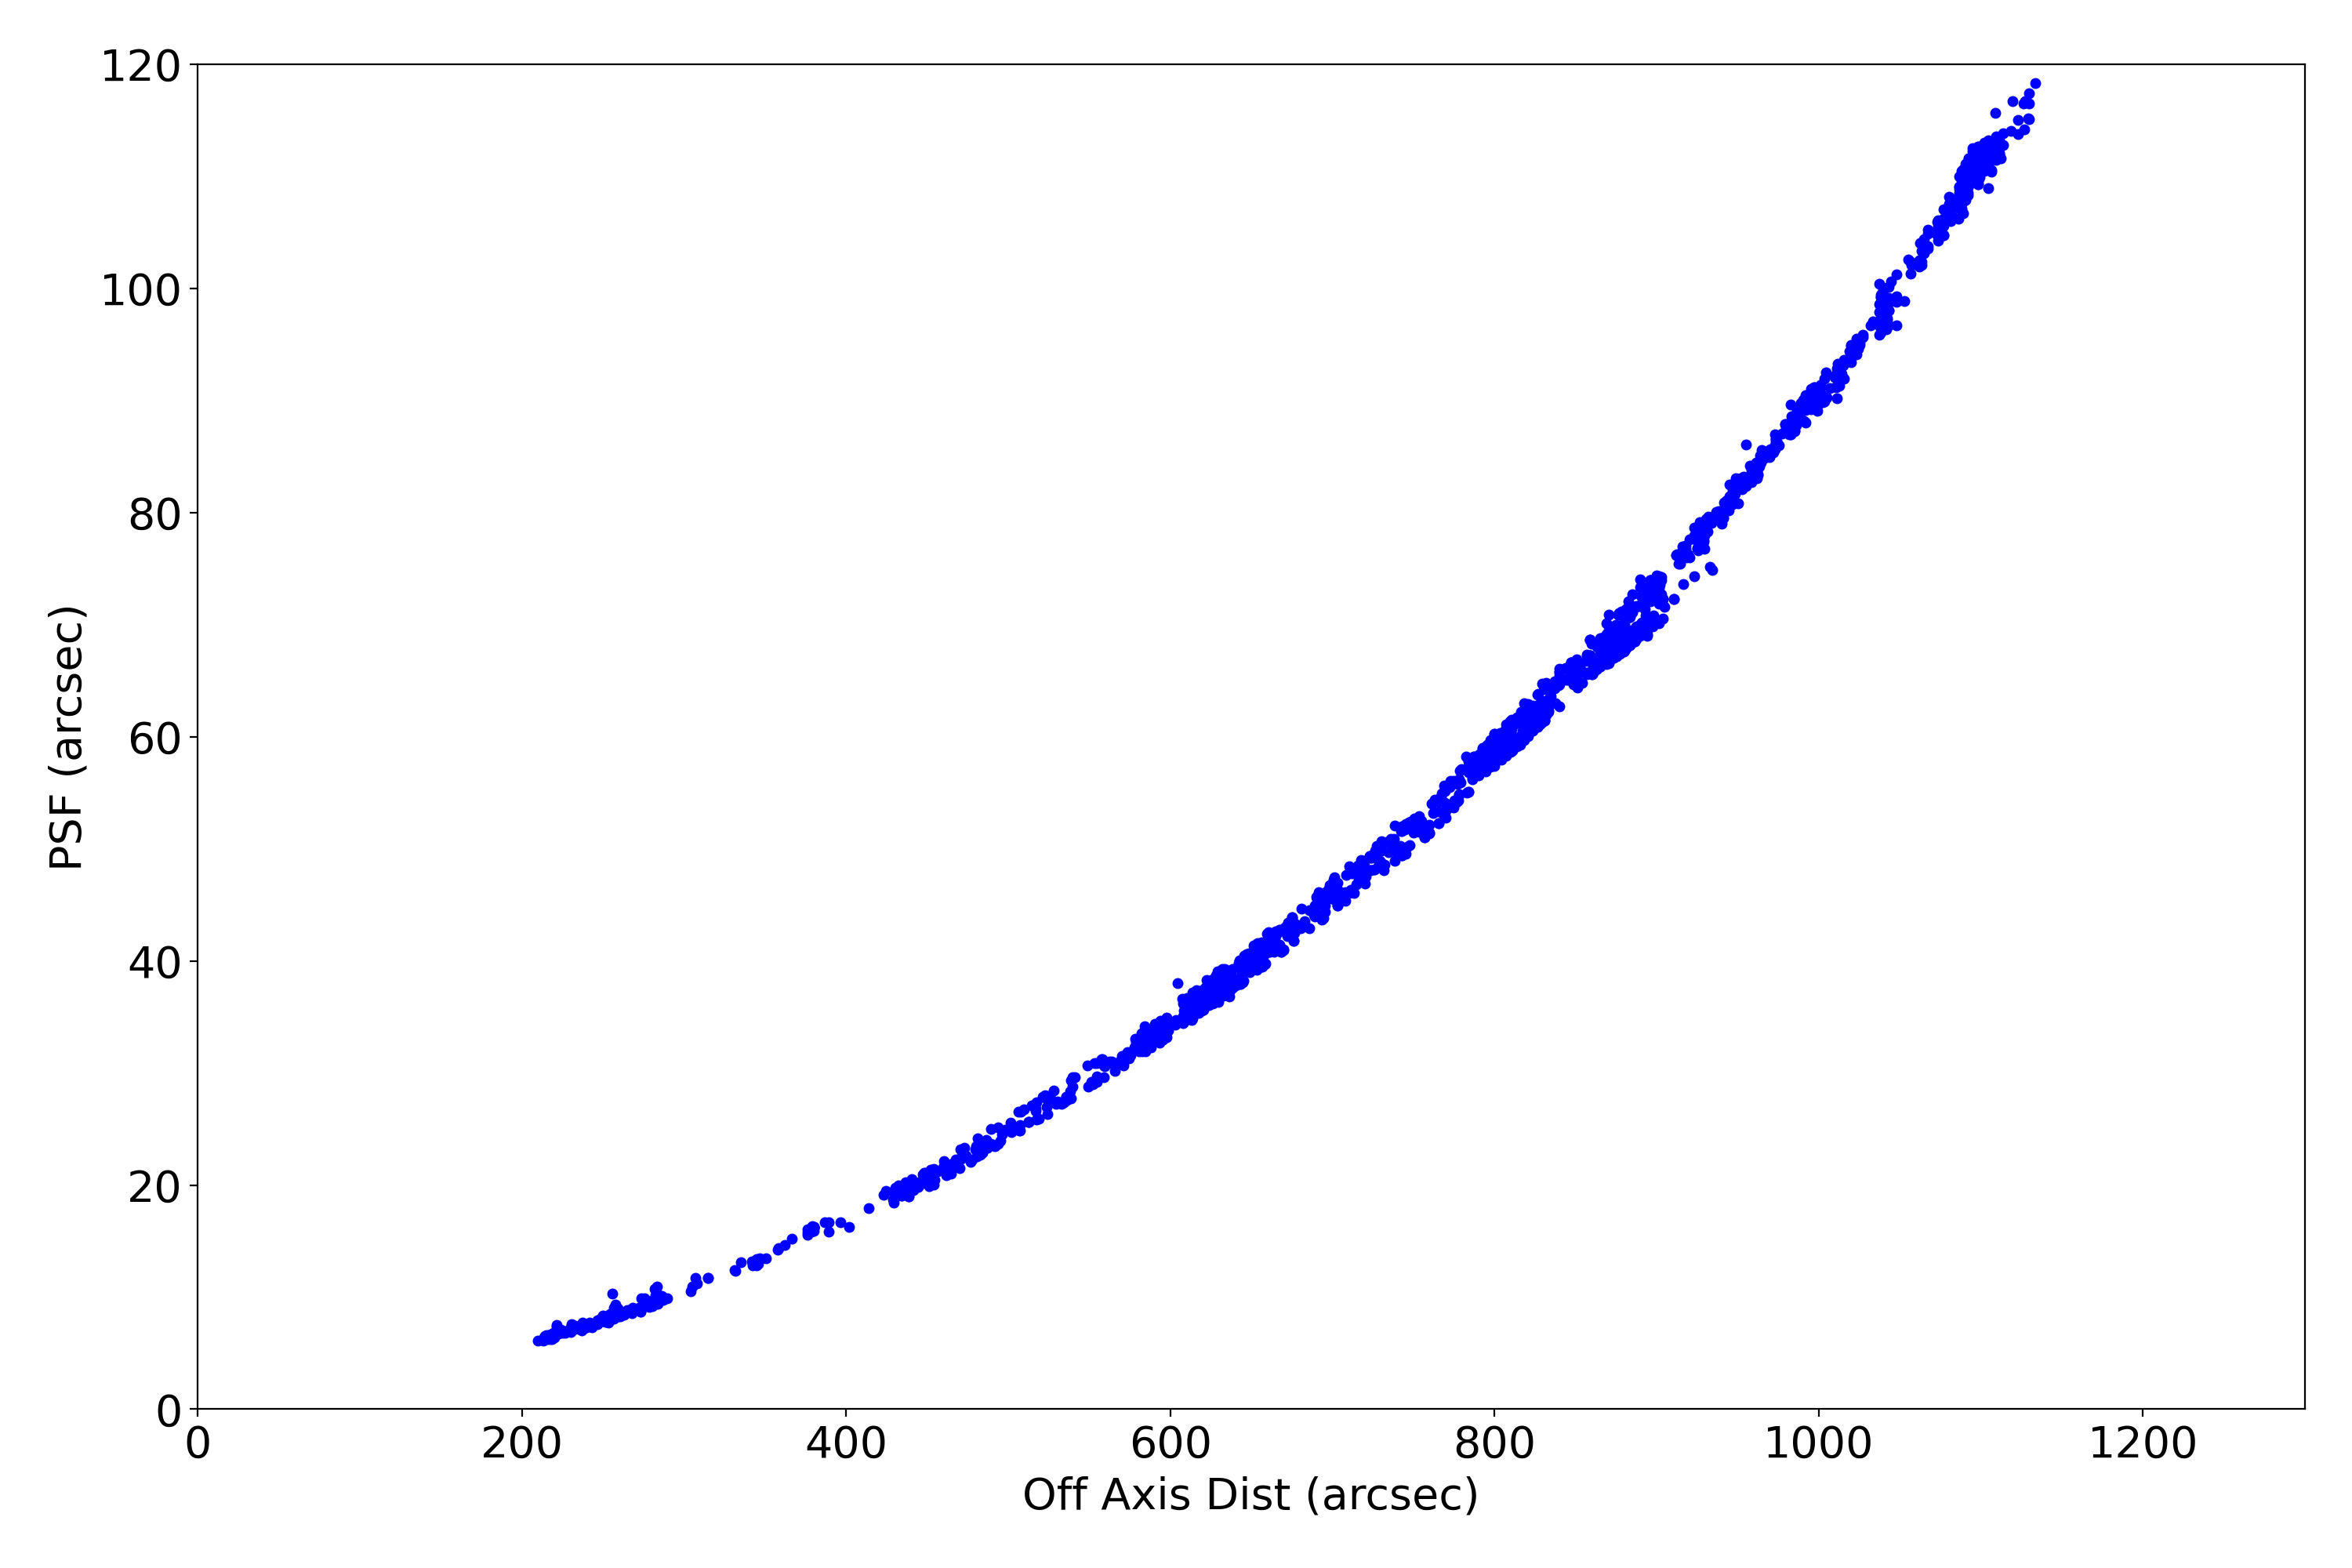
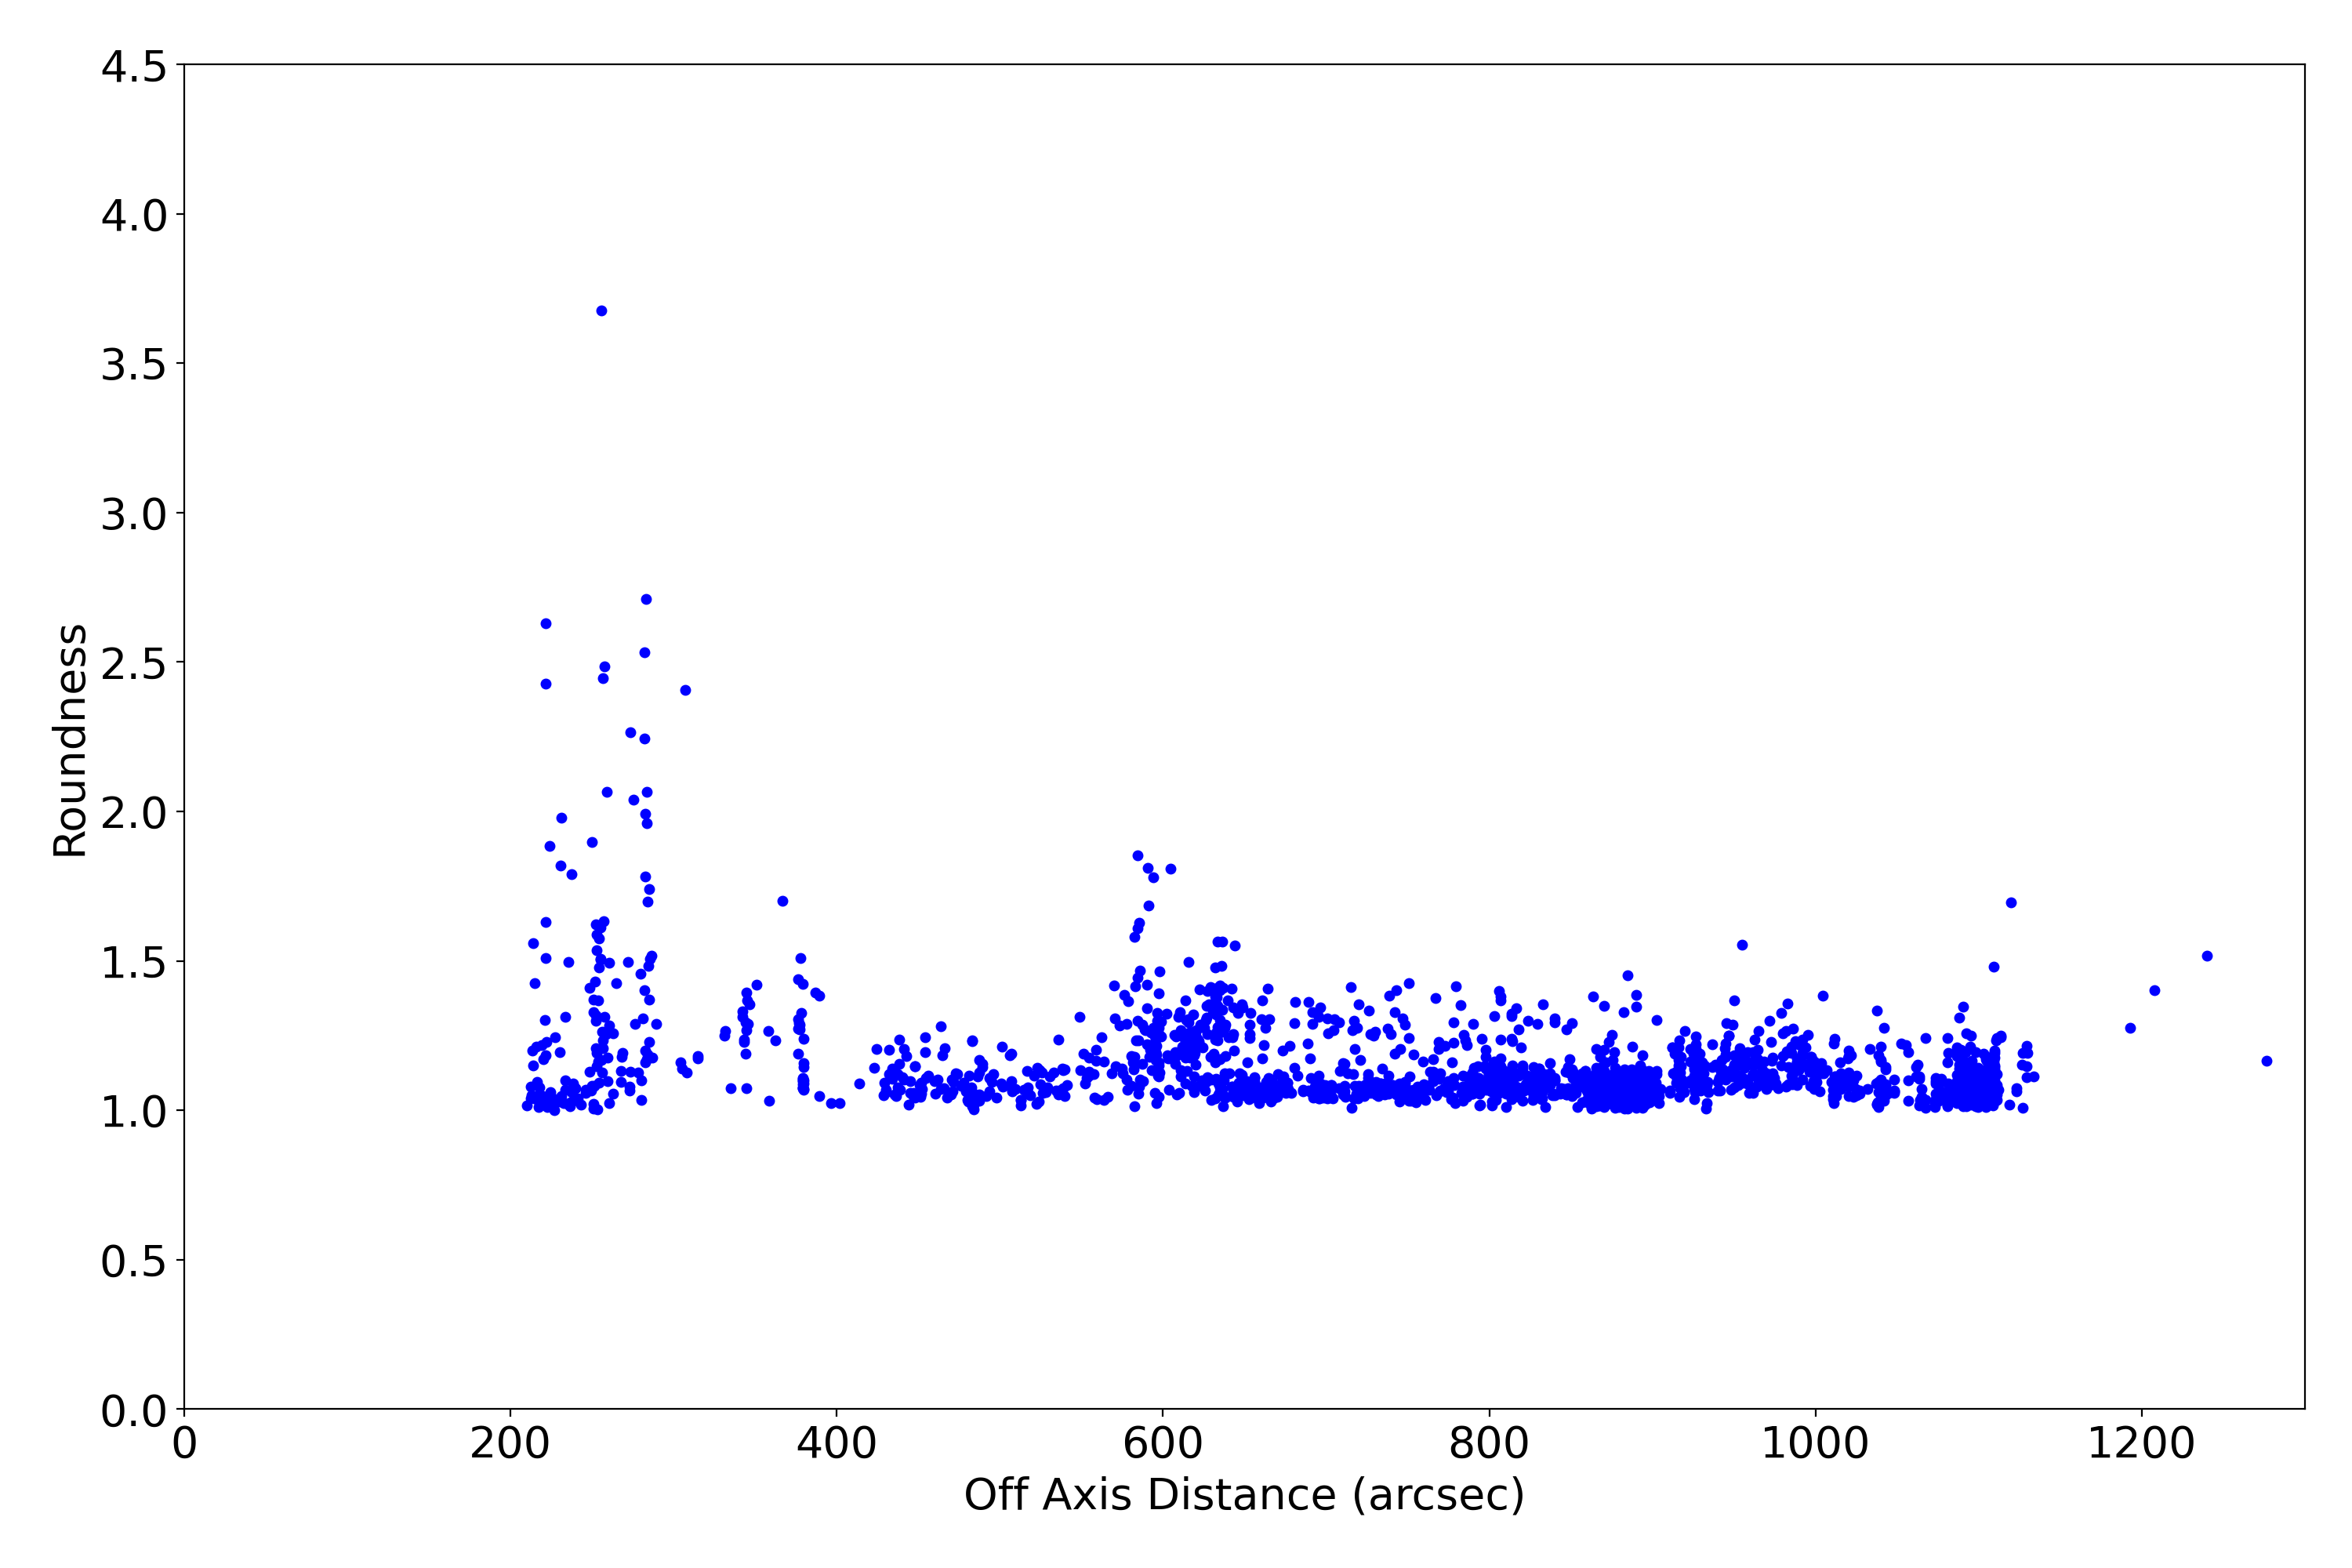
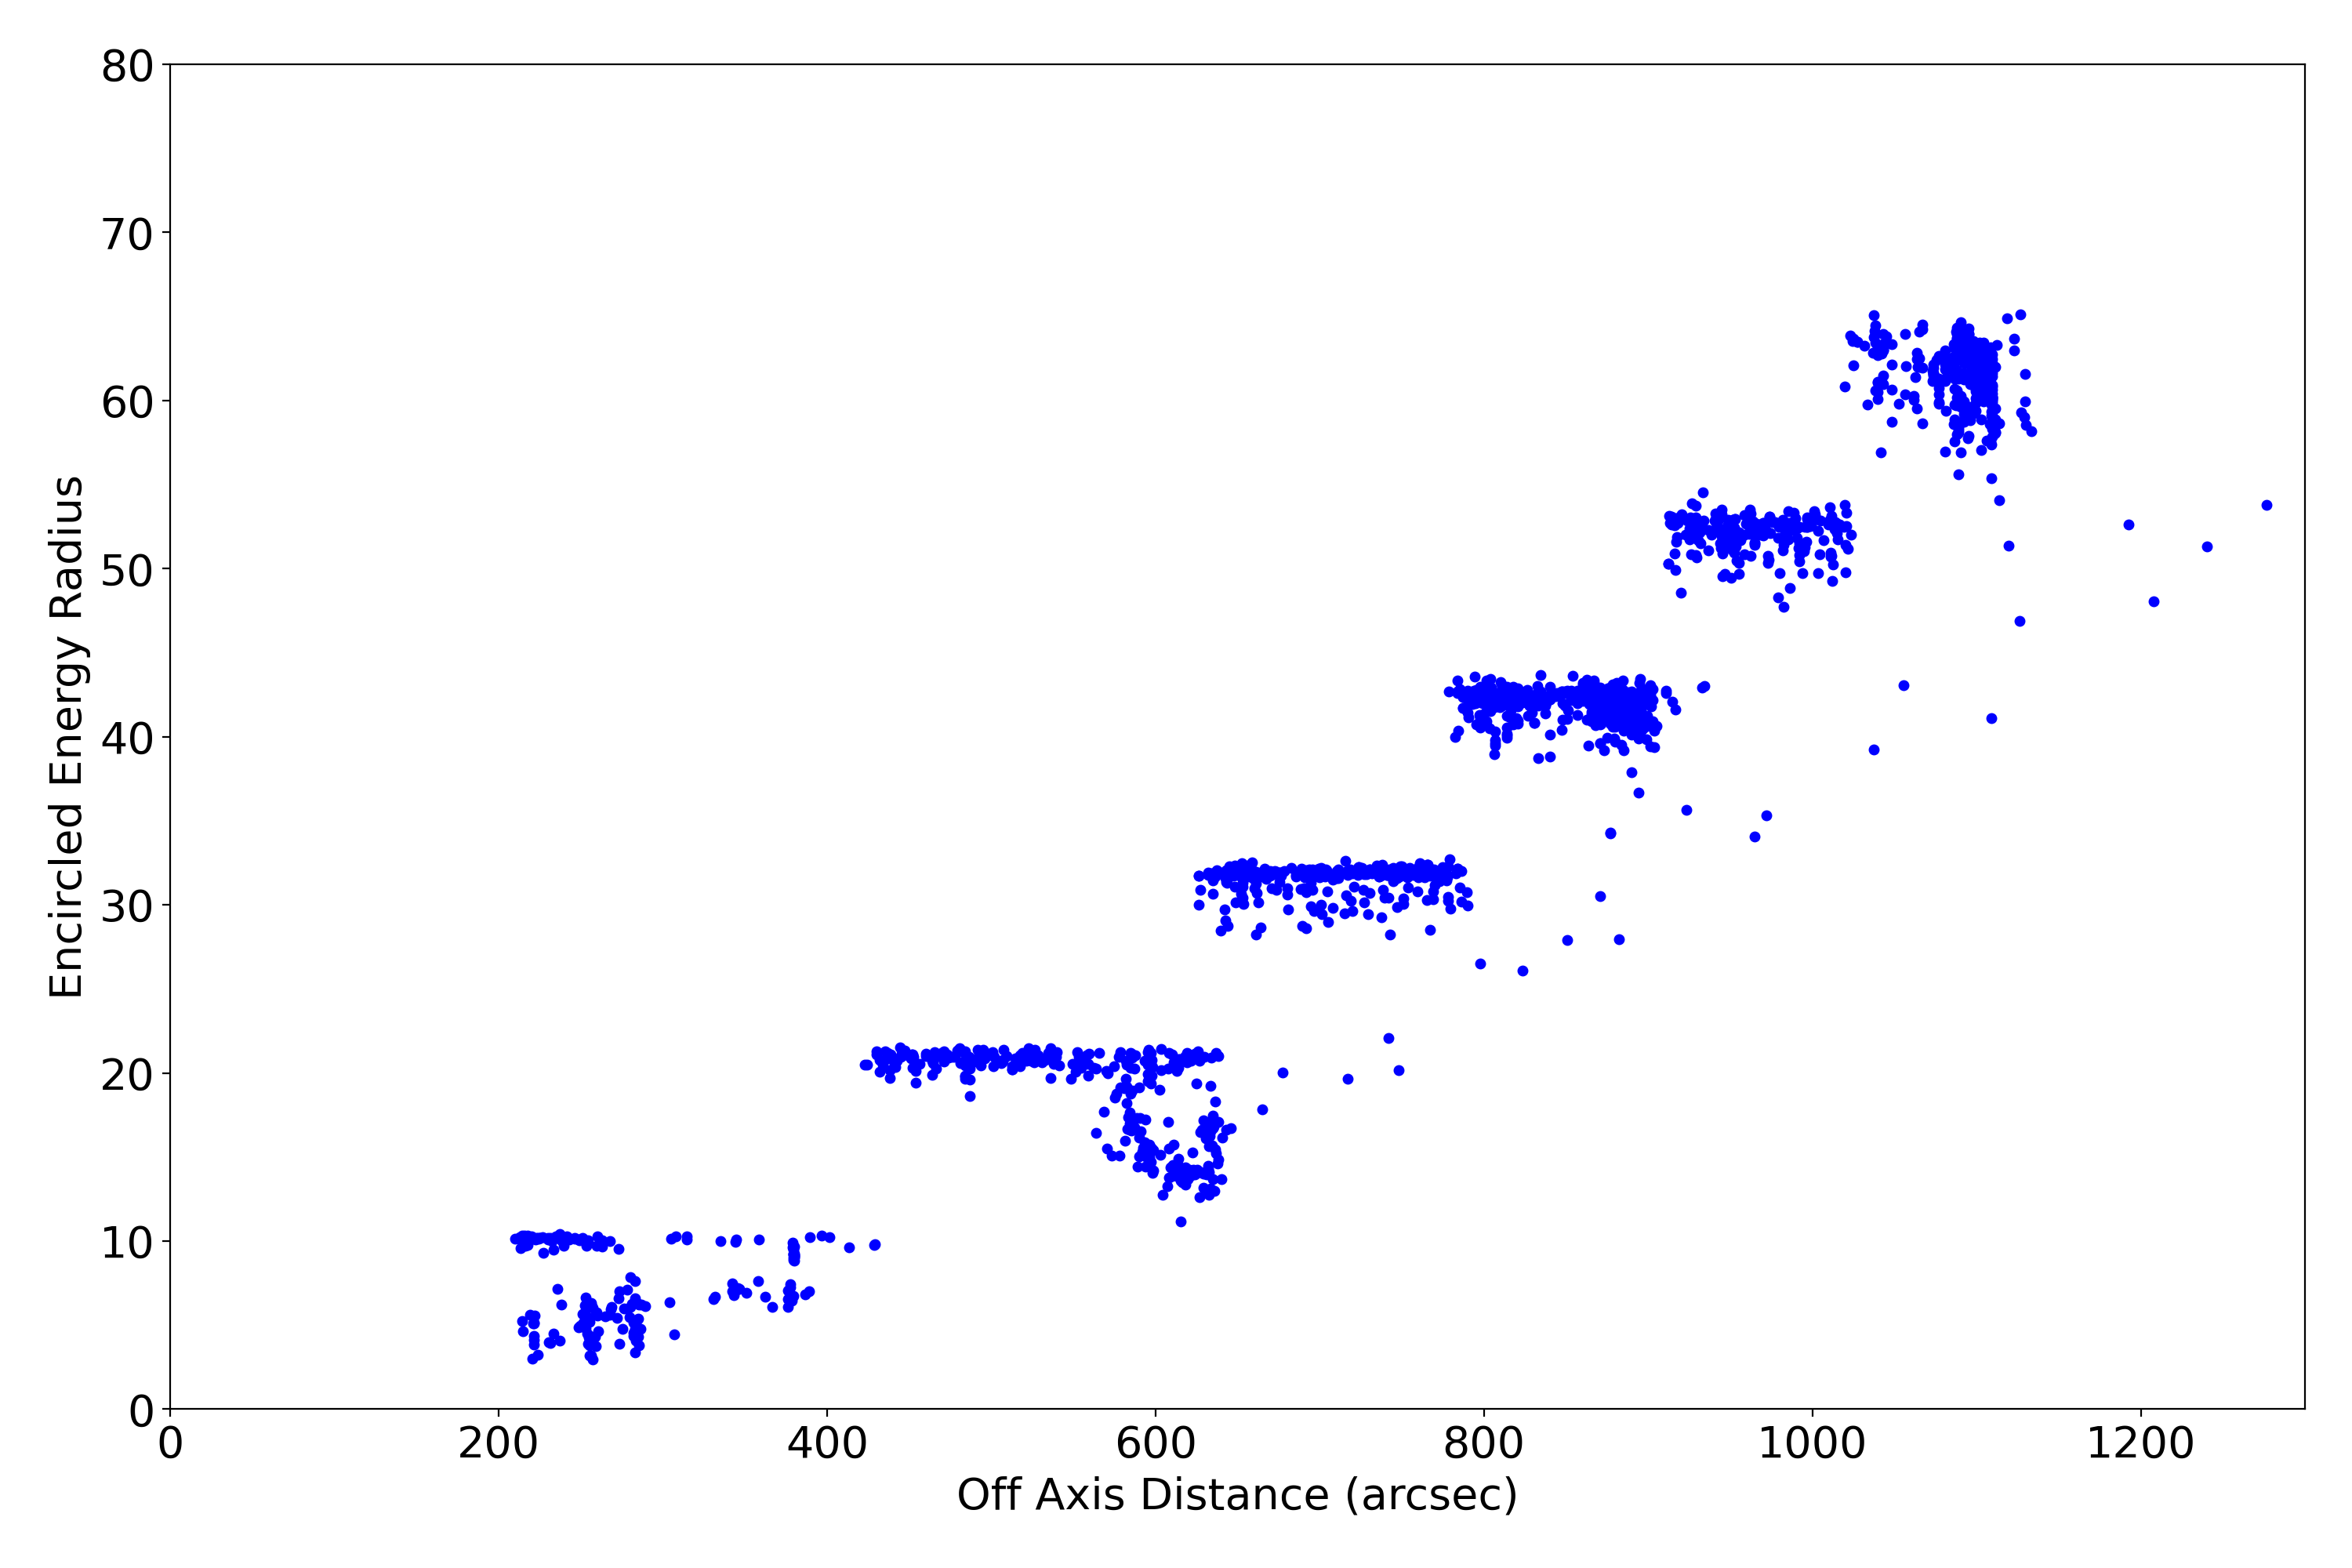
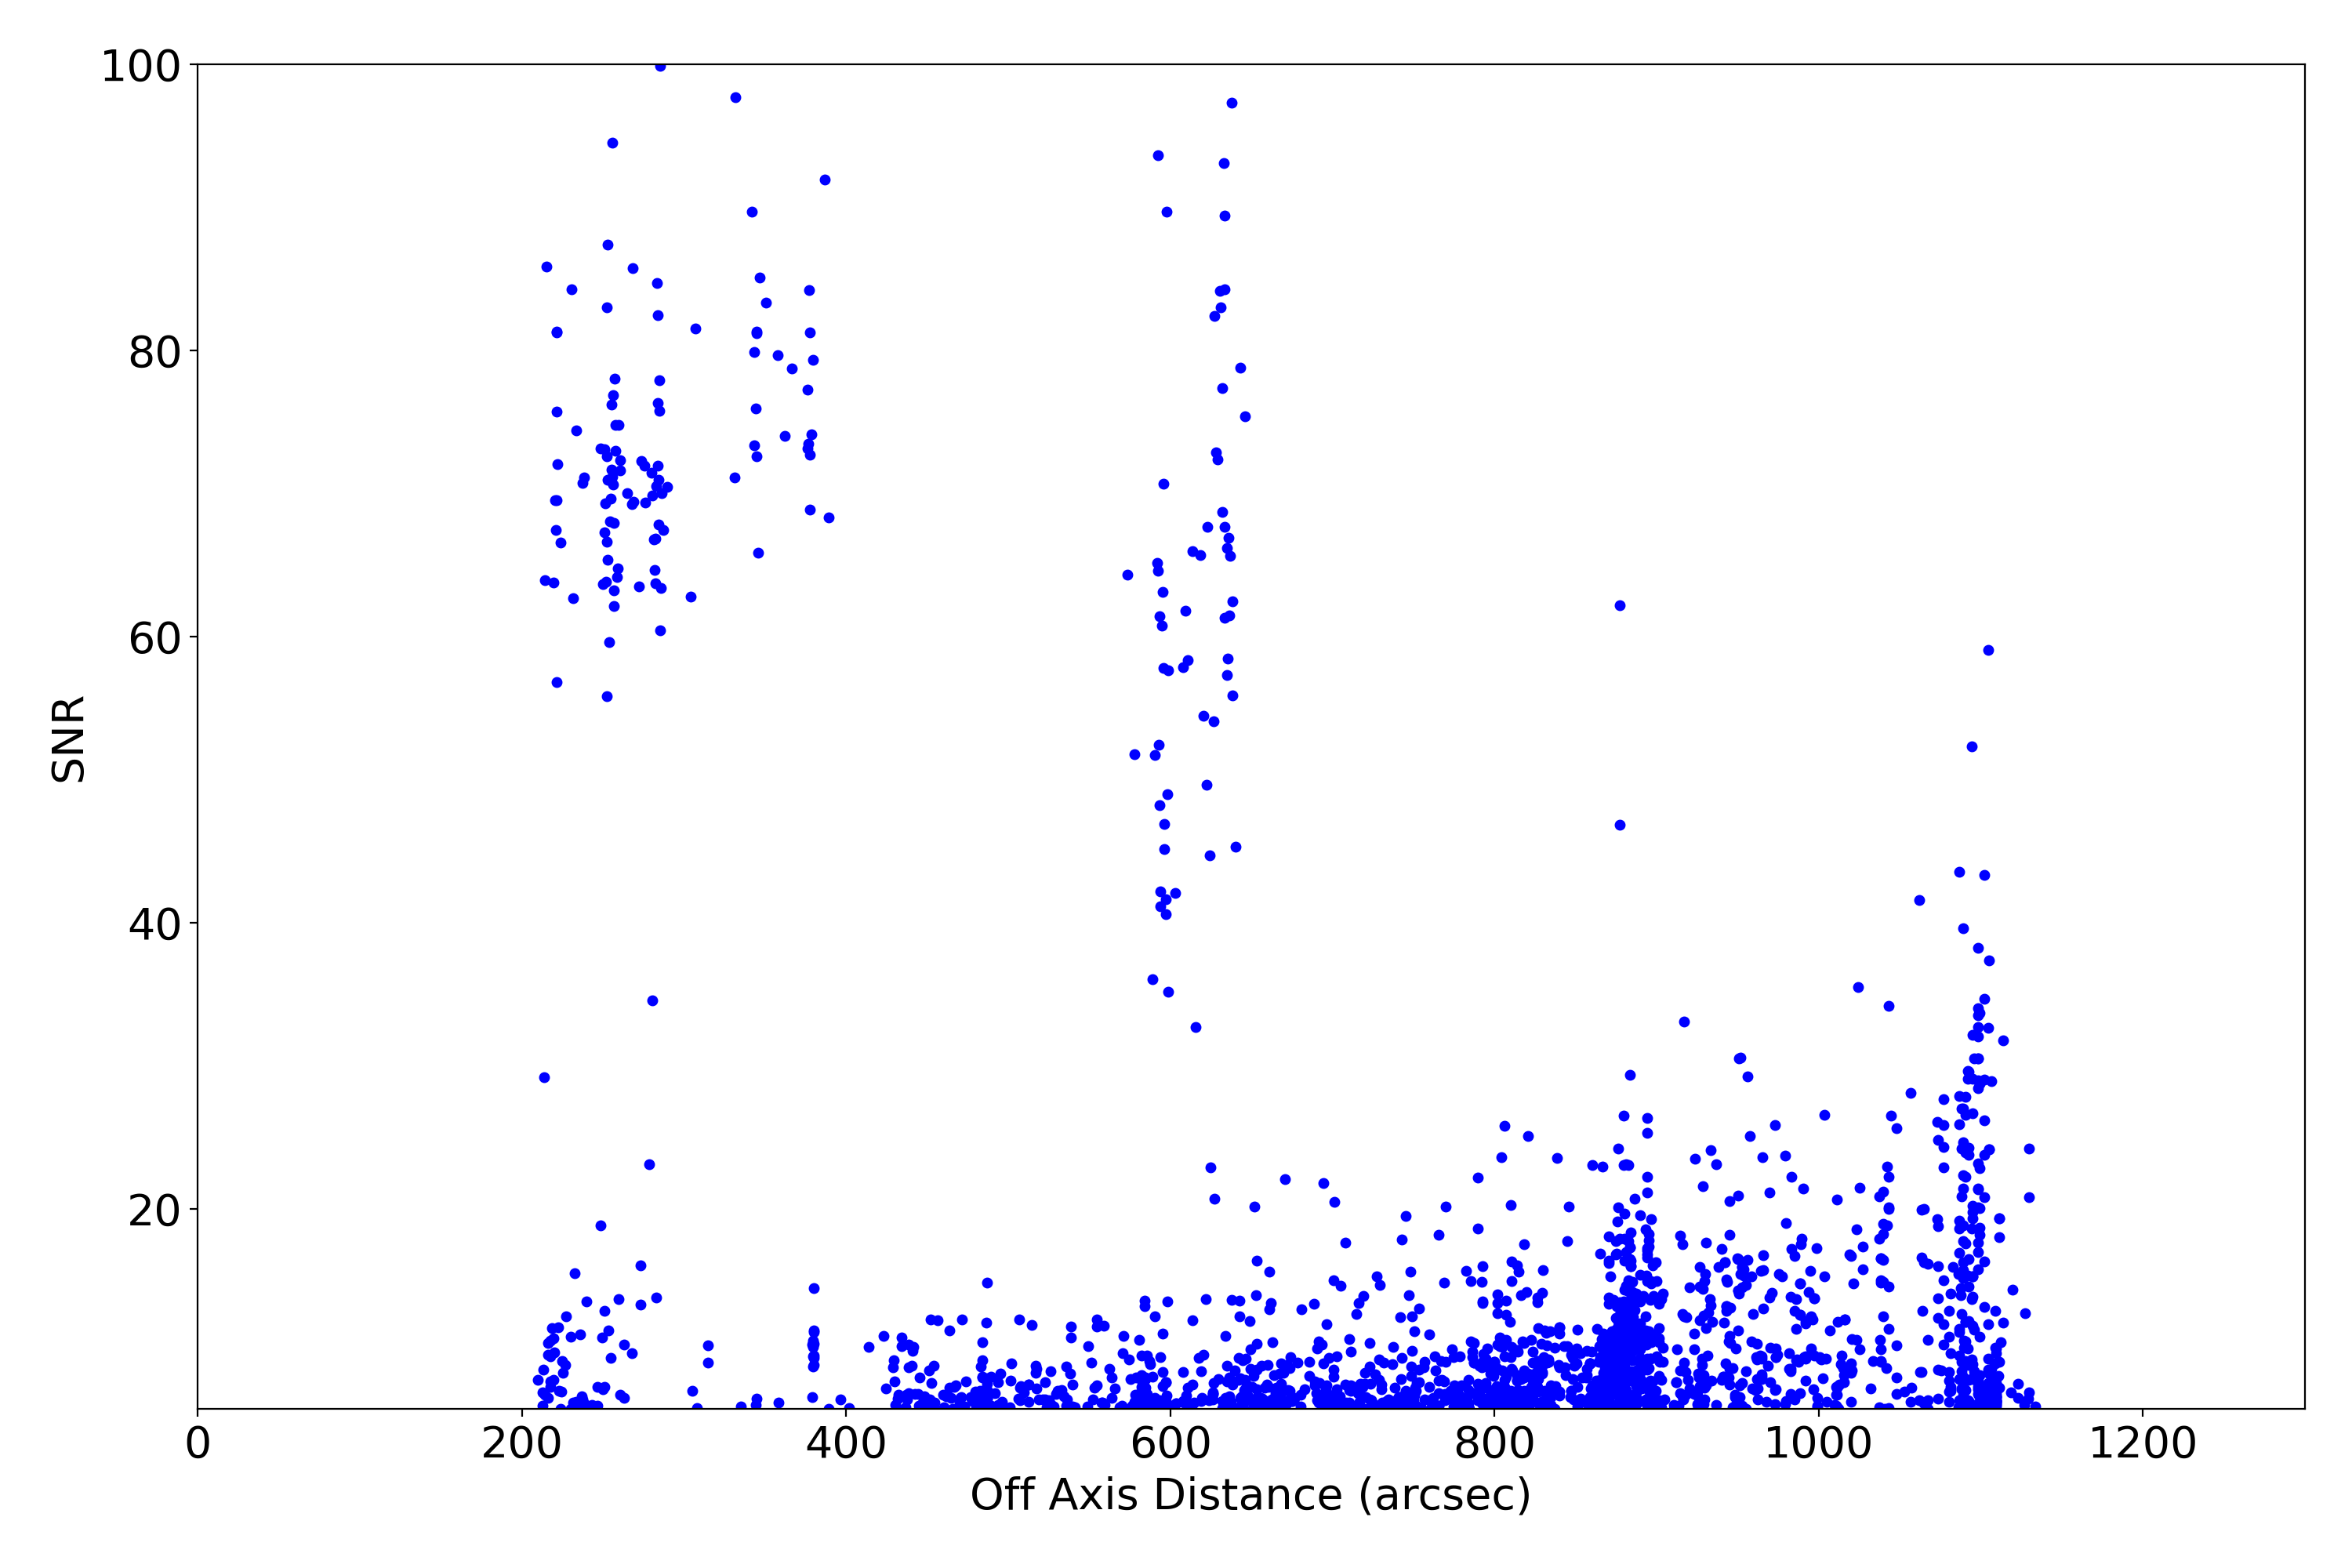
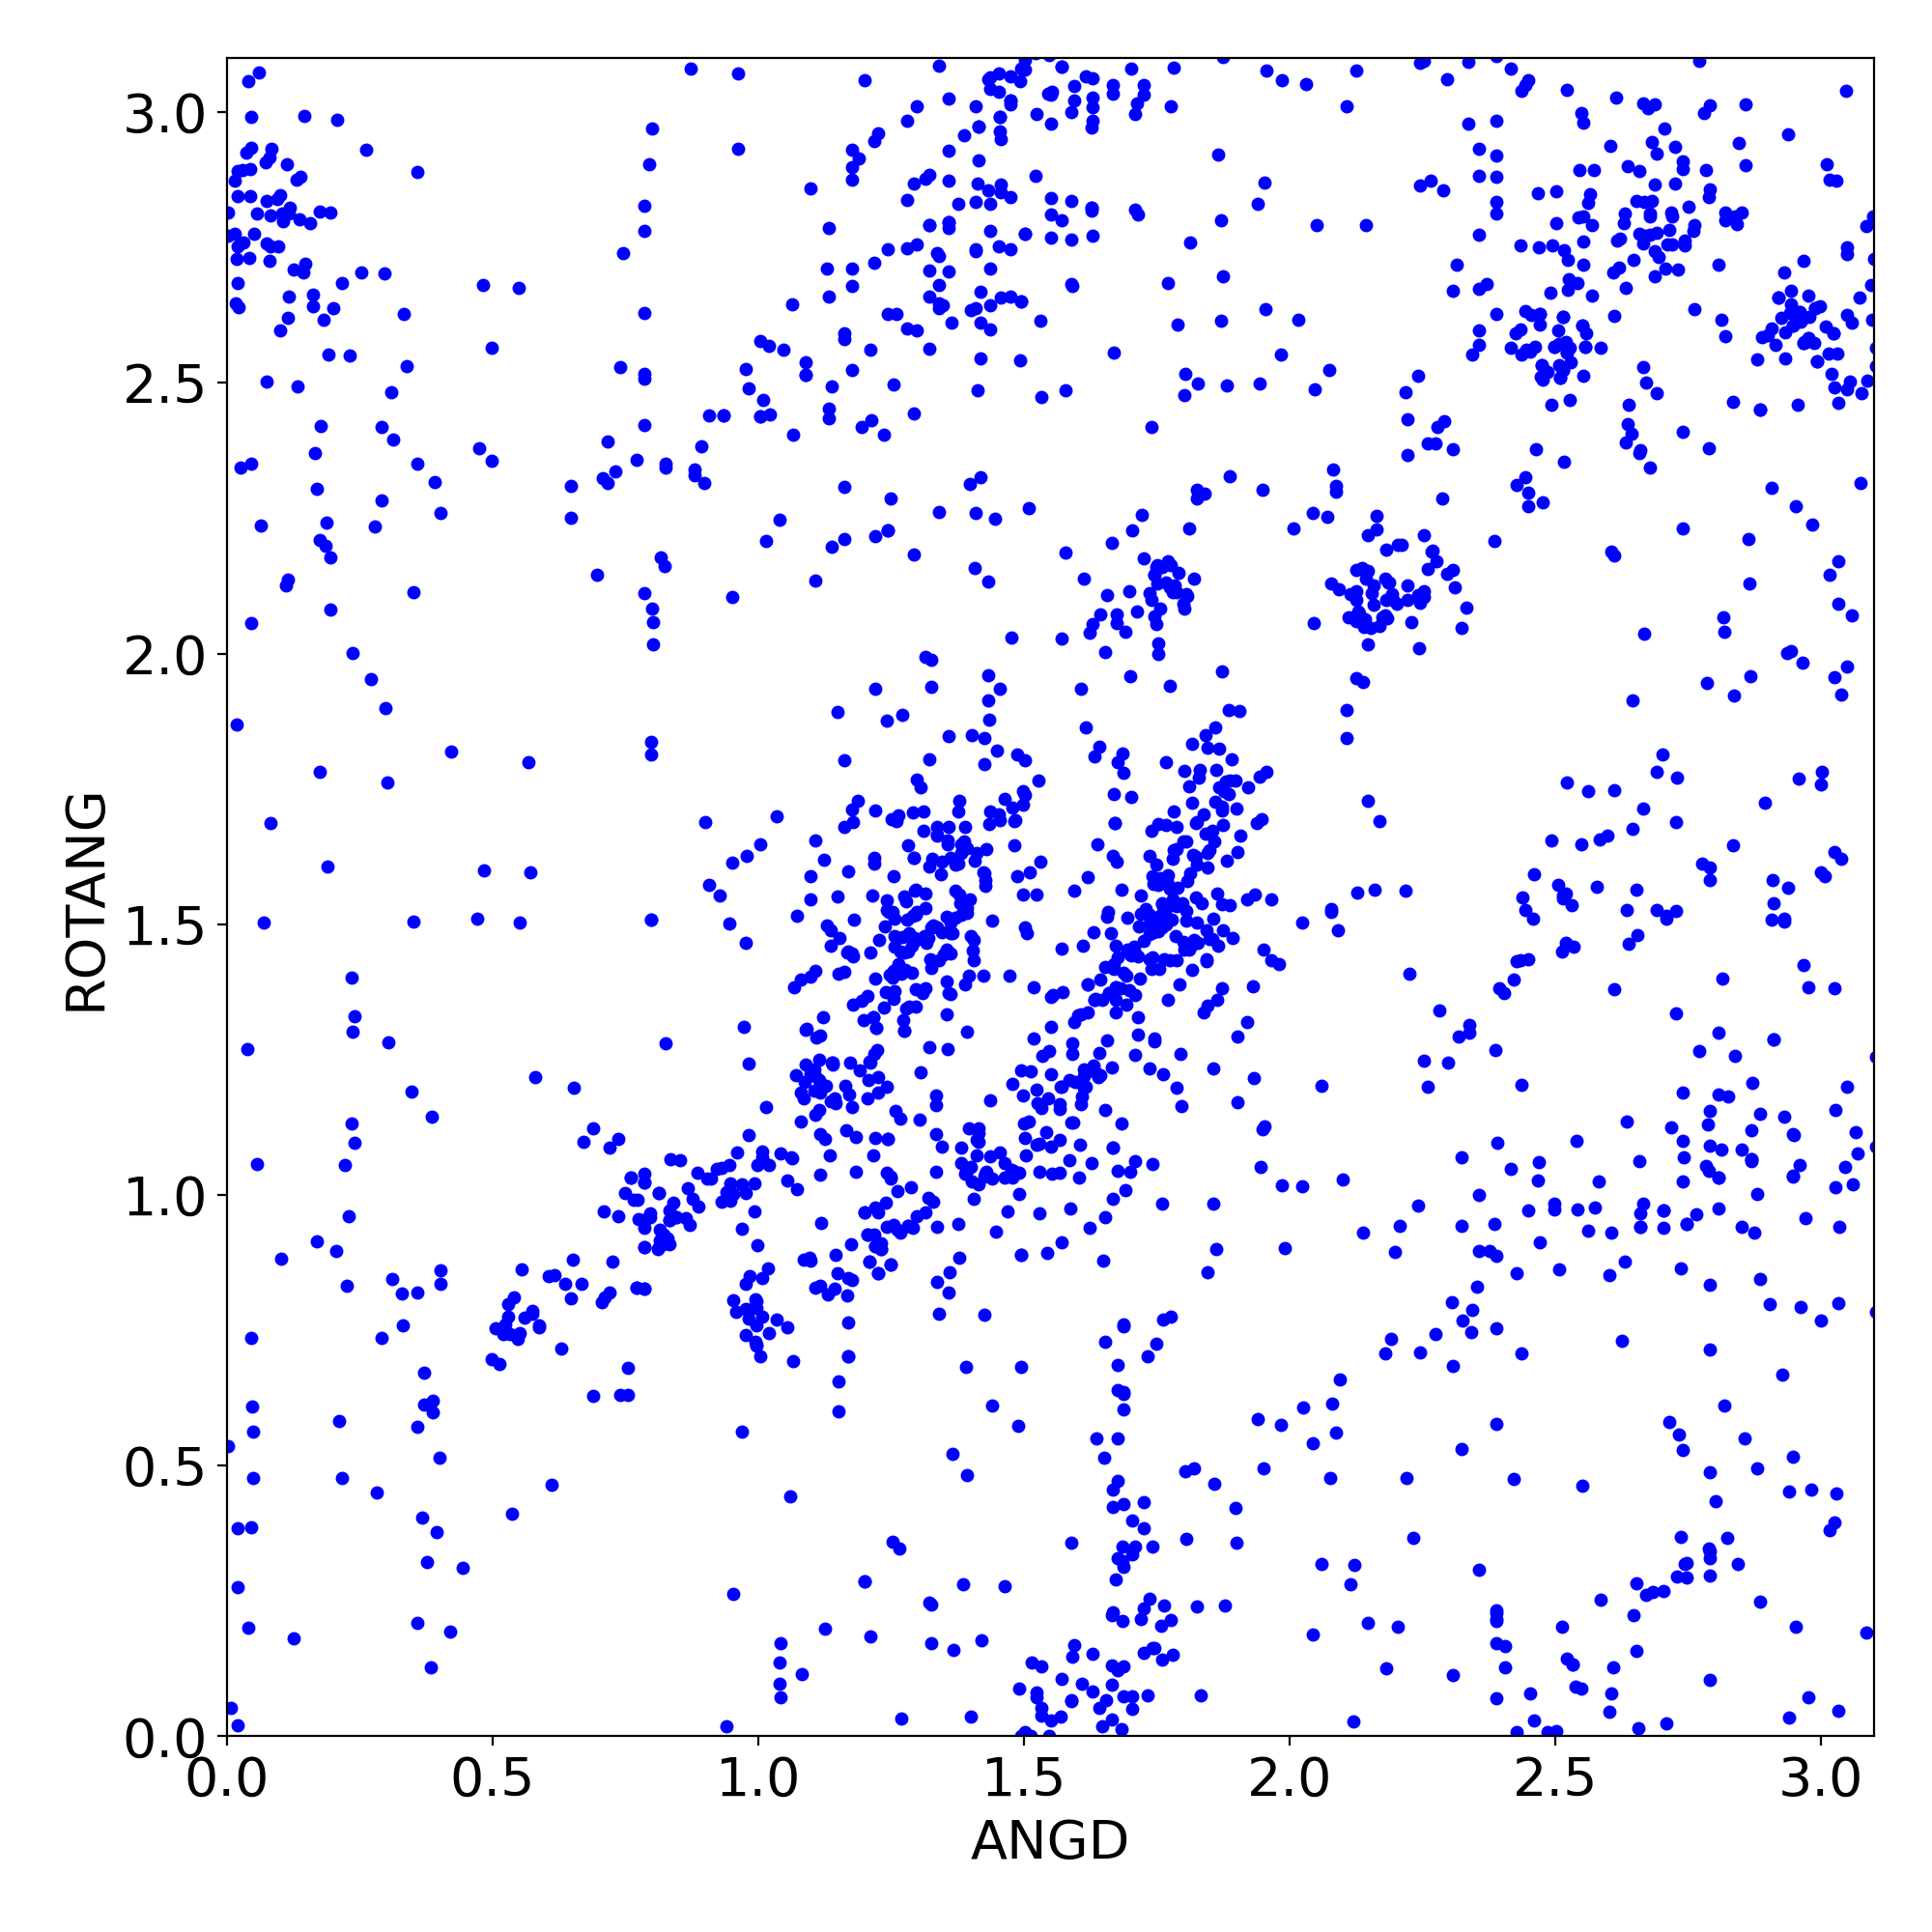
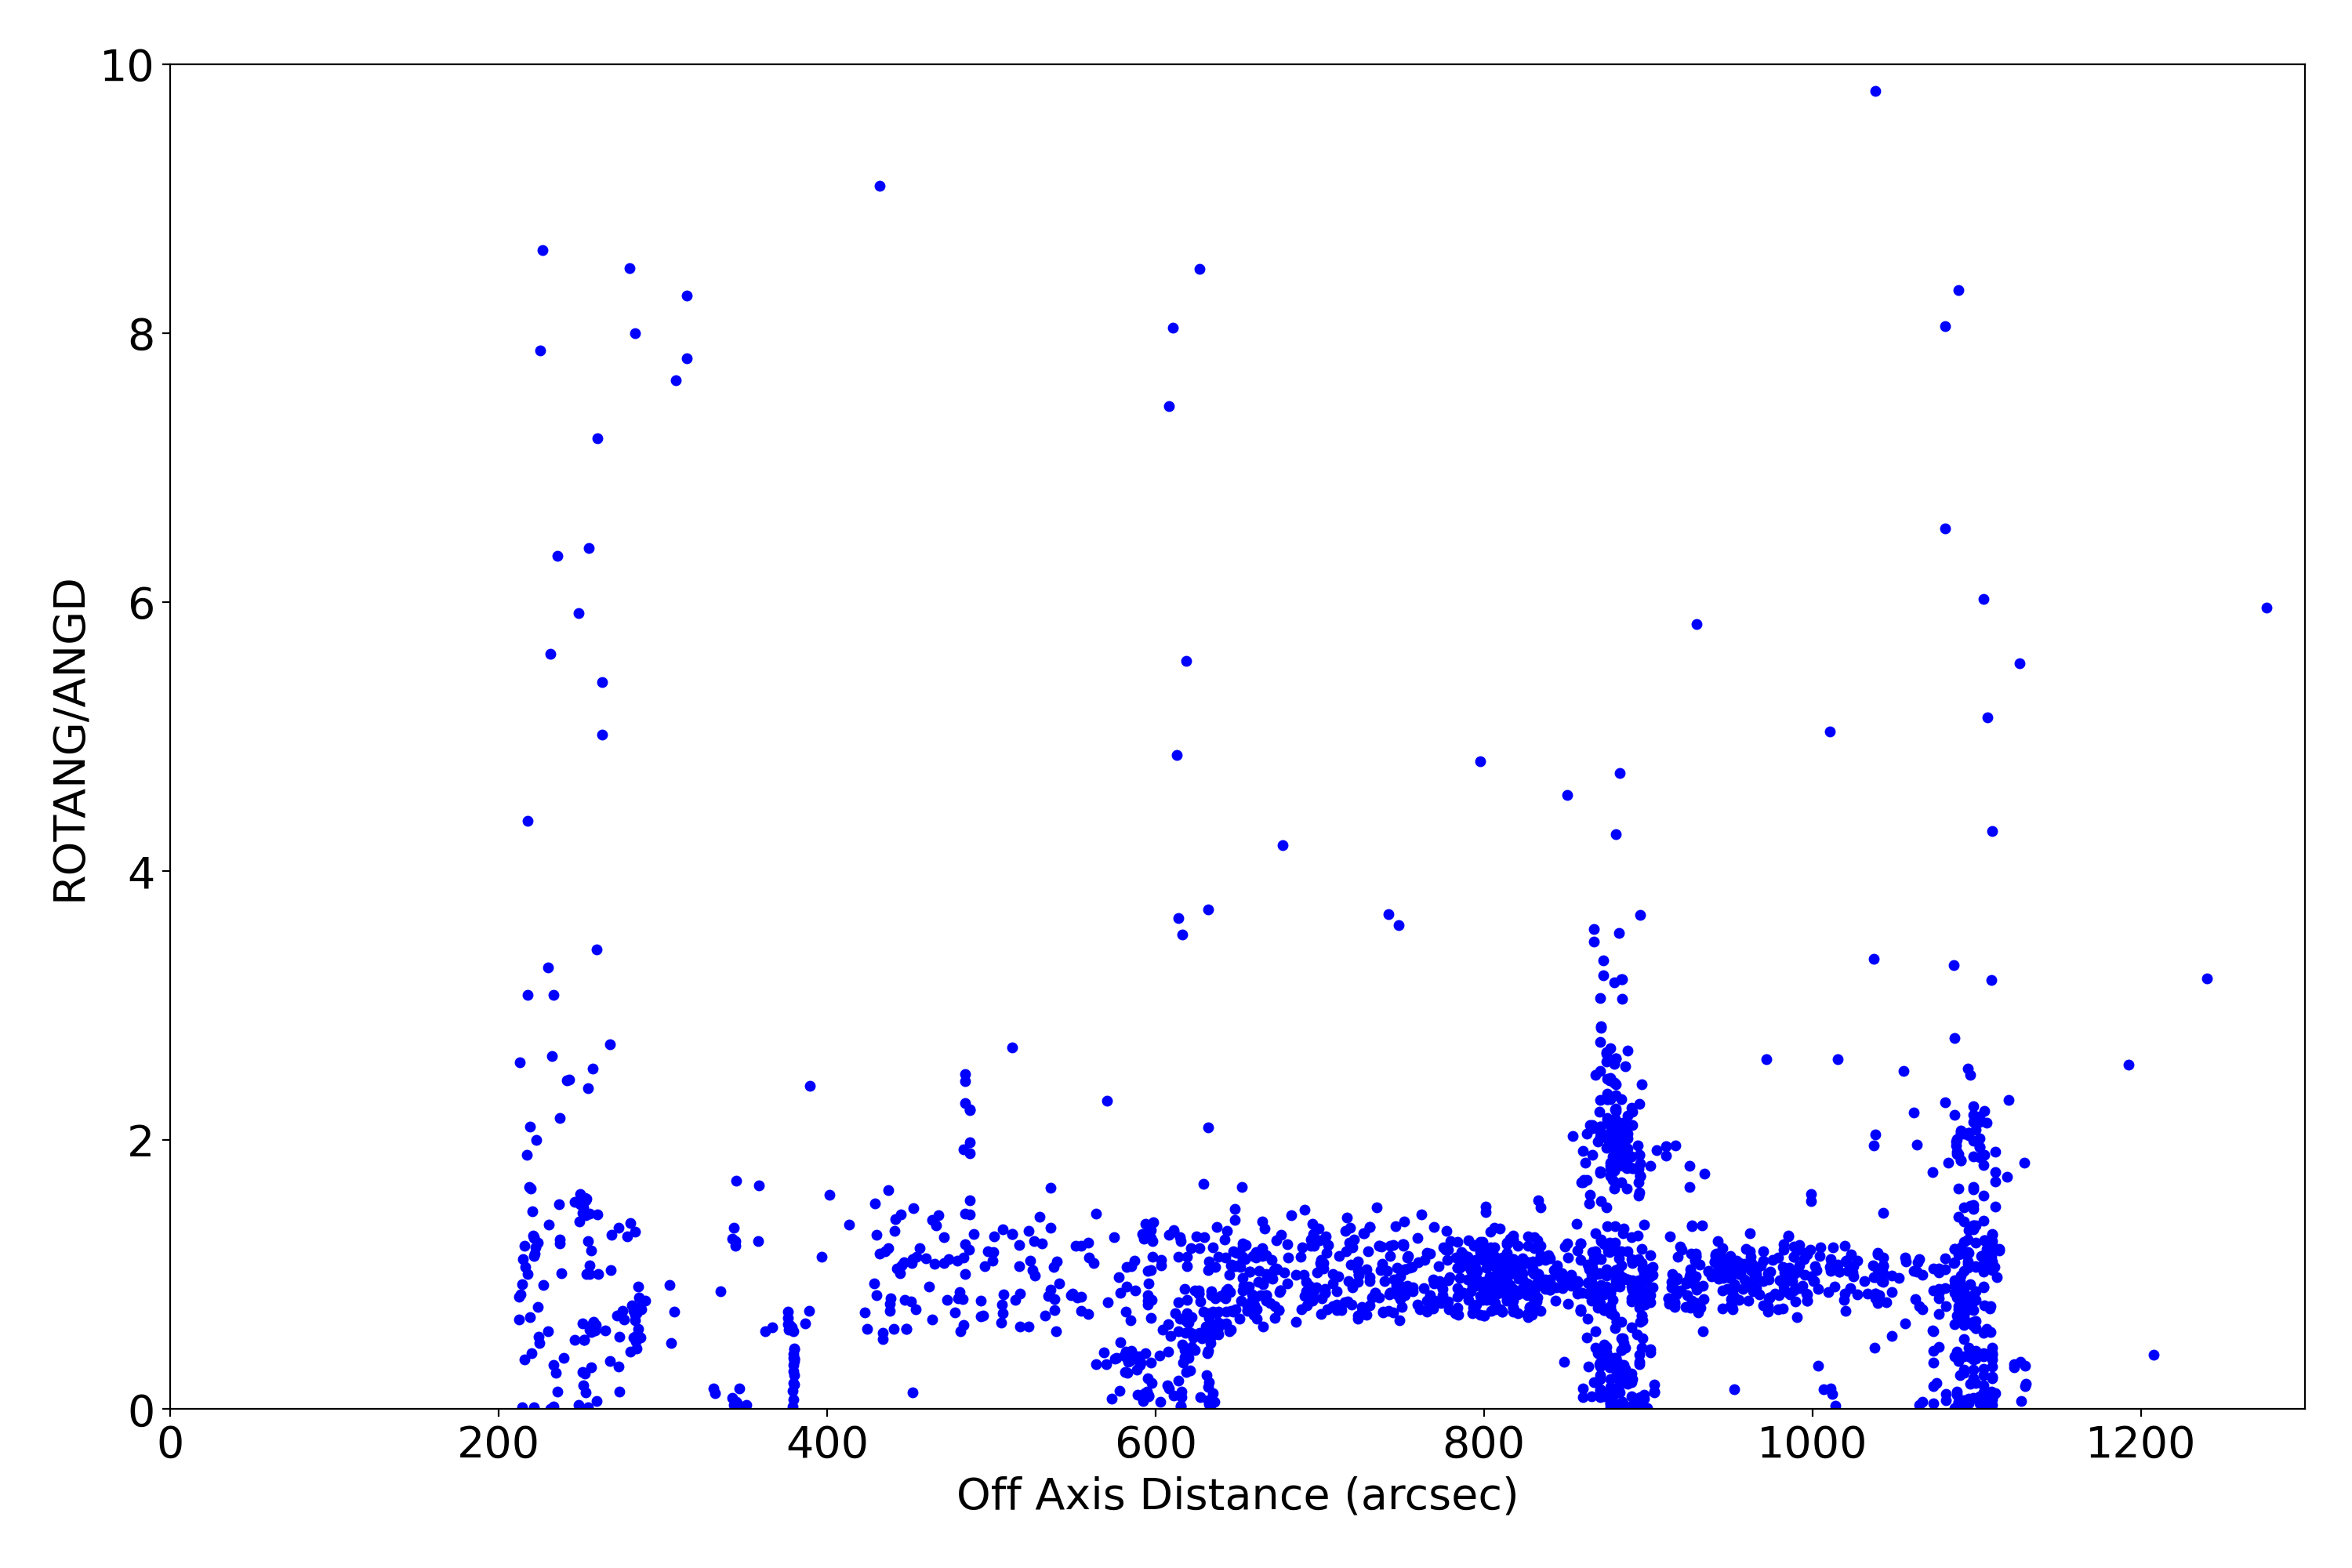
Plots below show various characteristics of detected imaging sources. Standard level 2 data products (*src2.fits) are used. Only observations with focus (sim_x) within 0.01 mm of nominal value for given SI configuration are used. Sources are also filtered for strength (SNR > 15).
| XY | PSF | Roundness | EE Radius | SNR | Rotation | Rotation2 | |
|---|---|---|---|---|---|---|---|
| ACIS I | 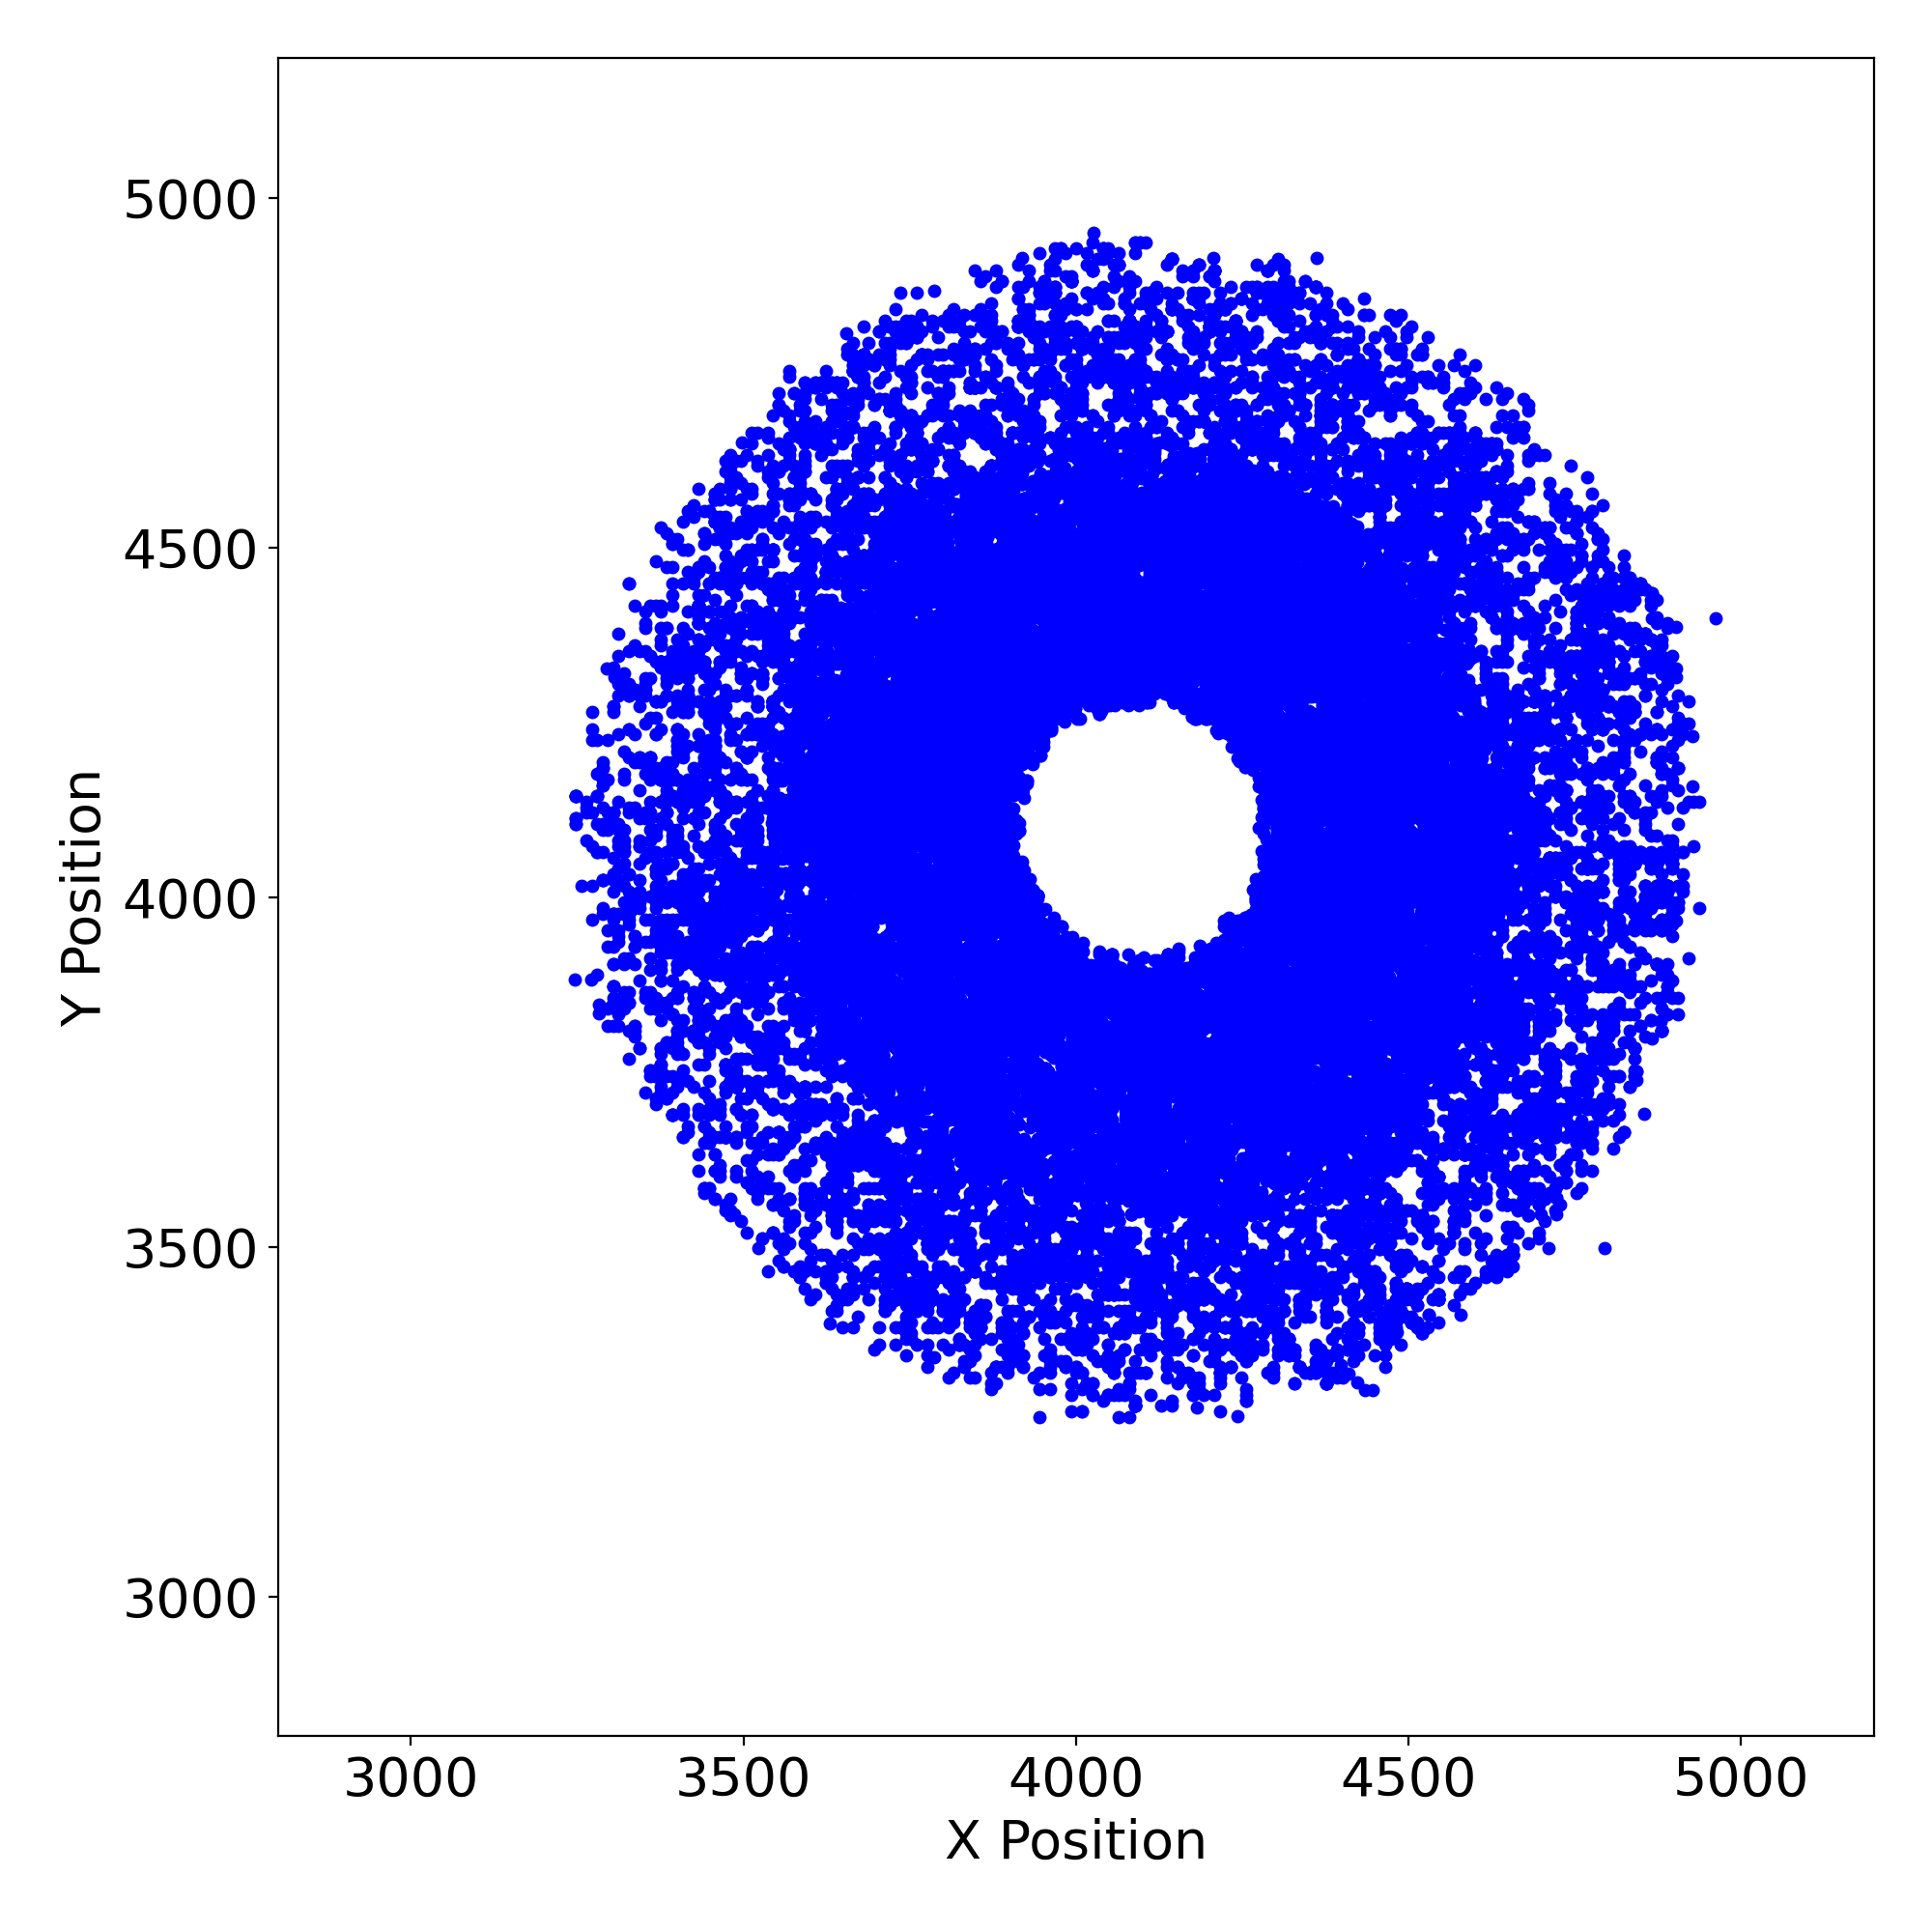 |
 |
 |
 |
 |
 |
 |
| ACIS S | 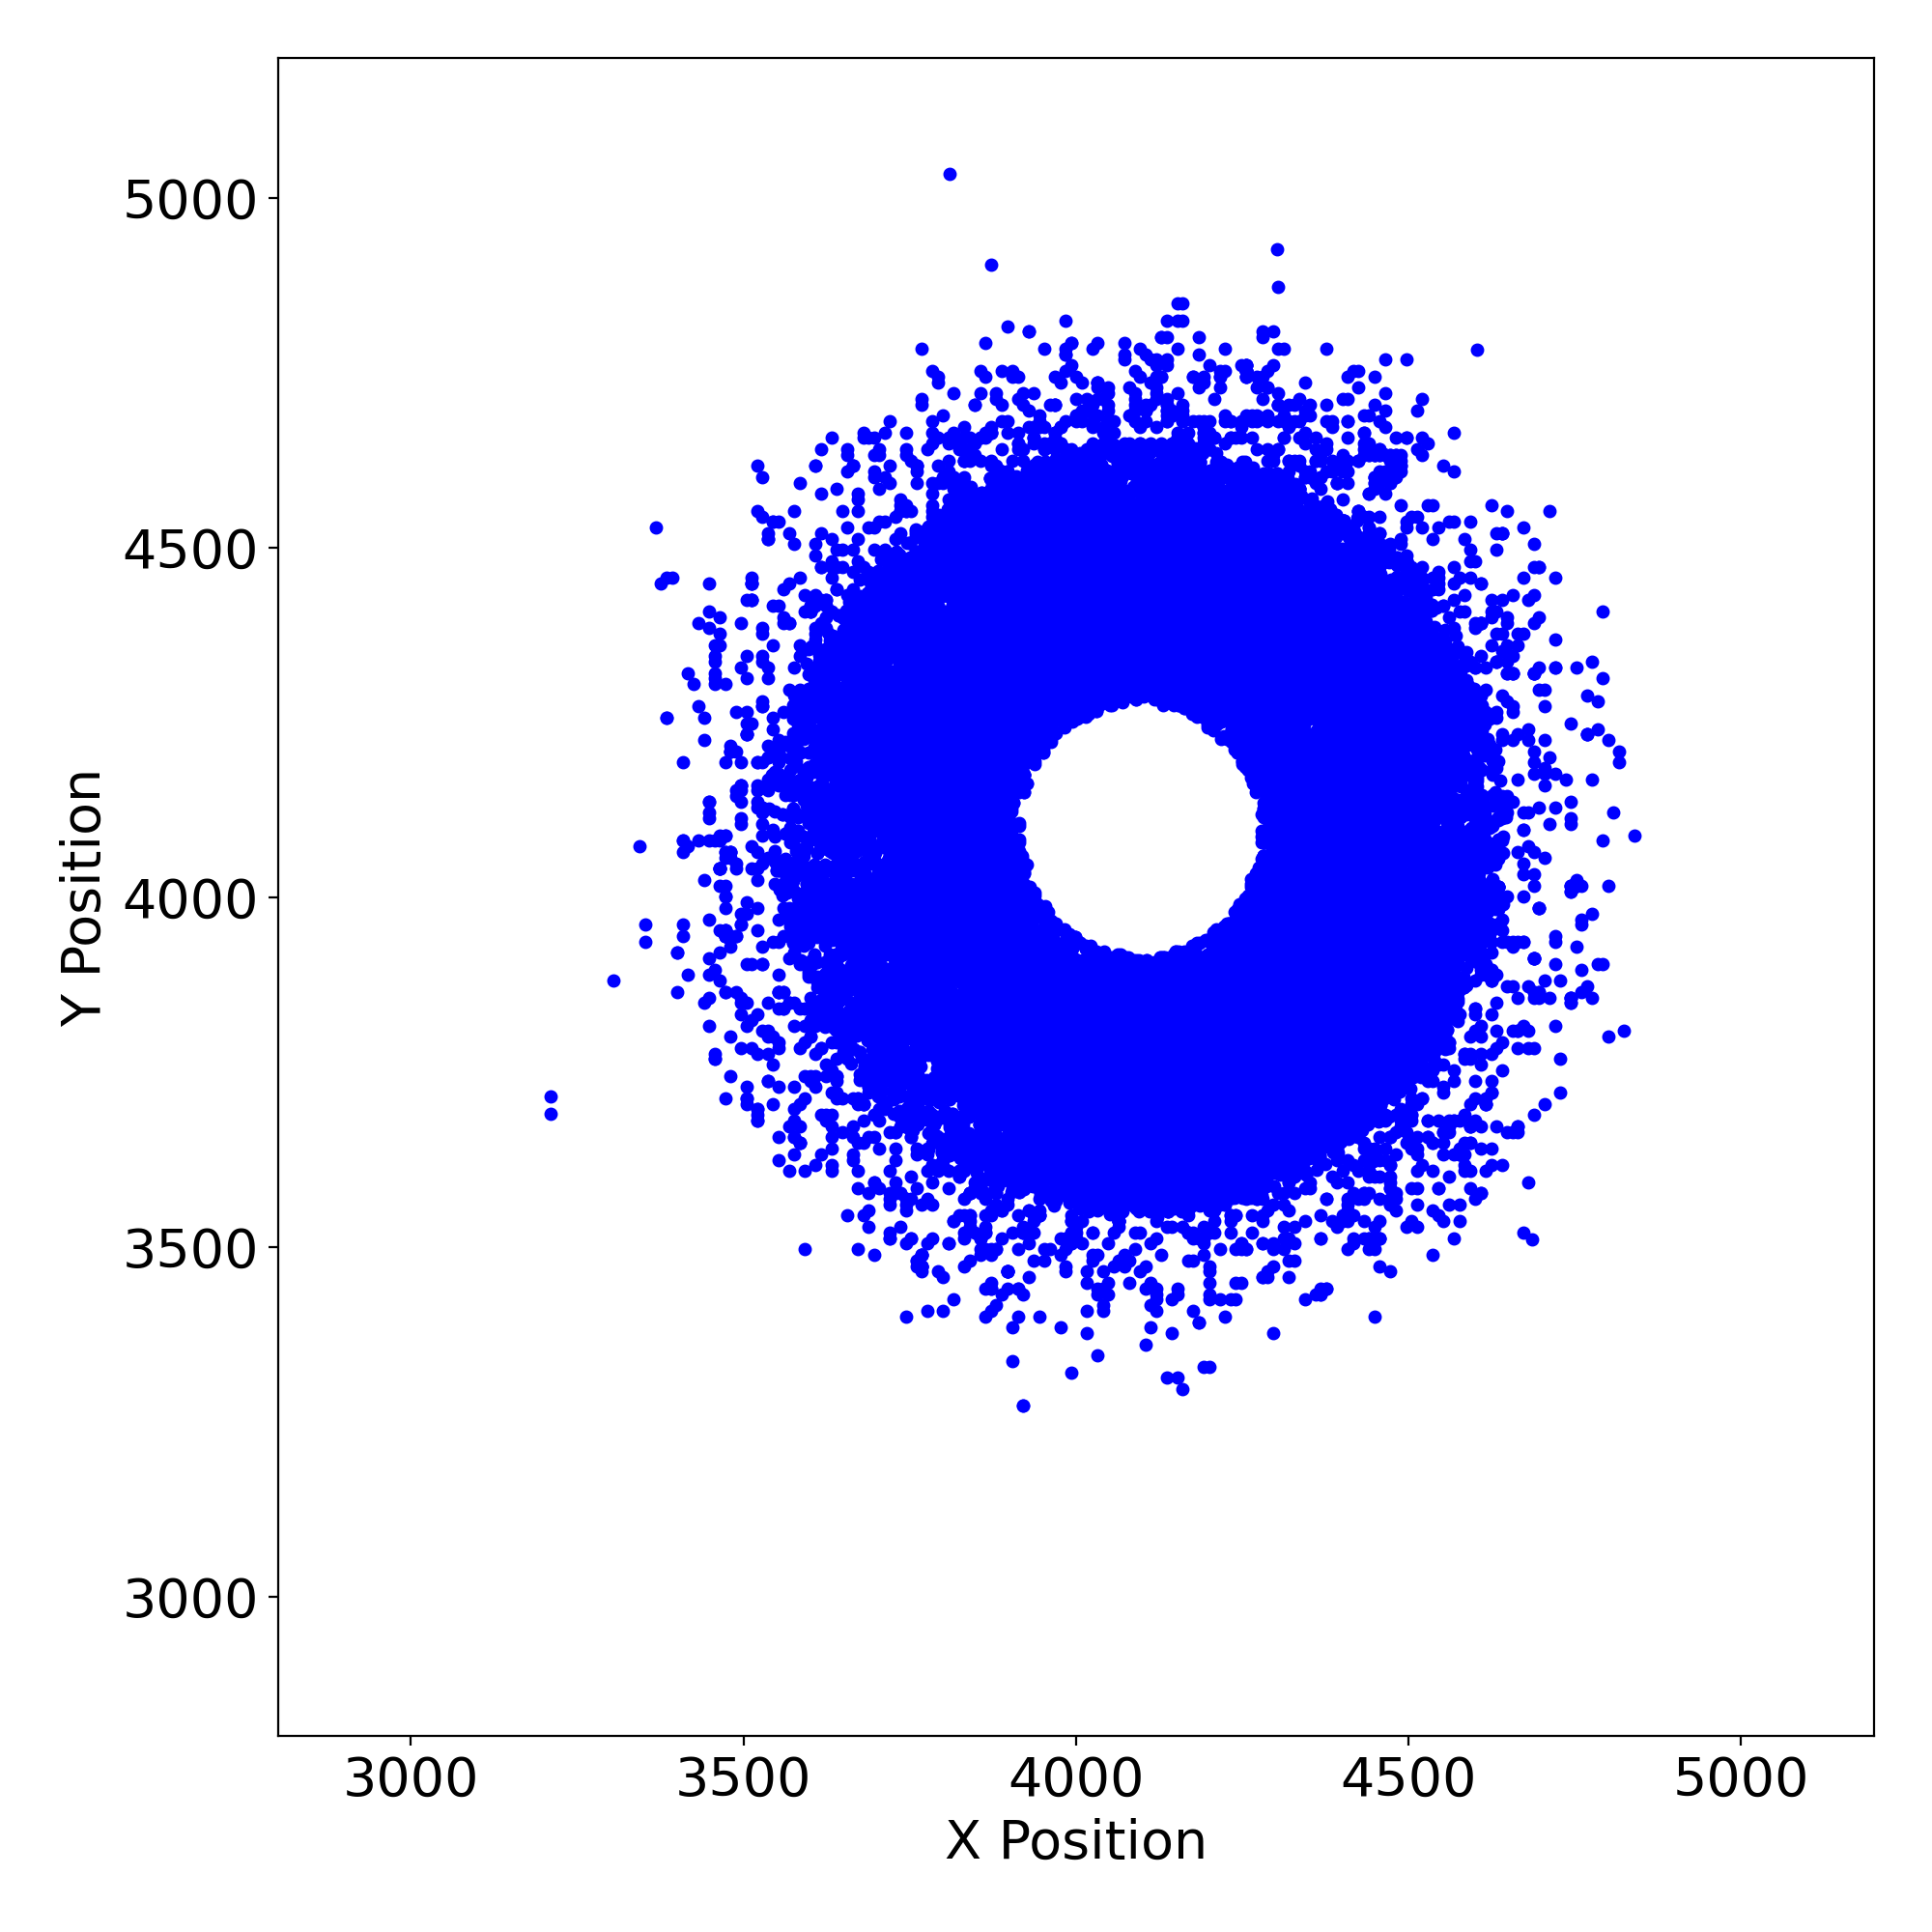 |
 |
 |
 |
 |
 |
 |
| HRC I | 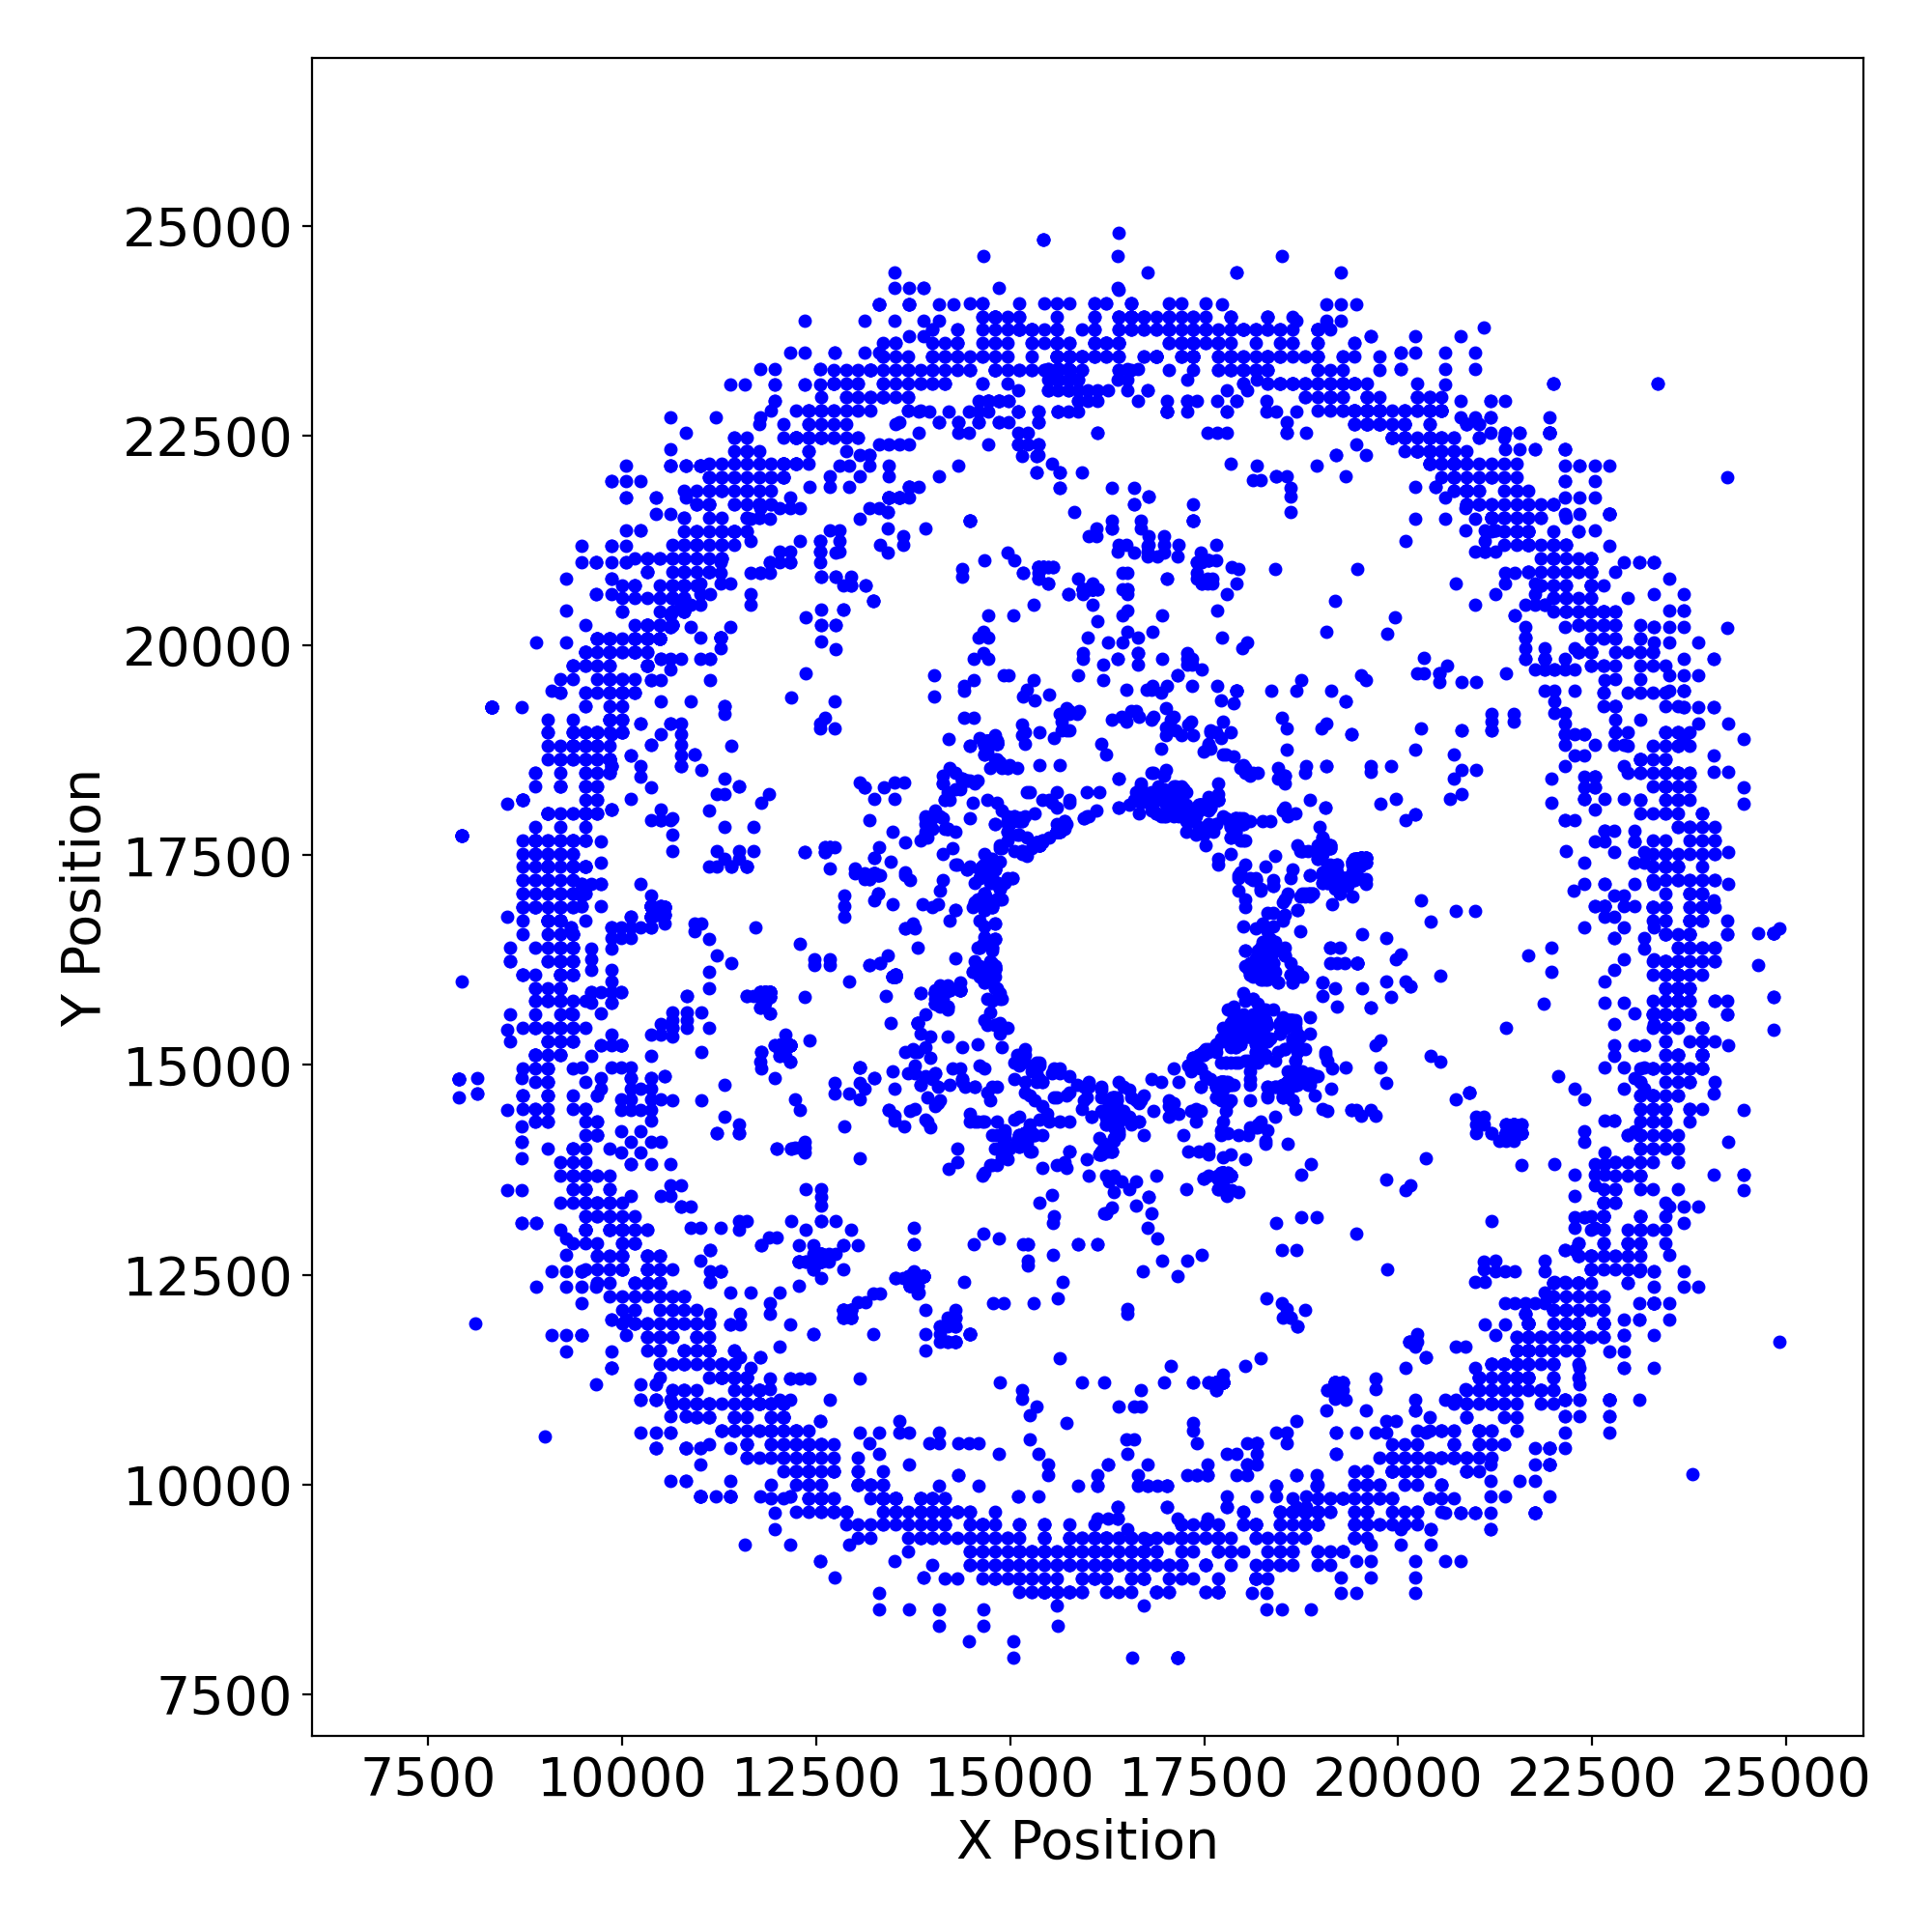 |
 |
 |
 |
 |
 |
 |
| HRC S | 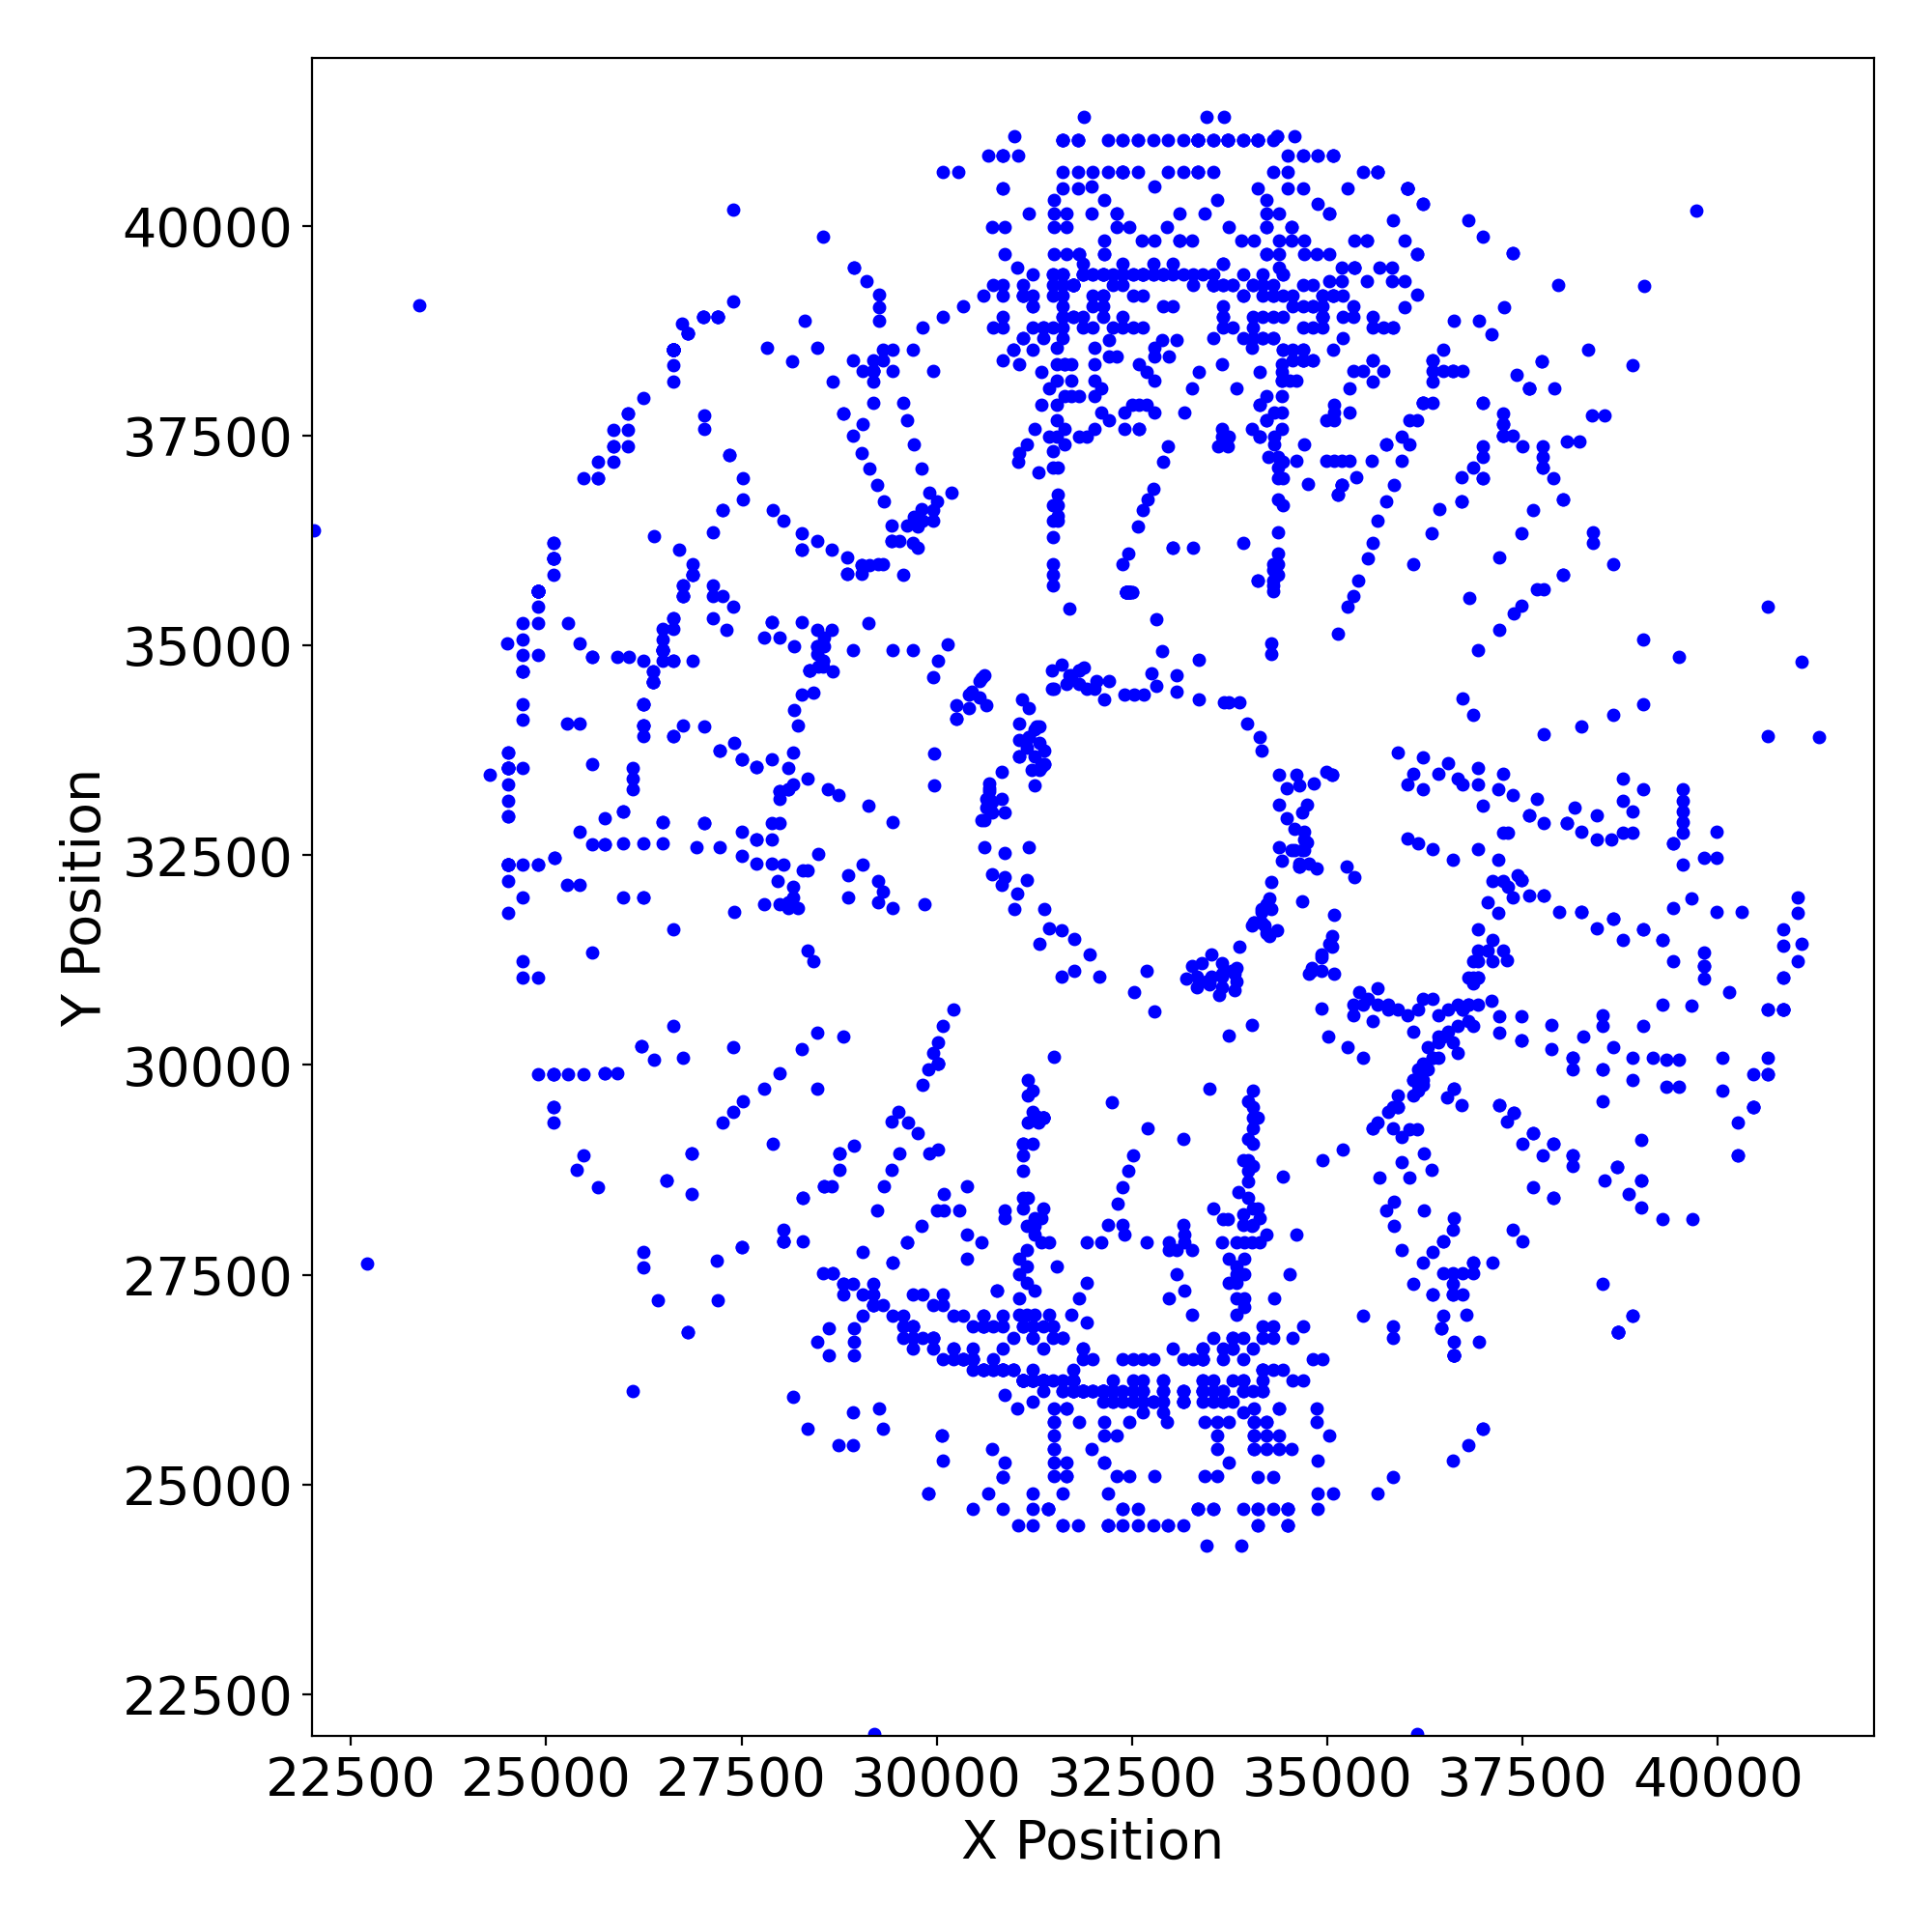 |
 |
 |
 |
 |
 |
 |
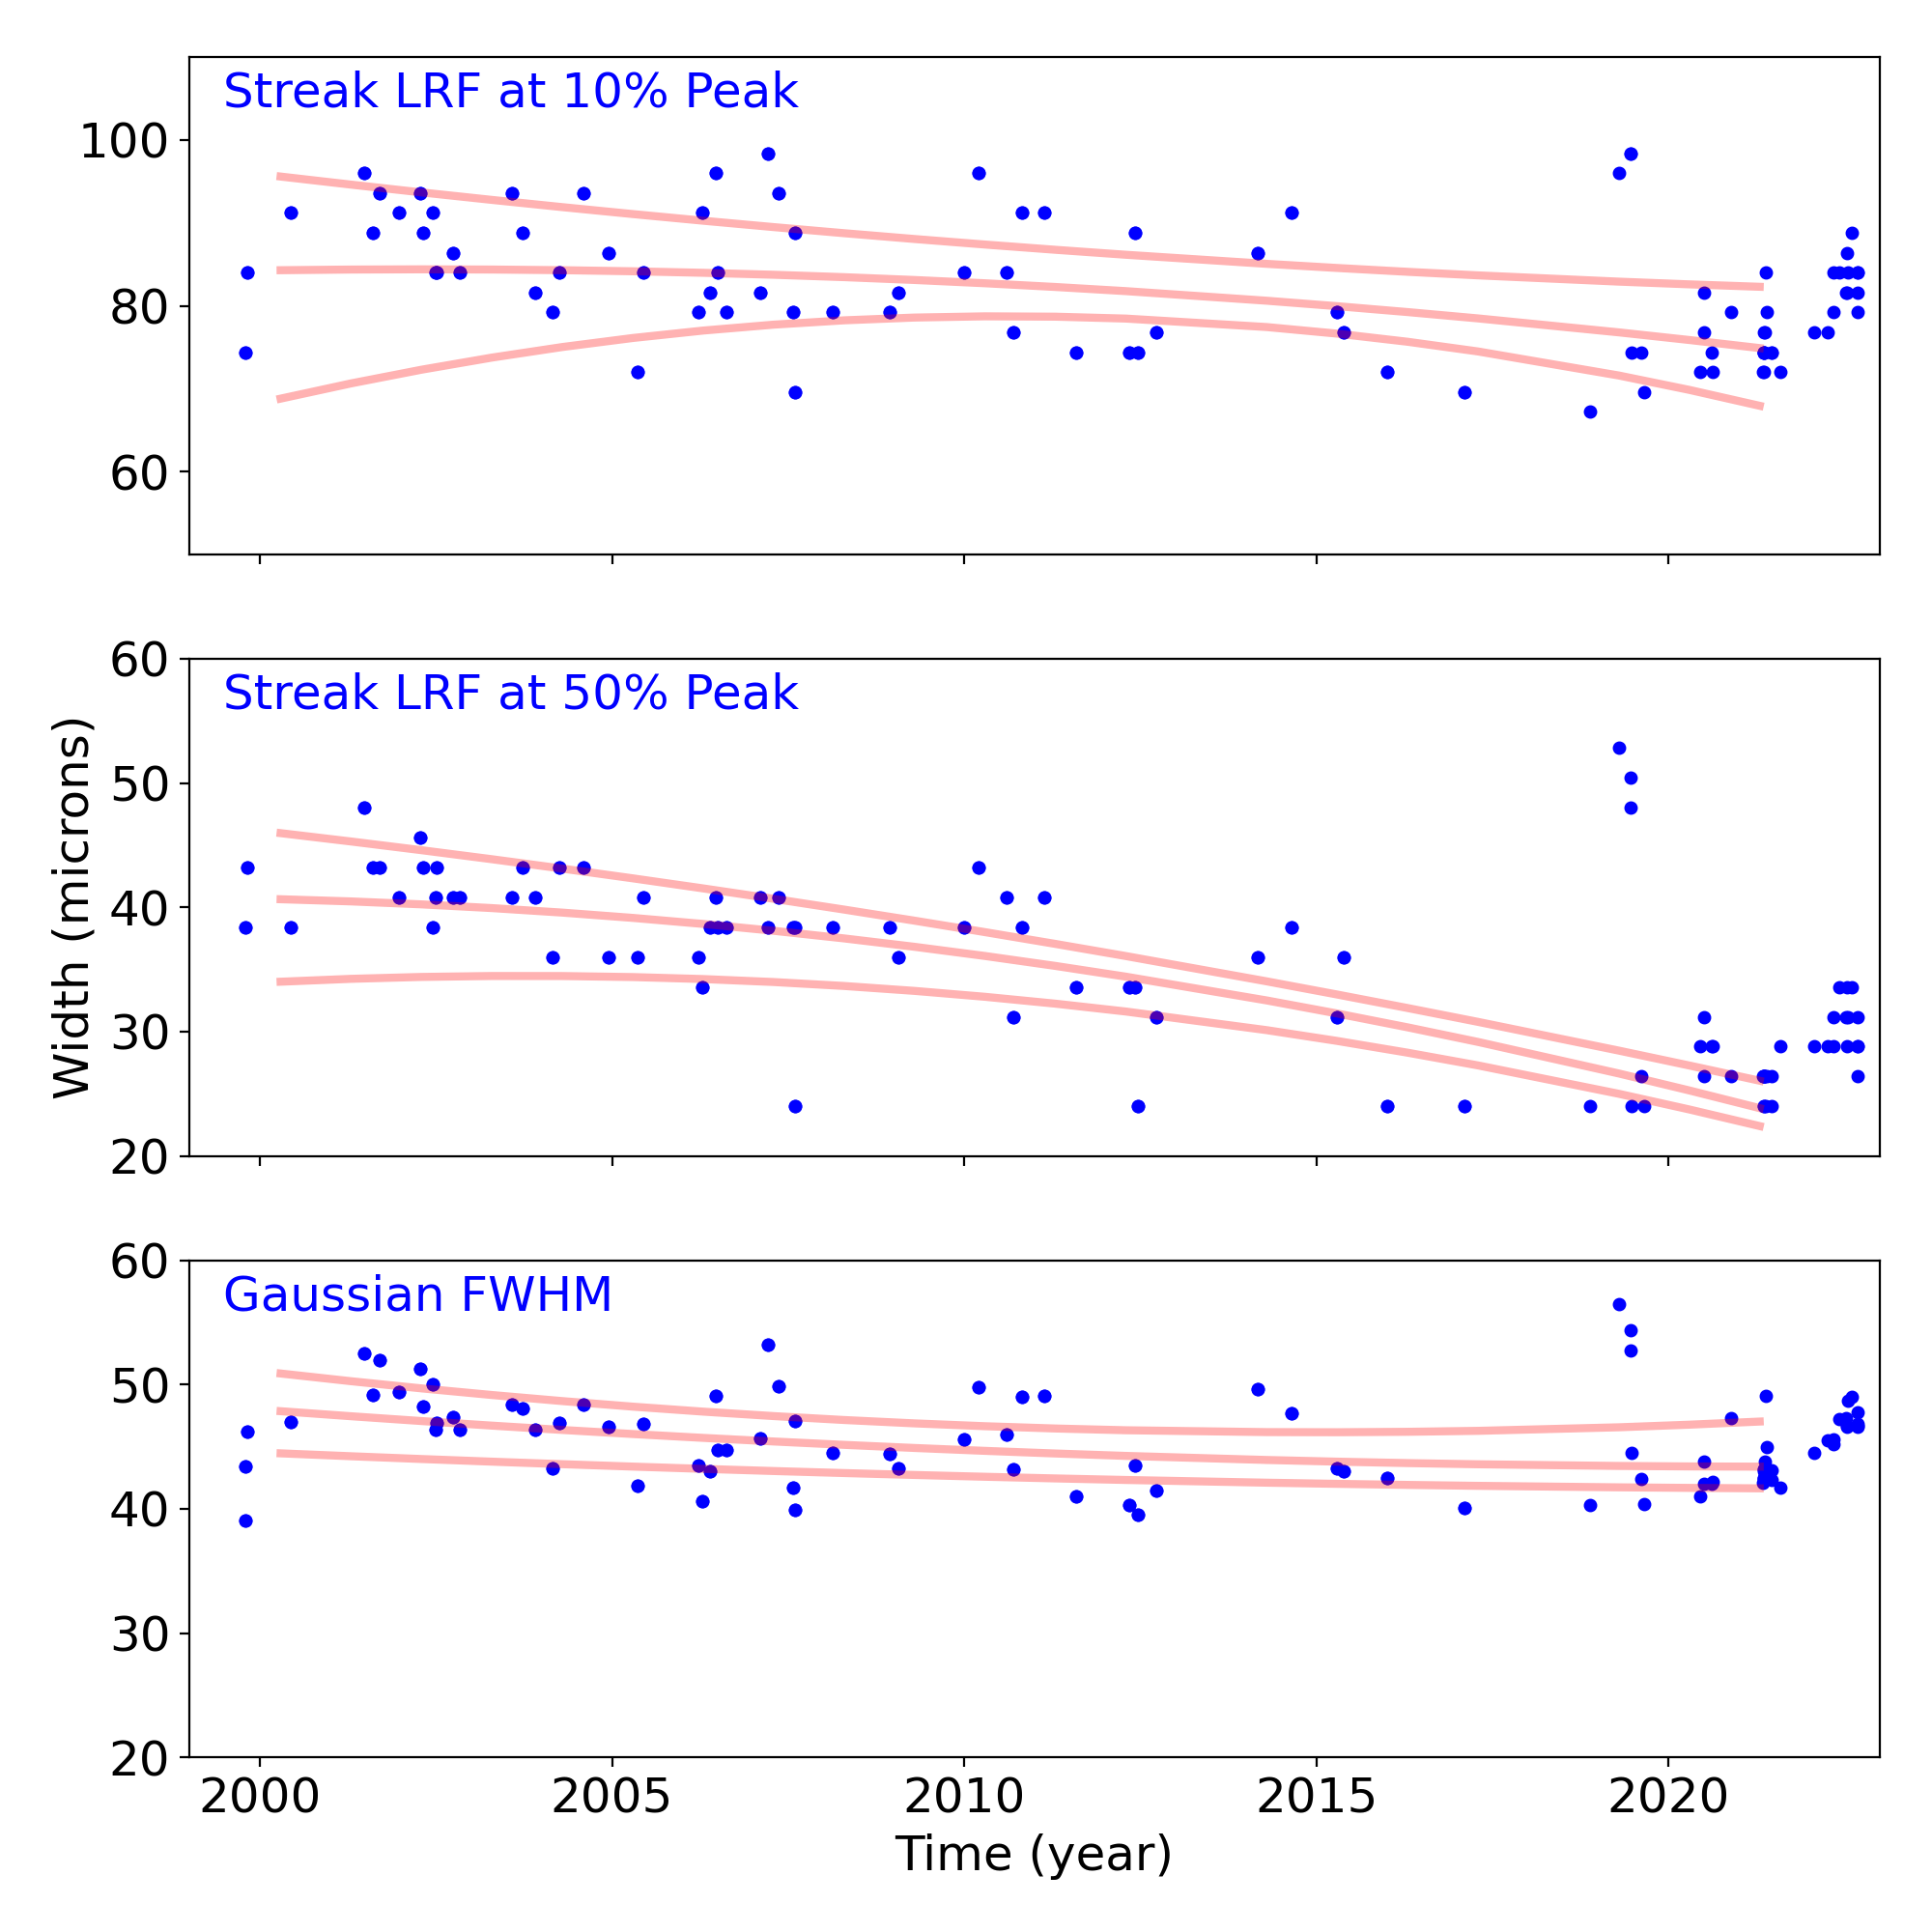
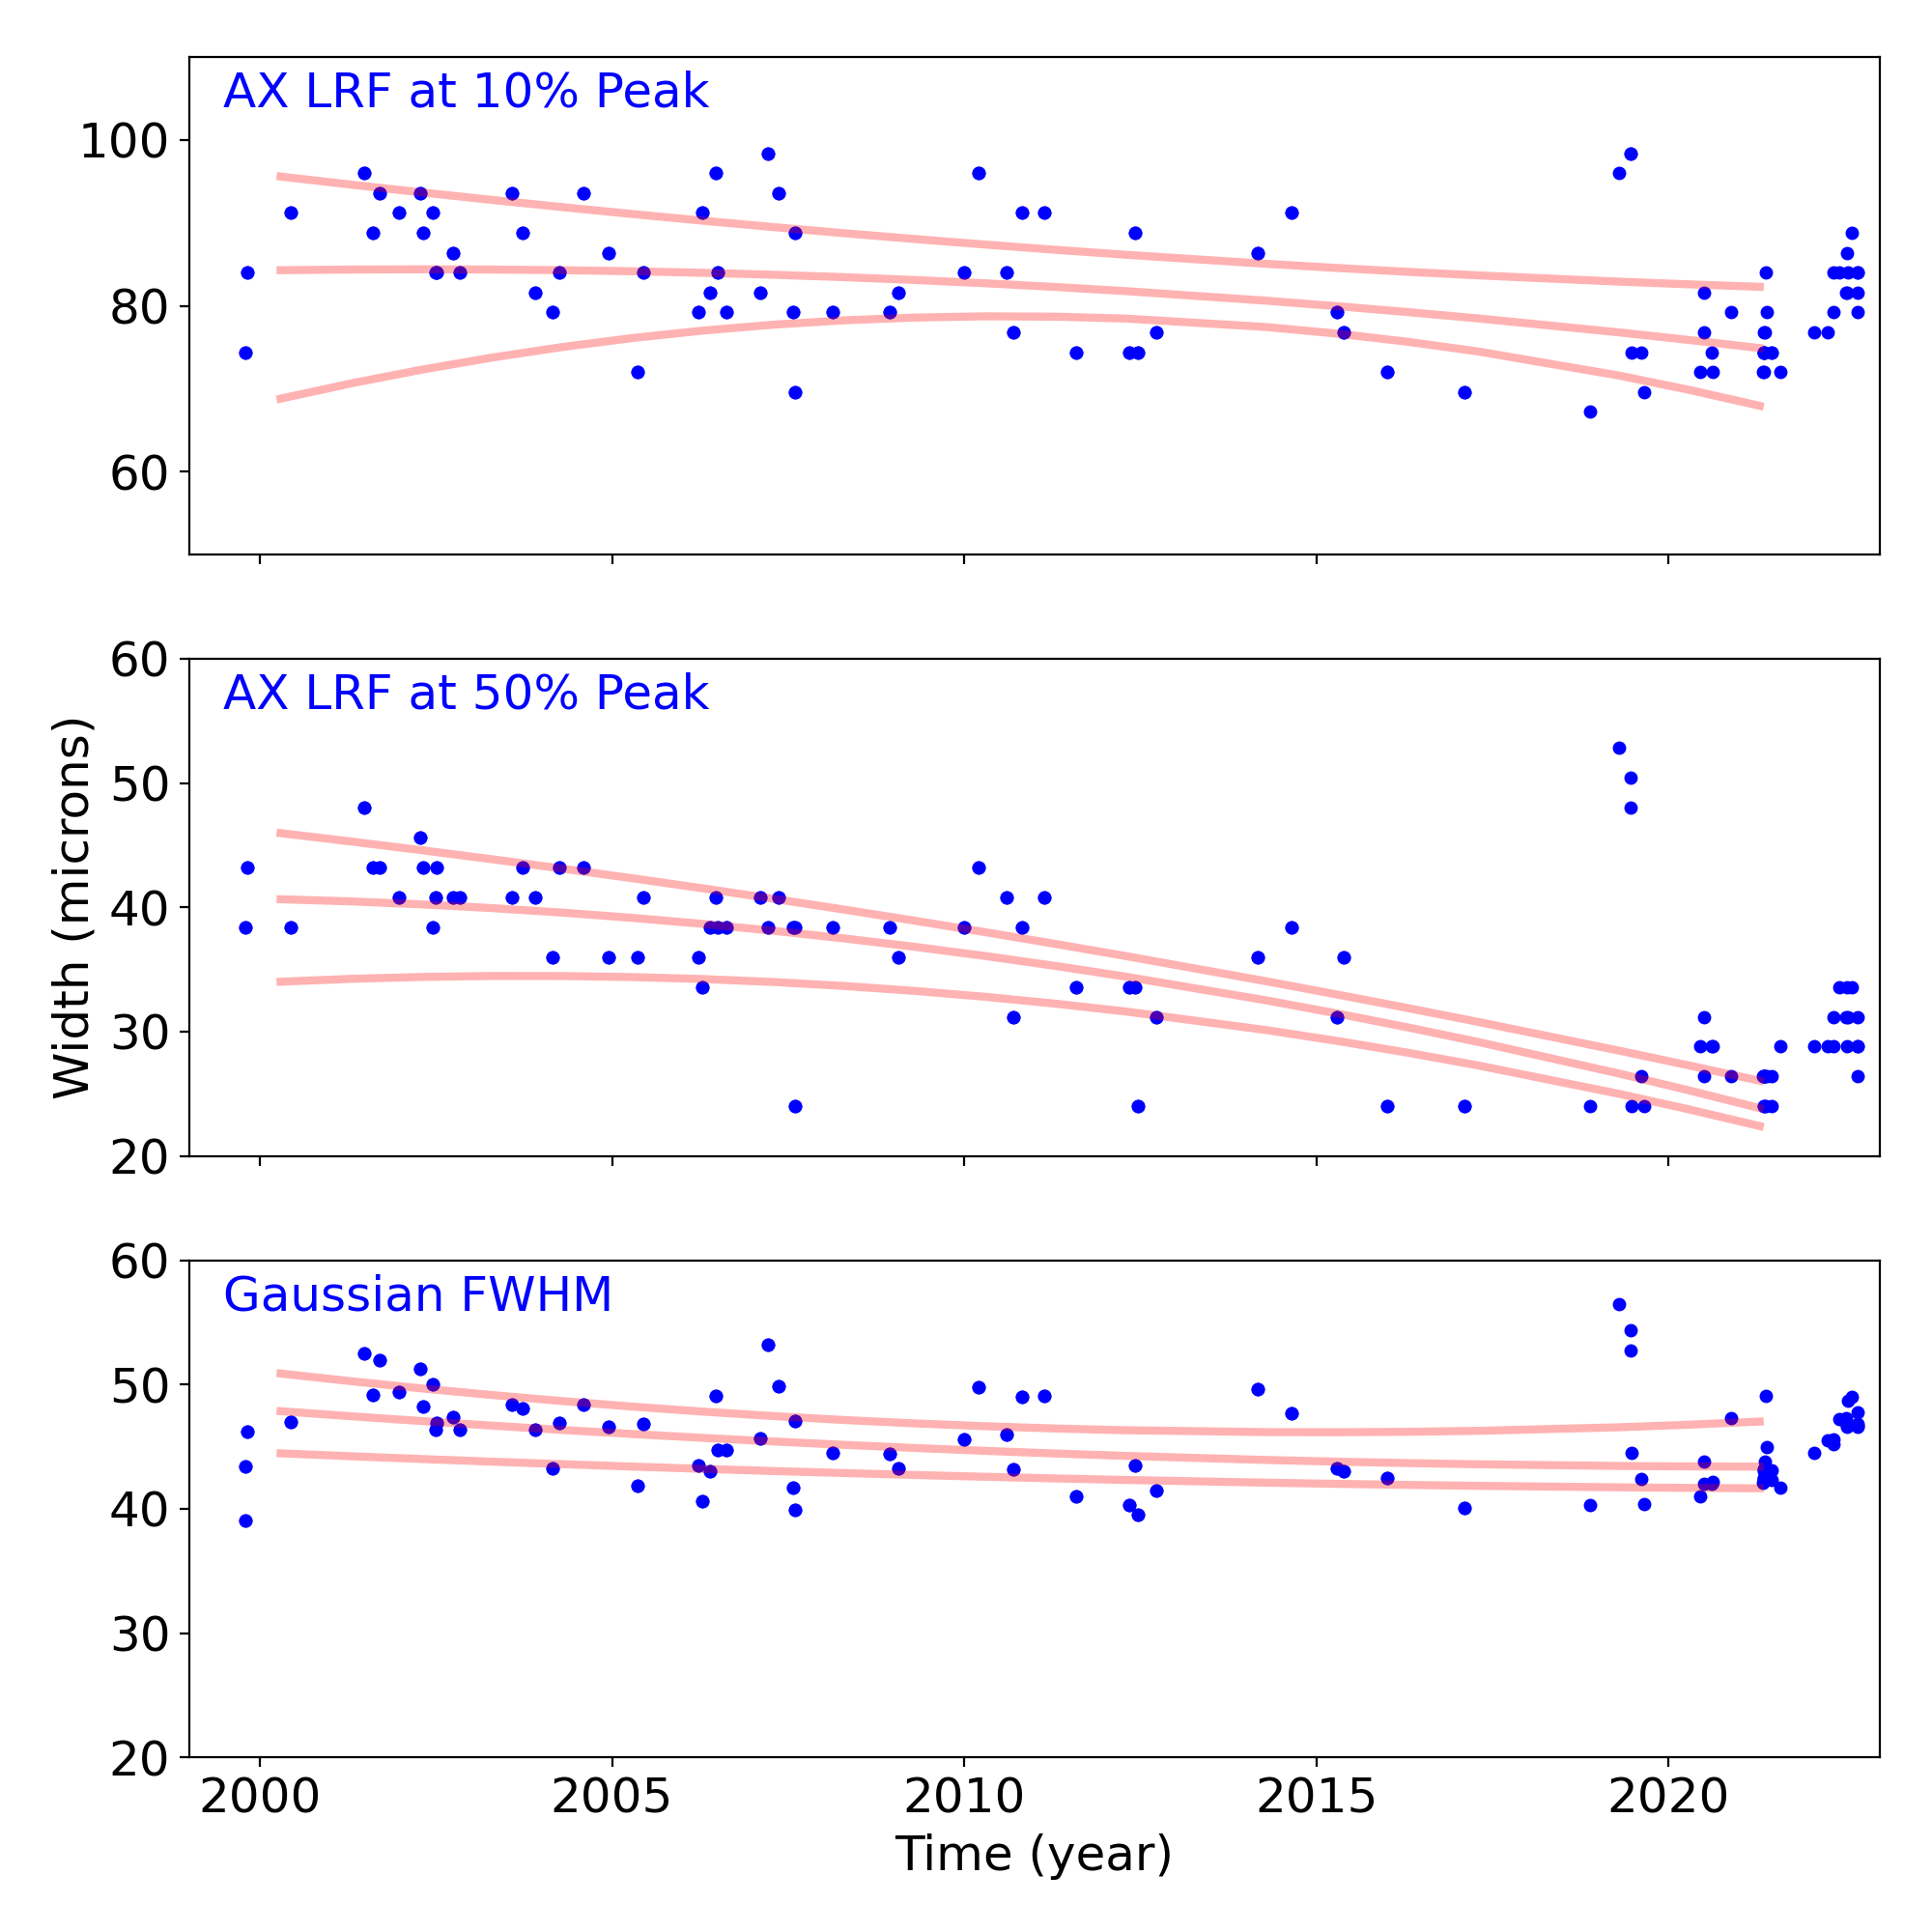
Gratings
Grating Trends/Focus
We plot the width of the zero order streak of ACIS/HETG observations and the width of the zero order image for HRC/LETG observations of point sources. No significant defocusing trend is seen at this time. See Gratings Trends pages.
PCAD
ACA Trending
| ACIS |
)
|
)
|
)
|
|
|---|---|---|---|---|
)
|
)
|
)
| ||
| HRCI |
)
|
)
|
)
|
)
|
| HRCI |
)
|
)
|
)
|
)
|
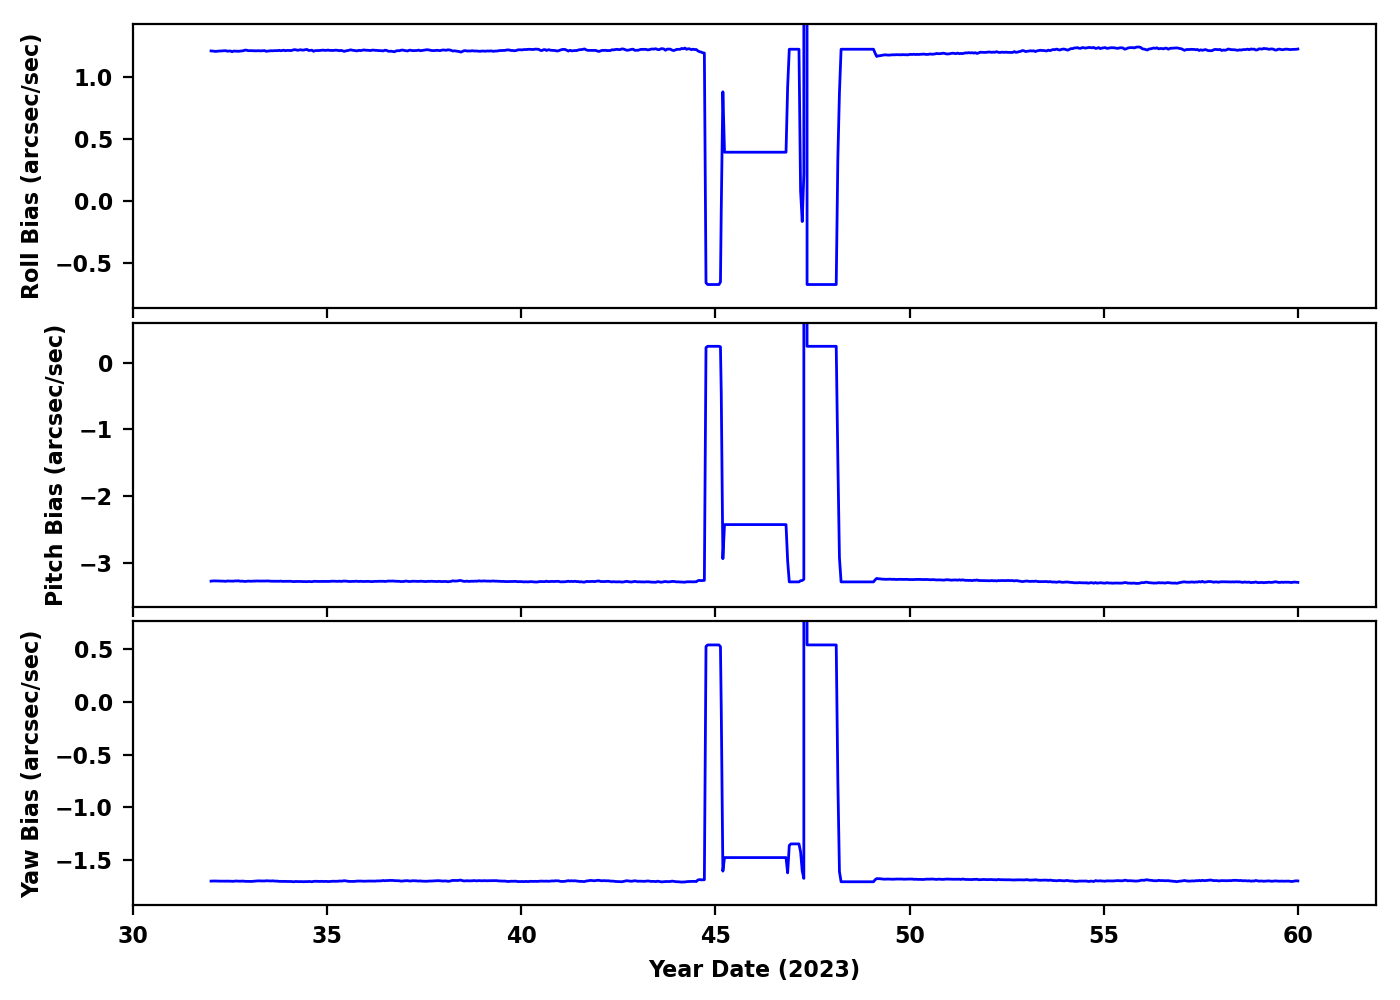
Gyro Bias Drift
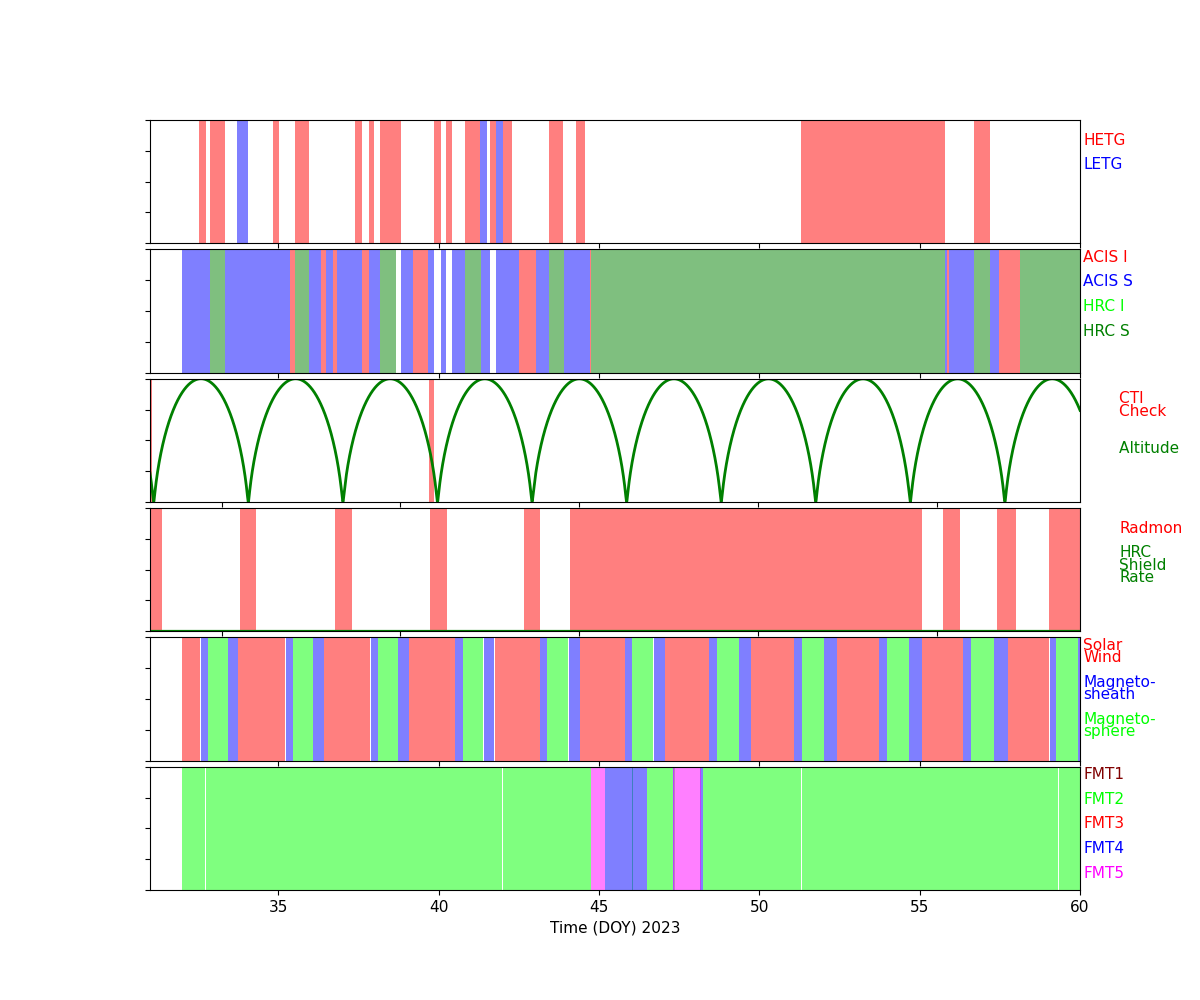
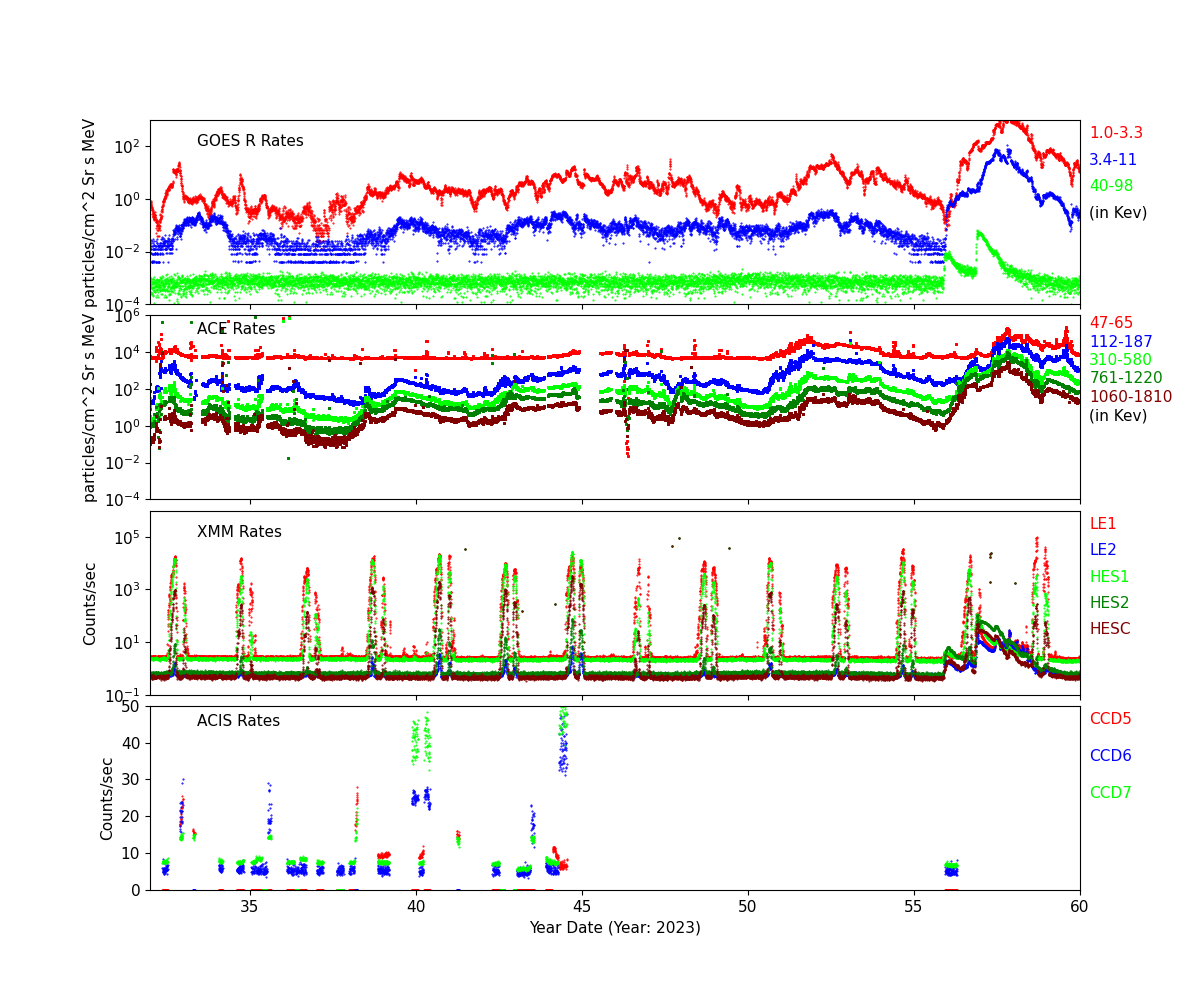
Radiation History
Radiation Count Rates of Feb 2023
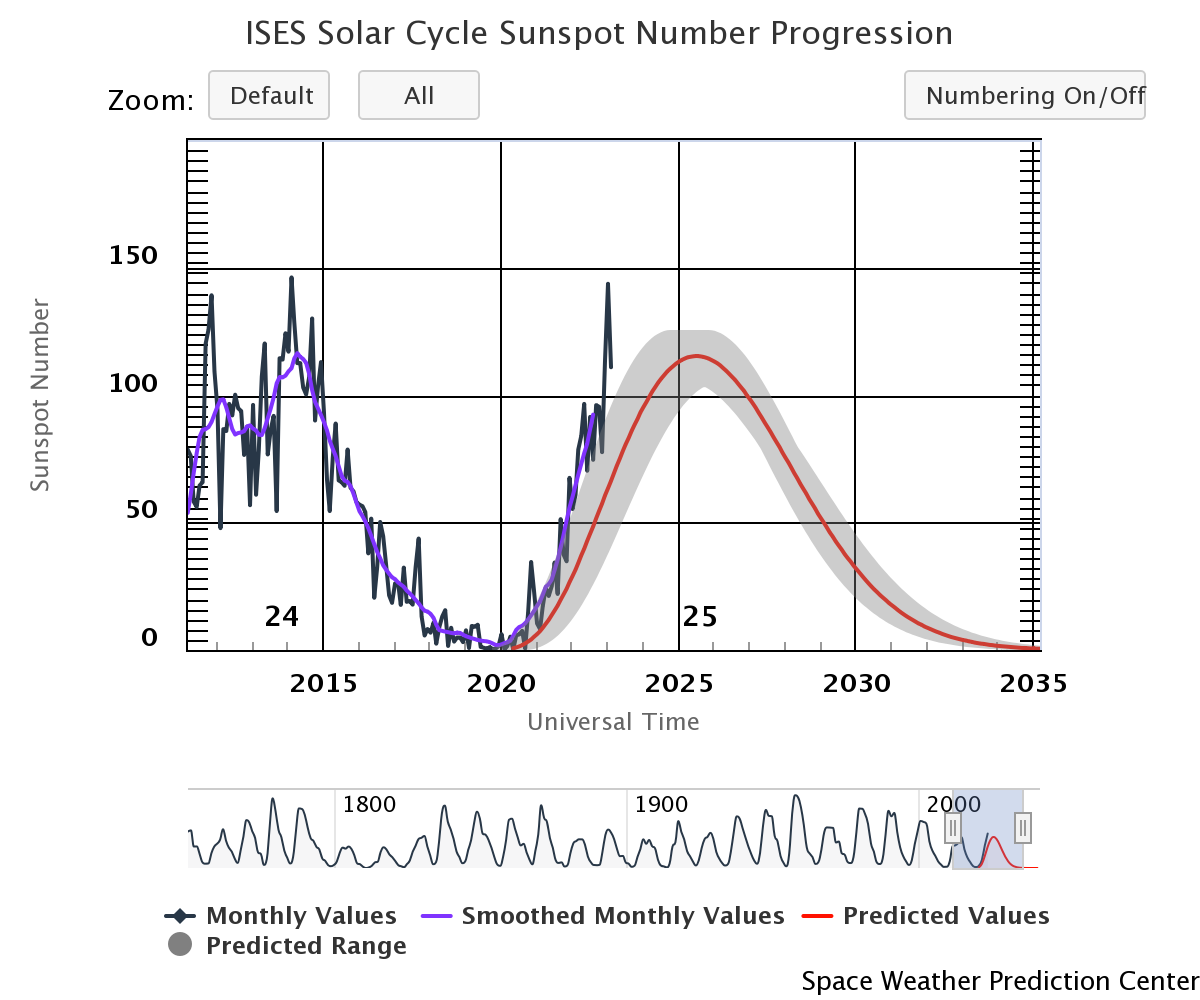
Sun Spot History (See:NOAA Page)
Trending
Quarterly Trends
- HRC Temperature
| Previous Quarter | |||||||
| MSID | MEAN | RMS | DELTA/YR | DELTA/YR/YR | UNITS | DESCRIPTION | |
| 2ceahvpt | 0.011 | 7.063e-04 | (2.79+/-0.02)e2 | -0.39 +/- 0.44 | K | CEA RADIATOR TEMPERATURE AT CENTER | |
|---|---|---|---|---|---|---|---|
| 2chtrpzt | 0.012 | 7.317e-04 | (2.76+/-0.02)e2 | -0.44 +/- 0.45 | K | CENTRAL ELECTRONICS BOX TEMP | |
| 2condmxt | 0.016 | 9.667e-04 | (2.71+/-0.02)e2 | -1.05 +/- 0.53 | K | CONDUIT -X FACE TEMPERATURE | |
| 2dcentrt | 0.009 | 4.235e-04 | (2.74+/-0.01)e2 | 0.05 +/- 0.22 | K | DETECTOR HOUSING TEMP 2 | |
| 2dtstatt | 0.008 | 4.400e-04 | (2.70+/-0.01)e2 | -0.08 +/- 0.22 | K | DETECTOR HOUSING TEMP 1 | |
| 2fhtrmzt | 0.016 | 8.982e-04 | (2.65+/-0.02)e2 | -0.87 +/- 0.58 | K | FRONT END ELECTRONICS BOX TEMPERATURE | |
| 2fradpyt | 0.016 | 9.837e-04 | (2.63+/-0.02)e2 | -1.07 +/- 0.62 | K | FRONT END ASSEMBLY +Y AT RADIATOR CENTER TEMP | |
| 2pmt1t | 0.015 | 0.001 | (2.84+/-0.03)e2 | -0.92 +/- 0.70 | K | PMT 1 TEMPERATURE | |
| 2pmt2t | 0.015 | 0.001 | (2.84+/-0.03)e2 | -0.90 +/- 0.70 | K | PMT 2 TEMPERATURE | |
| 2uvlspxt | 0.012 | 6.648e-04 | (2.75+/-0.02)e2 | -0.52 +/- 0.49 | K | UV LIGHT SHIELD NEXT TO SNOUT TEMP | |
- HRC HK
| Previous Quarter | |||||||
| MSID | MEAN | RMS | DELTA/YR | DELTA/YR/YR | UNITS | DESCRIPTION | |
| 2fe00atm | 4.074e-04 | 2.839e-05 | 22.37 +/- 2.04 | (0.00+/-0.00)e0 | C | Front end temperature | |
|---|---|---|---|---|---|---|---|
| 2fepratm | on | 0.075 | 0.004 | 25.19 +/- 1.89 | -2.48 +/- 1.79 | C | FE temp card temperature | off | -0.009 | 4.469e-04 | 24.56 +/- 2.90 | (0.00+/-0.00)e0 |
| 2imhvatm | on | 0.046 | 0.003 | 31.71 +/- 1.25 | -1.31 +/- 1.13 | C | Imaging det HVPS temperature | off | -4.361e-04 | 3.439e-04 | 31.73 +/- 2.17 | (0.00+/-0.00)e0 |
| 2iminatm | on | 0.064 | 0.003 | 20.52 +/- 1.59 | -1.25 +/- 1.57 | C | Imaging det temperature | off | -0.004 | 3.855e-04 | 20.19 +/- 2.45 | (0.00+/-0.00)e0 |
| 2lvplatm | on | 0.036 | 0.003 | 28.00 +/- 1.17 | -1.19 +/- 1.10 | C | LVPS plate temperature | off | -0.002 | 3.484e-04 | 28.05 +/- 2.20 | (0.00+/-0.00)e0 |
| 2prbscr | on | 0.001 | 1.075e-04 | 1.76 +/- 0.05 | -0.03 +/- 0.05 | AMP | Primary bus current | off | 1.990e-04 | 1.199e-05 | 1.74 +/- 0.08 | (0.00+/-0.00)e0 |
| 2prbsvl | -2.799e-04 | 4.243e-06 | 27.32 +/- 0.32 | (0.00+/-0.00)e0 | V | Primary bus voltage | |
| 2smtratm | on | 2.481e-13 | 2.768e-09 | 5.94 +/- 0.00 | (2.46+/-13.58)e-13 | C | Selected motor temperature | off | -7.567e-05 | 3.315e-06 | 5.94 +/- 0.02 | (0.00+/-0.00)e0 |
| 2sphvatm | on | -0.002 | 0.003 | 31.48 +/- 1.19 | -0.02 +/- 1.24 | C | Spect det HVPS temperature | off | 0.005 | 3.894e-04 | 31.98 +/- 2.49 | (0.00+/-0.00)e0 |
| 2spinatm | on | 0.054 | 0.003 | 19.08 +/- 1.49 | -1.14 +/- 1.53 | C | Spect det temperature | off | -0.001 | 3.648e-04 | 19.00 +/- 2.30 | (0.00+/-0.00)e0 |
- PCAD Temperature
| Previous Quarter | |||||||
| MSID | MEAN | RMS | DELTA/YR | DELTA/YR/YR | UNITS | DESCRIPTION | |
| aacccdpt | 0.031 | 0.003 | (2.66+/-0.08)e2 | 0.16 +/- 1.05 | K | AC CCD TEMP (PRI) | |
|---|---|---|---|---|---|---|---|
| aacccdrt | 0.020 | 0.001 | (3.09+/-0.03)e2 | -0.67 +/- 0.71 | K | AC CCD TEMP (RDNT) | |
| aach1t | 0.020 | 0.001 | (3.06+/-0.03)e2 | -0.55 +/- 0.73 | K | AC HOUSING TEMP (ACH1) | |
| aach2t | 0.020 | 0.001 | (3.06+/-0.03)e2 | -0.52 +/- 0.73 | K | AC HOUSING TEMP (ACH2) | |
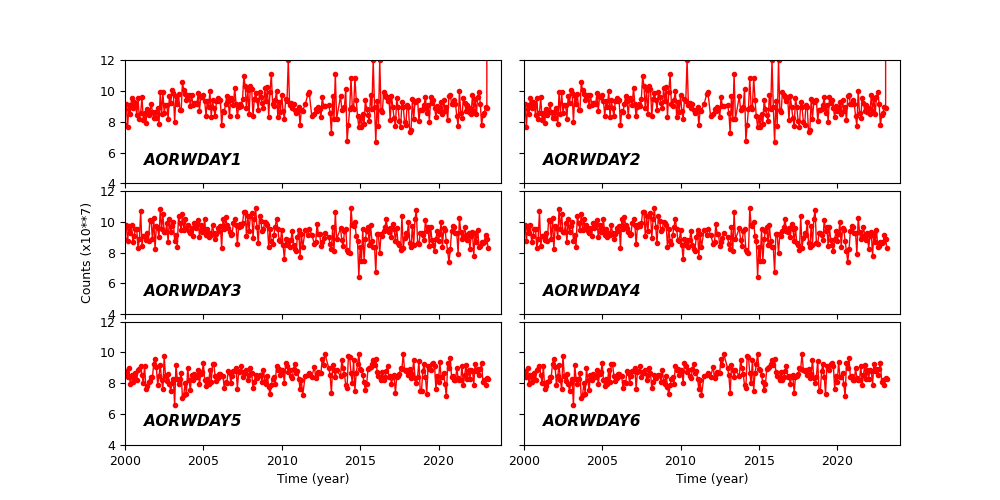
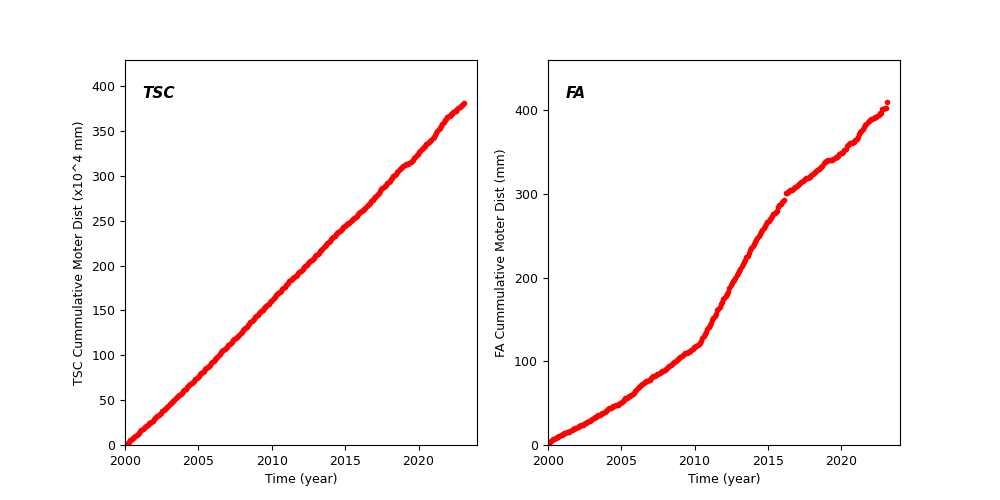
Spacecraft Motions
TSC and FA Cummulative Moter Distance
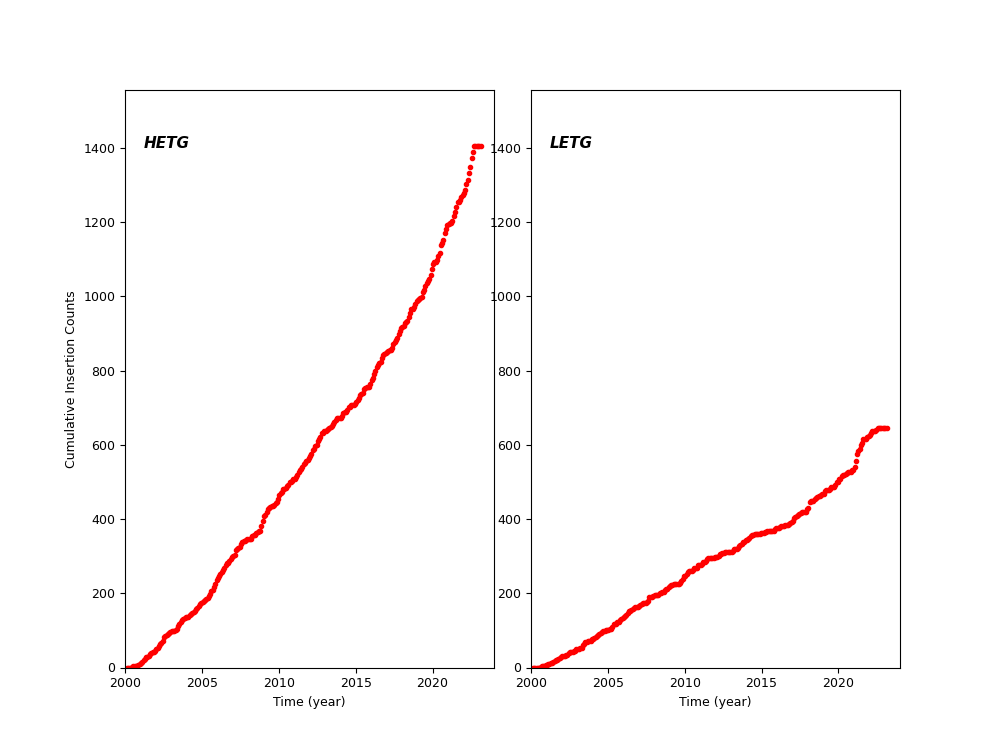
HETG and LETG Cummulative Insertion Counts
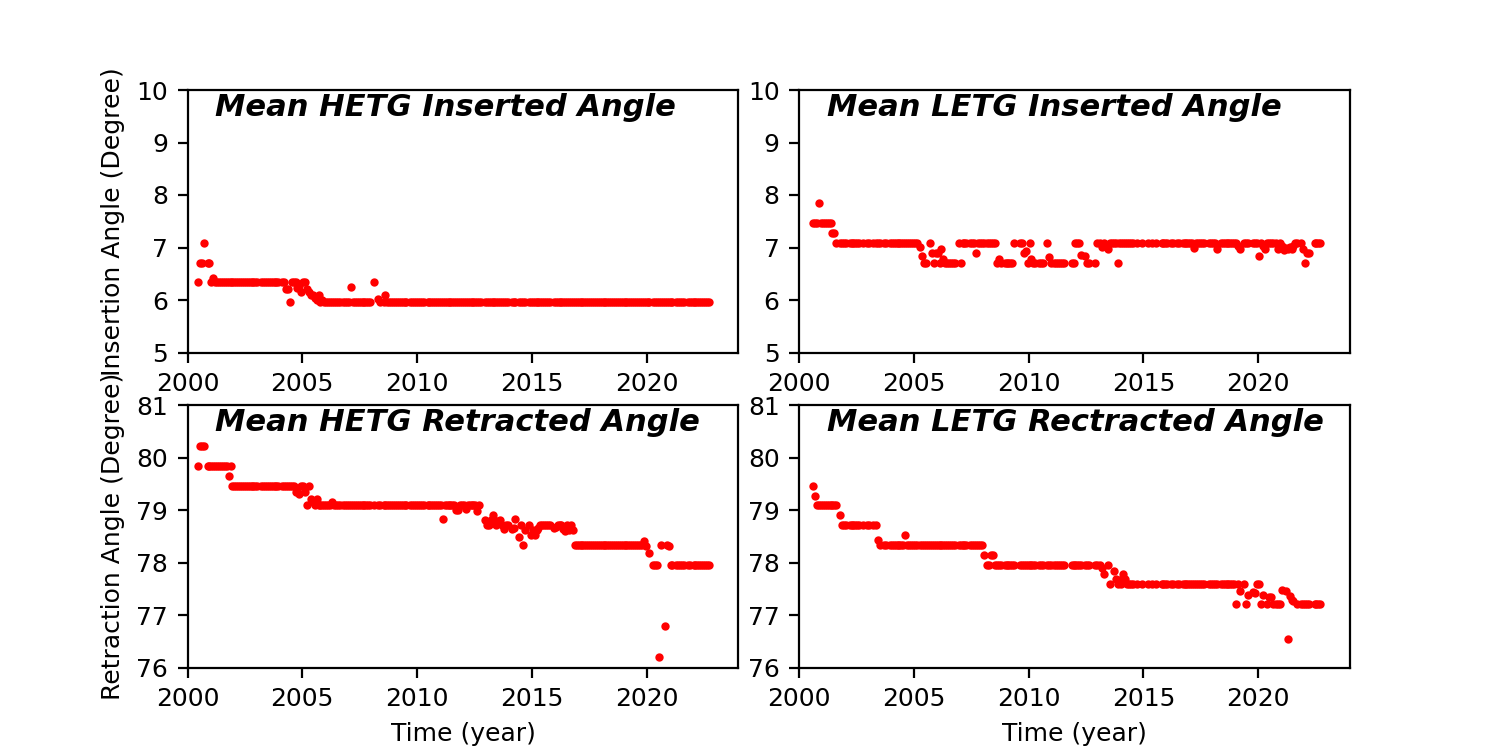
HETG/LETG Insertion/Retraction Angle
Reaction Wheel Rotations