ACIS
ACIS DOSE Registered-Photon-Map
The steps we took to compute the dose map are;
- Level 1 Event files for a specified month are obtained from archive.
- Image data including I2, I3, S2, S3 CCDs are extracted from all event files.
- All the extracted image data were merged to create a month long exposure map for the month.
- The exposure map is opened with ds9, and check a distribution of count rates against energy. From this, estimate the upper threshold value. Any events beyond this upper threshold are assumed erroneous events such as bad pixels.
- Using this upper threshold, the data is filtered, and create a cleaned exposure map for the month.
- The exposure map from each month from the Sep 1999 is added up to create a cumulative exposure map for each month.
- Using fimgstatistic, we compute count rate statistics for each CCDs.
- For observations with high data drop rates (e.g., Crab nebula, Cas A), we corrected the observations by adding events.
Please check more detail plots at Telemetered Photon Dose Trend page.
)
)
)
Statistics:
# IMAGE     NPIX     MEAN        RMS        MIN     MAX
ACIS_oct23 6004901       5.829         17.569           0.0      599


I2 node 0  262654	4.313968	2.406136	0.0	 54.0
I2 node 1  262654	4.591149	2.727794	0.0	506.0
I2 node 2  262654	4.448248	2.446416	0.0	 89.0
I2 node 3  262654	4.477685	2.557444	0.0	260.0

I3 node 0  262654	4.762149	2.599949	0.0	 55.0
I3 node 1  262654	4.654102	2.523276	0.0	 97.0
I3 node 2  262654	4.489648	2.428489	0.0	 47.0
I3 node 3  262654	4.483343	2.456540	0.0	121.0

S2 node 0  262654	7.109957	11.002296	0.0	402.0
S2 node 1  262654	8.930614	18.889566	0.0	326.0
S2 node 2  262654	13.868746	37.941681	0.0	515.0
S2 node 3  262654	9.532095	20.606920	0.0	397.0

S3 node 0  262654	6.330067	4.346907	0.0	 94.0
S3 node 1  262654	8.205991	9.759505	0.0	304.0
S3 node 2  262654	12.665652	27.397604	0.0	486.0
S3 node 3  262654	15.039336	38.872290	0.0	518.0
)
)
)
Statistics:
 IMAGE     NPIX      MEAN        RMS           MIN      MAX
ACIS_total   6004901       2662.503         3386.721           0.0   153424


I2 node 0  262654	2312.107223	468.092827	493.0	14649.0
I2 node 1  262654	2435.945174	676.917112	505.0	151418.0
I2 node 2  262654	2464.301836	522.241154	531.0	15730.0
I2 node 3  262654	2468.882447	638.914738	493.0	32292.0

I3 node 0  262654	2657.567251	654.455646	495.0	14439.0
I3 node 1  262654	2739.728963	1748.781283	517.0	55965.0
I3 node 2  262654	2450.320369	458.407859	489.0	14808.0
I3 node 3  262654	2430.171718	493.197045	459.0	35566.0

S2 node 0  262654	3103.520385	501.002585	1679.0	22517.0
S2 node 1  262654	3294.008403	748.776050	1861.0	17822.0
S2 node 2  262654	3651.632724	752.789596	2270.0	32056.0
S2 node 3  262654	3609.781052	606.732436	2003.0	79189.0

S3 node 0  262654	5501.483425	2984.675285	2414.0	54786.0
S3 node 1  262654	6719.983617	2382.945890	0.0	69061.0
S3 node 2  262654	5454.115047	1359.363629	2526.0	27457.0
S3 node 3  262654	4275.712255	767.605140	2583.0	26607.0
)
|
)
|
)
|
)
|
| Jul 2023 | Apr 2023 | Jan 2023 | Oct 2022 |
|---|
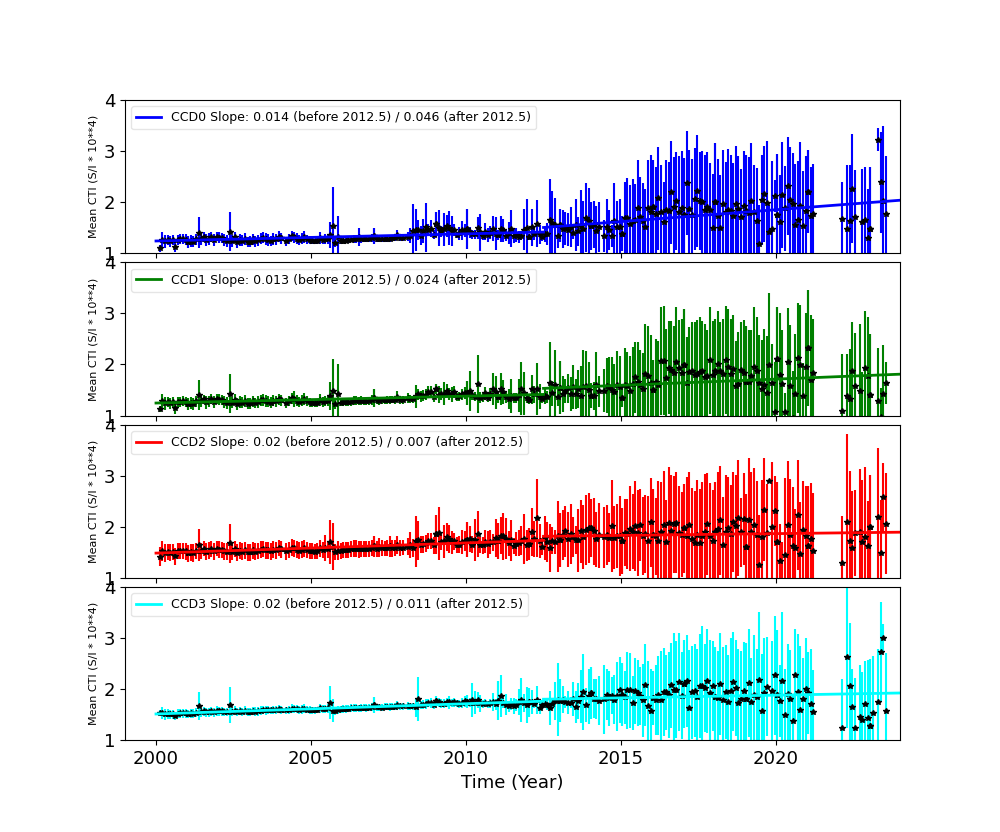
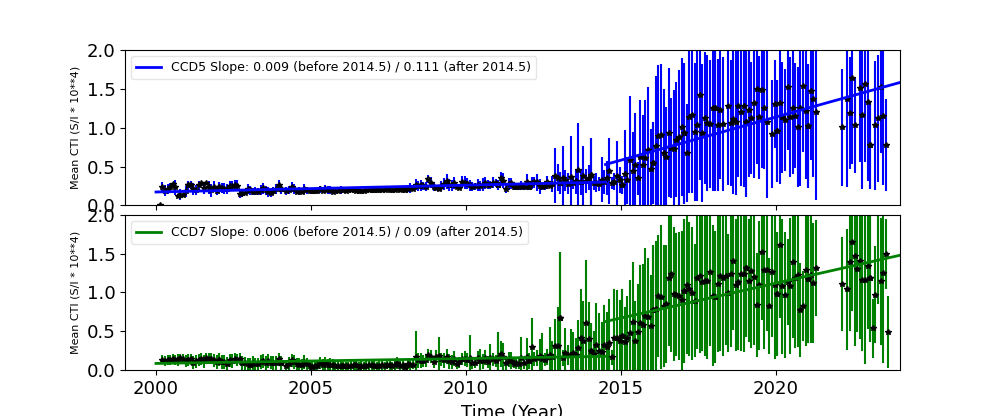
The Mean Detrended CTI
We report CTIs with a refined data definition. CTIs were computed for the temperature dependency corrected data. Please see CTI page for detailed explanation. CTI's are computed for Mn K alpha, and defined as slope/intercept x10^4 of row # vs ADU. Data file: here
Imaging CCDs
Spectral CCDs
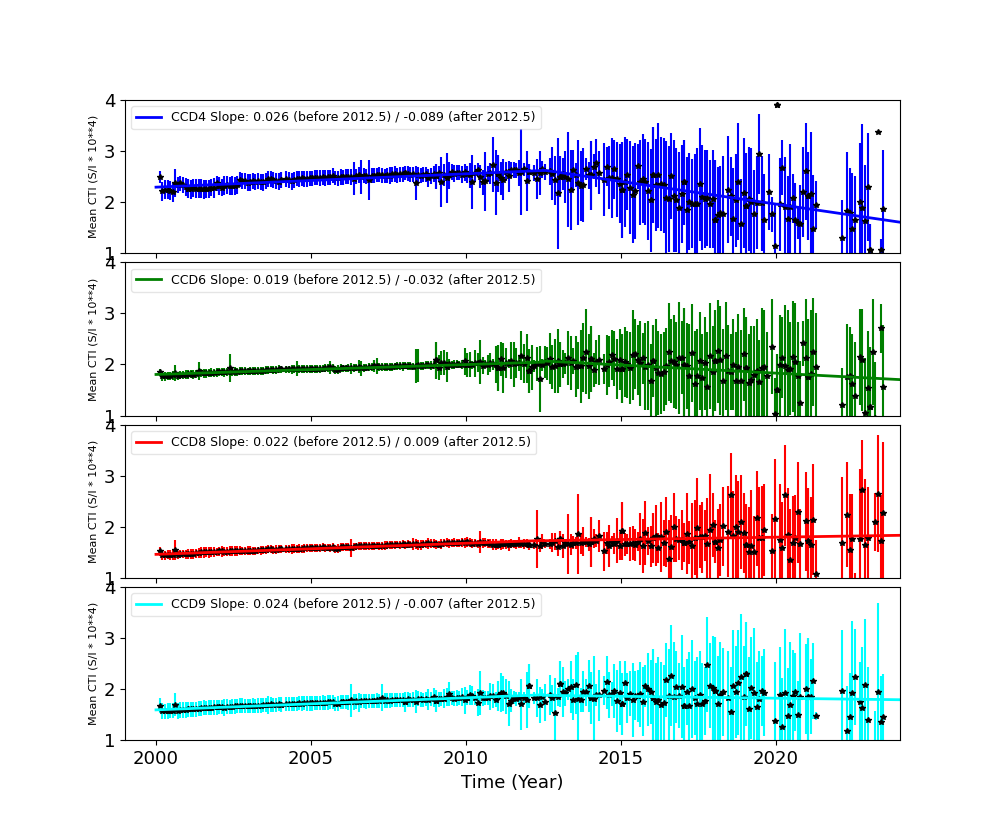
Backside CCDs
Focal Plane Temperature
Oct 2023 Focal Temperature
| The Mean (max) FPT: | |
|---|---|
| -107.53 | +/- 7.69 C |
| Mean Width: | |
| 0.8 | +/- 0.58 days |
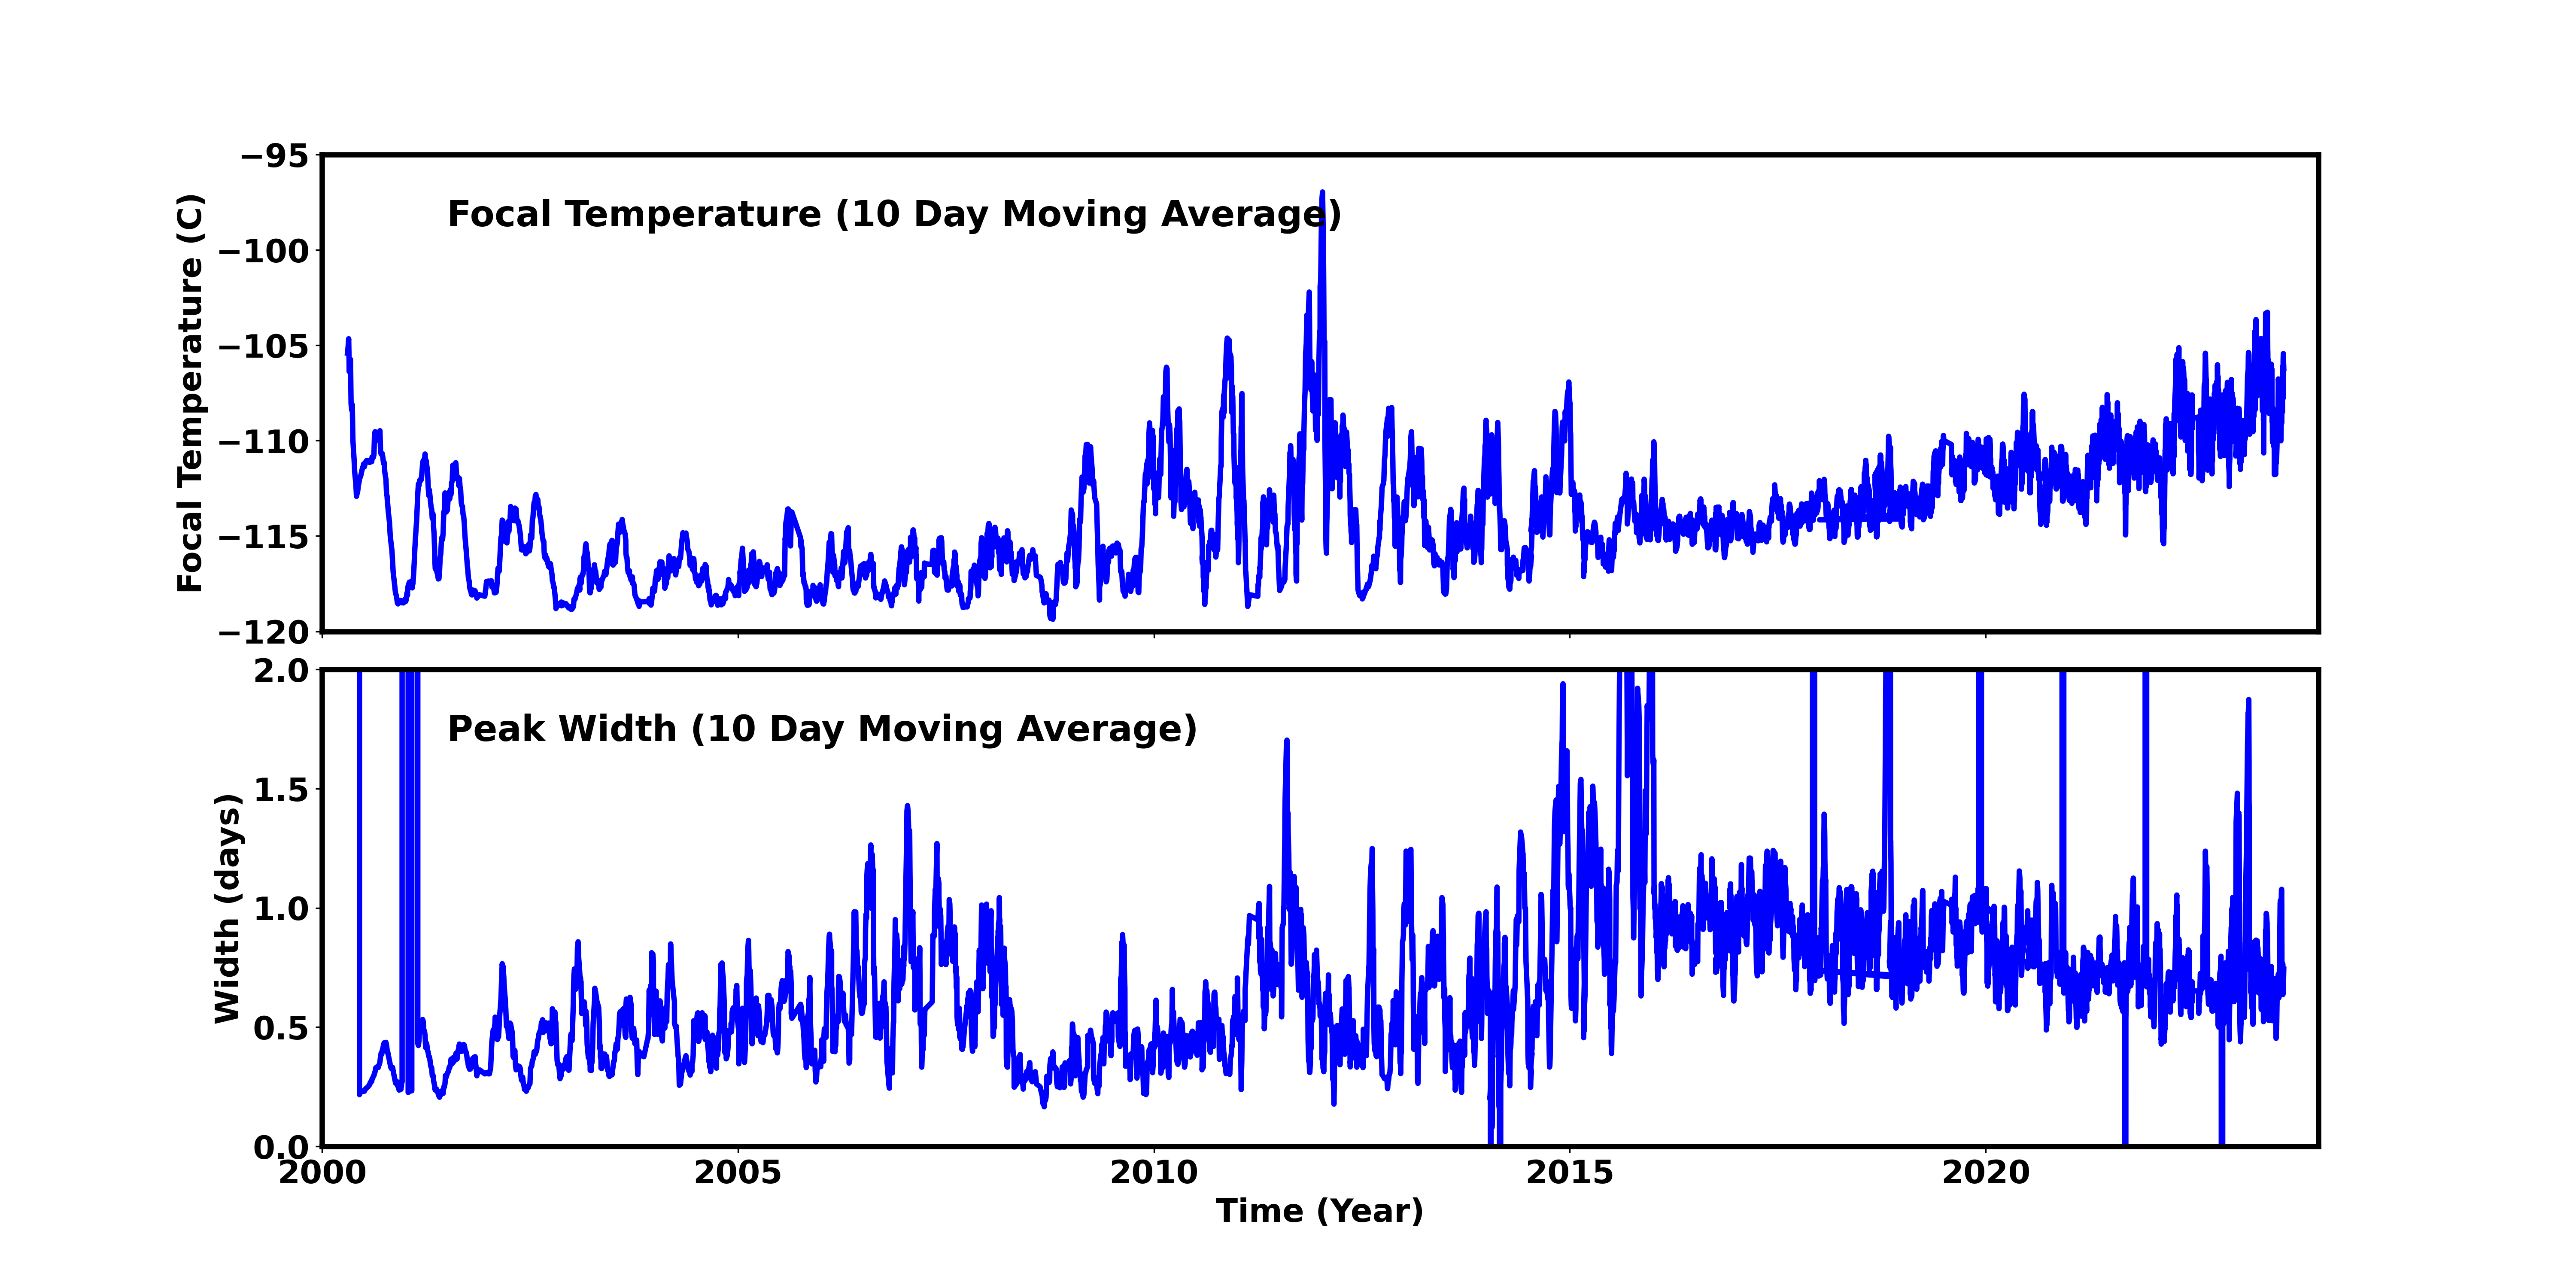
Averaged Focal Plane Temperature
We are using 10 period moving averages to show trends of peak temperatures and peak widths. Note, the gaps in the width plot are due to missing/corrupted data.
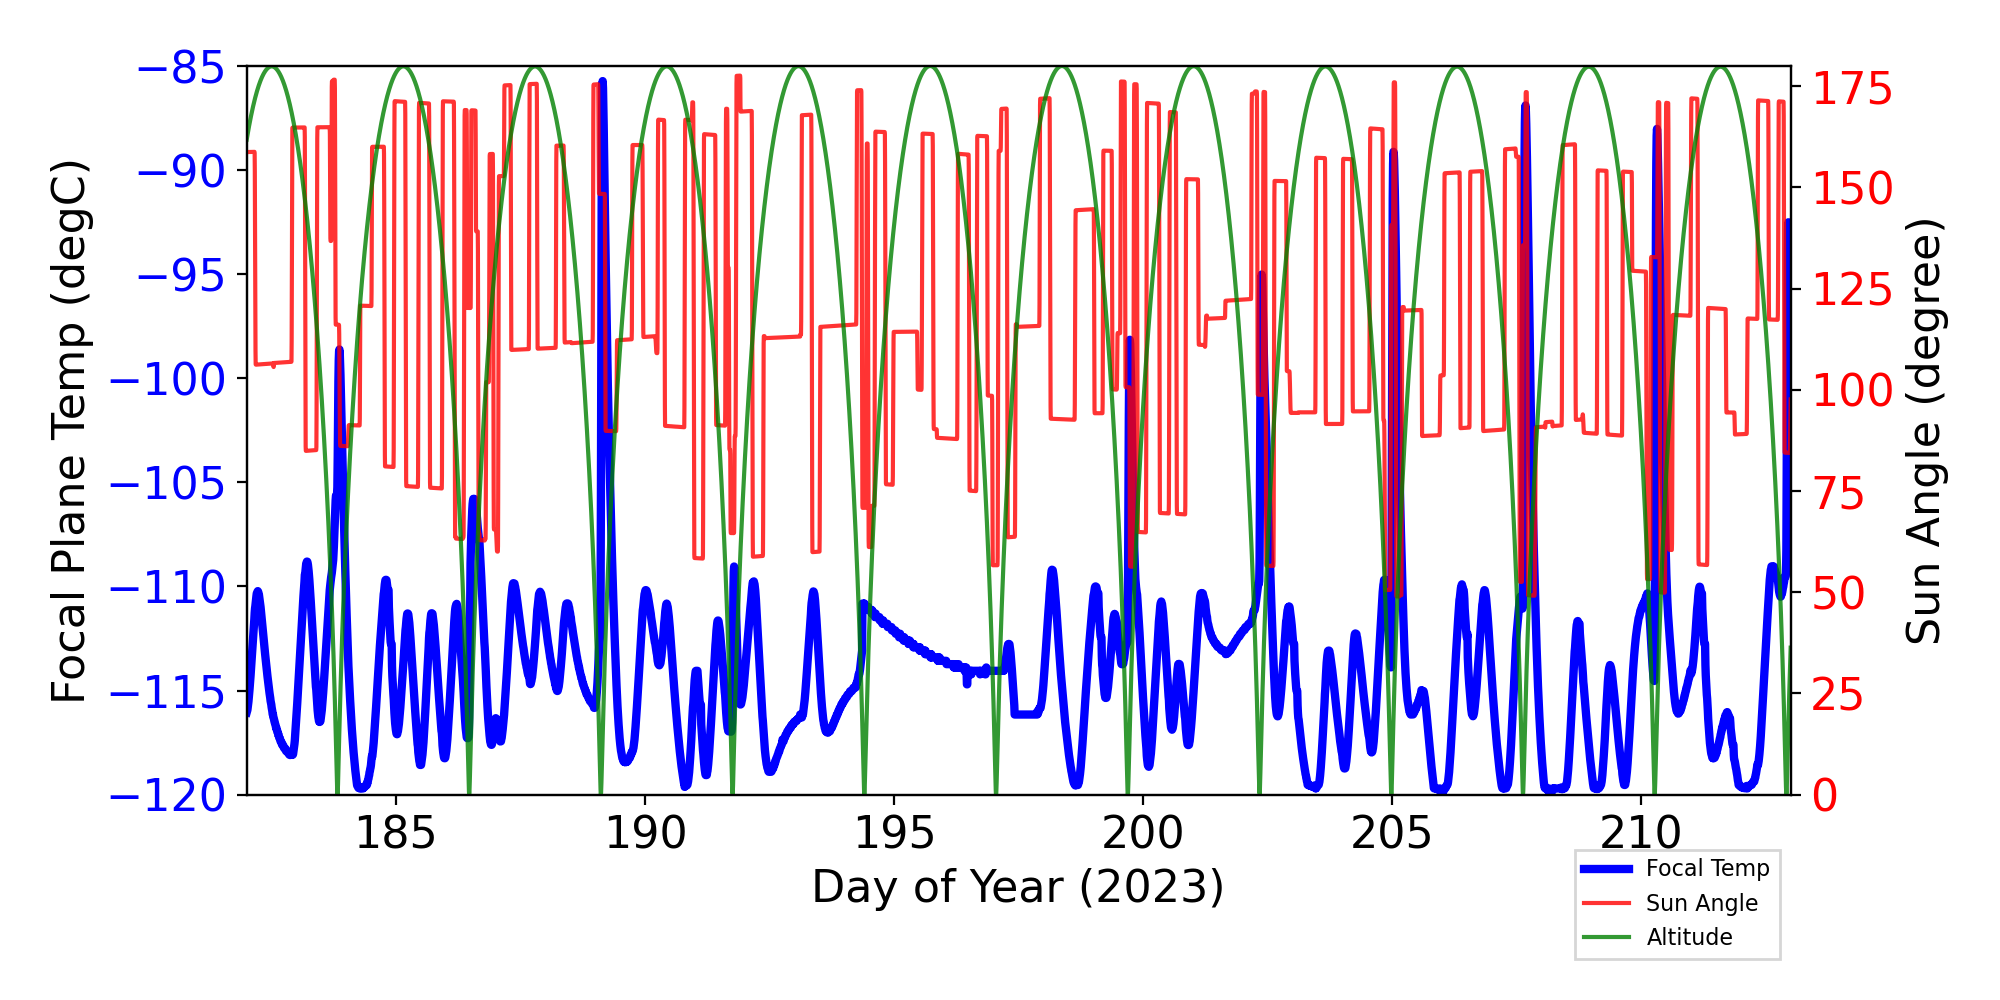
Focal Plane Temperature, Sun Angle and Altitude
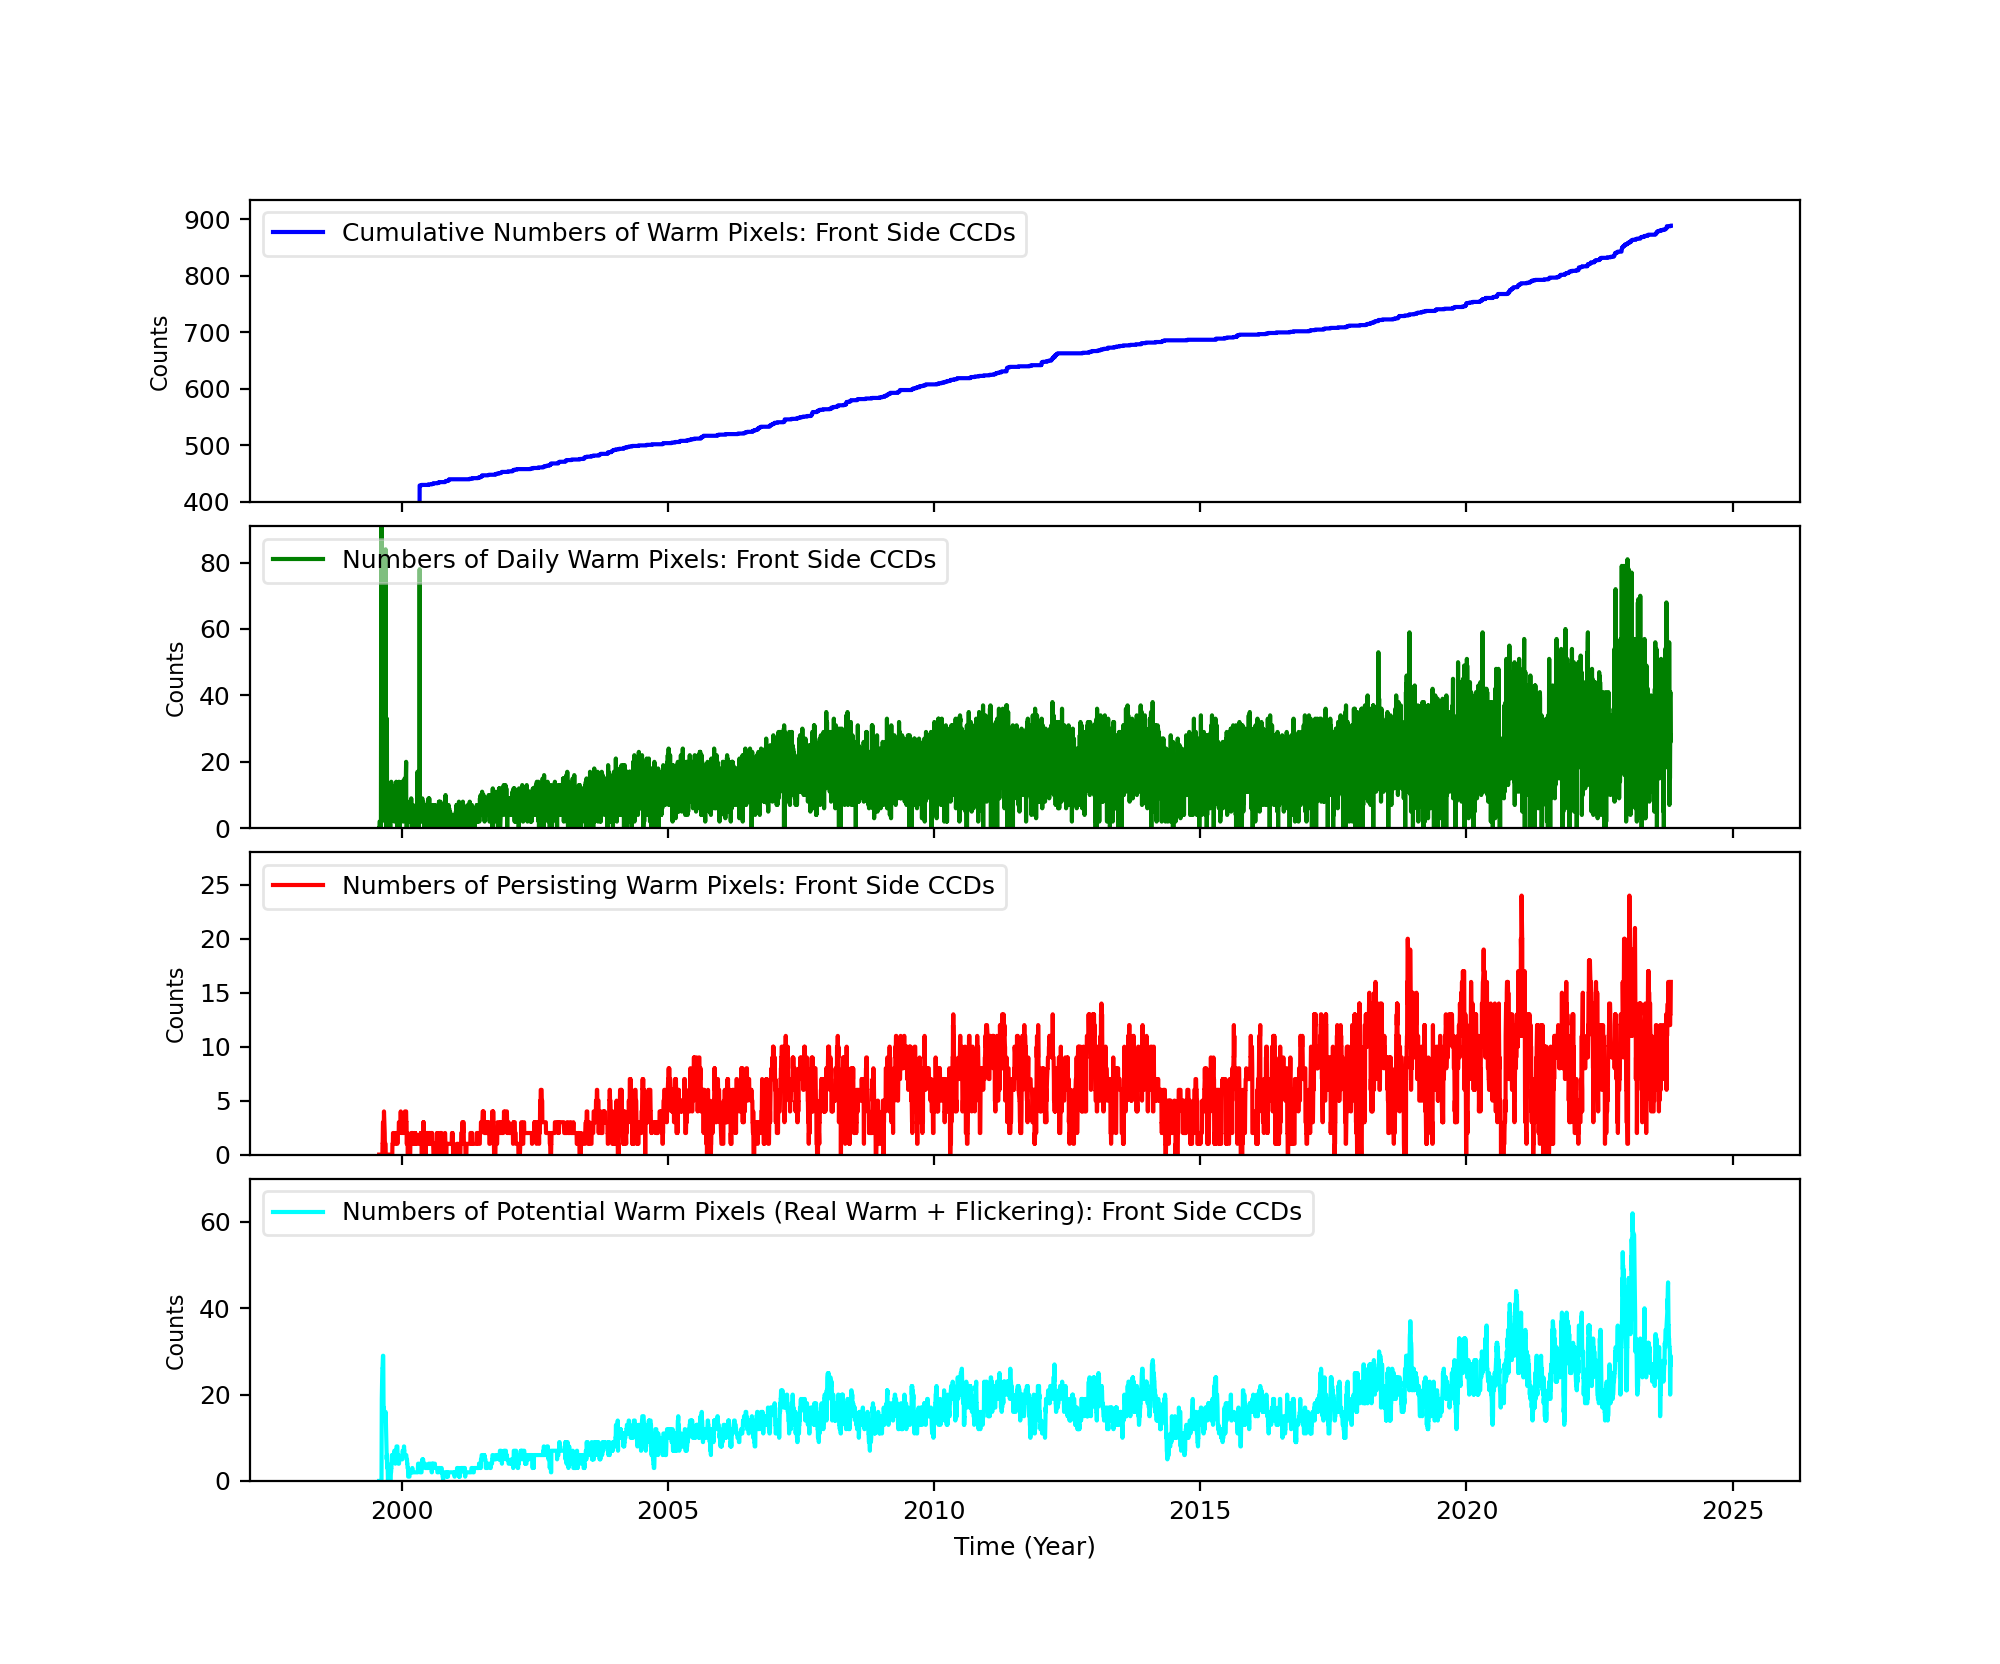
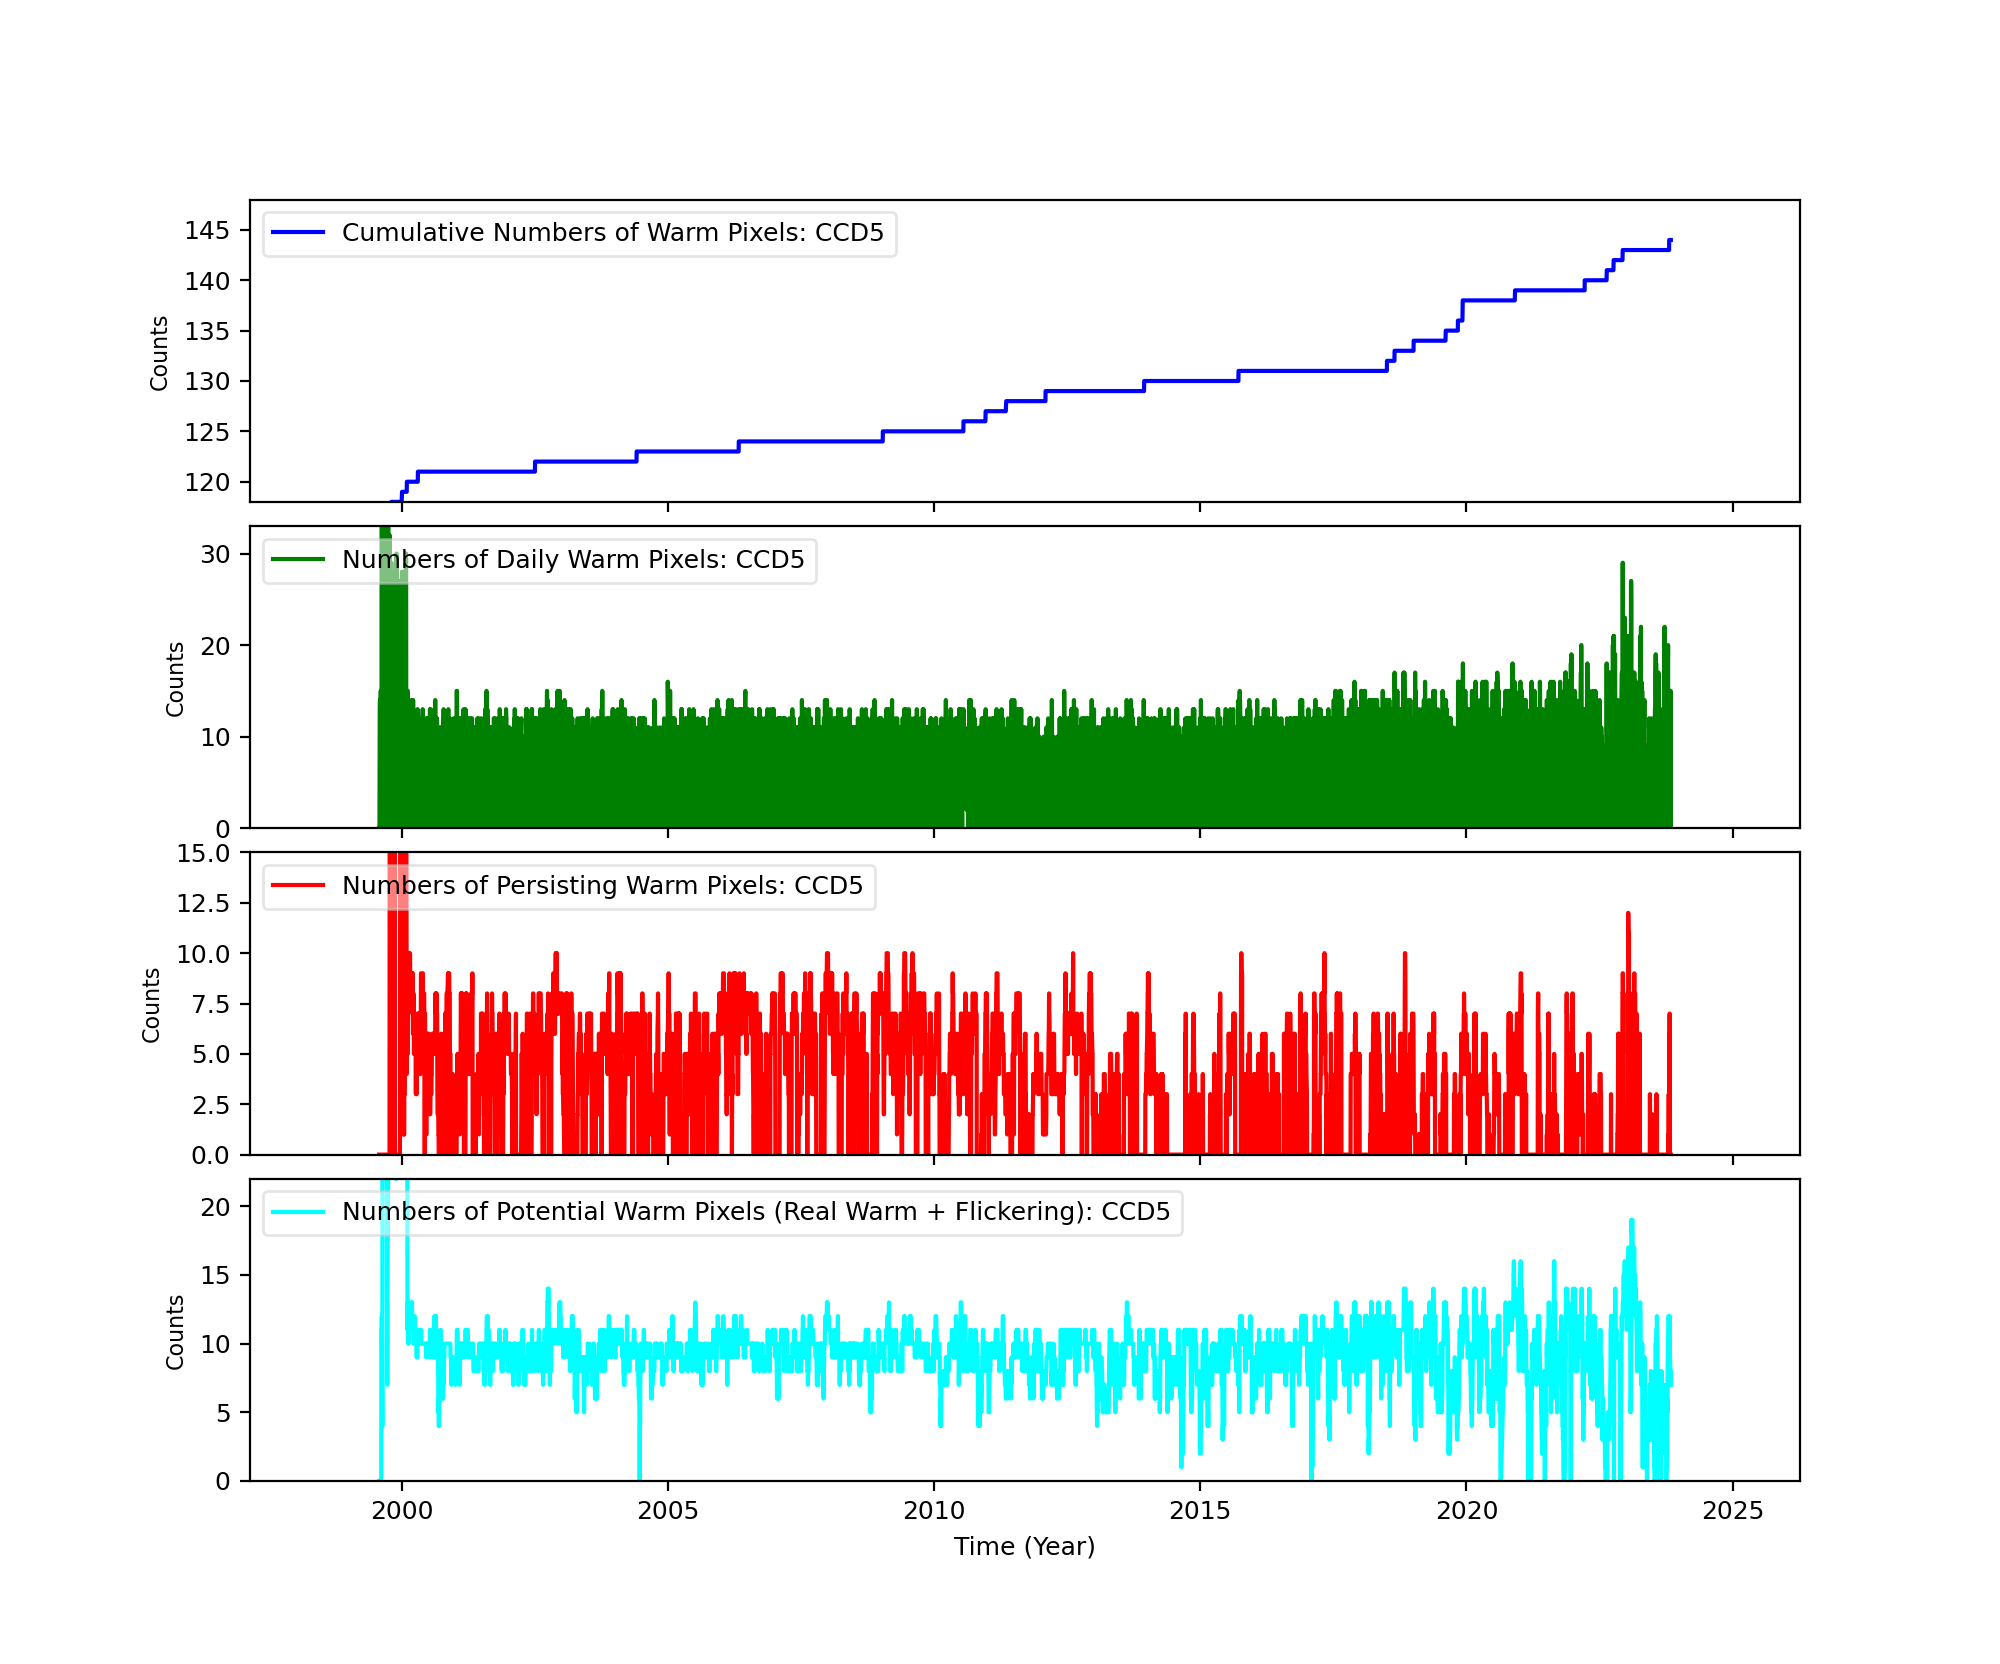
Bad Pixels
The plots below were generated with a new warm pixel finding script. Please see Acis Bad Pixel Page for details.
Front Side CCDs
Back Side CCD (CCD5)
Science Instrument Background Rates
| Name | Low (keV) | High(KeV) | Description |
|---|---|---|---|
| SSoft | 0.00 | 0.50 | Super soft photons |
| Soft | 0.50 | 1.00 | Soft photons |
| Med | 1.00 | 3.00 | Moderate energy photons |
| Hard | 3.00 | 5.00 | Hard Photons |
| Harder | 5.00 | 10.00 | Very Hard photons |
| Hardest | 10.00 | Beyond 10 keV |


HRC
DOSE of Central 4K Pore-Pairs
Please refer to Maximum Dose Trends for more details.
)
|
|---|
IMAGE                NPIX      MEAN    STDDEV      MIN       MAX
HRCI_10_2023.fits  16777216	0.030 	0.174 	0.000 	4.000
)
IMAGE                       NPIX      MEAN    STDDEV      MIN       MAX
HRCI_08_1999_10_2023.fits  16777216	na	na	na	na
)
|
|---|
IMAGE                NPIX      MEAN    STDDEV      MIN       MAX
HRCS_10_2023.fits  16777216	0.029 	0.179 	0.000 	8.000
)
IMAGE                       NPIX      MEAN    STDDEV      MIN       MAX
HRCS_08_1999_10_2023.fits  16777216	na	na	na	na
|
|
Max dose trend plots corrected for events that "pile-up"
in the center of the taps due to bad position information.
|
)
|
)
|
)
|
)
|
| Jul 2023 | Apr 2023 | Jan 2023 | Oct 2022 |
|---|
)
|
)
|
)
|
)
|
| Jul 2023 | Apr 2023 | Jan 2023 | Oct 2022 |
|---|
Gratings
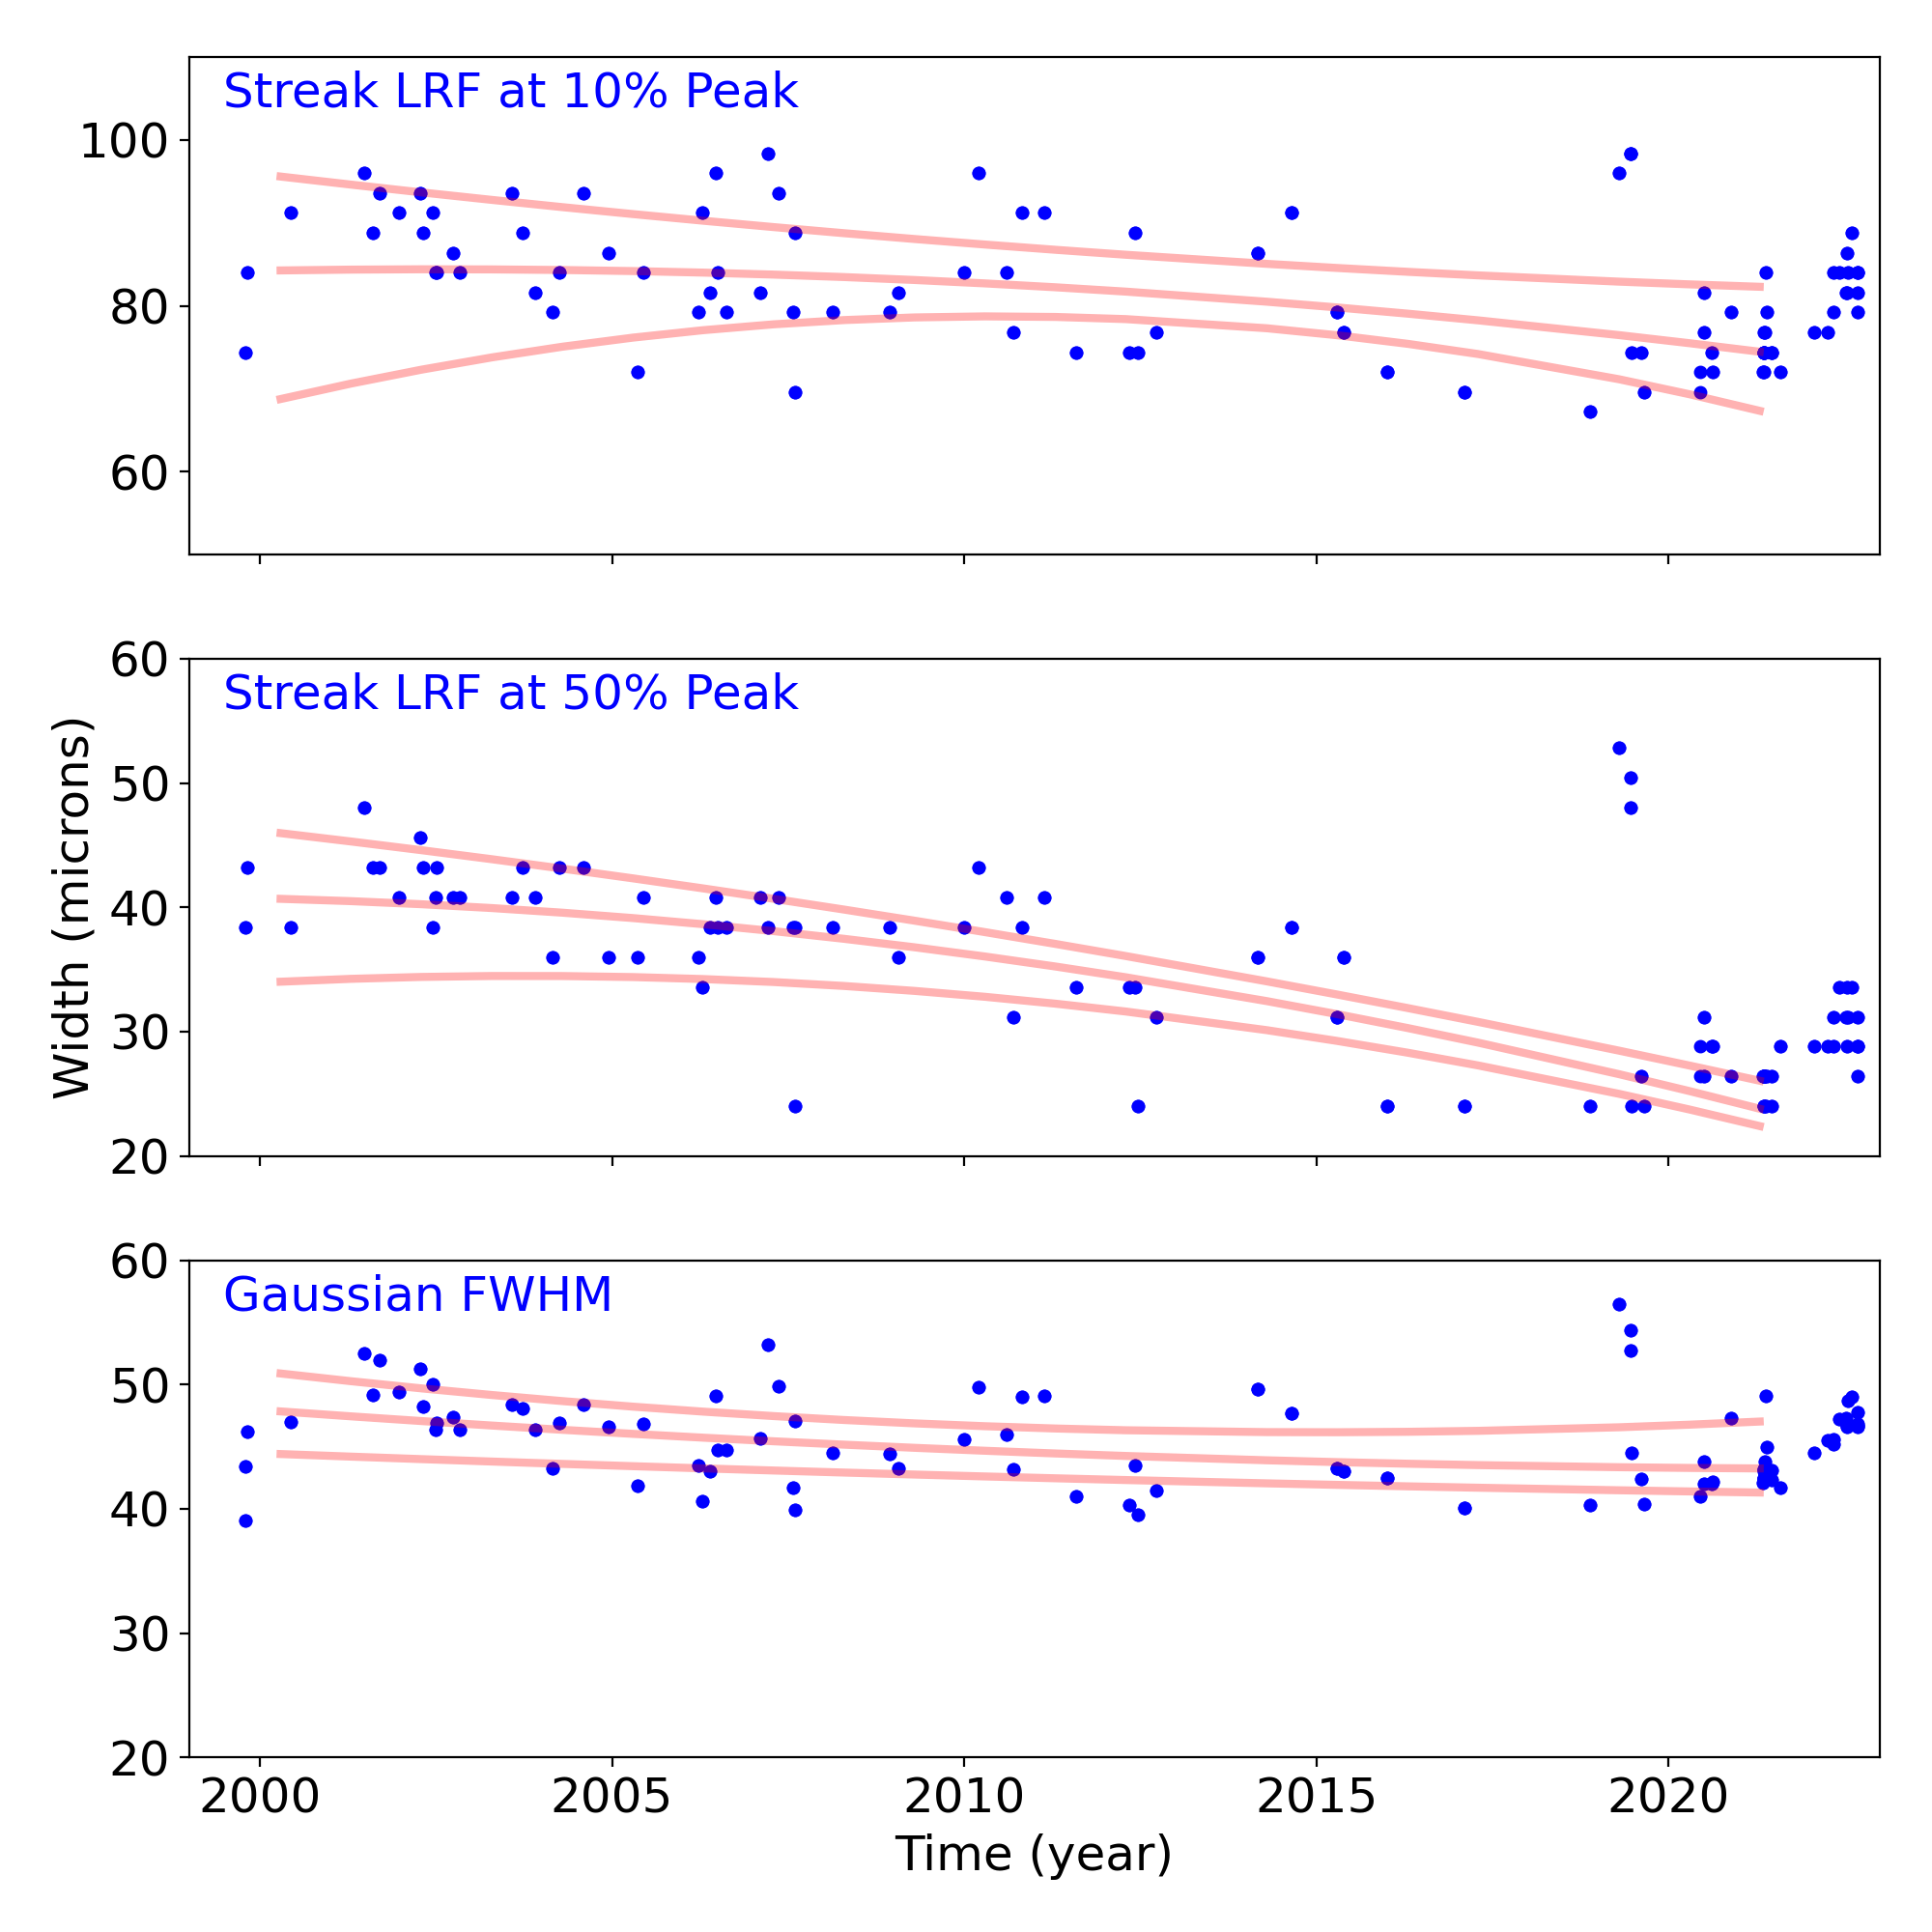
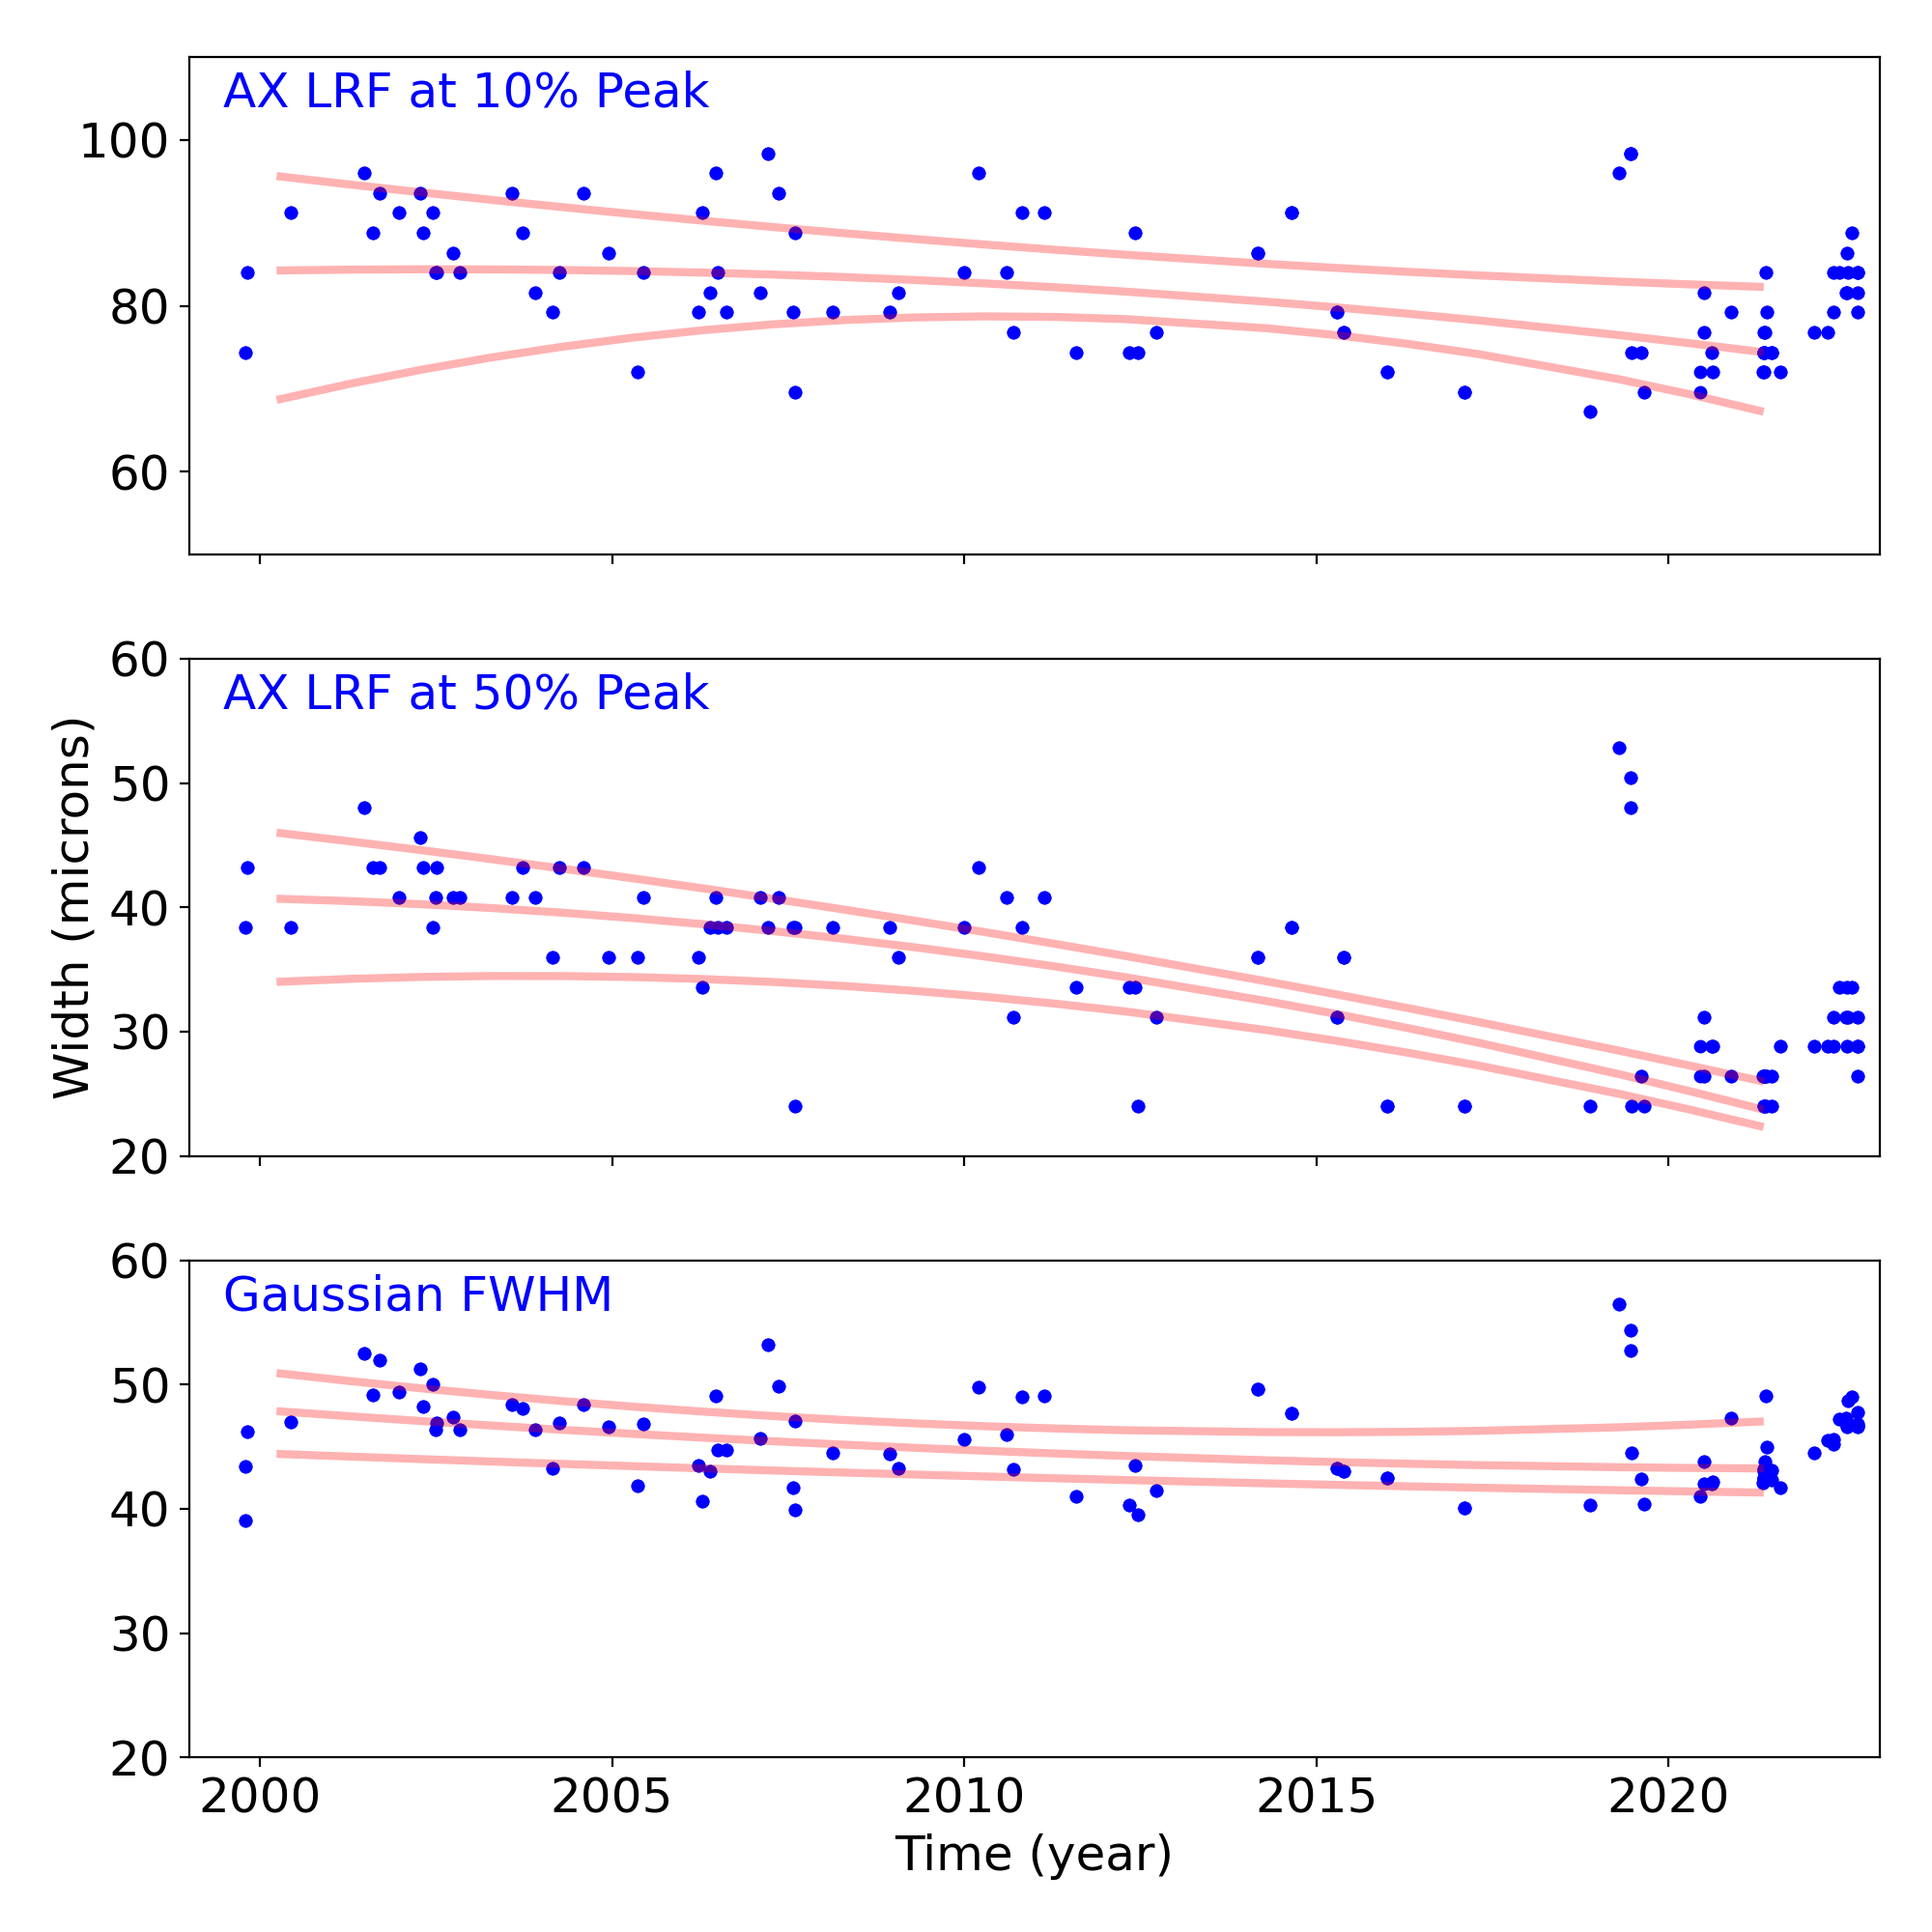
Grating Trends/Focus
We plot the width of the zero order streak of ACIS/HETG observations and the width of the zero order image for HRC/LETG observations of point sources. No significant defocusing trend is seen at this time. See Gratings Trends pages.
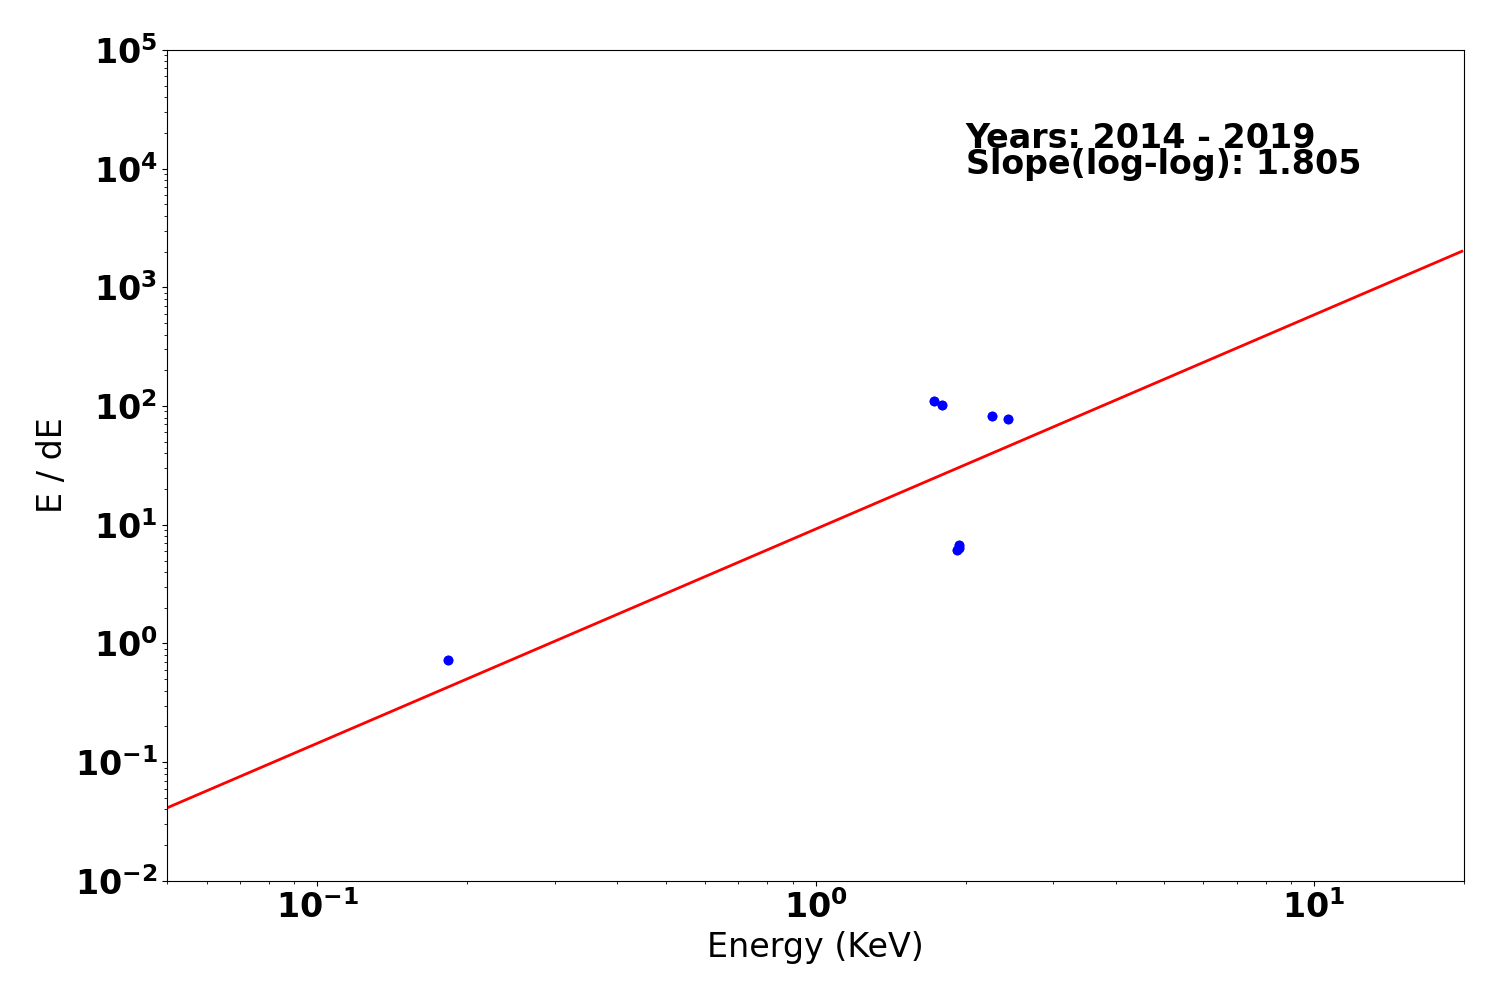
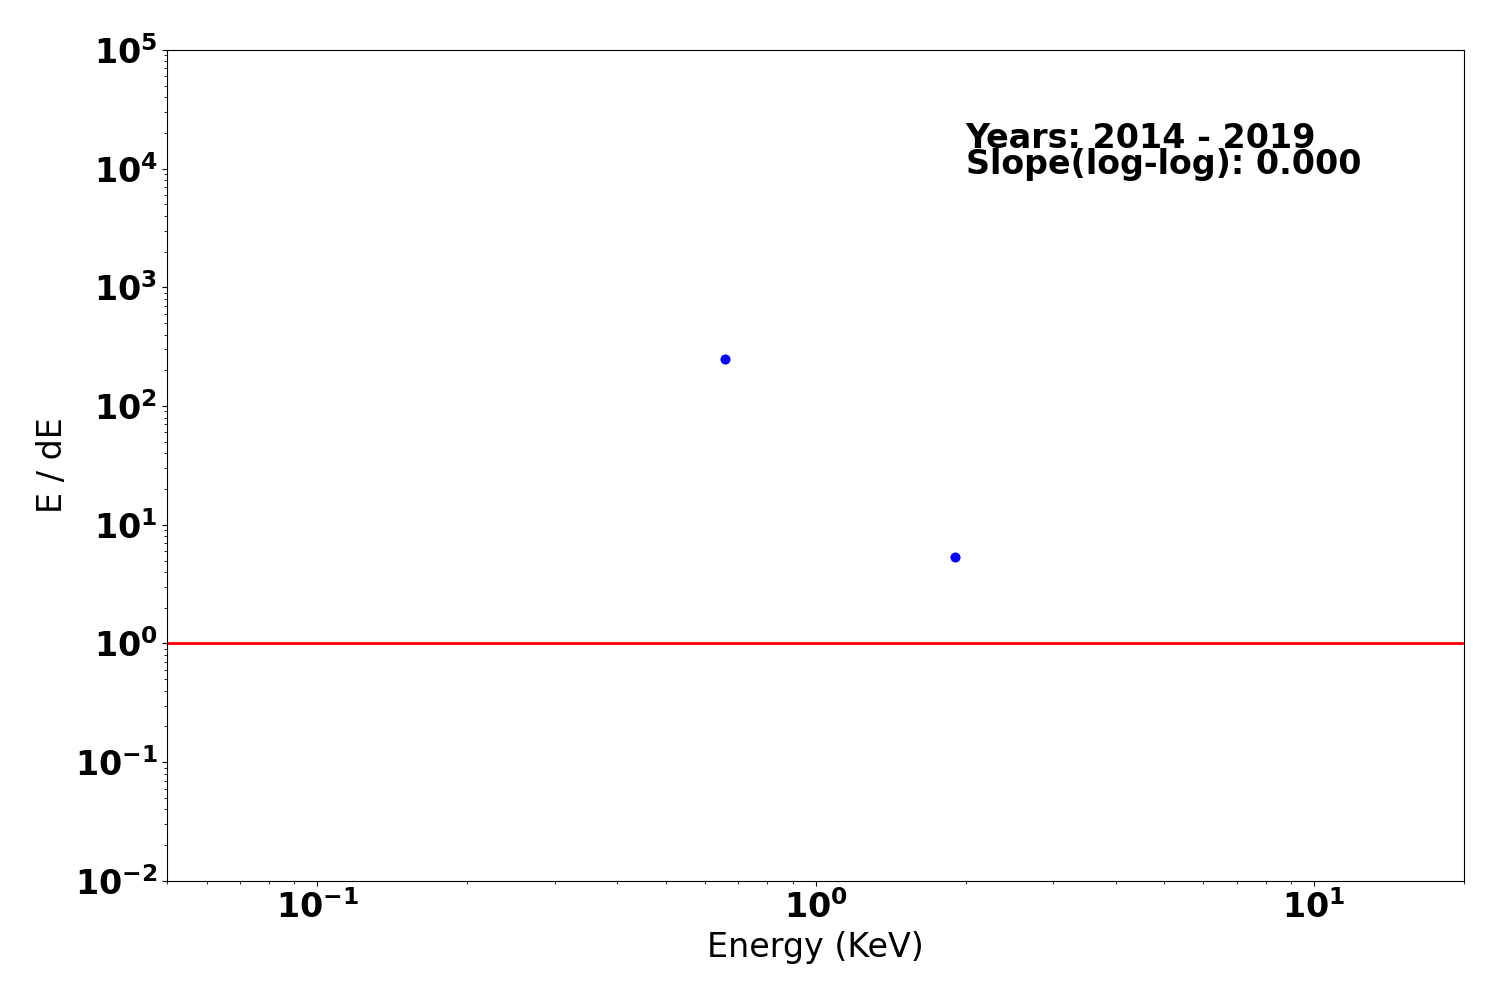
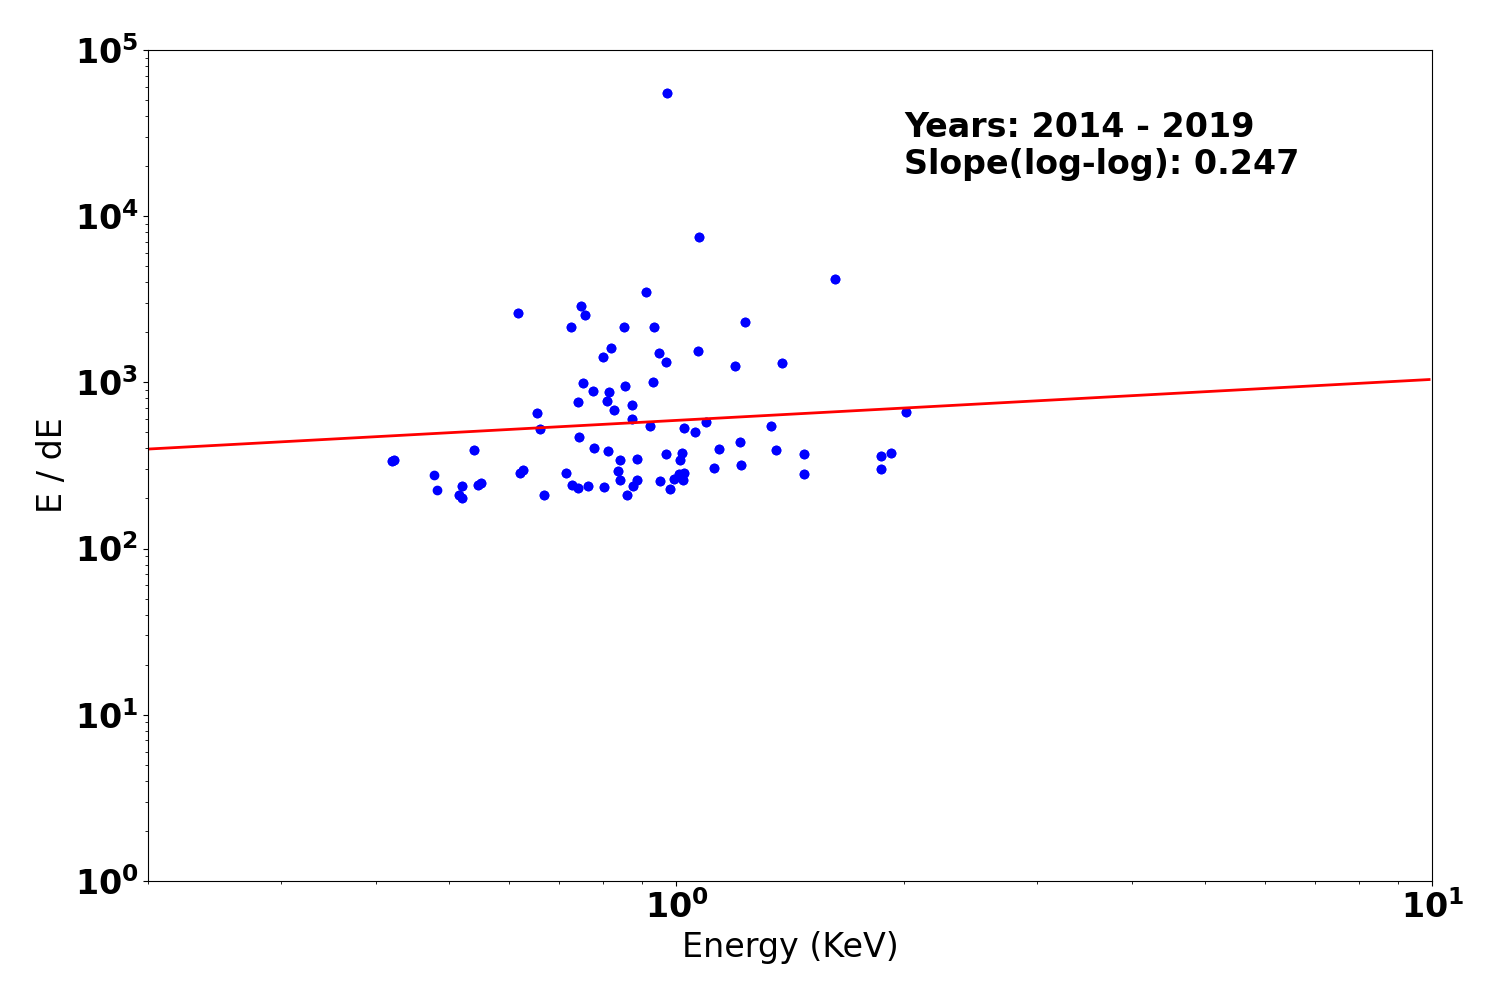
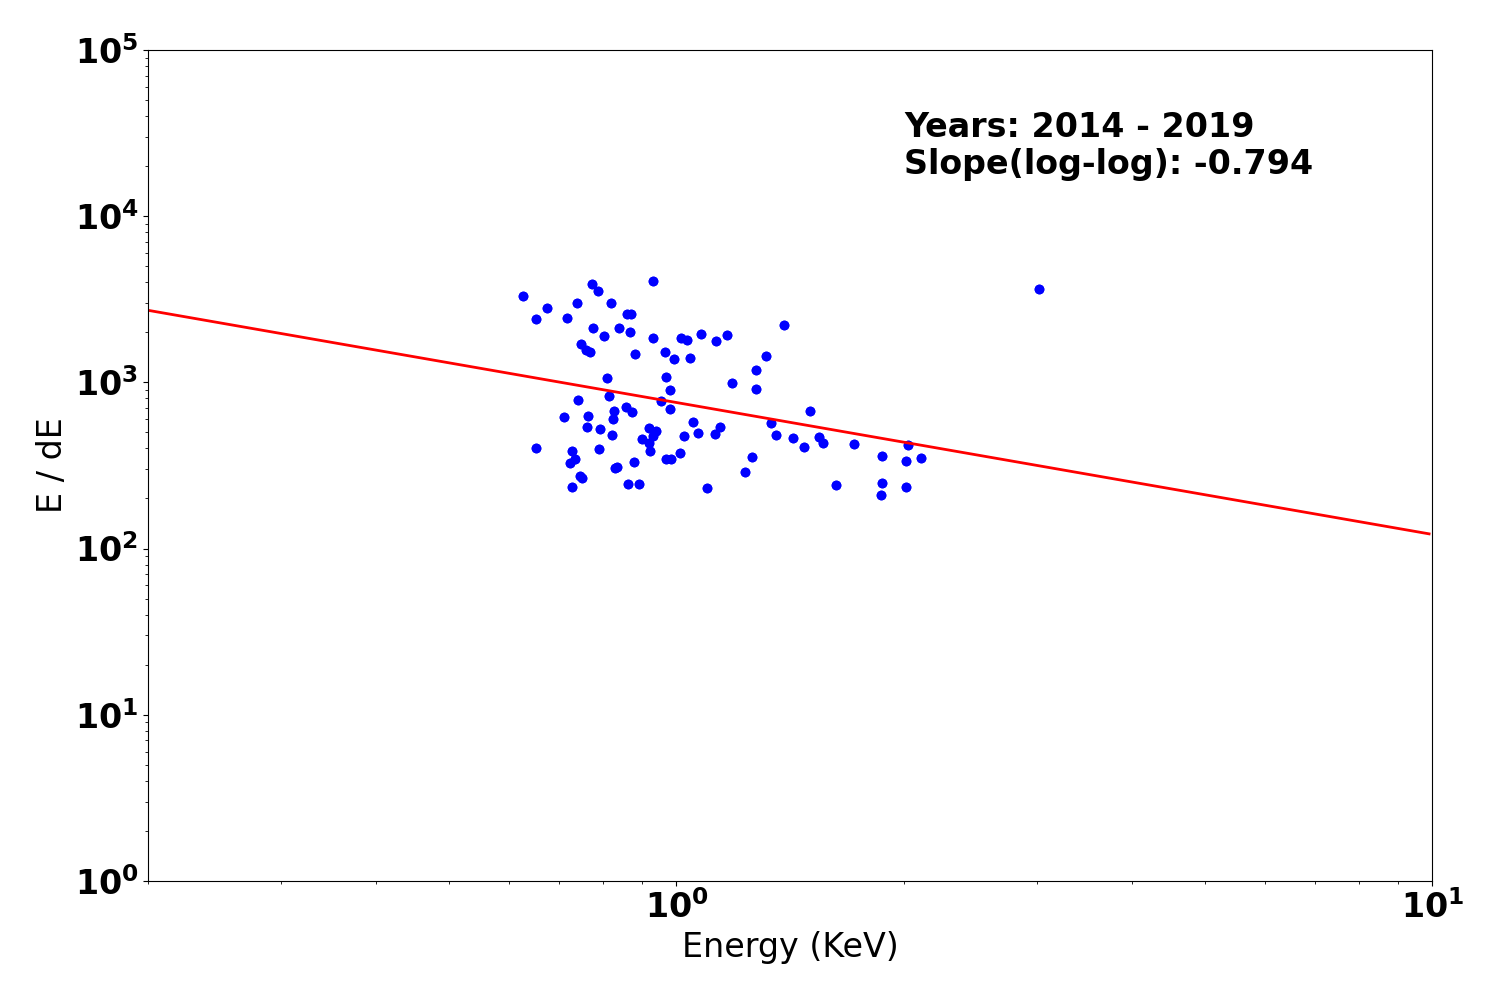
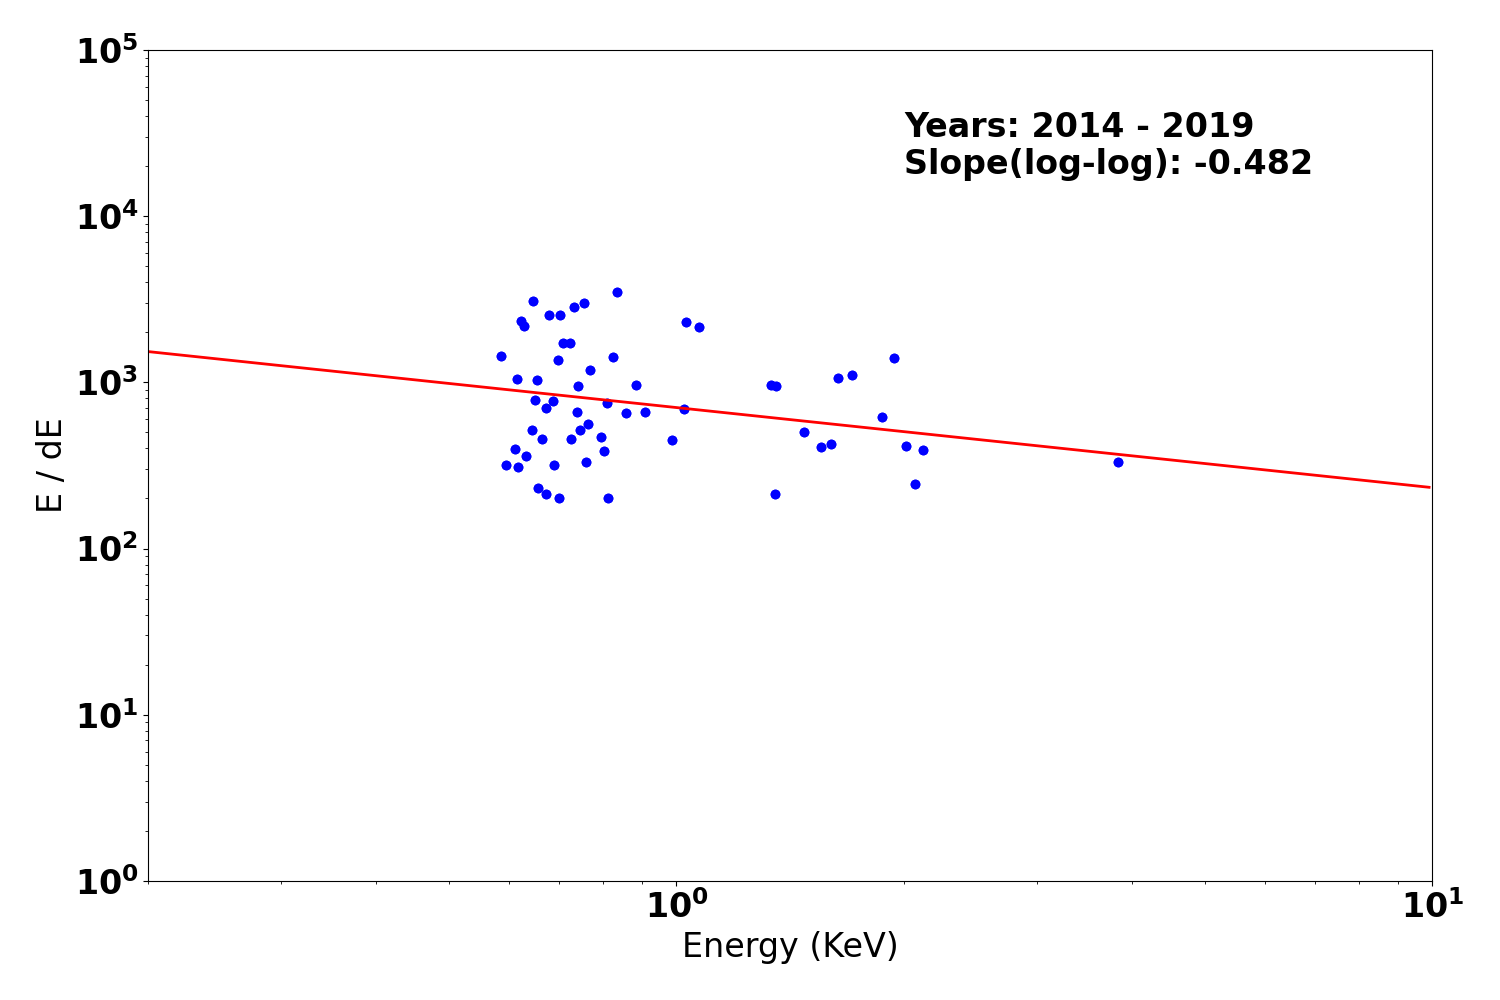
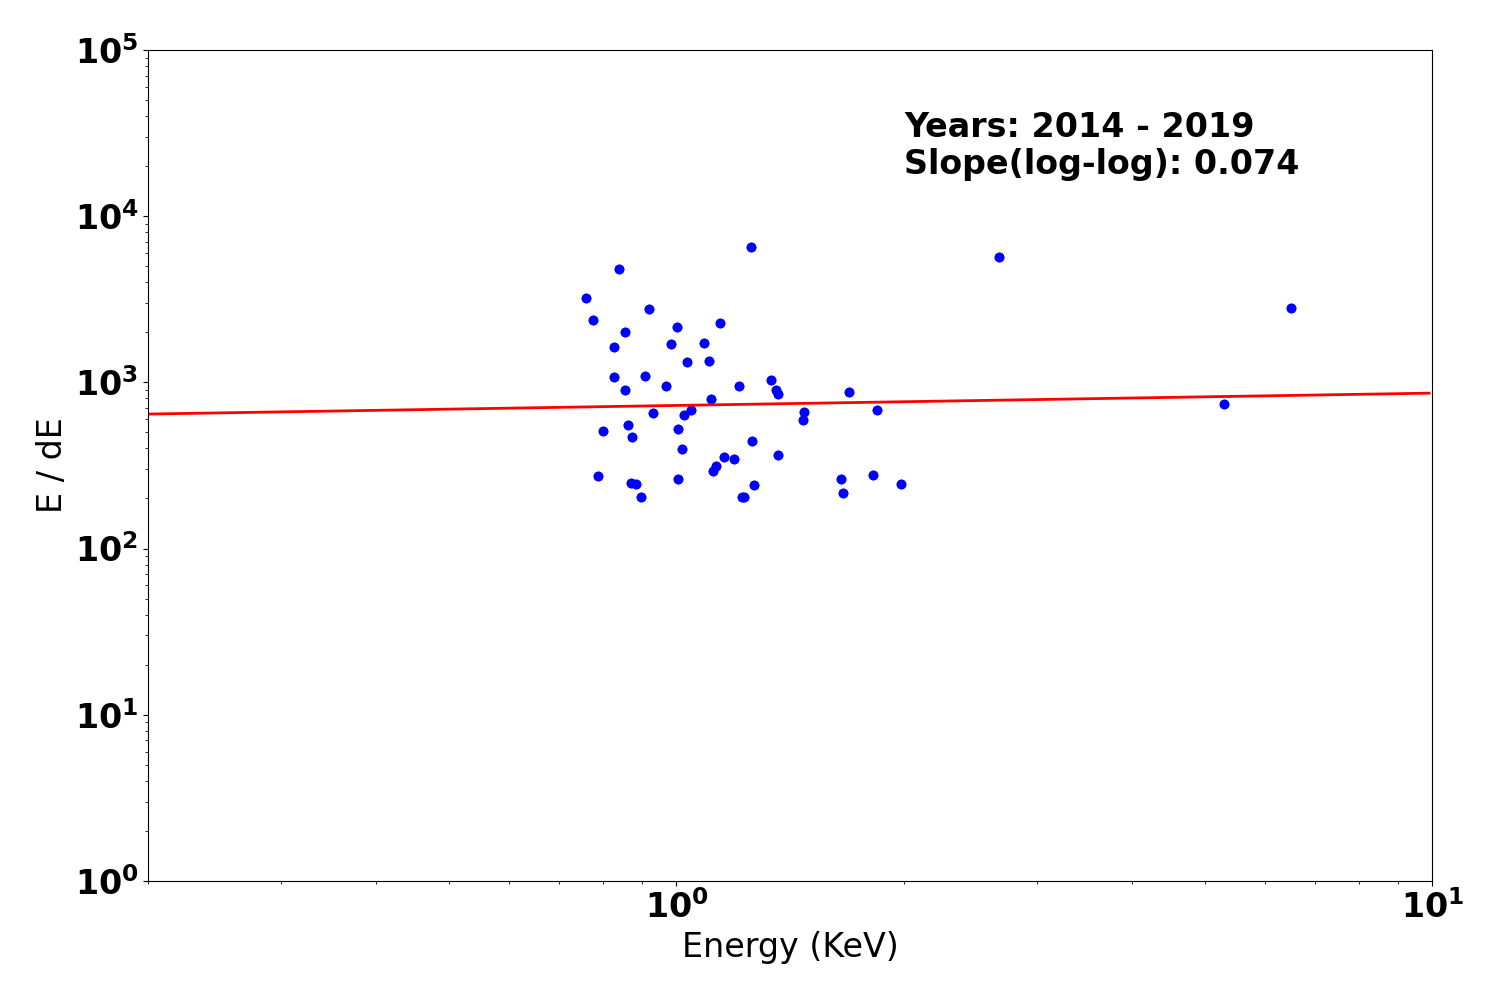
Gratings Resolving Power
We plot E/dE vs. E for fits to detected lines with fwhm_error/fwhm less than 0.15 for the plus and minus arms of HEG, MEG, and LEG. Also shown are conservative (dotted line) and optimistic (dashed line) pre-launch resolving power expectations.
We have selected only calibration observations of Capella, HR1099, and Sigma Gem. See MIT technotes for a parallel analysis.
| Year 2014 - | |
|---|---|
| Letg minus side | Letg plus side |
 |
 |
| Metg minus side | Metg plus side |
 |
 |
| Hetg minus side | Hetg plus side |
 |
 |
PCAD
ACA Trending
| ACIS |
)
|
)
|
)
|
|
|---|---|---|---|---|
)
|
)
|
)
| ||
| HRCI |
)
|
)
|
)
|
)
|
| HRCI |
)
|
)
|
)
|
)
|
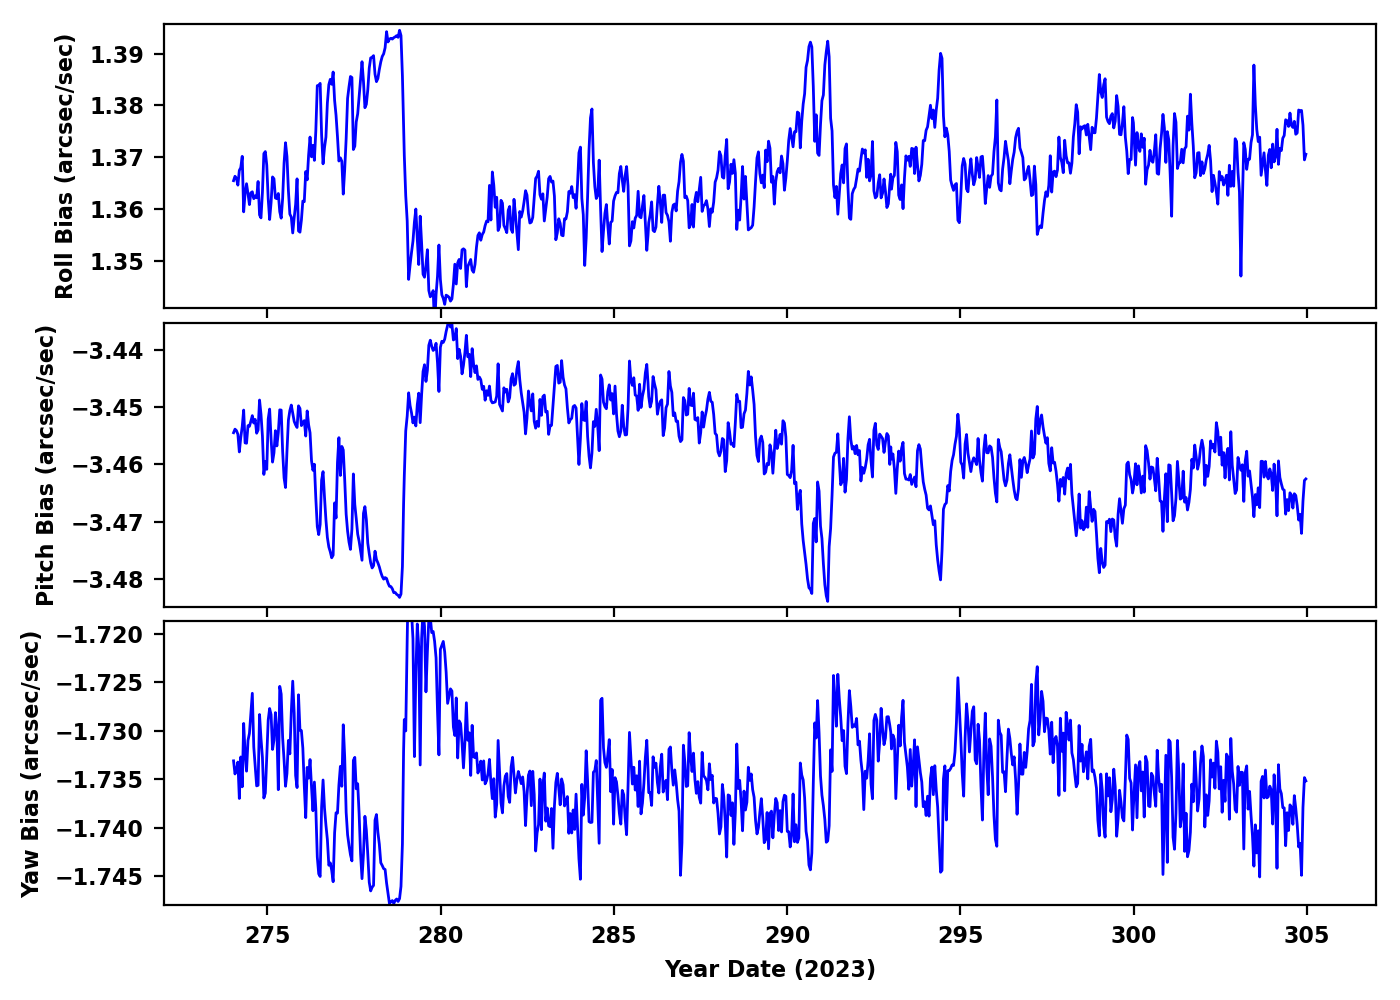
Gyro Bias Drift
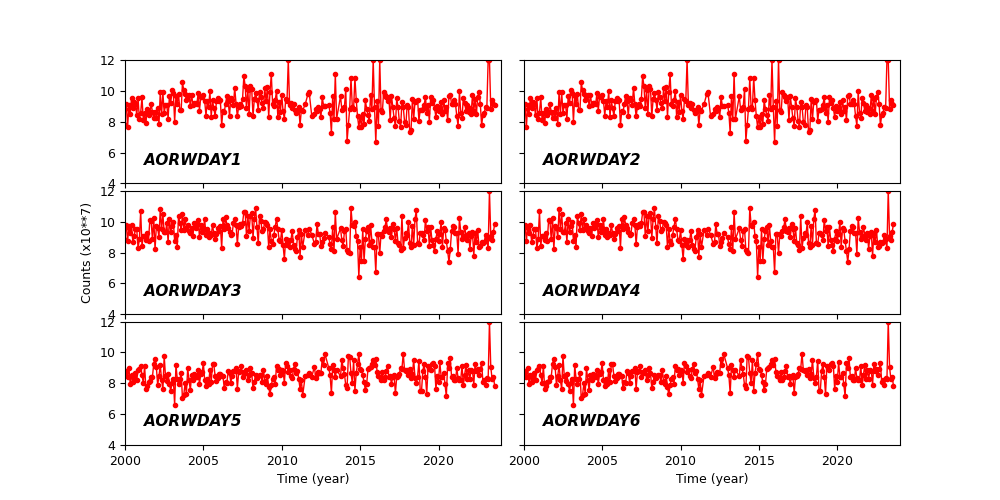
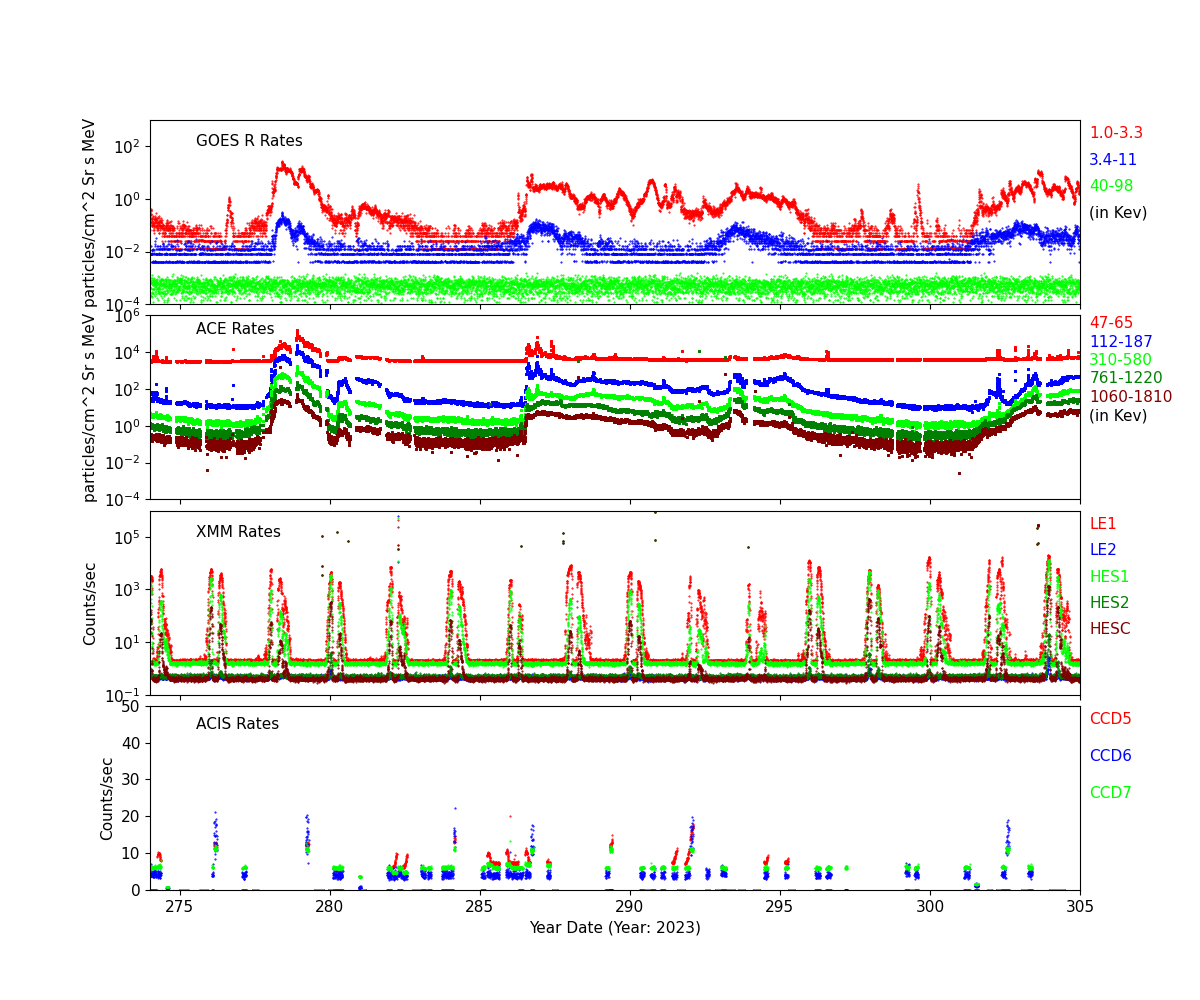
Radiation History
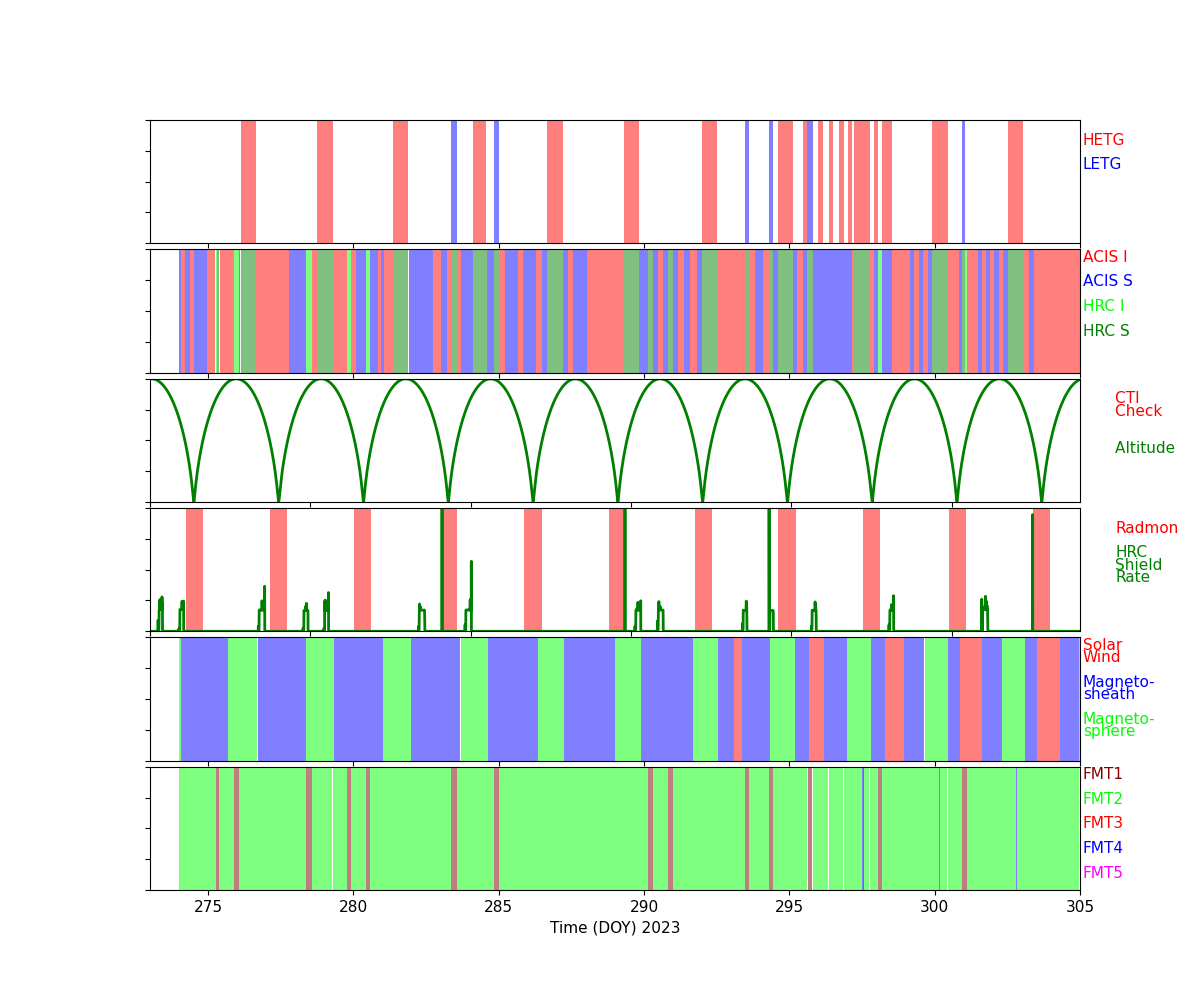
Radiation Count Rates of Oct 2023
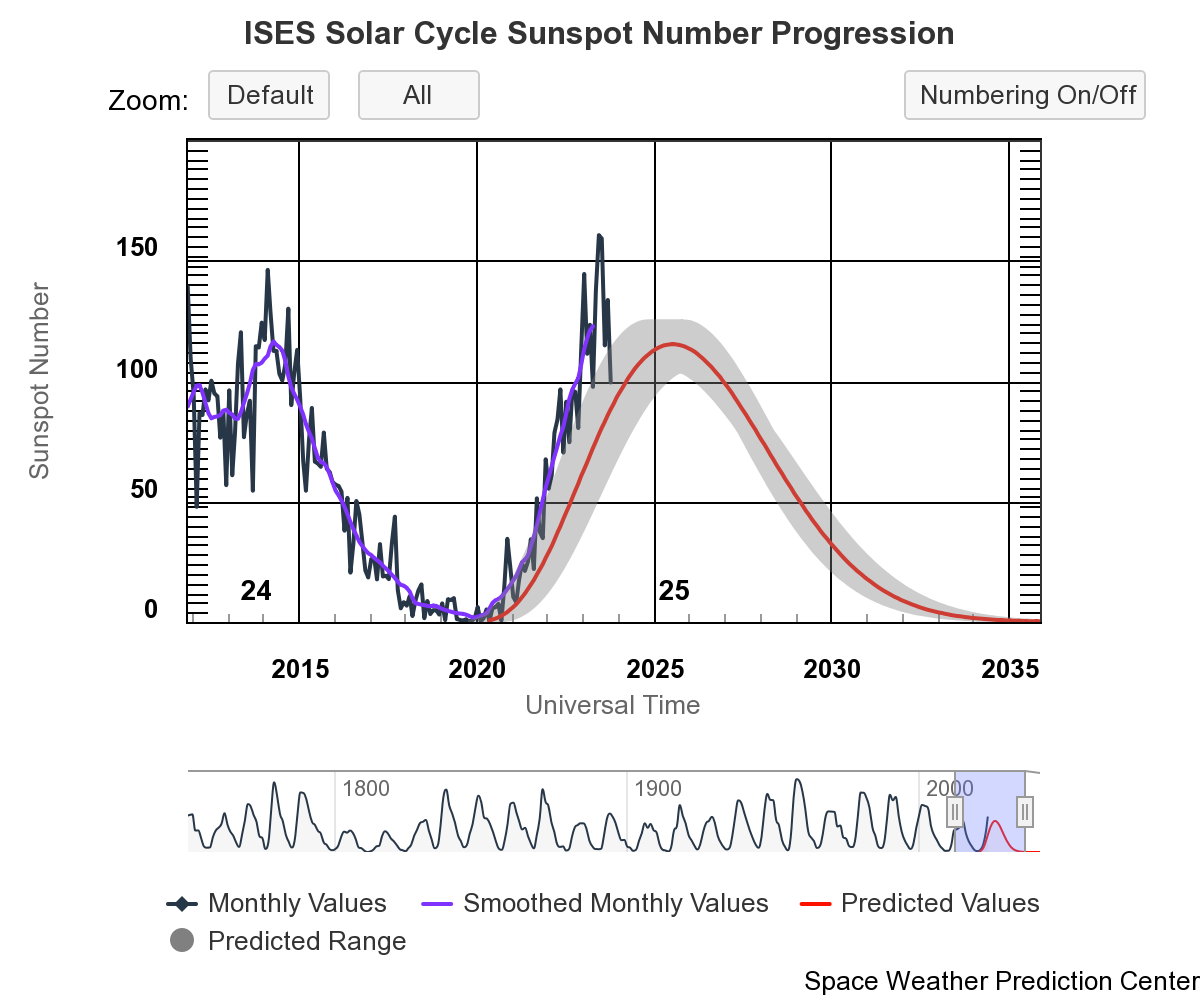
Sun Spot History (See:NOAA Page)
SIM
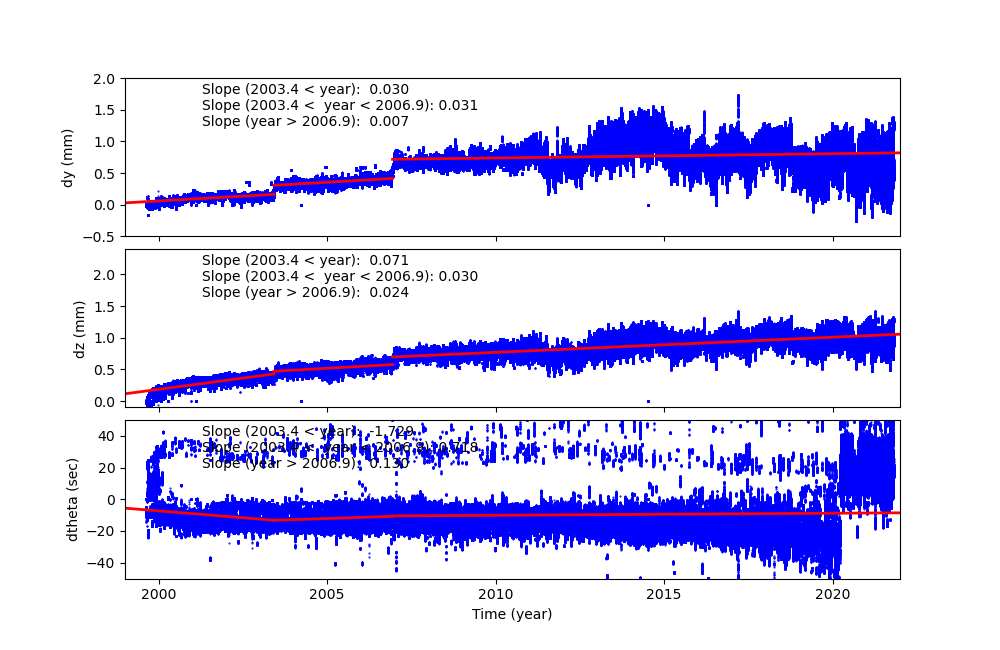
SIM Shift and Twist
SIM Shift and Twist Trend The following plots show trends of SIM shifts (dy and dz) and twist (dtheta). All quantities are directly taken from pcaf*_asol1.fits files. The units are mm for dy and dz, and degree for dtheta. We fit three lines separated before and after (Days of Mission)= 1400 (May 21, 2003), 2700 (Dec 11, 2006), and 4400 (Aug 07, 2011). The unit of slopes are mm per day or degree per day.
The sudden shift around DOM = 1400, 2700 and 4400 are due to fid light drift (see a memo by Aldcroft fiducial light drift). On the dtheta plot, two tracks are clearly observed. The track around 0.01 is due to HRC-I, and all others are clustered around -0.002. For more detail, please see SIM Shift and Twist Trend page
Trending
Quarterly Trends
- EPS Batteries
| Previous Quarter | |||||||
| MSID | MEAN | RMS | DELTA/YR | DELTA/YR/YR | UNITS | DESCRIPTION | |
| eb2ci | off | -5.618e-04 | 5.916e-05 | 0.31 +/- 0.14 | 0.00 +/- 0.00 | AMP | BATT 2 CHARGE CURRENT | on | -0.002 | 0.003 | 0.38 +/- 0.32 | (0.00+/-0.00)e0 |
|---|---|---|---|---|---|---|---|
| eb2di | off | -6.918e-04 | 1.283e-04 | 0.03 +/- 0.30 | (2.09+/-6.00)e-5 | AMP | BATT 2 DISCHARGE CURRENT | on | 0.006 | 0.010 | 0.27 +/- 1.03 | (0.00+/-0.00)e0 |
| eb2v | off | 0.001 | 6.602e-05 | 32.28 +/- 0.16 | 0.00 +/- 0.00 | V | BATT 2 VOLTAGE | on | -0.007 | 0.004 | 32.17 +/- 0.46 | (0.00+/-0.00)e0 |
| ecnv1v | -2.077e-05 | 4.755e-06 | 14.89 +/- 0.01 | (6.32+/-6.01)e-4 | V | CONV 1 +15V OUTPUT | |
| ecnv2v | -4.739e-06 | 3.541e-06 | 14.83 +/- 0.01 | 0.00 +/- 0.00 | V | CONV 2 +15V OUTPUT | |
| ecnv3v | -2.715e-05 | 2.294e-06 | 15.28 +/- 0.01 | (1.44+/-3.65)e-4 | V | CONV 3 +15V OUTPUT | |
- Spacecraft Electronics
| Previous Quarter | |||||||
| MSID | MEAN | RMS | DELTA/YR | DELTA/YR/YR | UNITS | DESCRIPTION | |
| elbi | 0.003 | 5.472e-04 | 53.23 +/- 1.28 | 0.03 +/- 0.16 | AMP | LOAD BUS CURRENT | |
|---|---|---|---|---|---|---|---|
| elbv | off | 0.002 | 6.899e-05 | 27.82 +/- 0.17 | -0.04 +/- 0.02 | V | LOAD BUS VOLTAGE | on | 0.007 | 0.003 | 27.71 +/- 0.36 | (0.00+/-0.00)e0 |
- OBA Heater
| Previous Quarter | |||||||
| MSID | MEAN | RMS | DELTA/YR | DELTA/YR/YR | UNITS | DESCRIPTION | |
| oobthr04 | 0.006 | 7.138e-04 | (3.03+/-0.02)e2 | 0.81 +/- 0.39 | K | RT 27: HRMA STRUT | |
|---|---|---|---|---|---|---|---|
| oobthr12 | 0.008 | 0.001 | (3.01+/-0.02)e2 | 0.97 +/- 0.60 | K | RT 35: OBA CONE | |
| oobthr26 | 0.011 | 0.002 | (3.05+/-0.04)e2 | 1.18 +/- 0.91 | K | RT 48: OBA CONE | |
| oobthr38 | 3.574e-05 | 5.182e-06 | (2.72+/-0.00)e2 | 0.00 +/- 0.00 | K | RT 60: TFTE CONE | |
| oobthr44 | 0.008 | 0.001 | (3.04+/-0.02)e2 | 1.02 +/- 0.62 | K | RT 66: TFTE COVER | |
| oobthr50 | 0.008 | 8.899e-04 | (2.98+/-0.02)e2 | 0.90 +/- 0.52 | K | RT 76: S/C STRUT | |
Spacecraft Motions
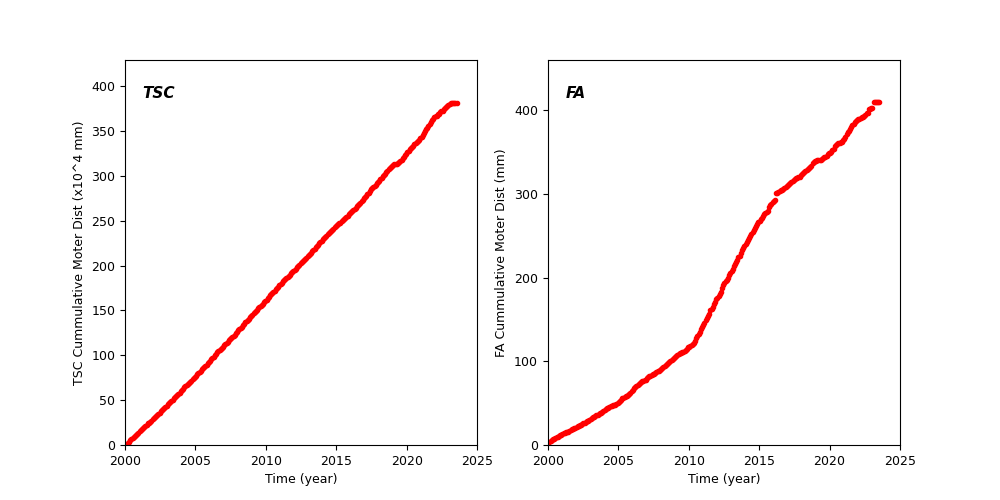
TSC and FA Cummulative Moter Distance
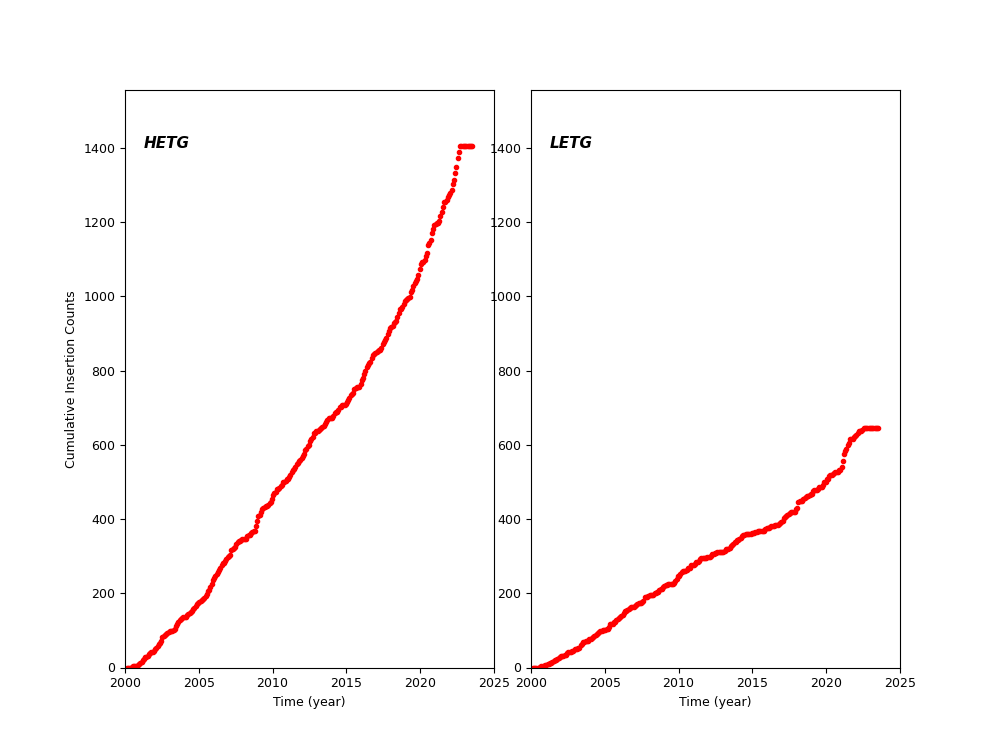
HETG and LETG Cummulative Insertion Counts
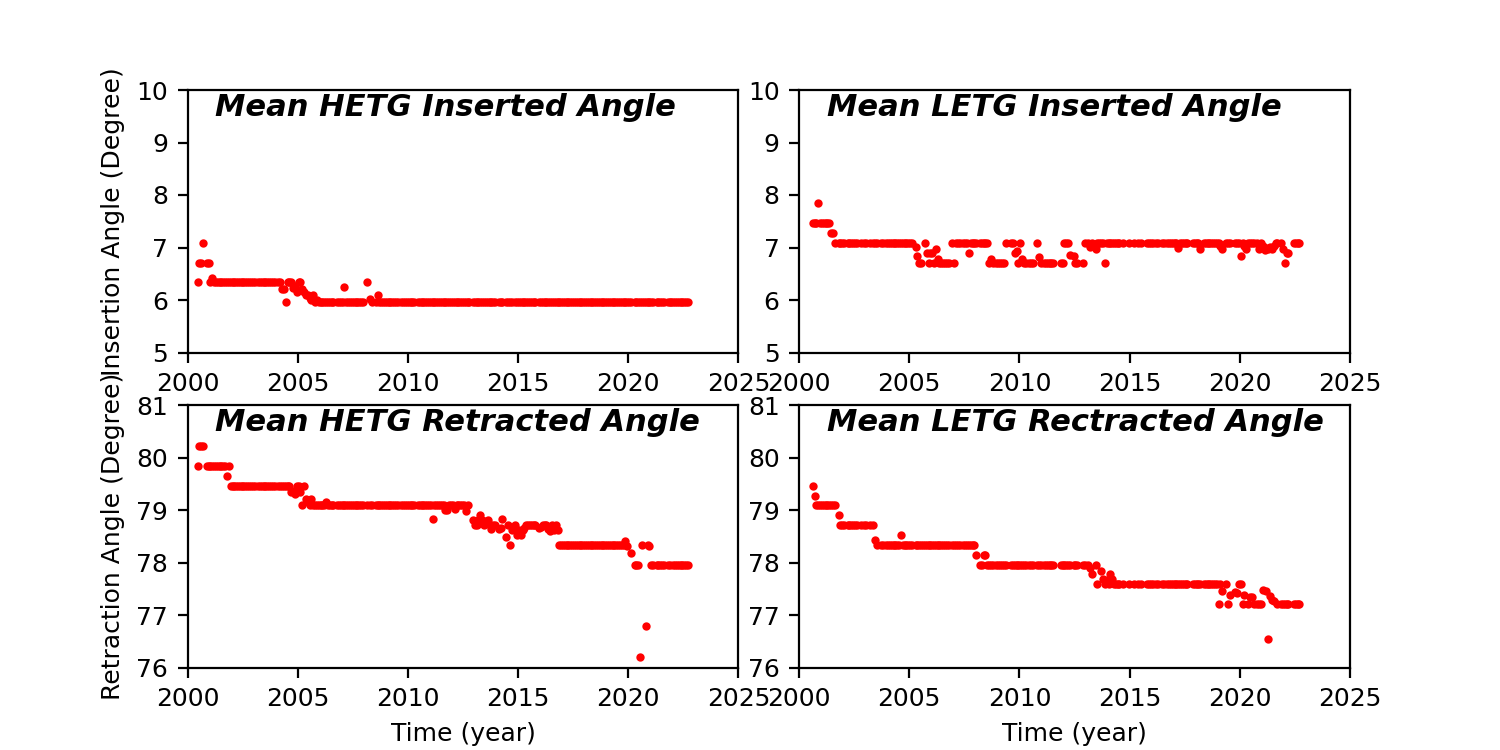
HETG/LETG Insertion/Retraction Angle
Reaction Wheel Rotations