ACIS
ACIS DOSE Registered-Photon-Map
The steps we took to compute the dose map are;
- Level 1 Event files for a specified month are obtained from archive.
- Image data including I2, I3, S2, S3 CCDs are extracted from all event files.
- All the extracted image data were merged to create a month long exposure map for the month.
- The exposure map is opened with ds9, and check a distribution of count rates against energy. From this, estimate the upper threshold value. Any events beyond this upper threshold are assumed erroneous events such as bad pixels.
- Using this upper threshold, the data is filtered, and create a cleaned exposure map for the month.
- The exposure map from each month from the Sep 1999 is added up to create a cumulative exposure map for each month.
- Using fimgstatistic, we compute count rate statistics for each CCDs.
- For observations with high data drop rates (e.g., Crab nebula, Cas A), we corrected the observations by adding events.
Please check more detail plots at Telemetered Photon Dose Trend page.
)
)
)
Statistics:
# IMAGE     NPIX     MEAN        RMS        MIN     MAX
ACIS_jun24 6004901       3.674         5.698           0.0     2724


I2 node 0  262654	4.904561	2.609834	0.0	 66.0
I2 node 1  262654	5.165642	3.216899	0.0	829.0
I2 node 2  262654	5.097958	2.651136	0.0	 64.0
I2 node 3  262654	5.240949	2.887812	0.0	348.0

I3 node 0  262654	5.441695	2.822577	0.0	 61.0
I3 node 1  262654	5.640839	2.814819	0.0	107.0
I3 node 2  262654	5.454466	2.668361	0.0	 59.0
I3 node 3  262654	5.300063	5.407517	0.0	2345.0

S2 node 0  262654	3.621320	5.787442	0.0	2724.0
S2 node 1  262654	3.745125	2.406656	0.0	189.0
S2 node 2  262654	3.809402	6.412271	0.0	2332.0
S2 node 3  262654	6.768870	14.462337	0.0	362.0

S3 node 0  262654	5.123303	5.113060	0.0	 64.0
S3 node 1  262654	5.177268	2.574598	0.0	 47.0
S3 node 2  262654	4.917927	2.346067	0.0	 34.0
S3 node 3  262654	4.362527	2.200867	0.0	 21.0
)
)
)
Statistics:
 IMAGE     NPIX      MEAN        RMS           MIN      MAX
ACIS_total   6004901       2692.640         3415.736           0.0   158232


I2 node 0  262654	2339.516699	474.324005	498.0	15109.0
I2 node 1  262654	2465.340948	688.012689	511.0	156226.0
I2 node 2  262654	2493.020552	528.616597	537.0	16425.0
I2 node 3  262654	2497.467365	646.968927	498.0	34799.0

I3 node 0  262654	2689.368989	663.020905	499.0	14764.0
I3 node 1  262654	2771.523426	1751.936460	519.0	56007.0
I3 node 2  262654	2481.332561	464.388186	492.0	15082.0
I3 node 3  262654	2460.403712	500.907779	464.0	35794.0

S2 node 0  262654	3140.647388	507.460297	1698.0	22567.0
S2 node 1  262654	3334.345826	759.553329	1875.0	18707.0
S2 node 2  262654	3696.961179	763.866250	2291.0	32887.0
S2 node 3  262654	3657.553851	616.725535	2013.0	82280.0

S3 node 0  262654	5561.805790	2998.973833	2444.0	54938.0
S3 node 1  262654	6782.602564	2390.213845	0.0	74989.0
S3 node 2  262654	5516.337190	1365.186411	2580.0	27535.0
S3 node 3  262654	4331.190970	771.997050	2615.0	26659.0
)
|
)
|
)
|
)
|
| Mar 2024 | Dec 2023 | Sep 2023 | Jun 2023 |
|---|
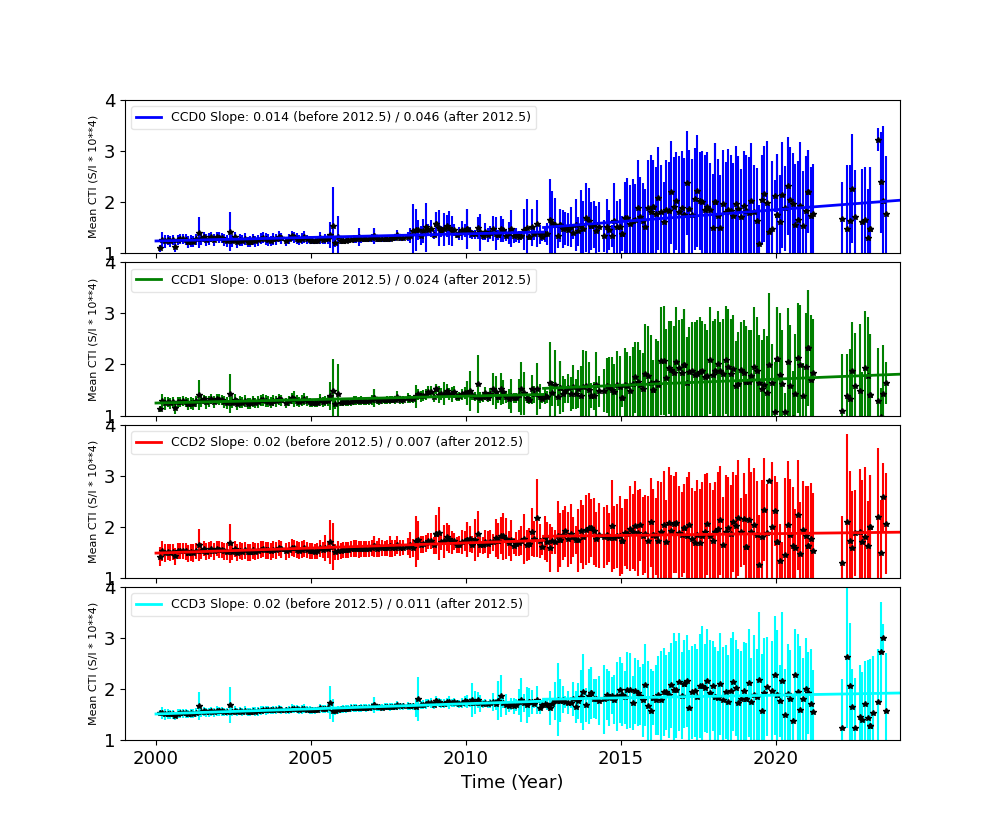
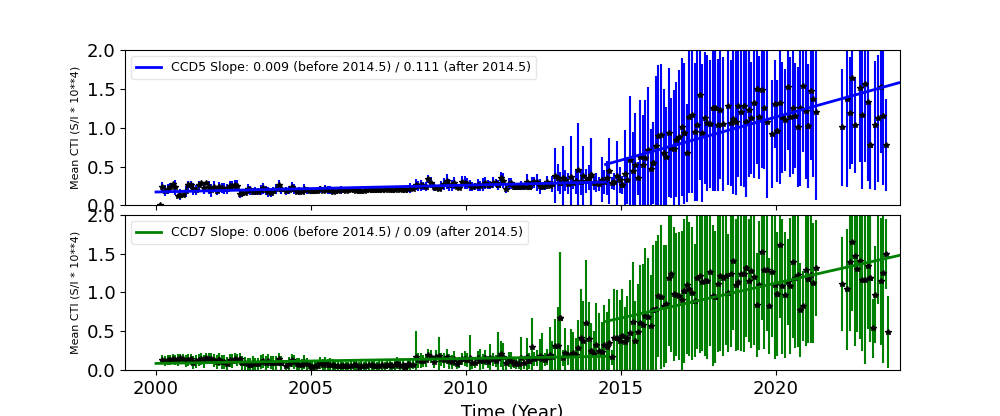
The Mean Detrended CTI
We report CTIs with a refined data definition. CTIs were computed for the temperature dependency corrected data. Please see CTI page for detailed explanation. CTI's are computed for Mn K alpha, and defined as slope/intercept x10^4 of row # vs ADU. Data file: here
Imaging CCDs
Spectral CCDs
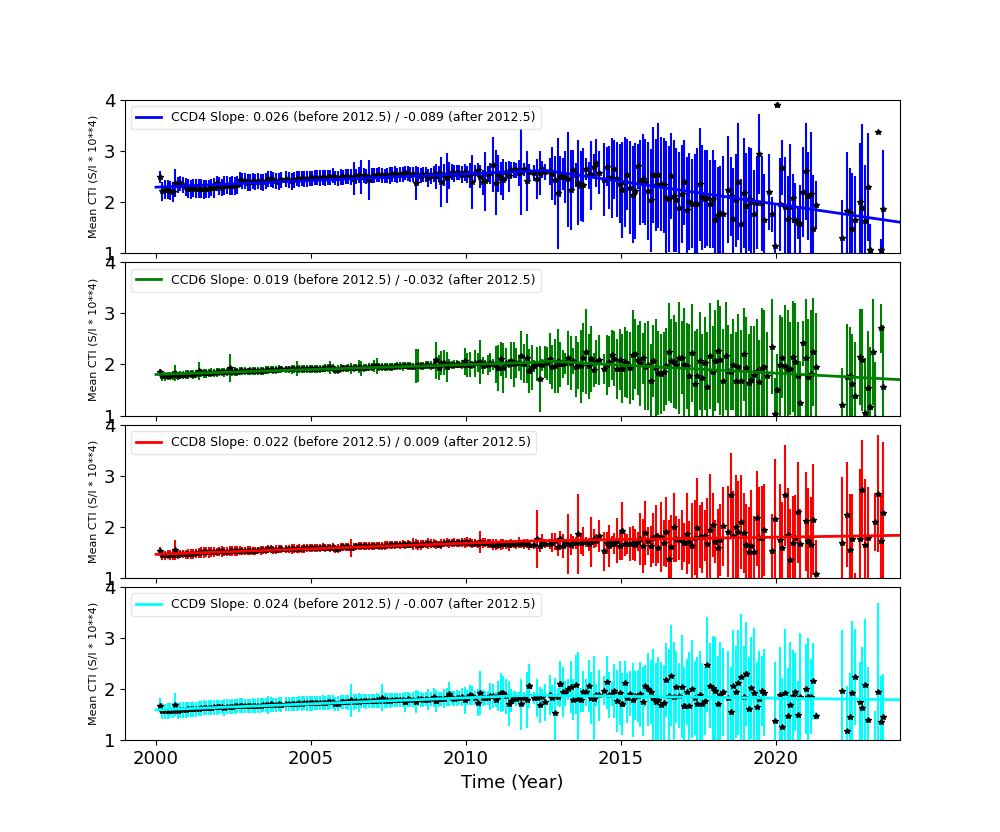
Backside CCDs
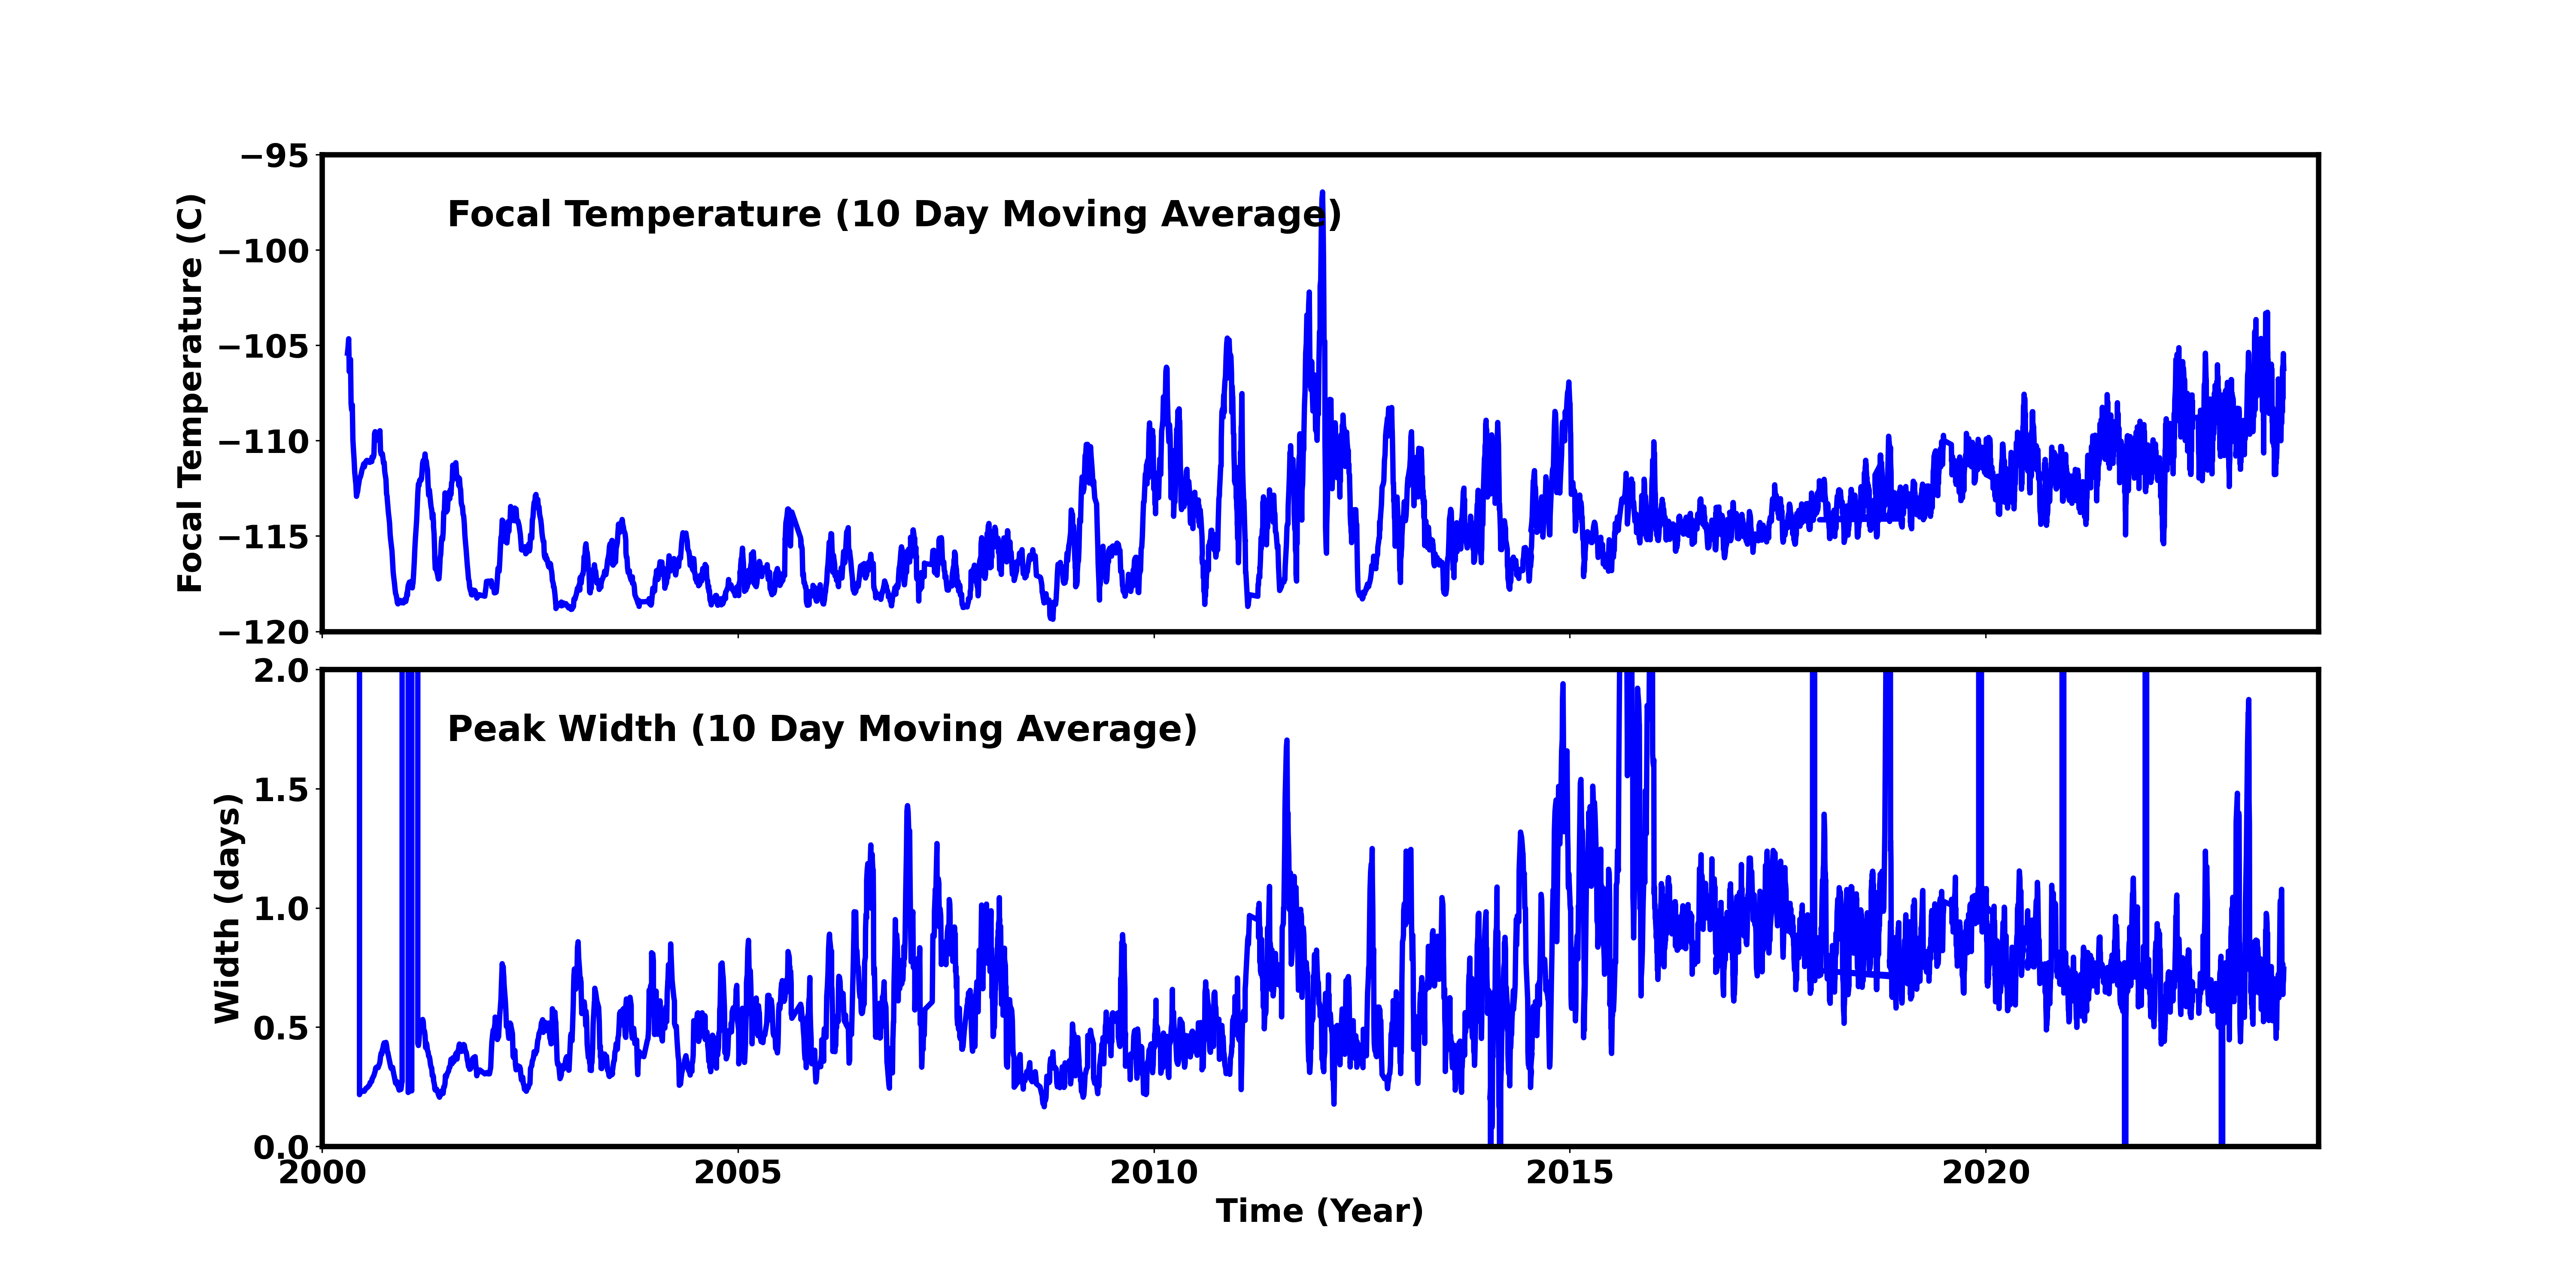
Focal Plane Temperature
Jun 2024 Focal Temperature
| The Mean (max) FPT: | |
|---|---|
| -107.53 | +/- 7.69 C |
| Mean Width: | |
| 0.8 | +/- 0.58 days |
Averaged Focal Plane Temperature
We are using 10 period moving averages to show trends of peak temperatures and peak widths. Note, the gaps in the width plot are due to missing/corrupted data.
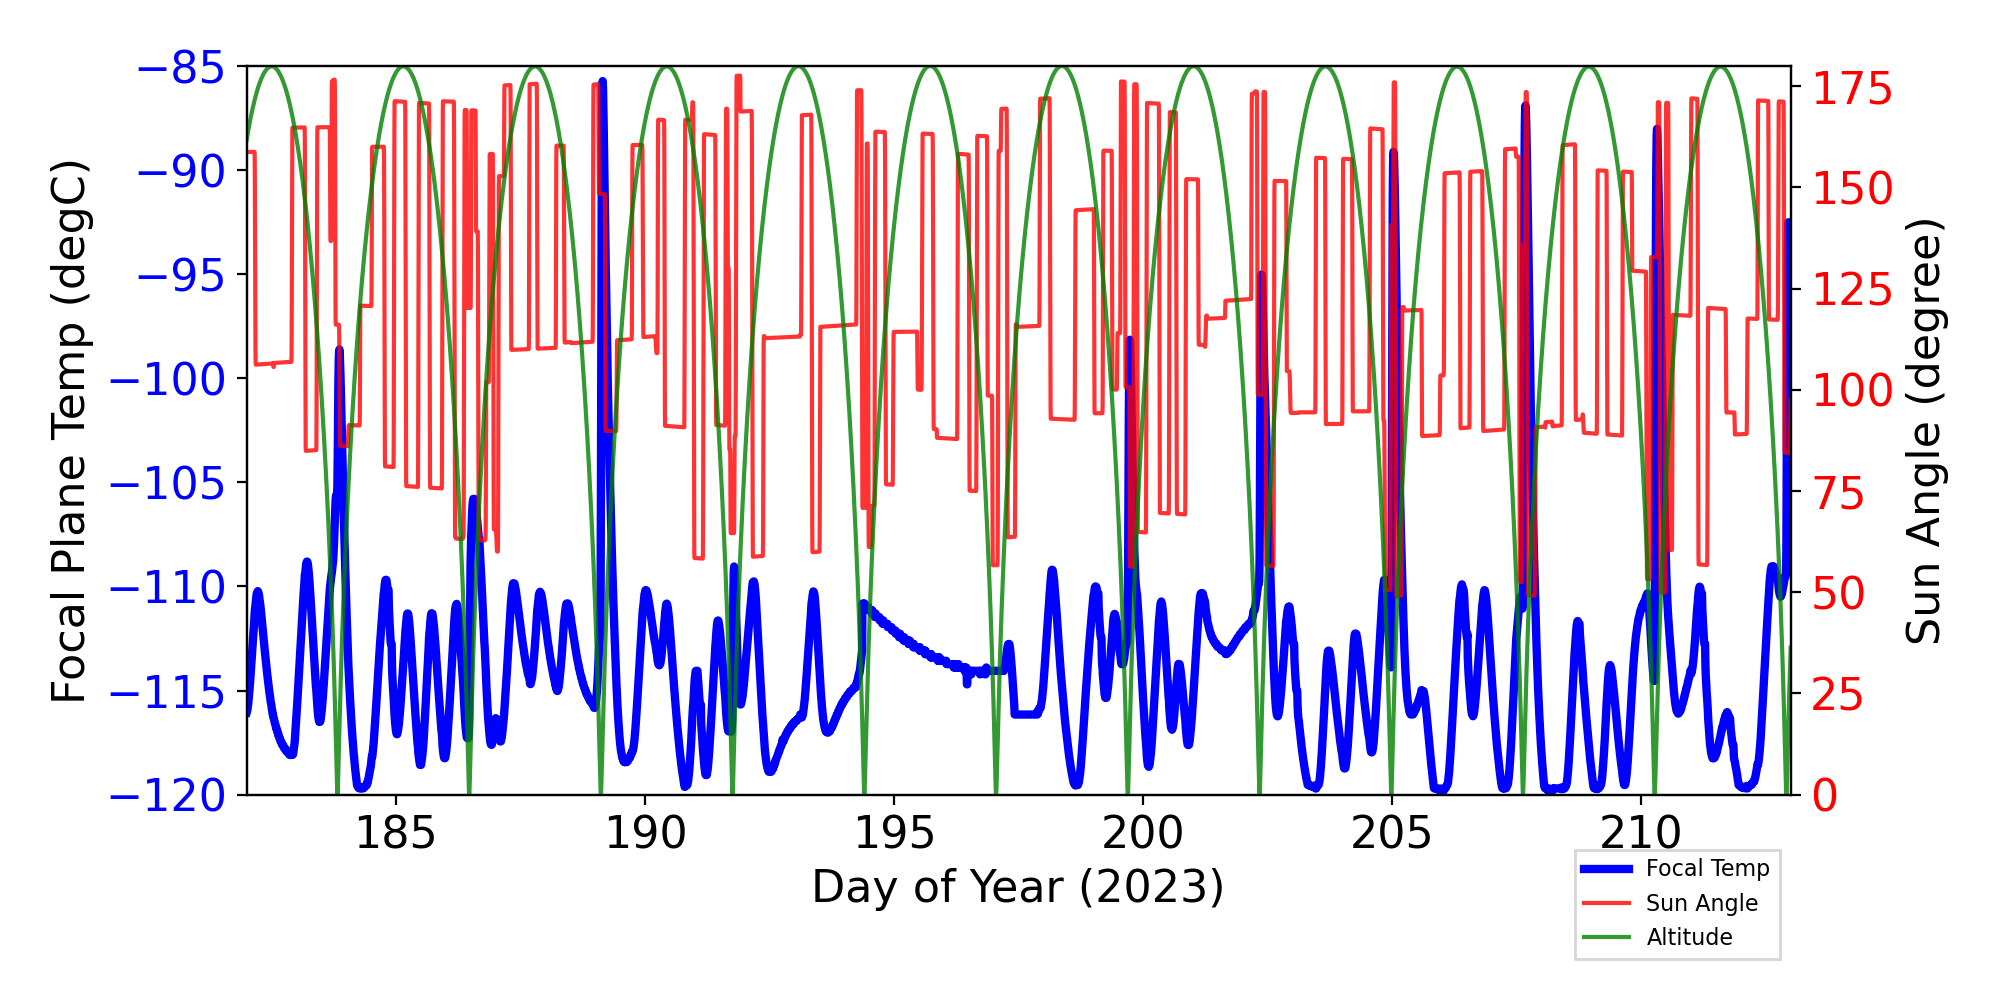
Focal Plane Temperature, Sun Angle and Altitude
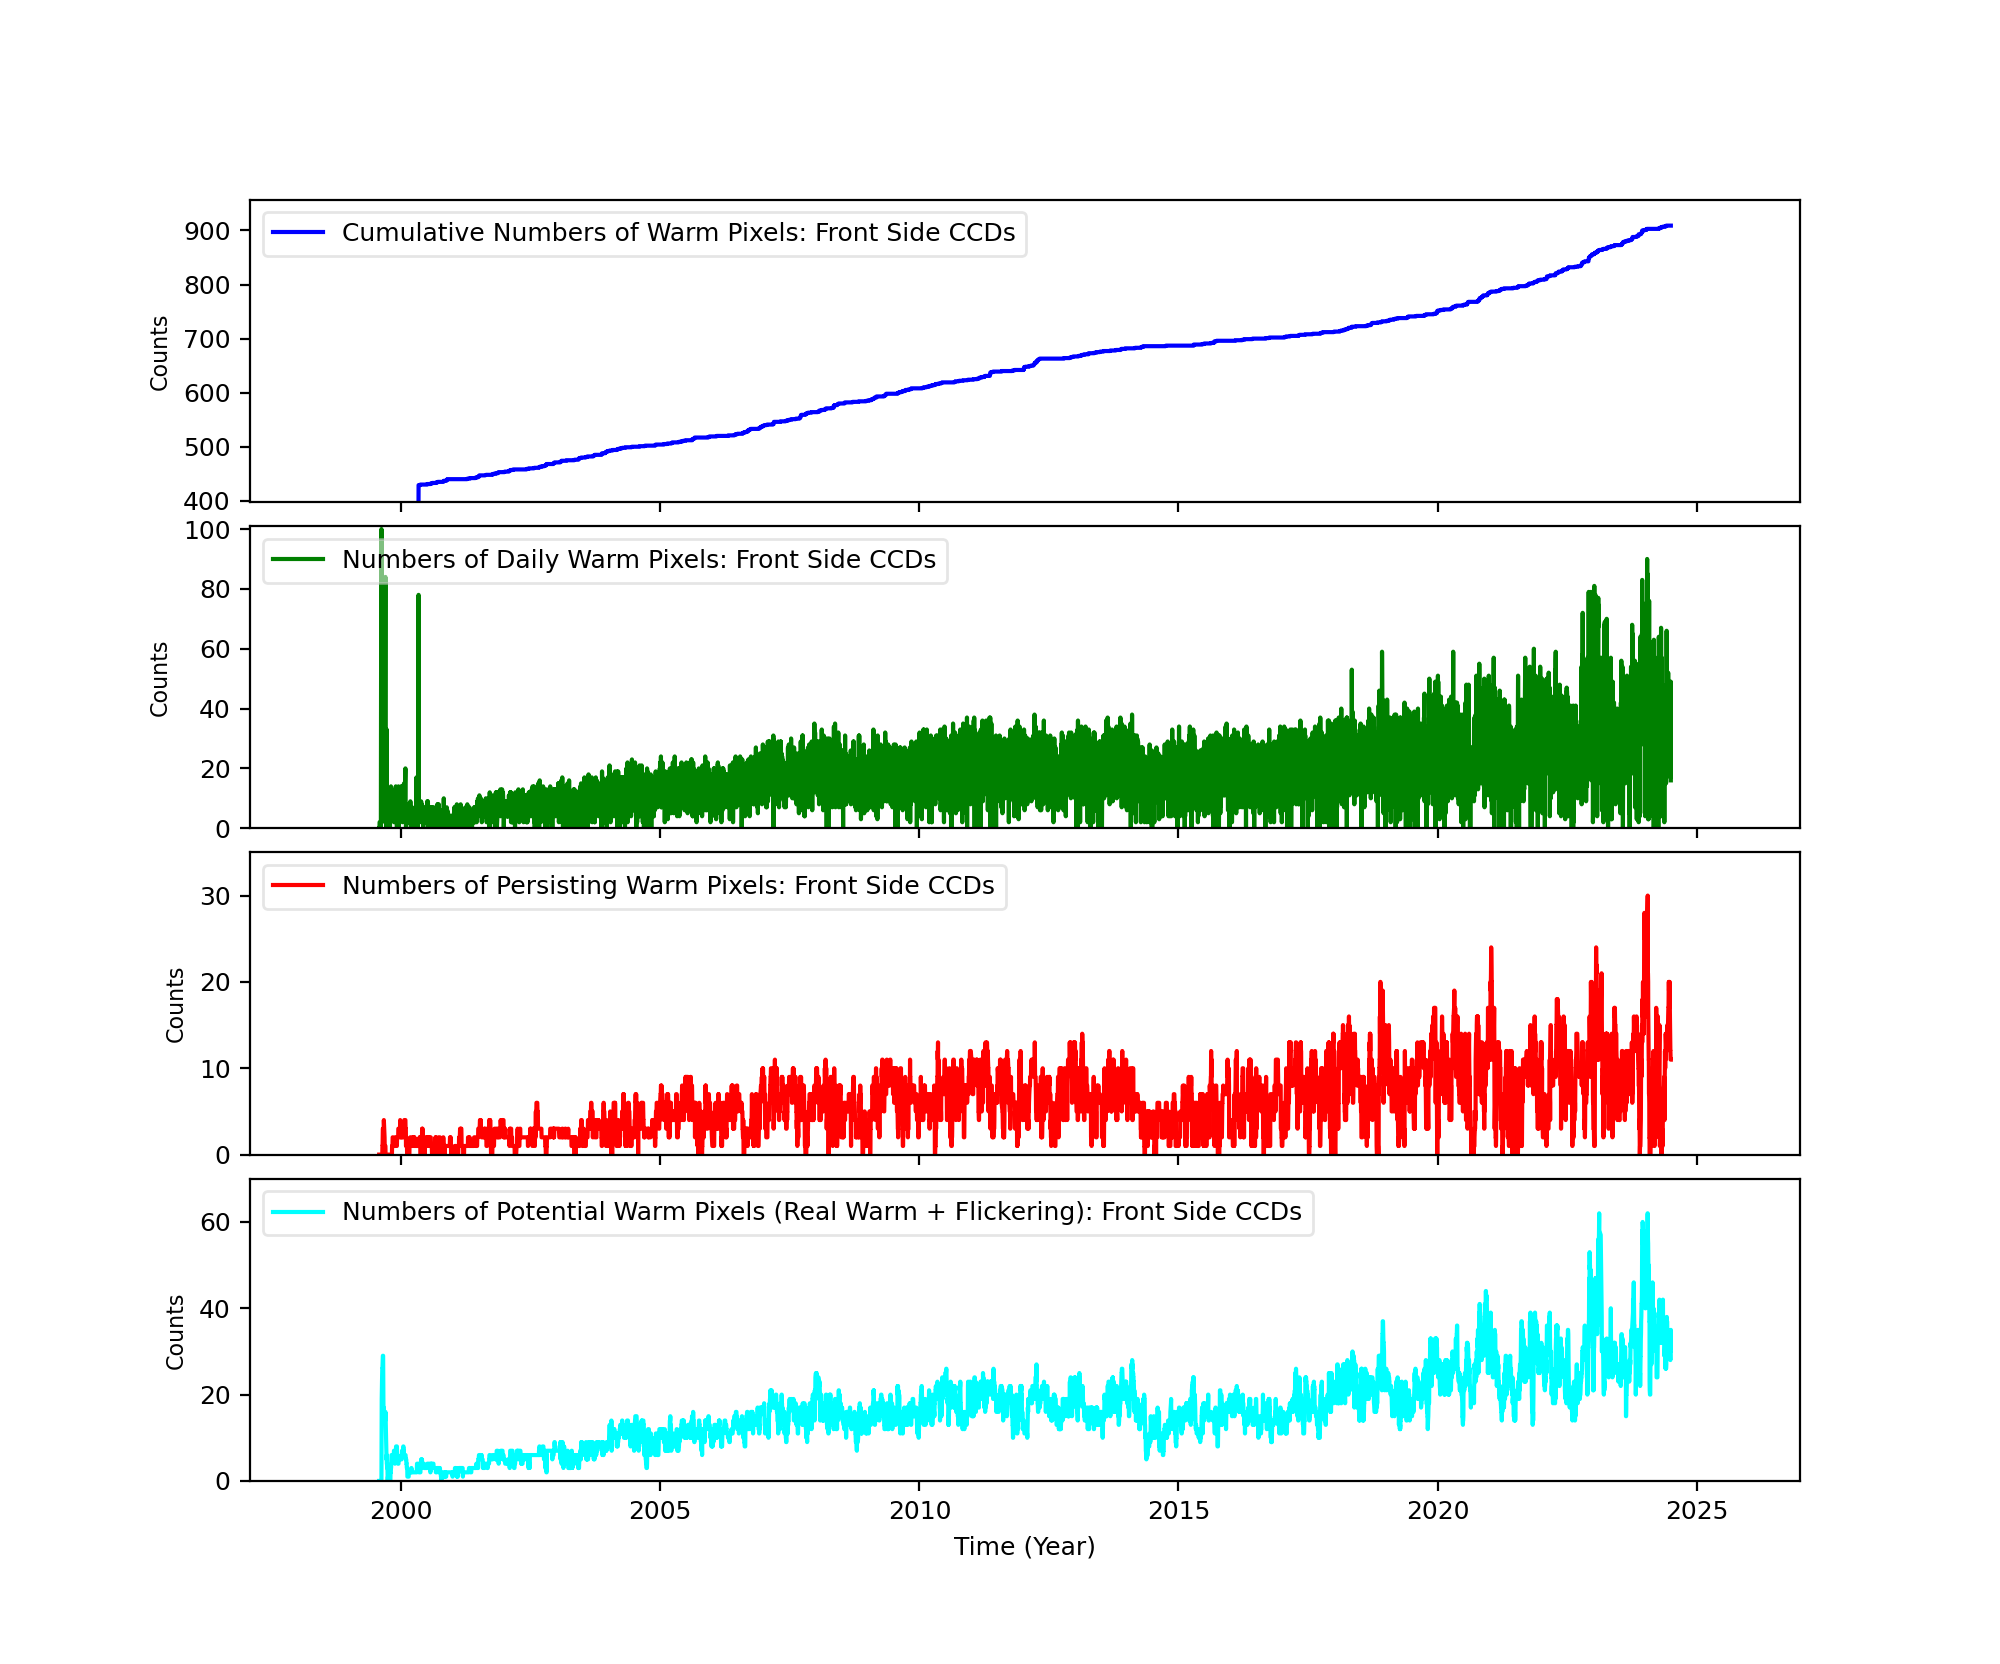
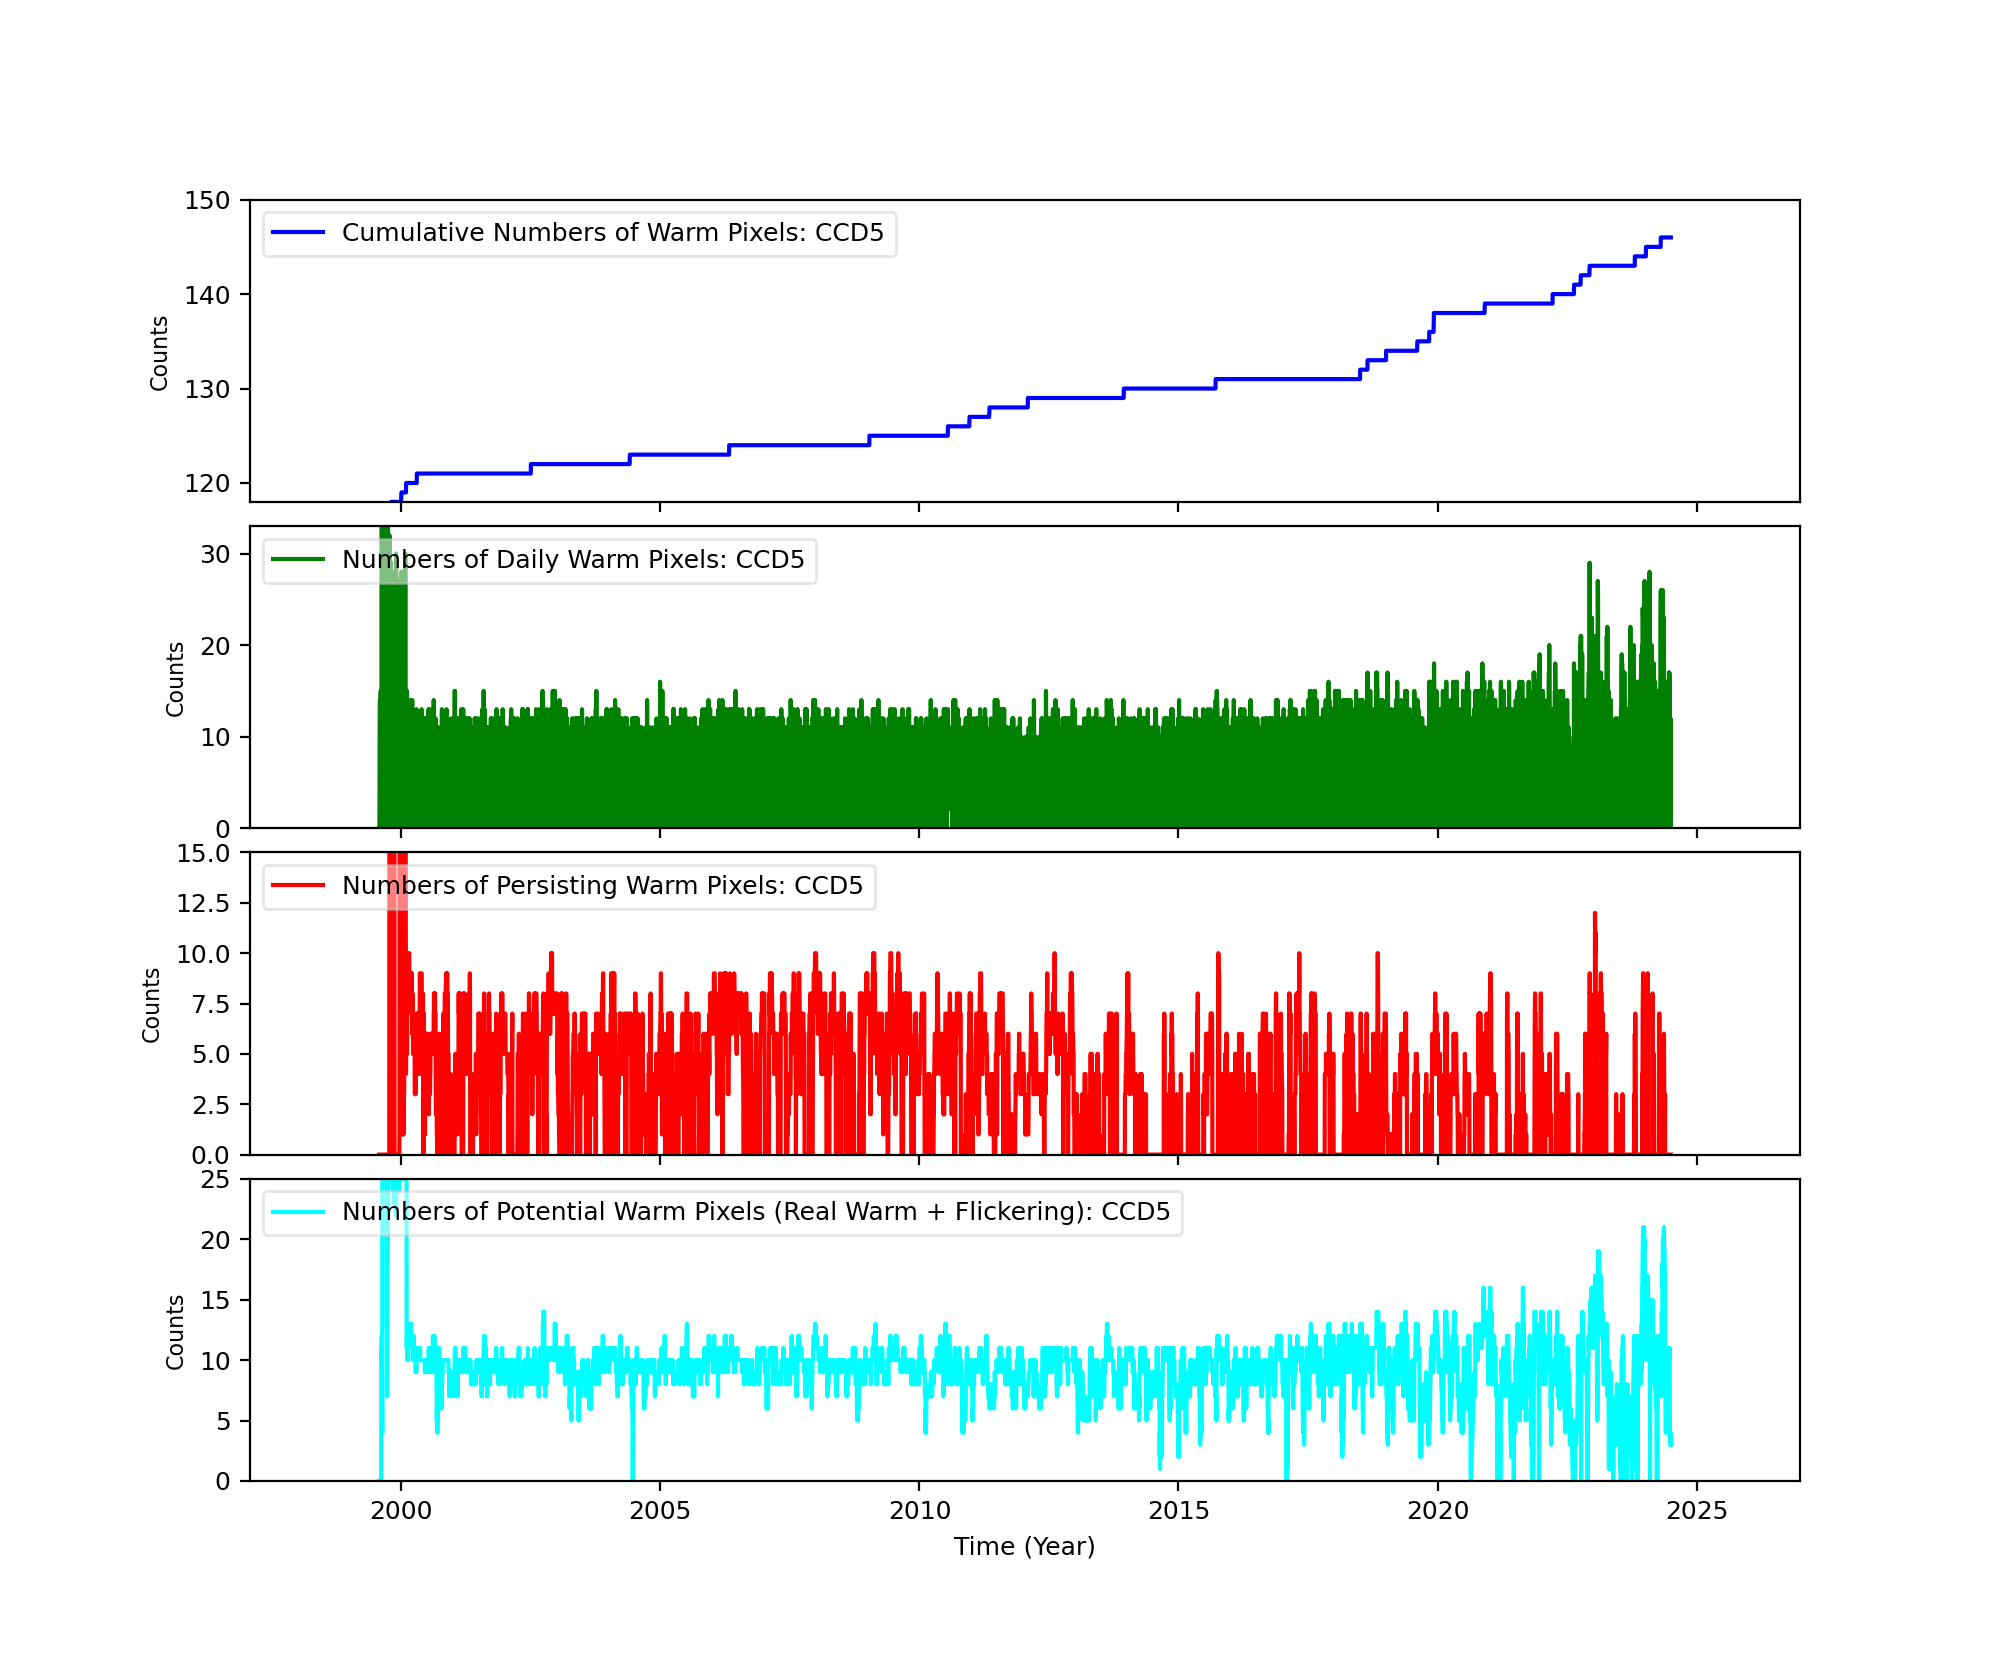
Bad Pixels
The plots below were generated with a new warm pixel finding script. Please see Acis Bad Pixel Page for details.
Front Side CCDs
Back Side CCD (CCD5)
Science Instrument Background Rates
| Name | Low (keV) | High(KeV) | Description |
|---|---|---|---|
| SSoft | 0.00 | 0.50 | Super soft photons |
| Soft | 0.50 | 1.00 | Soft photons |
| Med | 1.00 | 3.00 | Moderate energy photons |
| Hard | 3.00 | 5.00 | Hard Photons |
| Harder | 5.00 | 10.00 | Very Hard photons |
| Hardest | 10.00 | Beyond 10 keV |


HRC
DOSE of Central 4K Pore-Pairs
Please refer to Maximum Dose Trends for more details.
)
|
|---|
IMAGE                NPIX      MEAN    STDDEV      MIN       MAX
HRCI_06_2024.fits  16777216	0.043 	0.235 	0.000 	16.000
)
IMAGE                       NPIX      MEAN    STDDEV      MIN       MAX
HRCI_08_1999_06_2024.fits  16777216	na	na	na	na
)
|
|---|
IMAGE                NPIX      MEAN    STDDEV      MIN       MAX
HRCS_06_2024.fits  16777216	0.054 	0.258 	0.000 	15.000
)
IMAGE                       NPIX      MEAN    STDDEV      MIN       MAX
HRCS_08_1999_06_2024.fits  16777216	na	na	na	na
|
|
Max dose trend plots corrected for events that "pile-up"
in the center of the taps due to bad position information.
|
)
|
)
|
)
|
)
|
| Mar 2024 | Dec 2023 | Sep 2023 | Jun 2023 |
|---|
)
|
)
|
)
|
)
|
| Mar 2024 | Dec 2023 | Sep 2023 | Jun 2023 |
|---|
Gratings
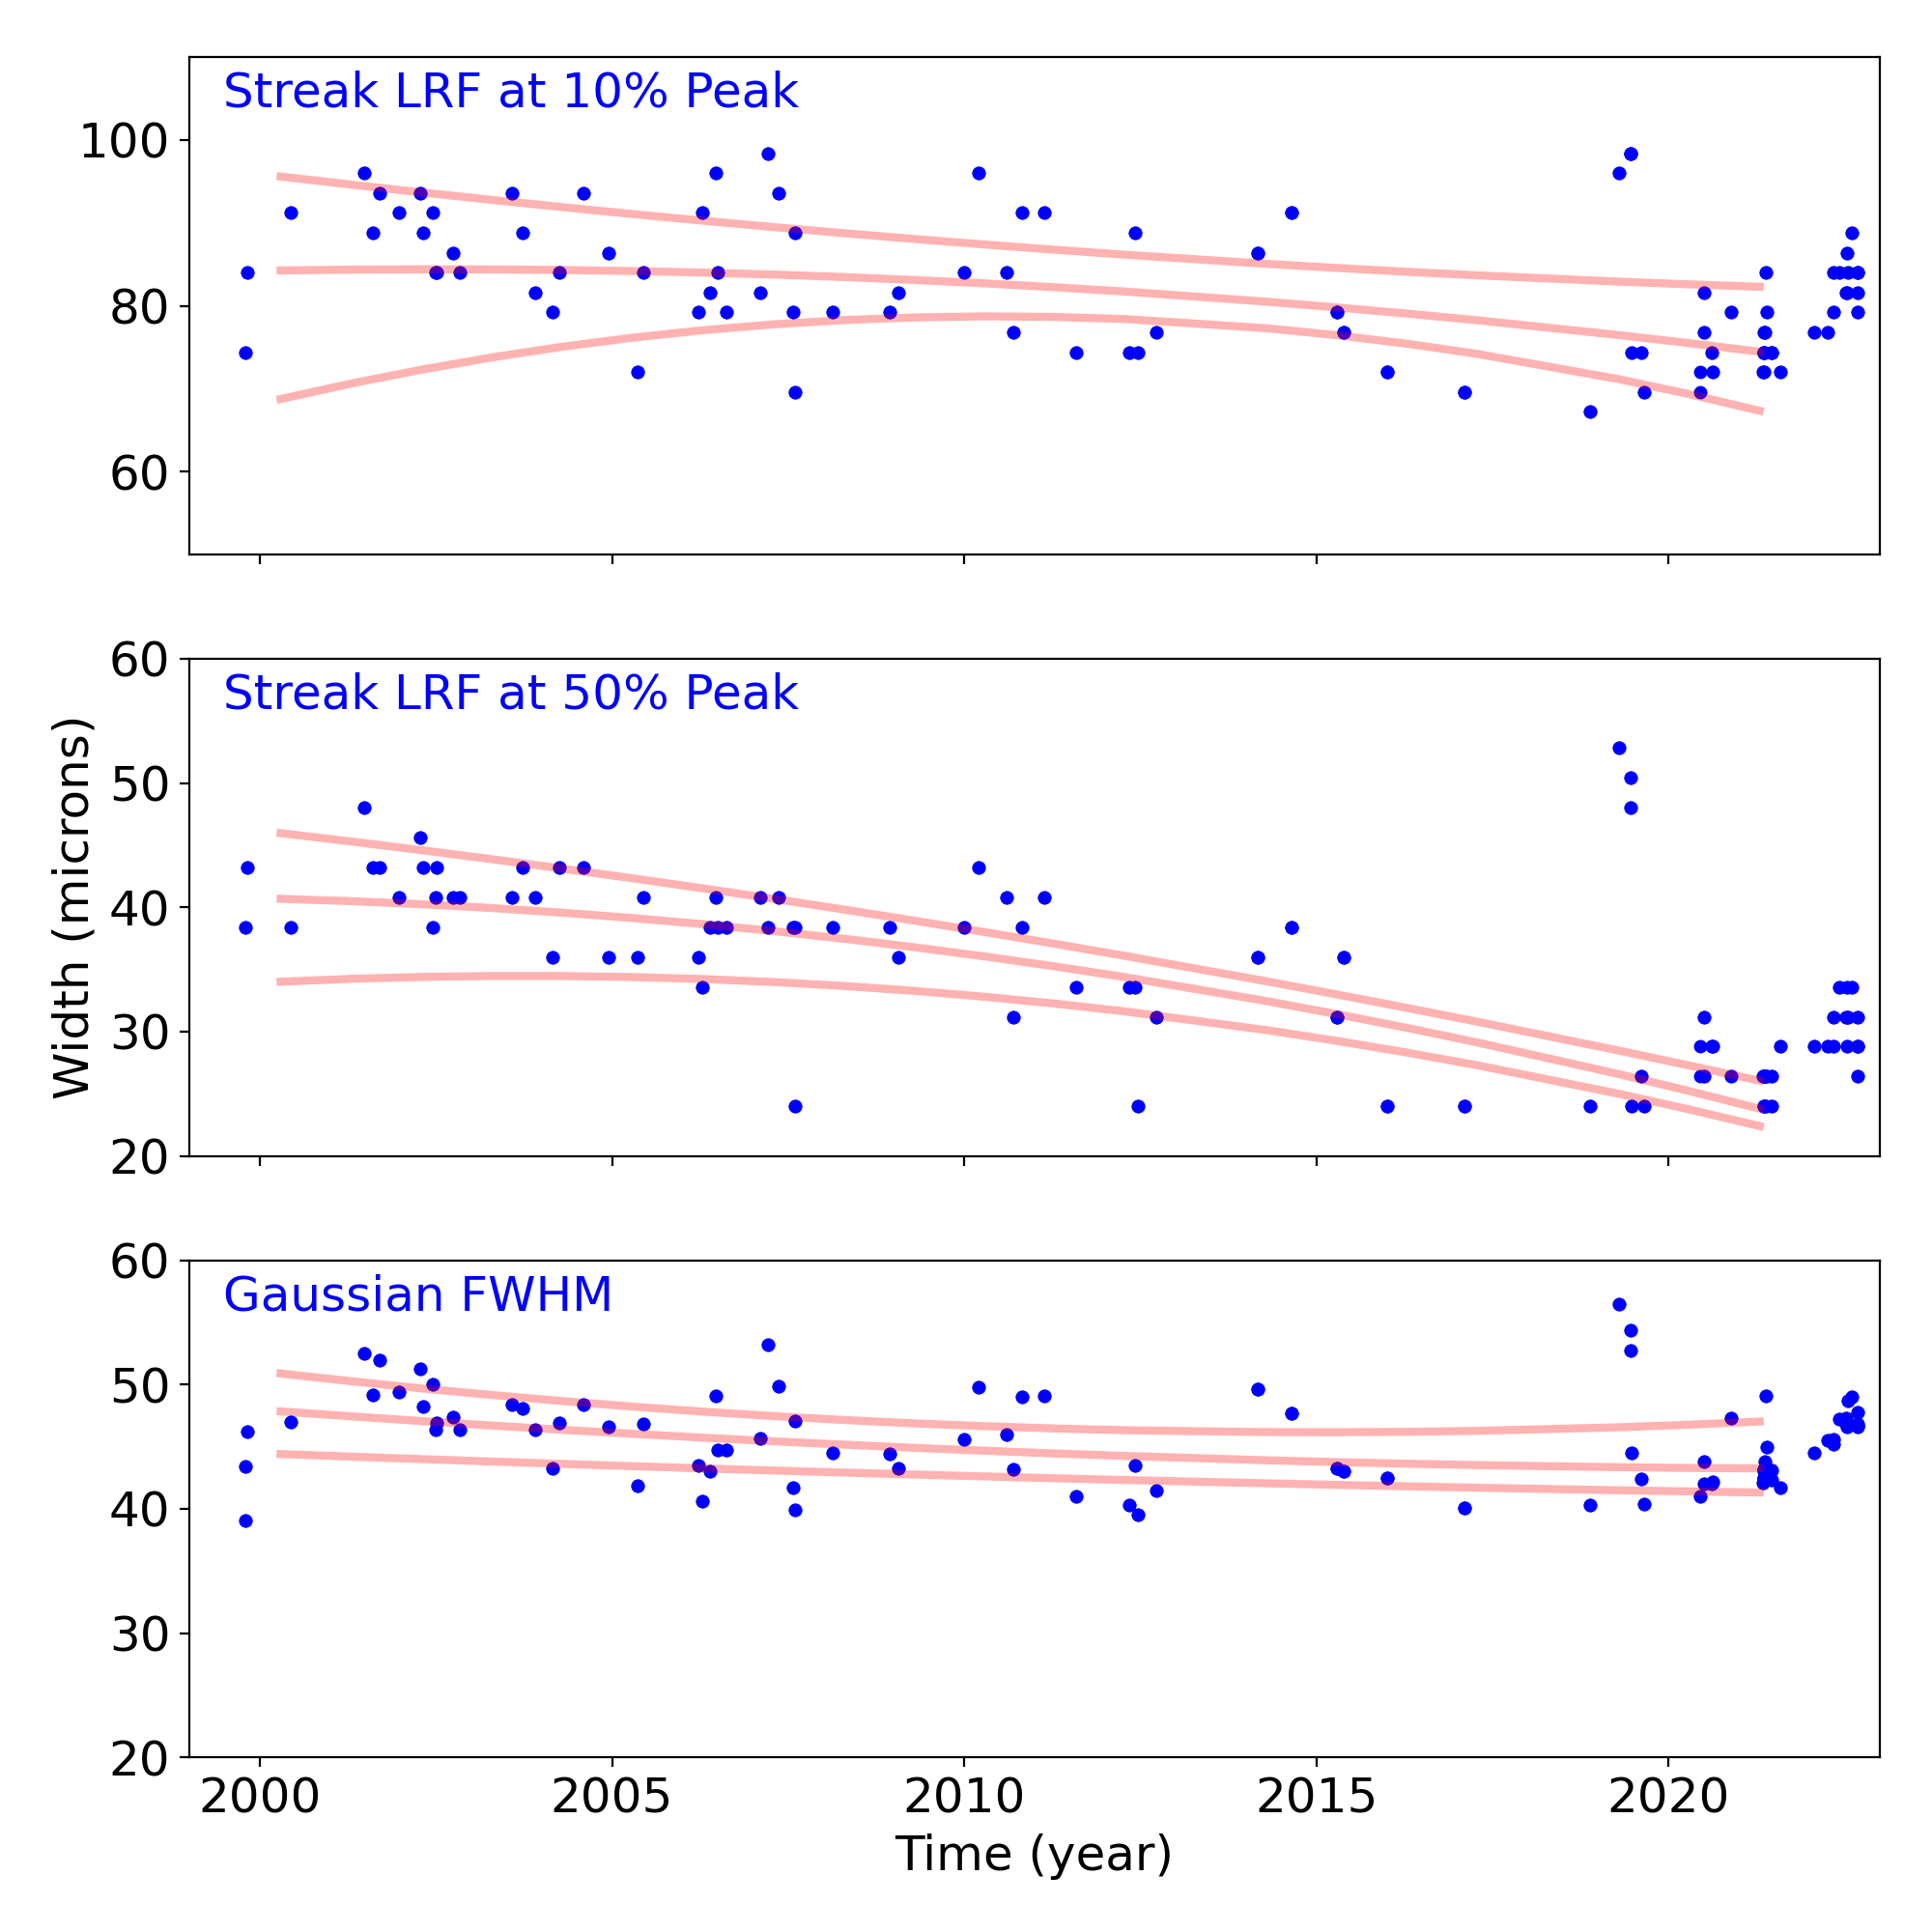
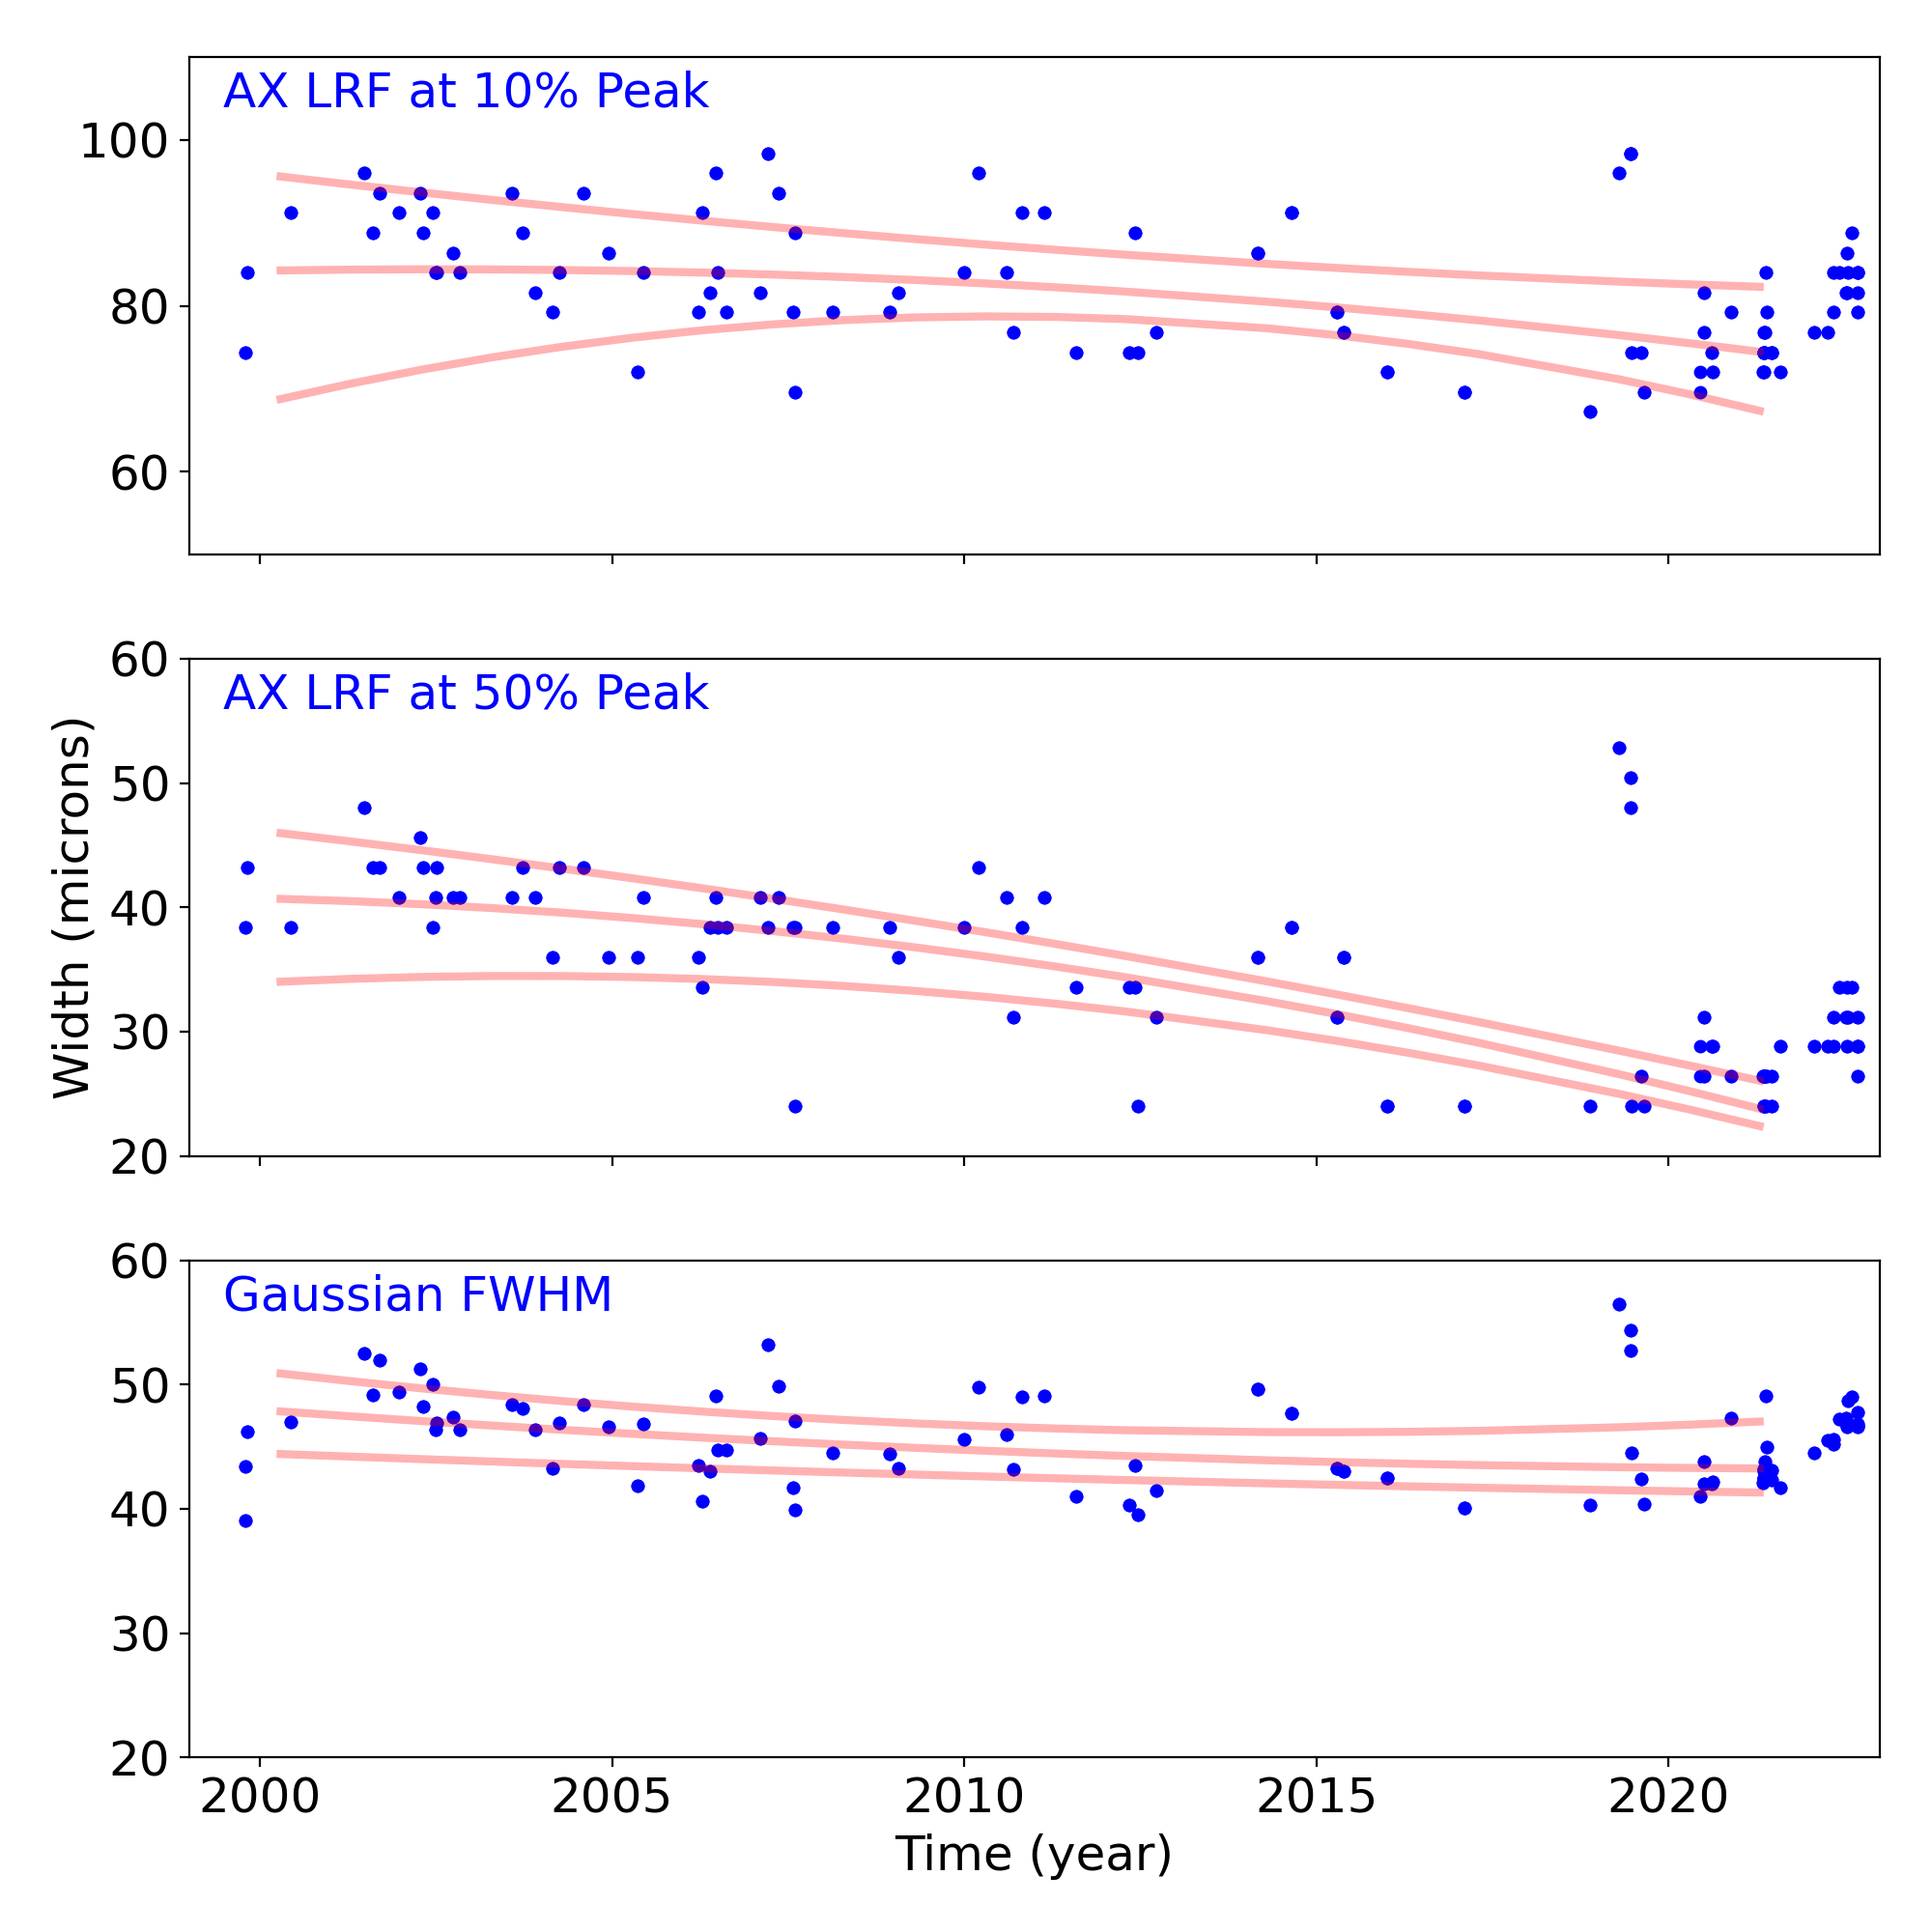
Grating Trends/Focus
We plot the width of the zero order streak of ACIS/HETG observations and the width of the zero order image for HRC/LETG observations of point sources. No significant defocusing trend is seen at this time. See Gratings Trends pages.
PCAD
ACA Trending
| ACIS |
)
|
)
|
)
|
|
|---|---|---|---|---|
)
|
)
|
)
| ||
| HRCI |
)
|
)
|
)
|
)
|
| HRCI |
)
|
)
|
)
|
)
|
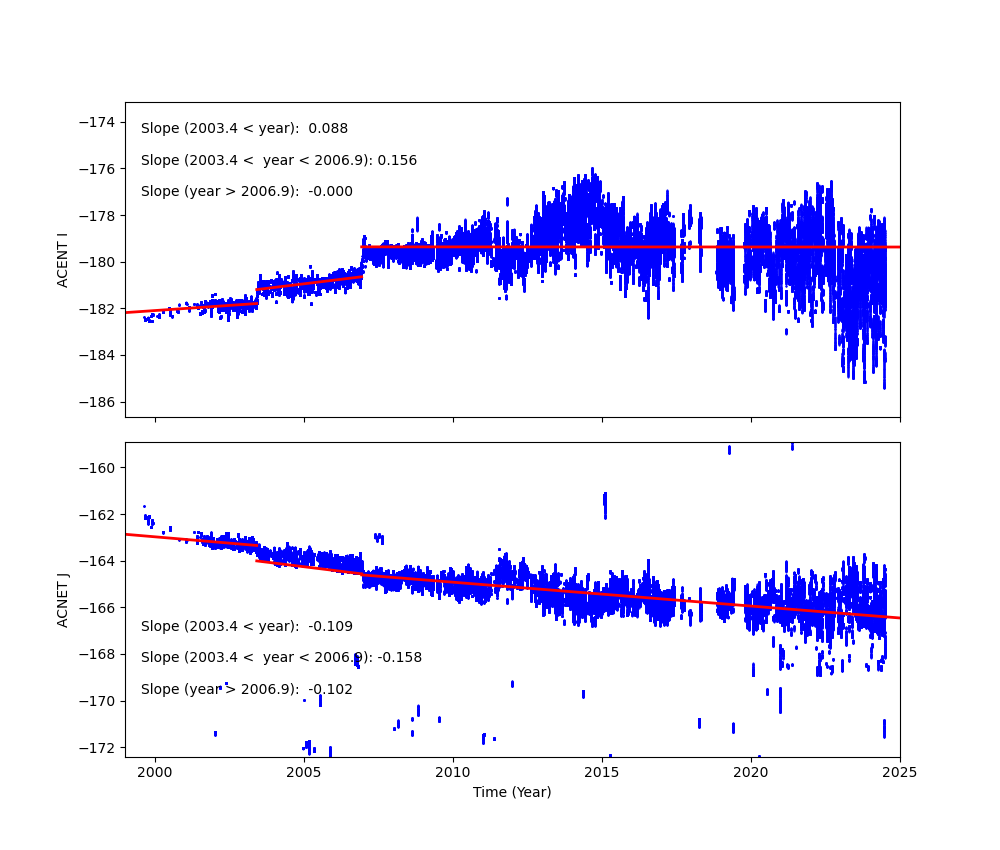
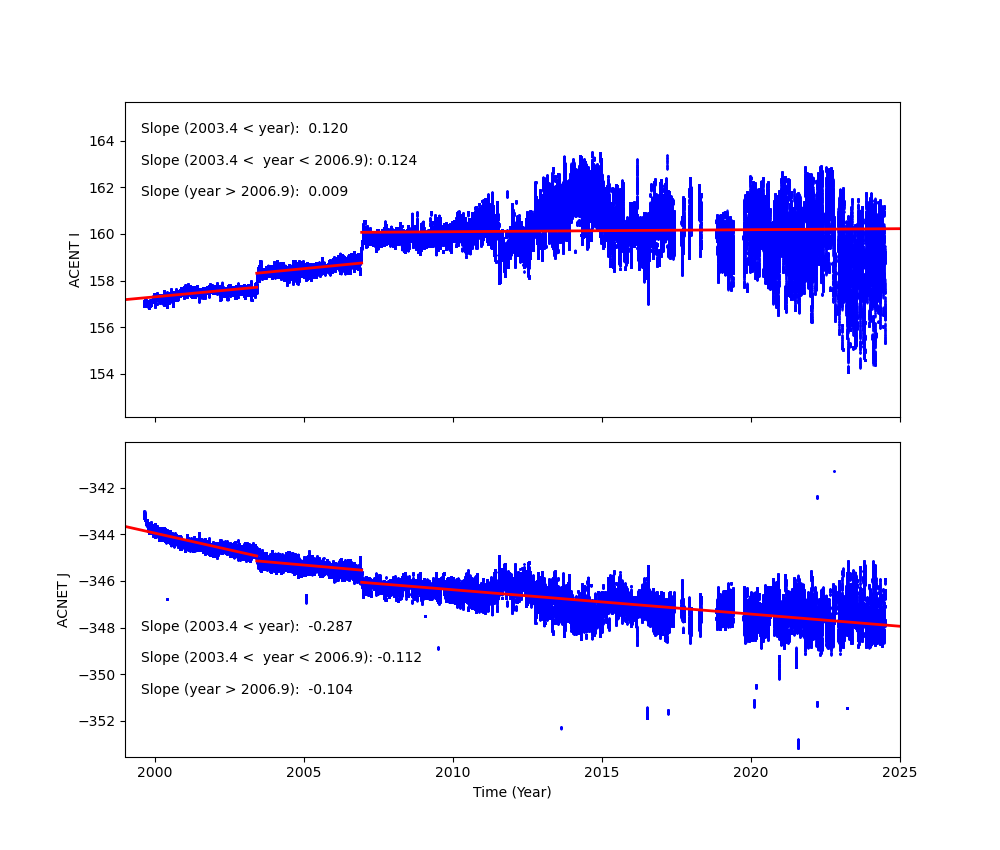
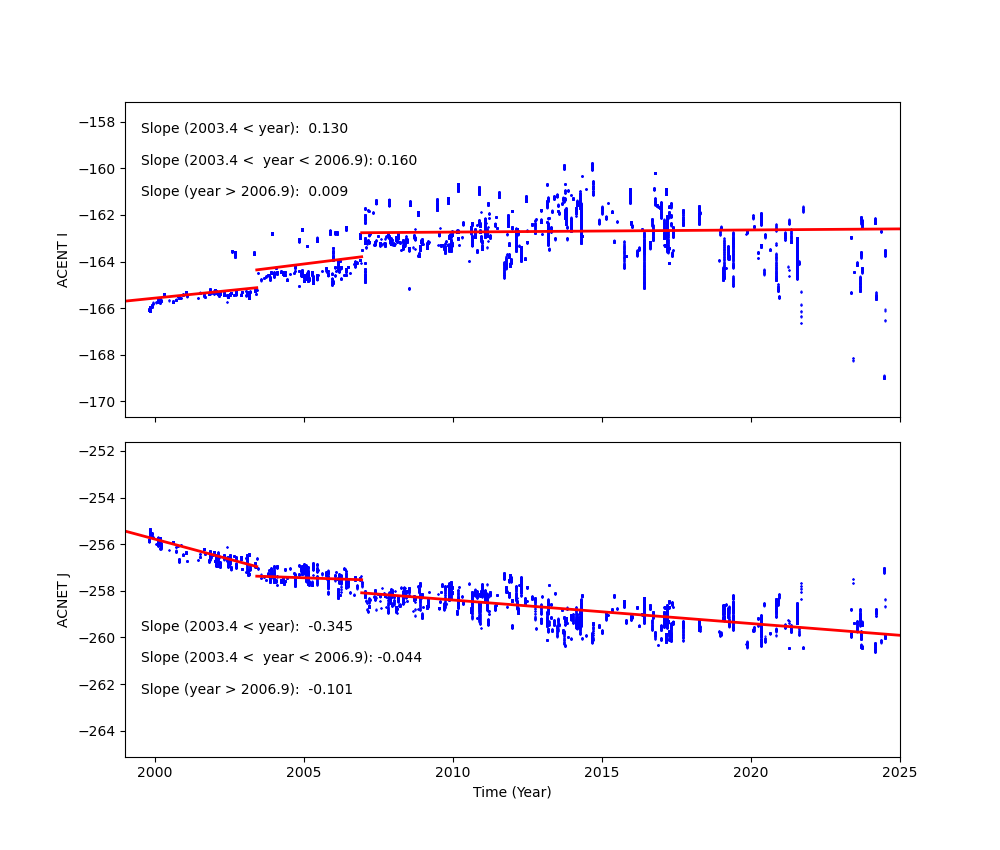
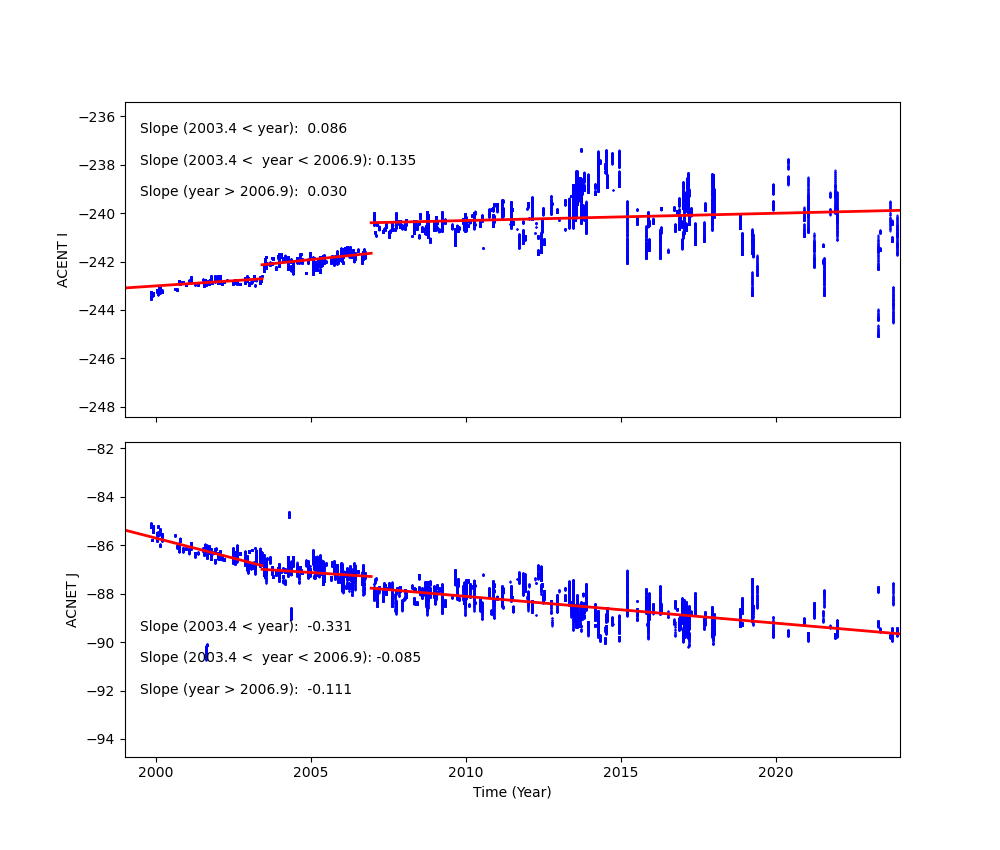
Fid Light Drift
Fid light positions on ACA drift with time. The drift trends of Fid light 2 with ACIS-I and ACIS-S configurations are shown below.
The top panel shows Fid light 2 drift in ACENT I (app. along with -Y axis), and the
bottom panel shows that in ACENT J (app. along with Z axis). The unit is a pixel, and
one pixel is approximately 0.5 arcsec. The slope listed at the top right corner is
the change in a position per year (arcsec/yr). The vertical line on DOM = 1411 (Jun 1, 2003)
indicates a transition date of use of IRU-1 to IRU-2.
See also Tom Aldcroft's updated page:
https://cxc.cfa.harvard.edu/mta/ASPECT/fid_drift
Fid 2 (ACIS-I)
Fid 2 (ACIS-S)
Fid 8 (HRC-I)
Fid 12 (HRC-S)
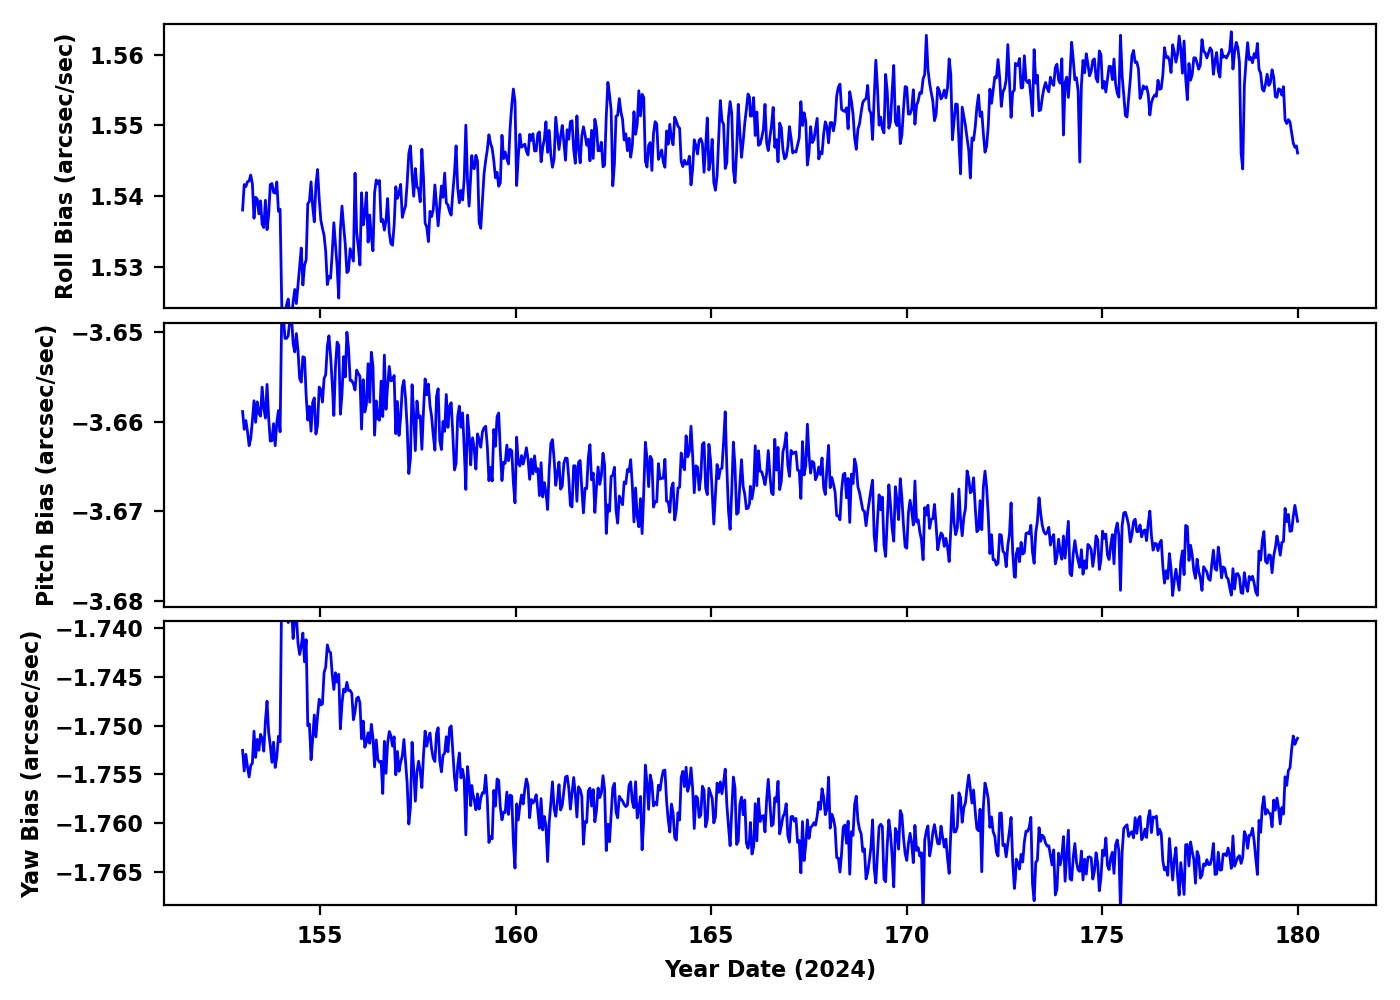
Gyro Bias Drift
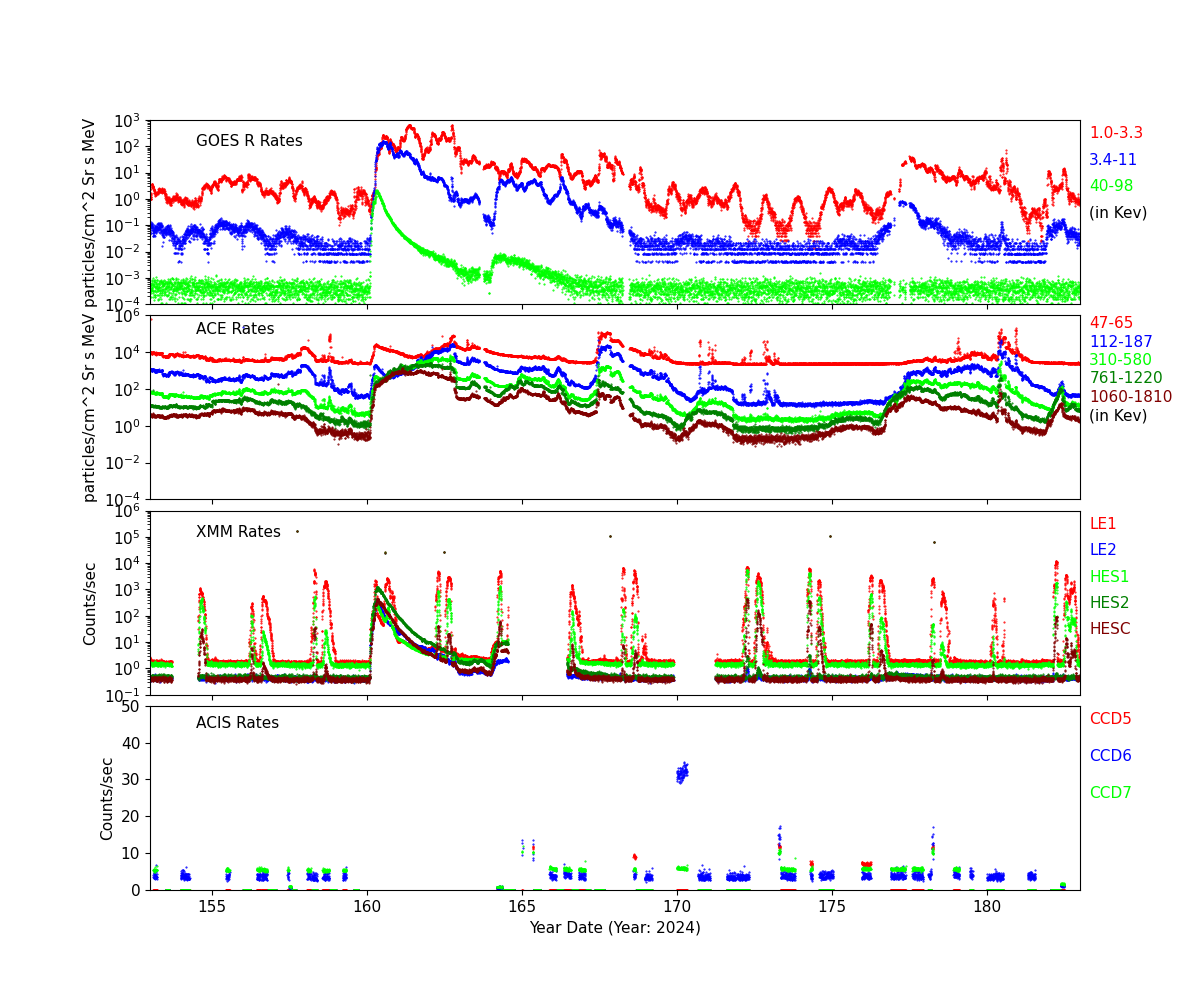
Radiation History
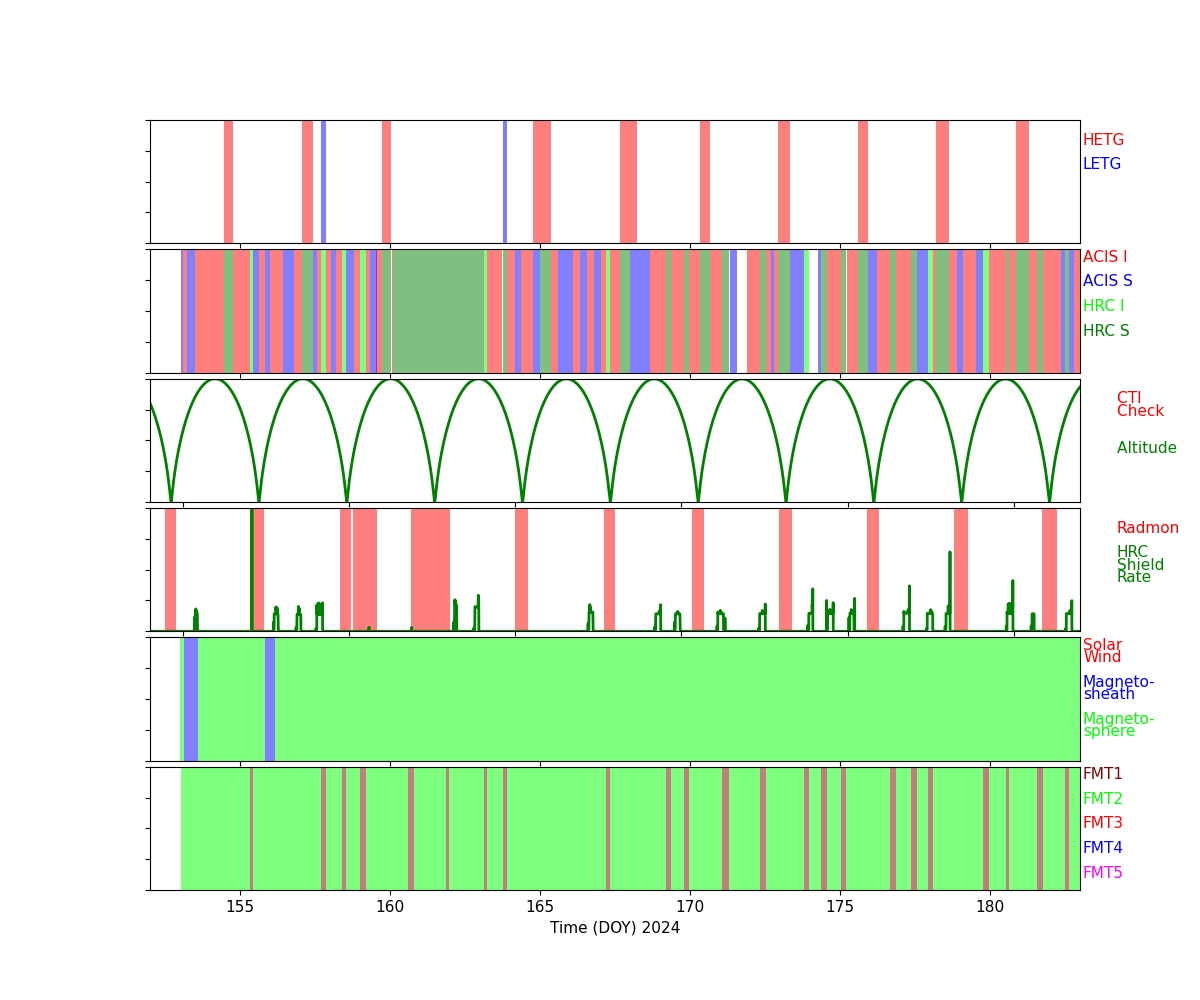
Radiation Count Rates of Jun 2024
Sun Spot History (See:NOAA Page)

Trending
Critical Trends
| ACIS Temperatures - Daily Maximums | |||||||
|---|---|---|---|---|---|---|---|
| MSID | MEAN | RMS | DELTA/YR | DELTA/YR/YR | UNITS | DESCRIPTION | |
| 1pdeaat | 0.001 | 0.002 | (2.99+/-0.04)e2 | 1.24 +/- 1.33 | K | PSMC DEA PS A TEMP | |
| HRMA Computed Averages - Daily Maximums | |||||||
|---|---|---|---|---|---|---|---|
| MSID | MEAN | RMS | DELTA/YR | DELTA/YR/YR | UNITS | DESCRIPTION | |
| obaavg | -0.014 | 0.001 | (2.98+/-0.02)e2 | -1.27 +/- 0.65 | TEMP | OBA/TFTE | |
| EPHIN Temperatures - Daily Maximums | |||||||
|---|---|---|---|---|---|---|---|
| MSID | MEAN | RMS | DELTA/YR | DELTA/YR/YR | UNITS | DESCRIPTION | |
| teio | 0.026 | 0.009 | (3.30+/-0.22)e2 | 2.97 +/- 3.64 | K | EPHIN ELECTRONICS HOUSING TEMP | |
| tephin | 0.008 | 0.003 | (3.39+/-0.08)e2 | 2.15 +/- 2.13 | K | EPHIN SENSOR HOUSING TEMP | |
| S/C Main Temperatures - Daily Maximums | |||||||
|---|---|---|---|---|---|---|---|
| MSID | MEAN | RMS | DELTA/YR | DELTA/YR/YR | UNITS | DESCRIPTION | |
| tcylfmzm | 0.020 | 0.004 | (3.13+/-0.10)e2 | 1.24 +/- 1.91 | K | CNT CYL TEMP:-Z SIDE UNDER LAE-1 | |
| tcylfmzp | 0.020 | 0.004 | (3.16+/-0.09)e2 | 1.12 +/- 1.75 | K | CNT CYL TEMP:-Z SIDE UNDER LAE-2 | |
| S/C Ancillary Temperatures - Daily Maximums | |||||||
|---|---|---|---|---|---|---|---|
| MSID | MEAN | RMS | DELTA/YR | DELTA/YR/YR | UNITS | DESCRIPTION | |
| tfssbkt1 | 0.015 | 0.012 | (3.50+/-0.29)e2 | 3.75 +/- 4.12 | K | FSS BRAC | |
| tfssbkt2 | 0.017 | 0.013 | (3.45+/-0.29)e2 | 3.80 +/- 4.17 | K | FSS BRAC | |
| tsctsf1 | 0.004 | 0.002 | (3.24+/-0.05)e2 | 0.53 +/- 1.31 | K | SC-TS FITTING -1 TEMP | |
| tsctsf6 | 0.003 | 0.002 | (3.24+/-0.05)e2 | 0.36 +/- 1.36 | K | SC-TS FITTING -6 TEMP | |
| MUPS - Daily Maximums | |||||||
|---|---|---|---|---|---|---|---|
| MSID | MEAN | RMS | DELTA/YR | DELTA/YR/YR | UNITS | DESCRIPTION | |
| pm1thv1t | 0.016 | 0.007 | (3.52+/-0.16)e2 | -1.18 +/- 2.51 | K | MUPS 1 THRUSTER VALVE 01 TEMP | |
| pm2thv1t | 0.063 | 0.022 | (3.18+/-0.51)e2 | 0.41 +/- 7.55 | K | MUPS 2 THRUSTER VALVE 01 TEMP | |
| pm1thv2t | 0.015 | 0.007 | (3.54+/-0.16)e2 | -0.79 +/- 2.65 | K | MUPS 1 THRUSTER VALVE 02 TEMP | |
| pm2thv2t | 0.059 | 0.023 | (3.16+/-0.55)e2 | 1.27 +/- 8.00 | K | MUPS 2 THRUSTER VALVE 02 TEMP | |
| pline02t | 0.023 | 0.005 | (3.36+/-0.12)e2 | 0.78 +/- 2.28 | K | PROP LINE TEMP 02 | |
| pline03t | 0.025 | 0.006 | (3.29+/-0.14)e2 | 0.57 +/- 2.15 | K | PROP LINE TEMP 03 | |
| pline04t | 0.023 | 0.005 | (3.17+/-0.11)e2 | 2.82 +/- 2.29 | K | PROP LINE TEMP 04 | |
Quarterly Trends
- HRMA Struts
| Previous Quarter | |||||||
| MSID | MEAN | RMS | DELTA/YR | DELTA/YR/YR | UNITS | DESCRIPTION | |
| 4rt584t | 0.005 | 7.523e-04 | (3.02+/-0.02)e2 | 1.21 +/- 0.40 | K | RT 584 - STRUT TEMP | |
|---|---|---|---|---|---|---|---|
| 4rt585t | 0.005 | 7.450e-04 | (3.03+/-0.02)e2 | 1.26 +/- 0.39 | K | RT 585 - STRUT TEMP | |
| 4rt586t | 0.004 | 6.409e-04 | (2.98+/-0.02)e2 | 1.13 +/- 0.33 | K | RT 586 - STRUT TEMP | |
| 4rt587t | 0.003 | 4.826e-04 | (2.92+/-0.01)e2 | 0.85 +/- 0.24 | K | RT 587 - STRUT TEMP | |
| 4rt597t | 0.010 | 0.001 | (3.11+/-0.03)e2 | 1.76 +/- 0.82 | K | RT 597 - TFTE TEMP | |
| 4rt598t | 0.010 | 0.001 | (3.10+/-0.03)e2 | 1.46 +/- 0.82 | K | RT 598 - TFTE TEMP | |
- OB Forward Bulkhead
| Previous Quarter | |||||||
| MSID | MEAN | RMS | DELTA/YR | DELTA/YR/YR | UNITS | DESCRIPTION | |
| 4rt705t | 0.007 | 8.594e-04 | (2.93+/-0.02)e2 | 0.79 +/- 0.50 | K | RT 705 - OB BUL | |
|---|---|---|---|---|---|---|---|
| 4rt706t | 0.007 | 8.687e-04 | (2.92+/-0.02)e2 | 0.84 +/- 0.51 | K | RT 706 - OB BUL | |
| 4rt707t | 0.007 | 8.628e-04 | (2.94+/-0.02)e2 | 0.67 +/- 0.51 | K | RT 707 - OB BULKHEAD TEMP | |
| 4rt708t | 0.008 | 9.395e-04 | (3.00+/-0.02)e2 | 0.78 +/- 0.55 | K | RT 708 - OB BULKHEAD TEMP | |
| 4rt709t | 0.008 | 0.001 | (3.01+/-0.02)e2 | 0.71 +/- 0.59 | K | RT 709 - OB BULKHEAD TEMP | |
| 4rt710t | 0.009 | 0.001 | (3.03+/-0.03)e2 | 0.81 +/- 0.63 | K | RT 710 - OB BULKHEAD TEMP | |
- HRMA Thermal
- HRMA Thermal
| Previous Quarter | |||||||
| MSID | MEAN | RMS | DELTA/YR | DELTA/YR/YR | UNITS | DESCRIPTION | |
| 4rt568t | 0.006 | 9.319e-04 | (3.00+/-0.02)e2 | 1.26 +/- 0.53 | K | RT 568 - HRMA TEMP | |
|---|---|---|---|---|---|---|---|
| 4rt569t | 0.002 | 2.987e-04 | (2.97+/-0.01)e2 | 0.64 +/- 0.12 | K | RT 569 - HRMA TEMP | |
| 4rt570t | 0.001 | 1.639e-04 | (2.96+/-0.00)e2 | 0.31 +/- 0.06 | K | RT 570 - HRMA TEMP | |
| 4rt575t | 0.008 | 0.001 | (3.06+/-0.03)e2 | 1.55 +/- 0.67 | K | RT 575 - OB CONE TEMP | |
| 4rt576t | 0.007 | 9.279e-04 | (2.96+/-0.02)e2 | 1.40 +/- 0.53 | K | RT 576 - OB CONE TEMP | |
| 4rt578t | 0.009 | 0.002 | (3.04+/-0.04)e2 | 1.66 +/- 0.87 | K | RT 578 - OB CONE TEMP | |
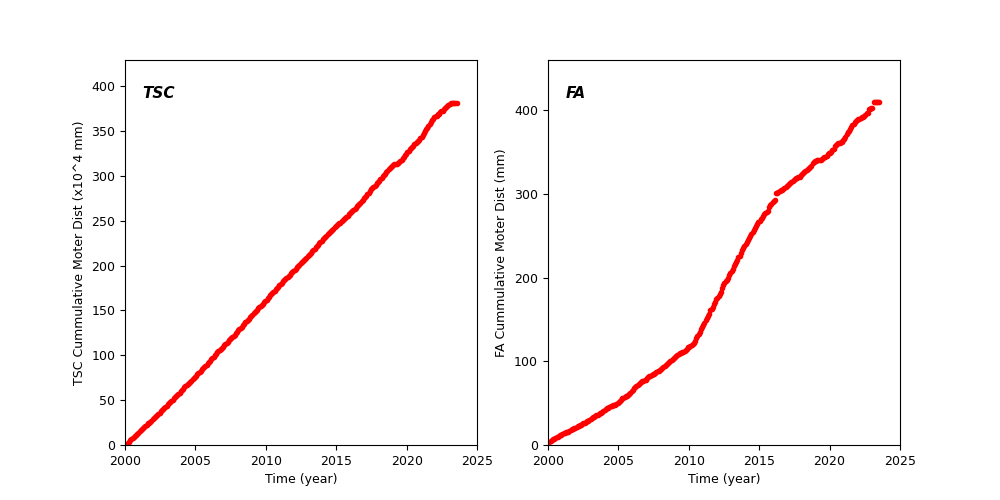
Spacecraft Motions
TSC and FA Cummulative Moter Distance
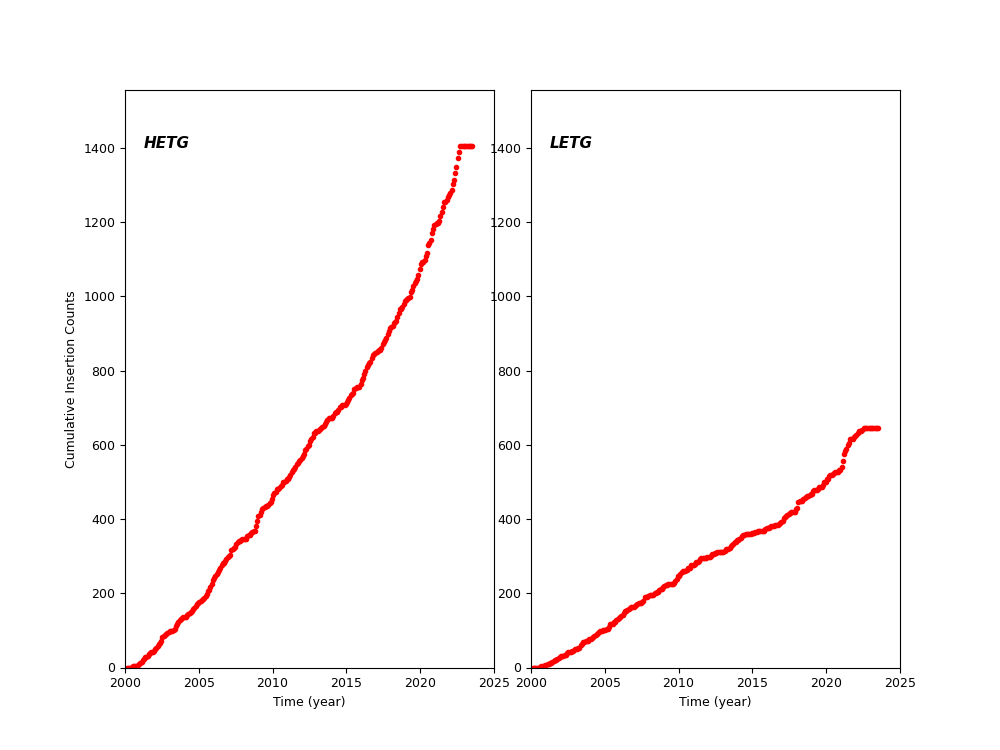
HETG and LETG Cummulative Insertion Counts
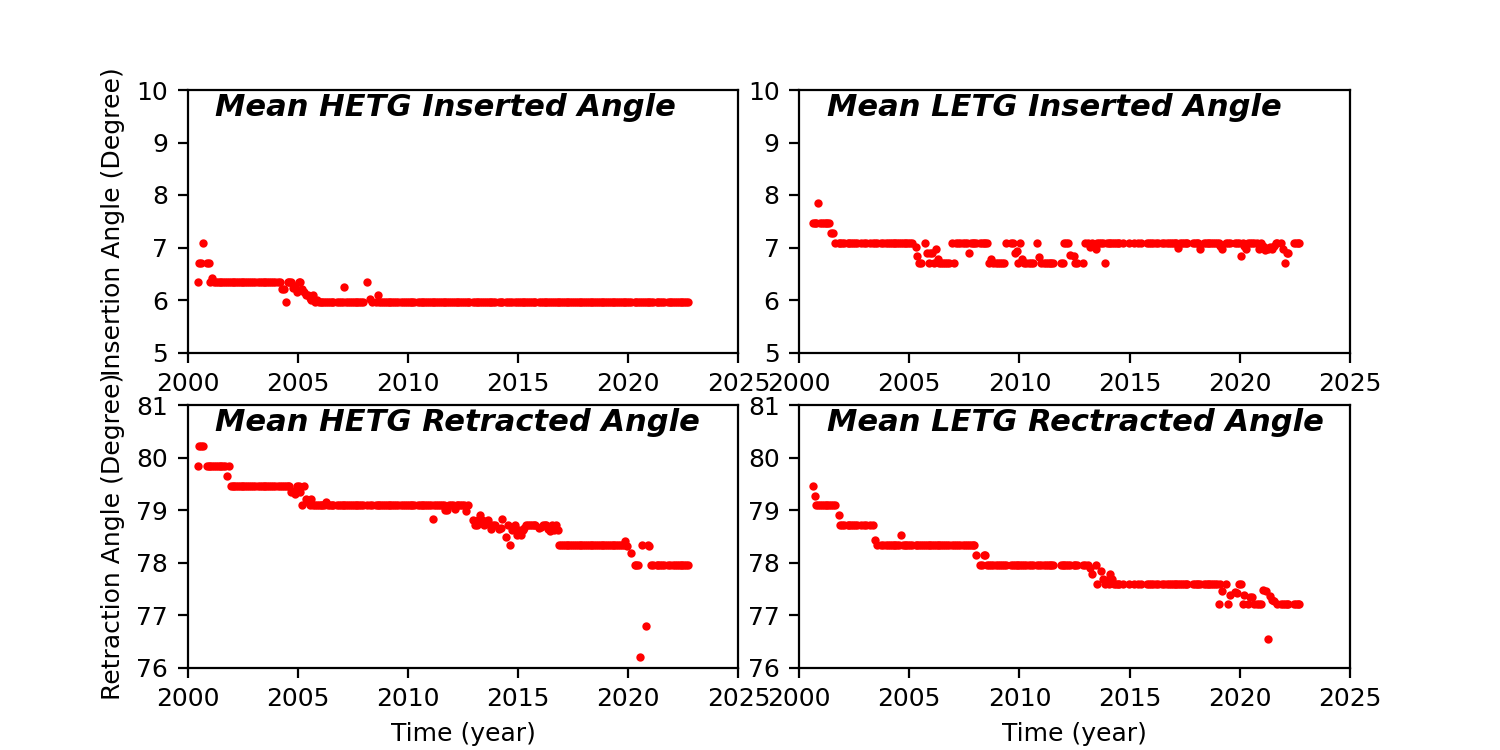
HETG/LETG Insertion/Retraction Angle
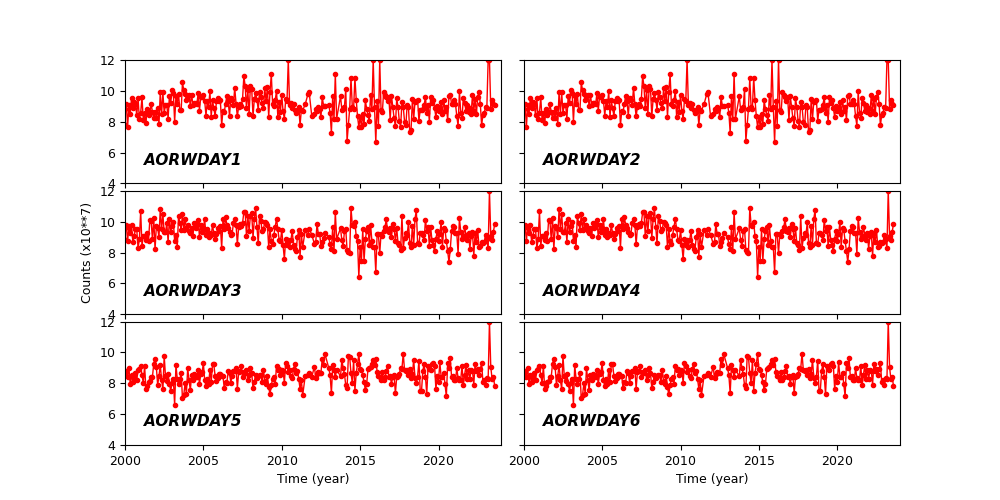
Reaction Wheel Rotations