ACIS
ACIS DOSE Registered-Photon-Map
The steps we took to compute the dose map are;
- Level 1 Event files for a specified month are obtained from archive.
- Image data including I2, I3, S2, S3 CCDs are extracted from all event files.
- All the extracted image data were merged to create a month long exposure map for the month.
- The exposure map is opened with ds9, and check a distribution of count rates against energy. From this, estimate the upper threshold value. Any events beyond this upper threshold are assumed erroneous events such as bad pixels.
- Using this upper threshold, the data is filtered, and create a cleaned exposure map for the month.
- The exposure map from each month from the Sep 1999 is added up to create a cumulative exposure map for each month.
- Using fimgstatistic, we compute count rate statistics for each CCDs.
- For observations with high data drop rates (e.g., Crab nebula, Cas A), we corrected the observations by adding events.
Please check more detail plots at Telemetered Photon Dose Trend page.
)
)
)
Statistics:
# IMAGE     NPIX     MEAN        RMS        MIN     MAX
ACIS_feb25 6004901       3.027         3.593           0.0      354


I2 node 0  262654	2.968666	1.933516	0.0	 53.0
I2 node 1  262654	3.215008	2.087191	0.0	 89.0
I2 node 2  262654	3.330621	2.131679	0.0	101.0
I2 node 3  262654	3.520602	2.434265	0.0	219.0

I3 node 0  262654	5.006112	3.526687	0.0	 86.0
I3 node 1  262654	3.961515	2.443668	0.0	136.0
I3 node 2  262654	3.594430	2.161837	0.0	 72.0
I3 node 3  262654	3.416620	2.129651	0.0	135.0

S2 node 0  262654	3.658559	2.144689	0.0	 88.0
S2 node 1  262654	3.817593	2.414797	0.0	212.0
S2 node 2  262654	3.785340	2.535995	0.0	354.0
S2 node 3  262654	3.685790	2.402827	0.0	353.0

S3 node 0  262654	4.907797	2.418310	0.0	 64.0
S3 node 1  262654	5.865002	2.777949	0.0	 53.0
S3 node 2  262654	5.560570	2.522744	0.0	 31.0
S3 node 3  262654	4.963652	2.375641	0.0	 25.0
)
)
)
Statistics:
 IMAGE     NPIX      MEAN        RMS           MIN      MAX
ACIS_total   6004901       2721.244         3443.350           0.0   168593


I2 node 0  262654	2365.142964	480.211412	507.0	15633.0
I2 node 1  262654	2493.362901	704.784593	516.0	166587.0
I2 node 2  262654	2520.731271	535.019103	543.0	17257.0
I2 node 3  262654	2524.989361	655.929455	502.0	36181.0

I3 node 0  262654	2721.184442	673.182340	503.0	15169.0
I3 node 1  262654	2803.319177	1755.293863	527.0	56054.0
I3 node 2  262654	2511.921349	471.394733	493.0	15347.0
I3 node 3  262654	2488.887862	509.658731	469.0	35967.0

S2 node 0  262654	3174.507081	513.230747	1714.0	22616.0
S2 node 1  262654	3371.971790	769.425825	1890.0	20004.0
S2 node 2  262654	3738.967406	773.669311	2304.0	33500.0
S2 node 3  262654	3695.946516	628.368322	2026.0	85454.0

S3 node 0  262654	5621.089825	3025.395379	2468.0	55159.0
S3 node 1  262654	6841.561706	2400.390316	0.0	83602.0
S3 node 2  262654	5574.973821	1372.730992	2612.0	27631.0
S3 node 3  262654	4384.456906	778.207753	2645.0	26724.0
)
|
)
|
)
|
)
|
| Nov 2024 | Aug 2024 | May 2024 | Feb 2024 |
|---|
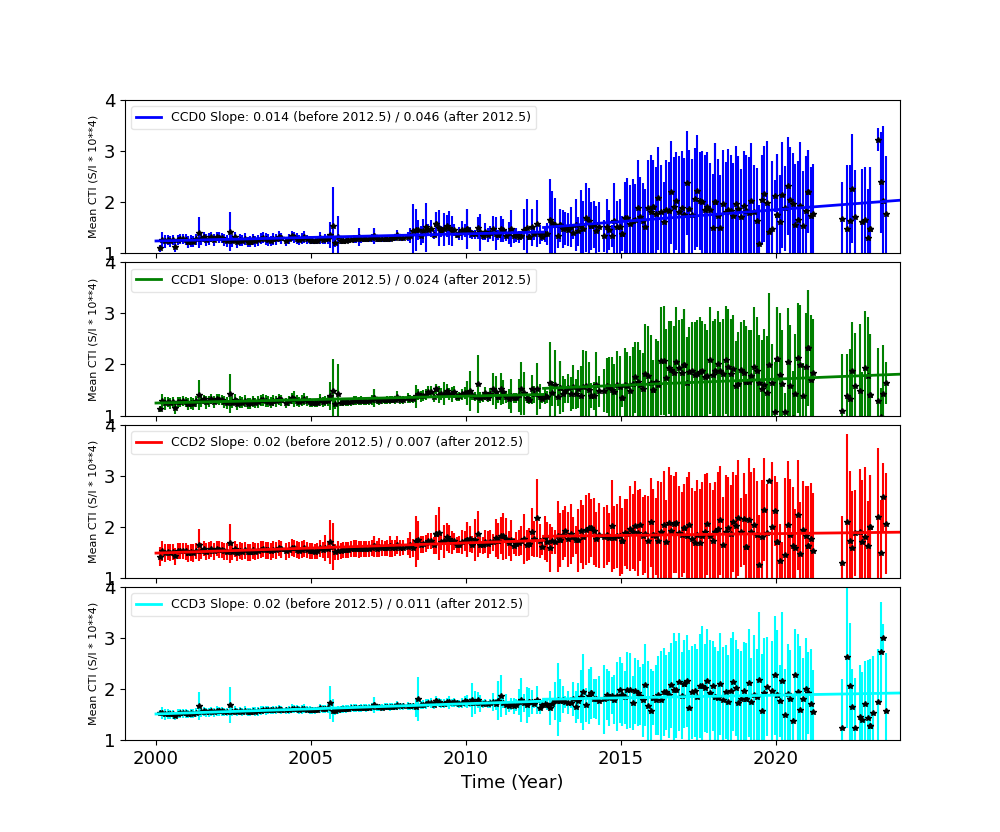
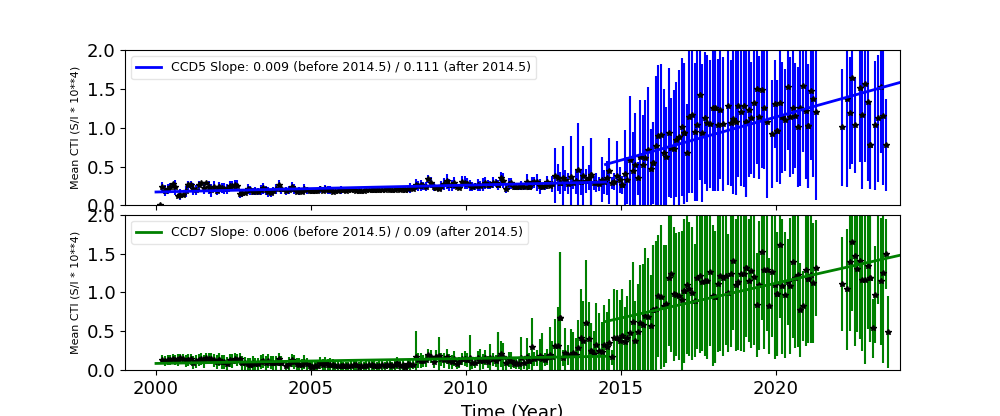
The Mean Detrended CTI
We report CTIs with a refined data definition. CTIs were computed for the temperature dependency corrected data. Please see CTI page for detailed explanation. CTI's are computed for Mn K alpha, and defined as slope/intercept x10^4 of row # vs ADU. Data file: here
Imaging CCDs
Spectral CCDs
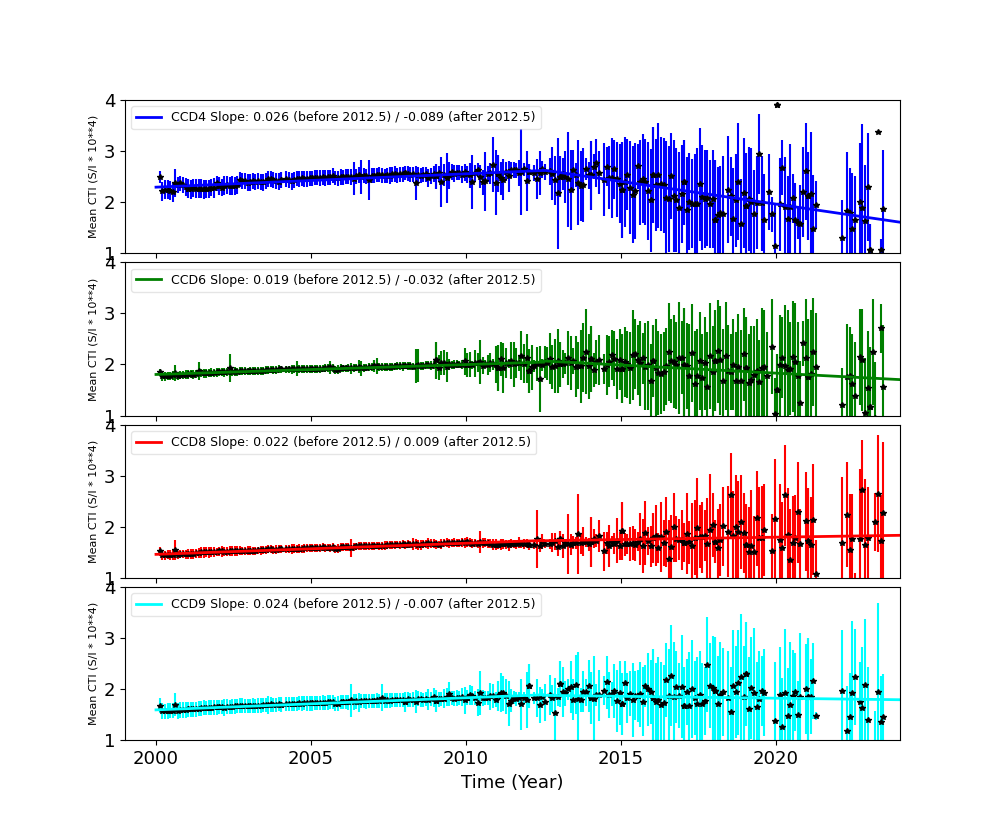
Backside CCDs
Focal Plane Temperature
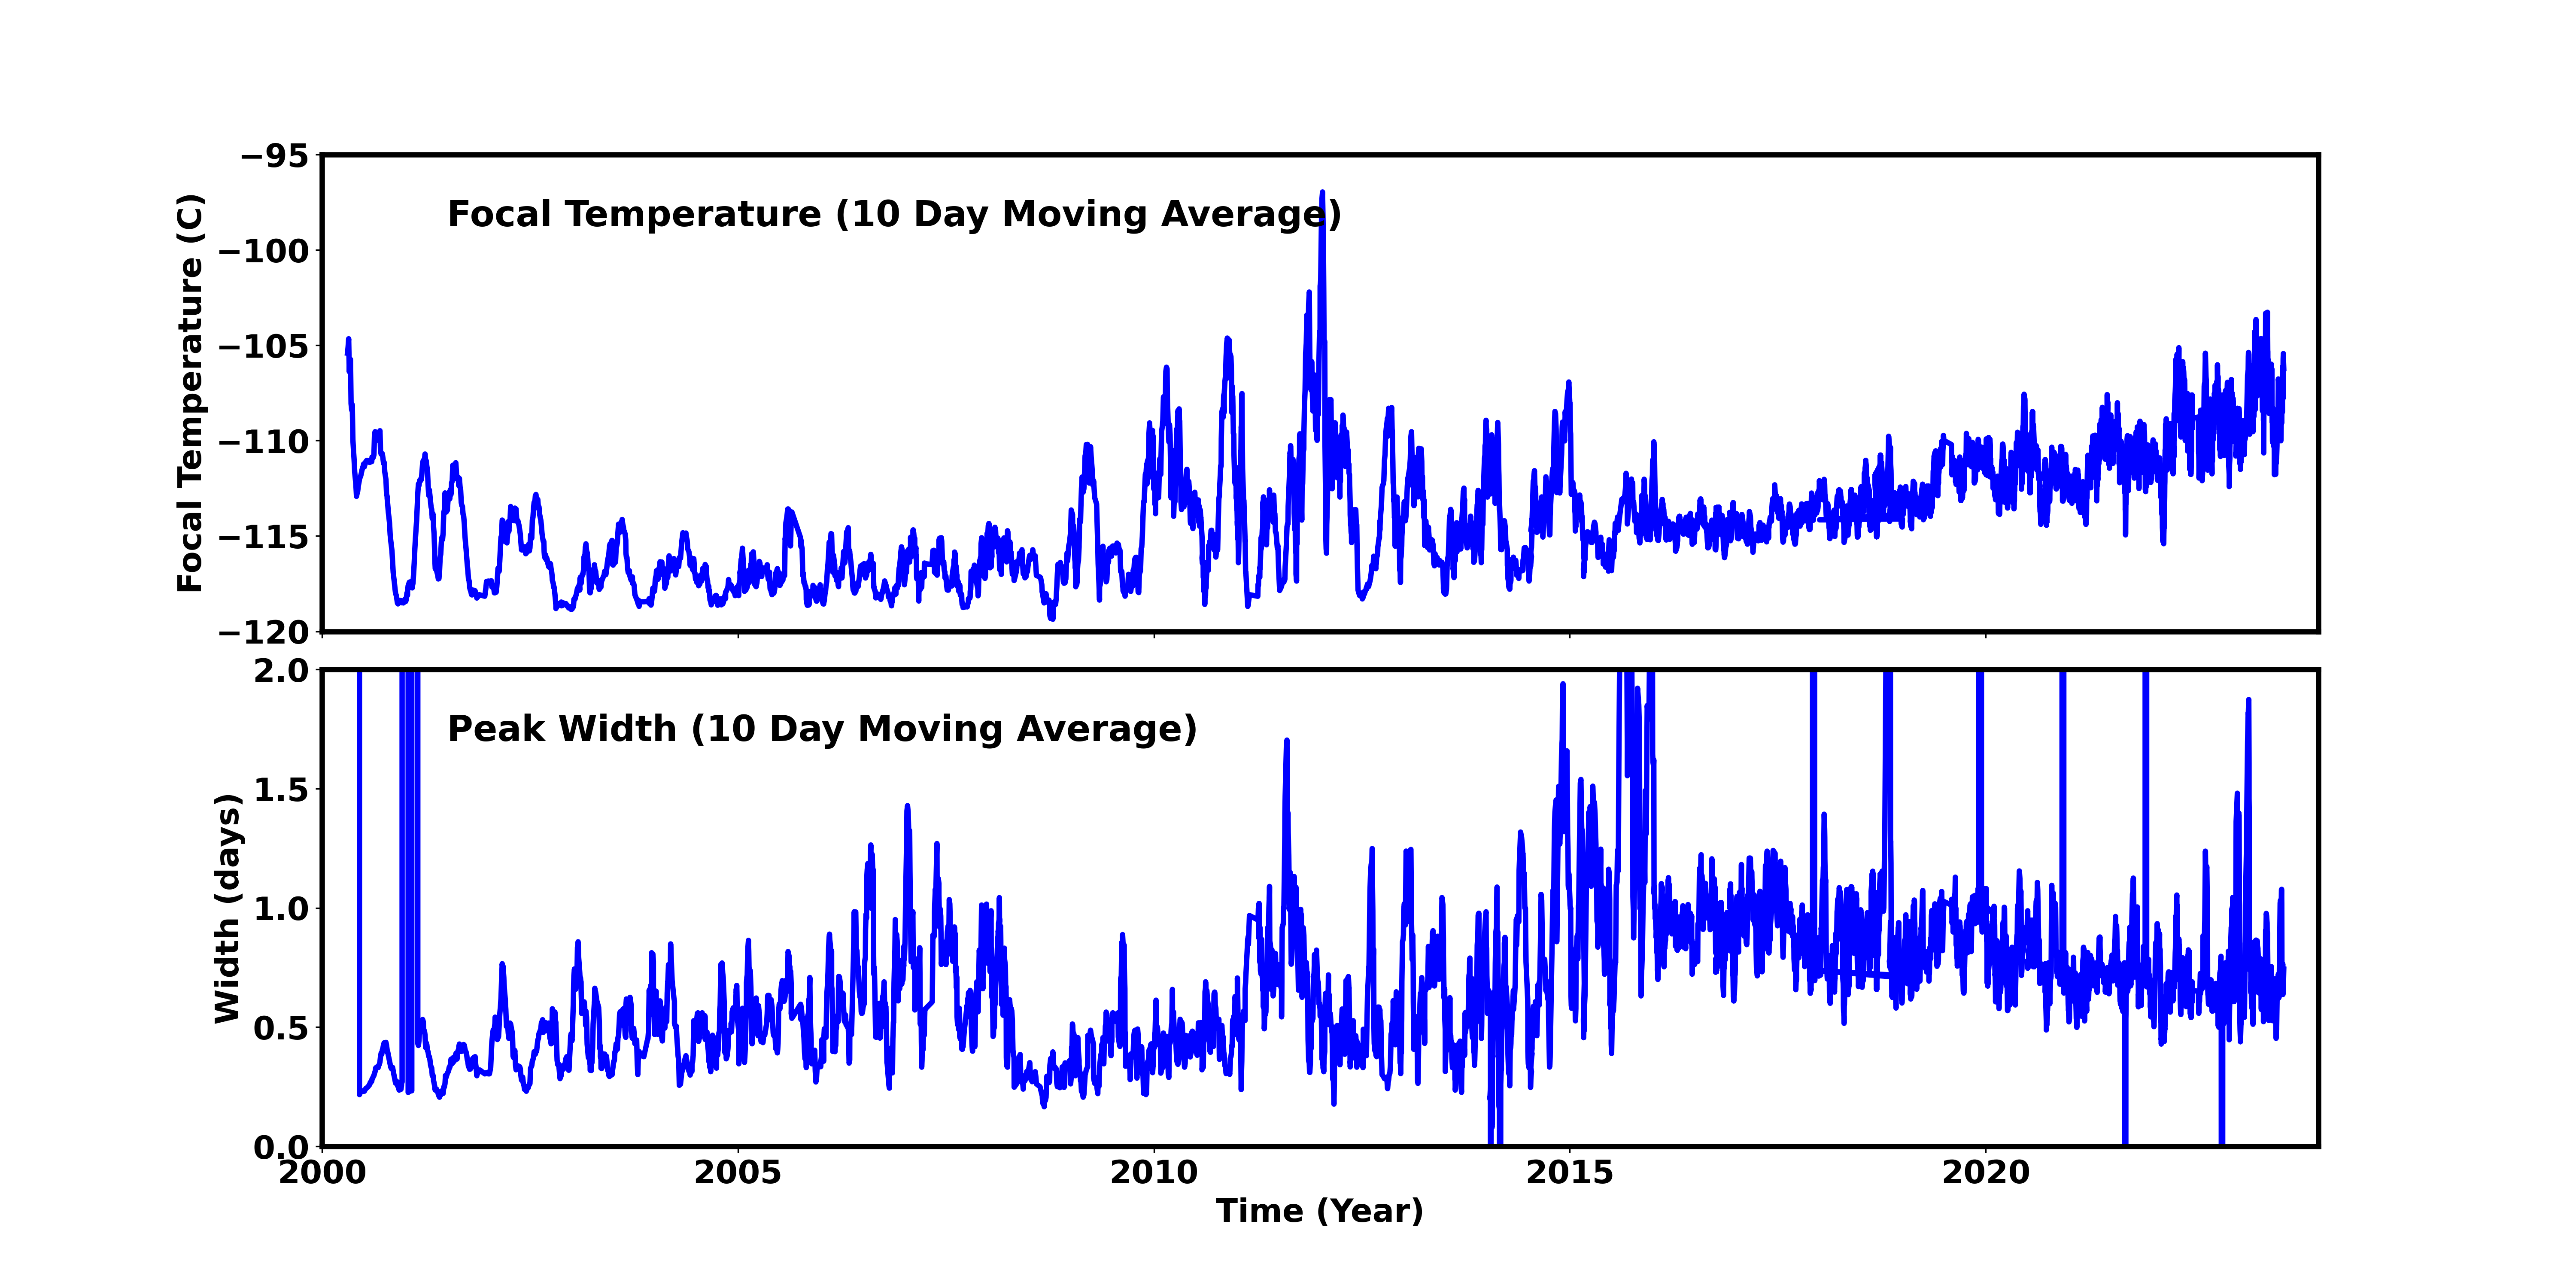
Feb 2025 Focal Temperature
| The Mean (max) FPT: | |
|---|---|
| -107.53 | +/- 7.69 C |
| Mean Width: | |
| 0.8 | +/- 0.58 days |
Averaged Focal Plane Temperature
We are using 10 period moving averages to show trends of peak temperatures and peak widths. Note, the gaps in the width plot are due to missing/corrupted data.
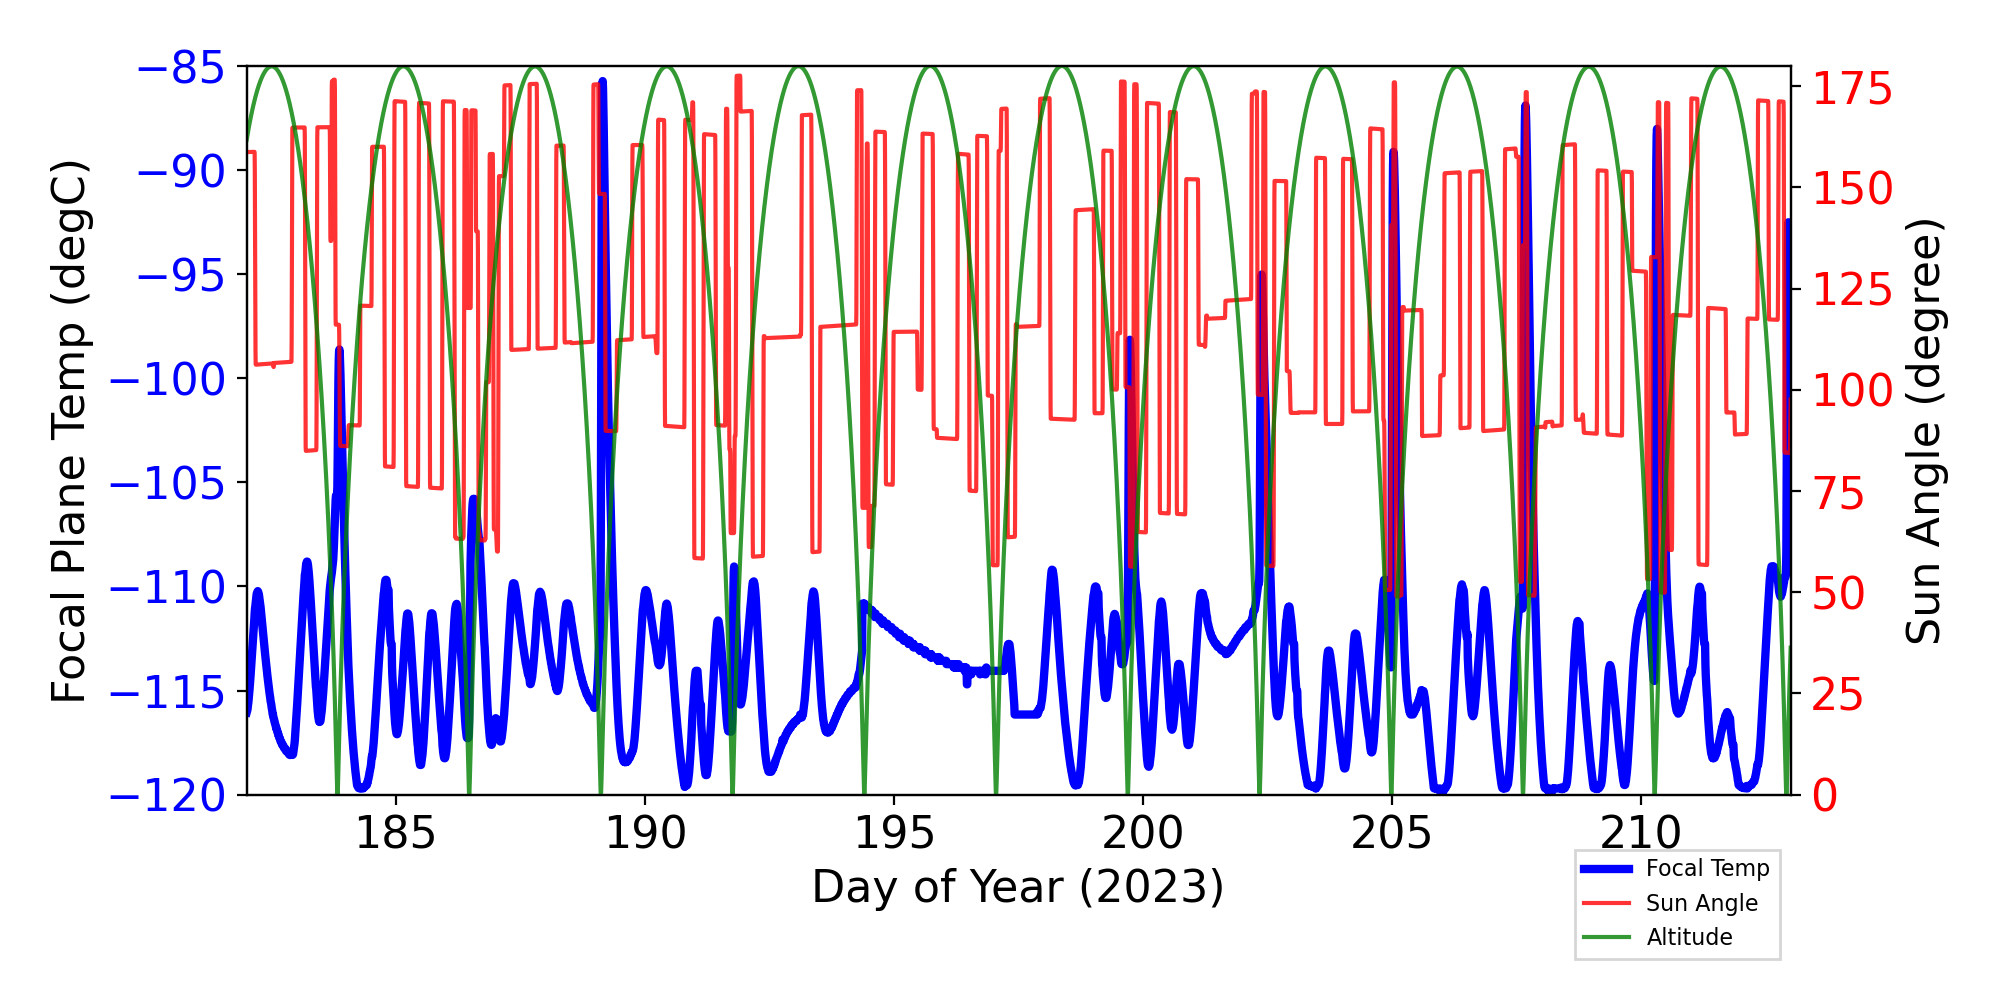
Focal Plane Temperature, Sun Angle and Altitude
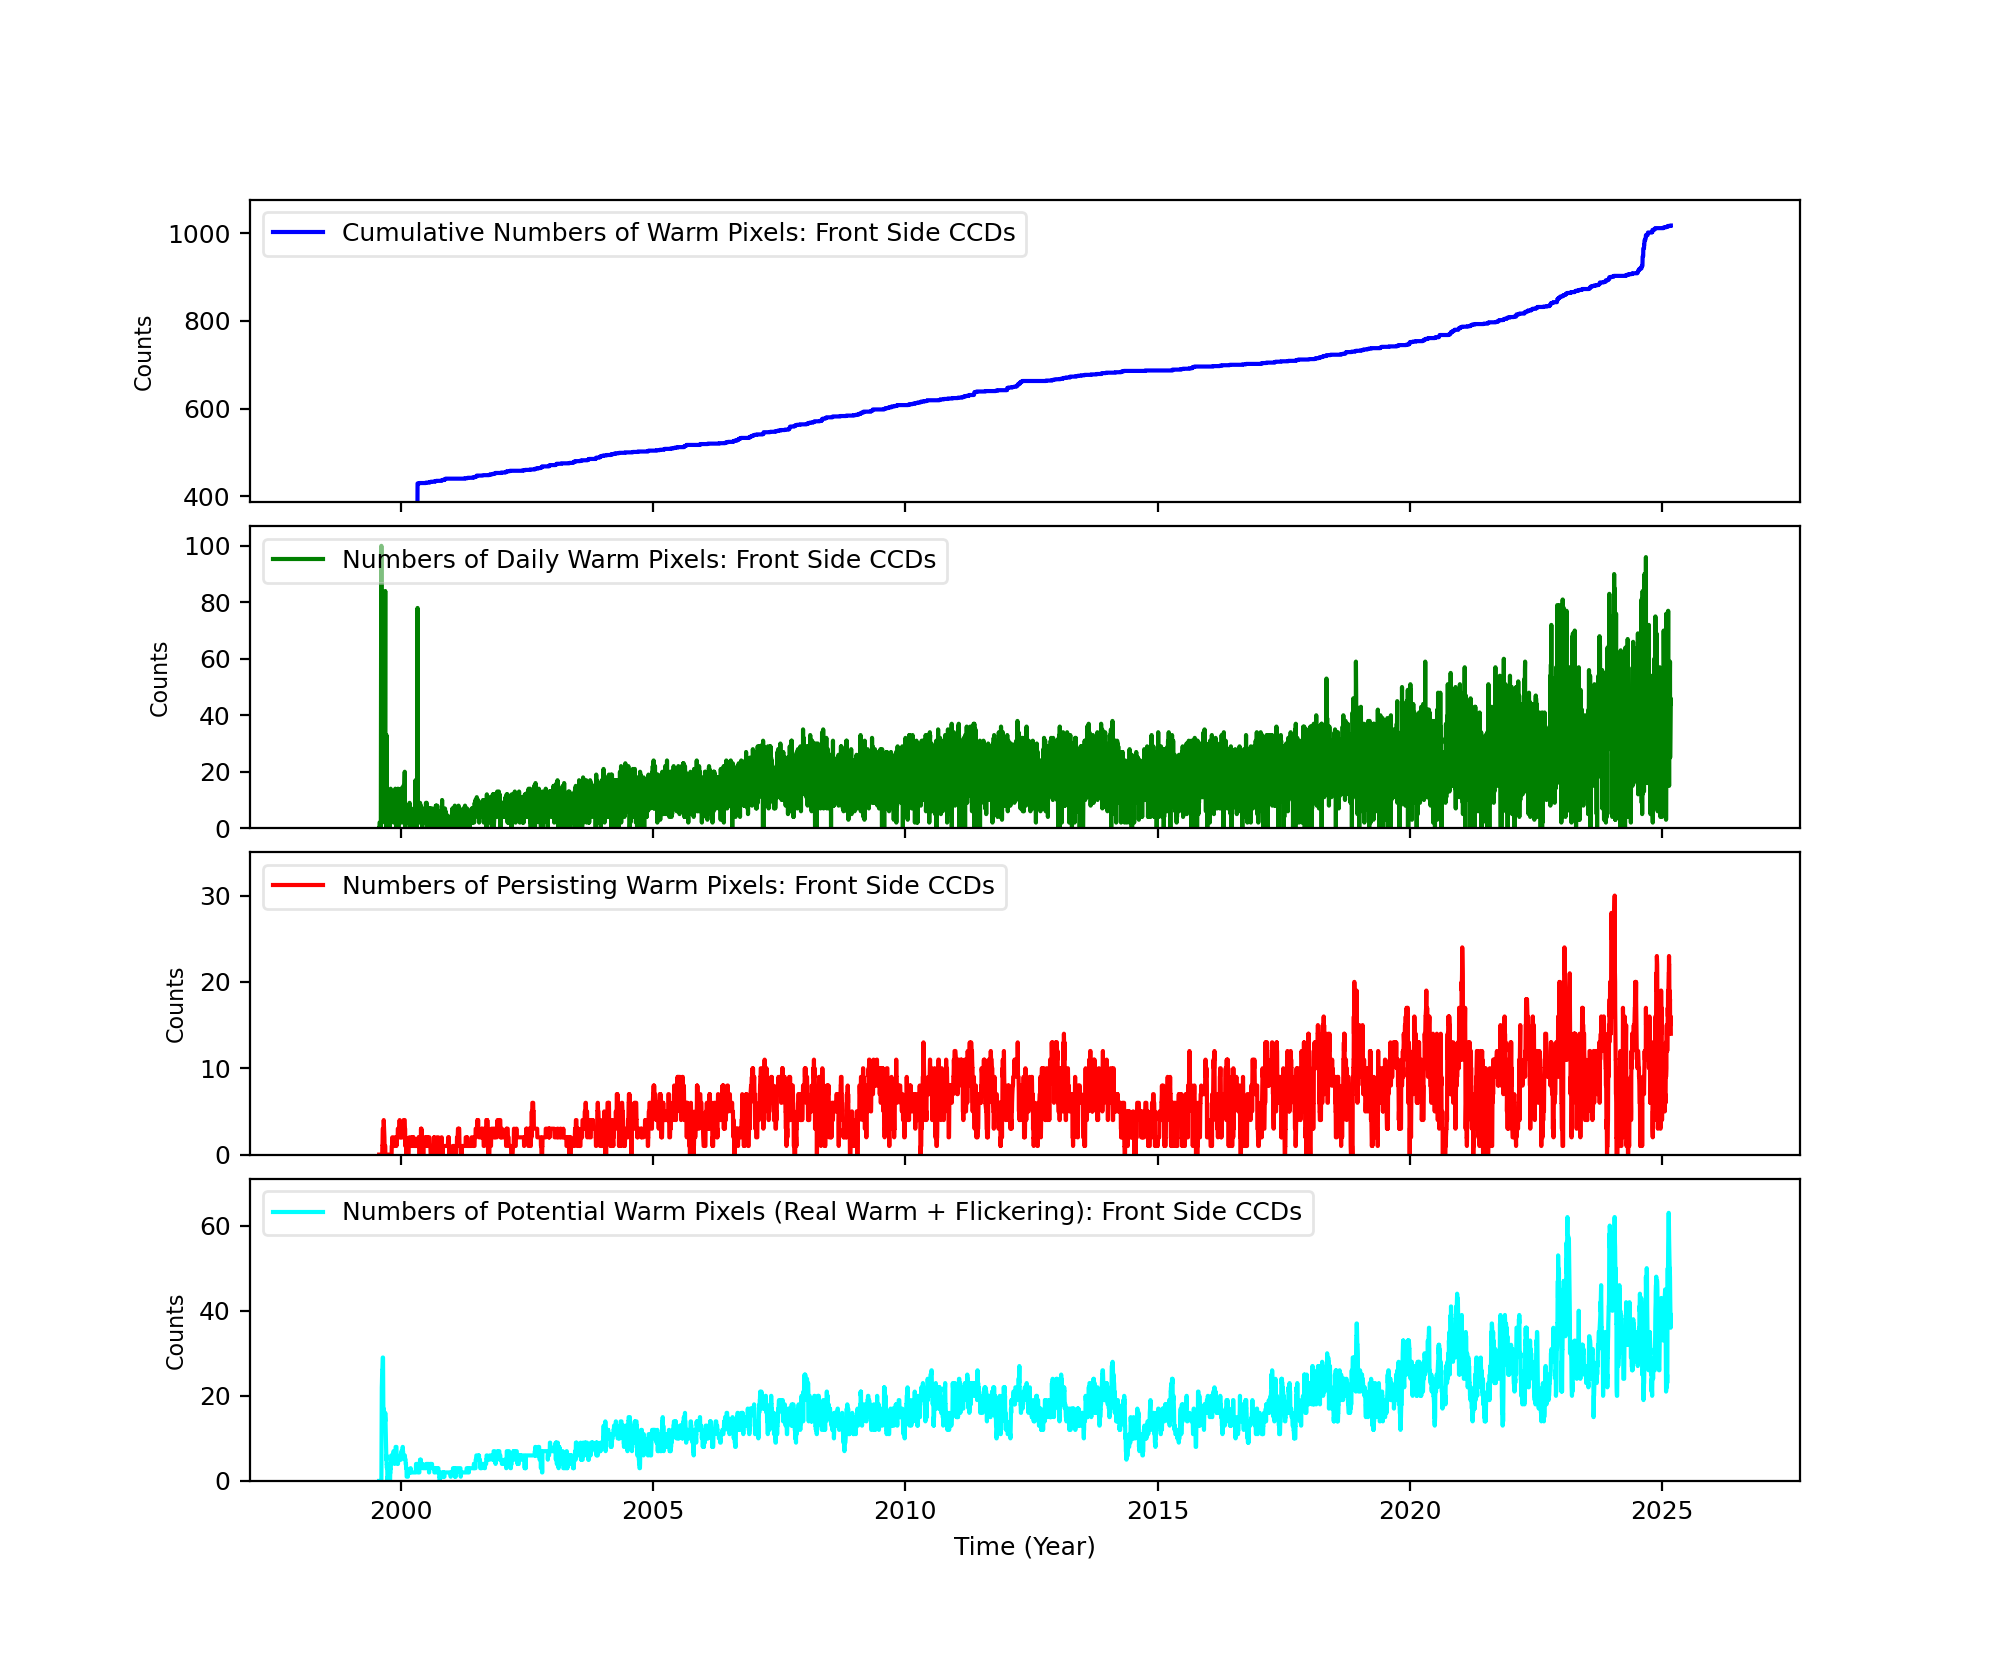
Bad Pixels
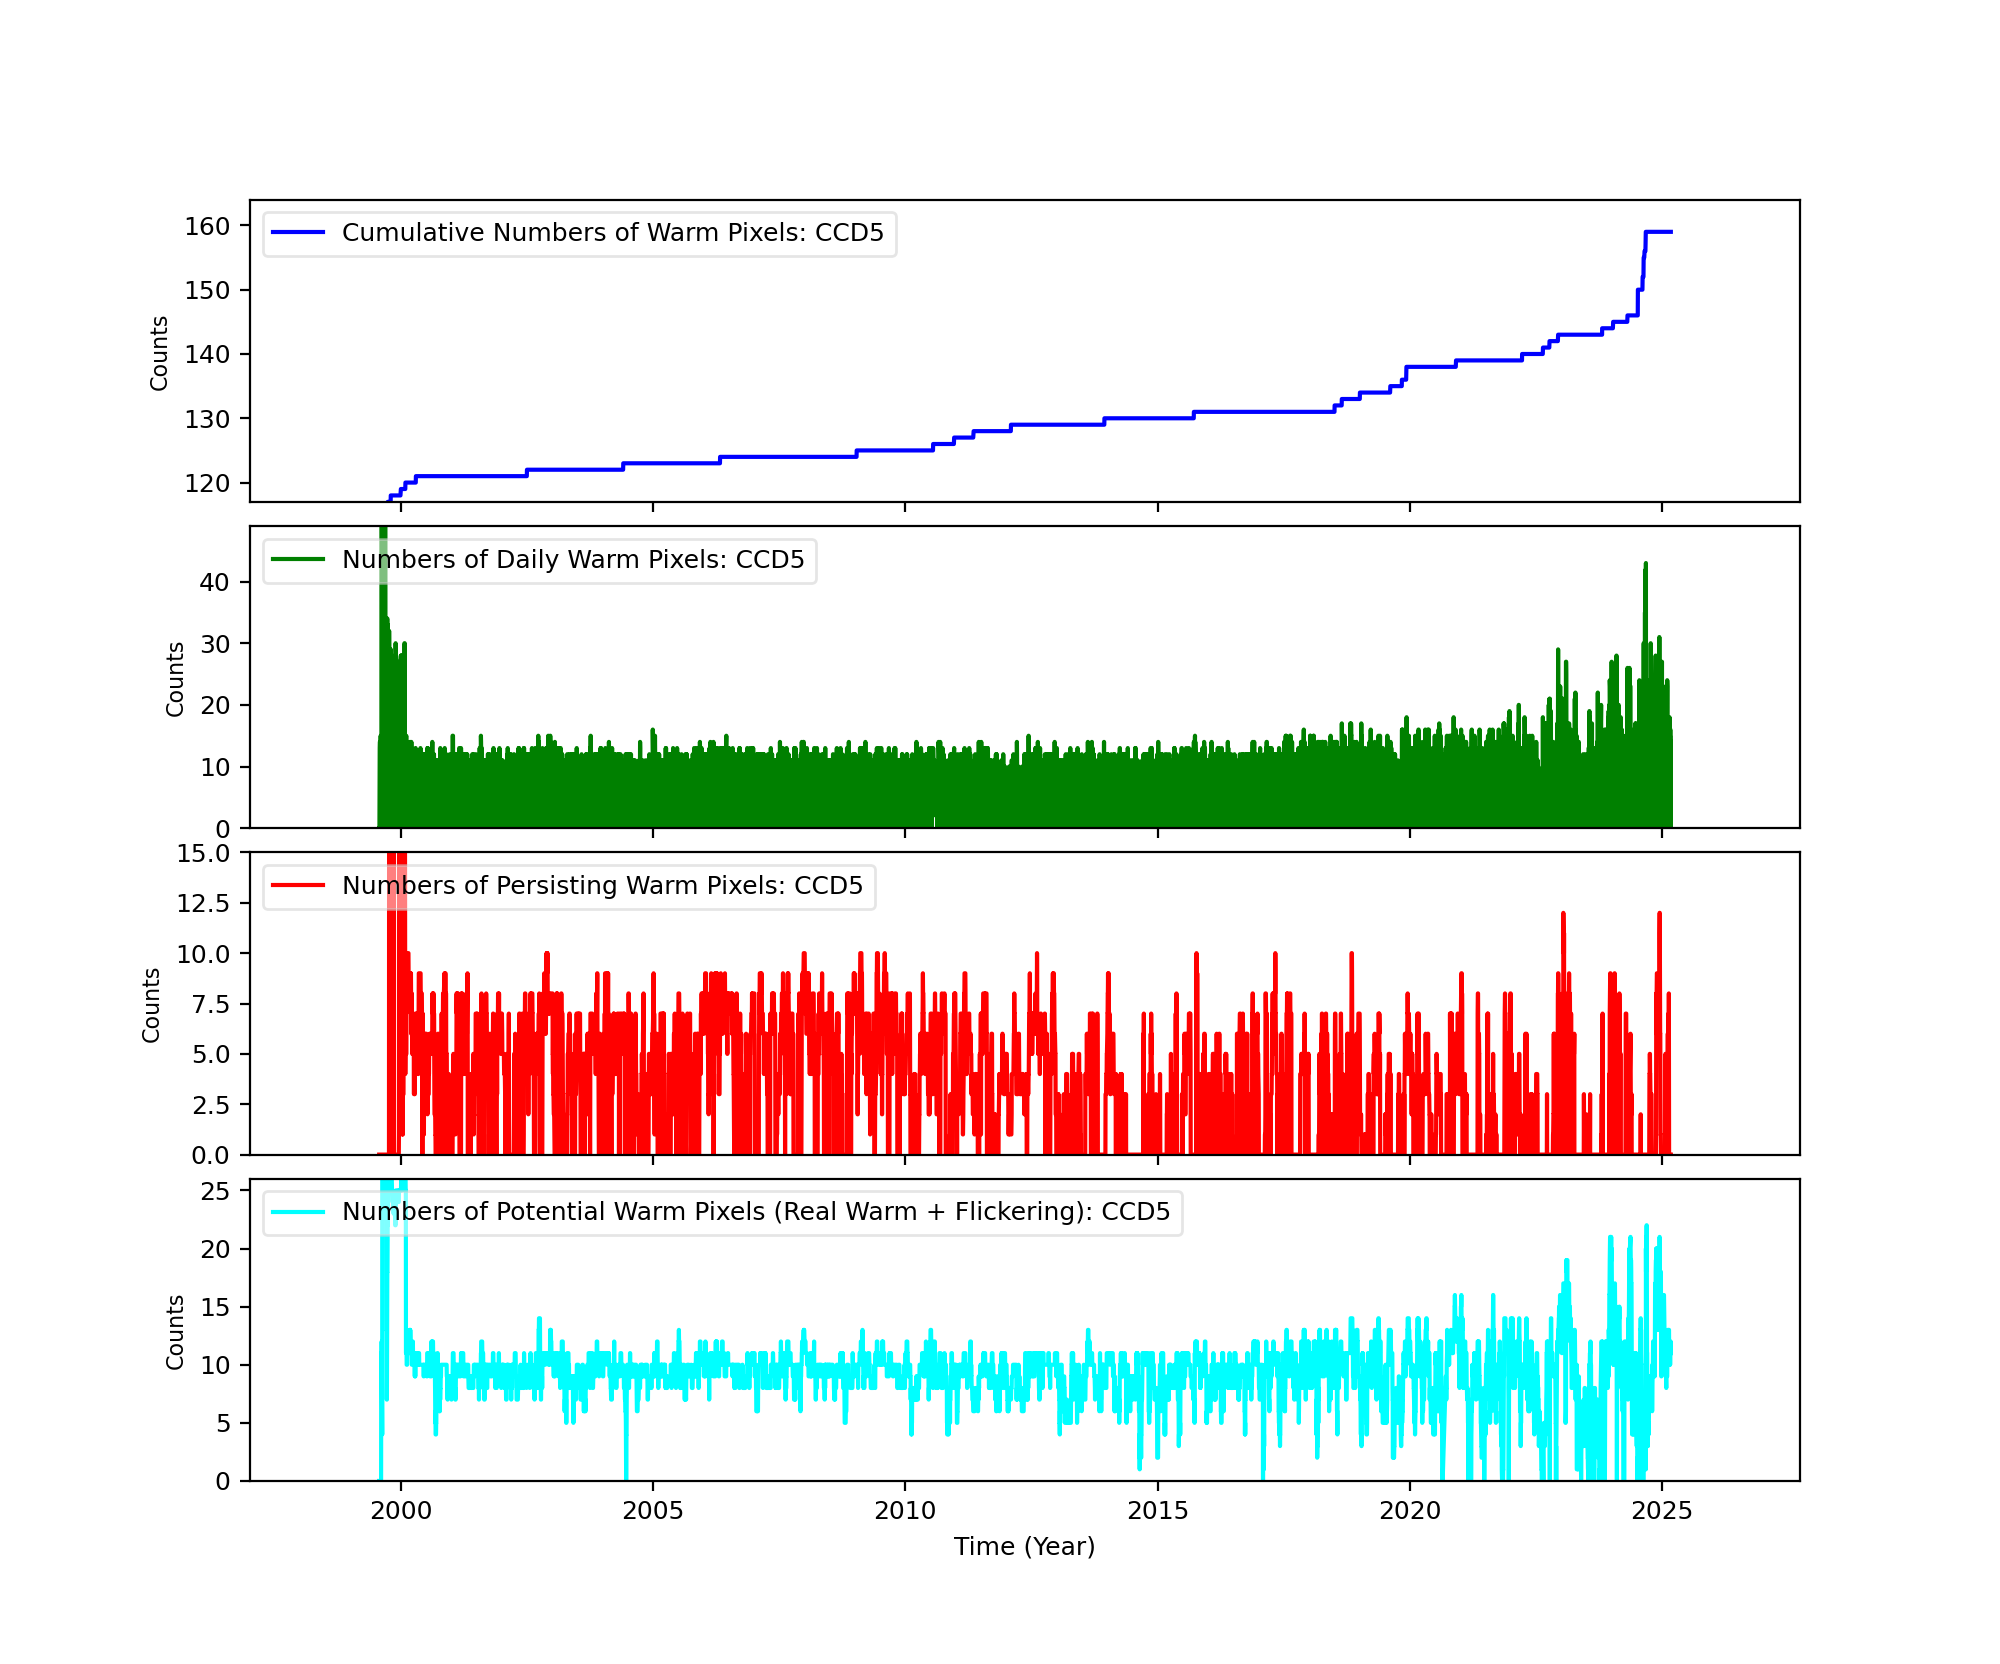
The plots below were generated with a new warm pixel finding script. Please see Acis Bad Pixel Page for details.
Front Side CCDs
Back Side CCD (CCD5)
Science Instrument Background Rates
| Name | Low (keV) | High(KeV) | Description |
|---|---|---|---|
| SSoft | 0.00 | 0.50 | Super soft photons |
| Soft | 0.50 | 1.00 | Soft photons |
| Med | 1.00 | 3.00 | Moderate energy photons |
| Hard | 3.00 | 5.00 | Hard Photons |
| Harder | 5.00 | 10.00 | Very Hard photons |
| Hardest | 10.00 | Beyond 10 keV |


HRC
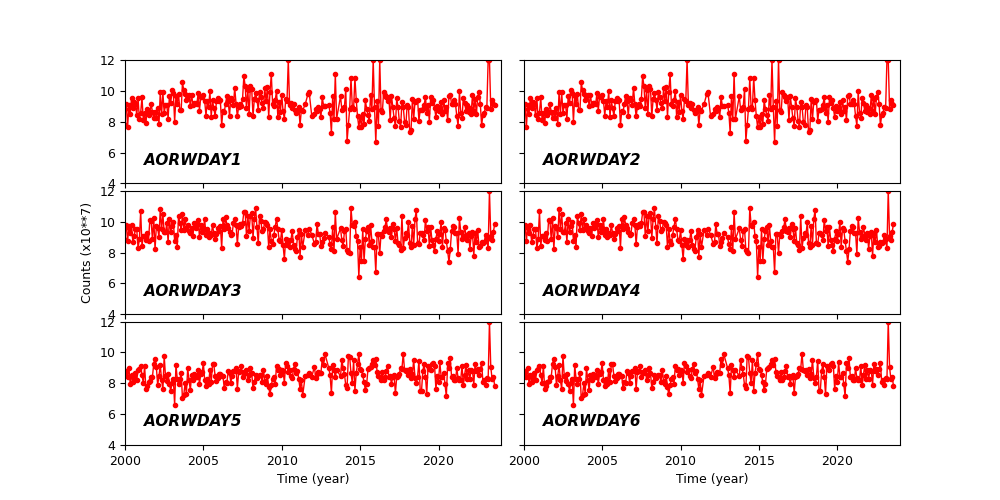
DOSE of Central 4K Pore-Pairs
Please refer to Maximum Dose Trends for more details.
)
|
|---|
IMAGE                NPIX      MEAN    STDDEV      MIN       MAX
HRCI_02_2025.fits  16777216	0.030 	0.186 	0.000 	12.000
)
IMAGE                       NPIX      MEAN    STDDEV      MIN       MAX
HRCI_08_1999_02_2025.fits  16777216	na	na	na	na
)
|
|---|
IMAGE                NPIX      MEAN    STDDEV      MIN       MAX
HRCS_02_2025.fits  16777216	0.008 	0.092 	0.000 	3.000
)
IMAGE                       NPIX      MEAN    STDDEV      MIN       MAX
HRCS_08_1999_02_2025.fits  16777216	na	na	na	na
|
|
Max dose trend plots corrected for events that "pile-up"
in the center of the taps due to bad position information.
|
)
|
)
|
)
|
)
|
| Nov 2024 | Aug 2024 | May 2024 | Feb 2024 |
|---|
)
|
)
|
)
|
)
|
| Nov 2024 | Aug 2024 | May 2024 | Feb 2024 |
|---|
HRMA Focus
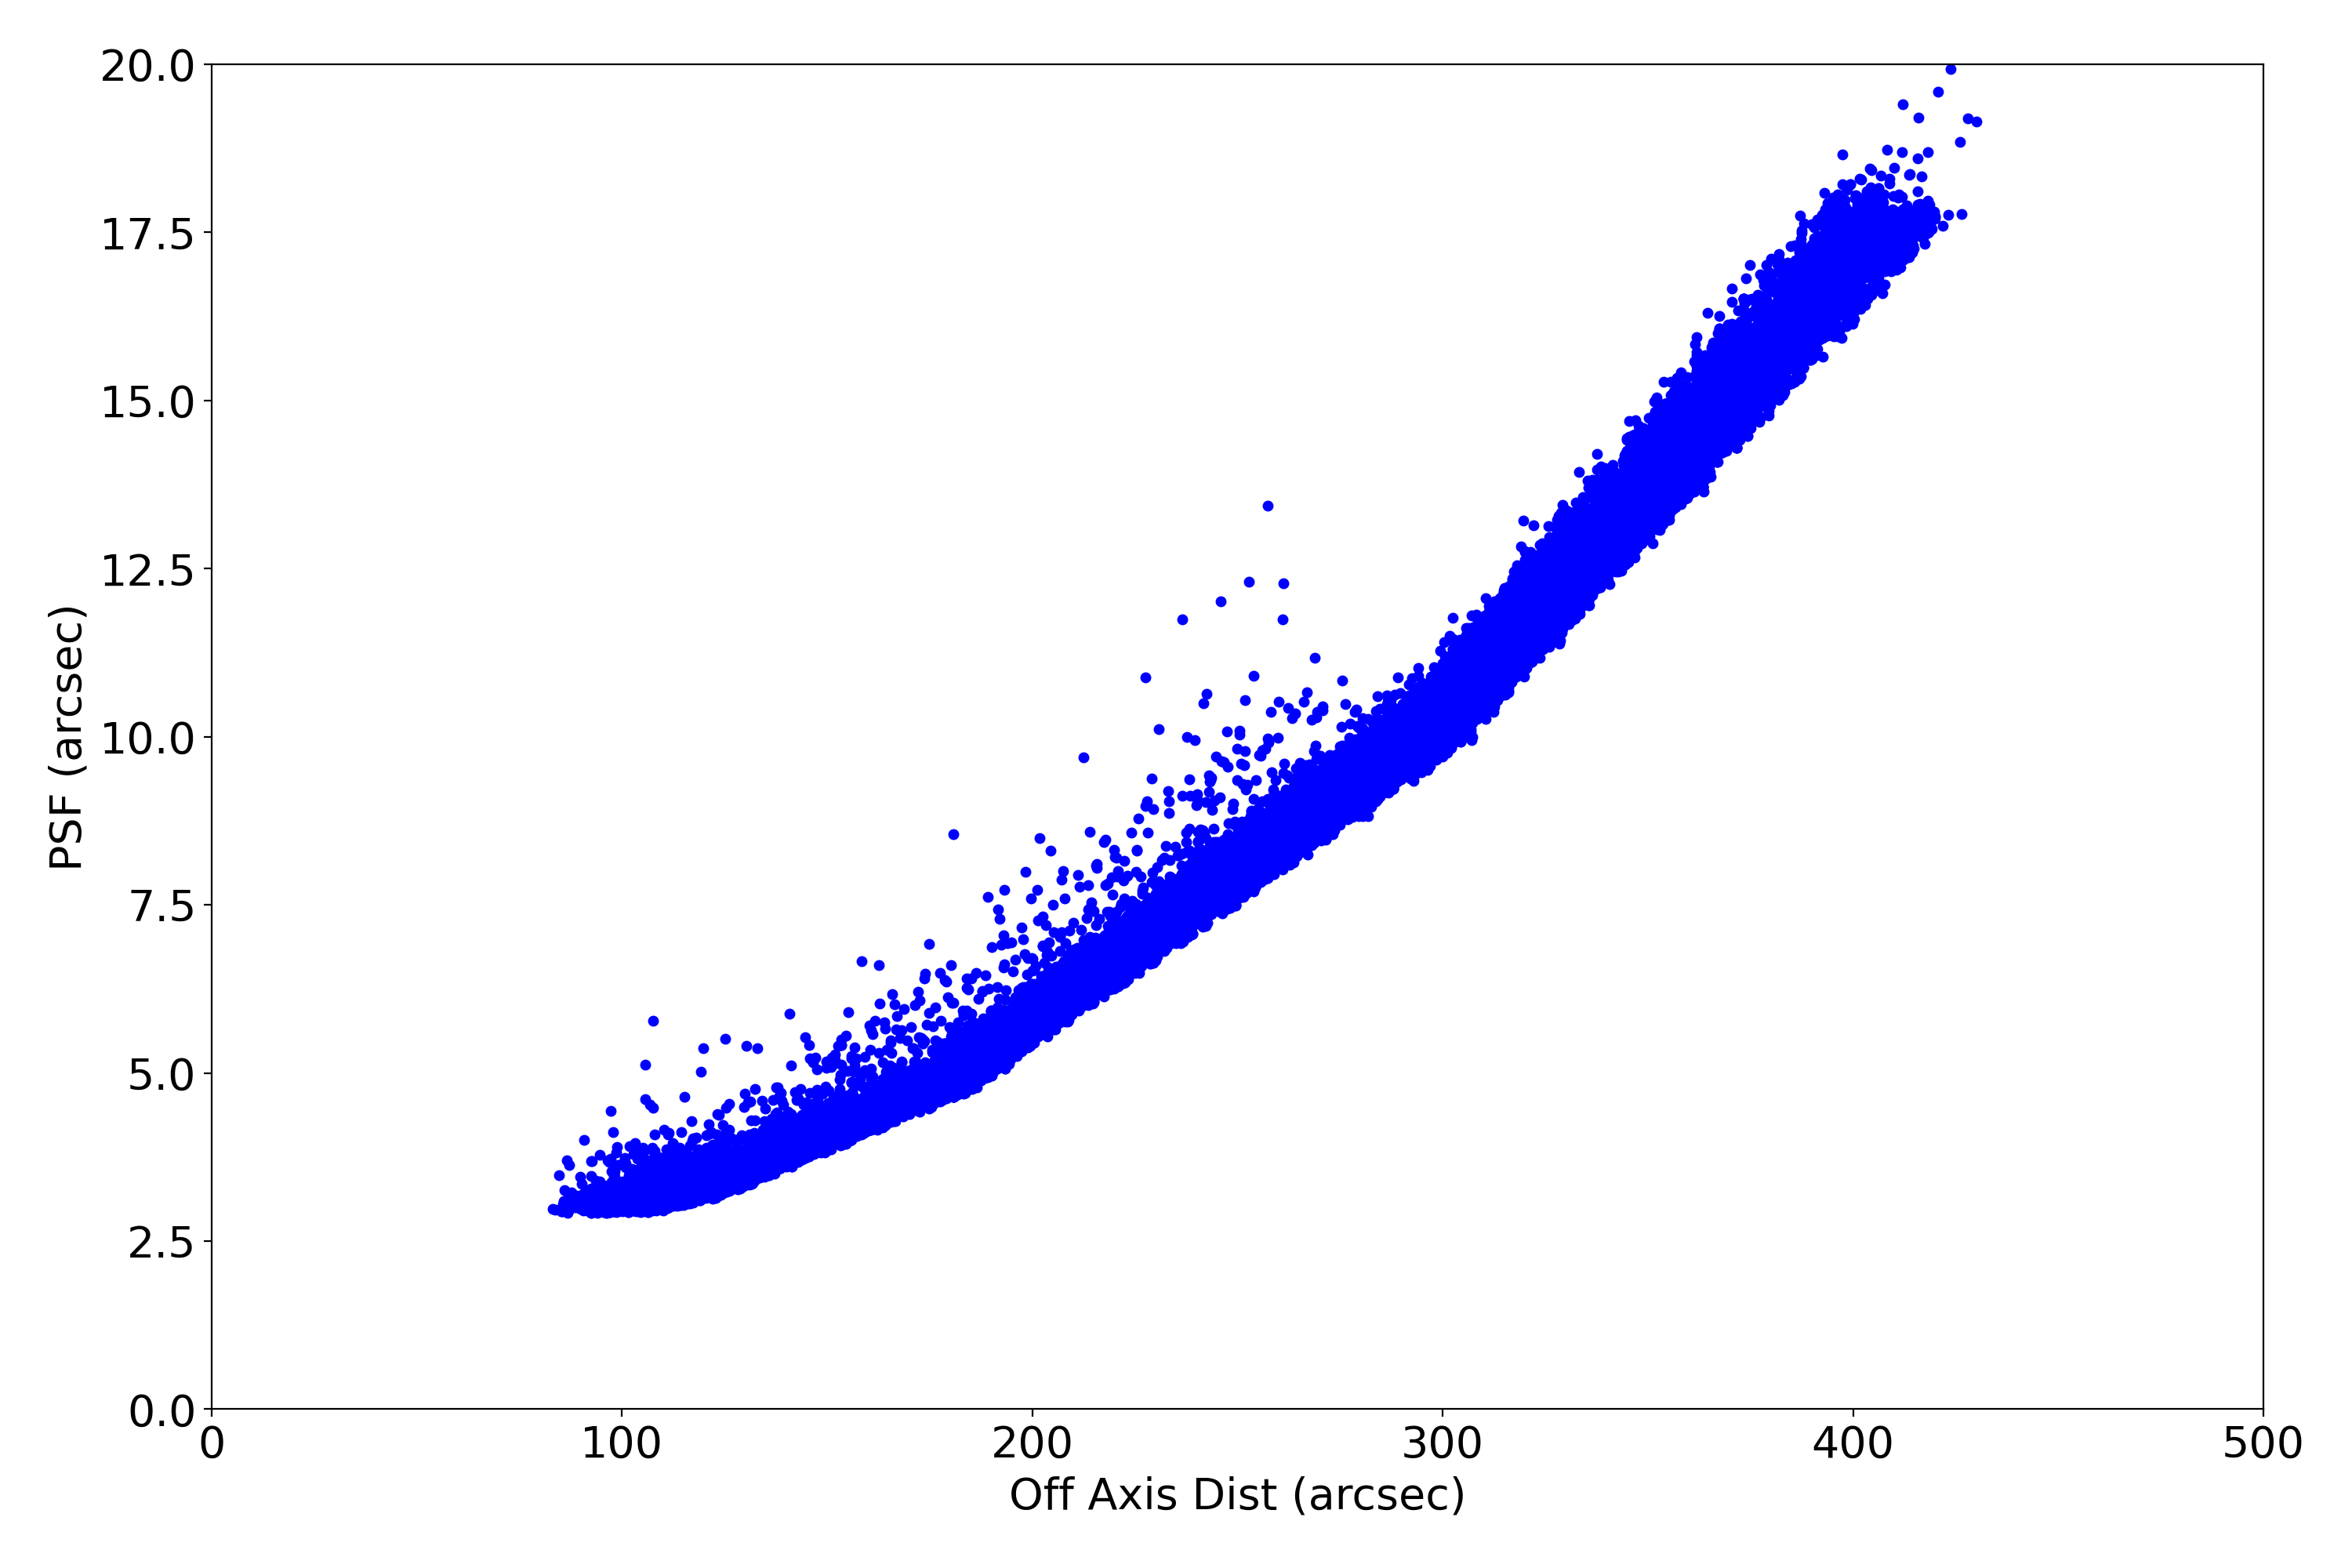
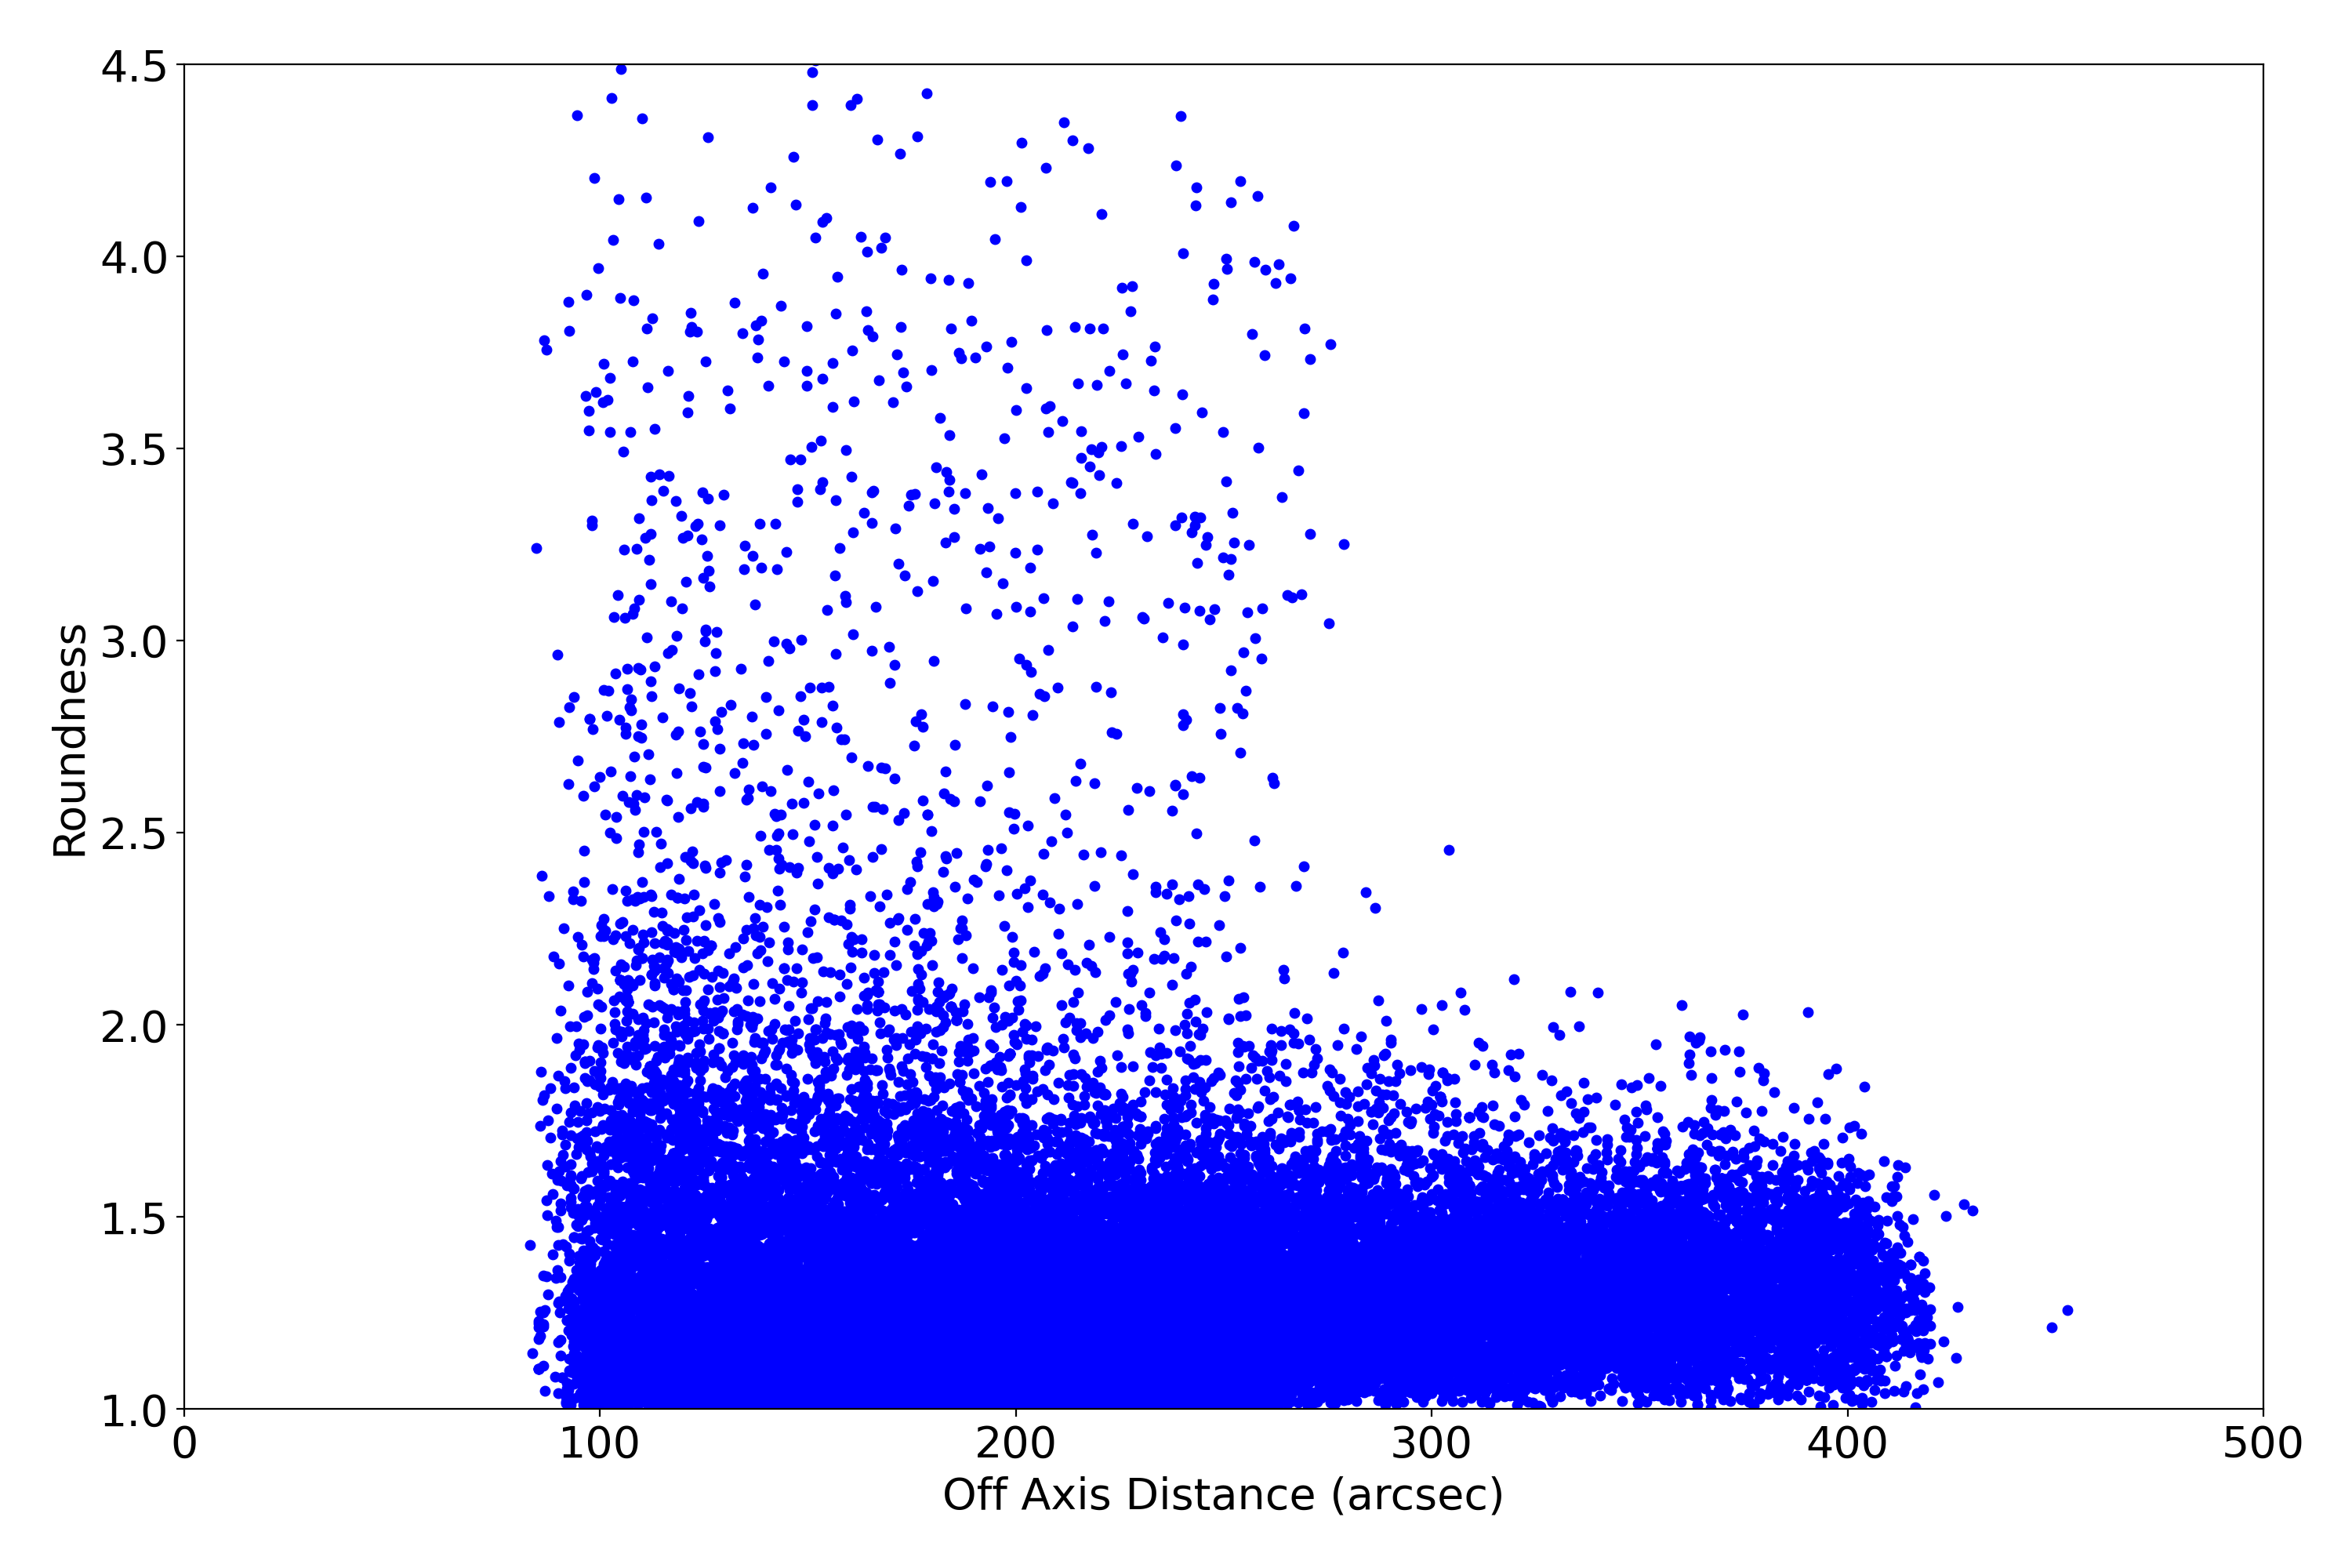
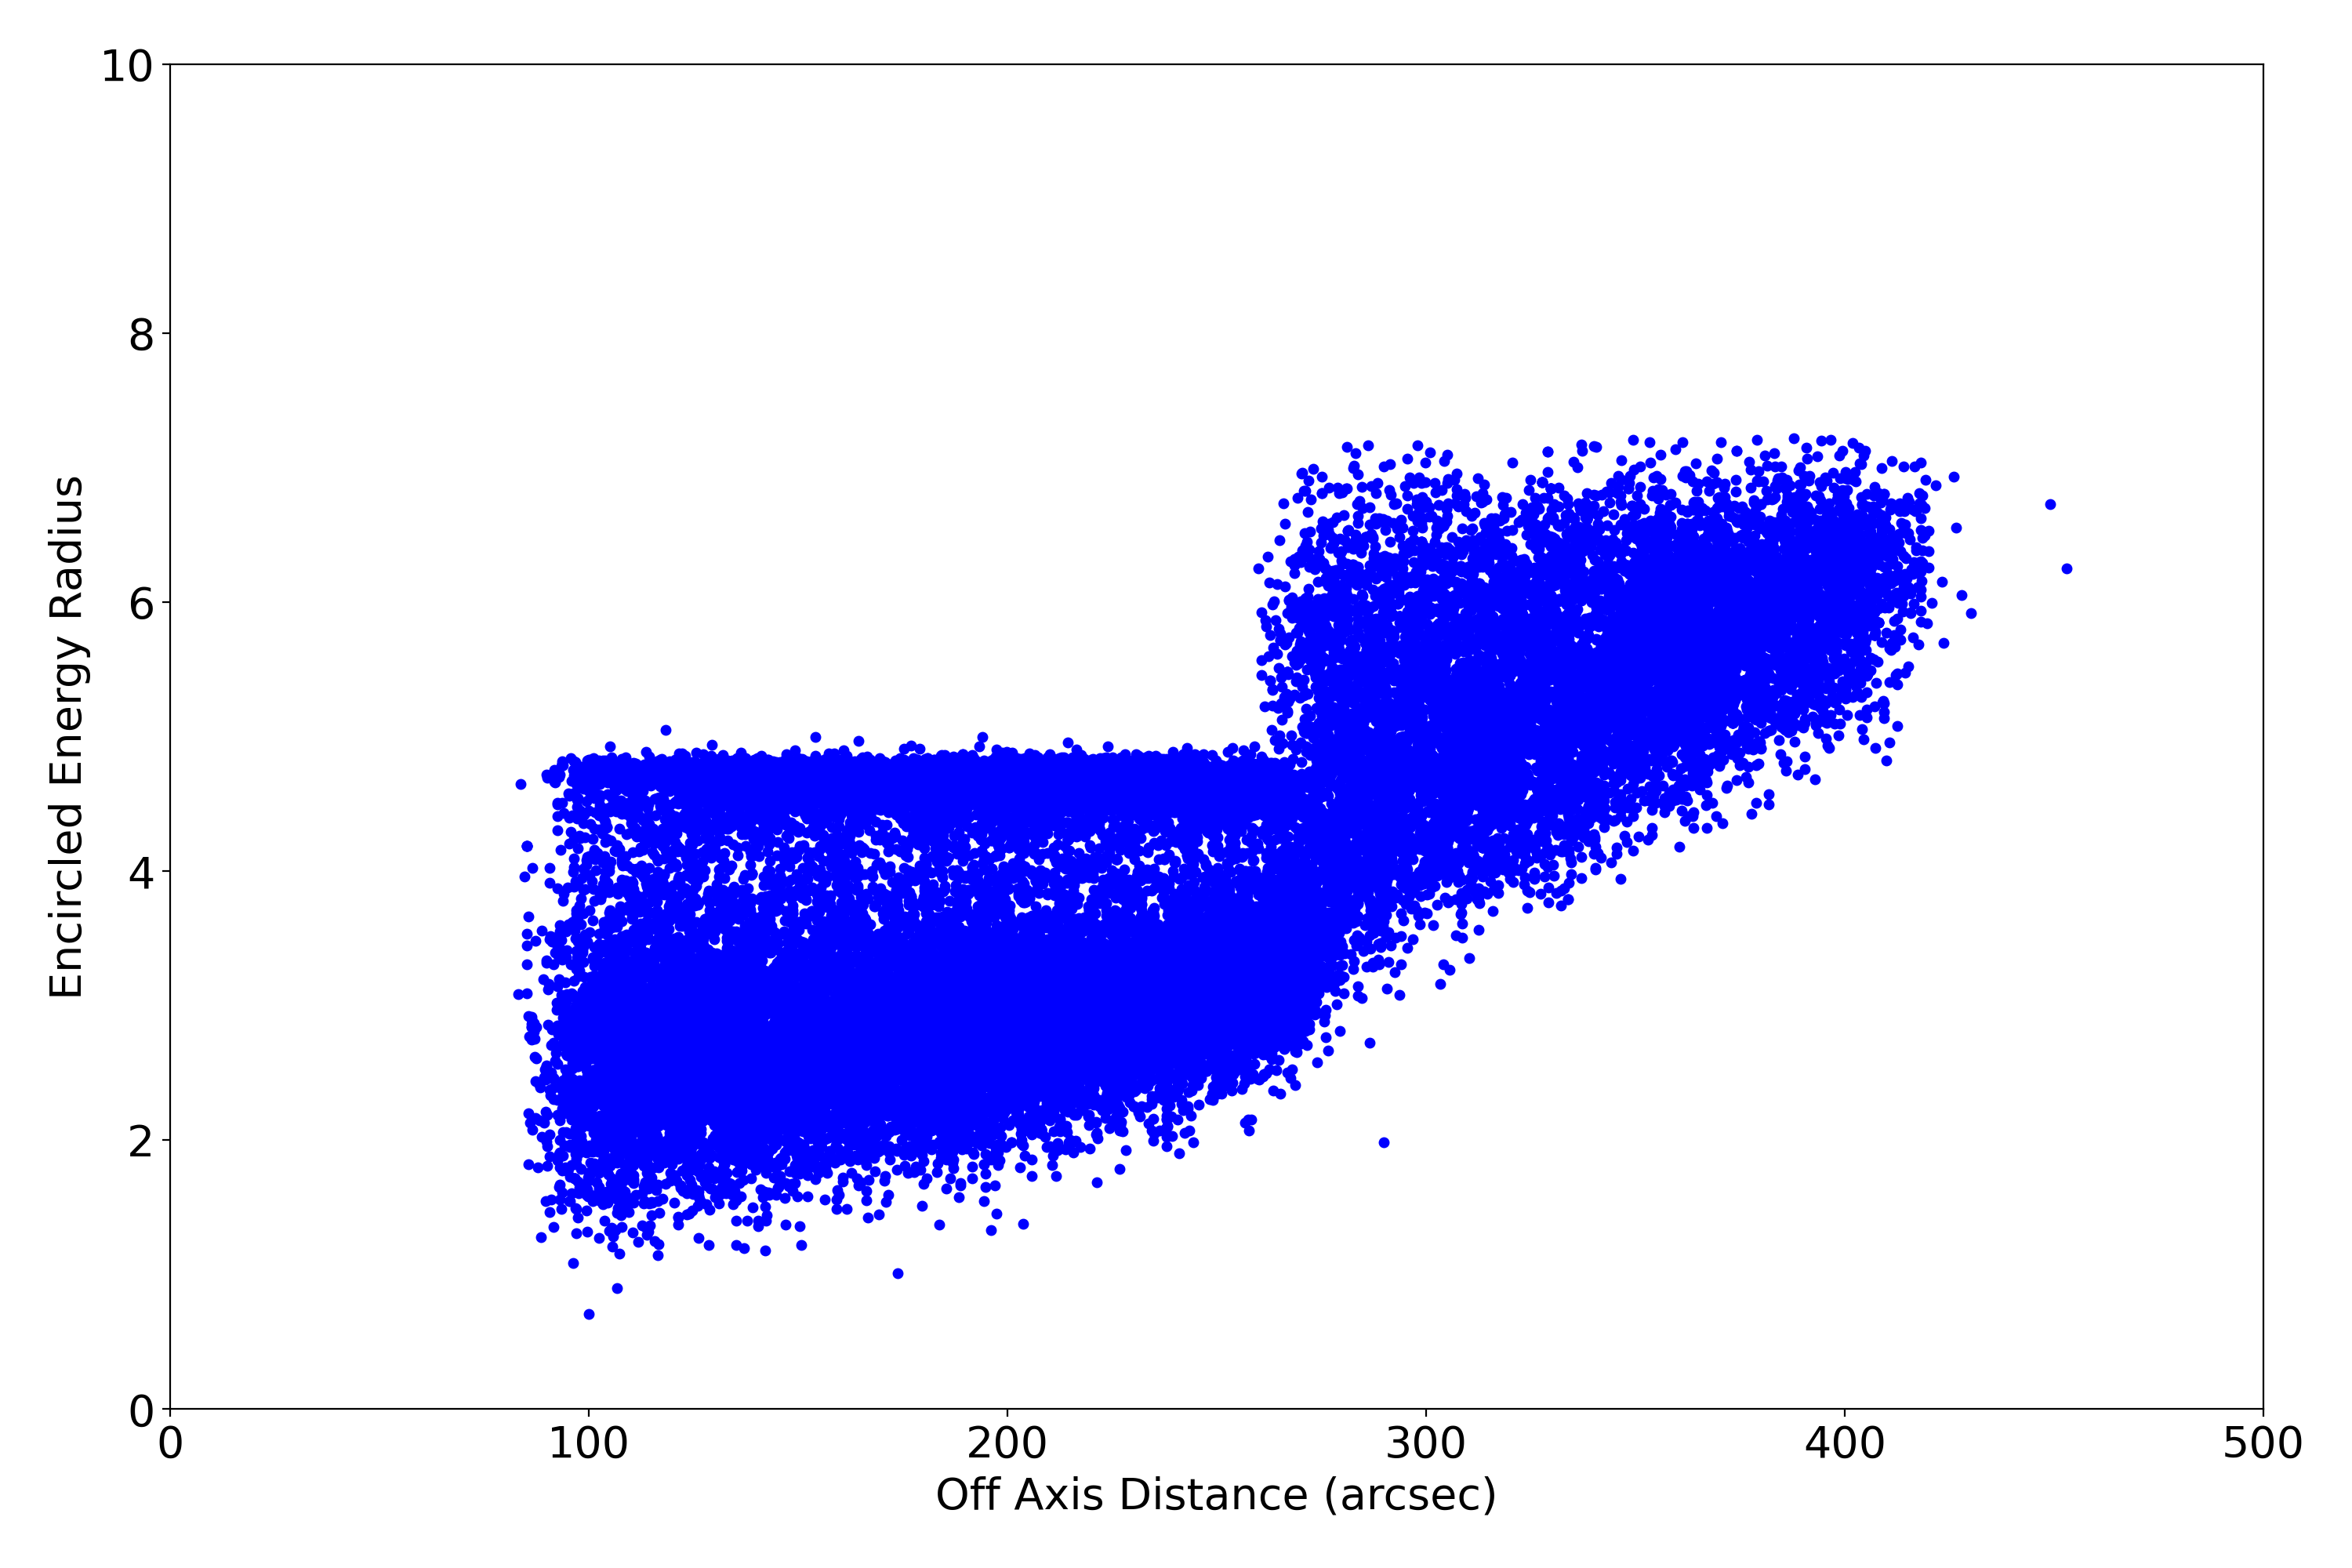
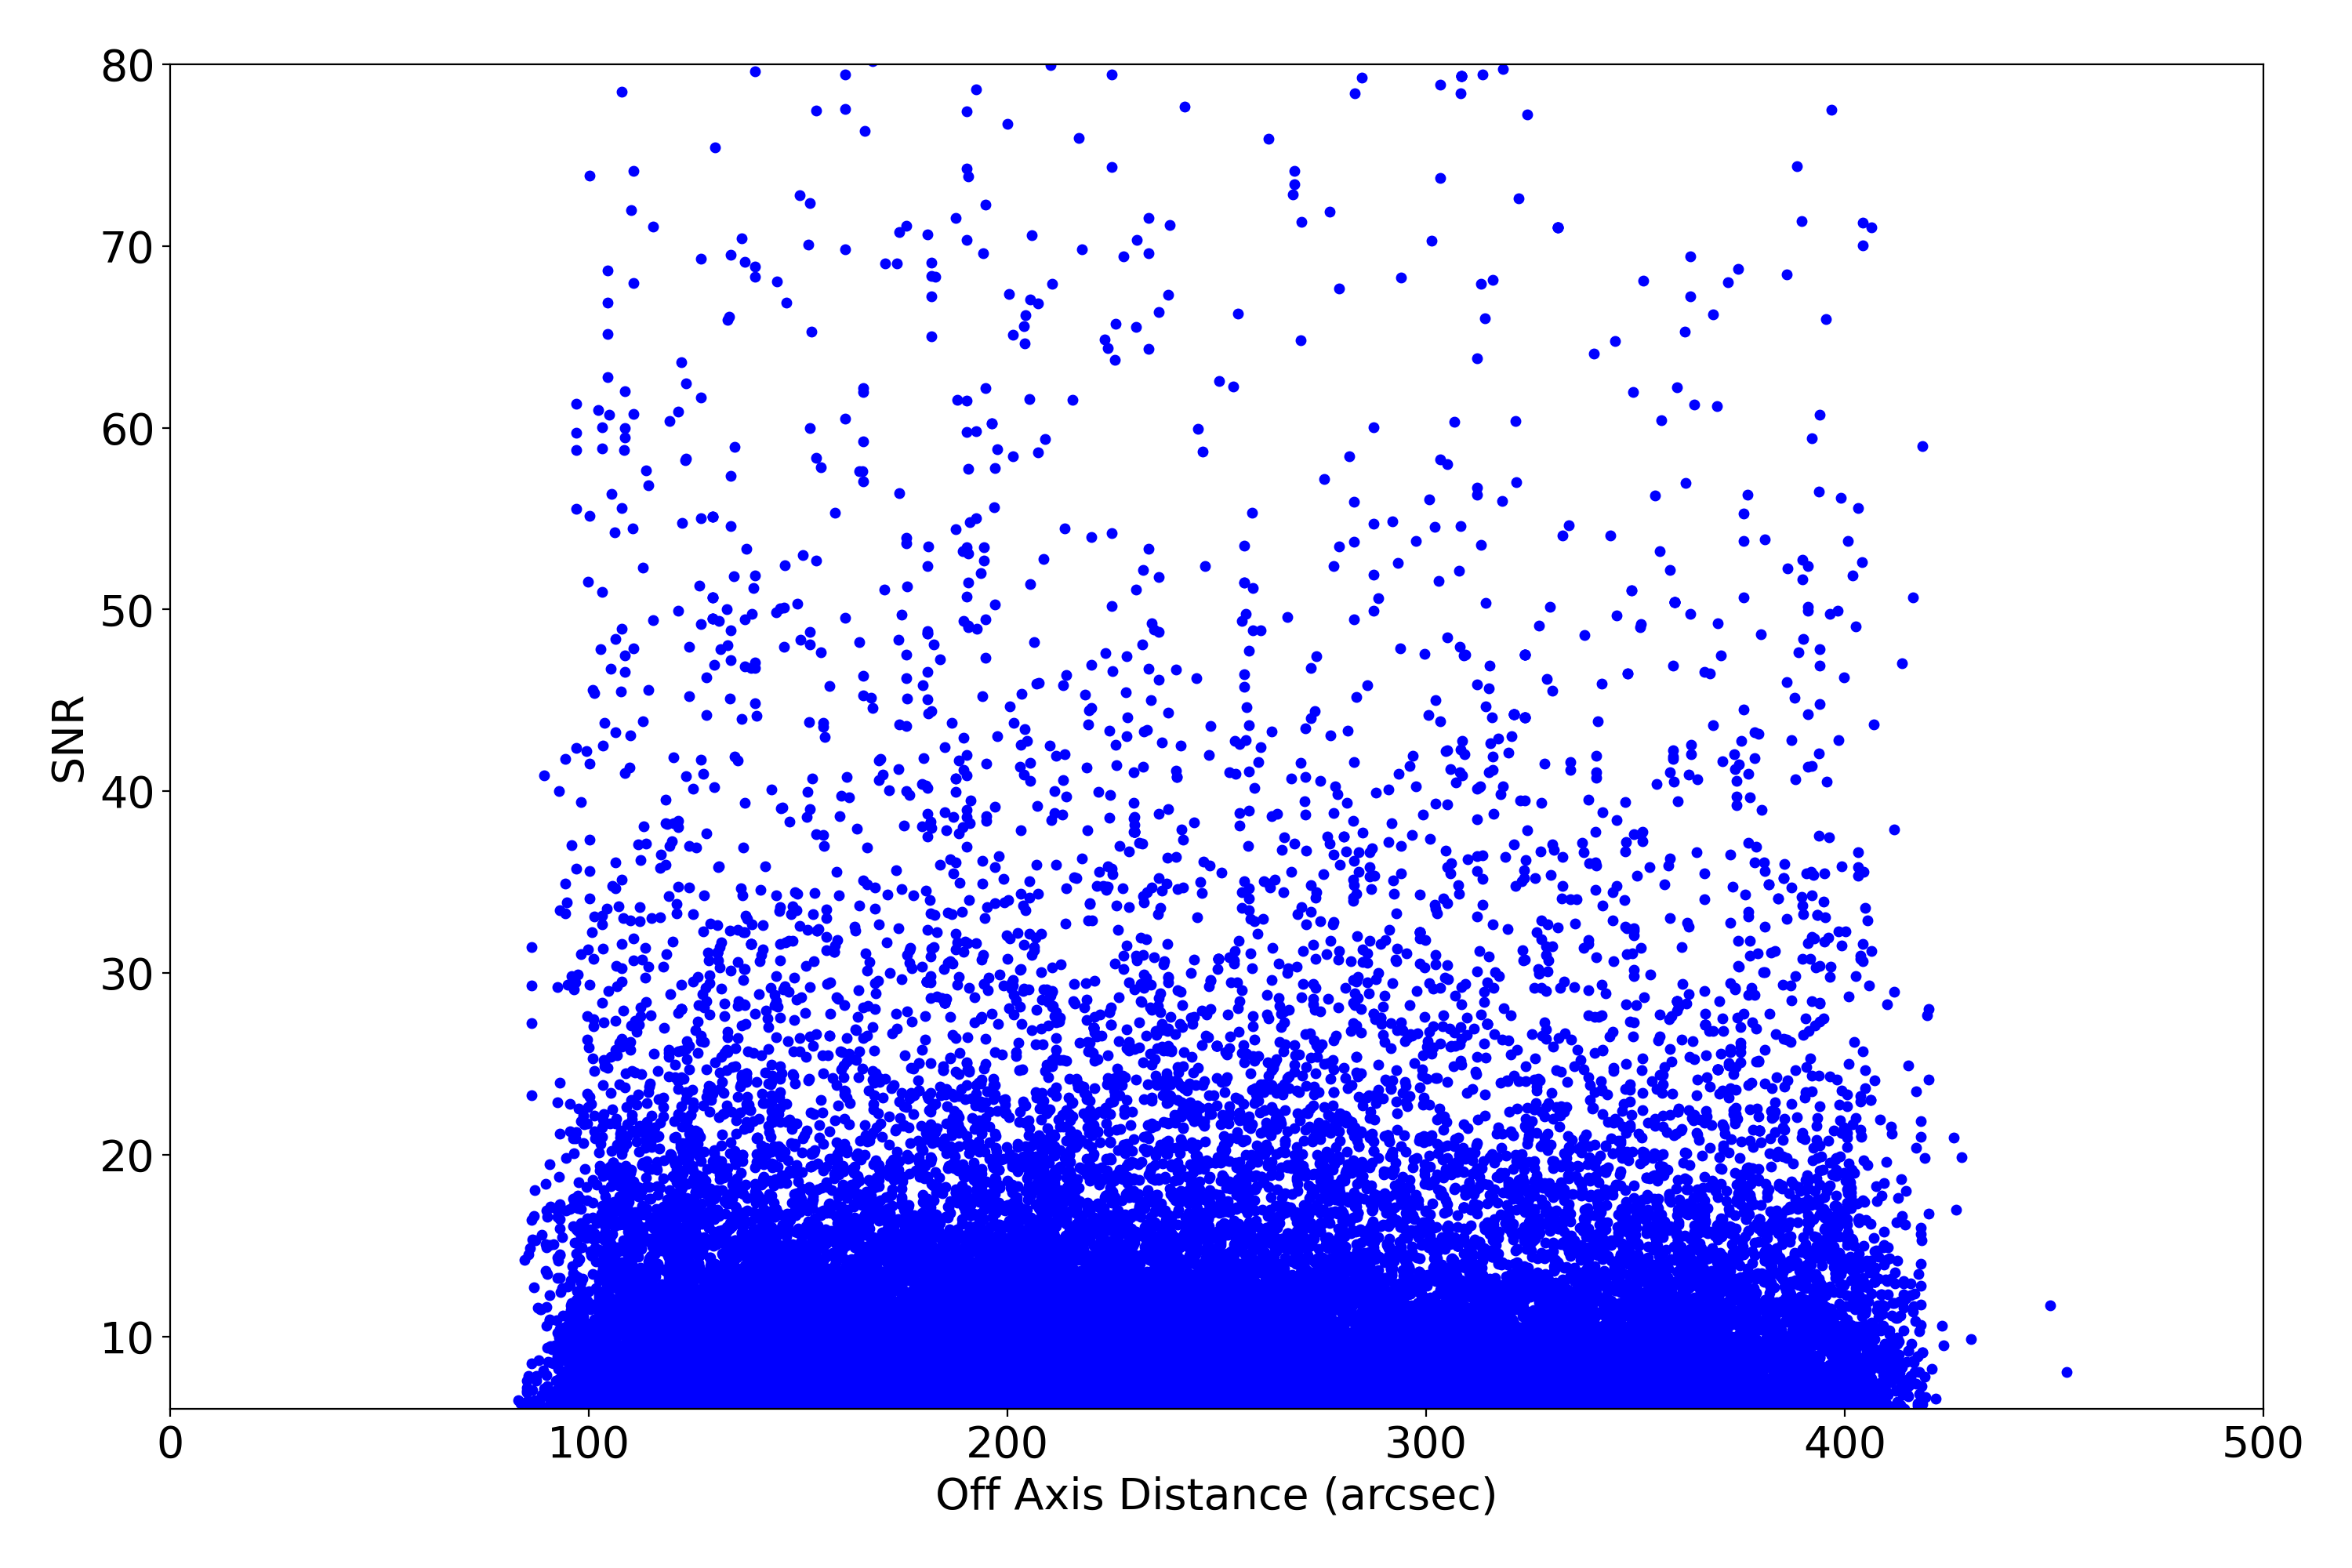
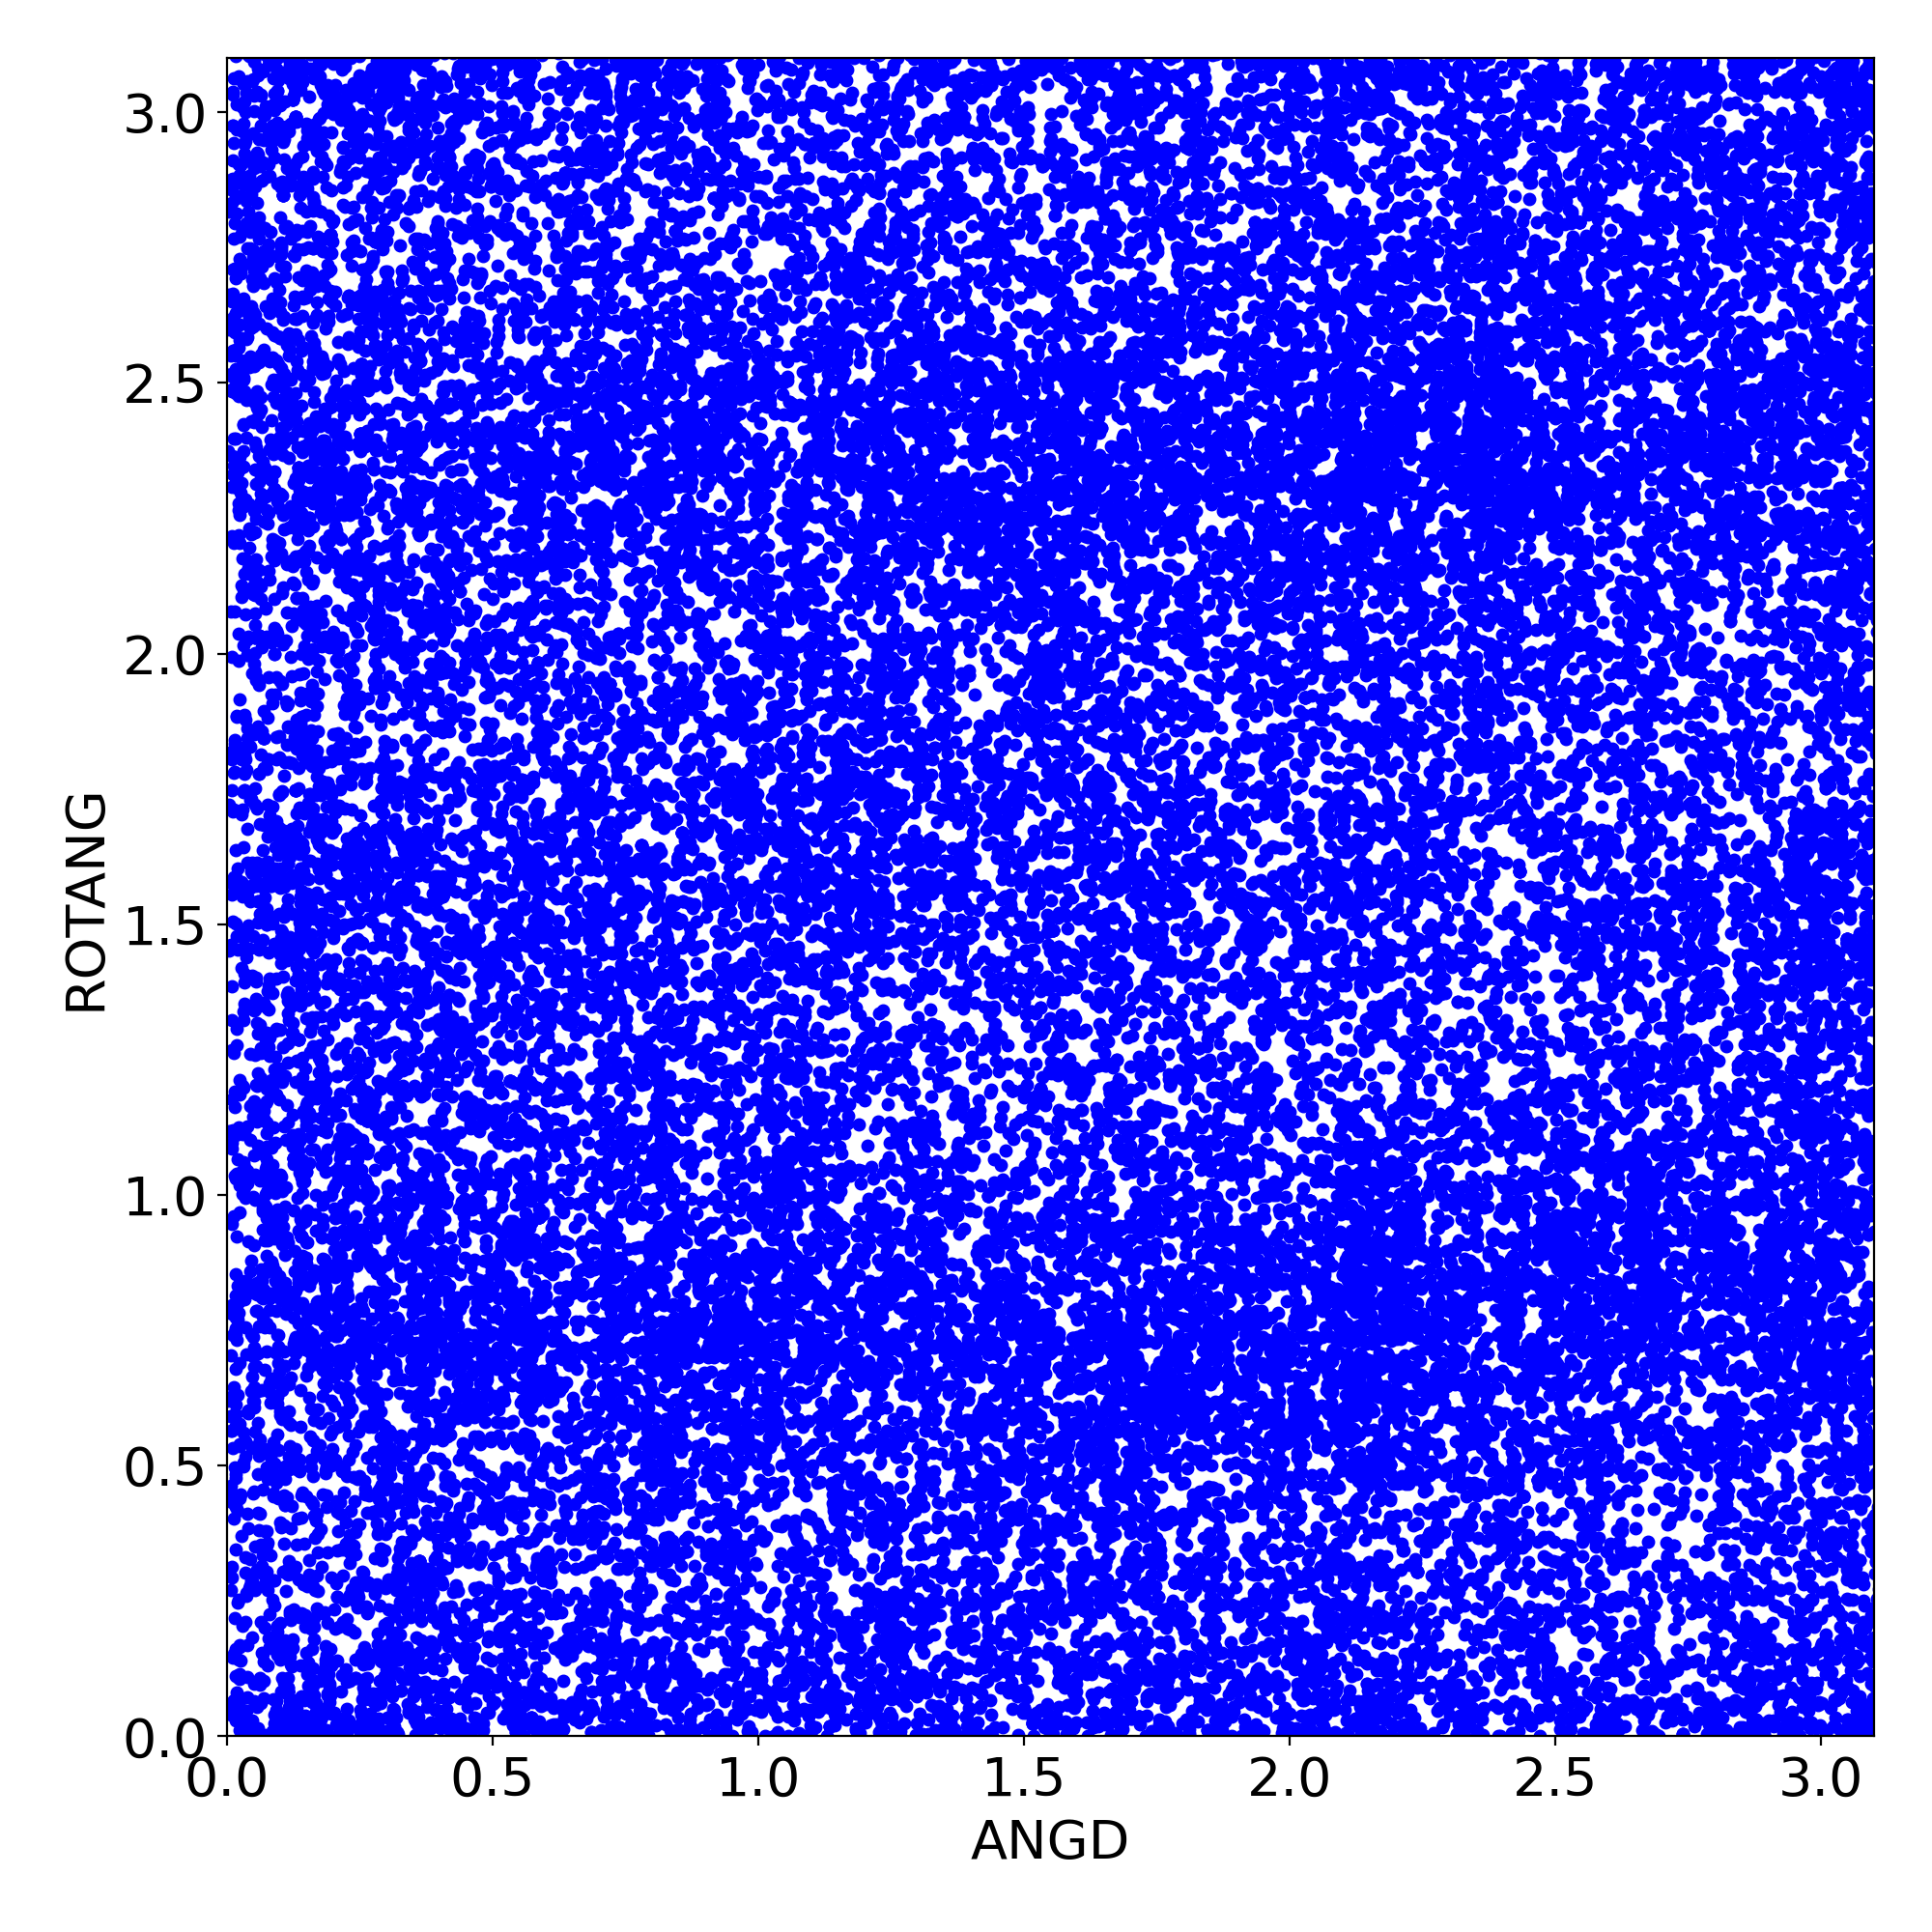
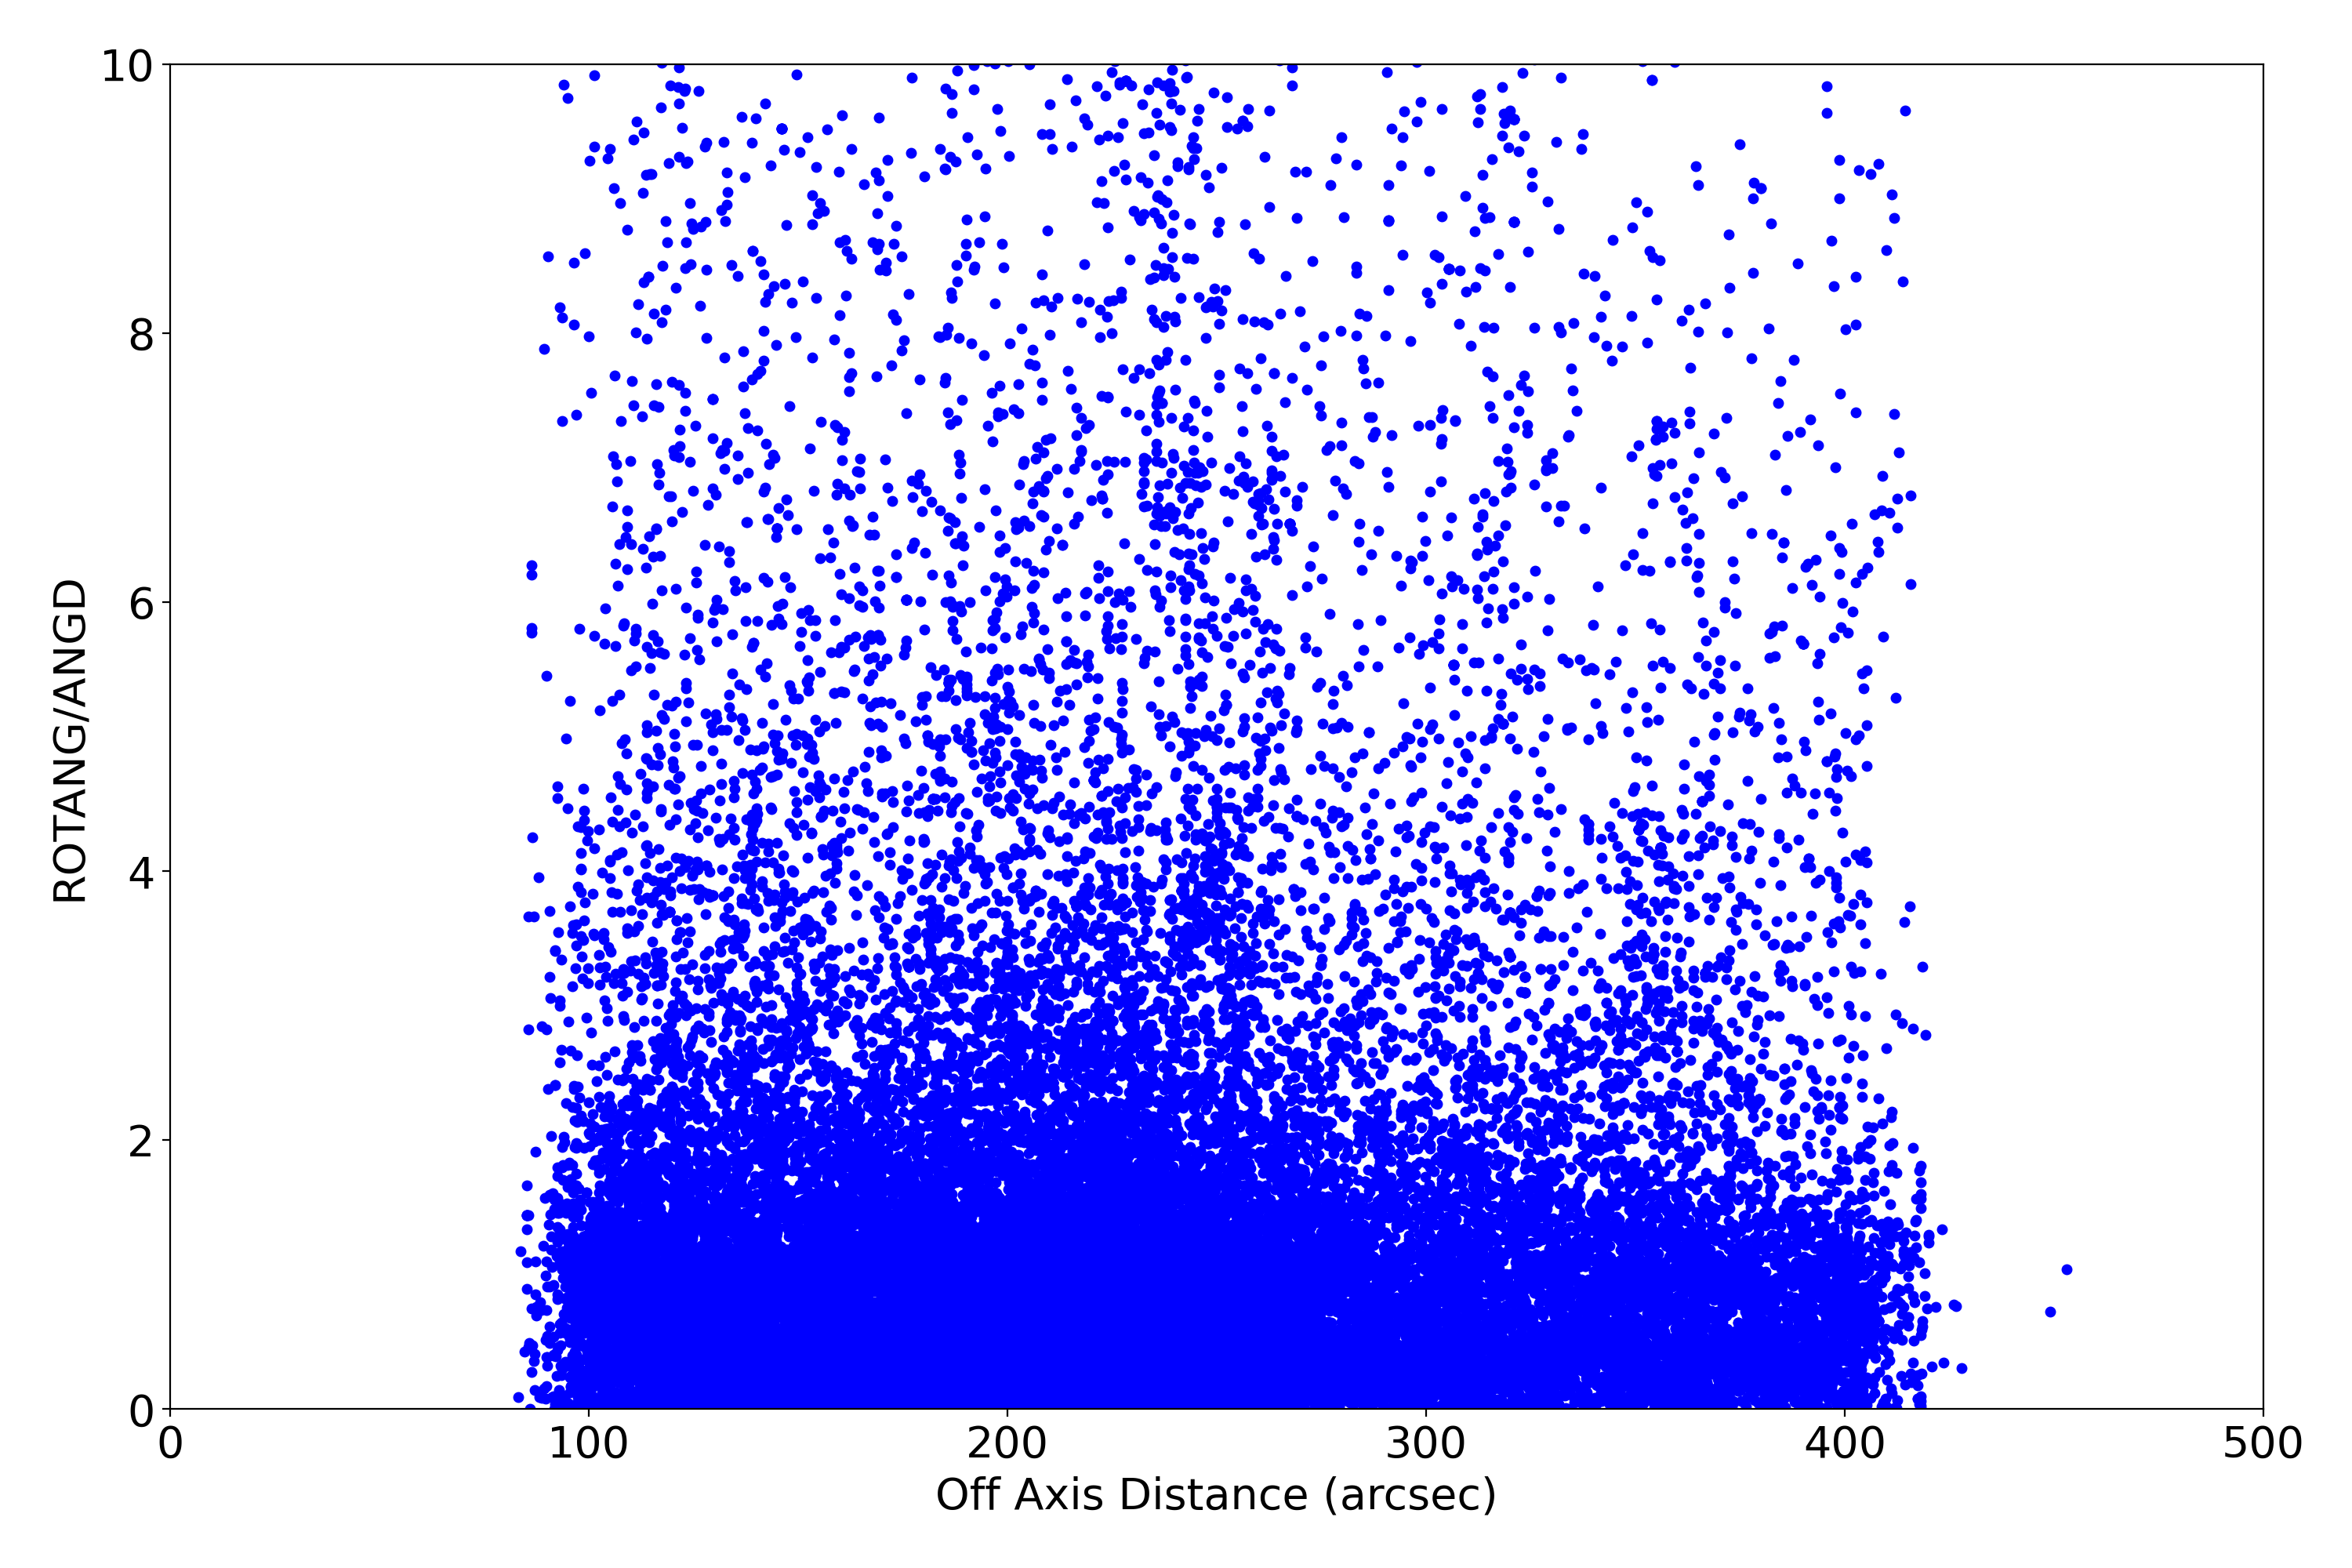
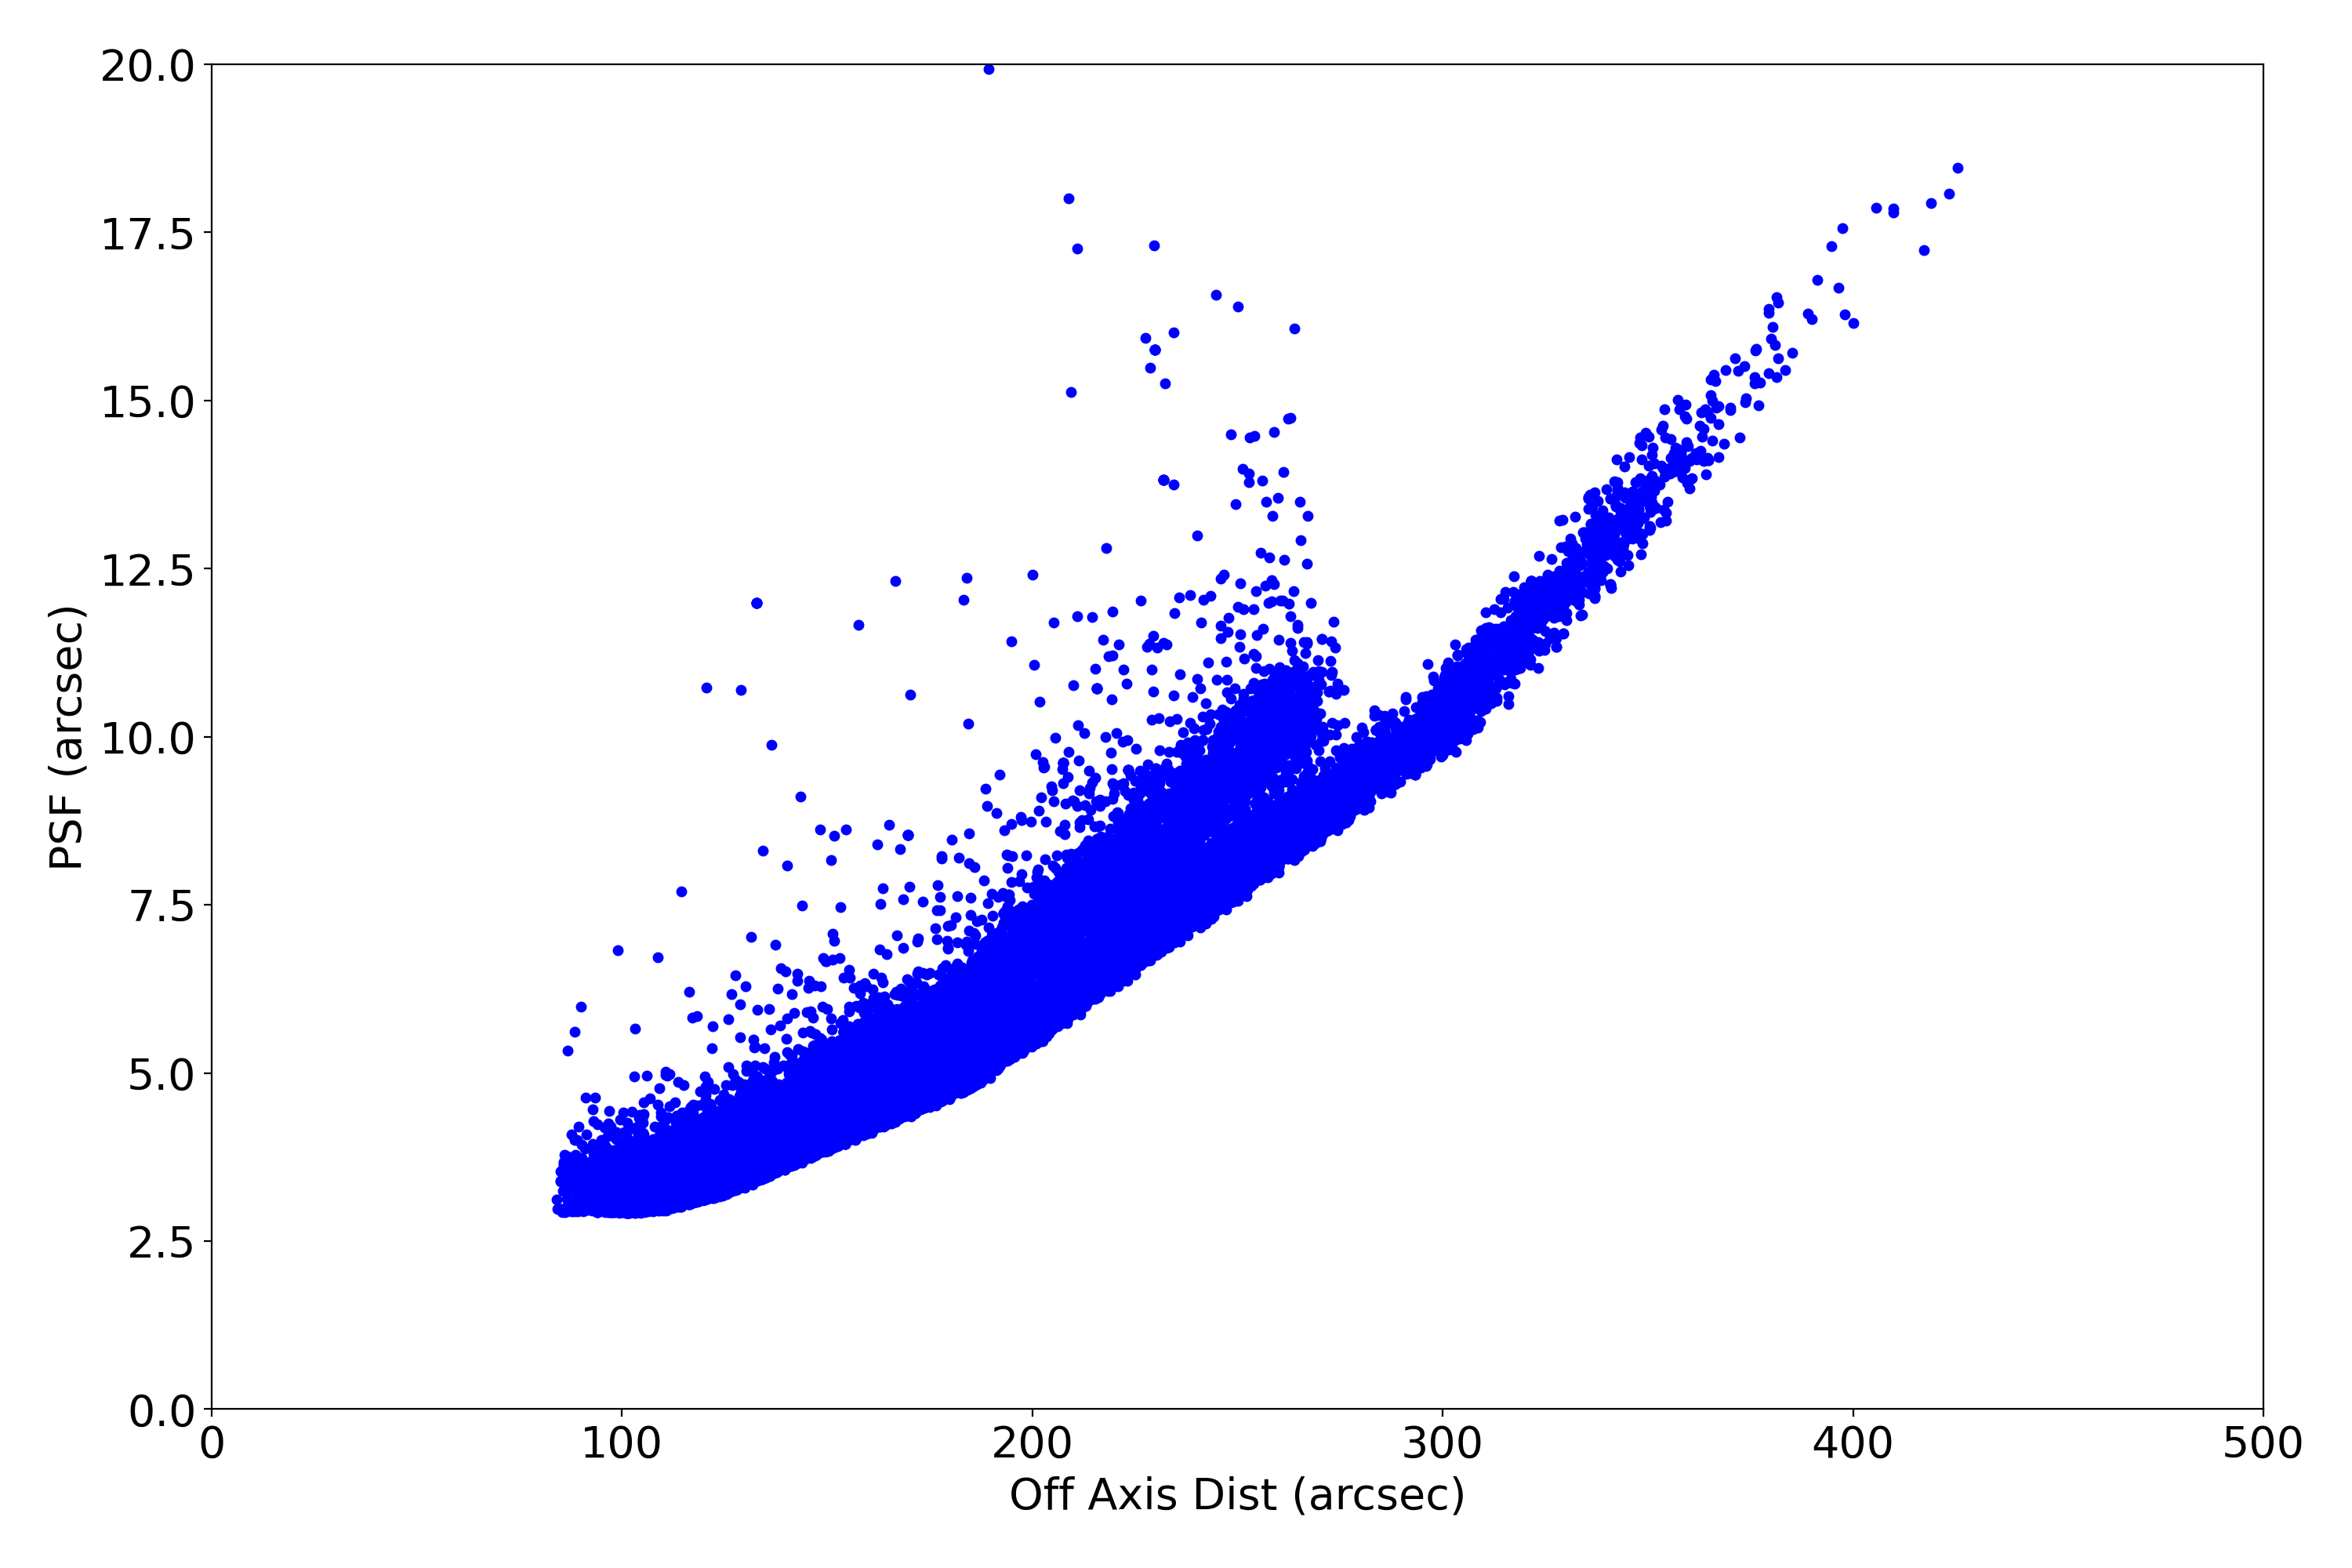
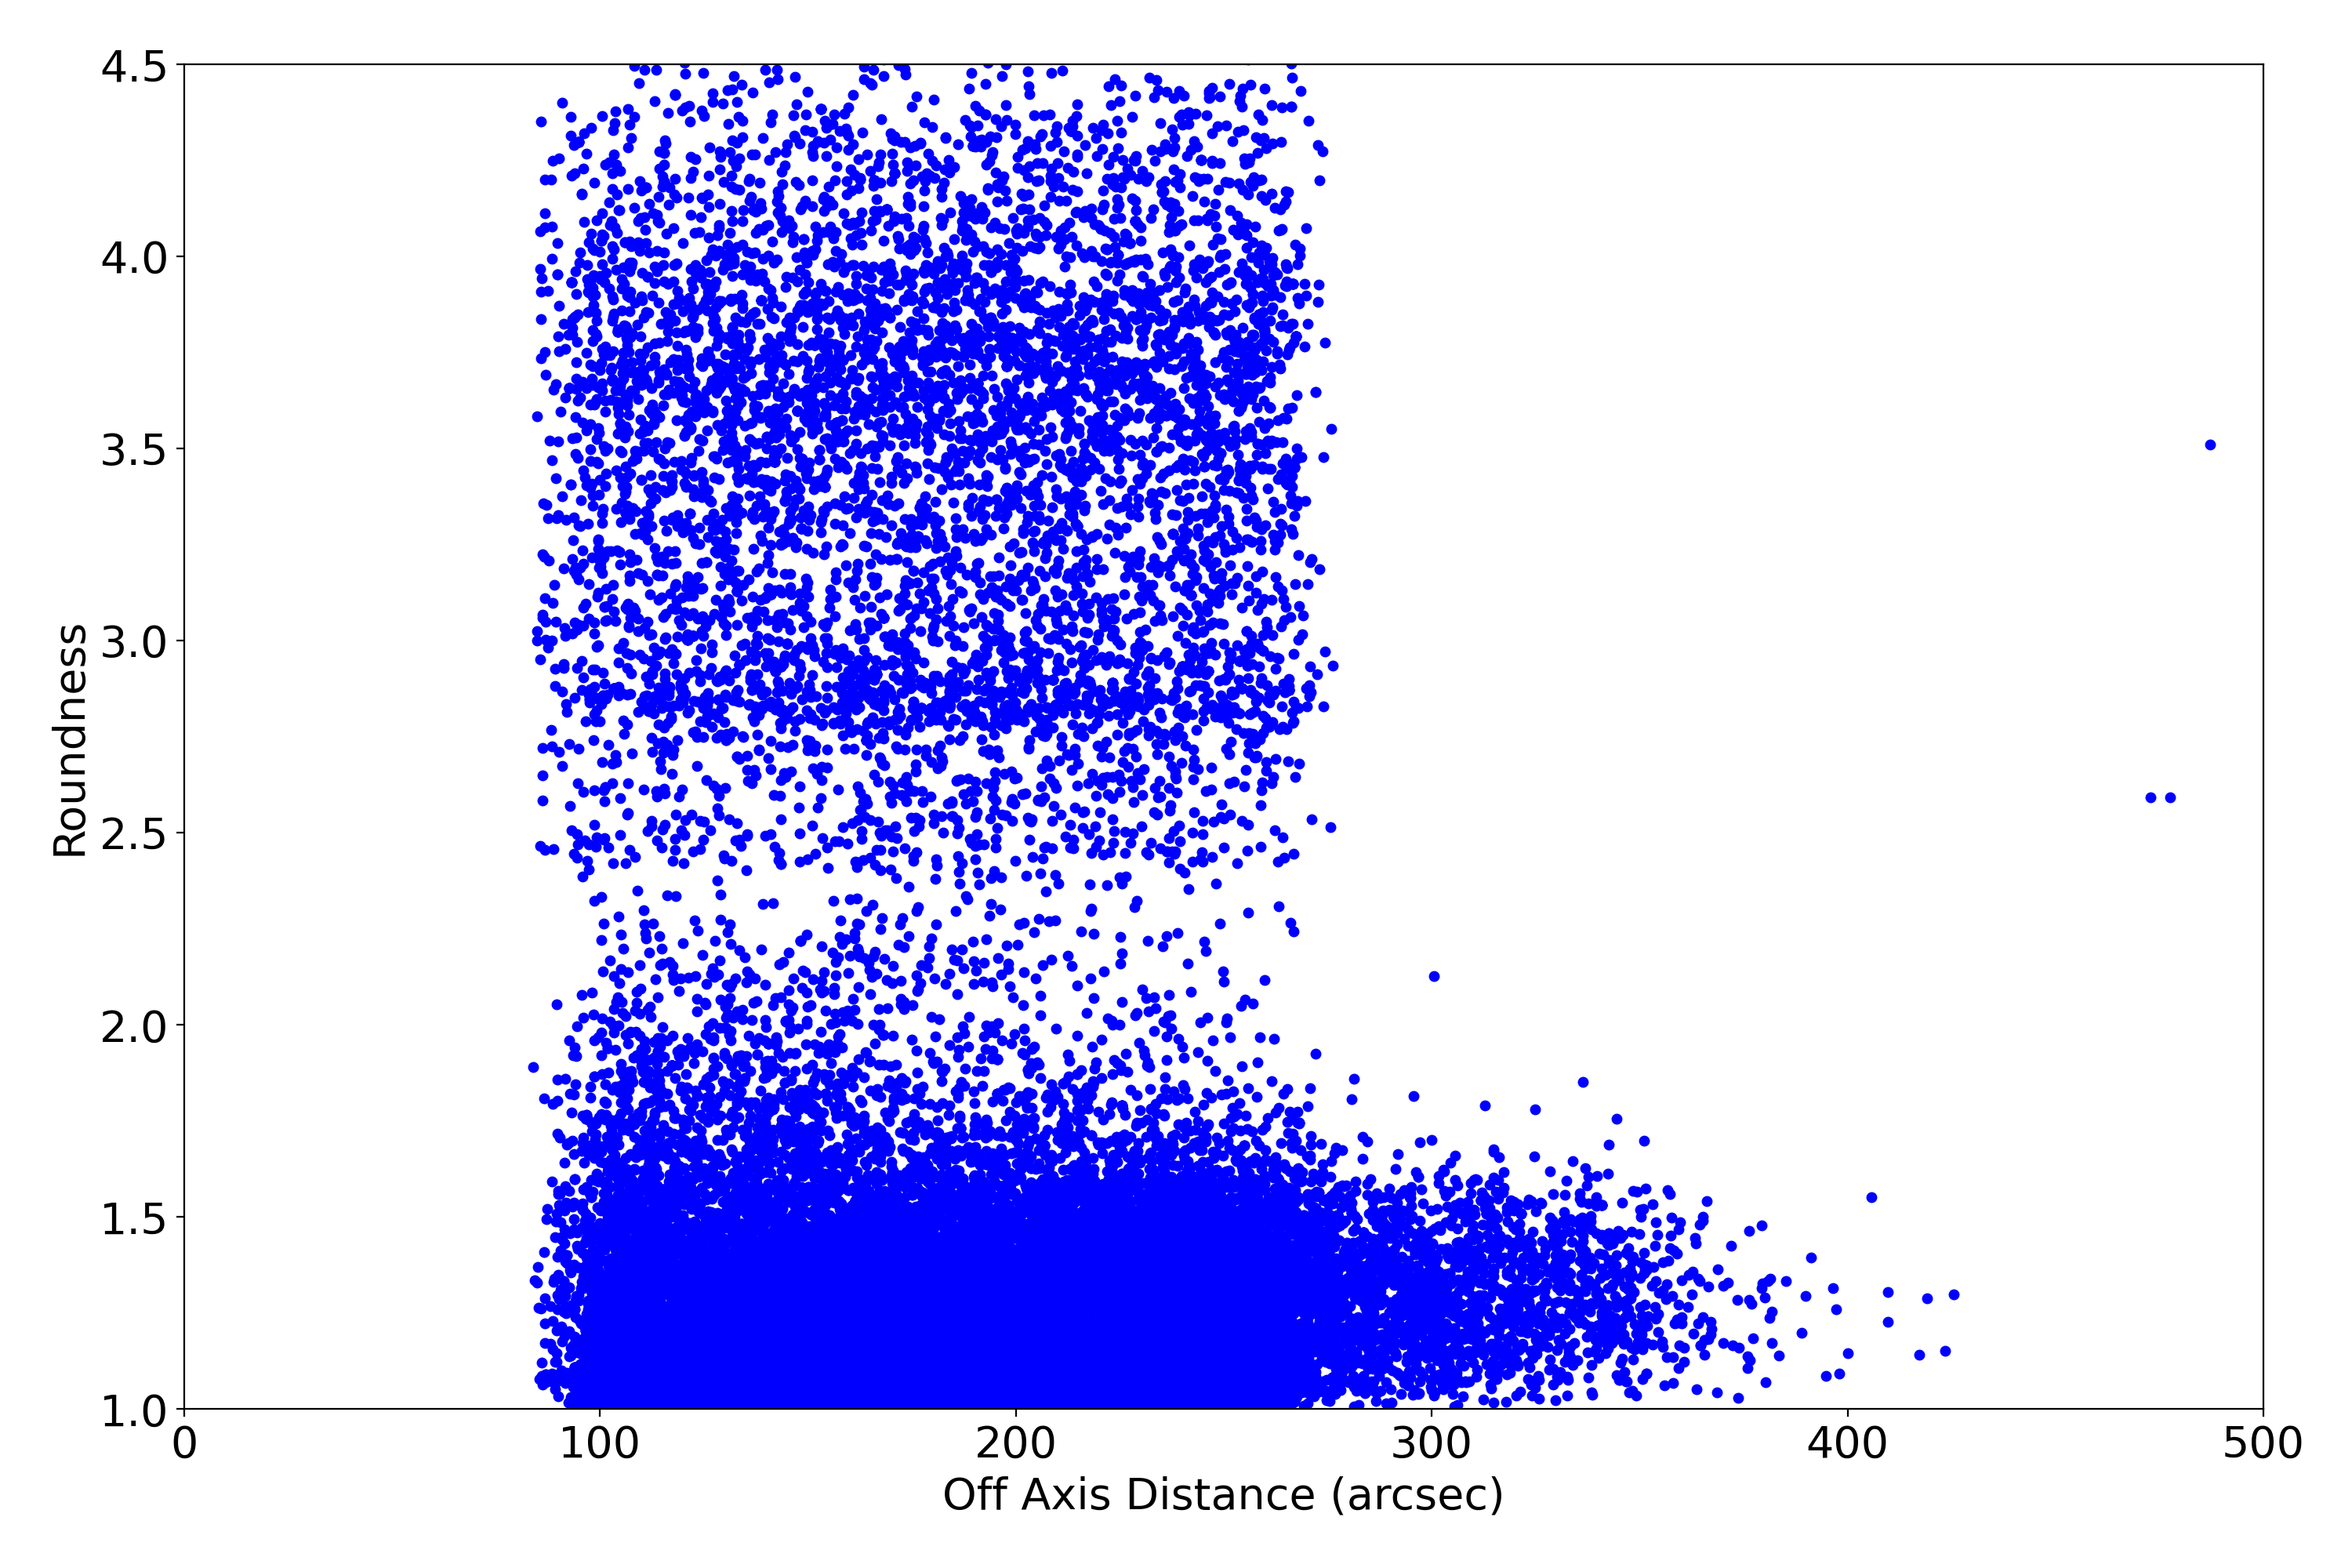
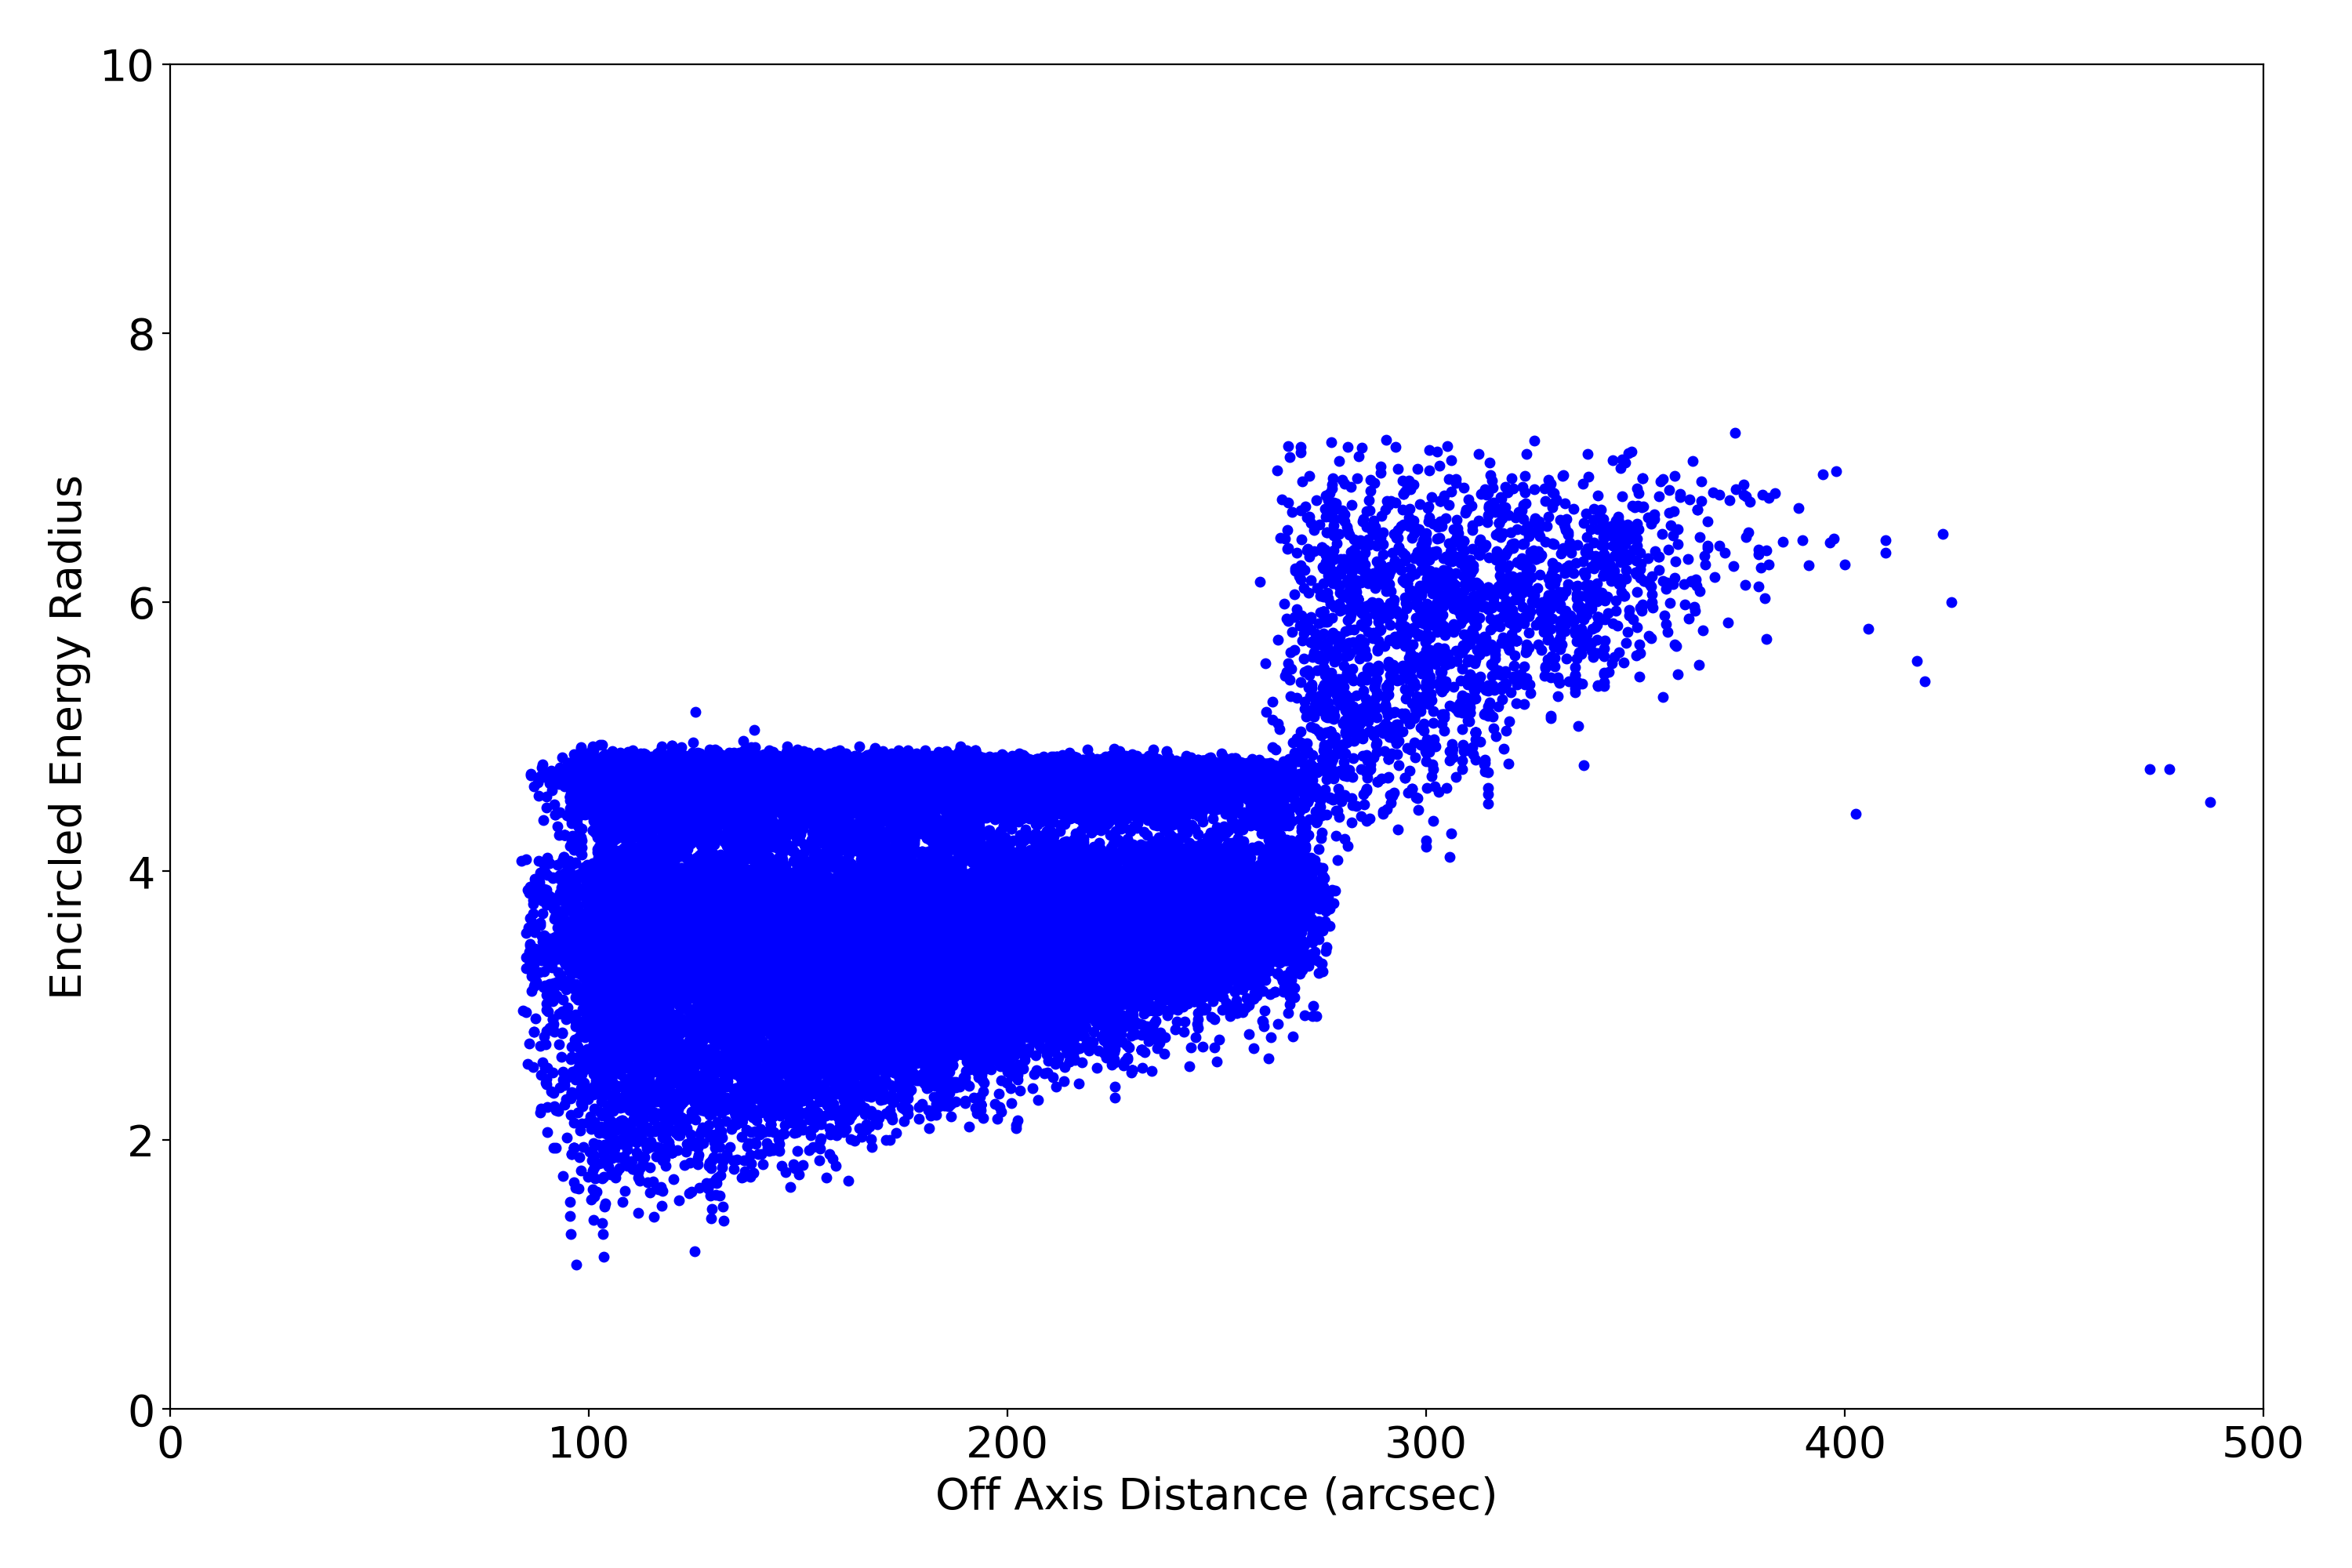
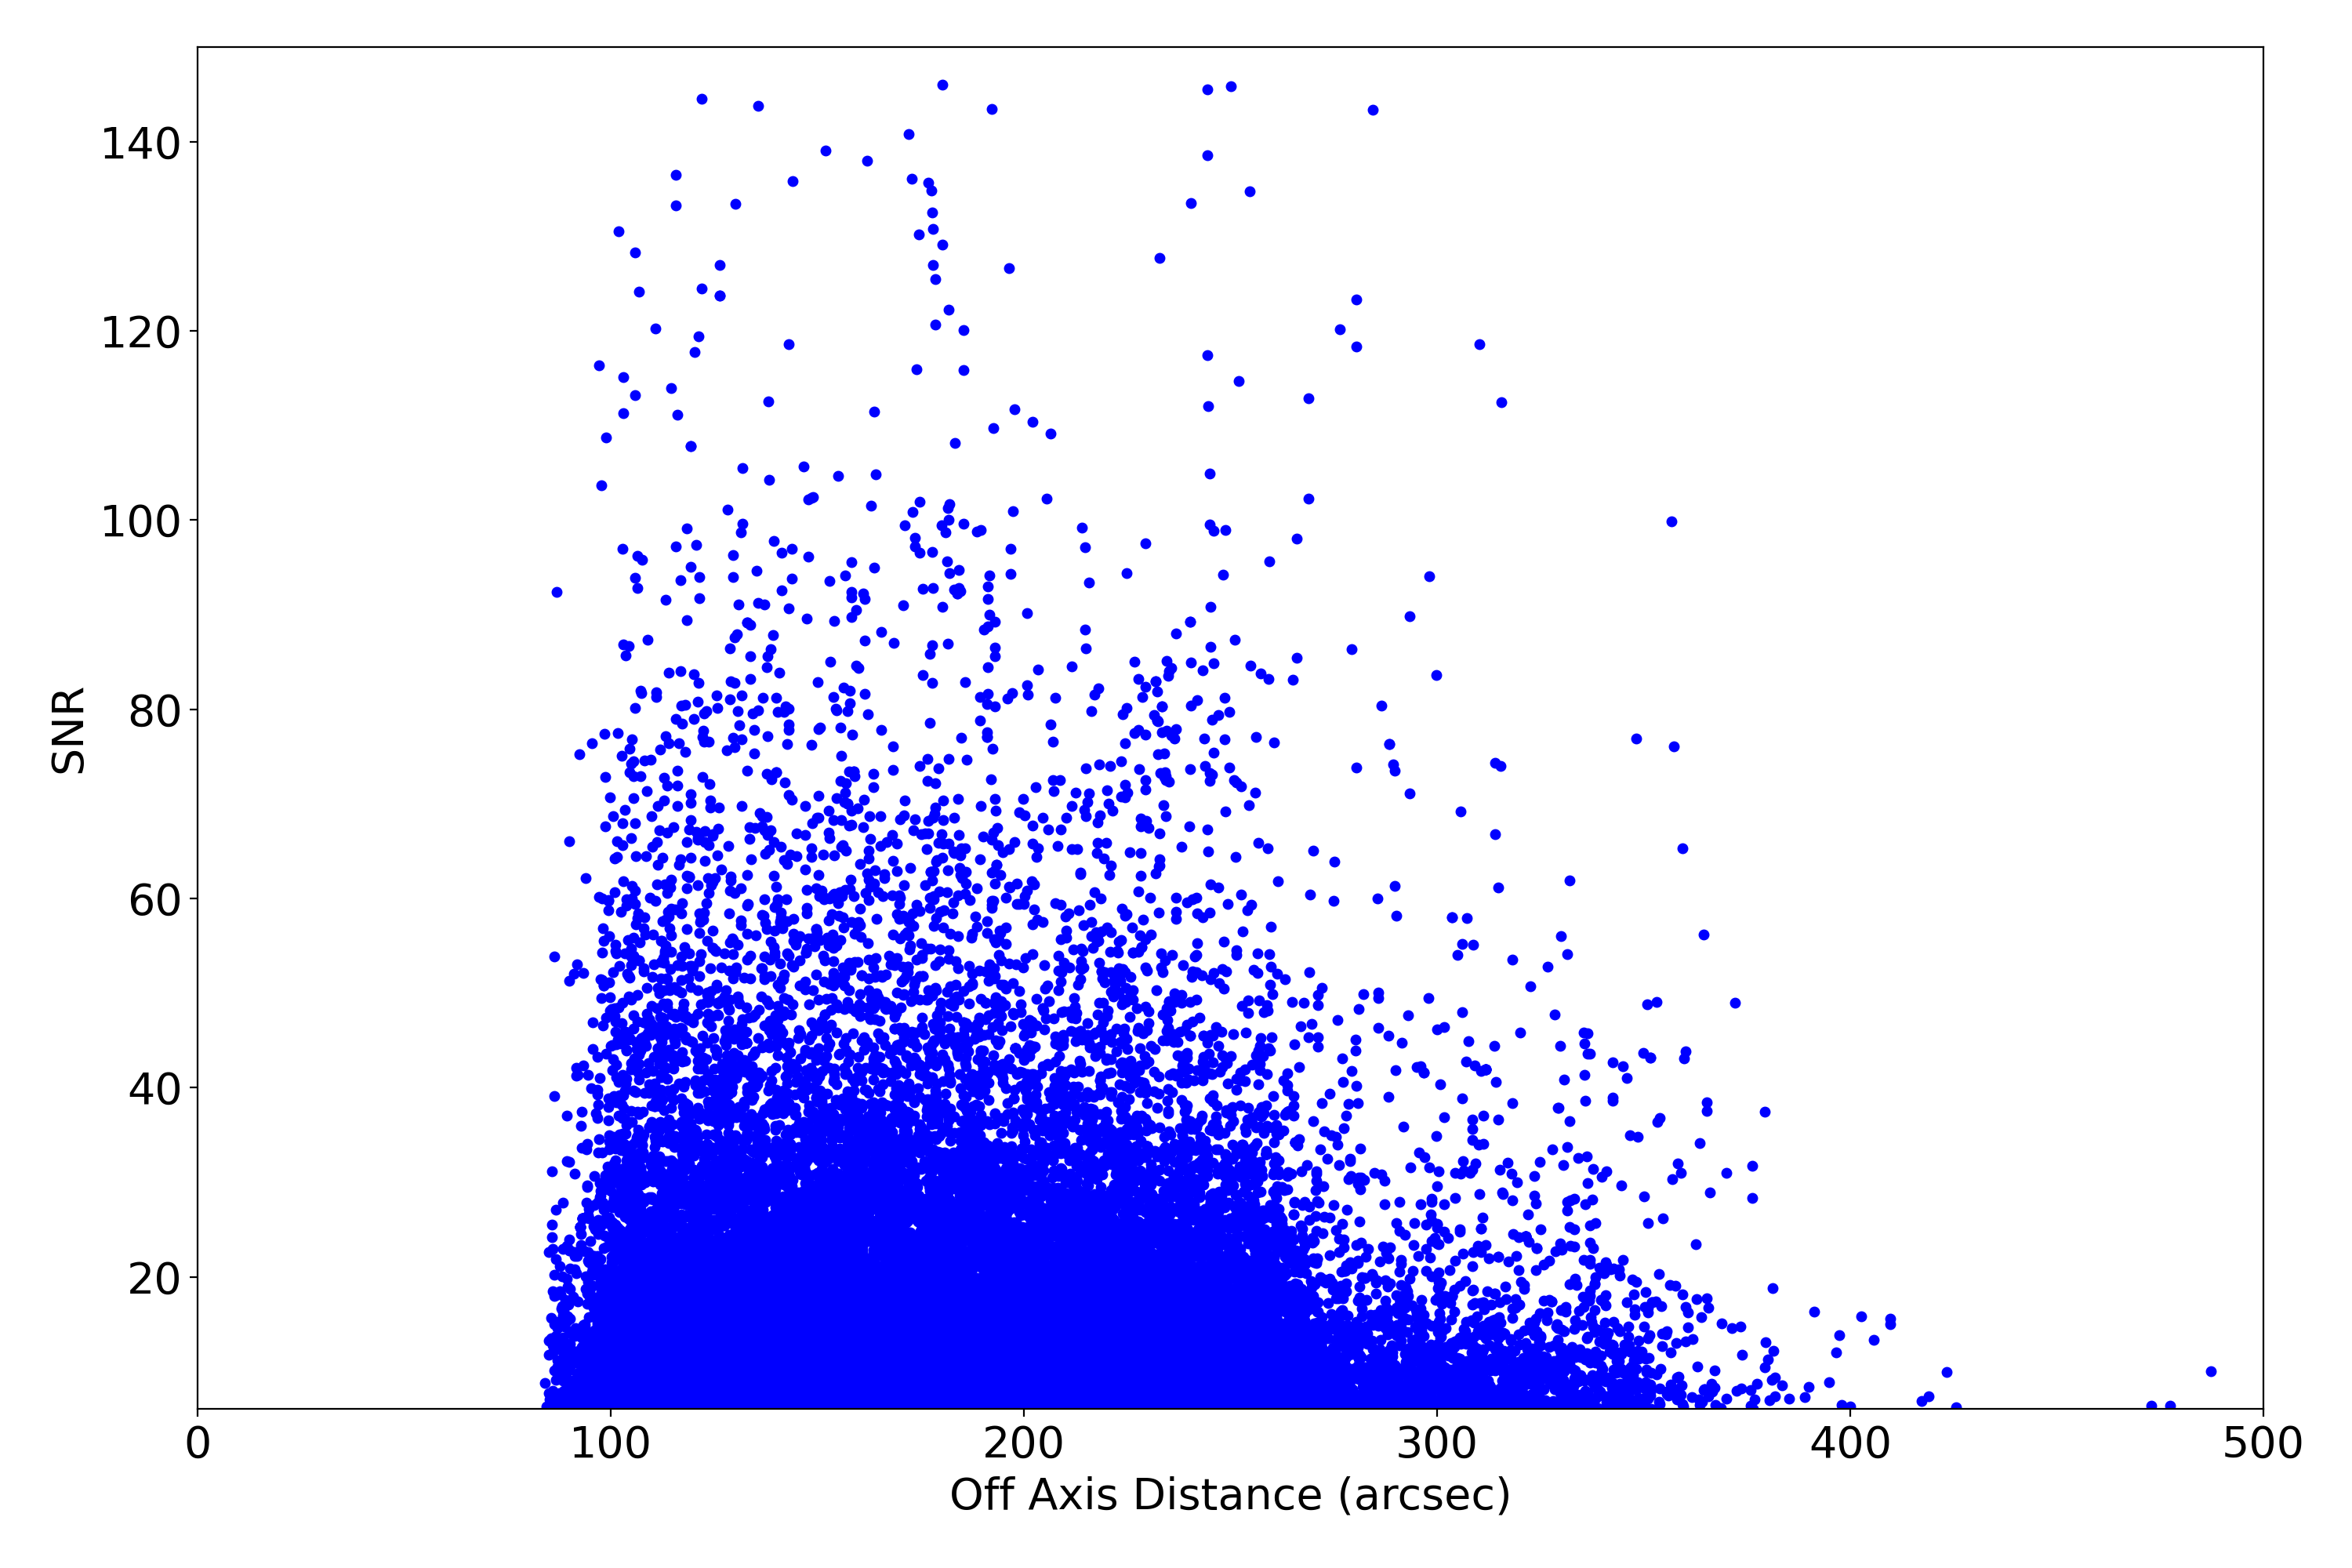
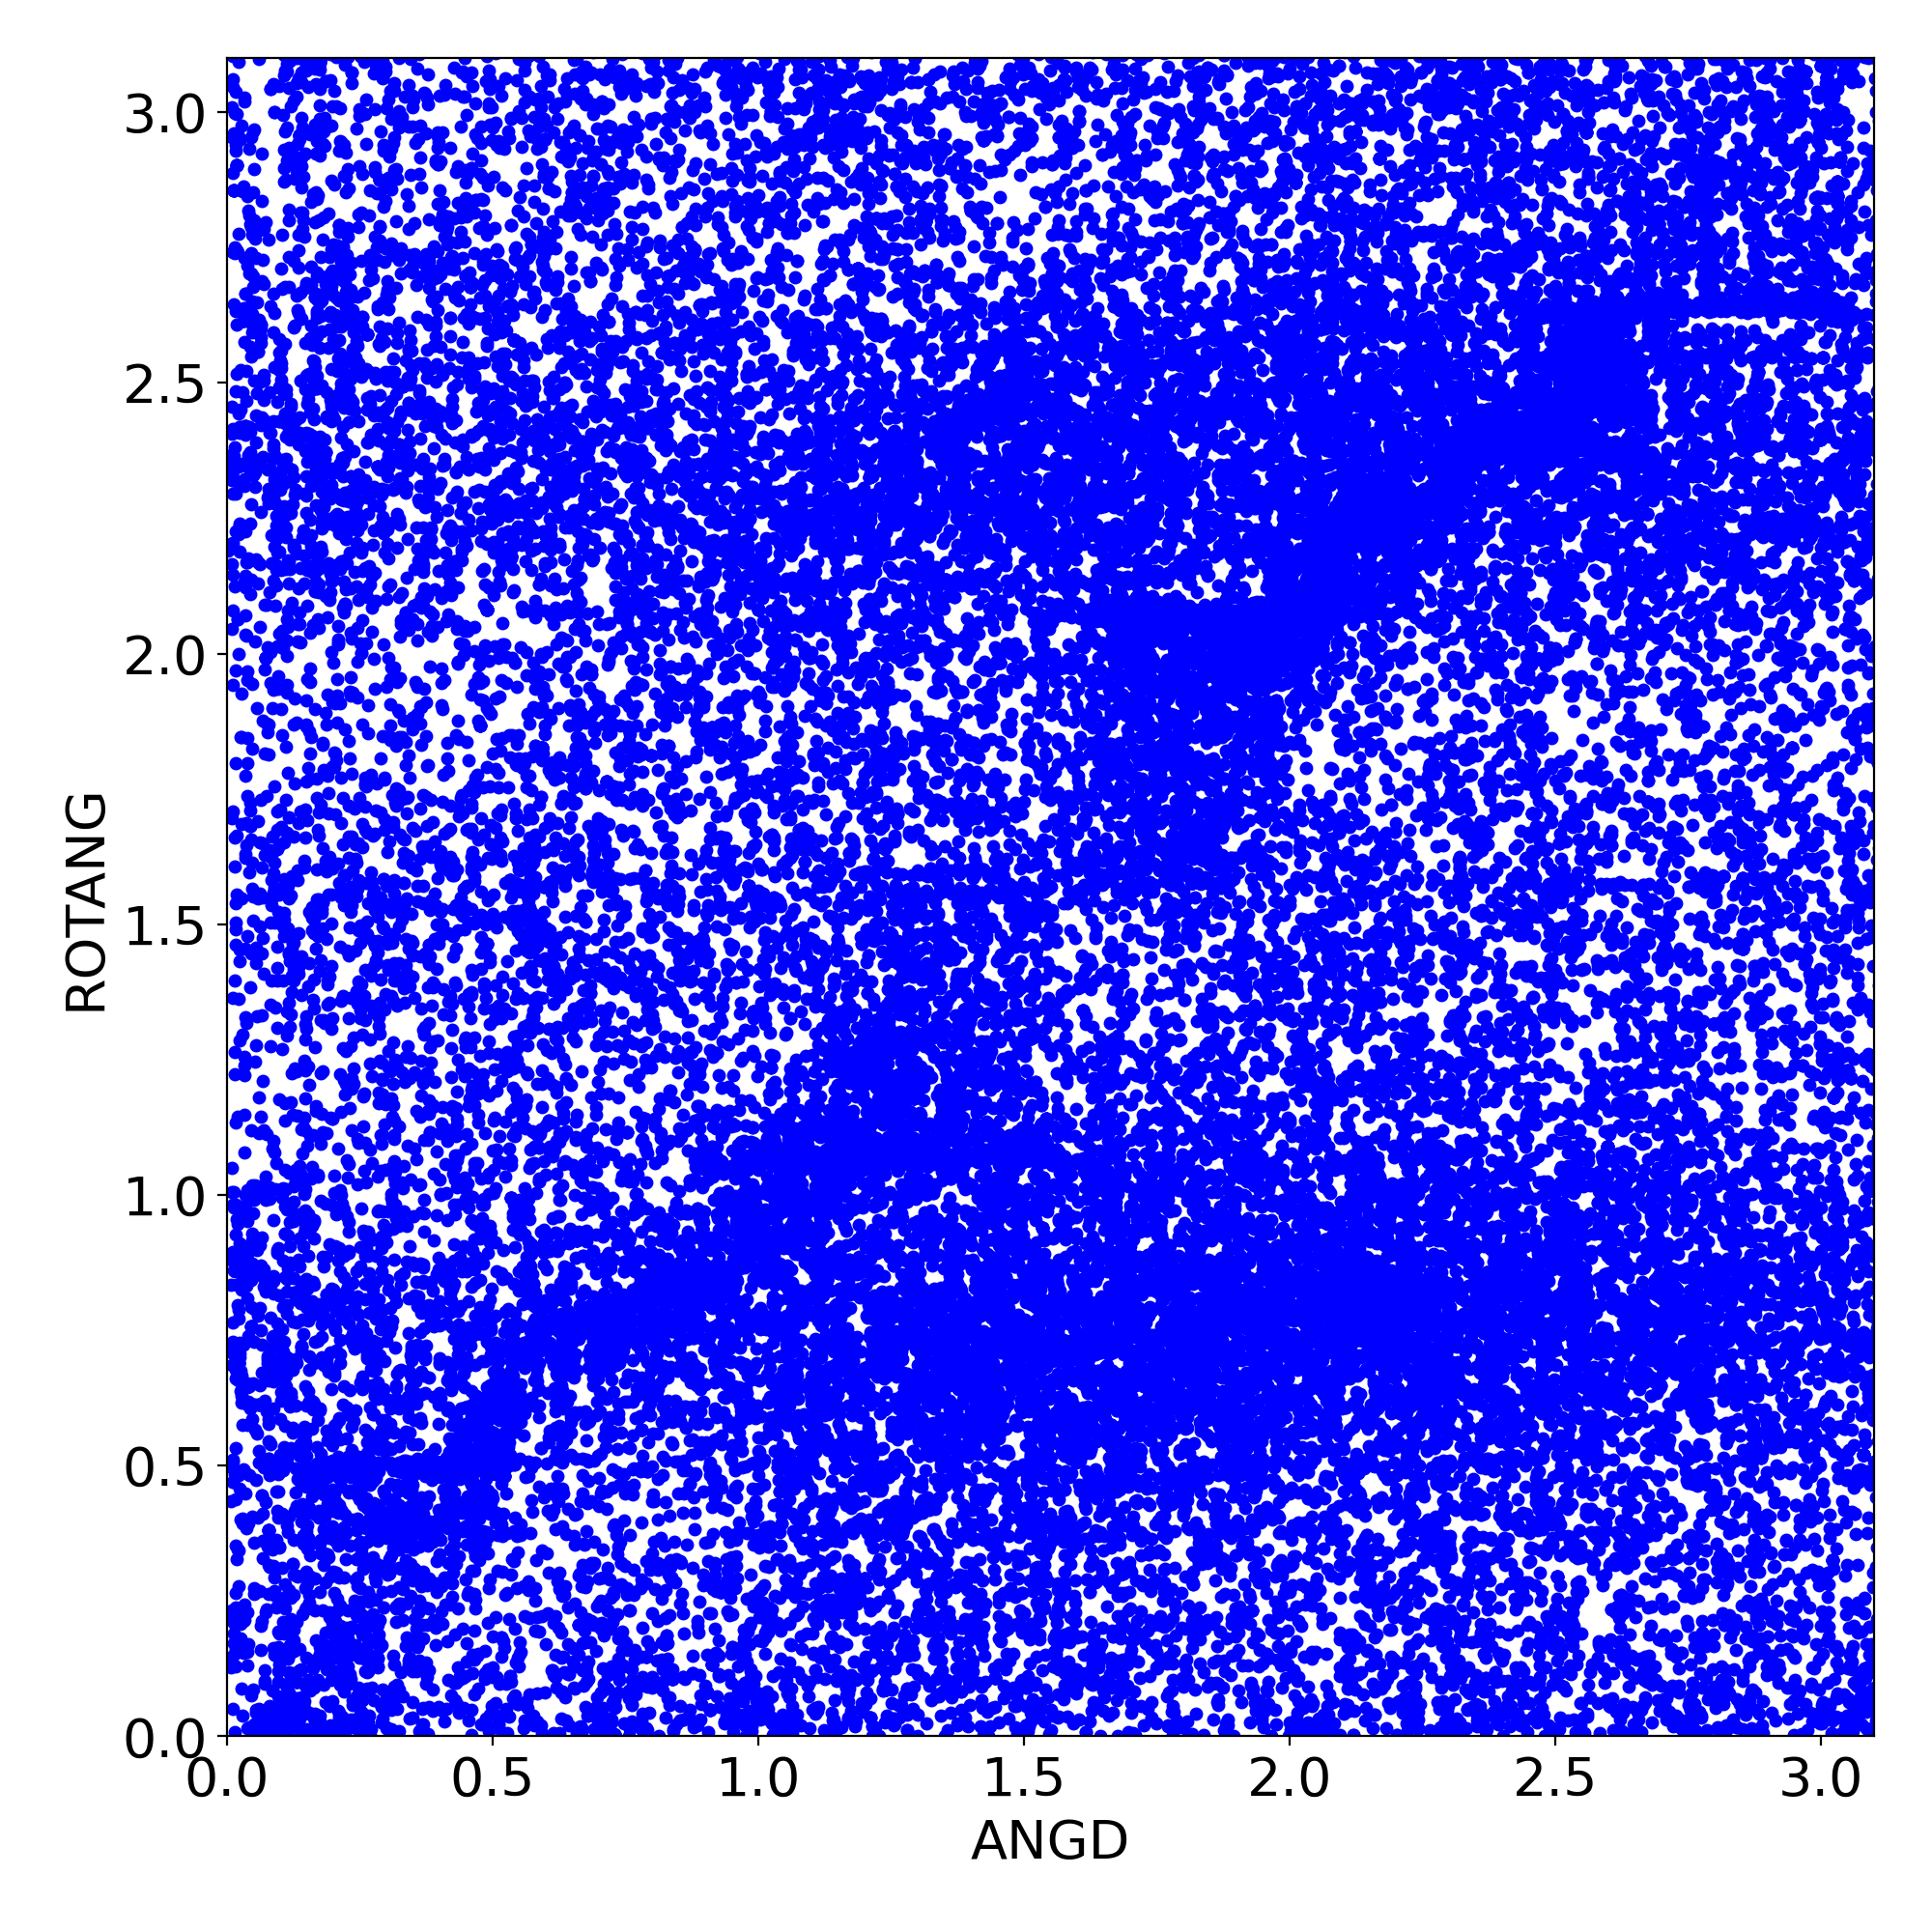
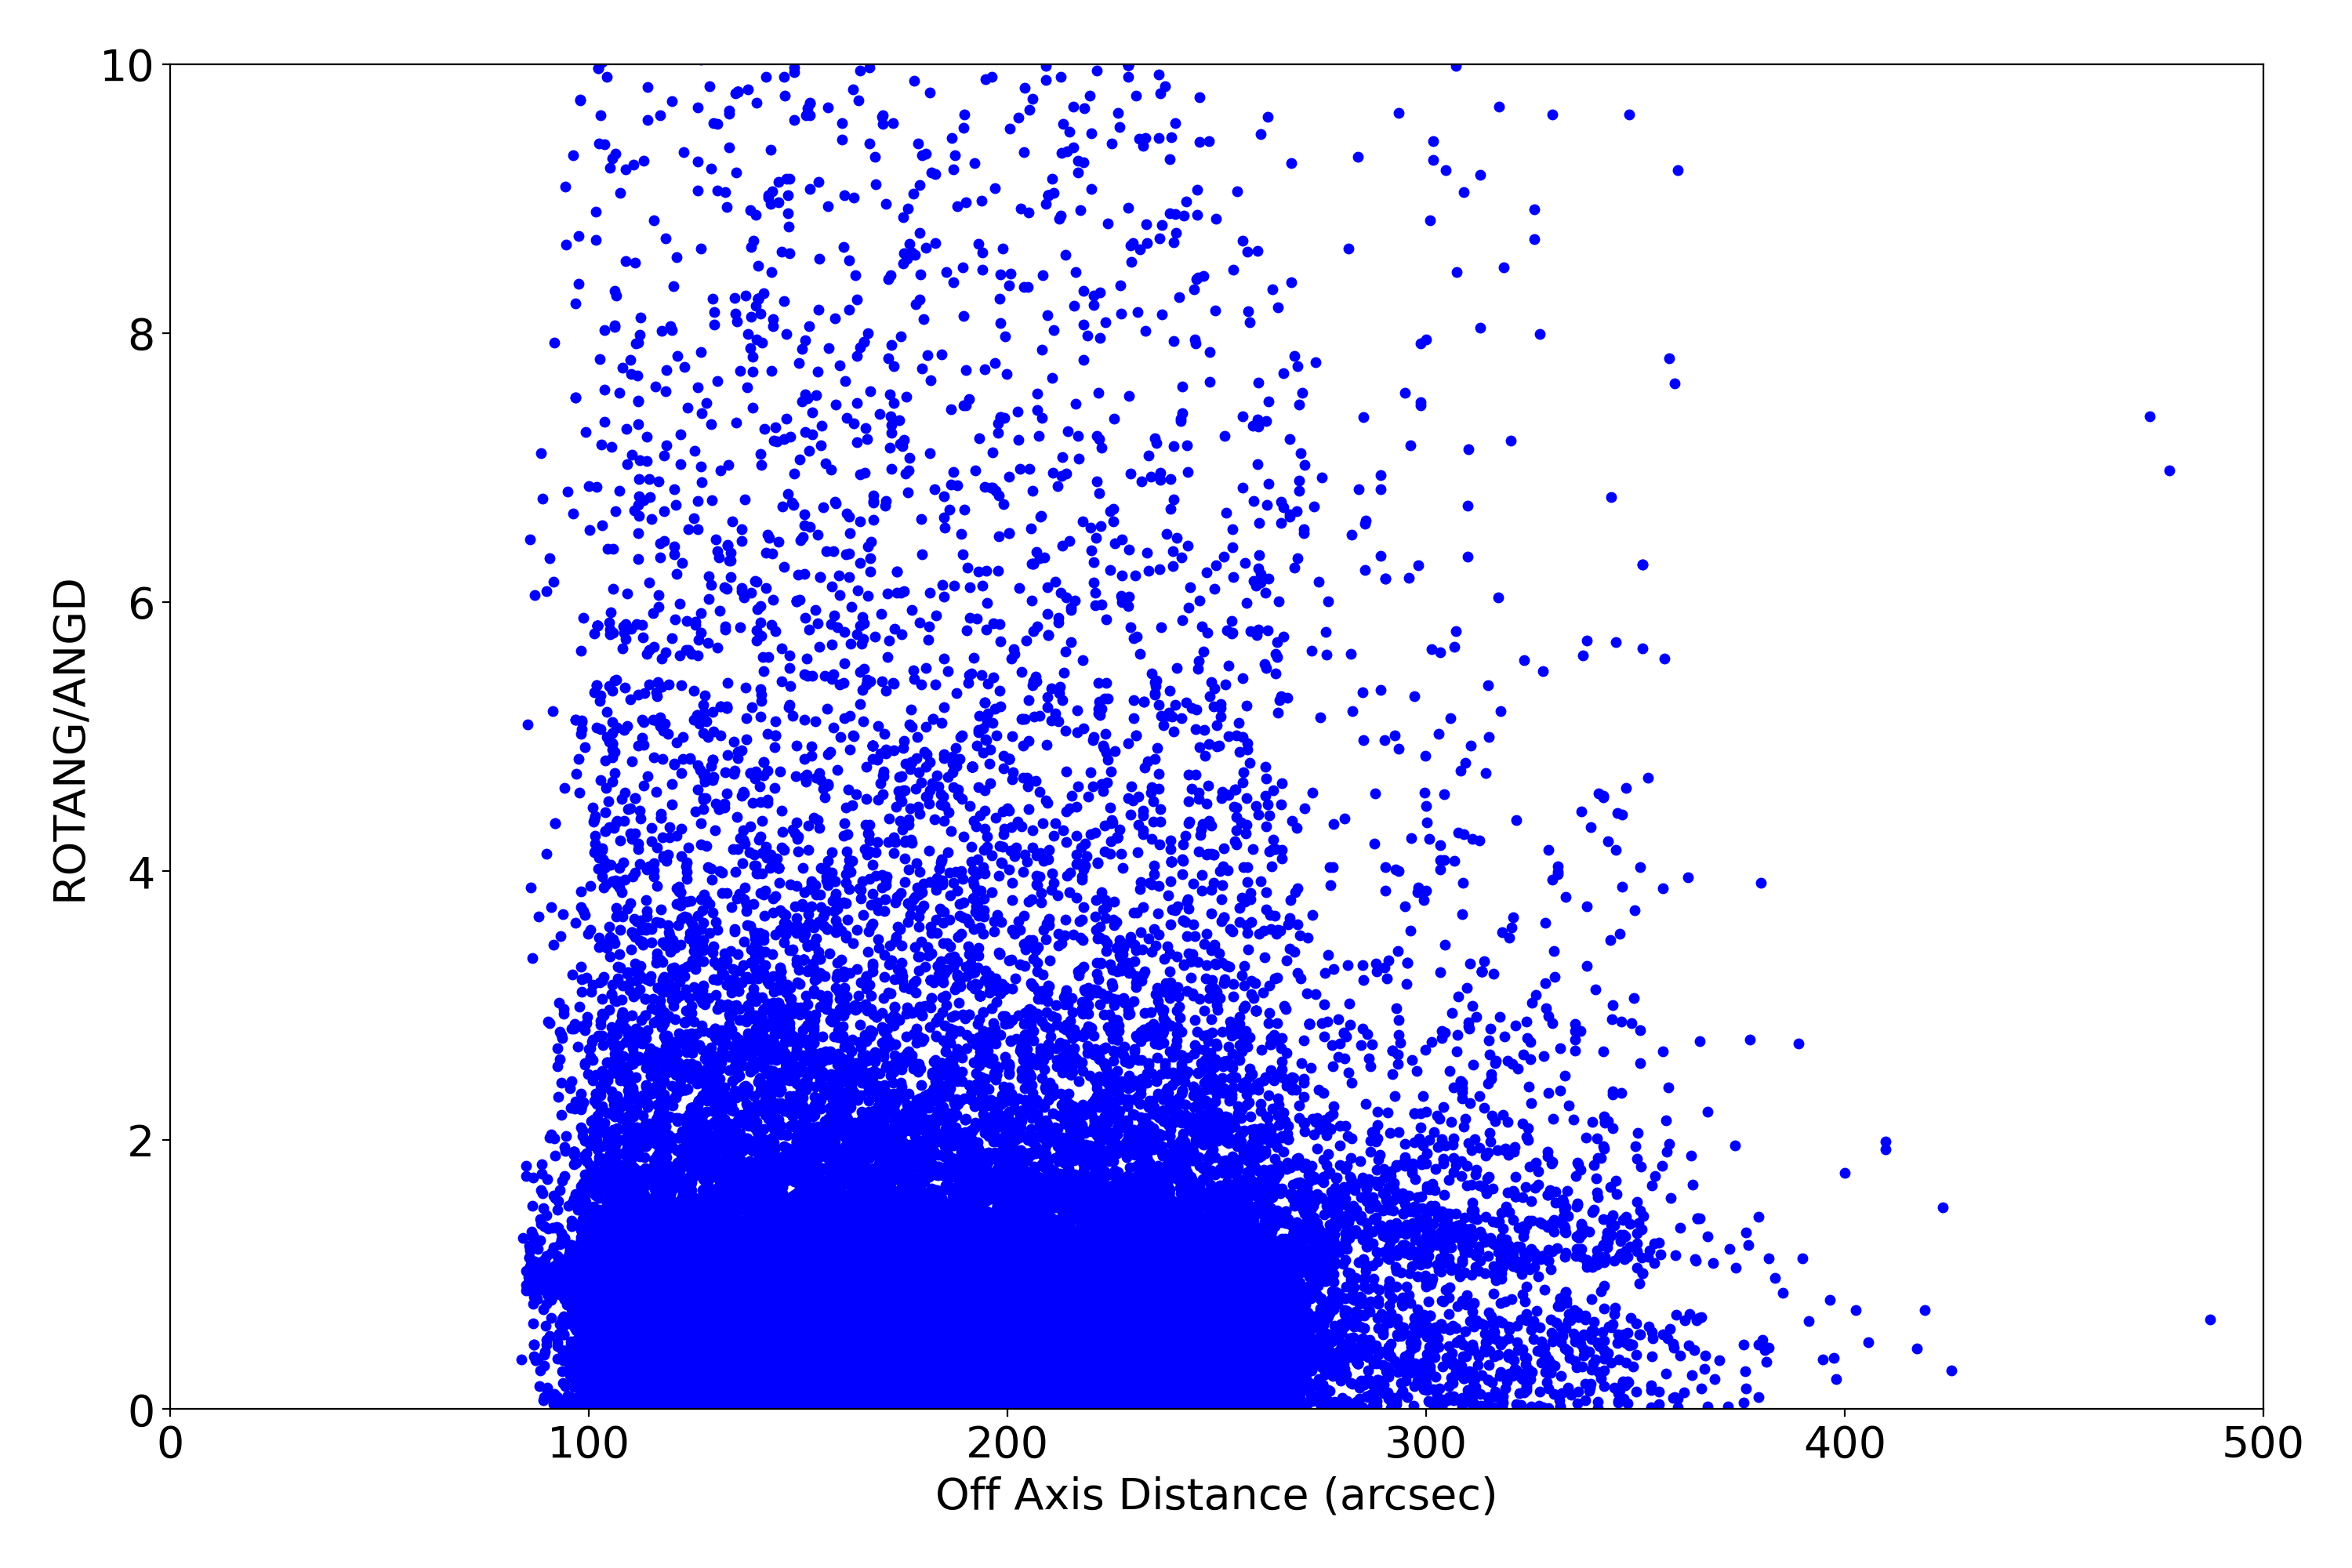
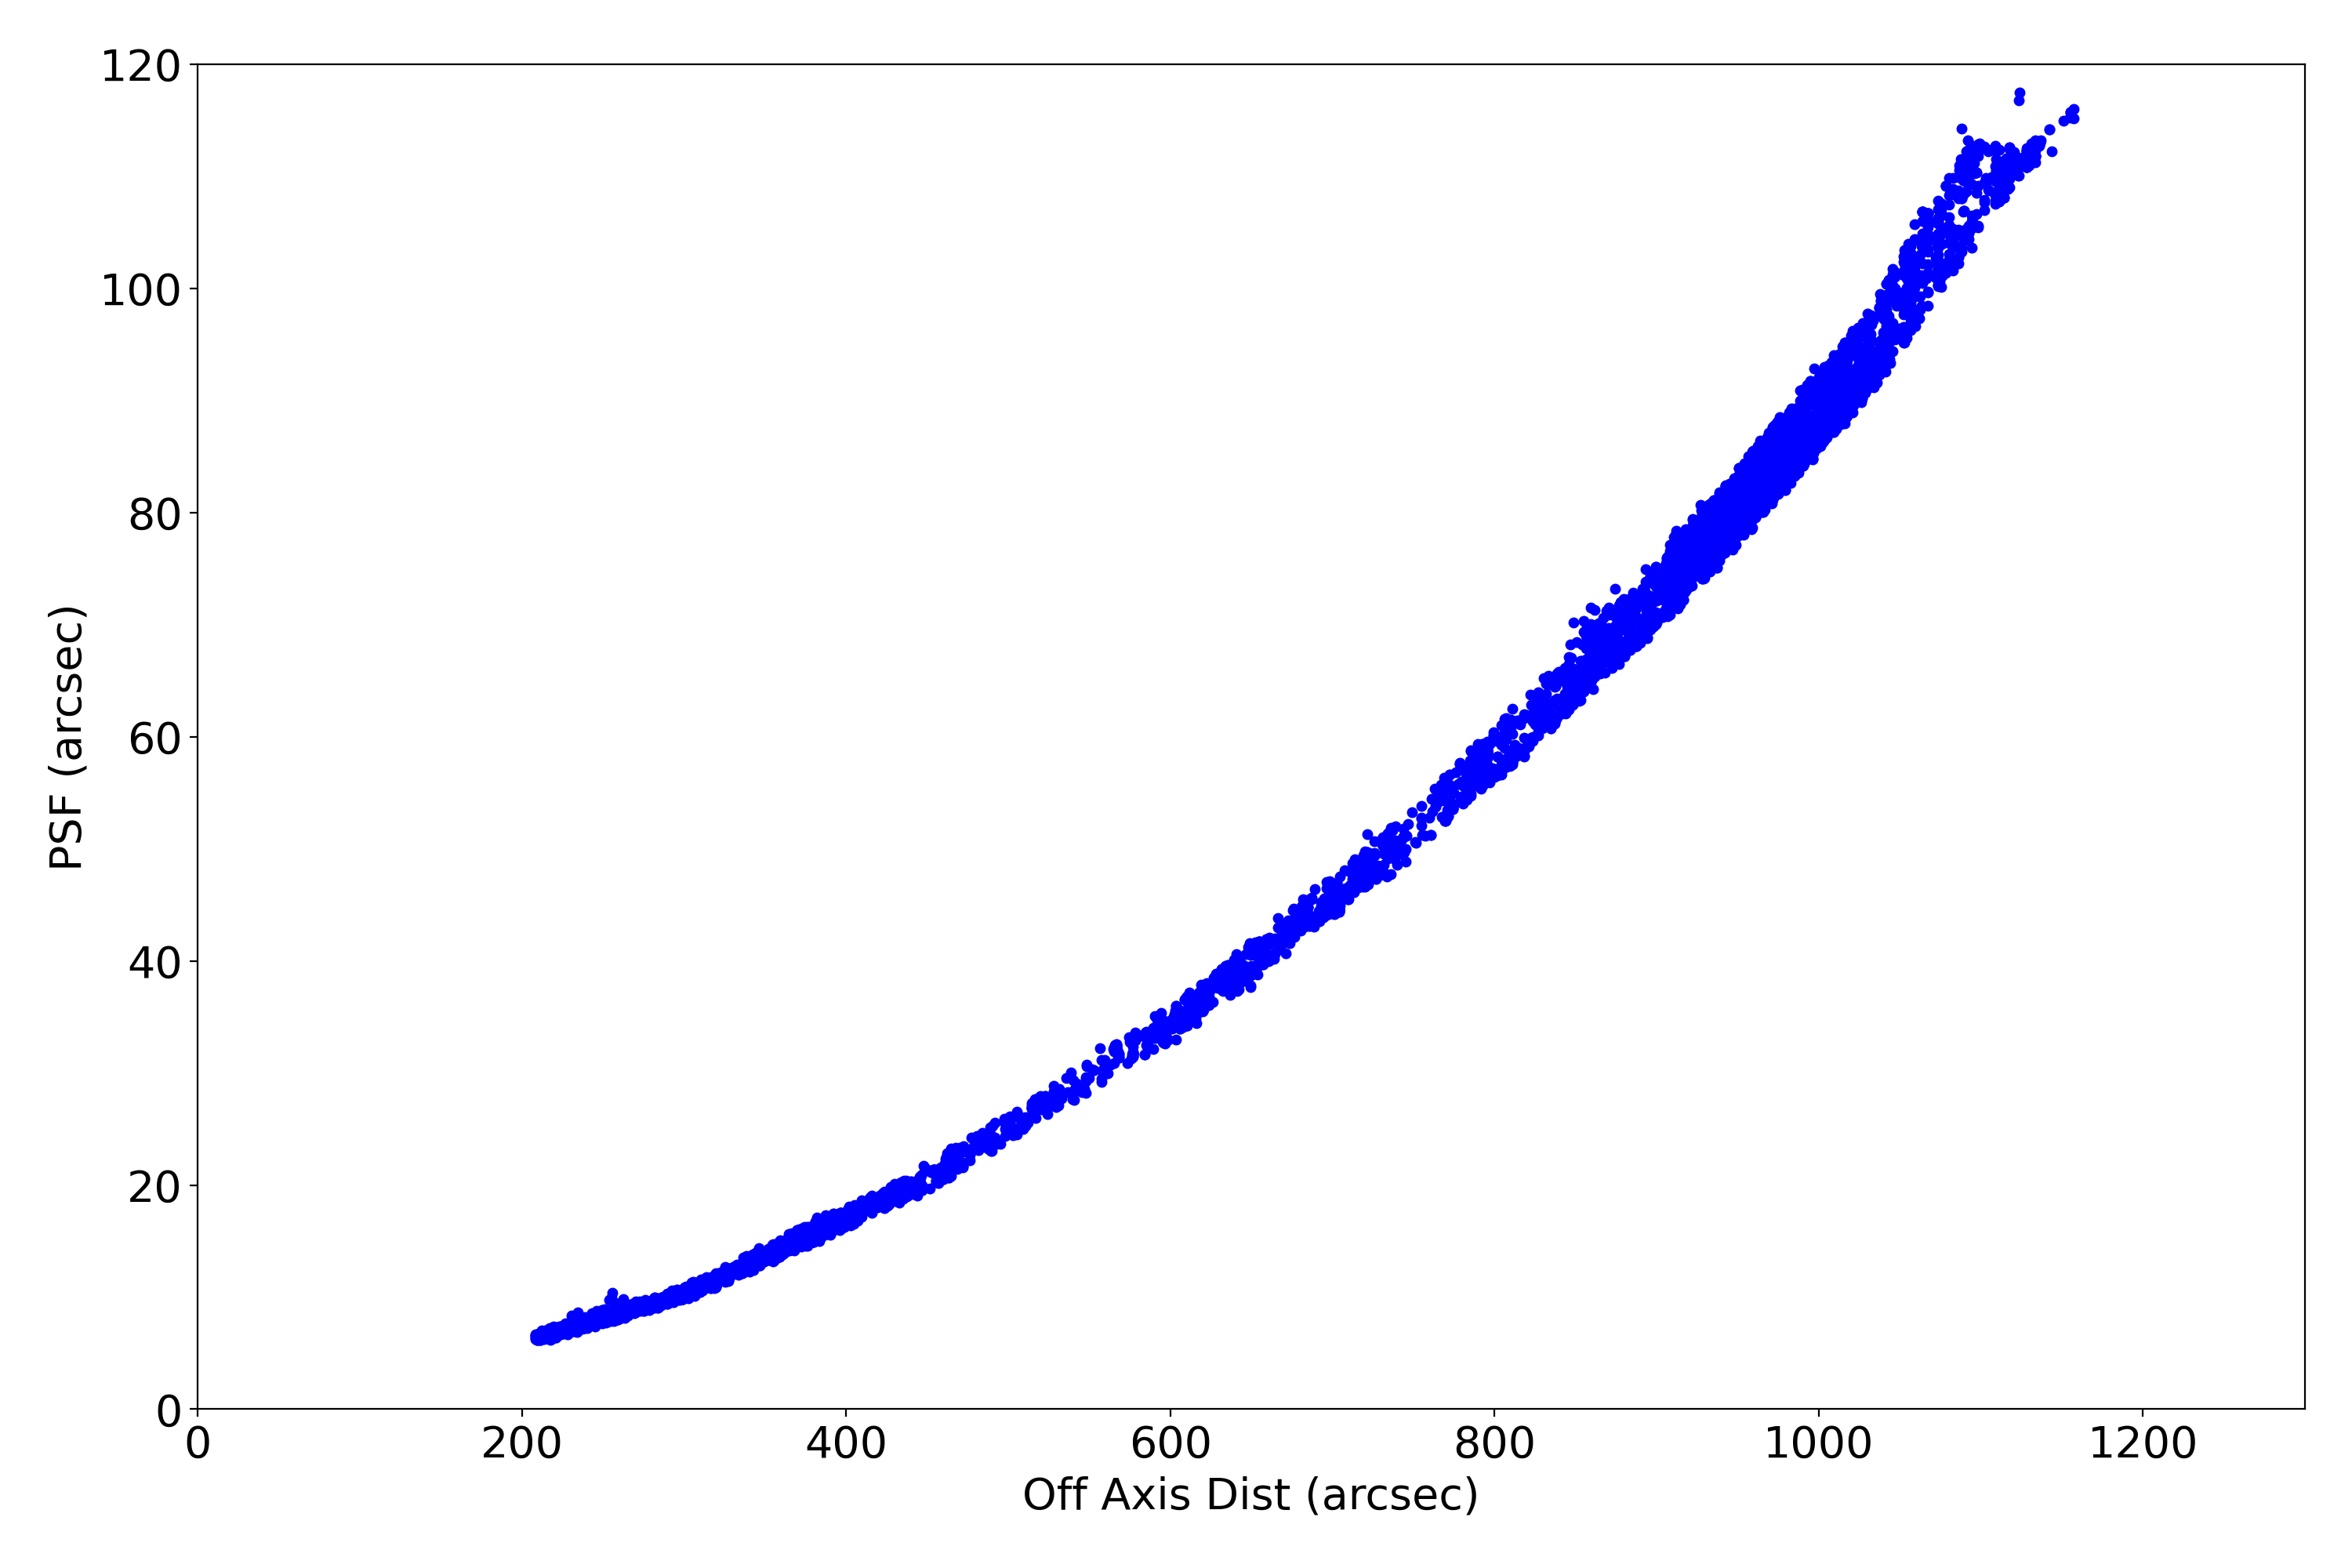
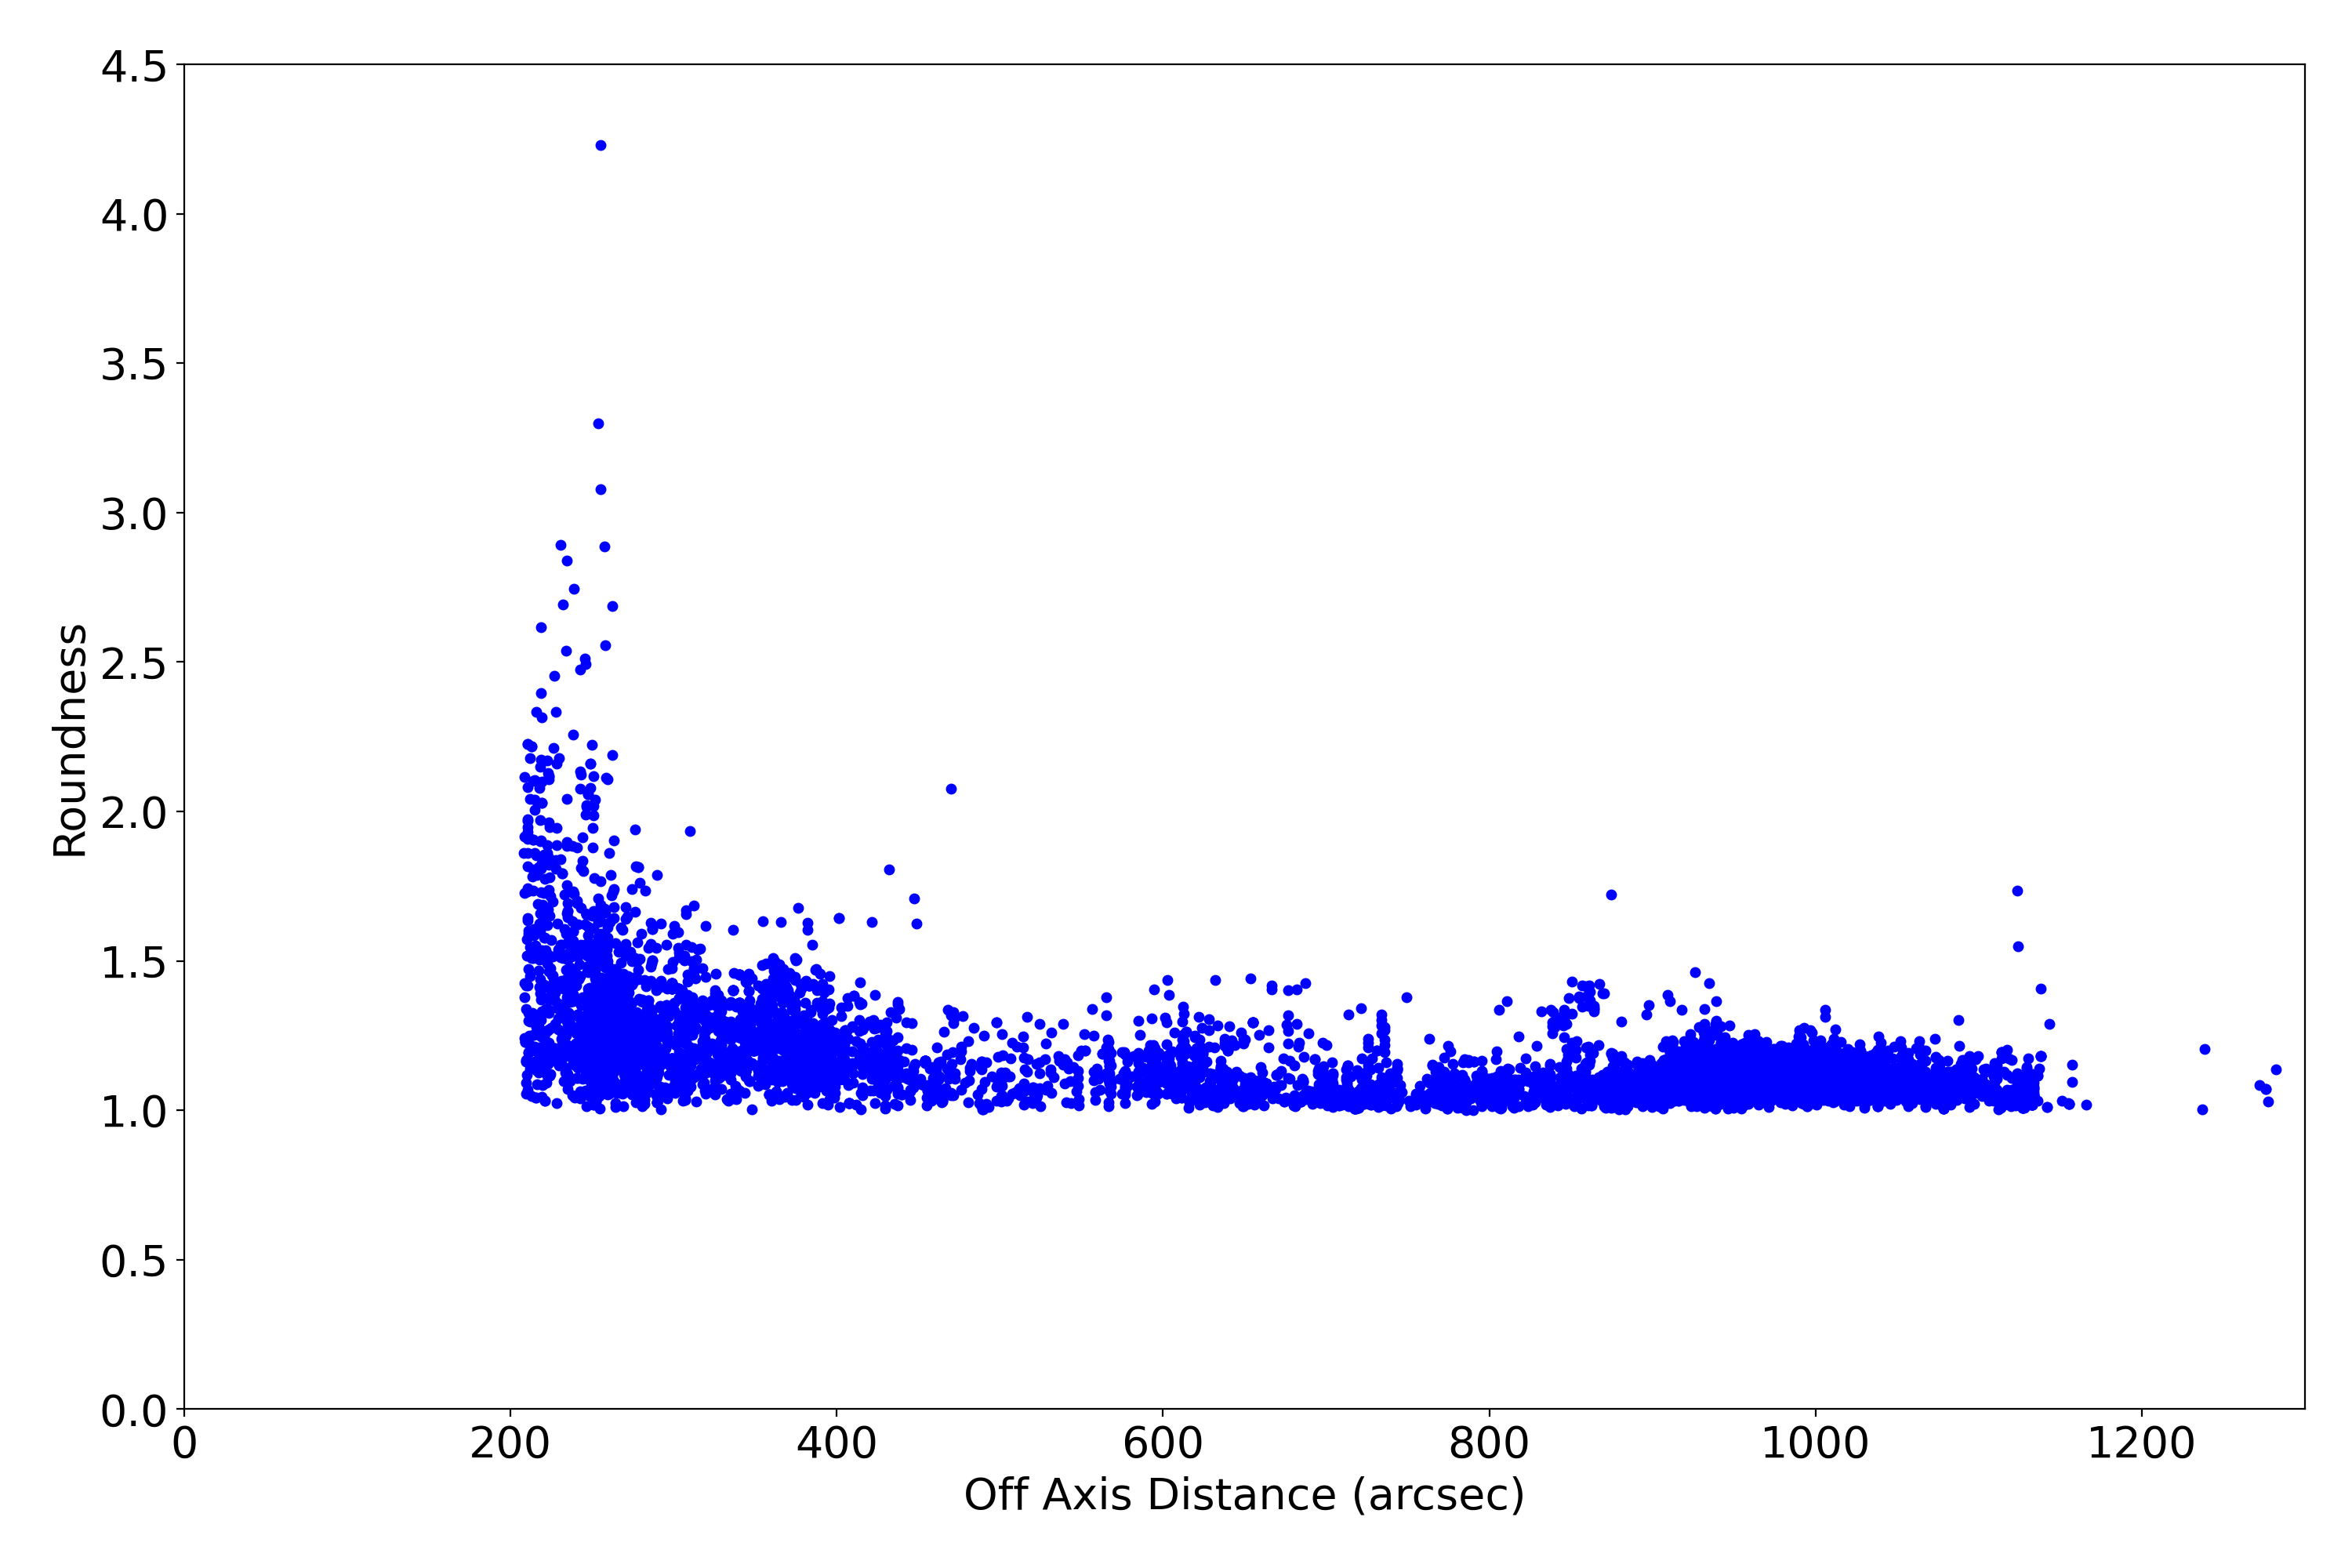
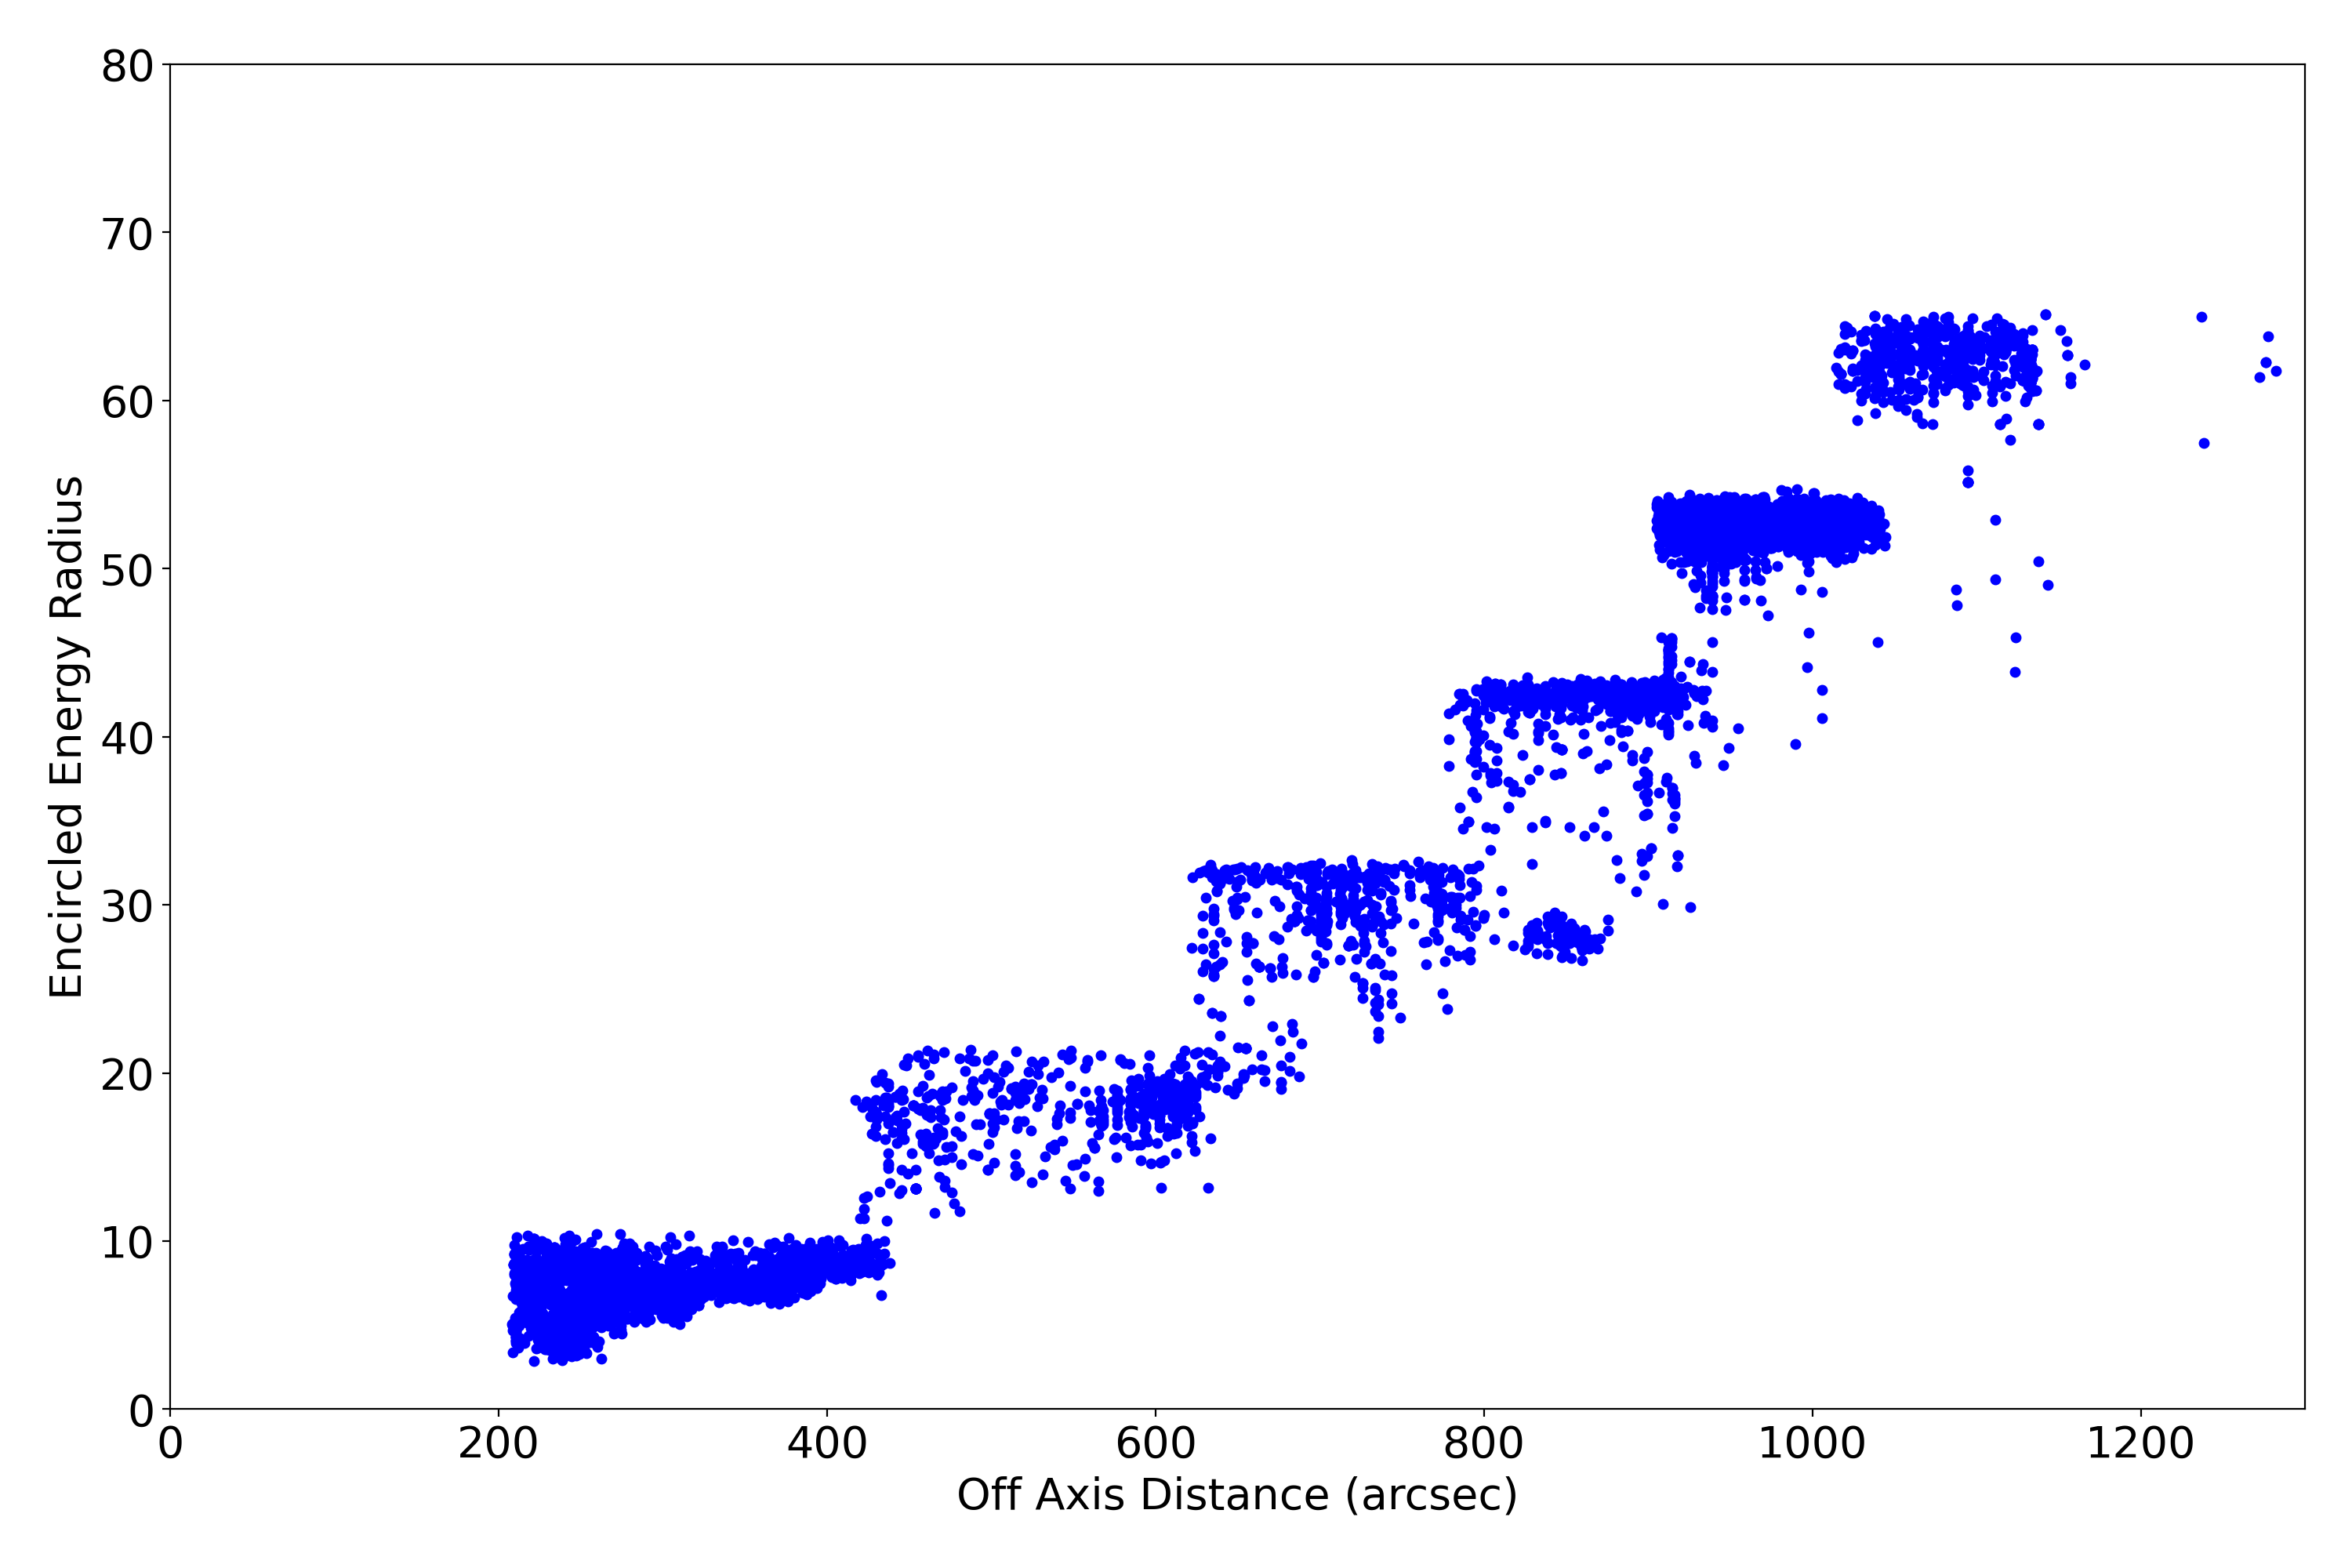
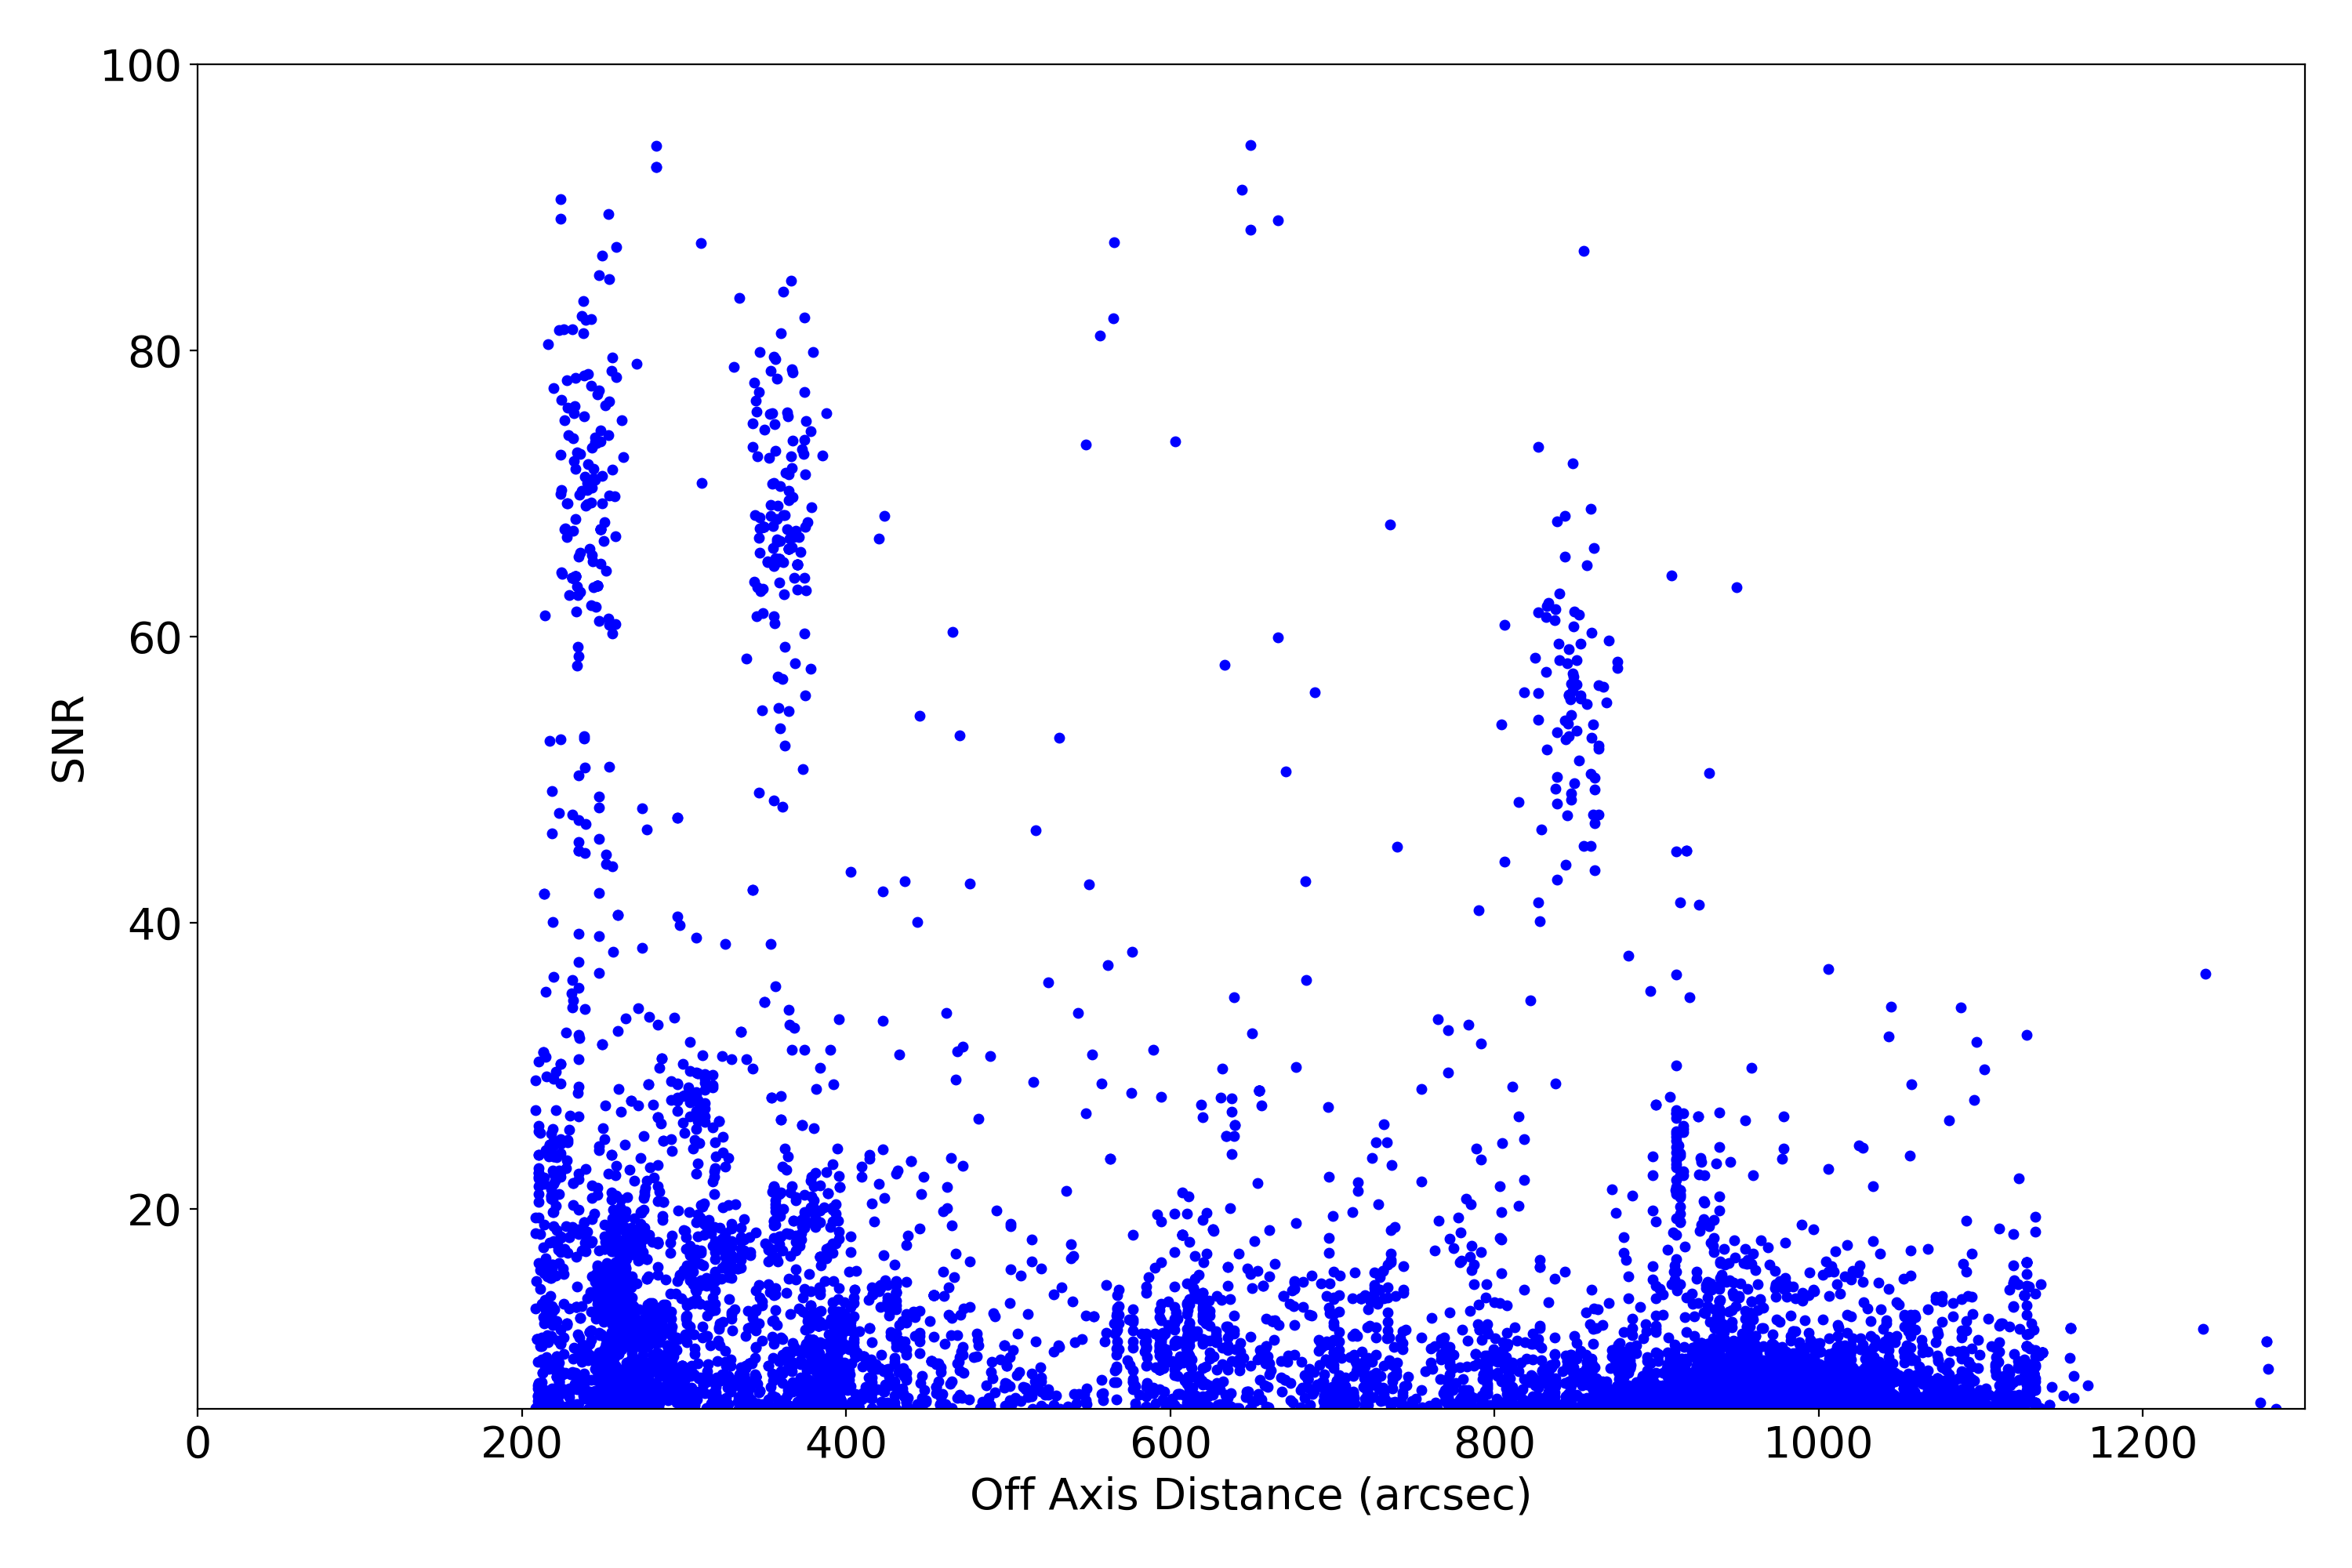
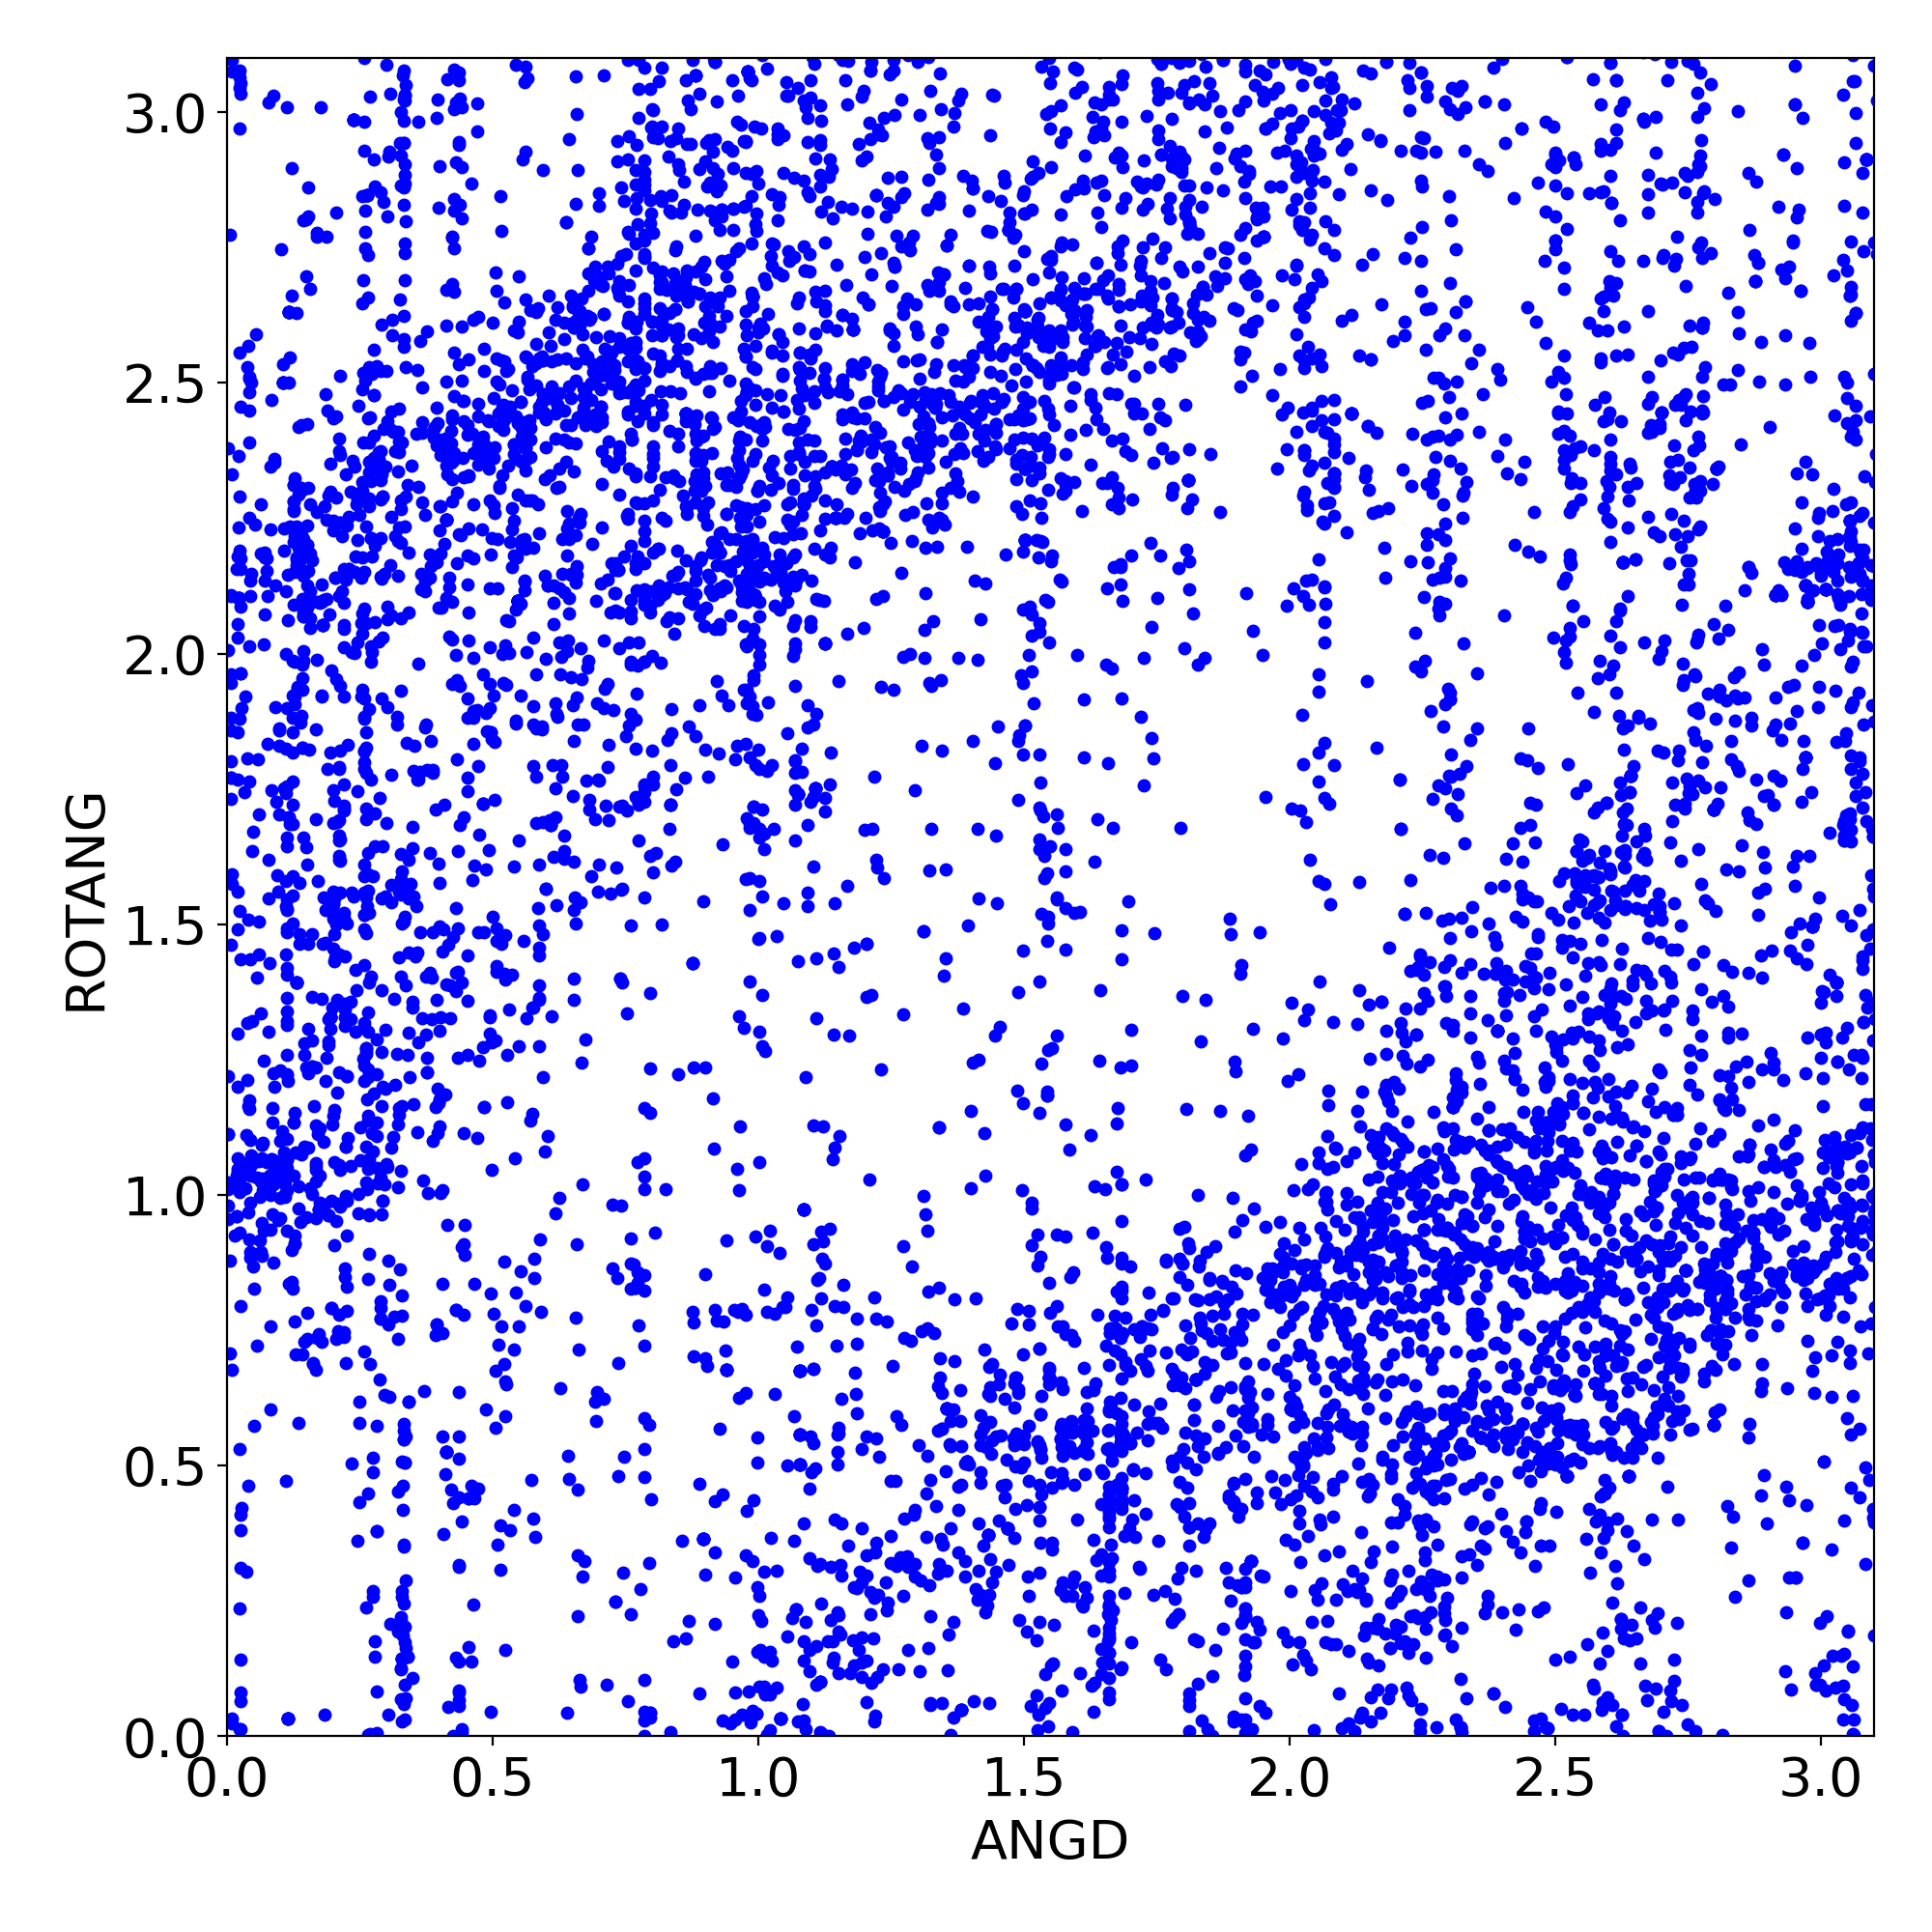
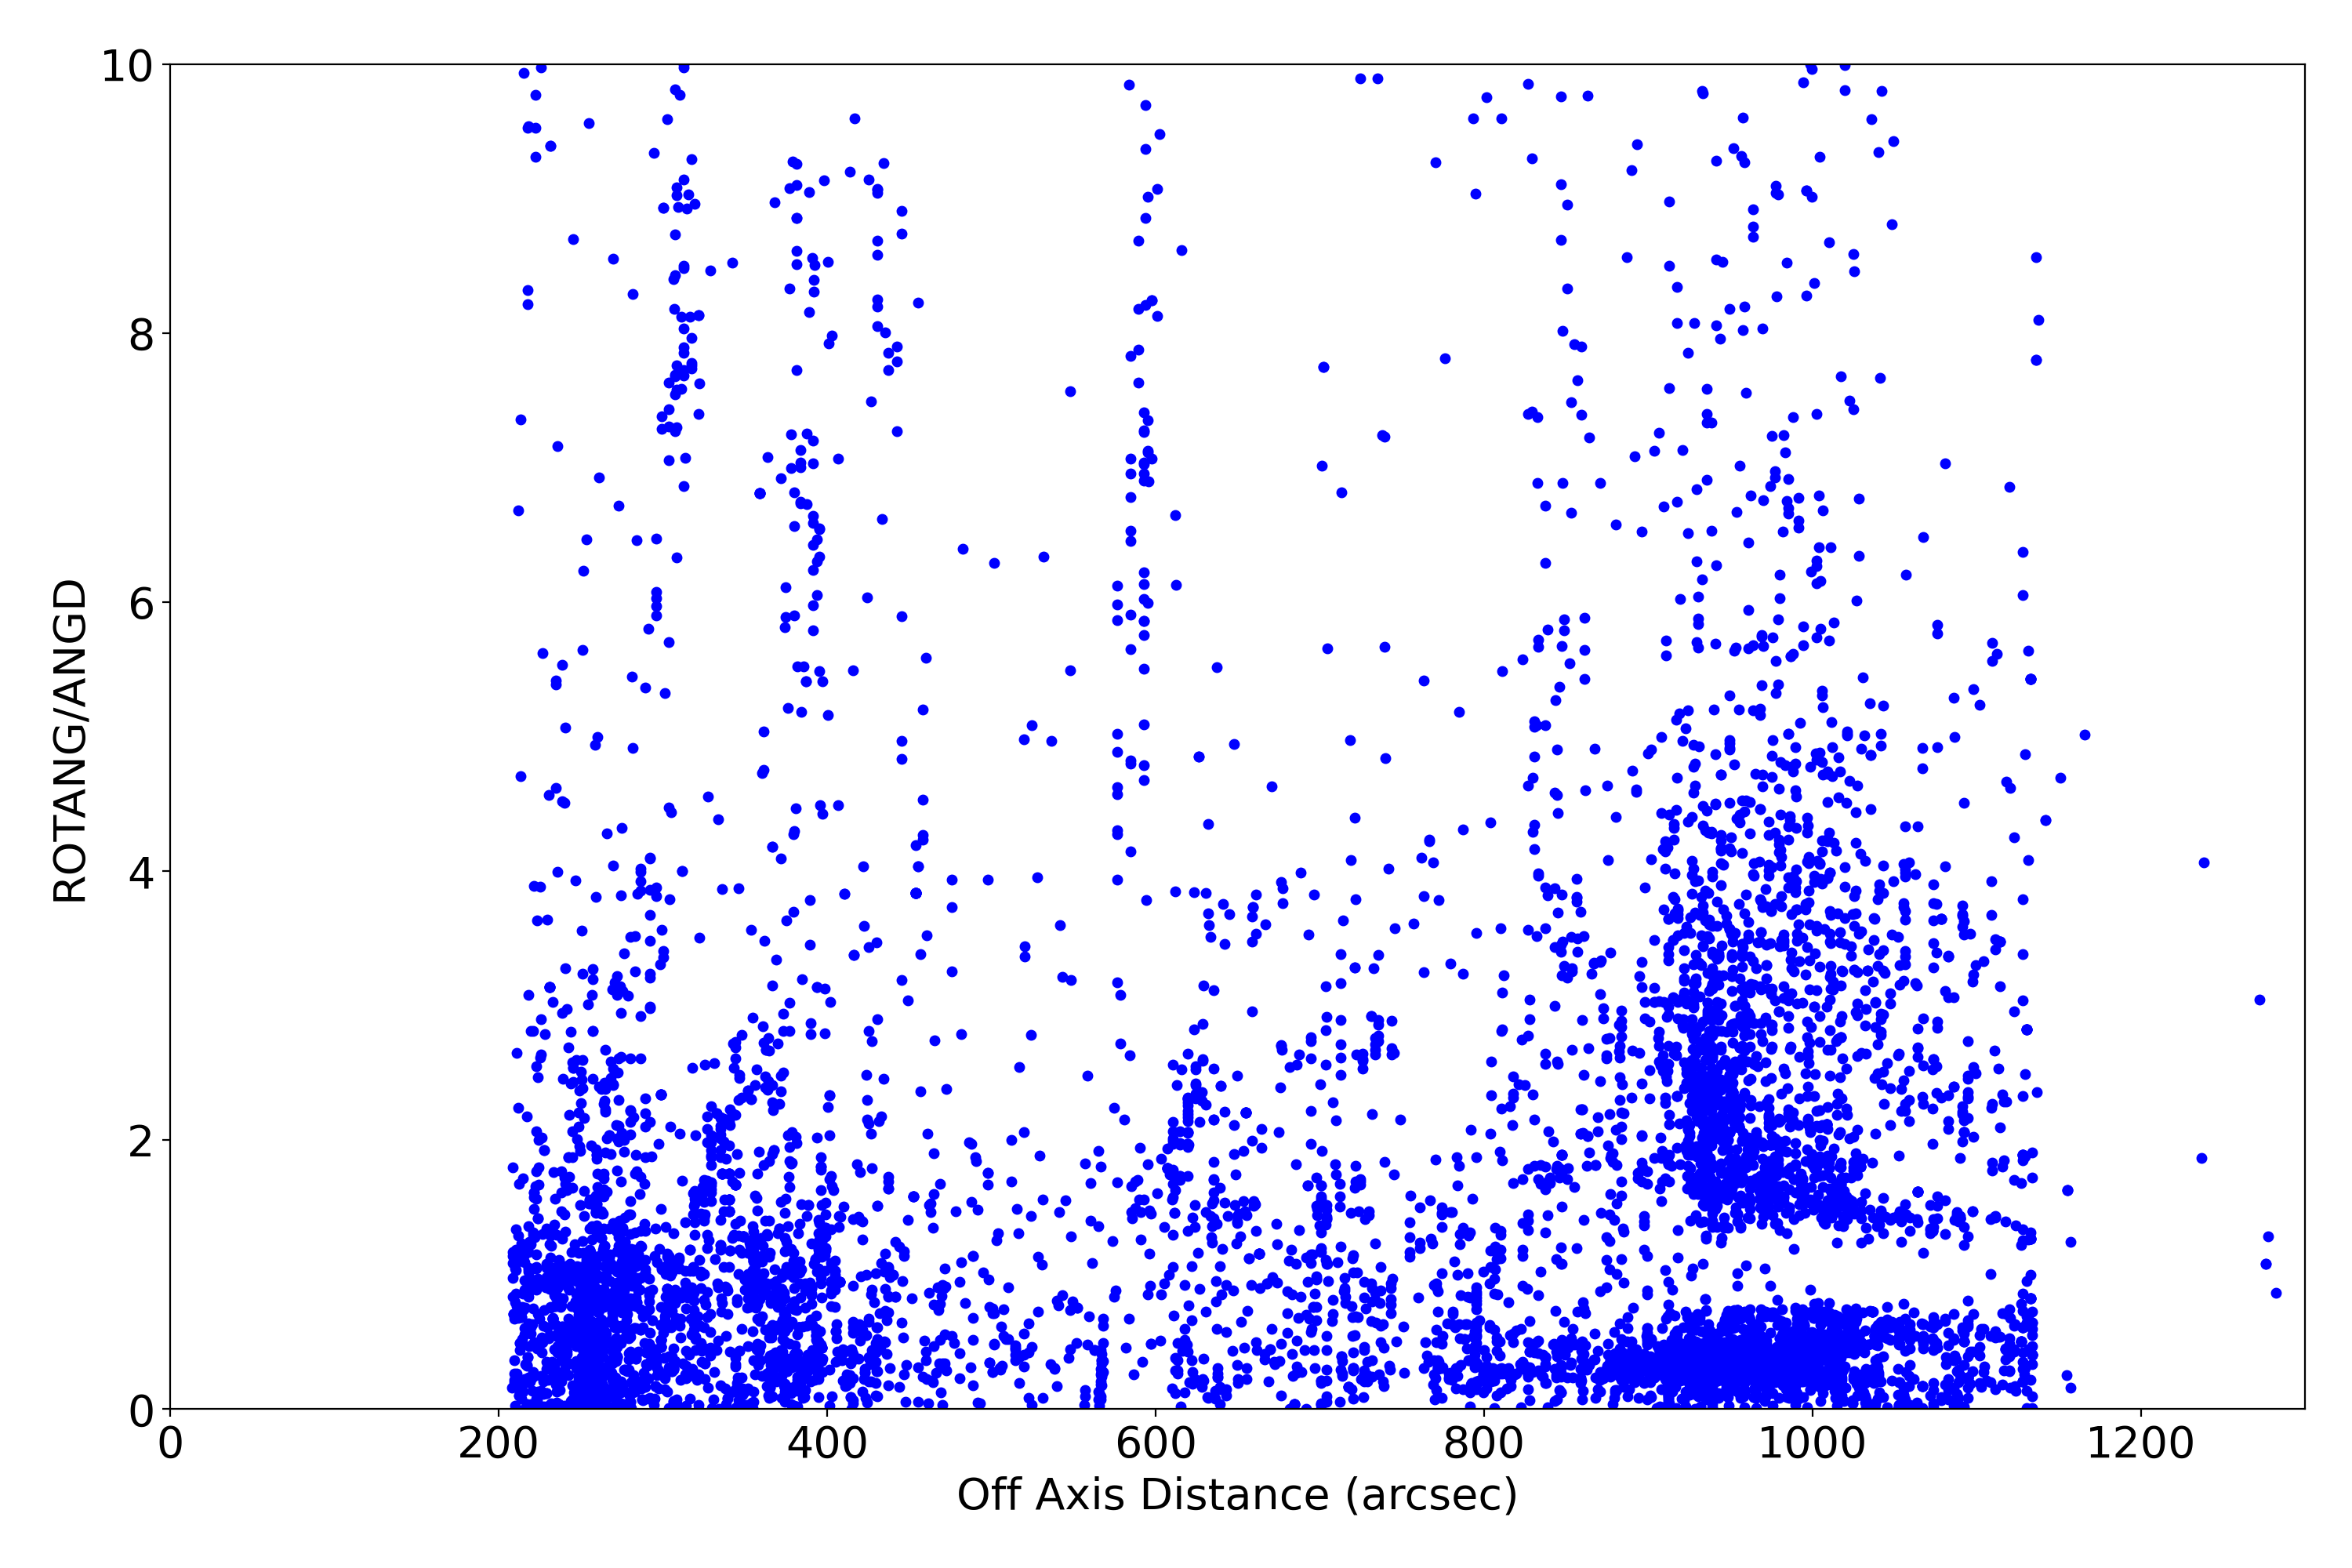
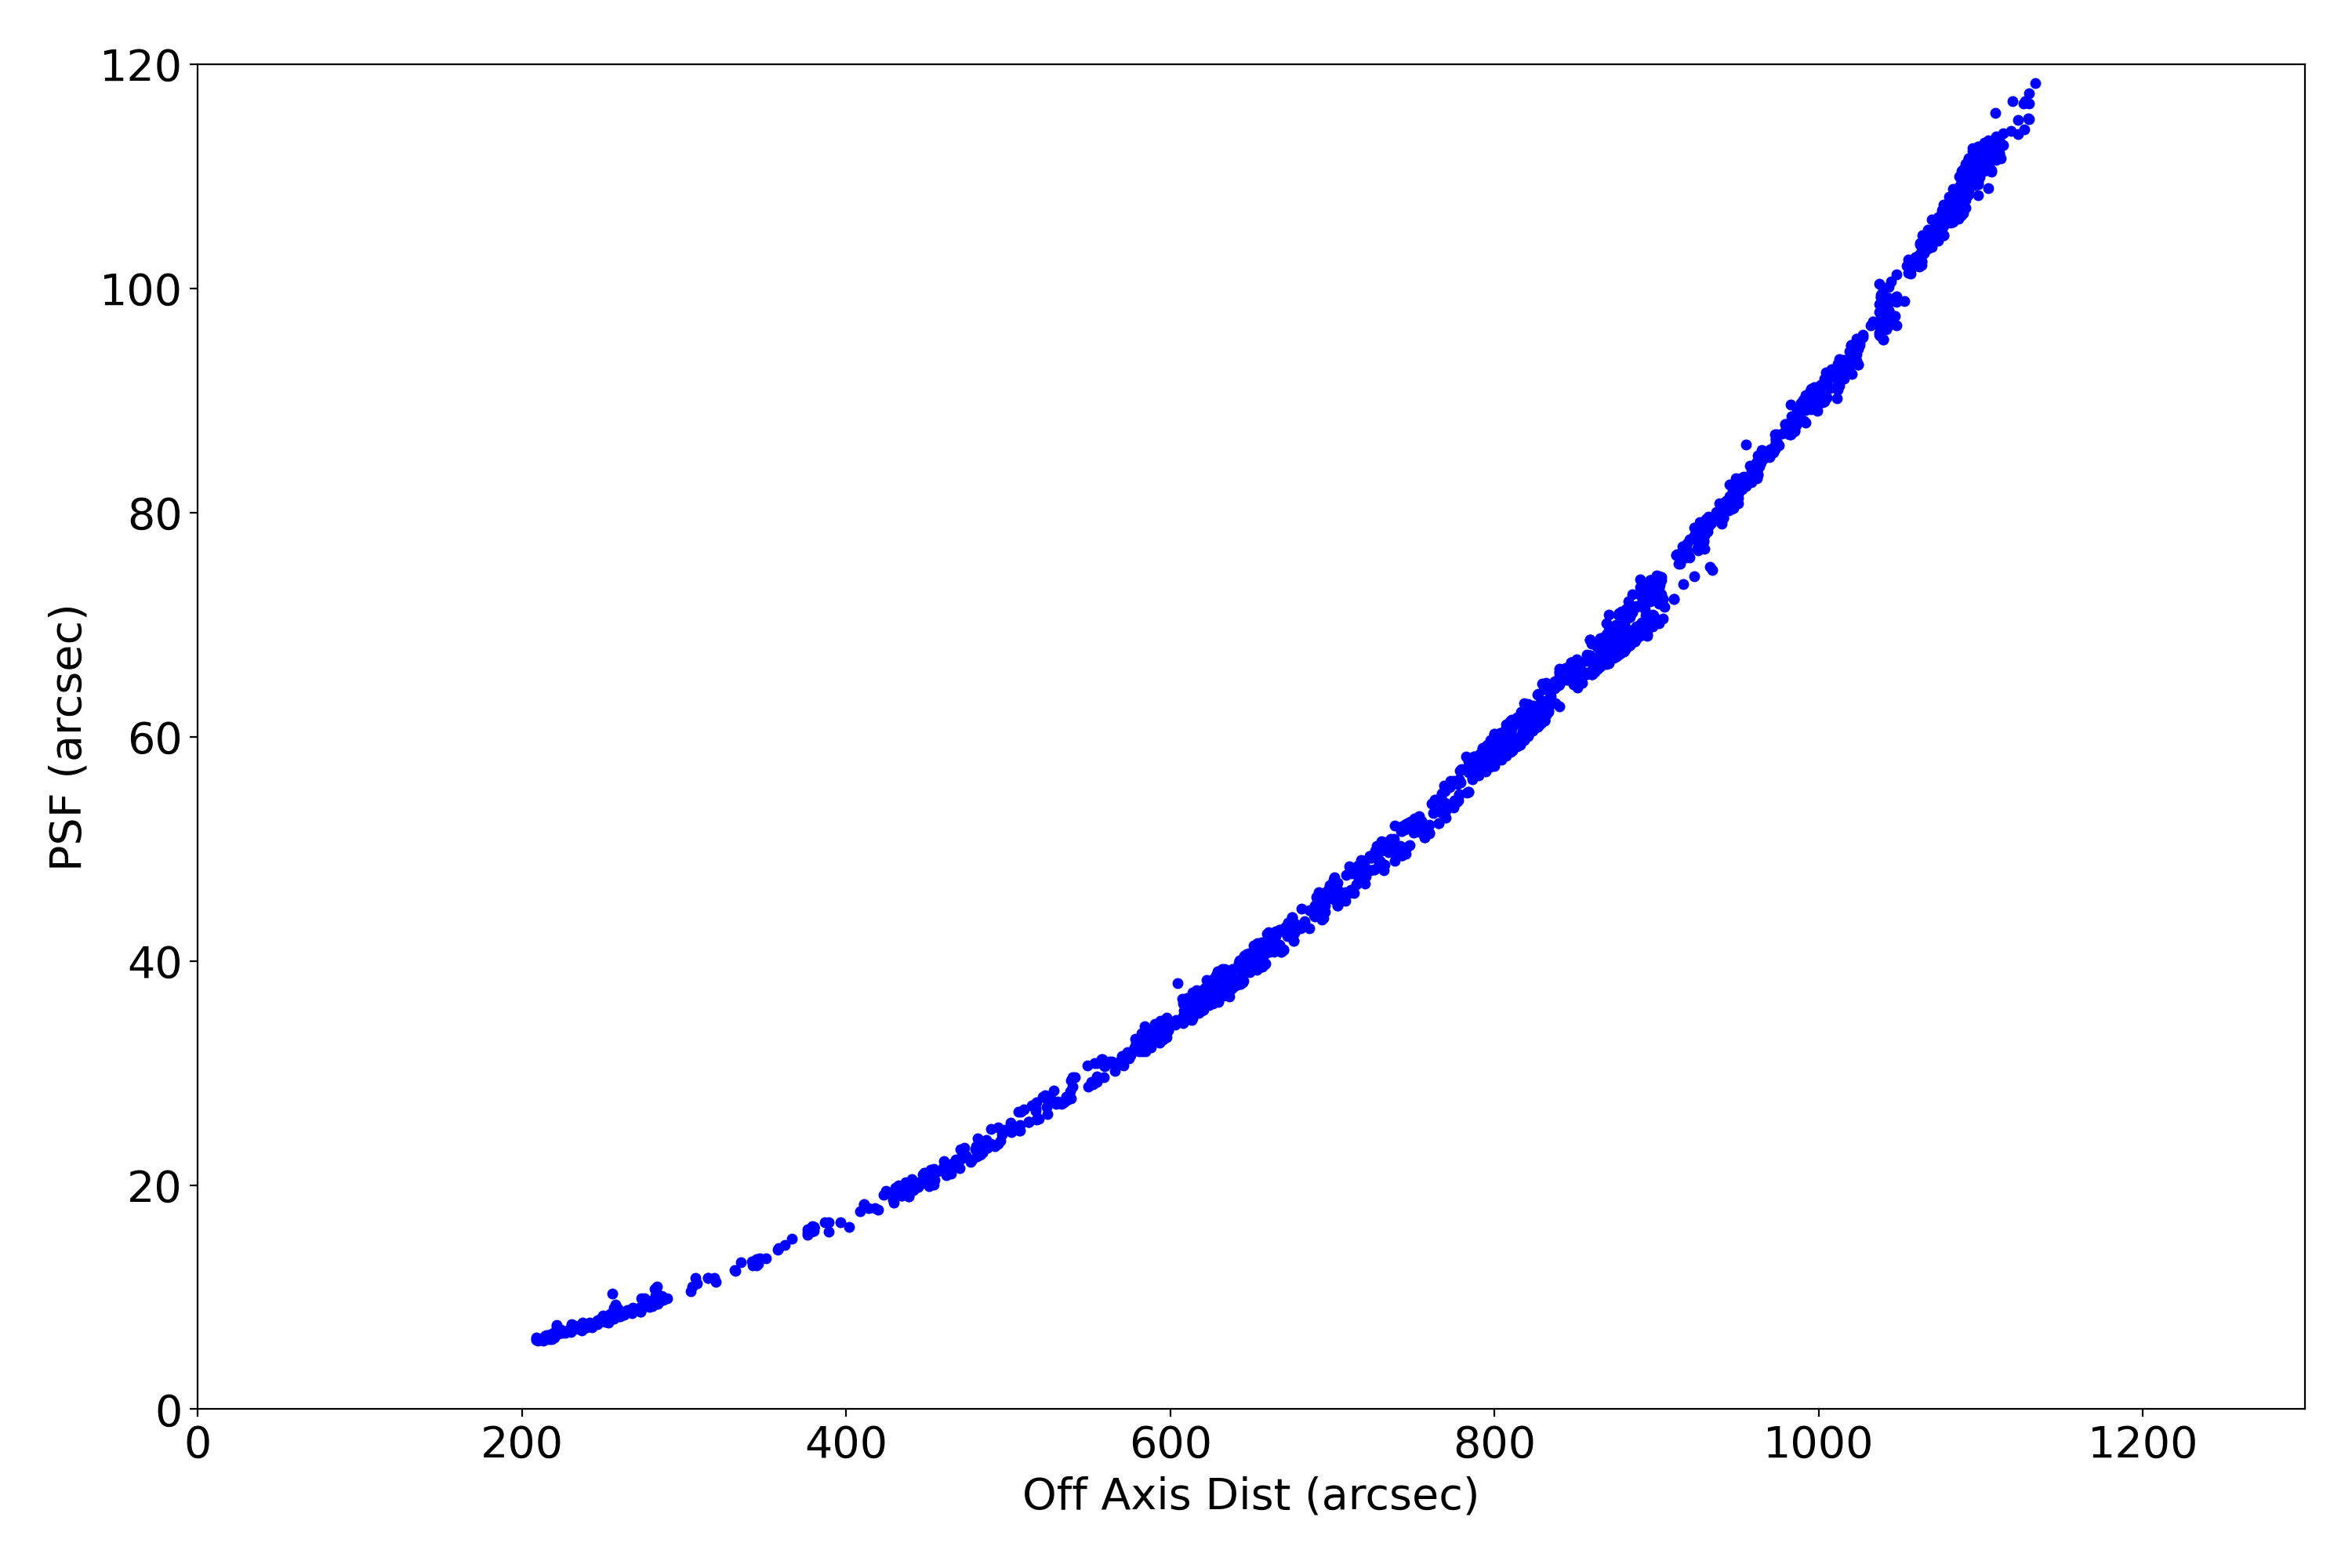
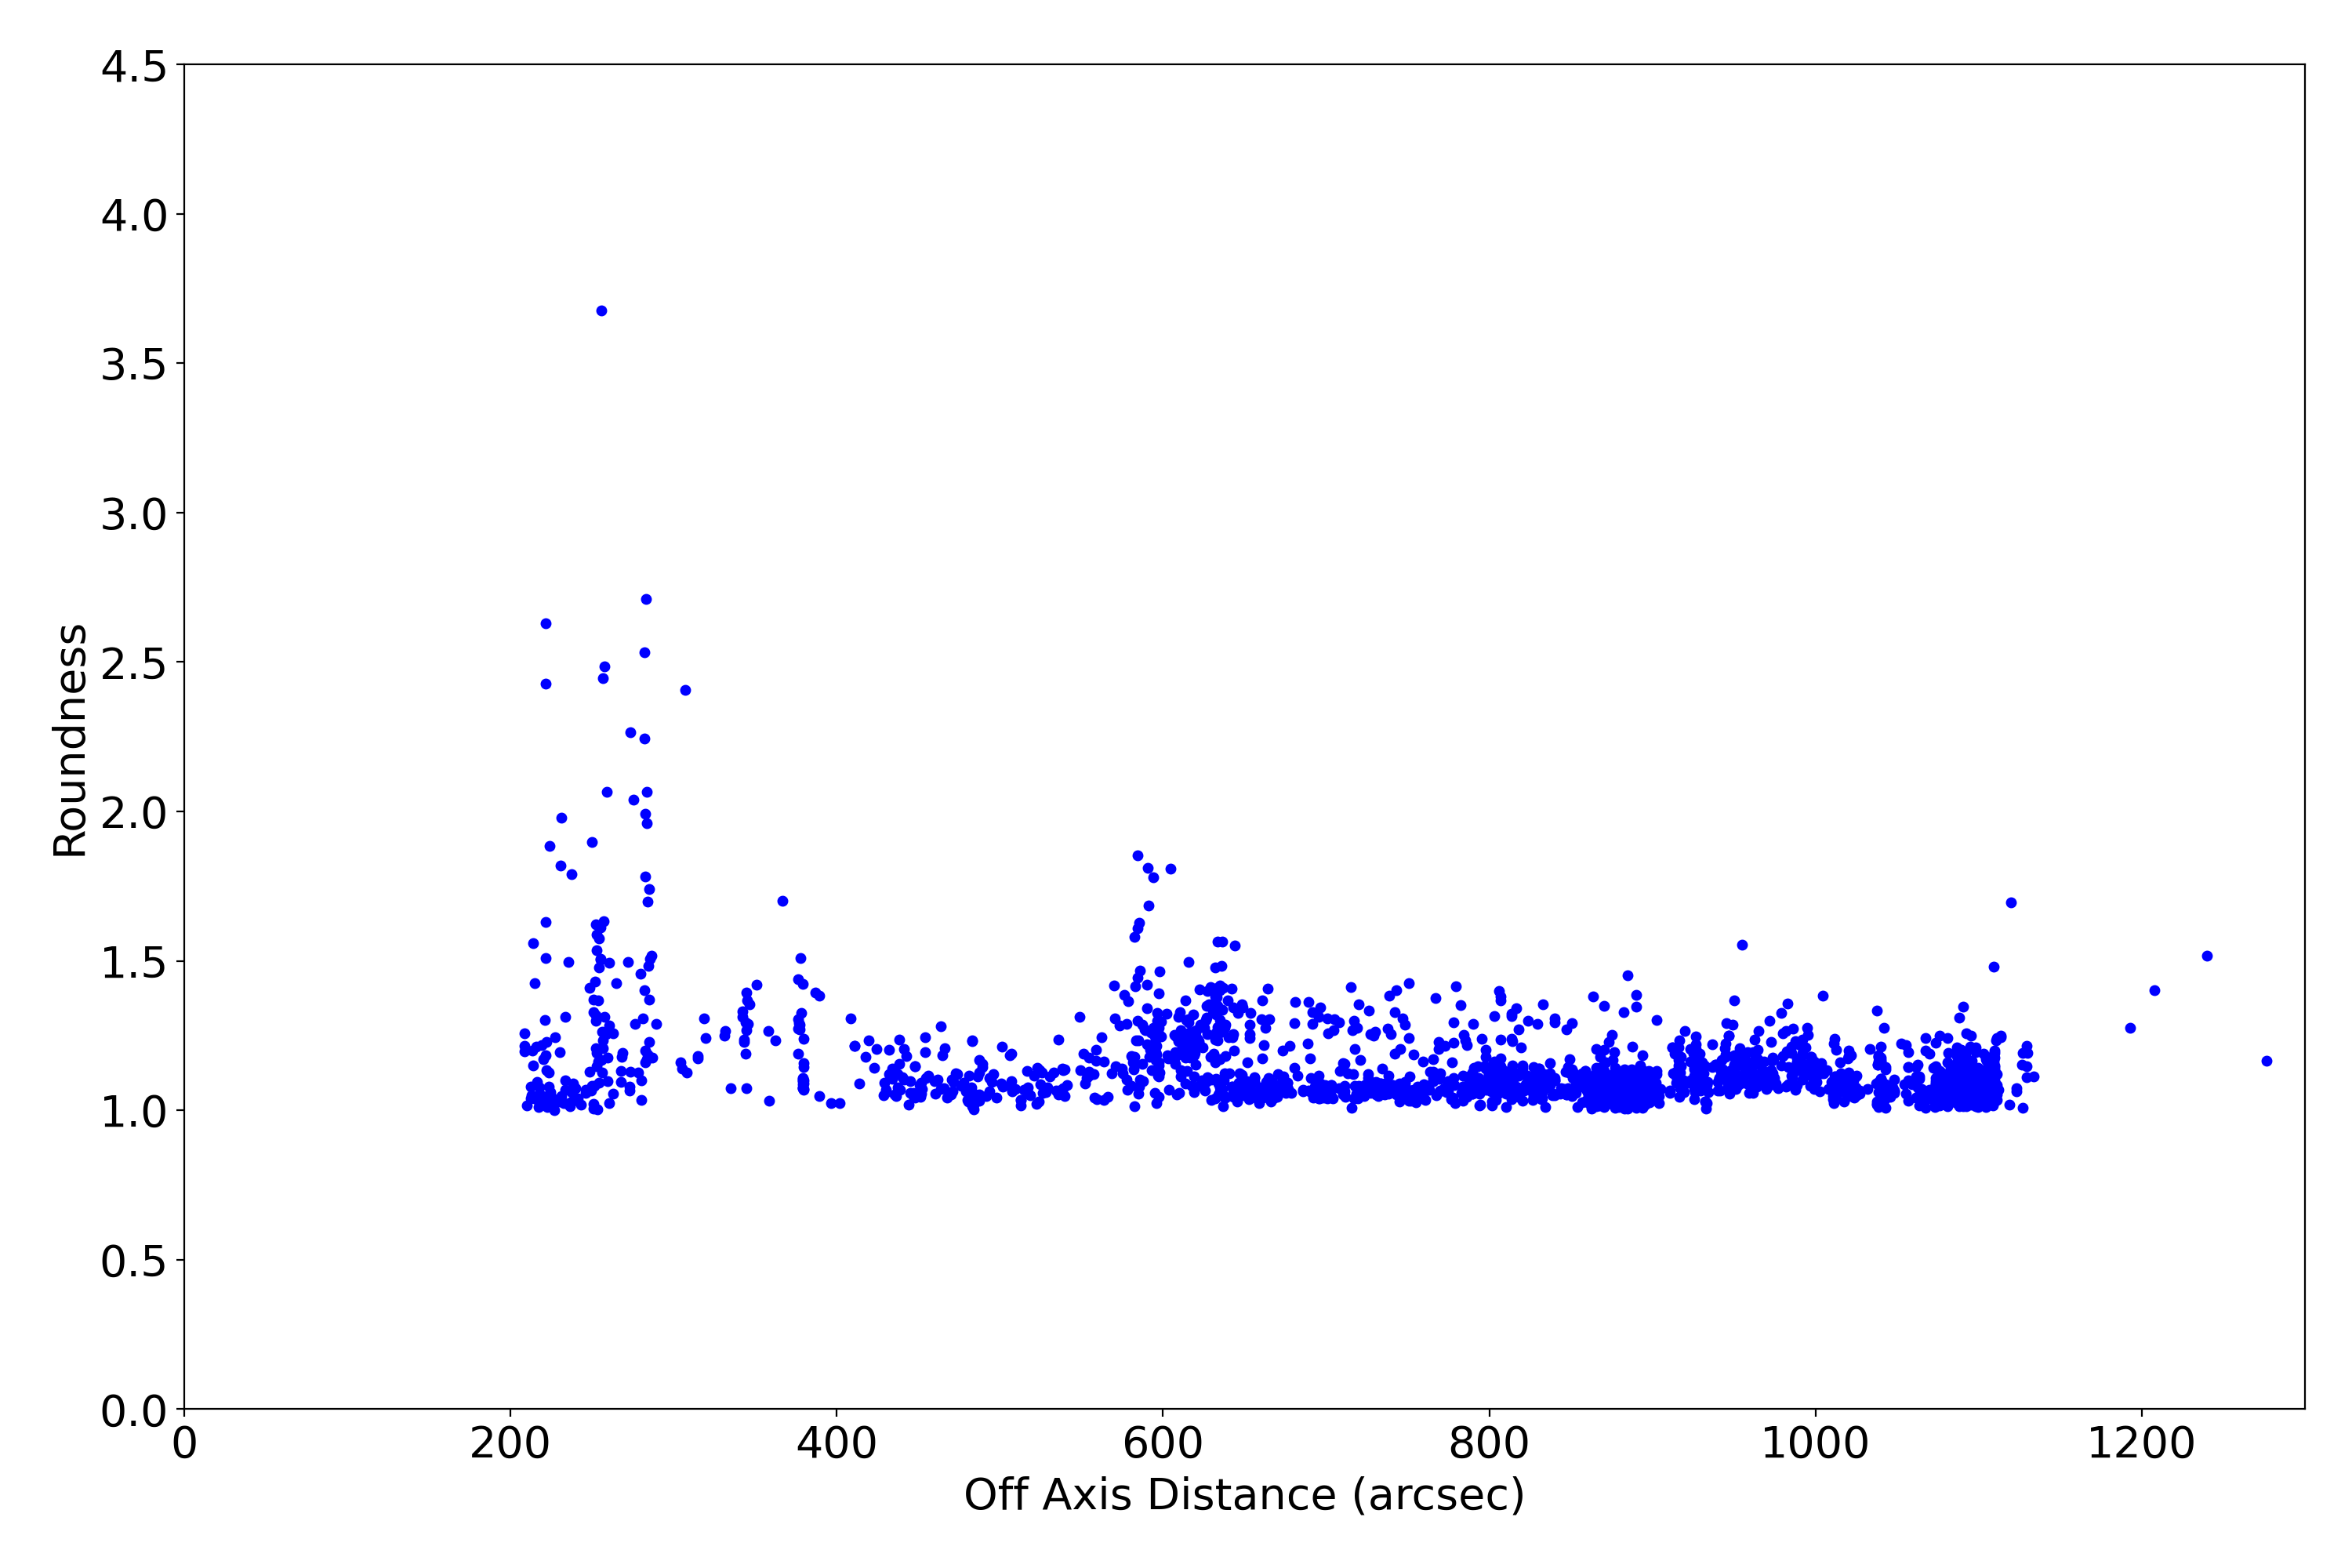
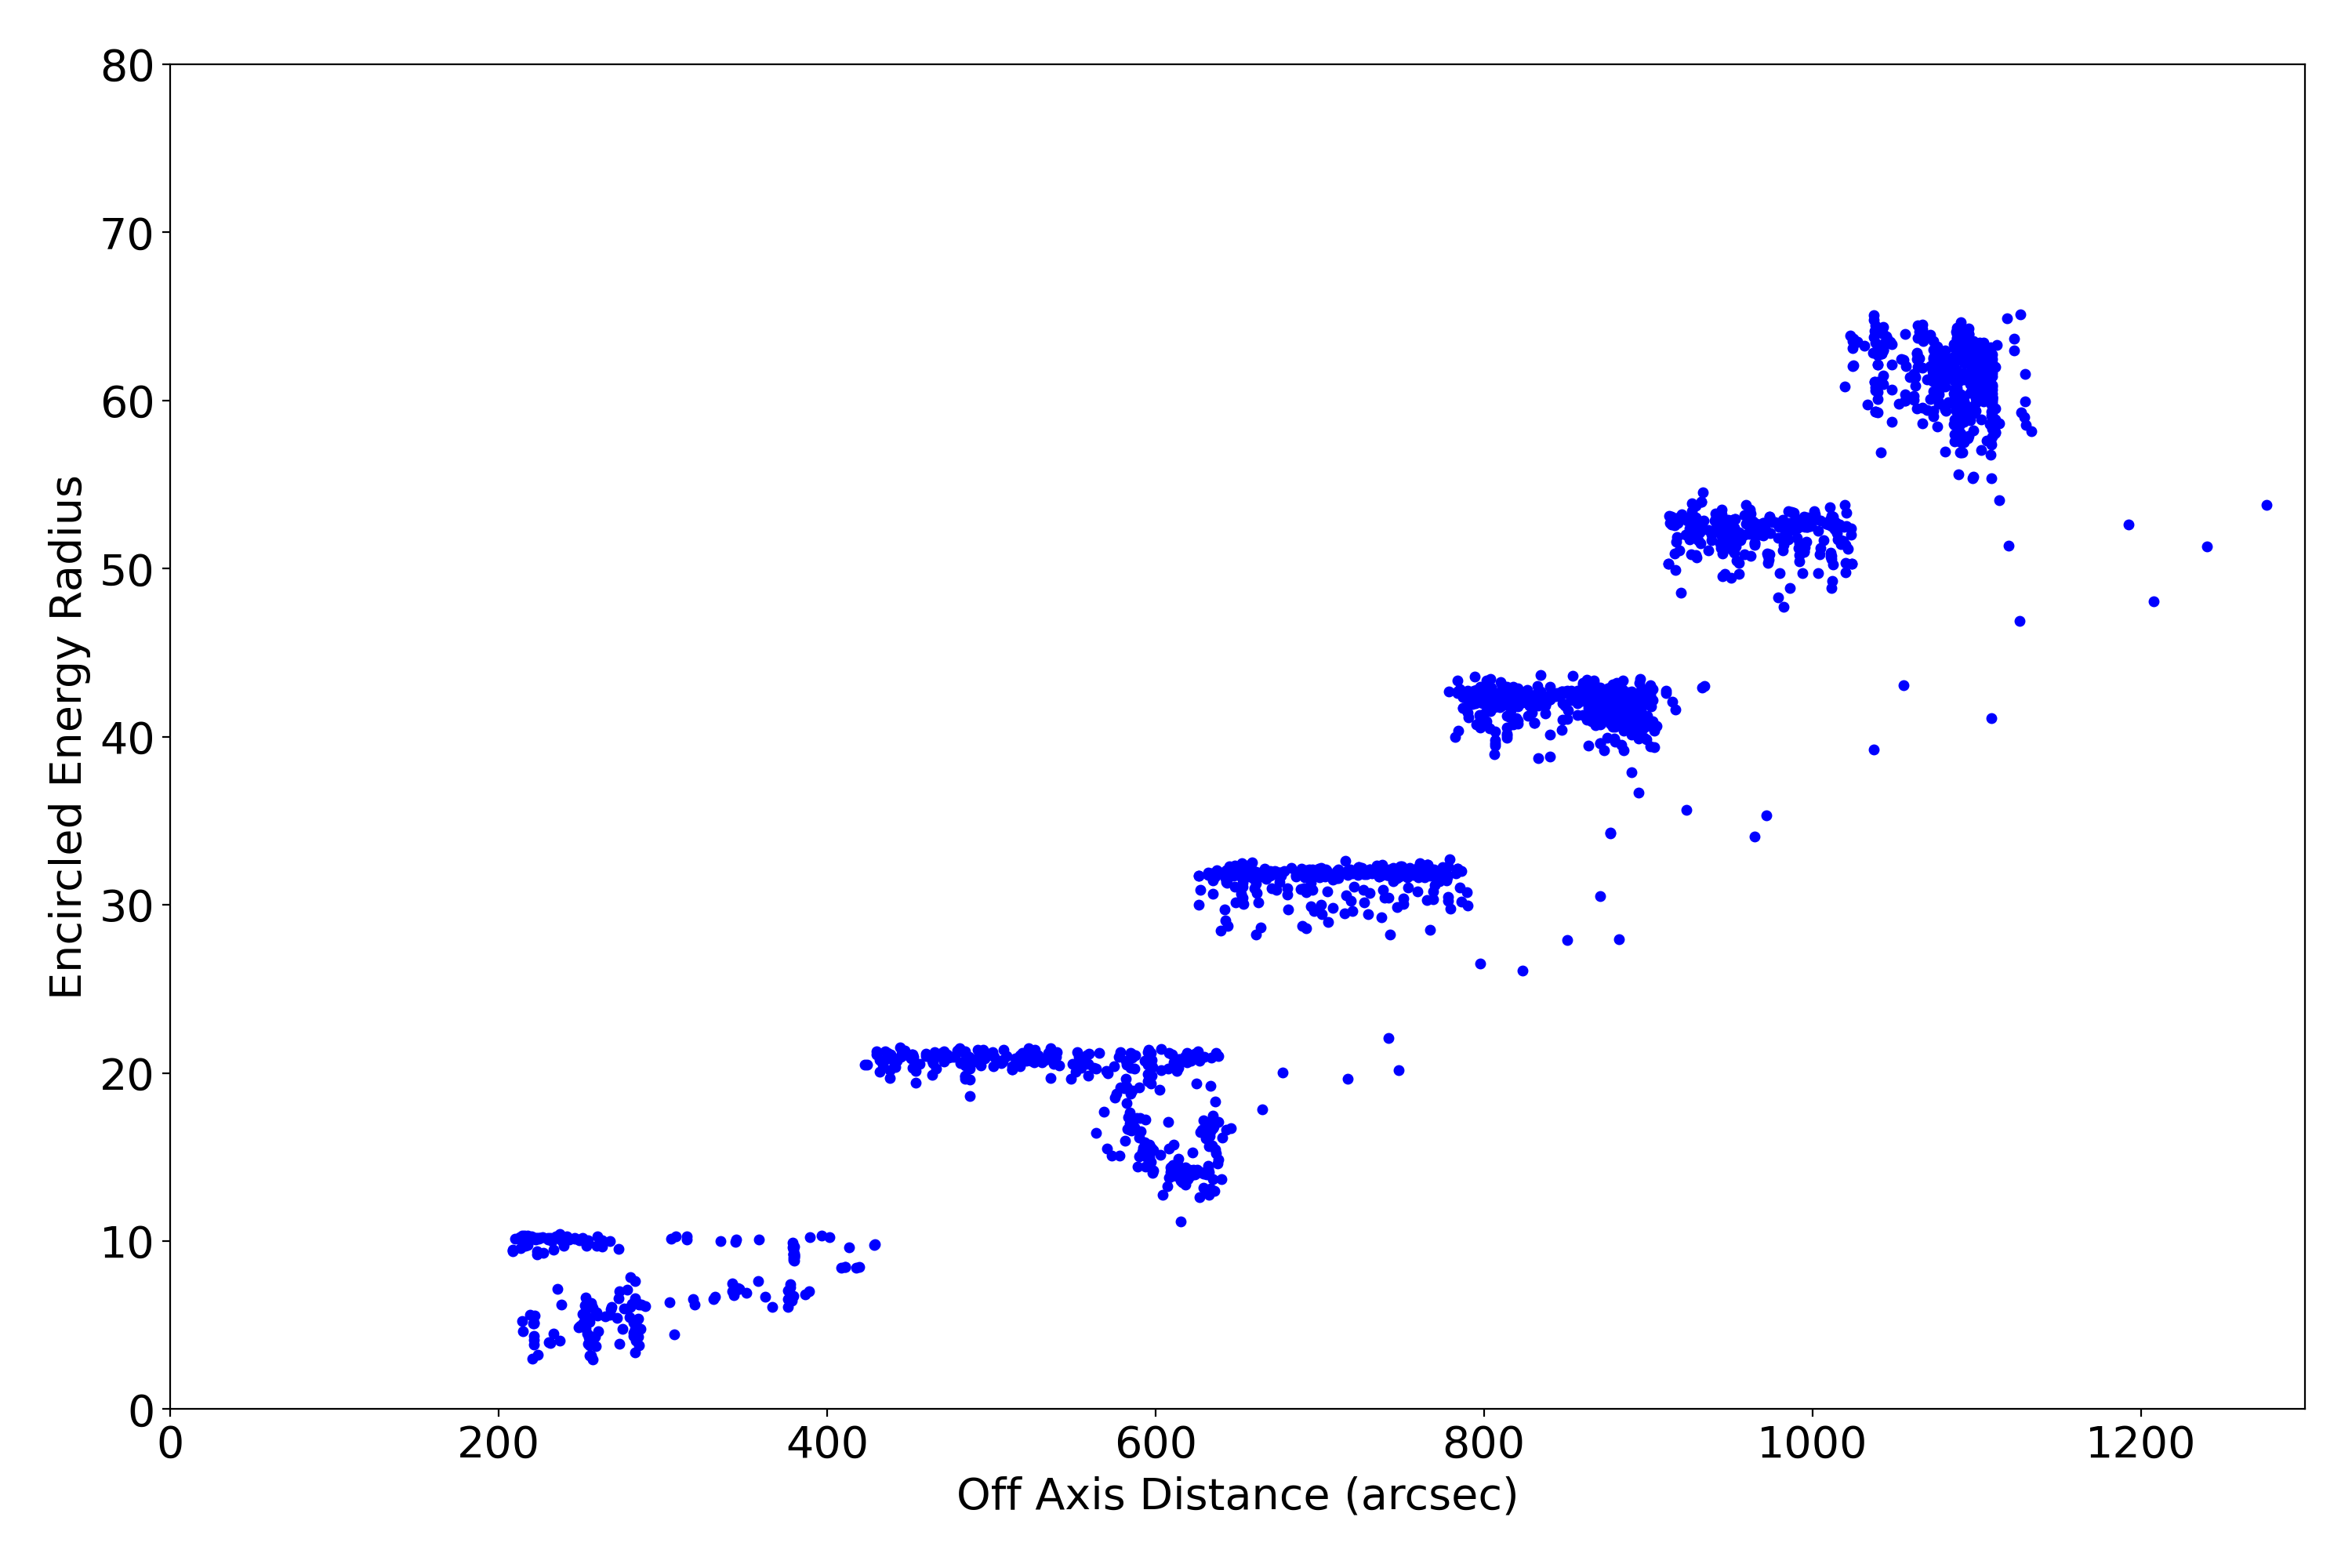
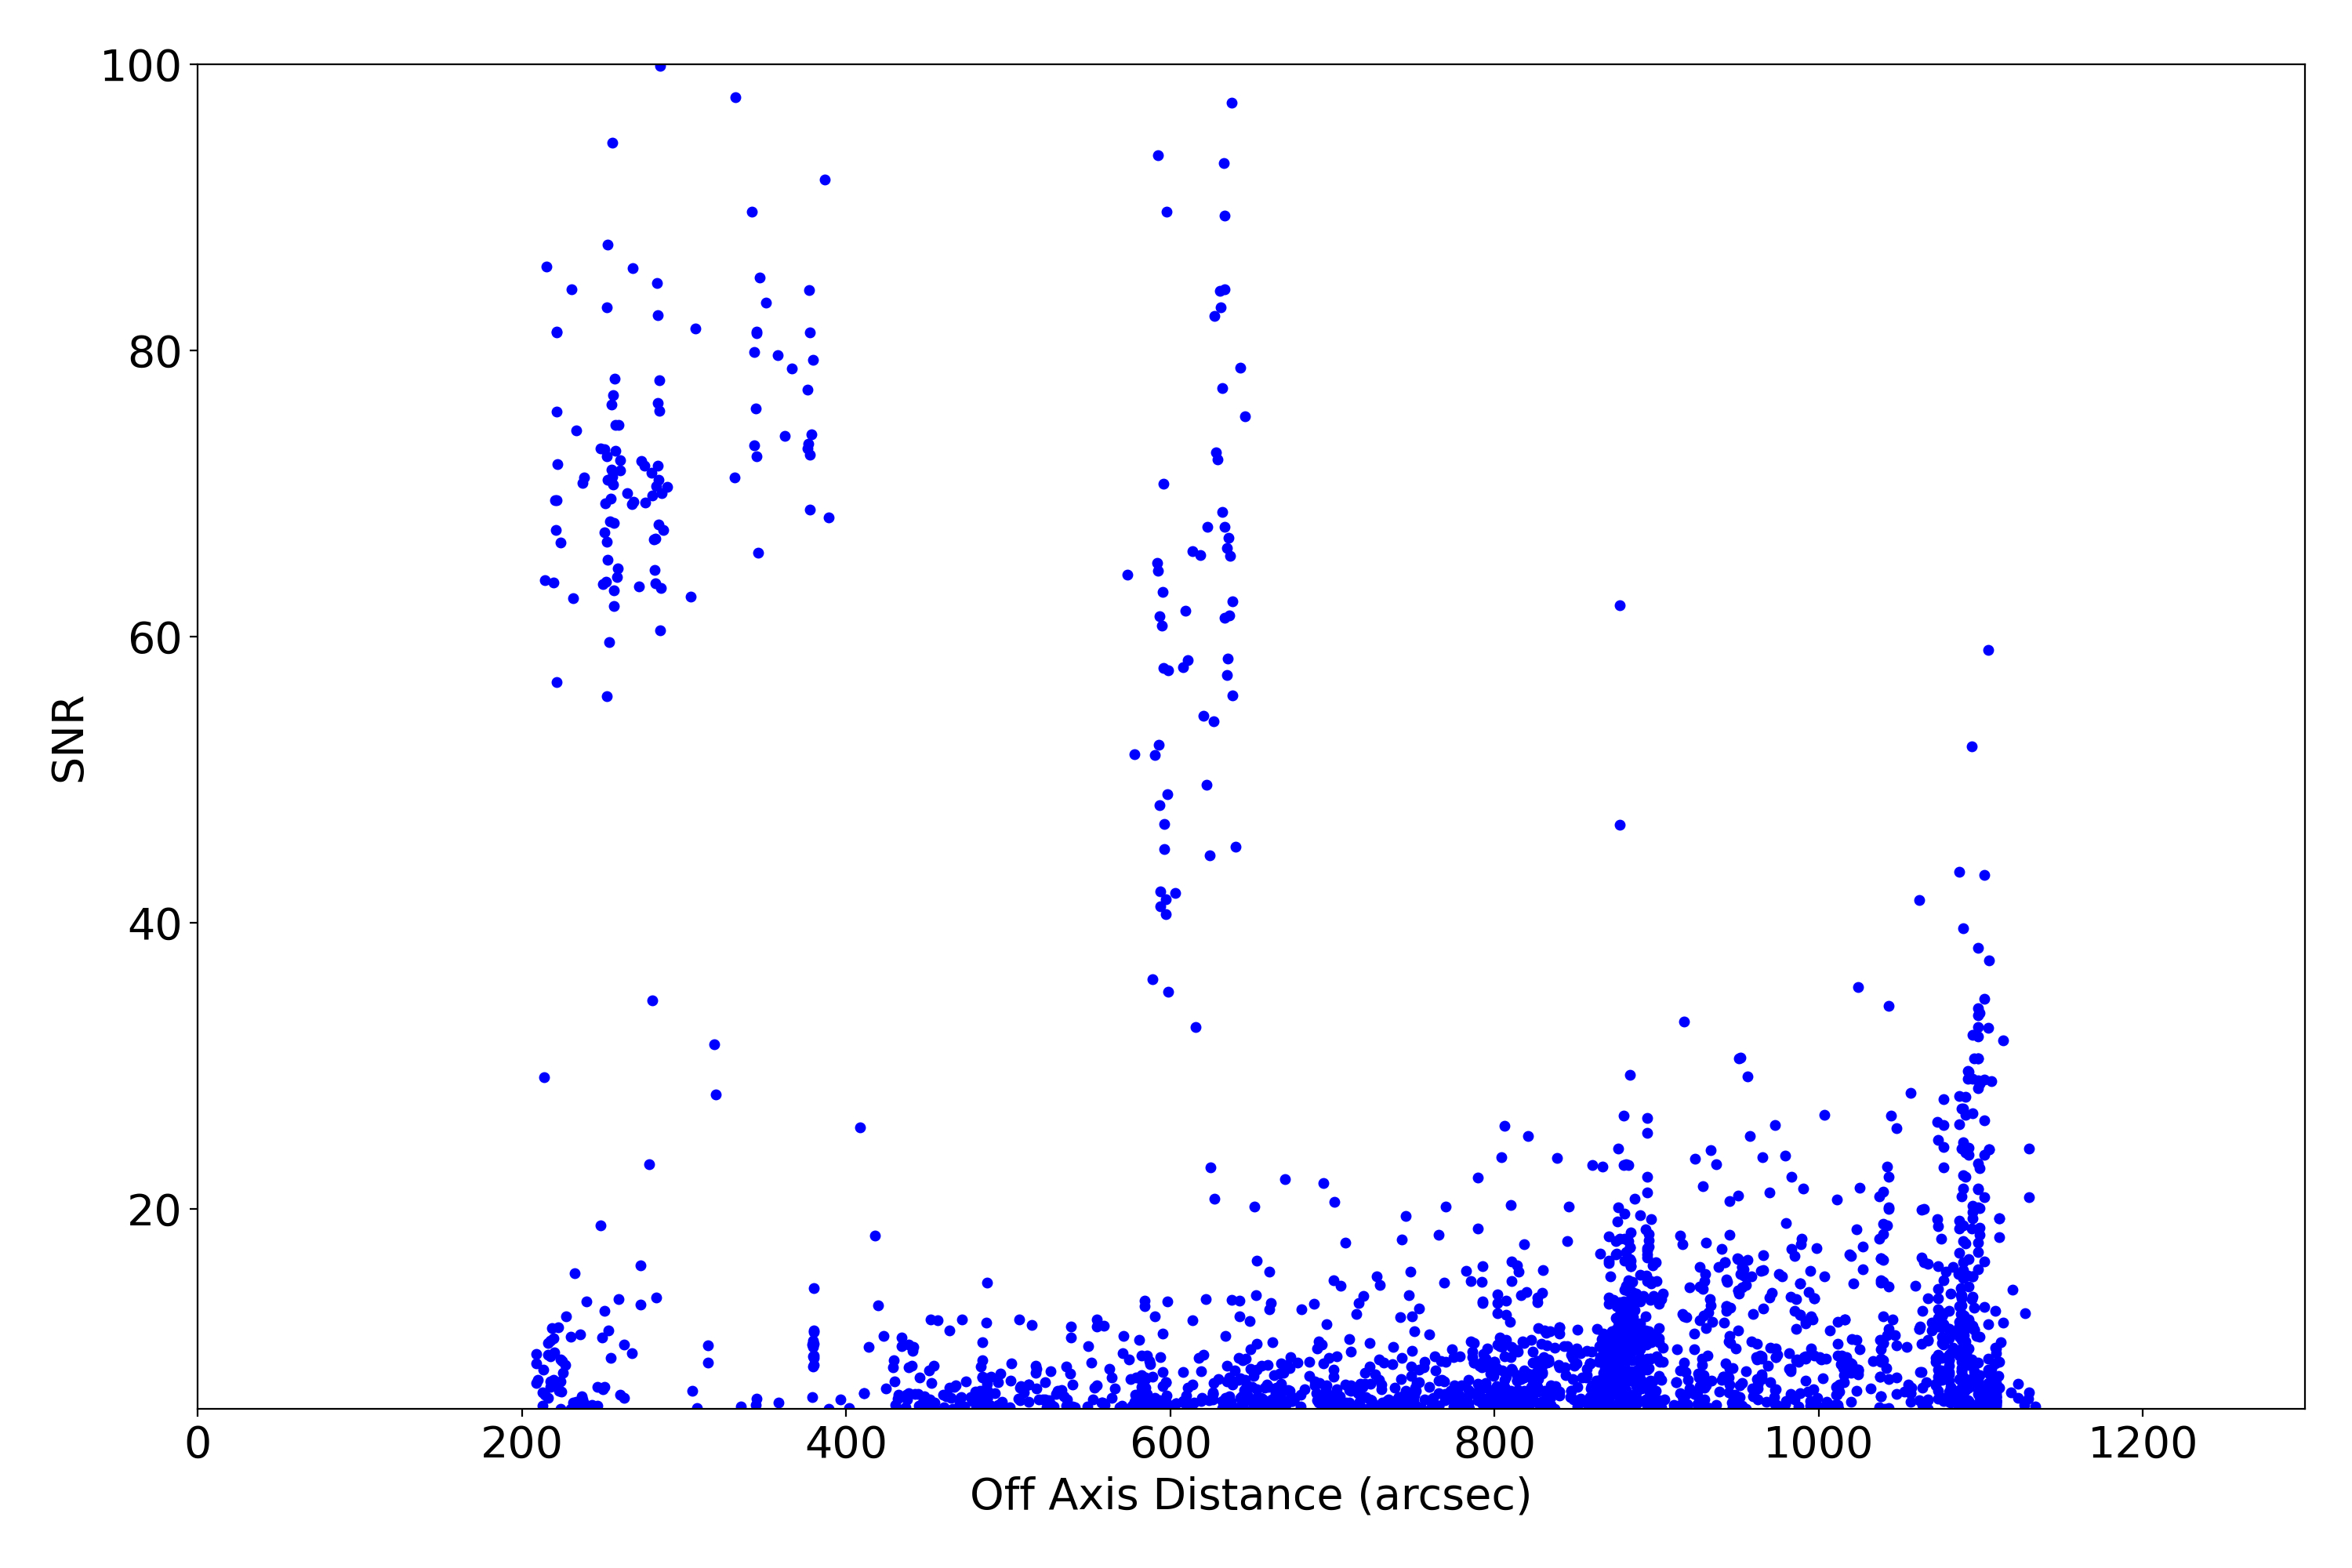
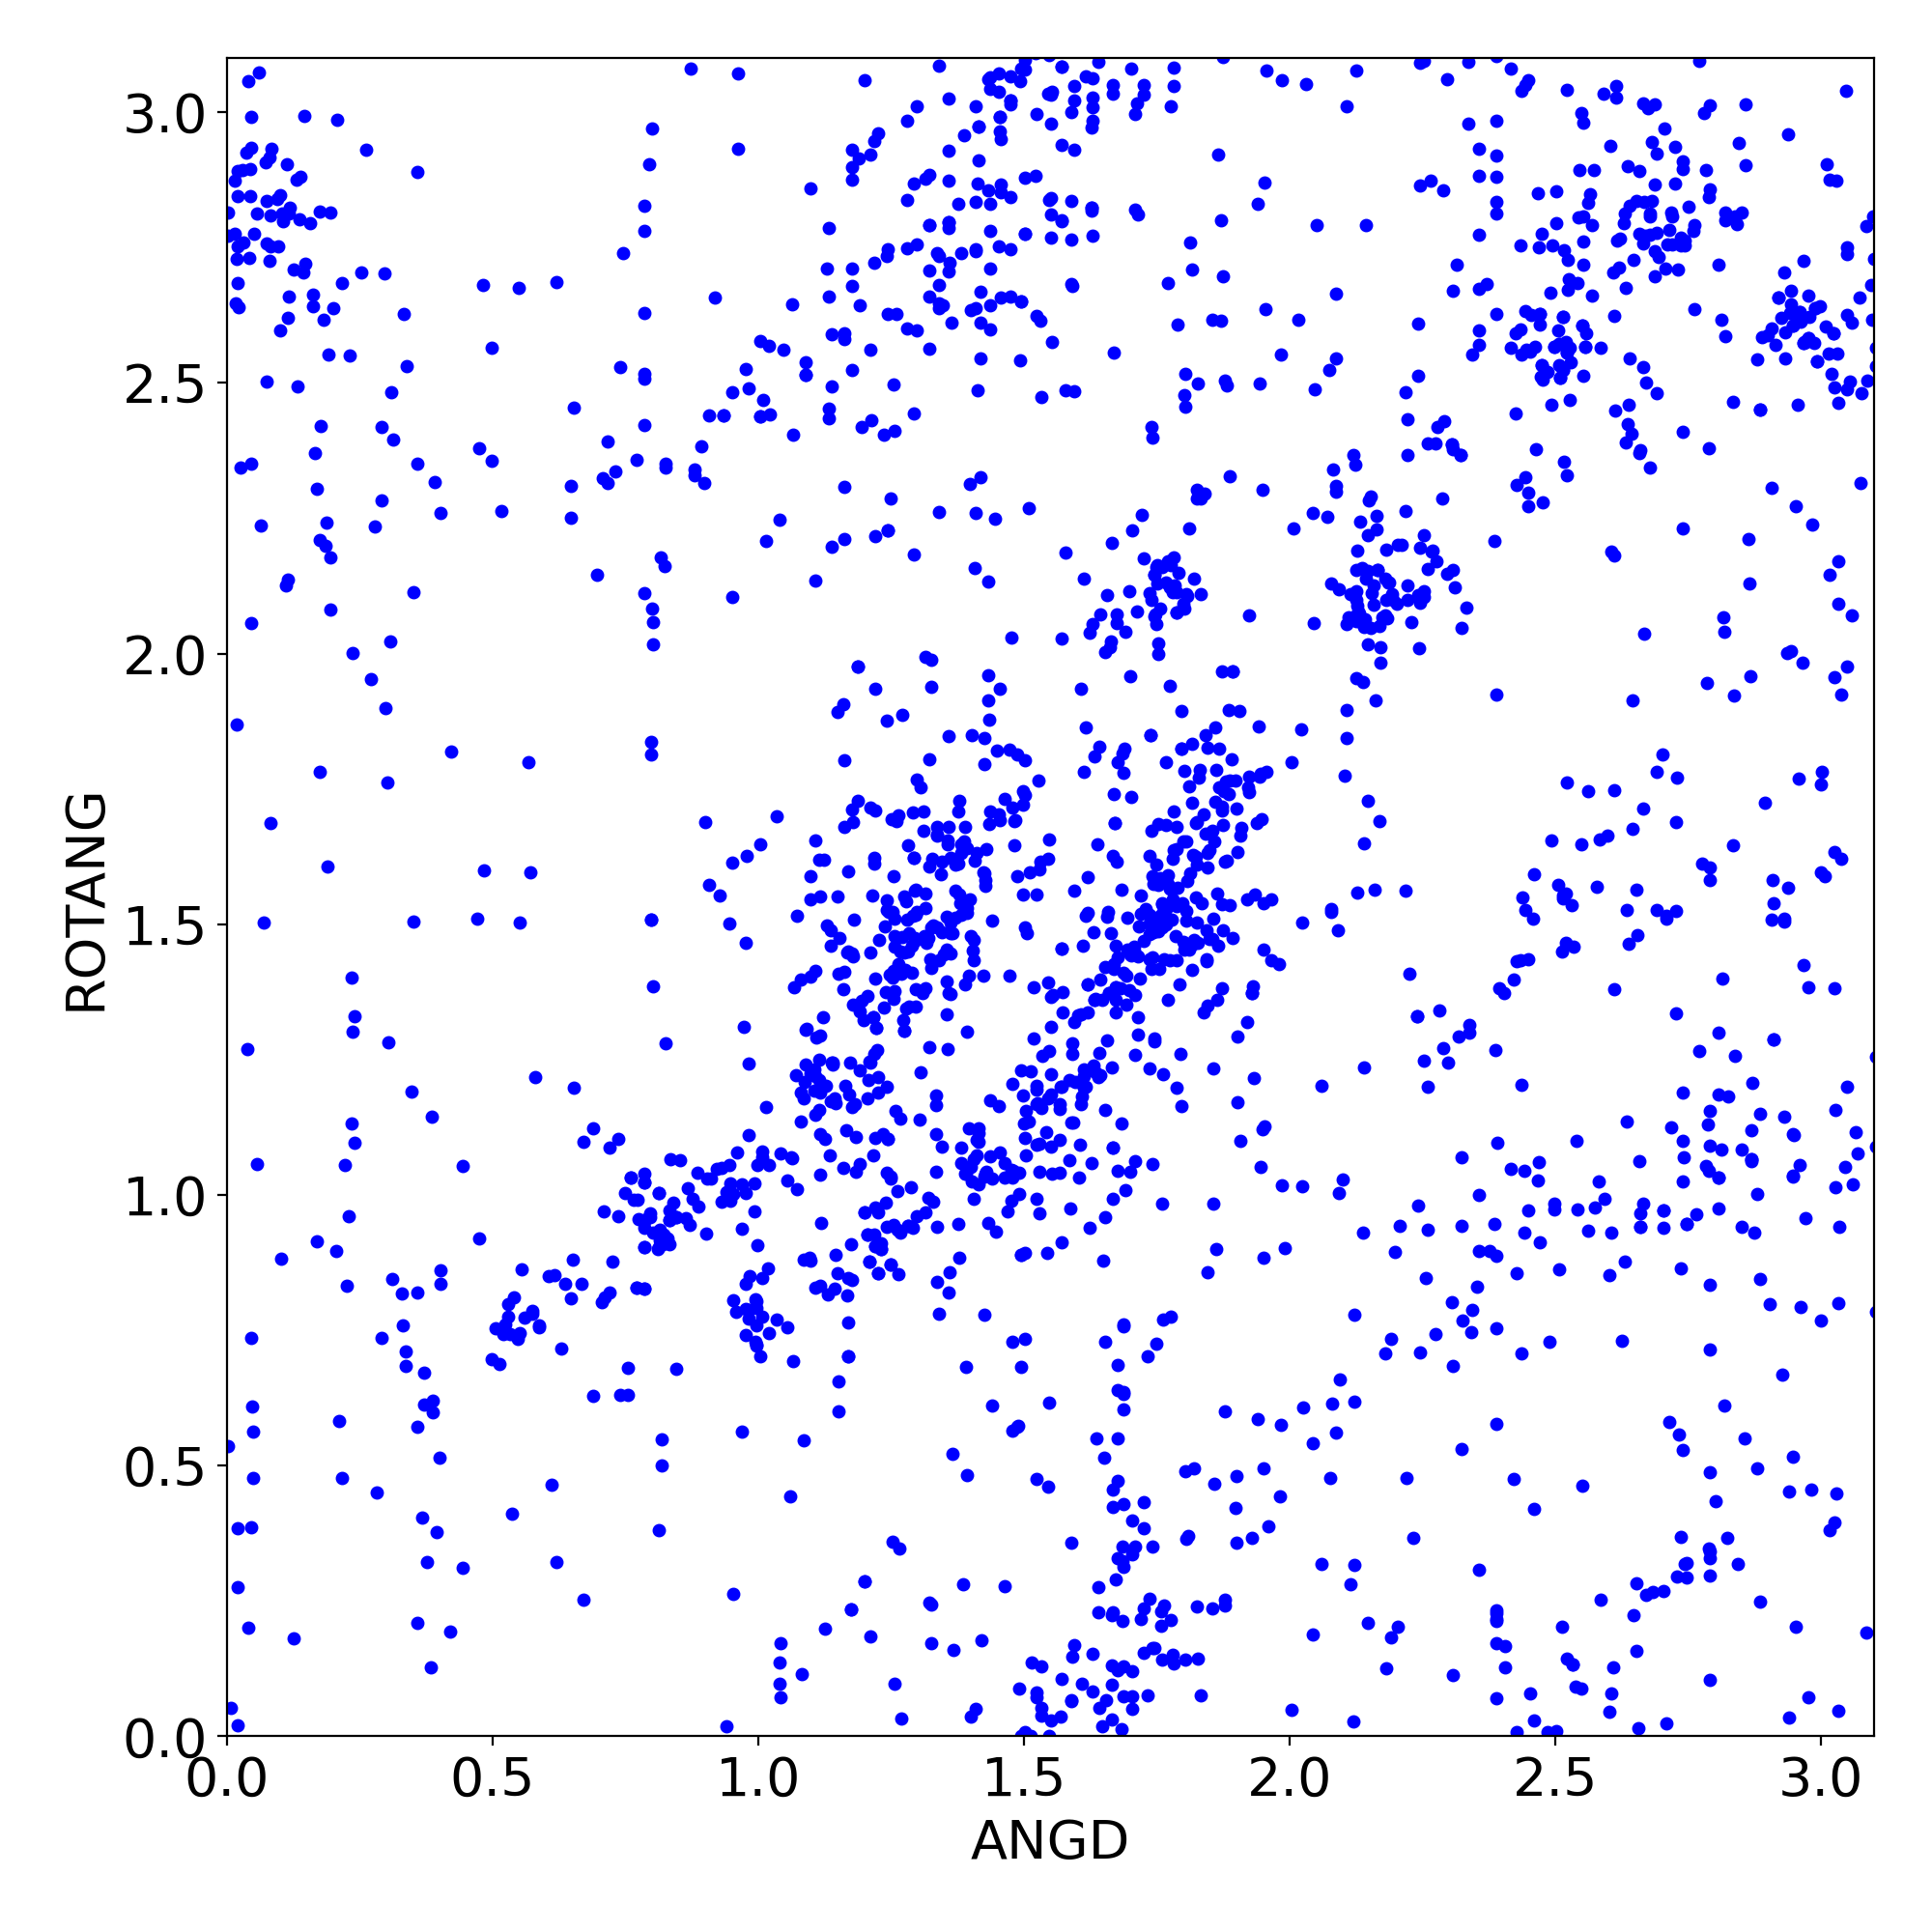
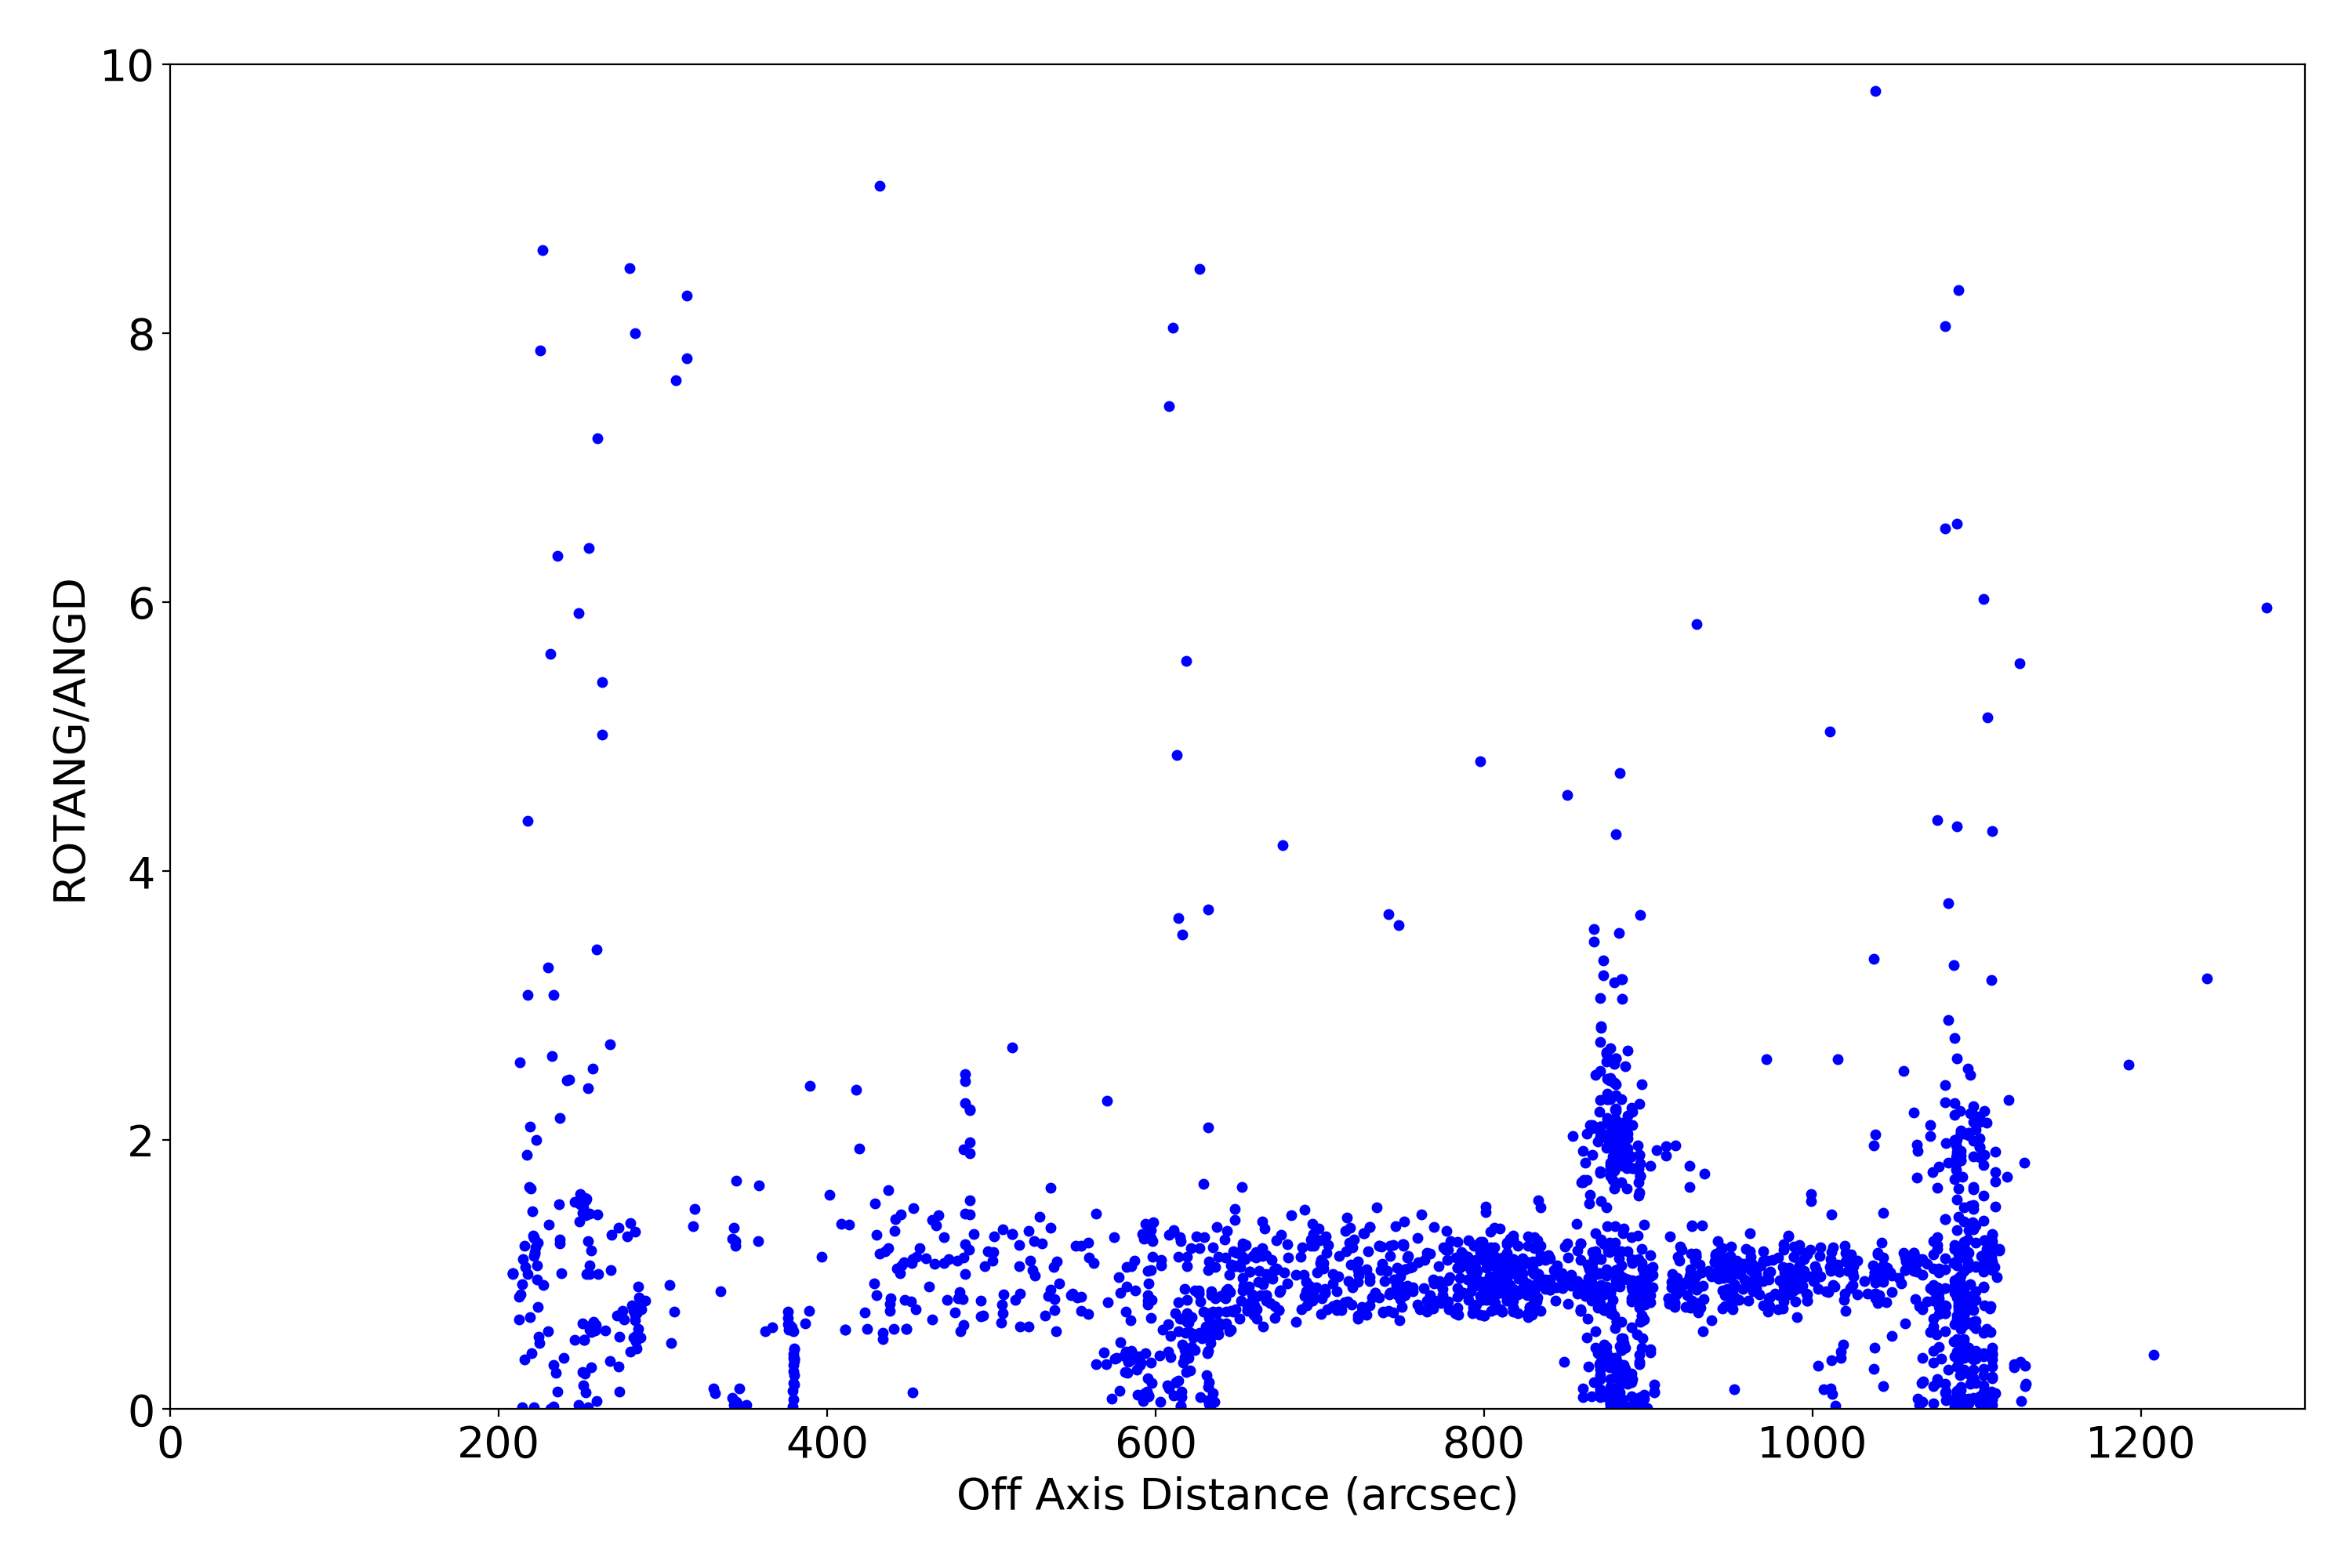
Plots below show various characteristics of detected imaging sources. Standard level 2 data products (*src2.fits) are used. Only observations with focus (sim_x) within 0.01 mm of nominal value for given SI configuration are used. Sources are also filtered for strength (SNR > 15).
| XY | PSF | Roundness | EE Radius | SNR | Rotation | Rotation2 | |
|---|---|---|---|---|---|---|---|
| ACIS I | 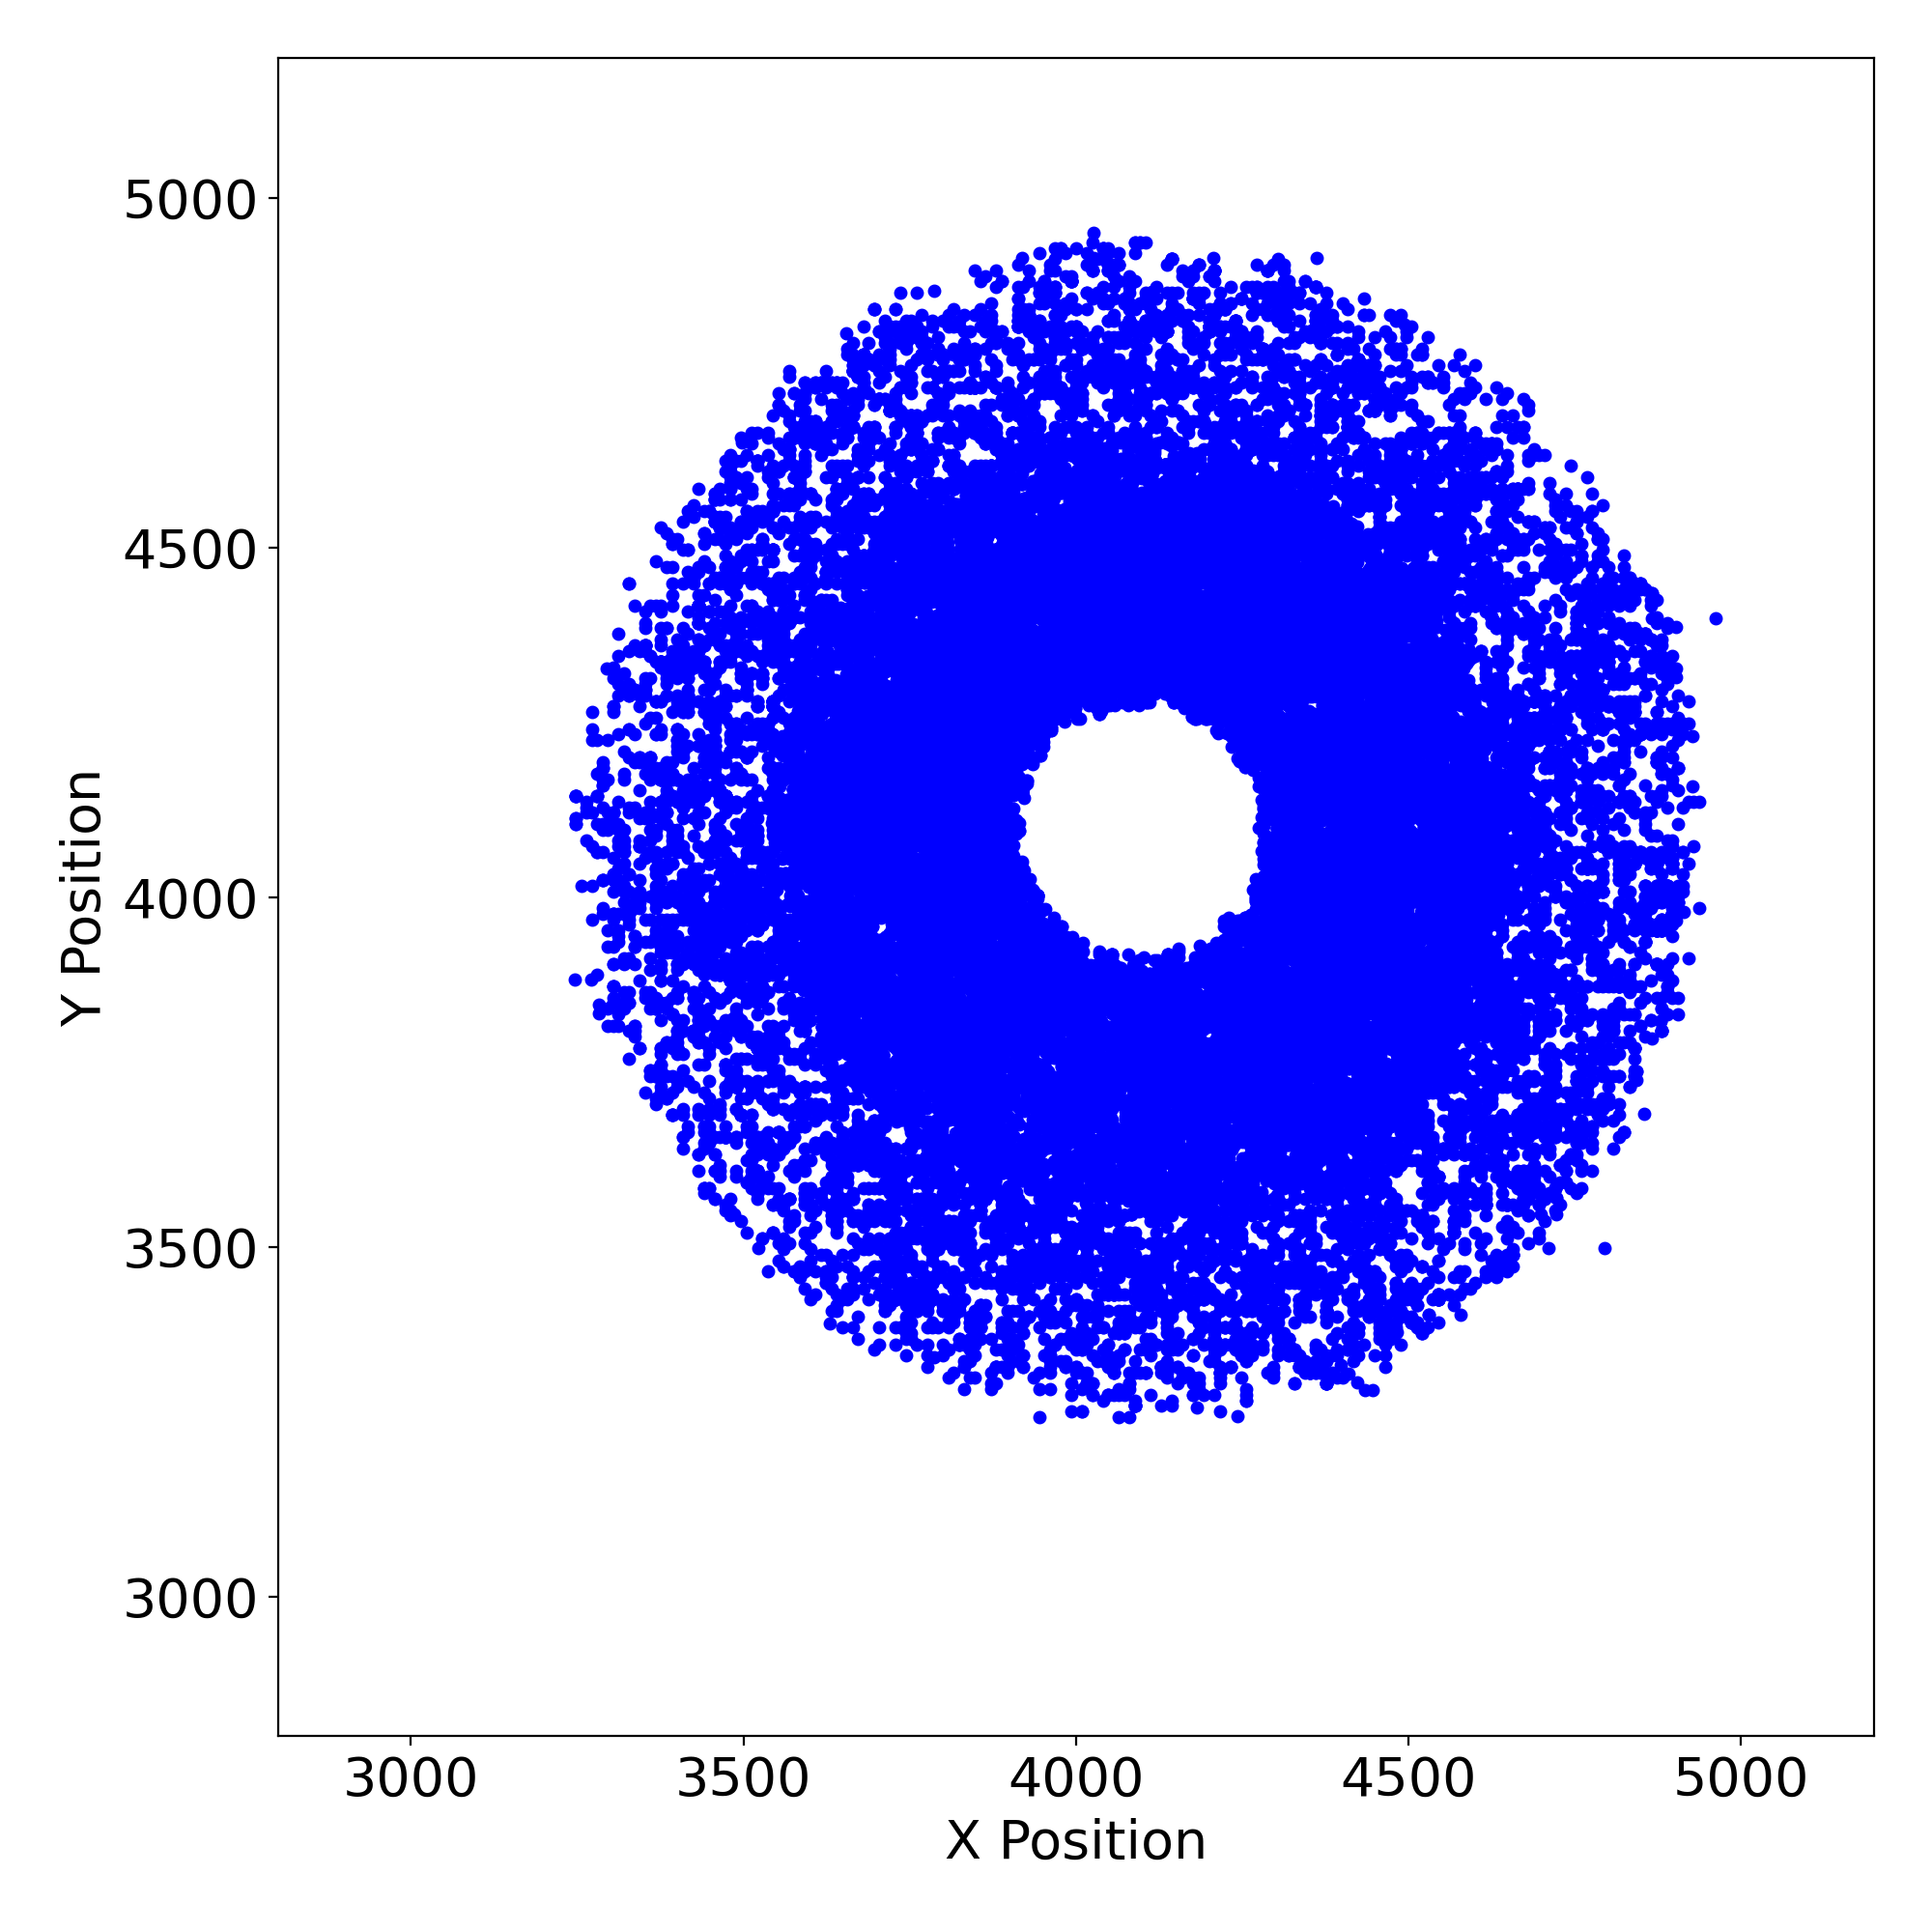 |
 |
 |
 |
 |
 |
 |
| ACIS S | 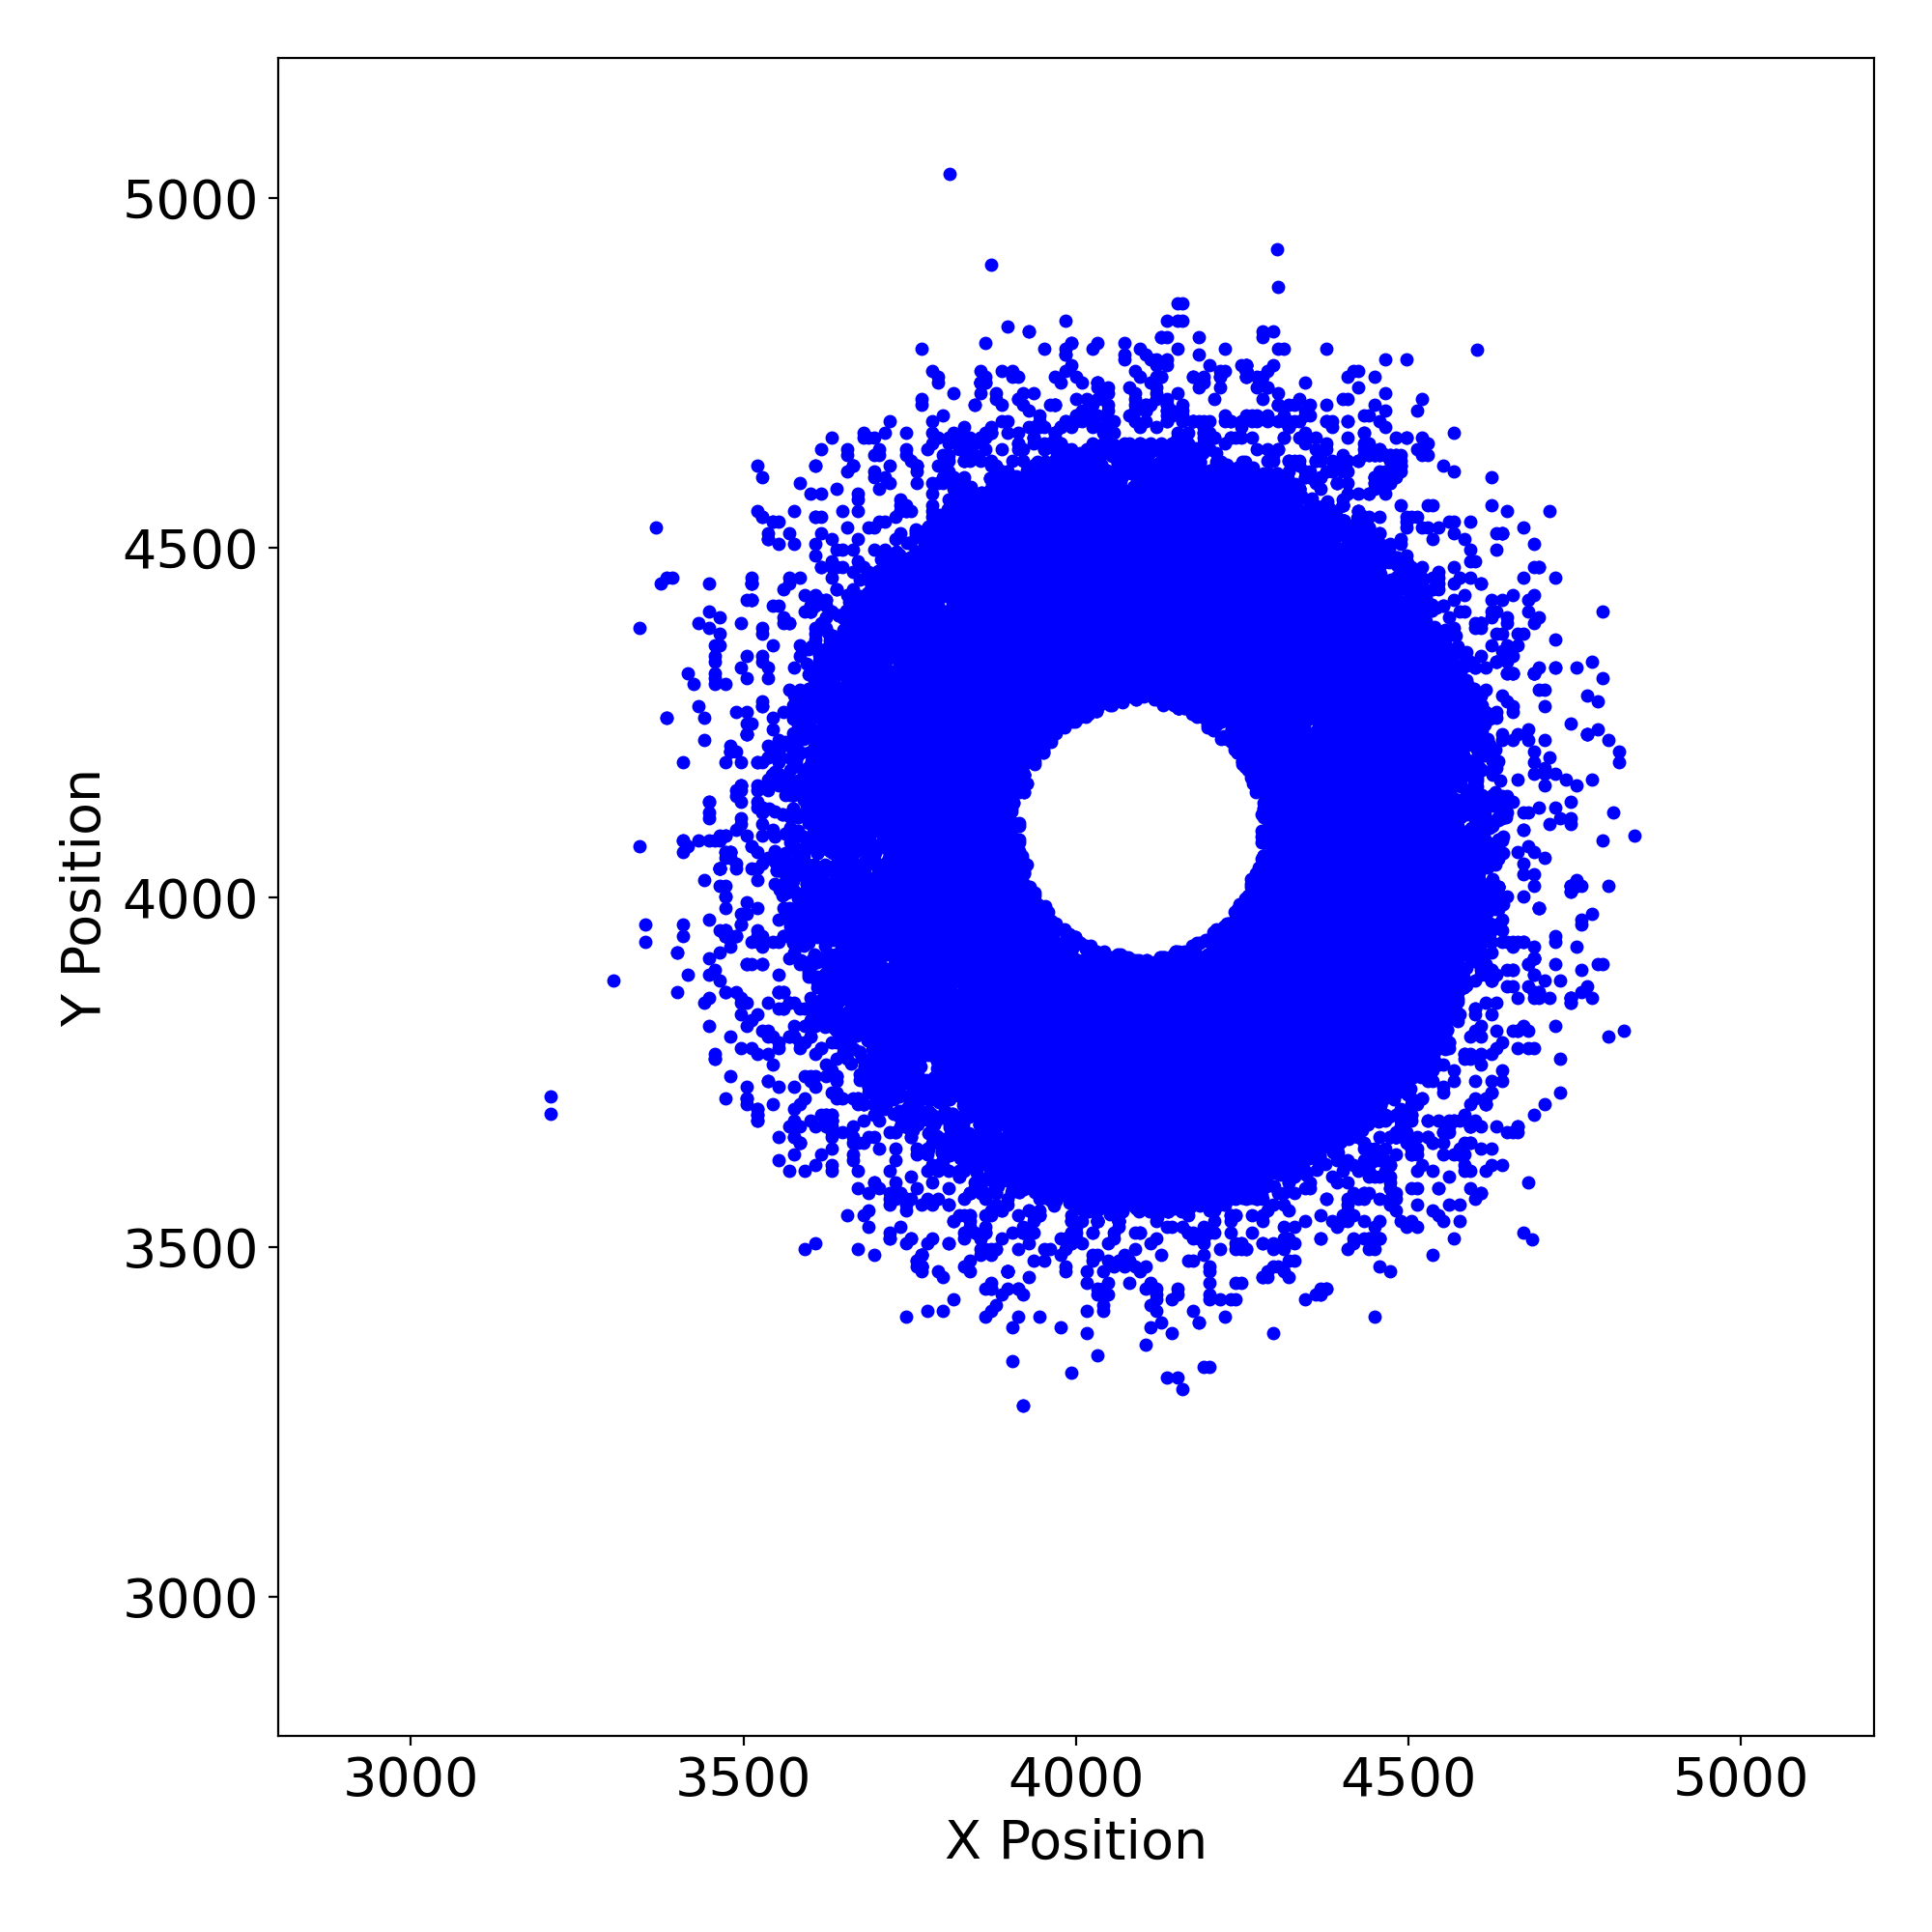 |
 |
 |
 |
 |
 |
 |
| HRC I | 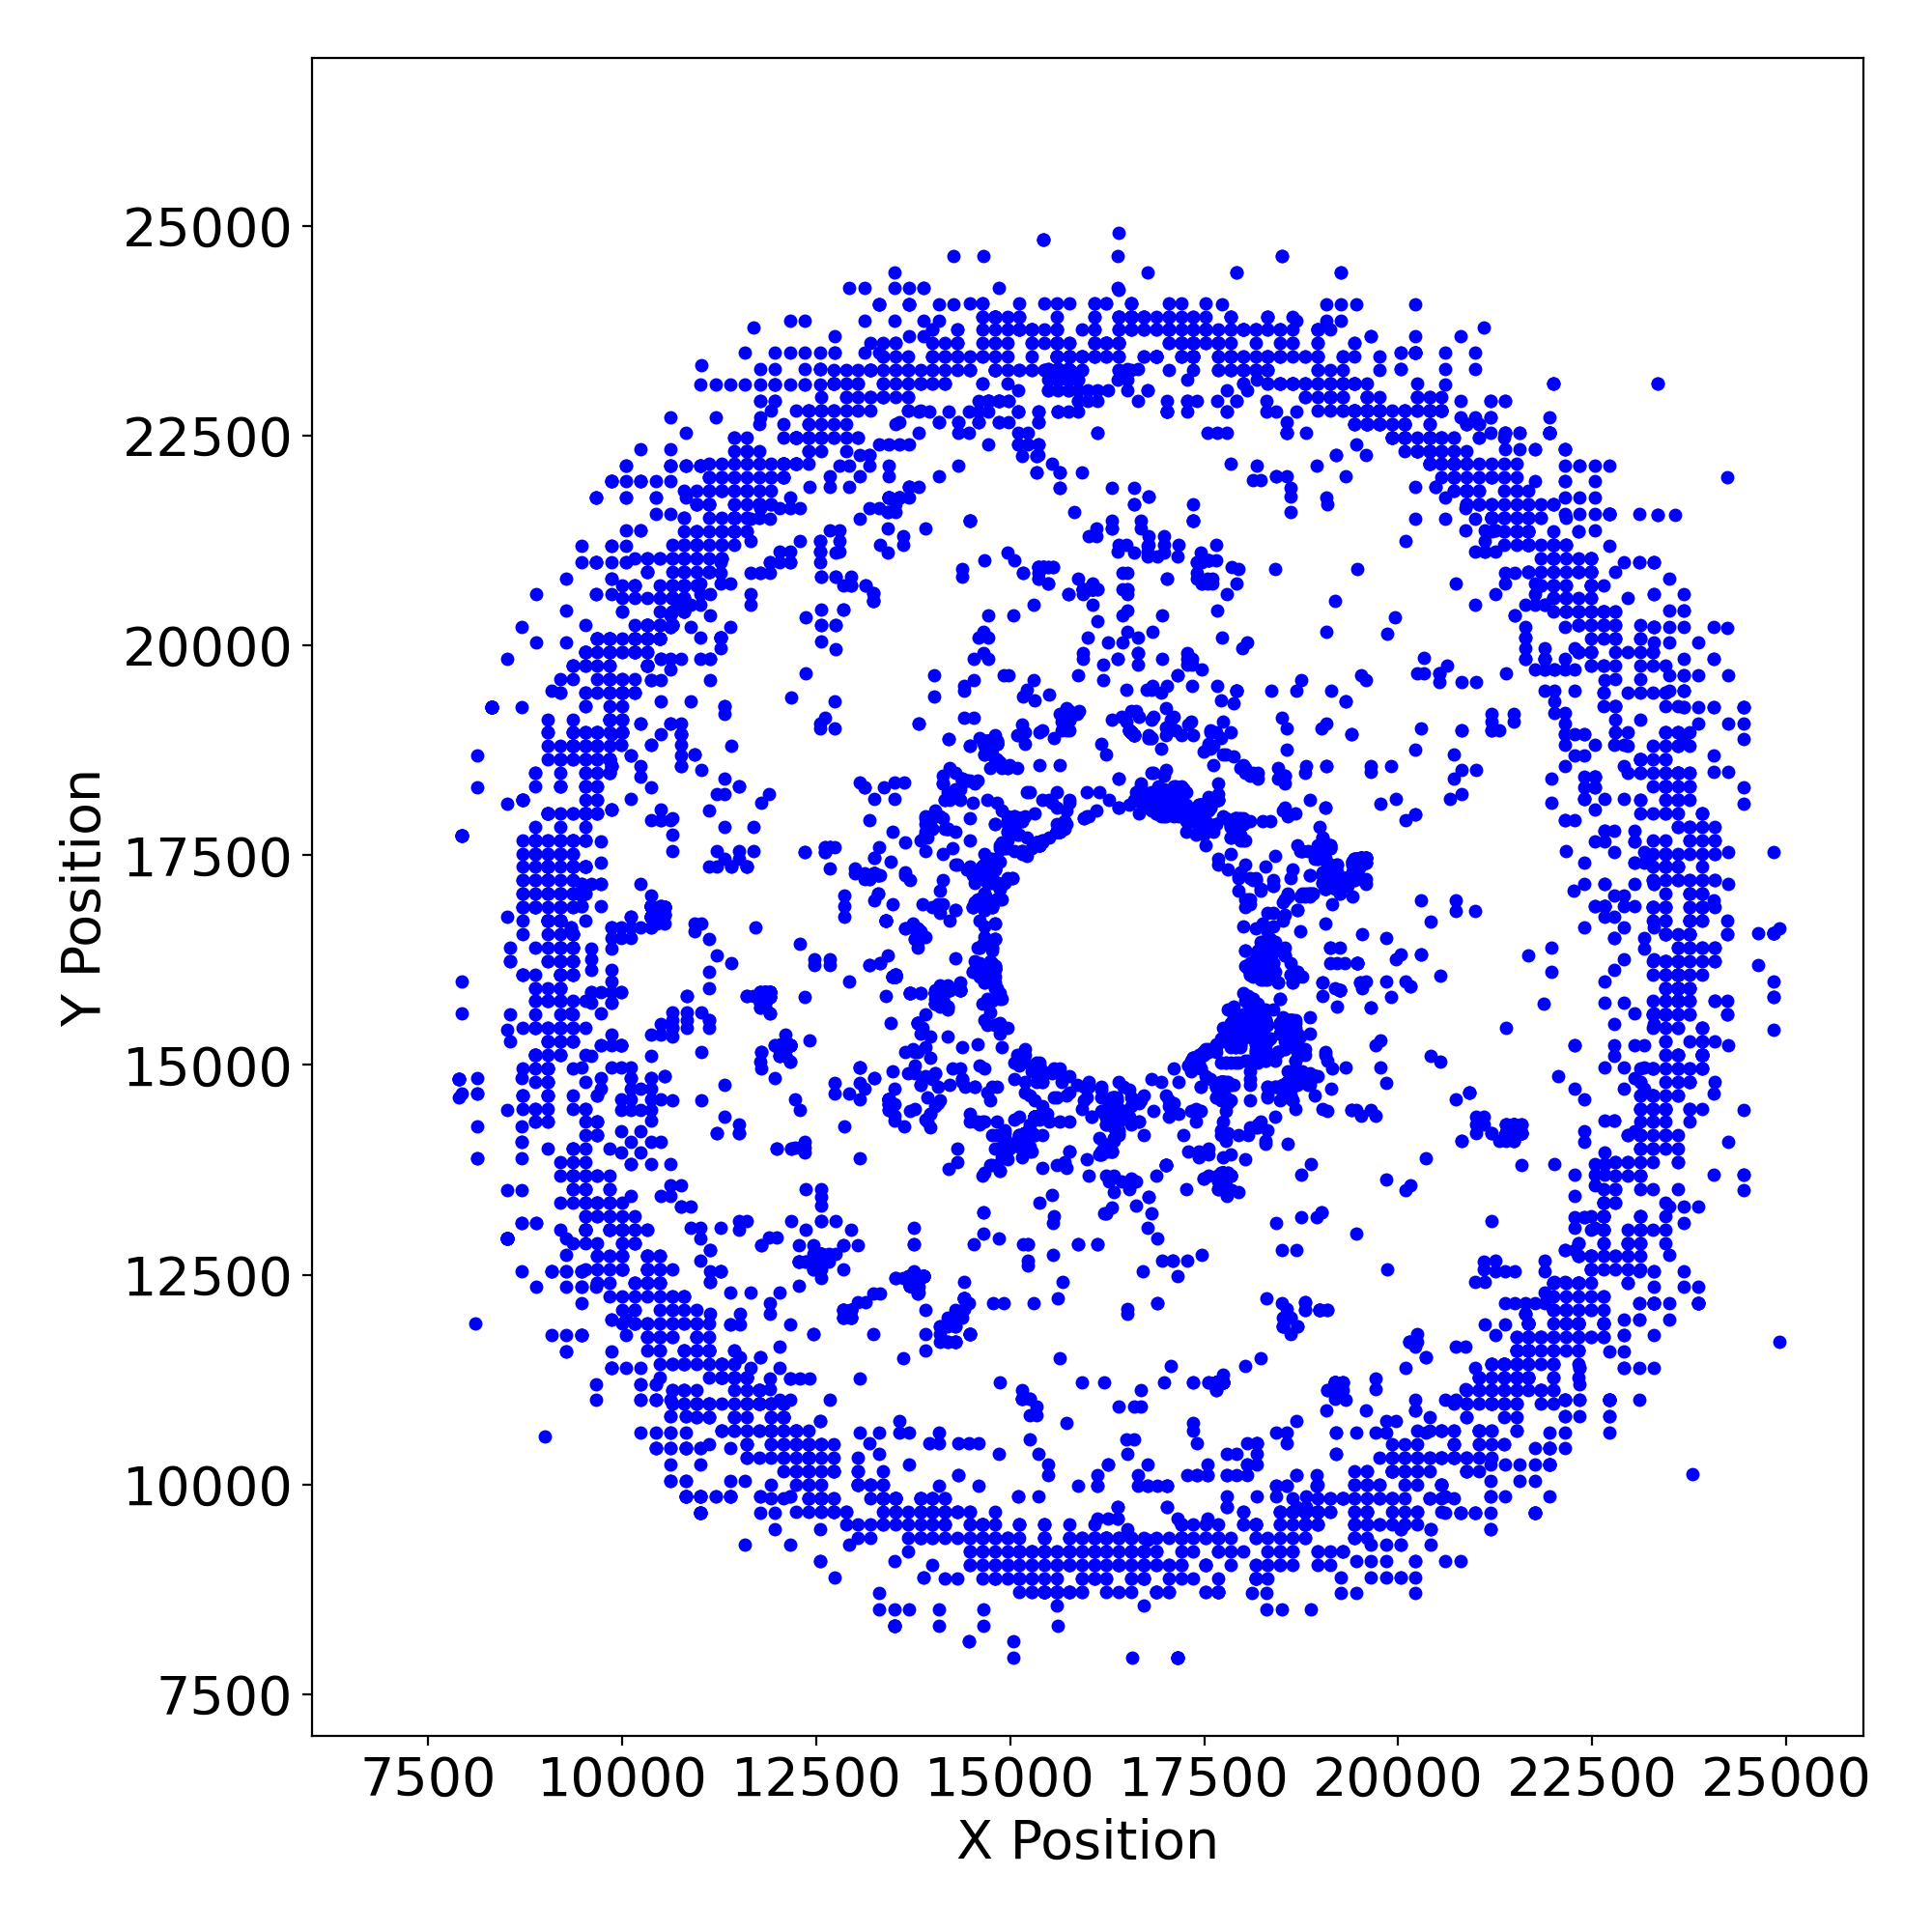 |
 |
 |
 |
 |
 |
 |
| HRC S | 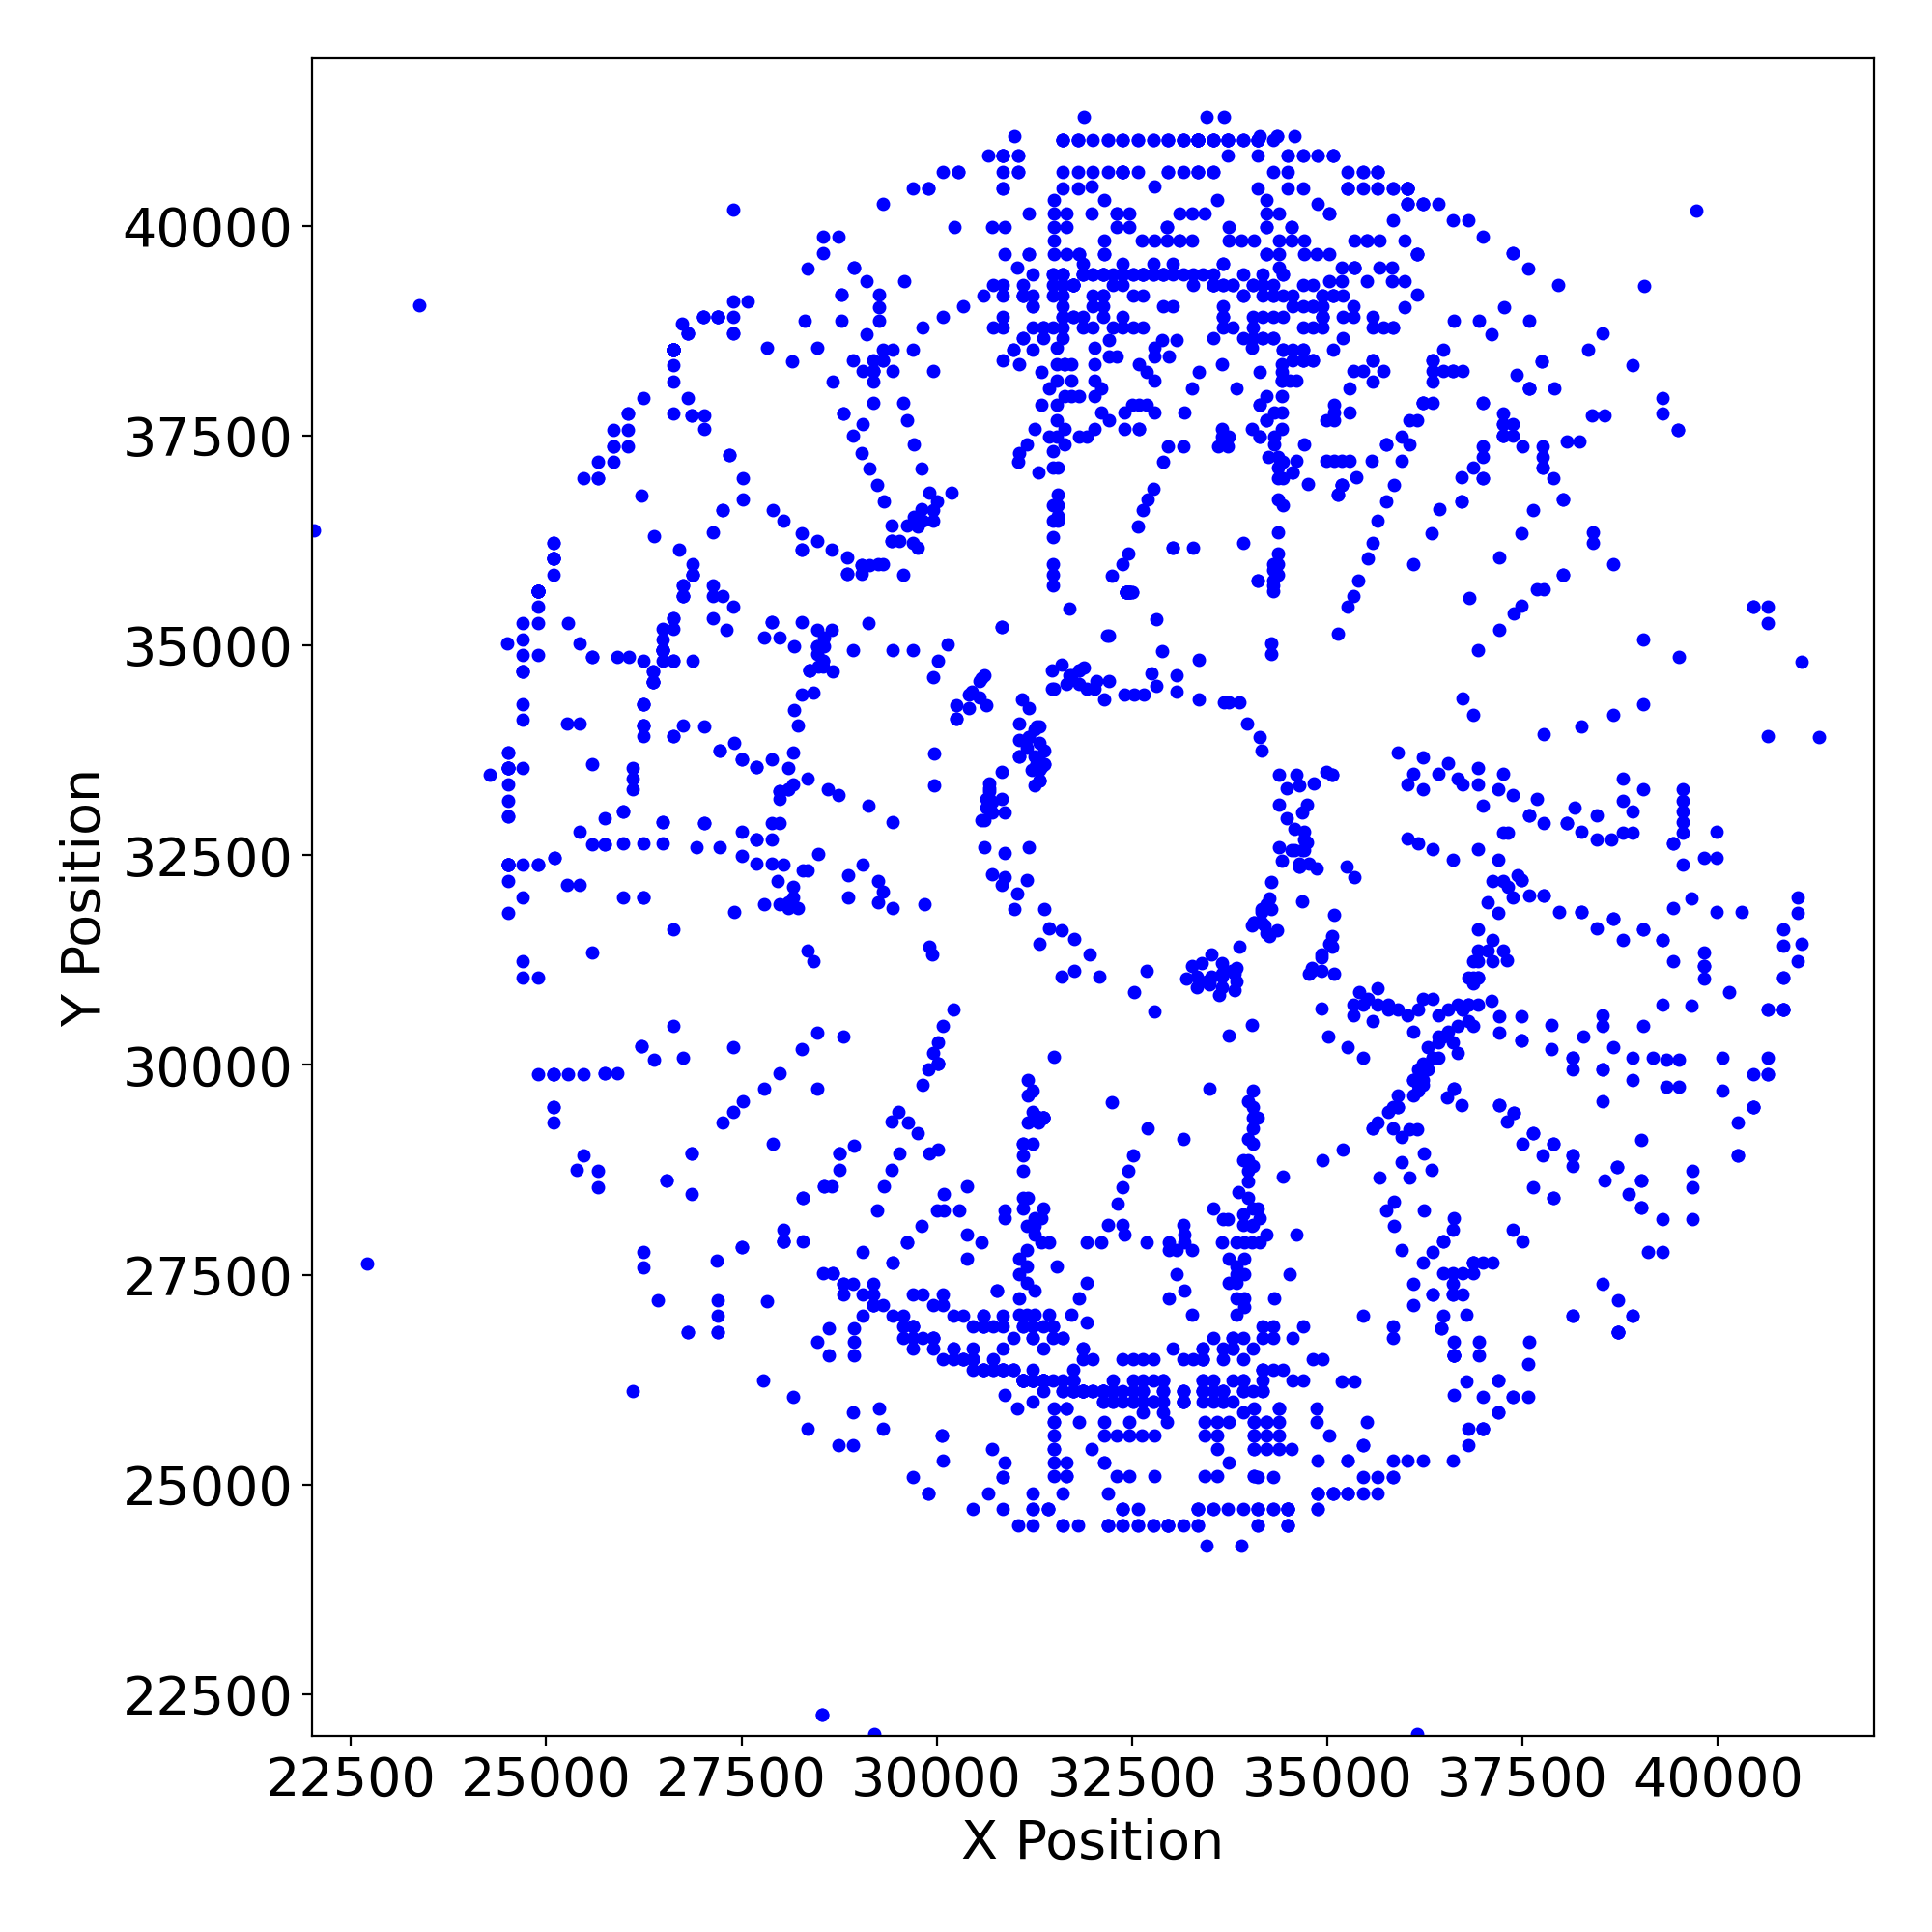 |
 |
 |
 |
 |
 |
 |
Gratings
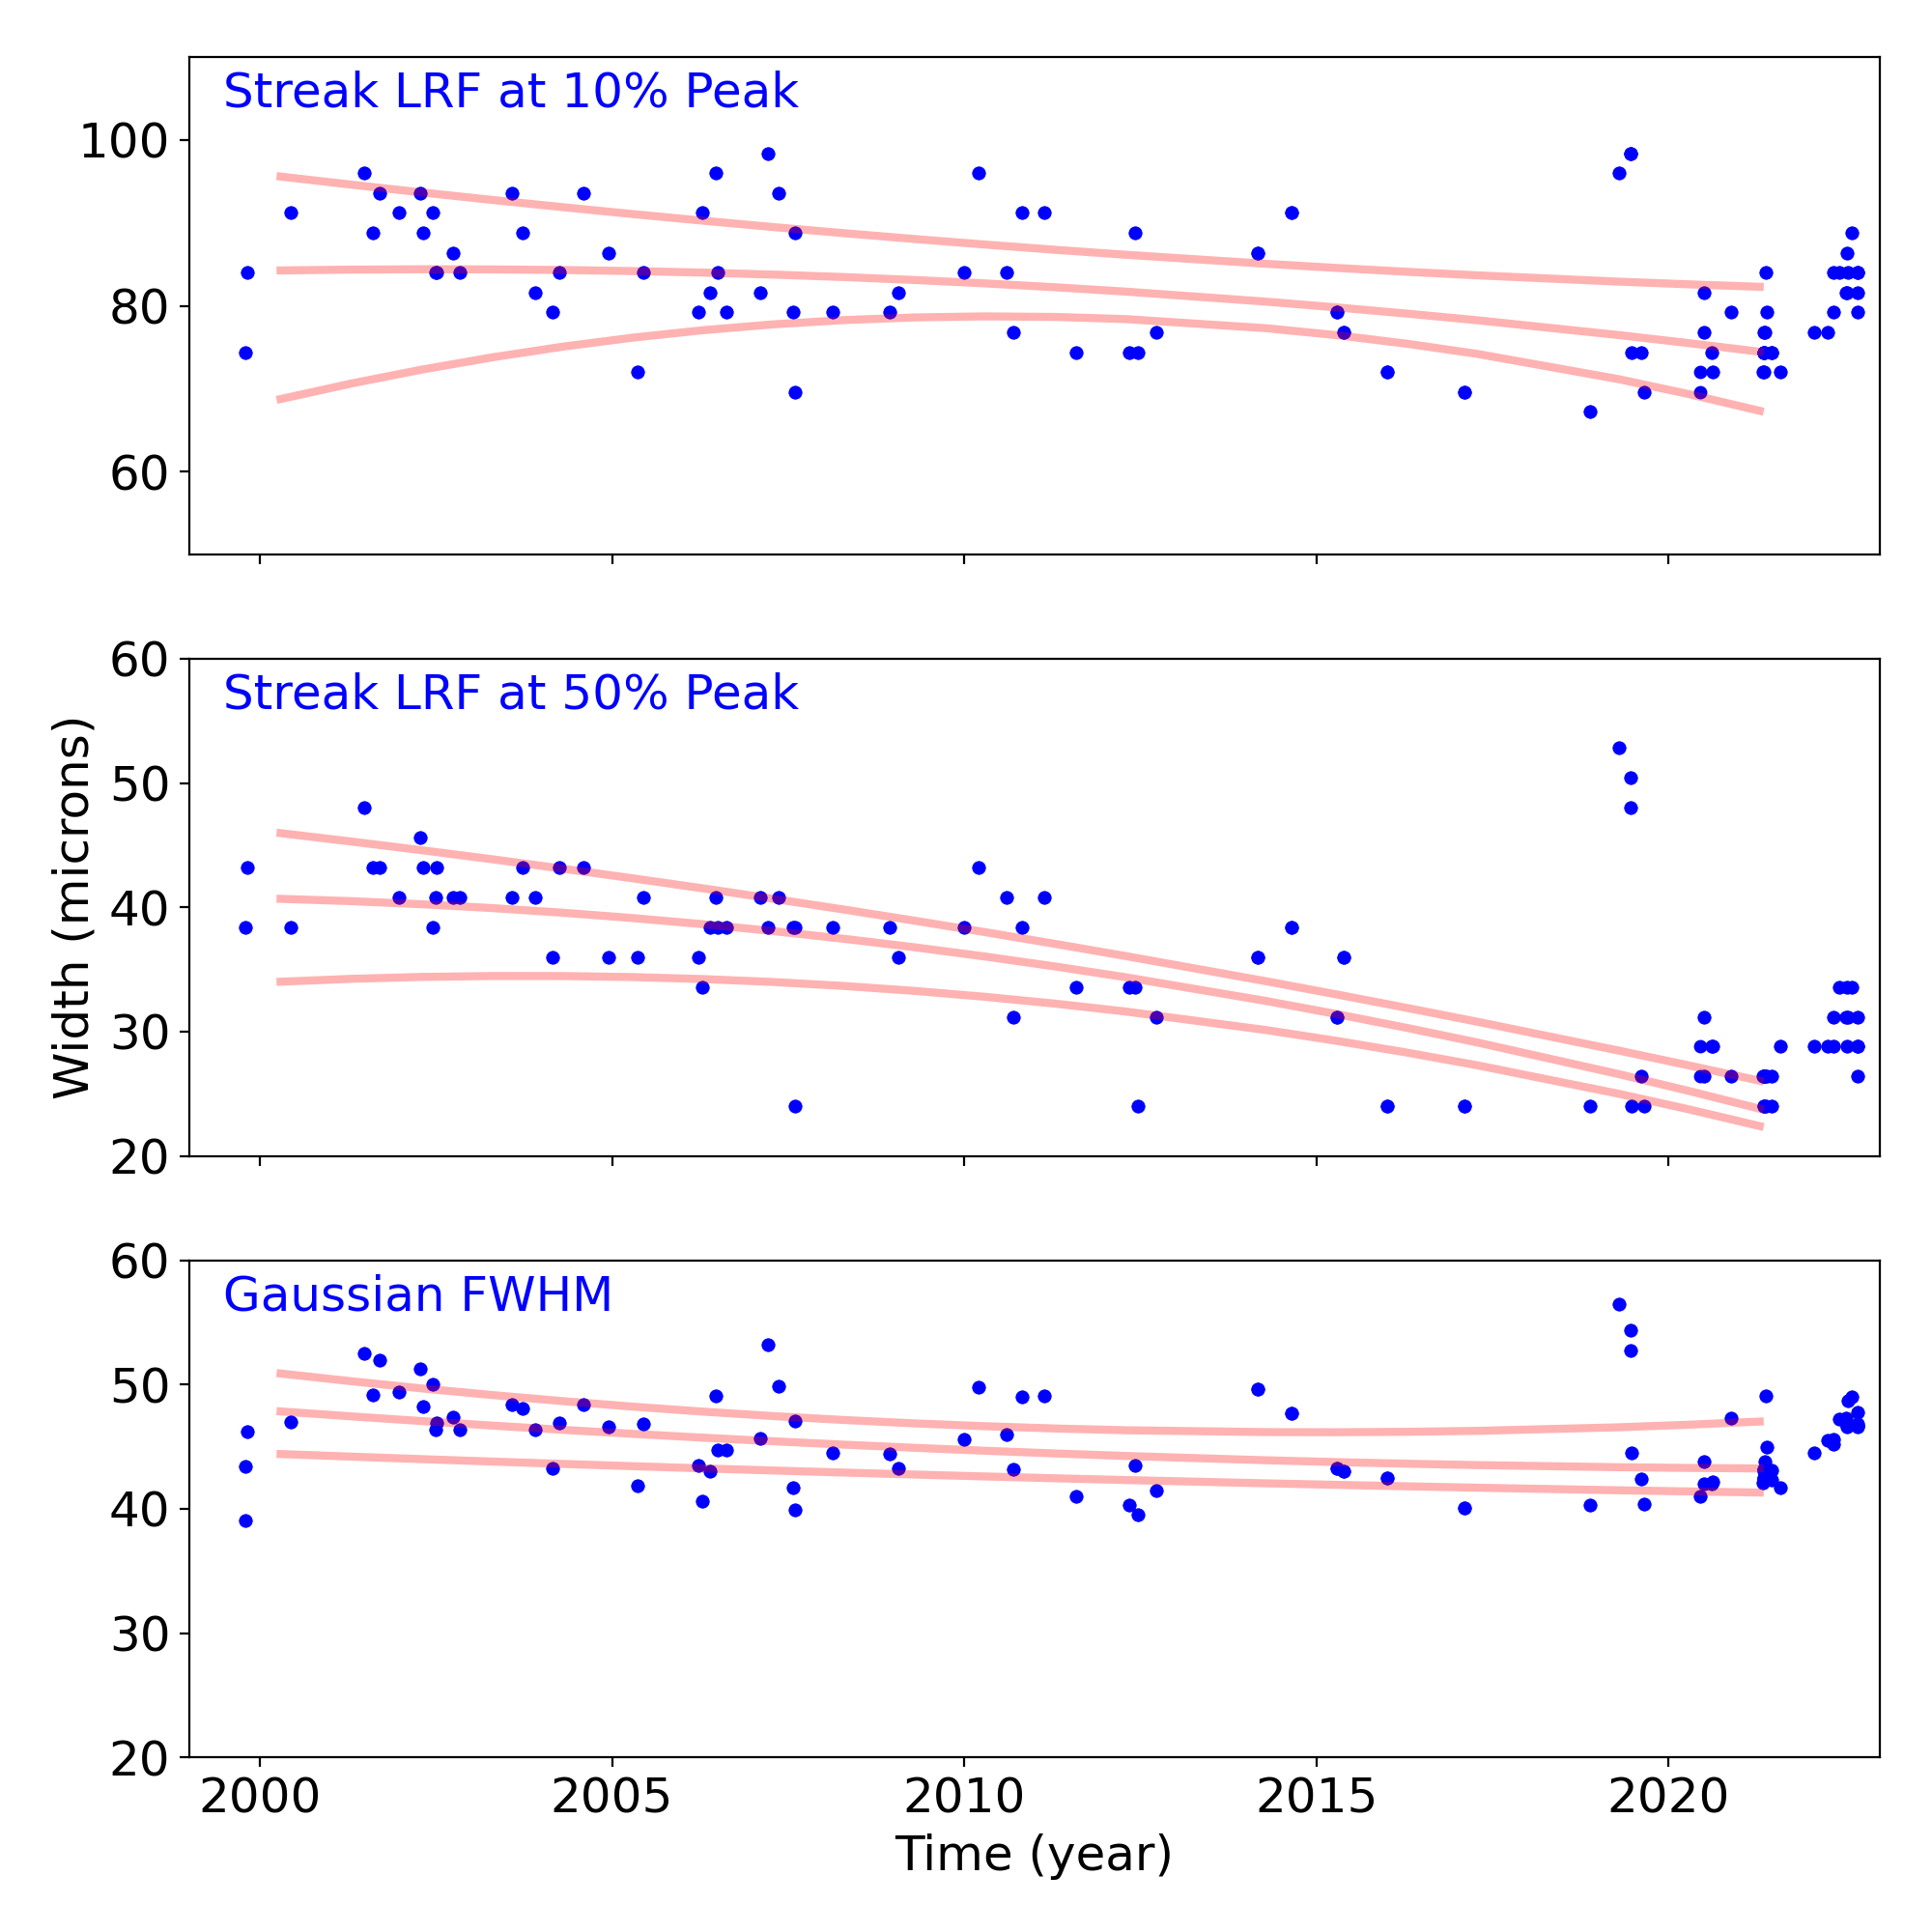
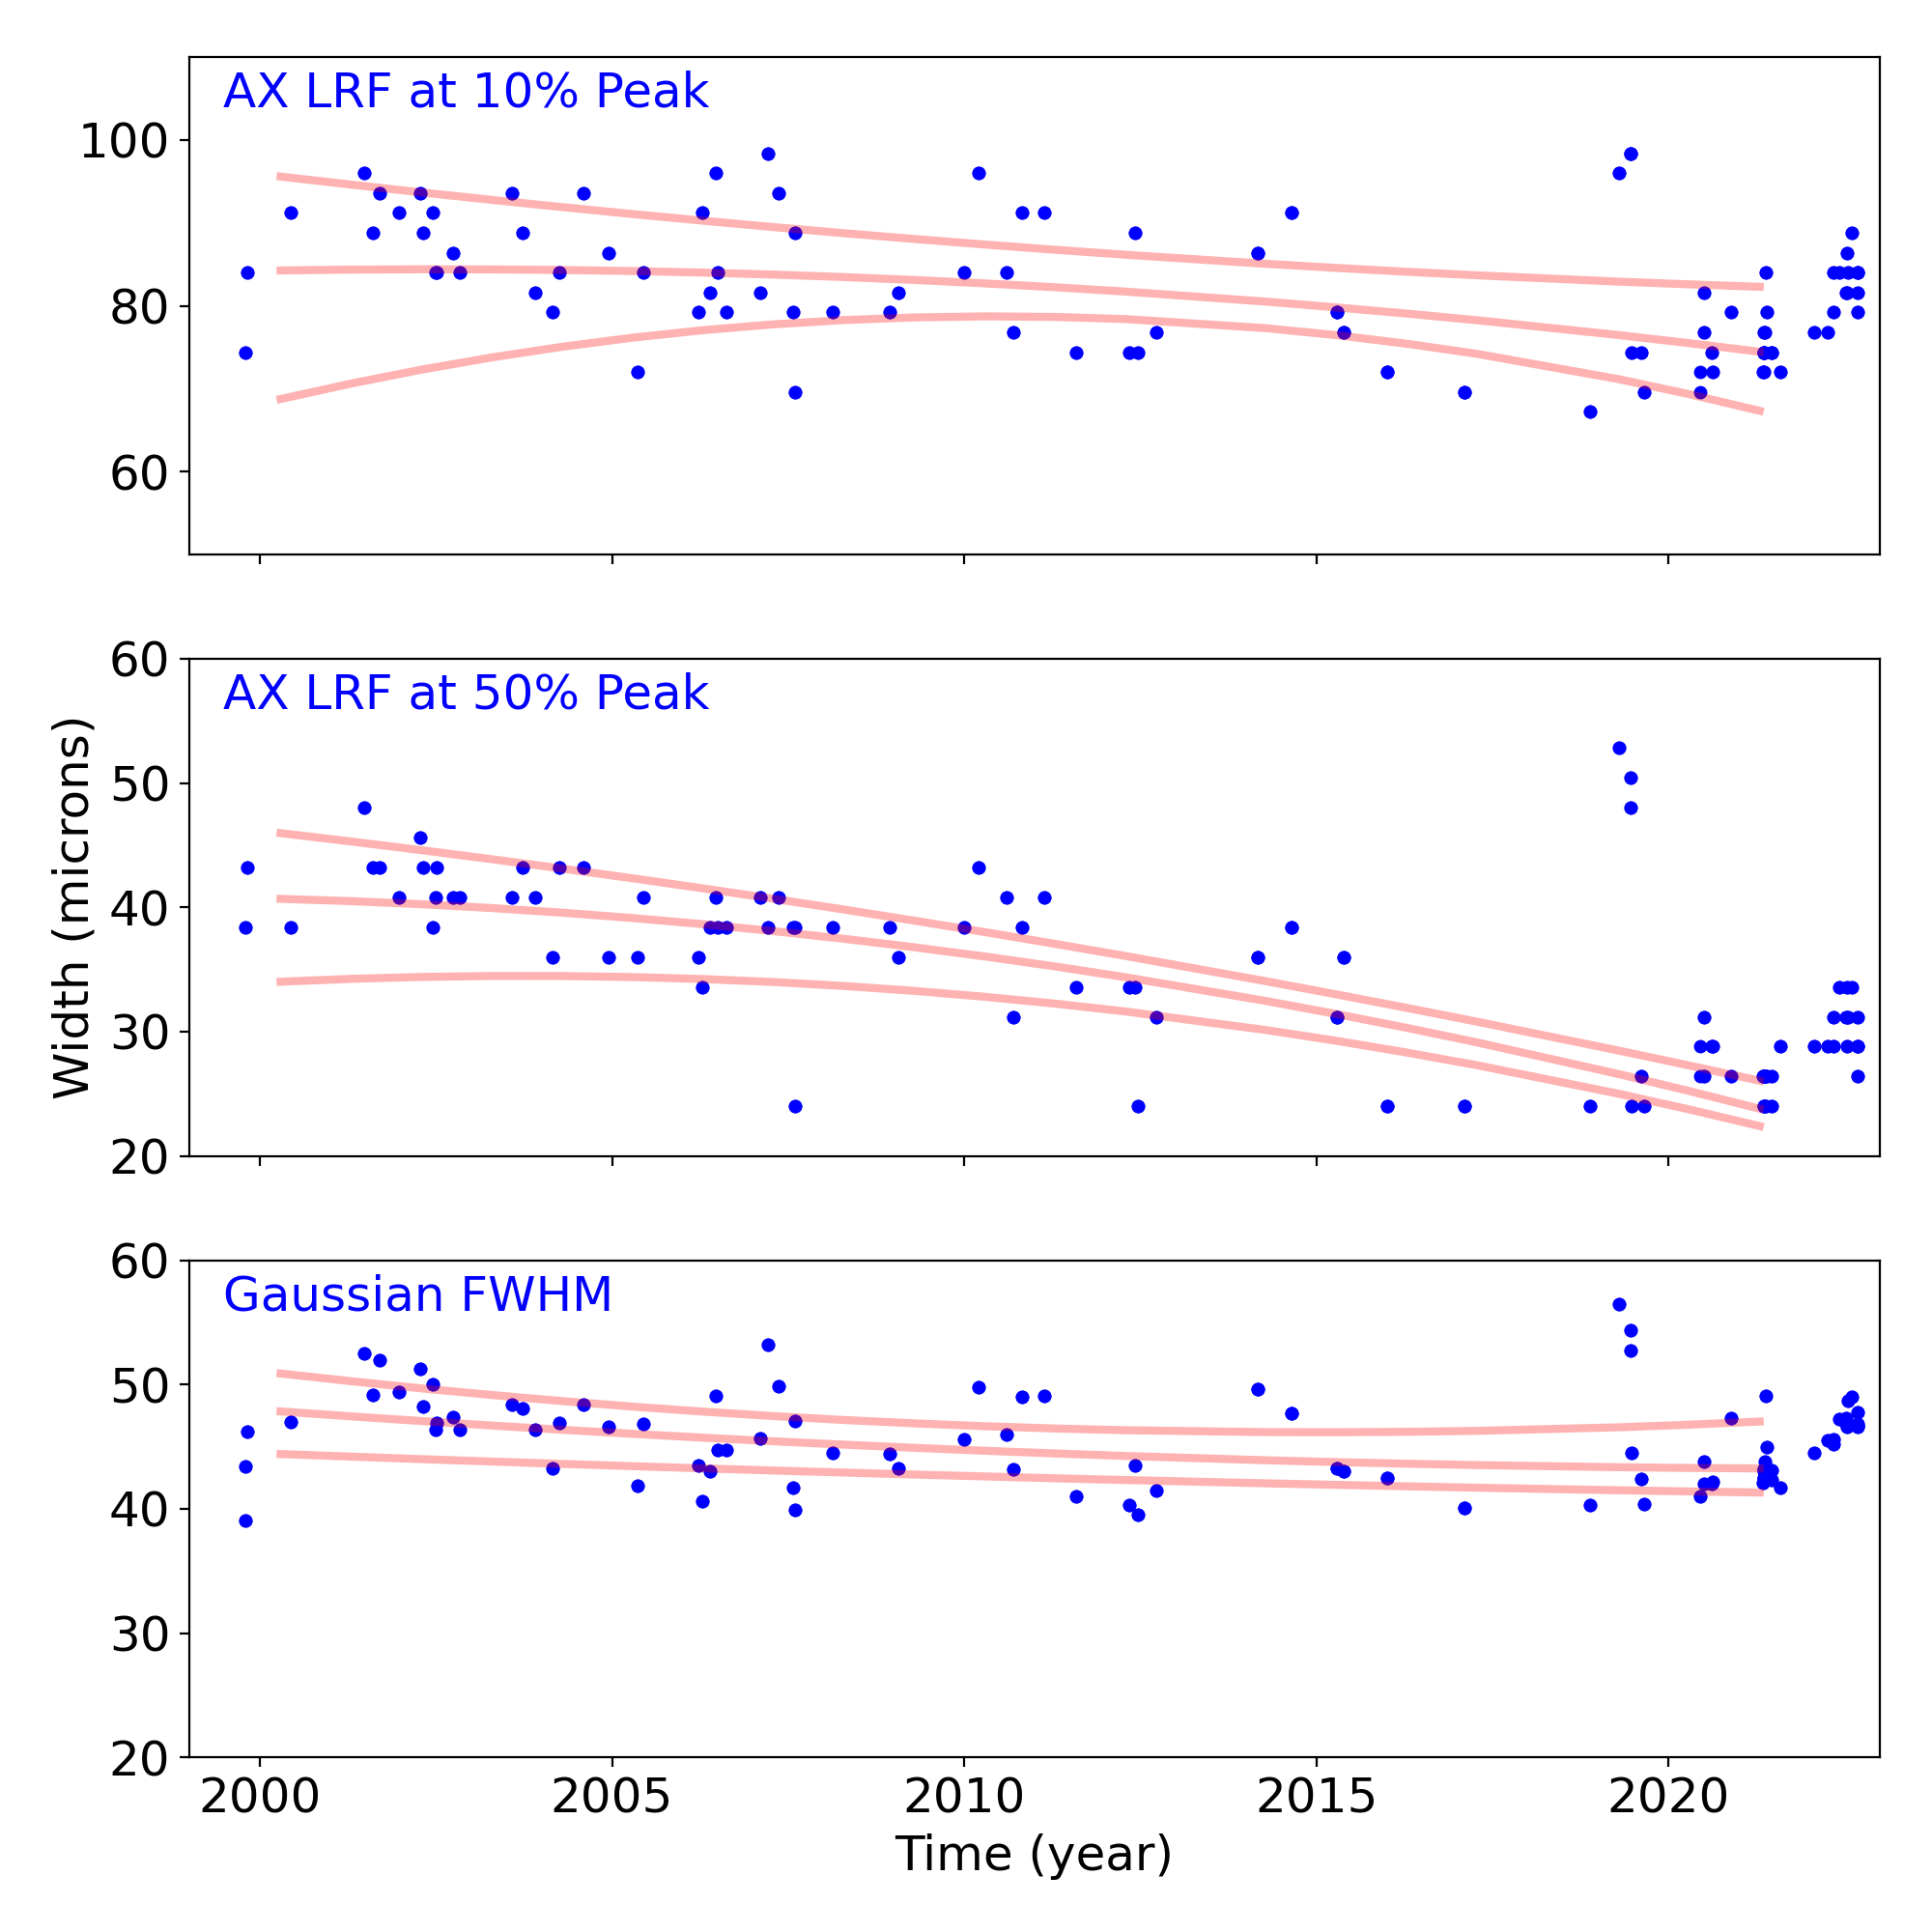
Grating Trends/Focus
We plot the width of the zero order streak of ACIS/HETG observations and the width of the zero order image for HRC/LETG observations of point sources. No significant defocusing trend is seen at this time. See Gratings Trends pages.
PCAD
ACA Trending
| ACIS |
)
|
)
|
)
|
|
|---|---|---|---|---|
)
|
)
|
)
| ||
| HRCI |
)
|
)
|
)
|
)
|
| HRCI |
)
|
)
|
)
|
)
|
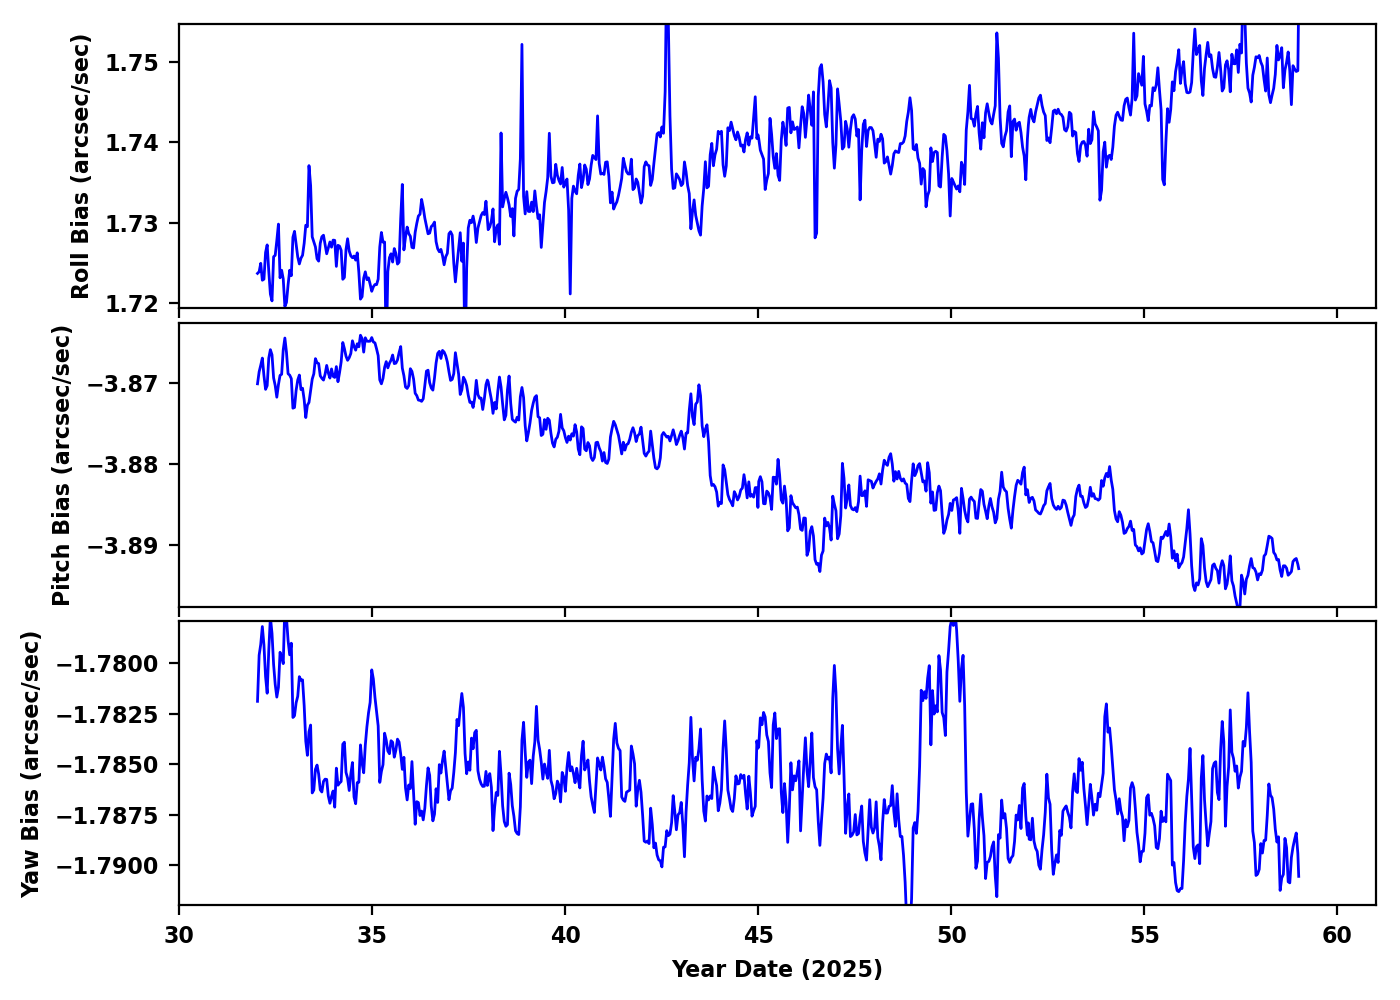
Gyro Bias Drift
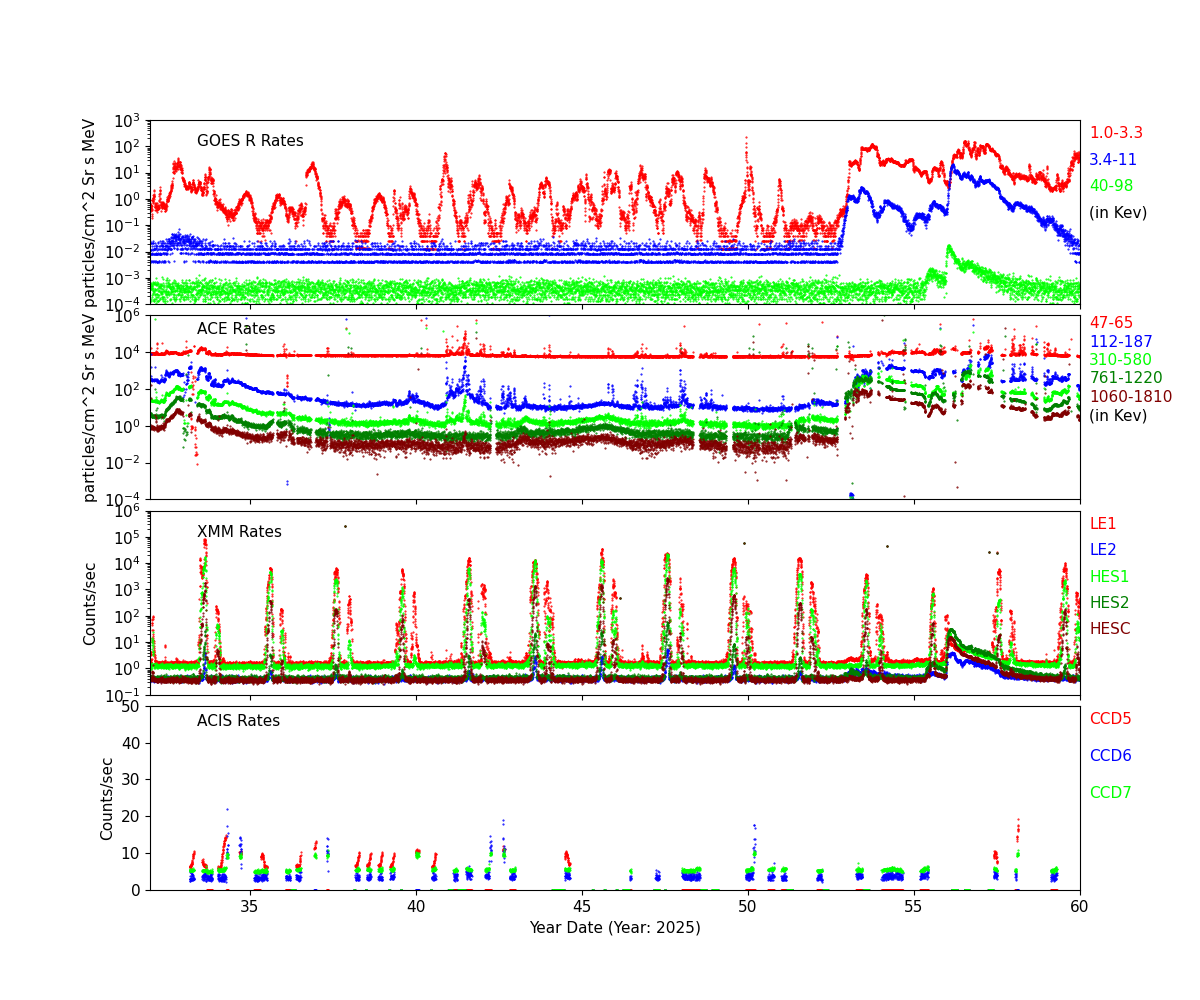
Radiation History
Radiation Count Rates of Feb 2025
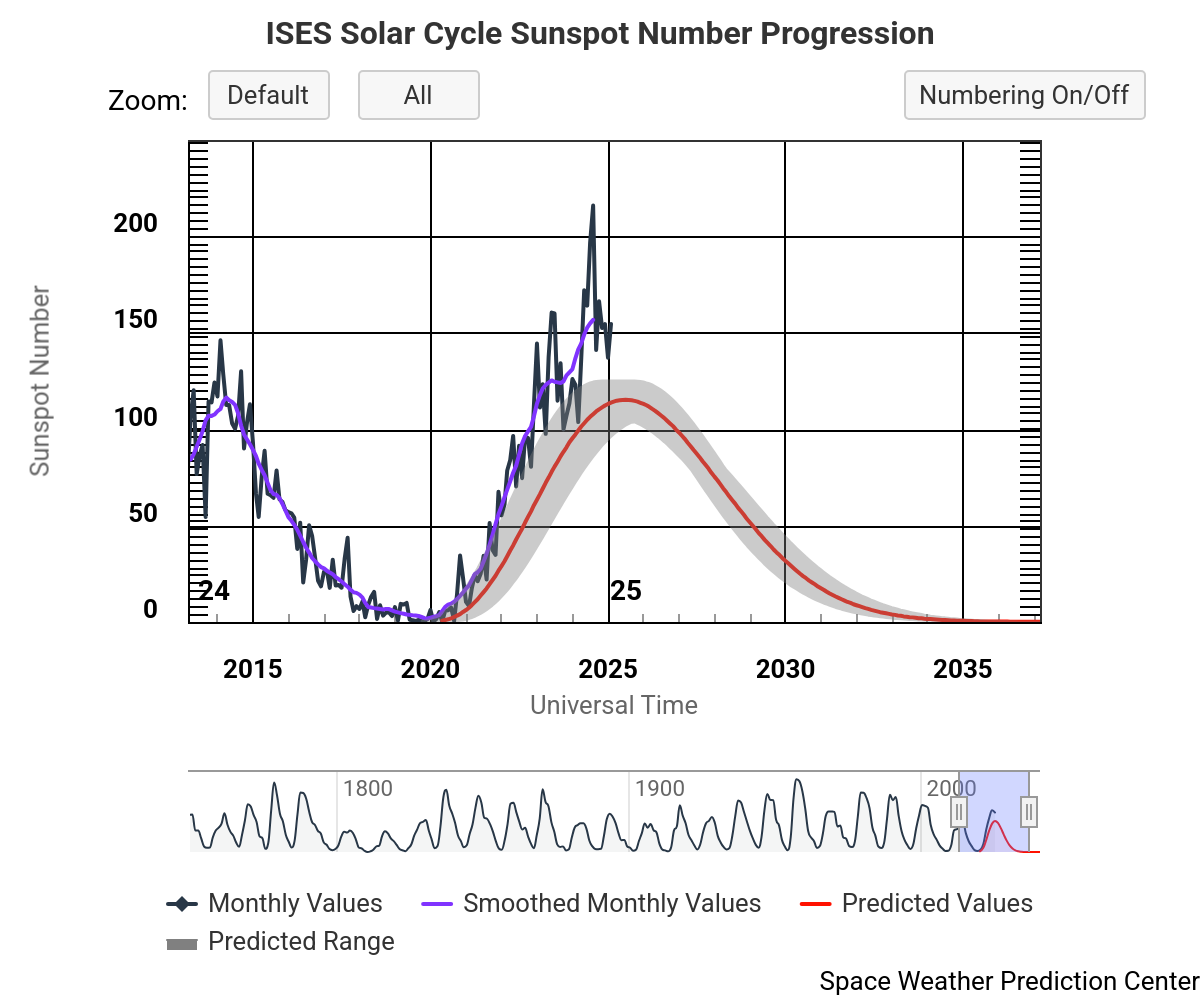
Sun Spot History (See:NOAA Page)
Trending
Quarterly Trends
- HRC Temperature
| Previous Quarter | |||||||
| MSID | MEAN | RMS | DELTA/YR | DELTA/YR/YR | UNITS | DESCRIPTION | |
| 2ceahvpt | 0.001 | 5.568e-04 | (2.79+/-0.01)e2 | 0.14 +/- 0.41 | K | CEA RADIATOR TEMPERATURE AT CENTER | |
|---|---|---|---|---|---|---|---|
| 2chtrpzt | 7.657e-04 | 5.485e-04 | (2.76+/-0.01)e2 | 0.15 +/- 0.40 | K | CENTRAL ELECTRONICS BOX TEMP | |
| 2condmxt | 0.001 | 8.217e-04 | (2.70+/-0.02)e2 | -0.87 +/- 0.54 | K | CONDUIT -X FACE TEMPERATURE | |
| 2dcentrt | 7.479e-04 | 2.794e-04 | (2.74+/-0.01)e2 | 0.17 +/- 0.21 | K | DETECTOR HOUSING TEMP 2 | |
| 2dtstatt | 0.003 | 4.523e-04 | (2.70+/-0.01)e2 | 0.07 +/- 0.32 | K | DETECTOR HOUSING TEMP 1 | |
| 2fhtrmzt | 0.006 | 0.001 | (2.65+/-0.03)e2 | -1.01 +/- 0.91 | K | FRONT END ELECTRONICS BOX TEMPERATURE | |
| 2fradpyt | 0.005 | 0.001 | (2.63+/-0.03)e2 | -1.18 +/- 0.88 | K | FRONT END ASSEMBLY +Y AT RADIATOR CENTER TEMP | |
| 2pmt1t | -0.003 | 6.786e-04 | (2.83+/-0.02)e2 | 0.12 +/- 0.42 | K | PMT 1 TEMPERATURE | |
| 2pmt2t | -0.002 | 6.911e-04 | (2.83+/-0.02)e2 | 0.21 +/- 0.43 | K | PMT 2 TEMPERATURE | |
| 2uvlspxt | -6.398e-04 | 4.948e-04 | (2.75+/-0.01)e2 | 0.36 +/- 0.36 | K | UV LIGHT SHIELD NEXT TO SNOUT TEMP | |
- HRC HK
| Previous Quarter | |||||||
| MSID | MEAN | RMS | DELTA/YR | DELTA/YR/YR | UNITS | DESCRIPTION | |
| 2fe00atm | -3.621e-04 | 0.006 | -1.20 +/- 3.15 | 0.56 +/- 0.12 | C | Front end temperature | |
|---|---|---|---|---|---|---|---|
| 2fepratm | on | 0.075 | 0.004 | 25.19 +/- 1.89 | -2.48 +/- 1.79 | C | FE temp card temperature | off | 3.976e-04 | 0.005 | -1.11 +/- 3.12 | 0.57 +/- 0.11 |
| 2imhvatm | on | 0.046 | 0.003 | 31.71 +/- 1.25 | -1.31 +/- 1.13 | C | Imaging det HVPS temperature | off | 0.008 | 0.003 | 16.31 +/- 1.64 | -0.02 +/- 0.12 |
| 2iminatm | on | 0.064 | 0.003 | 20.52 +/- 1.59 | -1.25 +/- 1.57 | C | Imaging det temperature | off | 0.002 | 0.001 | 1.29 +/- 0.67 | 0.27 +/- 0.06 |
| 2lvplatm | on | 0.036 | 0.003 | 28.00 +/- 1.17 | -1.19 +/- 1.10 | C | LVPS plate temperature | off | -0.003 | 0.003 | 10.20 +/- 1.51 | 0.14 +/- 0.09 |
| 2prbscr | on | 0.001 | 1.075e-04 | 1.76 +/- 0.05 | -0.03 +/- 0.05 | AMP | Primary bus current | off | 7.708e-06 | 2.818e-05 | 1.71 +/- 0.02 | (8.30+/-152.50)e-5 |
| 2prbsvl | 9.826e-04 | 2.024e-04 | 26.76 +/- 0.12 | -0.04 +/- 0.01 | V | Primary bus voltage | |
| 2smtratm | on | 2.481e-13 | 2.768e-09 | 5.94 +/- 0.00 | (2.46+/-13.58)e-13 | C | Selected motor temperature | off | -3.541e-15 | 999.000 | 5.66 +/- 0.00 | (2.67+/-1.54)e-14 |
| 2sphvatm | on | -0.002 | 0.003 | 31.48 +/- 1.19 | -0.02 +/- 1.24 | C | Spect det HVPS temperature | off | -0.018 | 0.003 | 16.55 +/- 1.78 | 0.31 +/- 0.08 |
| 2spinatm | on | 0.054 | 0.003 | 19.08 +/- 1.49 | -1.14 +/- 1.53 | C | Spect det temperature | off | -0.001 | 0.001 | 3.46 +/- 0.78 | 0.09 +/- 0.05 |
- PCAD Temperature
| Previous Quarter | |||||||
| MSID | MEAN | RMS | DELTA/YR | DELTA/YR/YR | UNITS | DESCRIPTION | |
| aacccdpt | 5.140e-05 | 7.863e-04 | (2.65+/-0.02)e2 | 0.47 +/- 0.47 | K | AC CCD TEMP (PRI) | |
|---|---|---|---|---|---|---|---|
| aacccdrt | 1.529e-04 | 8.473e-04 | (3.09+/-0.02)e2 | 0.57 +/- 0.51 | K | AC CCD TEMP (RDNT) | |
| aach1t | 2.078e-04 | 8.645e-04 | (3.06+/-0.02)e2 | 0.46 +/- 0.52 | K | AC HOUSING TEMP (ACH1) | |
| aach2t | 2.692e-04 | 8.665e-04 | (3.06+/-0.02)e2 | 0.54 +/- 0.52 | K | AC HOUSING TEMP (ACH2) | |
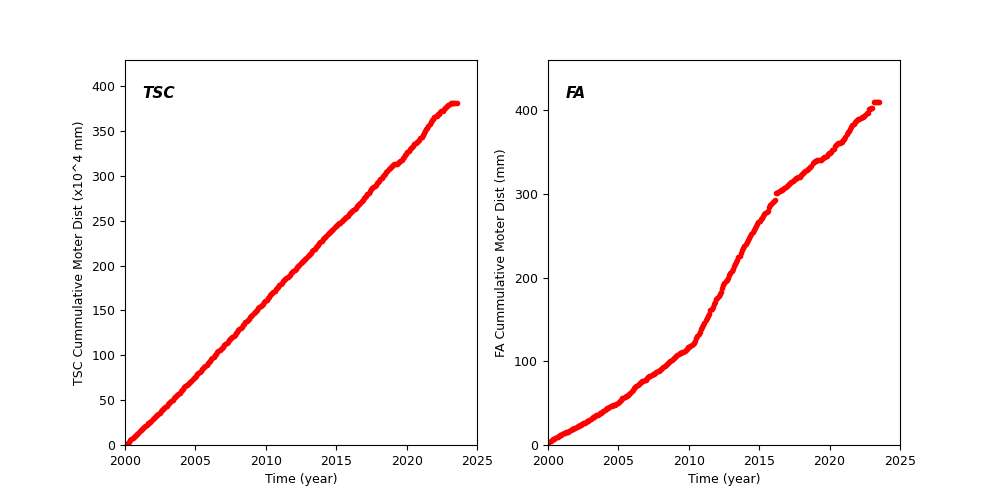
Spacecraft Motions
TSC and FA Cummulative Moter Distance
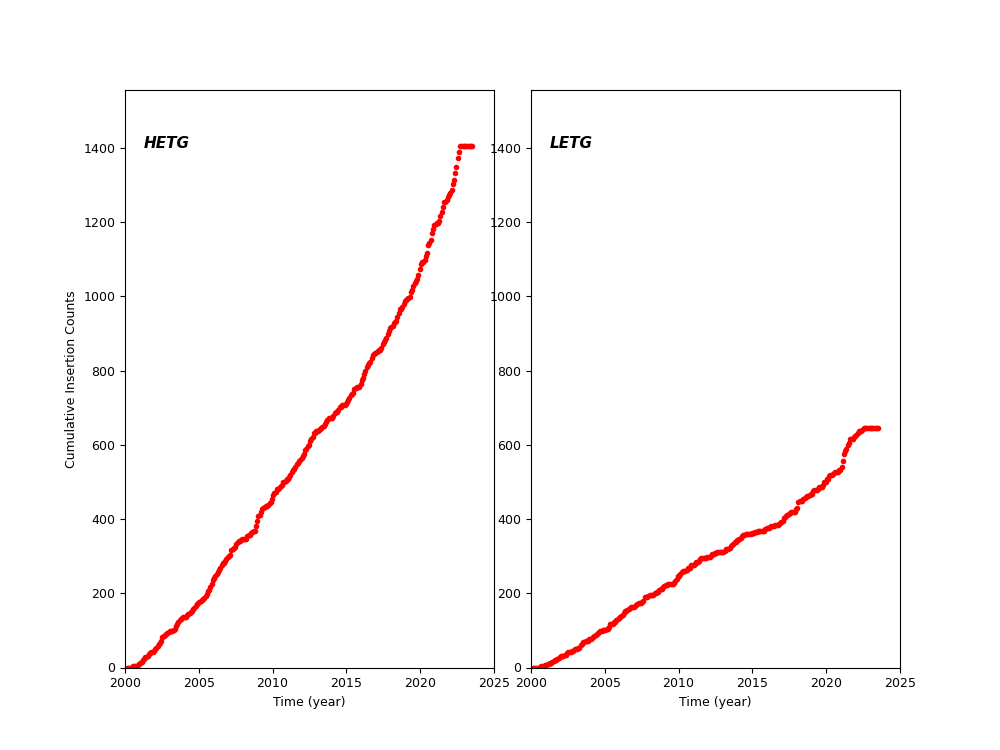
HETG and LETG Cummulative Insertion Counts
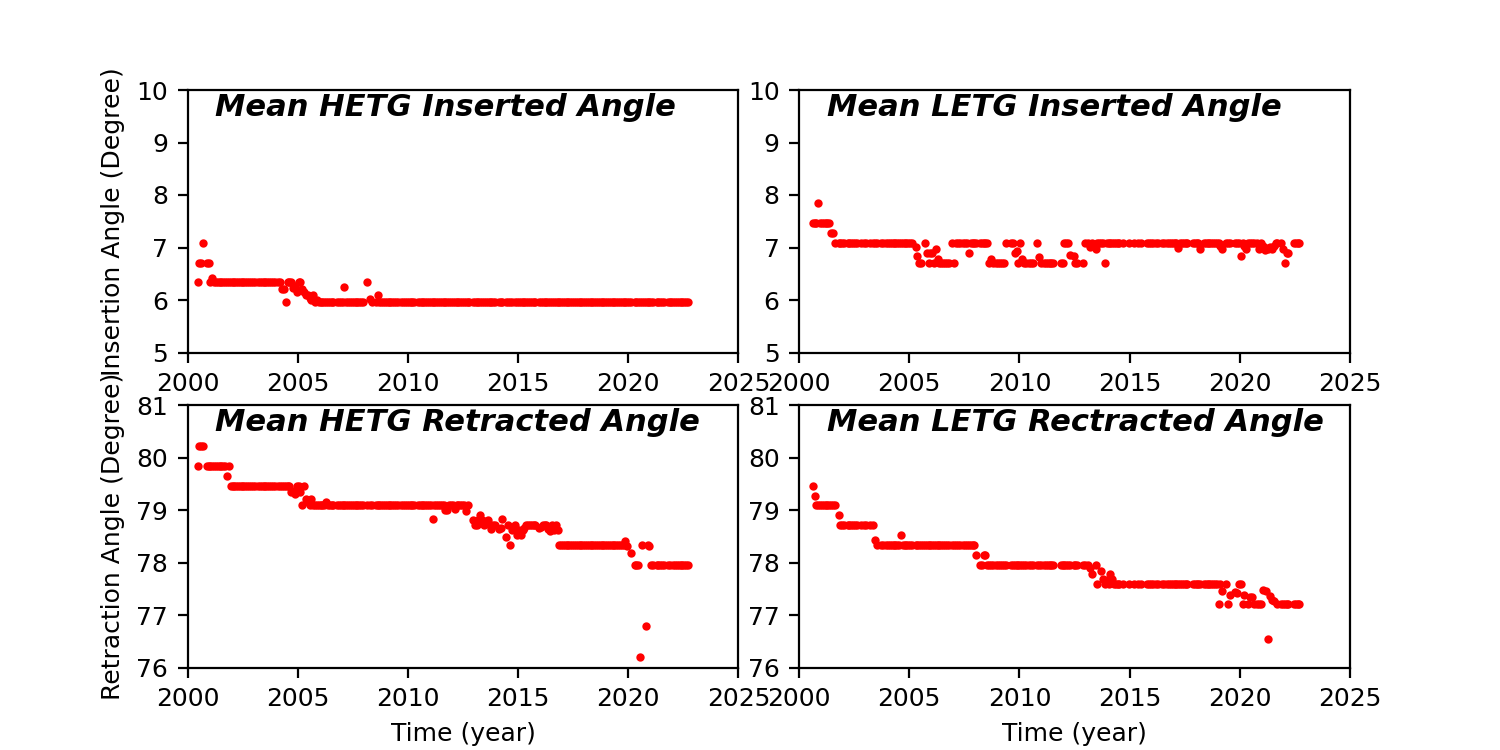
HETG/LETG Insertion/Retraction Angle
Reaction Wheel Rotations