ACIS
ACIS DOSE Registered-Photon-Map
The steps we took to compute the dose map are;
- Level 1 Event files for a specified month are obtained from archive.
- Image data including I2, I3, S2, S3 CCDs are extracted from all event files.
- All the extracted image data were merged to create a month long exposure map for the month.
- The exposure map is opened with ds9, and check a distribution of count rates against energy. From this, estimate the upper threshold value. Any events beyond this upper threshold are assumed erroneous events such as bad pixels.
- Using this upper threshold, the data is filtered, and create a cleaned exposure map for the month.
- The exposure map from each month from the Sep 1999 is added up to create a cumulative exposure map for each month.
- Using fimgstatistic, we compute count rate statistics for each CCDs.
- For observations with high data drop rates (e.g., Crab nebula, Cas A), we corrected the observations by adding events.
Please check more detail plots at Telemetered Photon Dose Trend page.
)
)
)
Statistics:
# IMAGE     NPIX     MEAN        RMS        MIN     MAX
ACIS_aug25 6004901       3.591         5.155           0.0      390


I2 node 0  262654	4.188589	2.460761	0.0	 77.0
I2 node 1  262654	4.905430	3.144256	0.0	 89.0
I2 node 2  262654	4.301118	2.508387	0.0	 86.0
I2 node 3  262654	4.069677	2.589274	0.0	350.0

I3 node 0  262654	6.855229	11.316086	0.0	115.0
I3 node 1  262654	4.054772	2.362831	0.0	110.0
I3 node 2  262654	4.114058	2.432937	0.0	 62.0
I3 node 3  262654	3.924784	2.316088	0.0	104.0

S2 node 0  262654	4.257165	2.376058	0.0	 81.0
S2 node 1  262654	4.302918	2.623366	0.0	212.0
S2 node 2  262654	4.494508	2.686183	0.0	224.0
S2 node 3  262654	4.510605	2.886313	0.0	390.0

S3 node 0  262654	6.652371	10.401333	0.0	287.0
S3 node 1  262654	6.276101	3.127577	0.0	 44.0
S3 node 2  262654	6.071890	2.845354	0.0	 28.0
S3 node 3  262654	5.334318	2.541873	0.0	 32.0
)
)
)
Statistics:
 IMAGE     NPIX      MEAN        RMS           MIN      MAX
ACIS_total   6004901       2743.889         3465.596           0.0   169725


I2 node 0  262654	2382.758596	484.493238	507.0	15942.0
I2 node 1  262654	2513.248175	710.885047	522.0	167719.0
I2 node 2  262654	2539.858932	539.927283	546.0	17654.0
I2 node 3  262654	2544.456446	661.971893	505.0	36734.0

I3 node 0  262654	2749.999134	684.428152	504.0	15485.0
I3 node 1  262654	2828.079314	1758.031289	529.0	56076.0
I3 node 2  262654	2535.650040	476.217221	496.0	15545.0
I3 node 3  262654	2511.772413	513.213032	475.0	36710.0

S2 node 0  262654	3201.632499	518.133361	1724.0	22661.0
S2 node 1  262654	3401.505855	777.673540	1901.0	21400.0
S2 node 2  262654	3773.024514	782.386864	2313.0	33967.0
S2 node 3  262654	3730.373686	640.696361	2038.0	87673.0

S3 node 0  262654	5673.889974	3072.658901	2494.0	55537.0
S3 node 1  262654	6888.644623	2409.317930	0.0	83602.0
S3 node 2  262654	5622.894026	1383.231733	2648.0	27707.0
S3 node 3  262654	4424.169133	784.003864	2657.0	26803.0
)
|
)
|
)
|
)
|
| May 2025 | Feb 2025 | Nov 2024 | Aug 2024 |
|---|
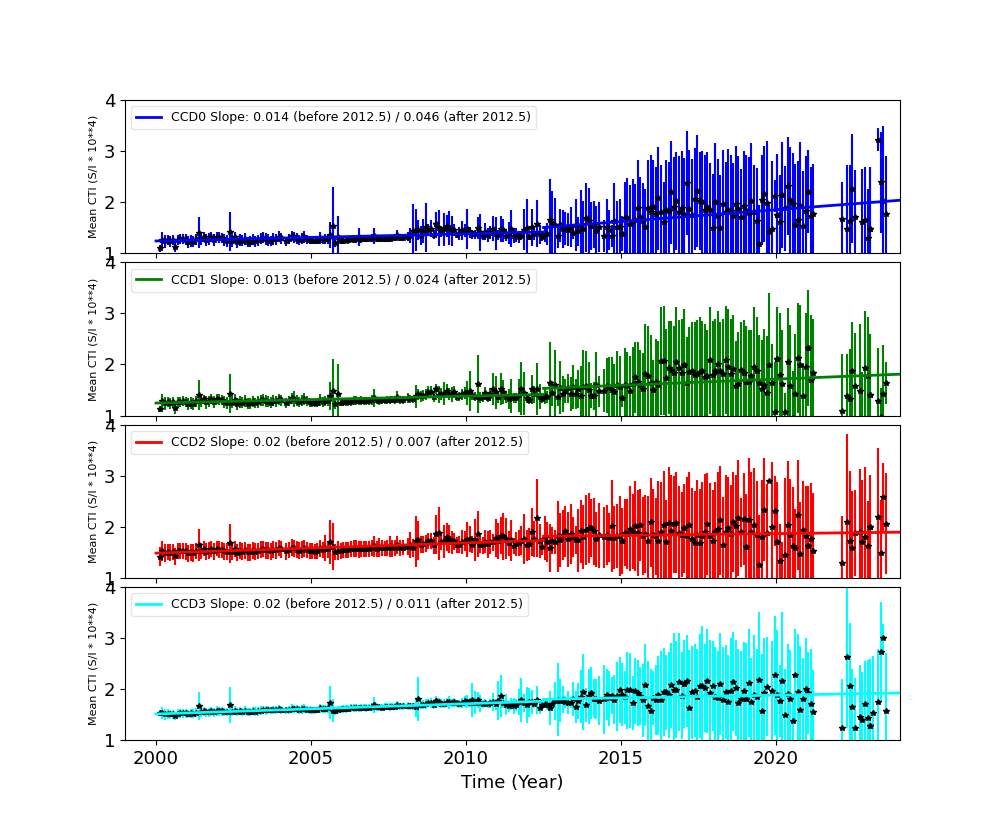
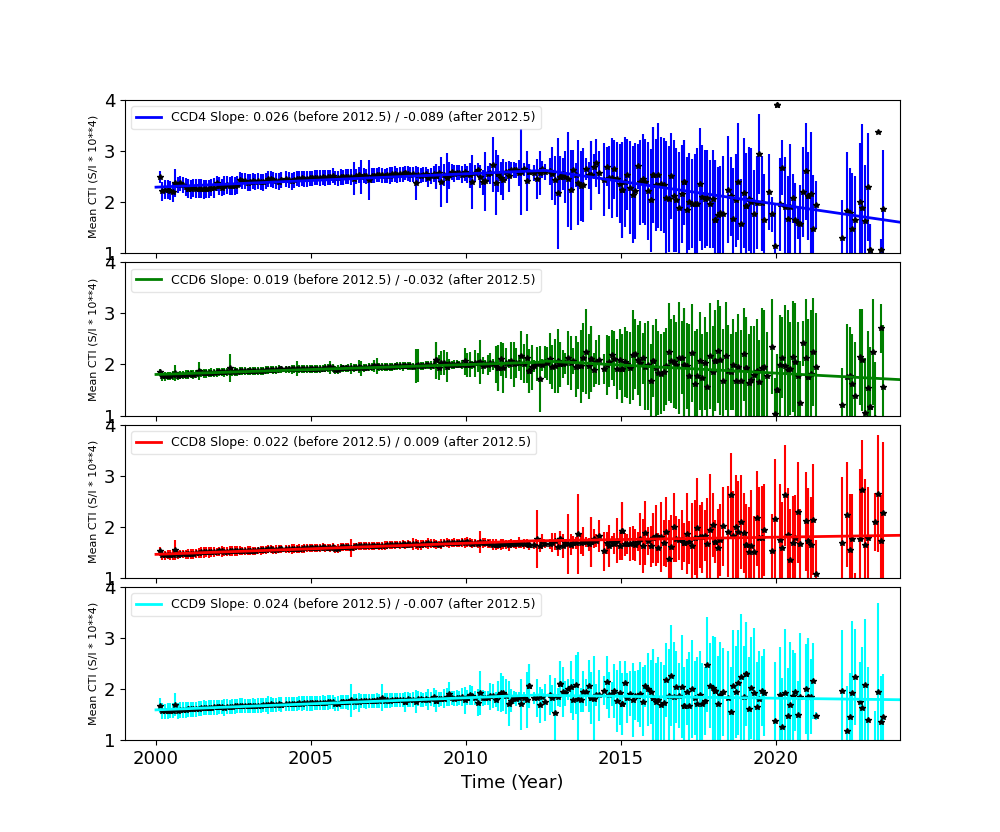
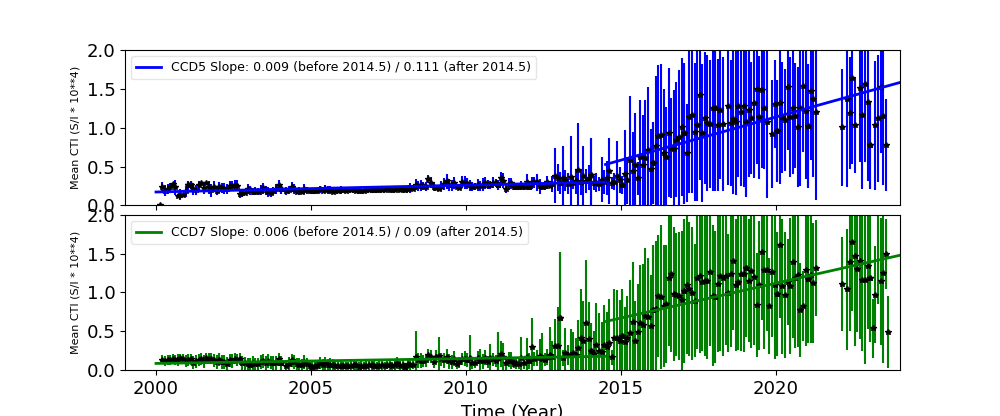
The Mean Detrended CTI
We report CTIs with a refined data definition. CTIs were computed for the temperature dependency corrected data. Please see CTI page for detailed explanation. CTI's are computed for Mn K alpha, and defined as slope/intercept x10^4 of row # vs ADU. Data file: here
Imaging CCDs
Spectral CCDs
Backside CCDs
Focal Plane Temperature
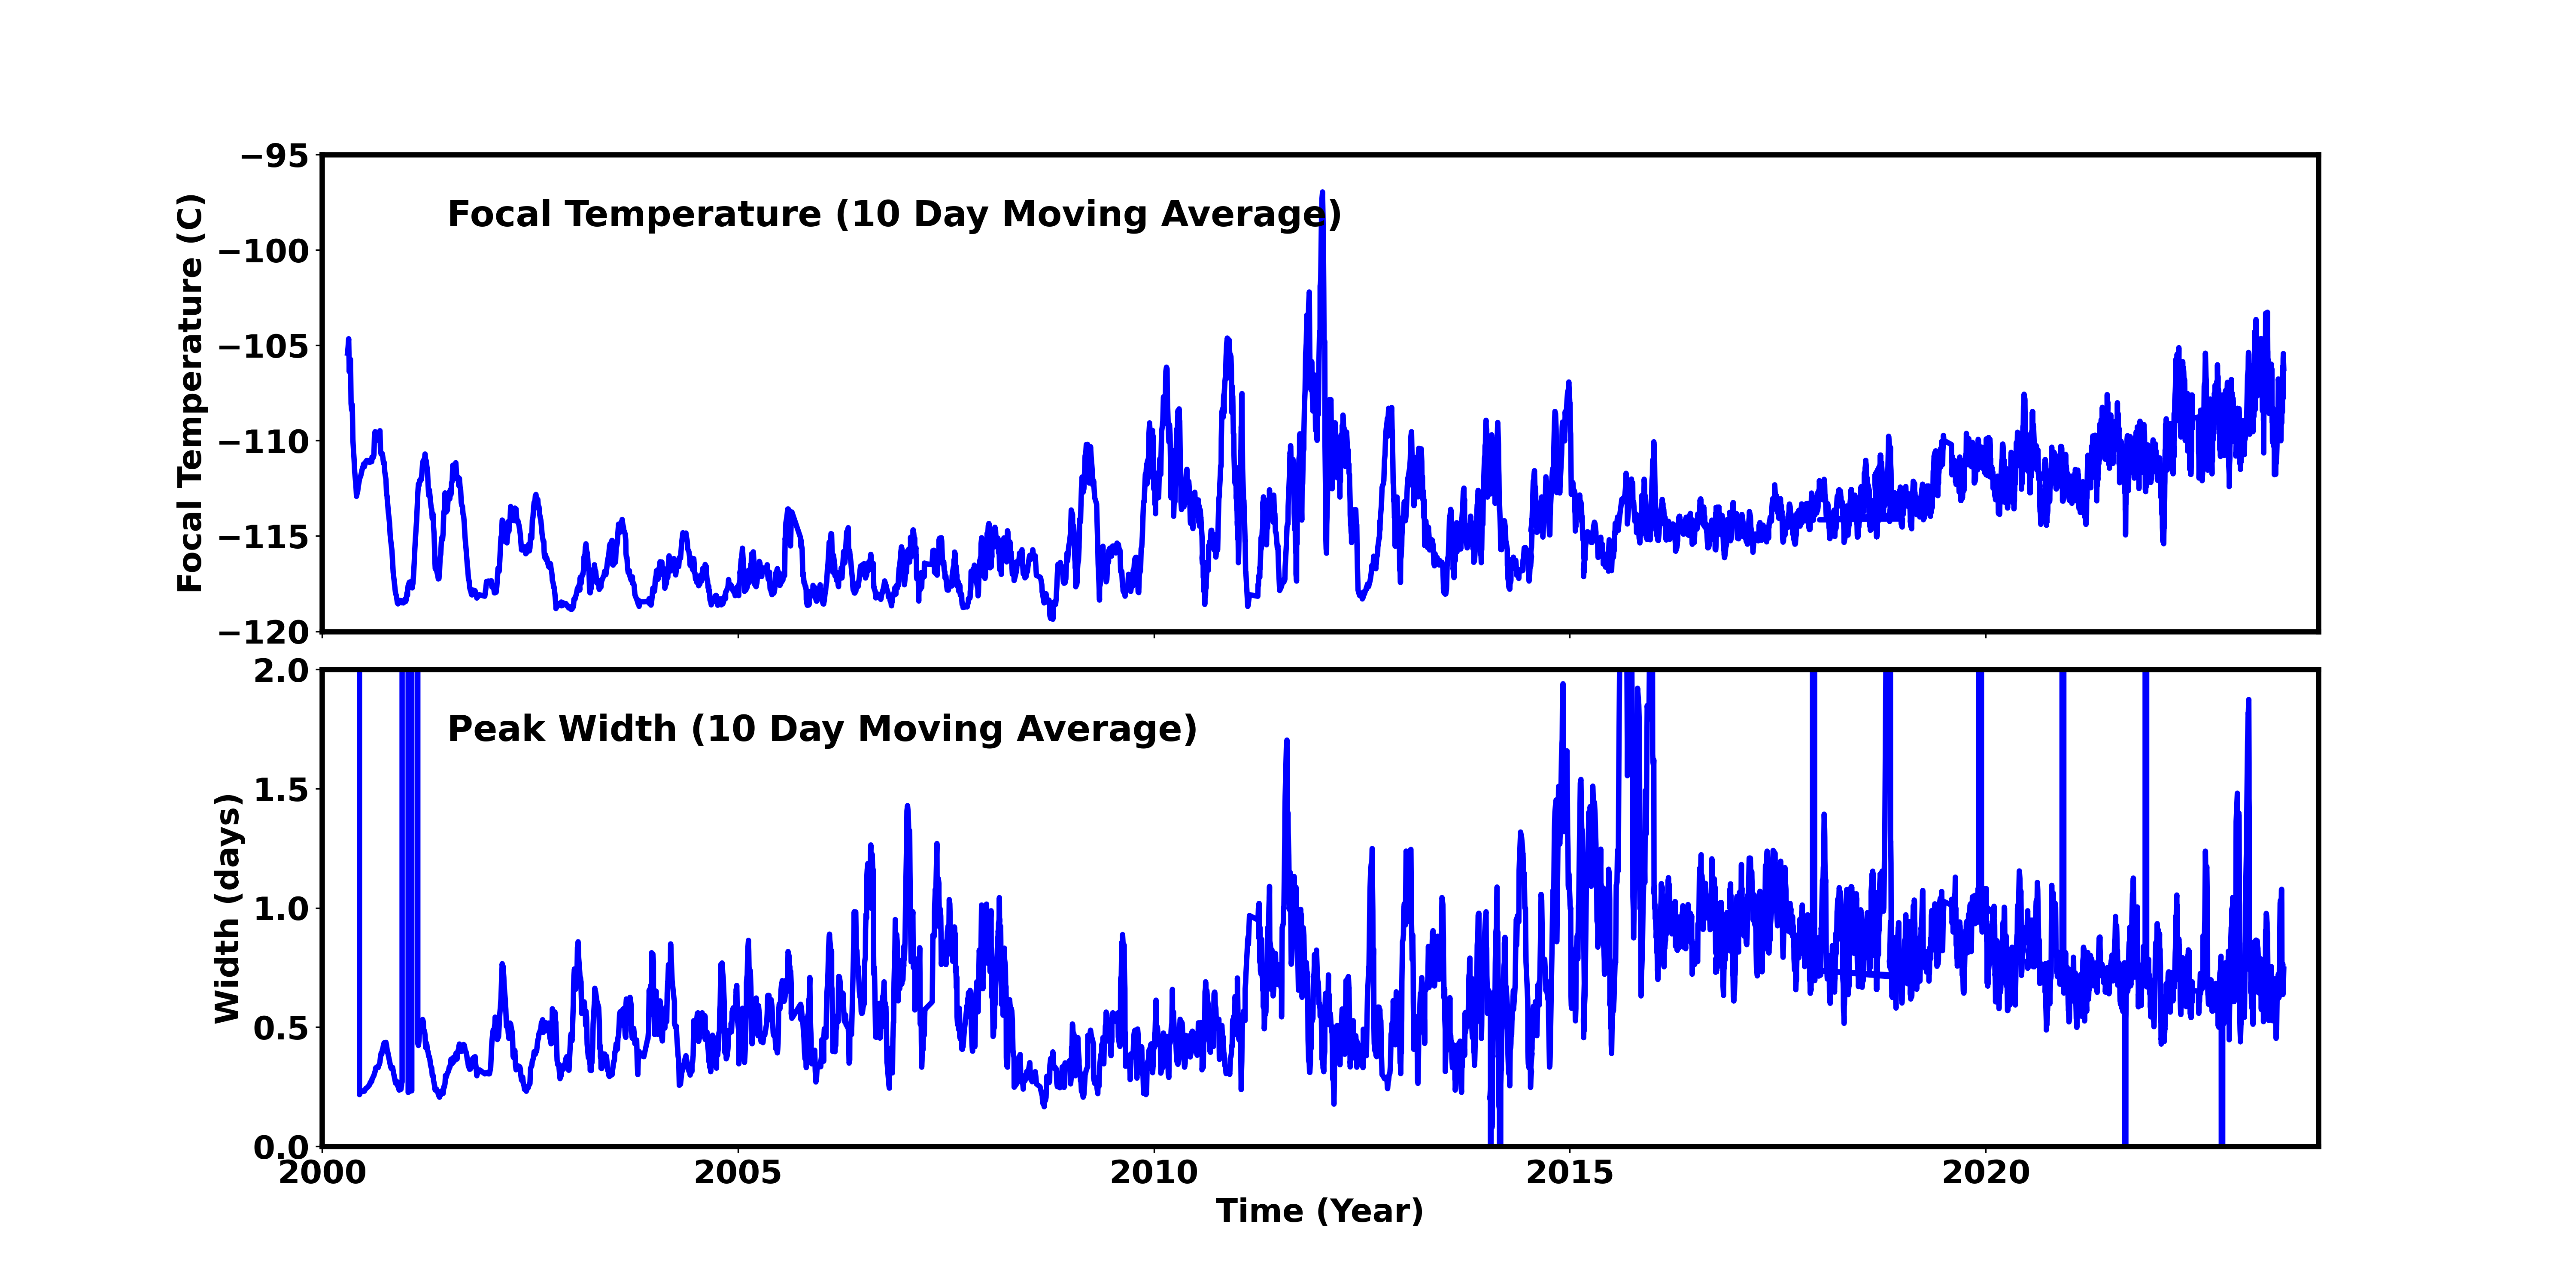
Aug 2025 Focal Temperature
| The Mean (max) FPT: | |
|---|---|
| -107.53 | +/- 7.69 C |
| Mean Width: | |
| 0.8 | +/- 0.58 days |
Averaged Focal Plane Temperature
We are using 10 period moving averages to show trends of peak temperatures and peak widths. Note, the gaps in the width plot are due to missing/corrupted data.
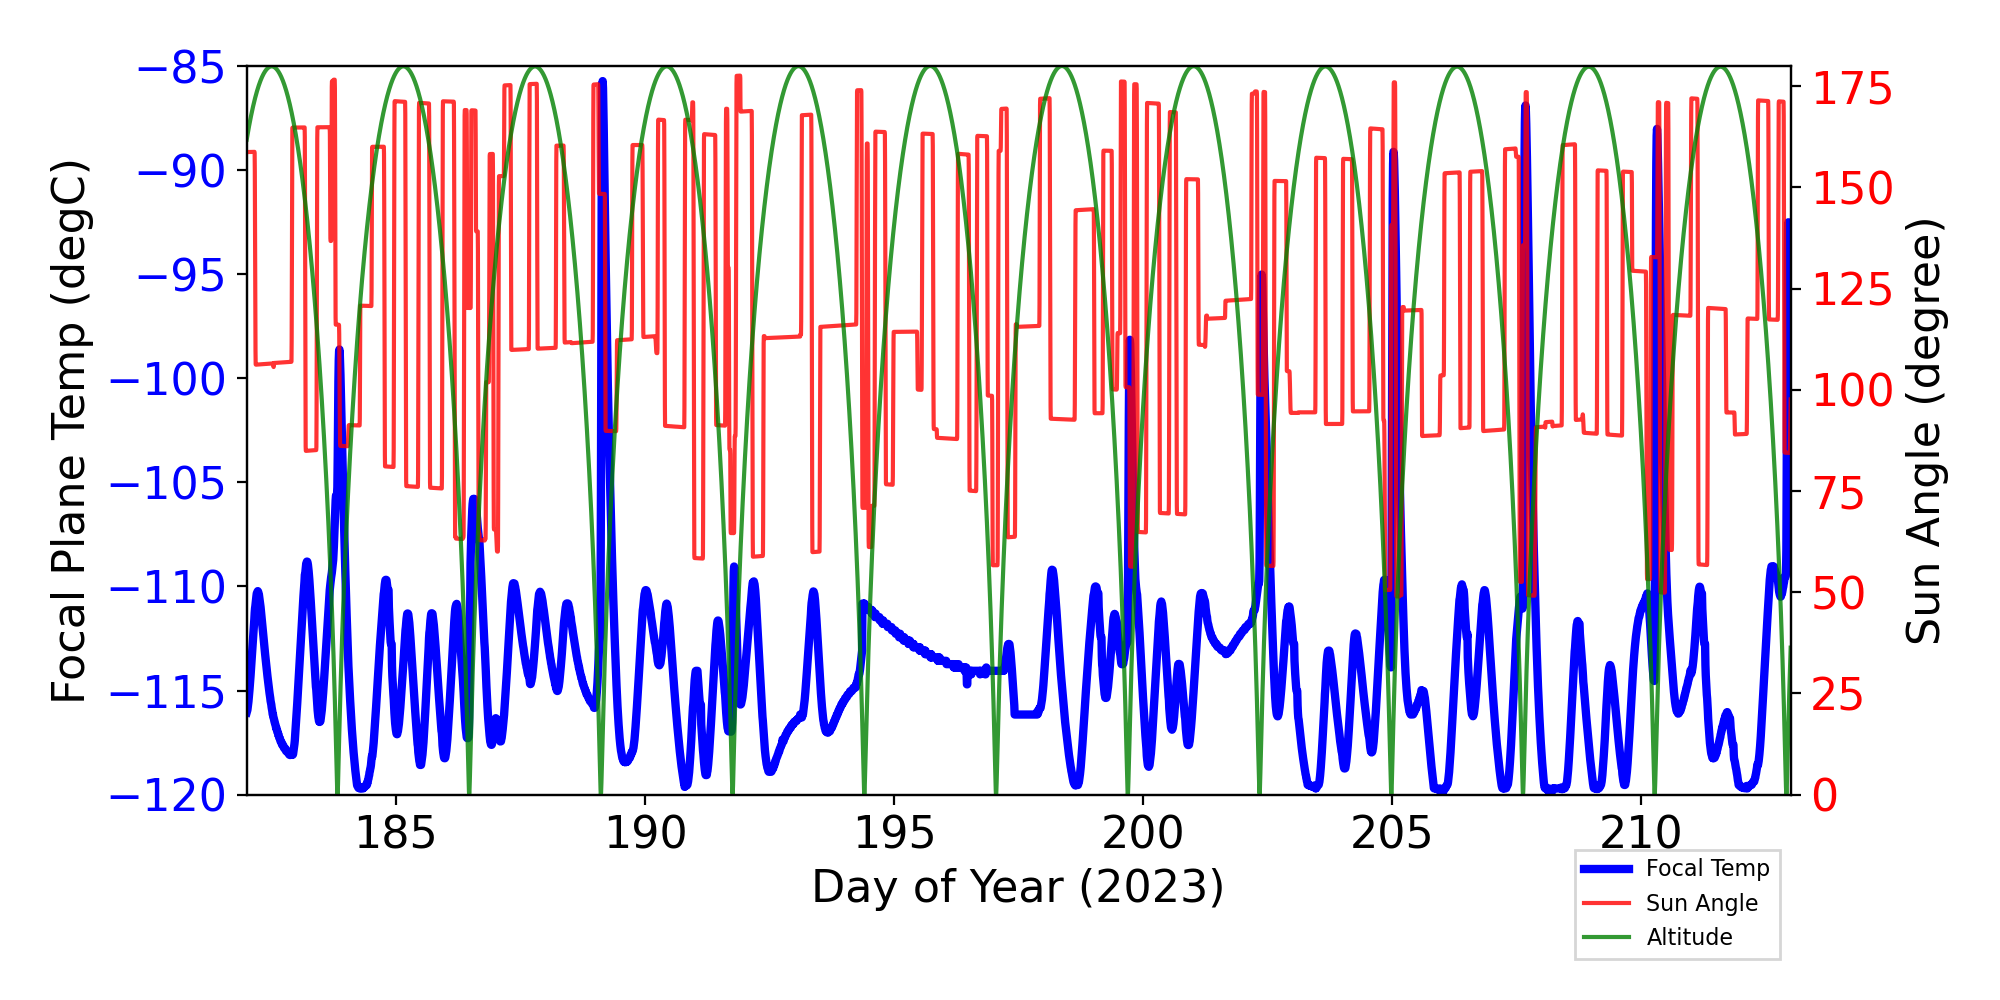
Focal Plane Temperature, Sun Angle and Altitude
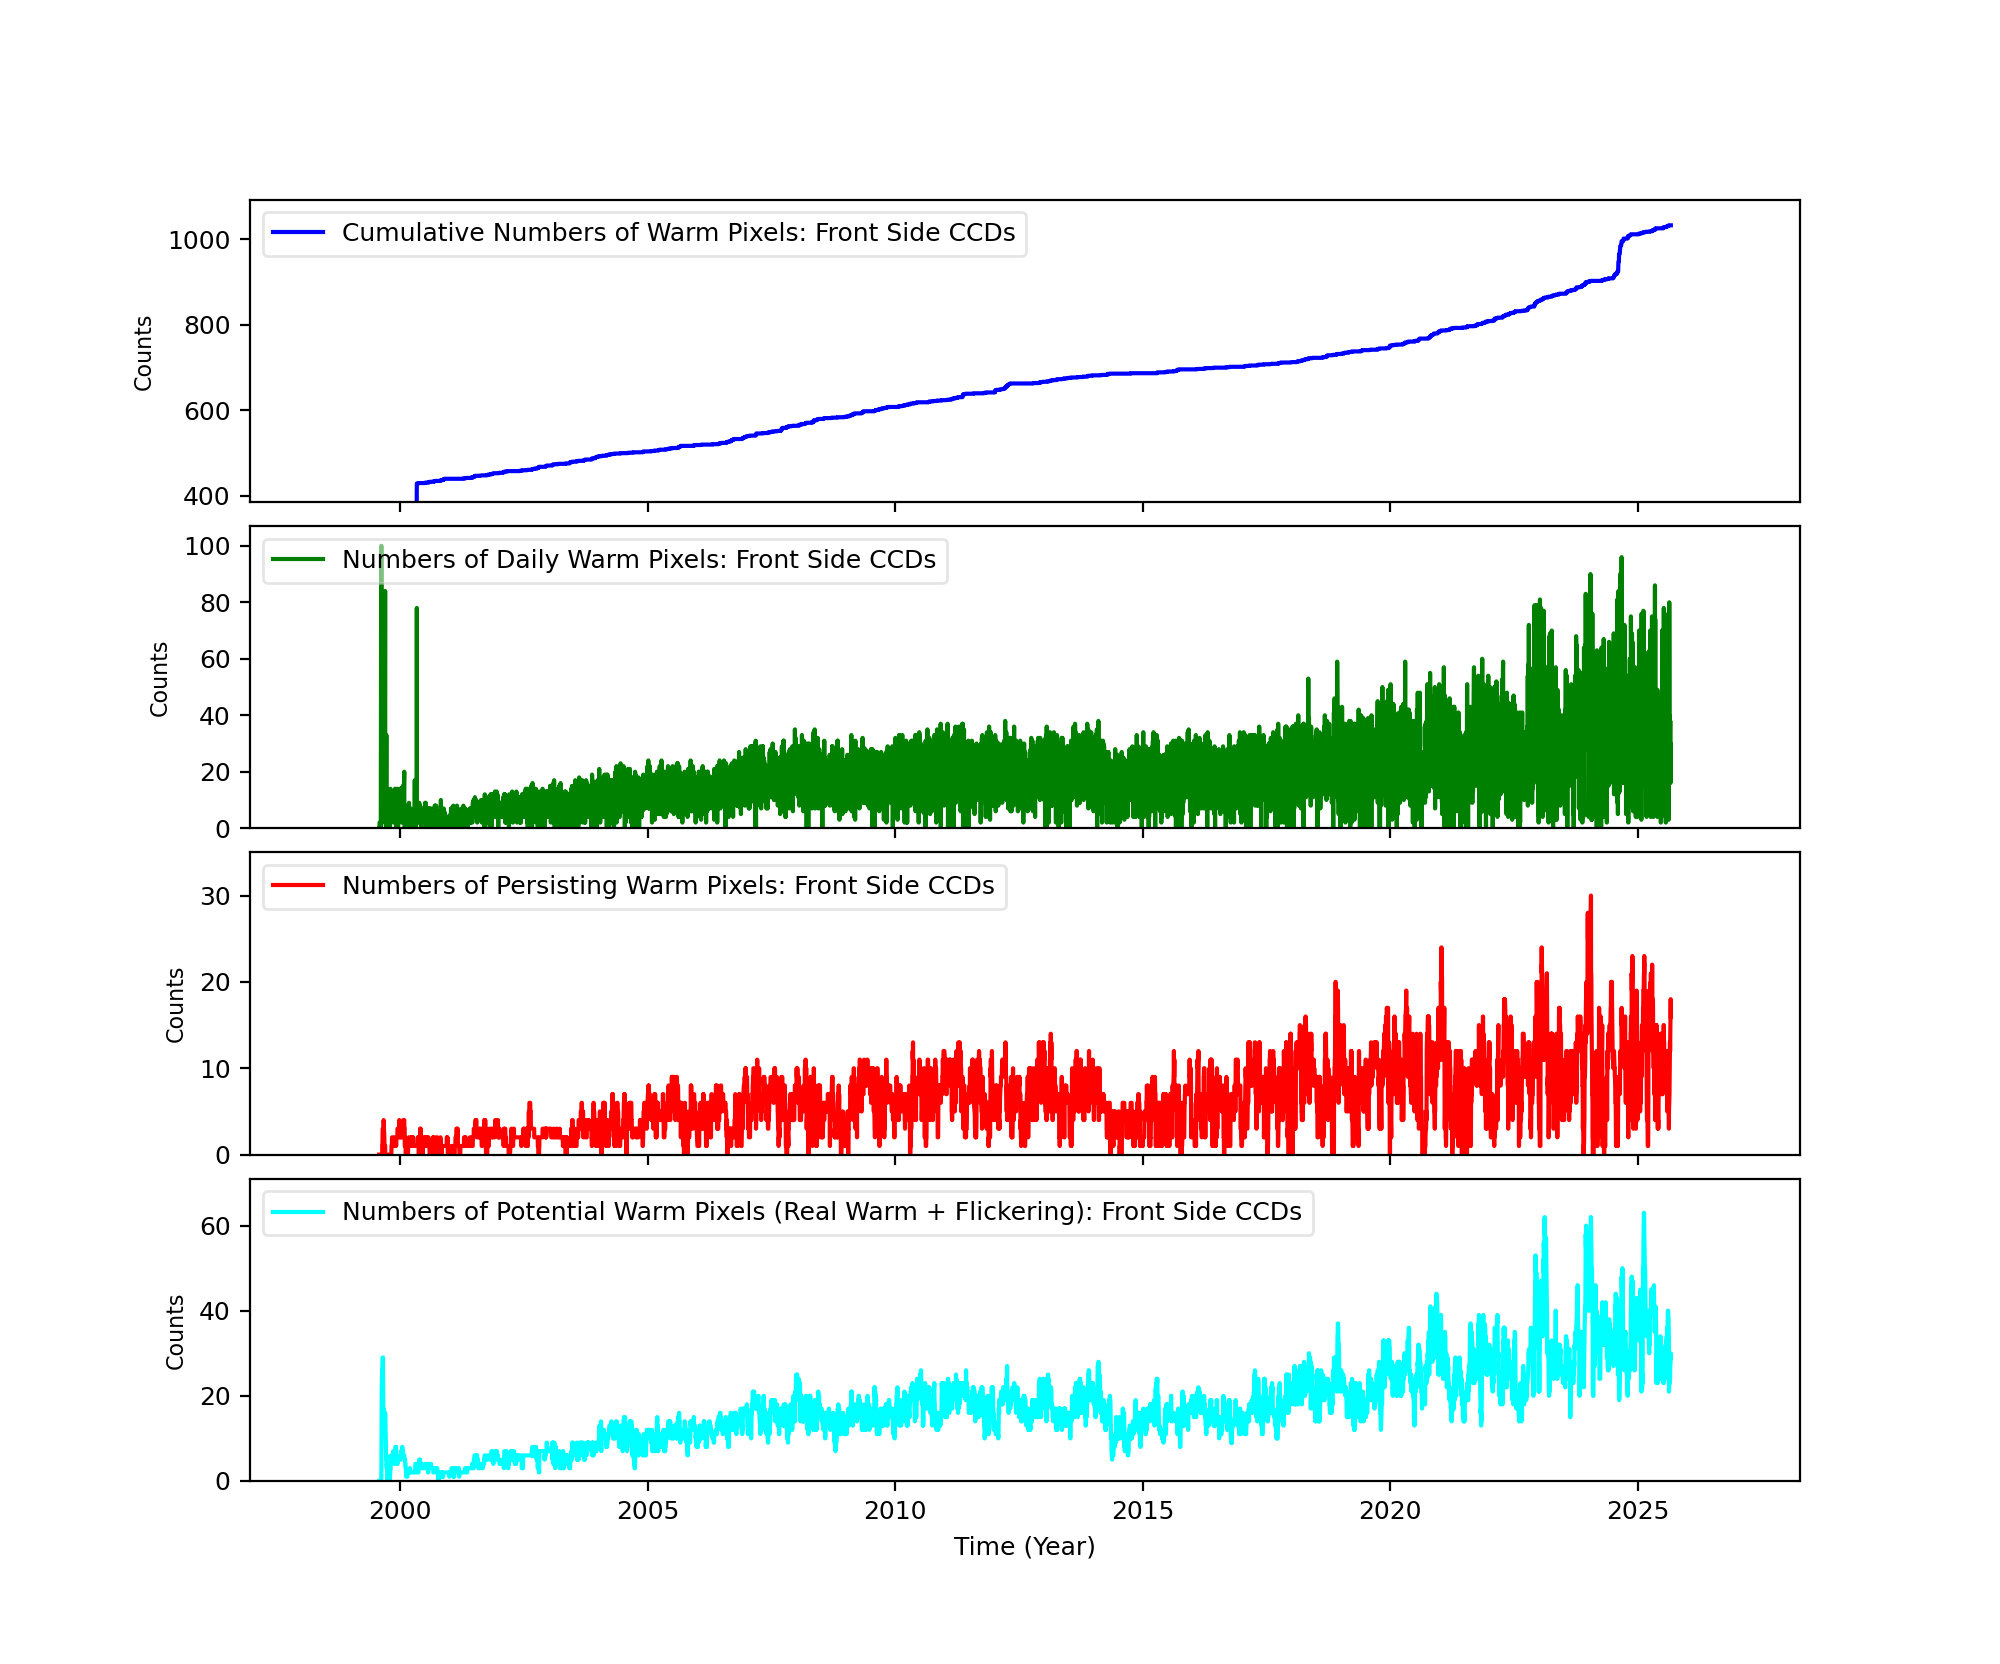
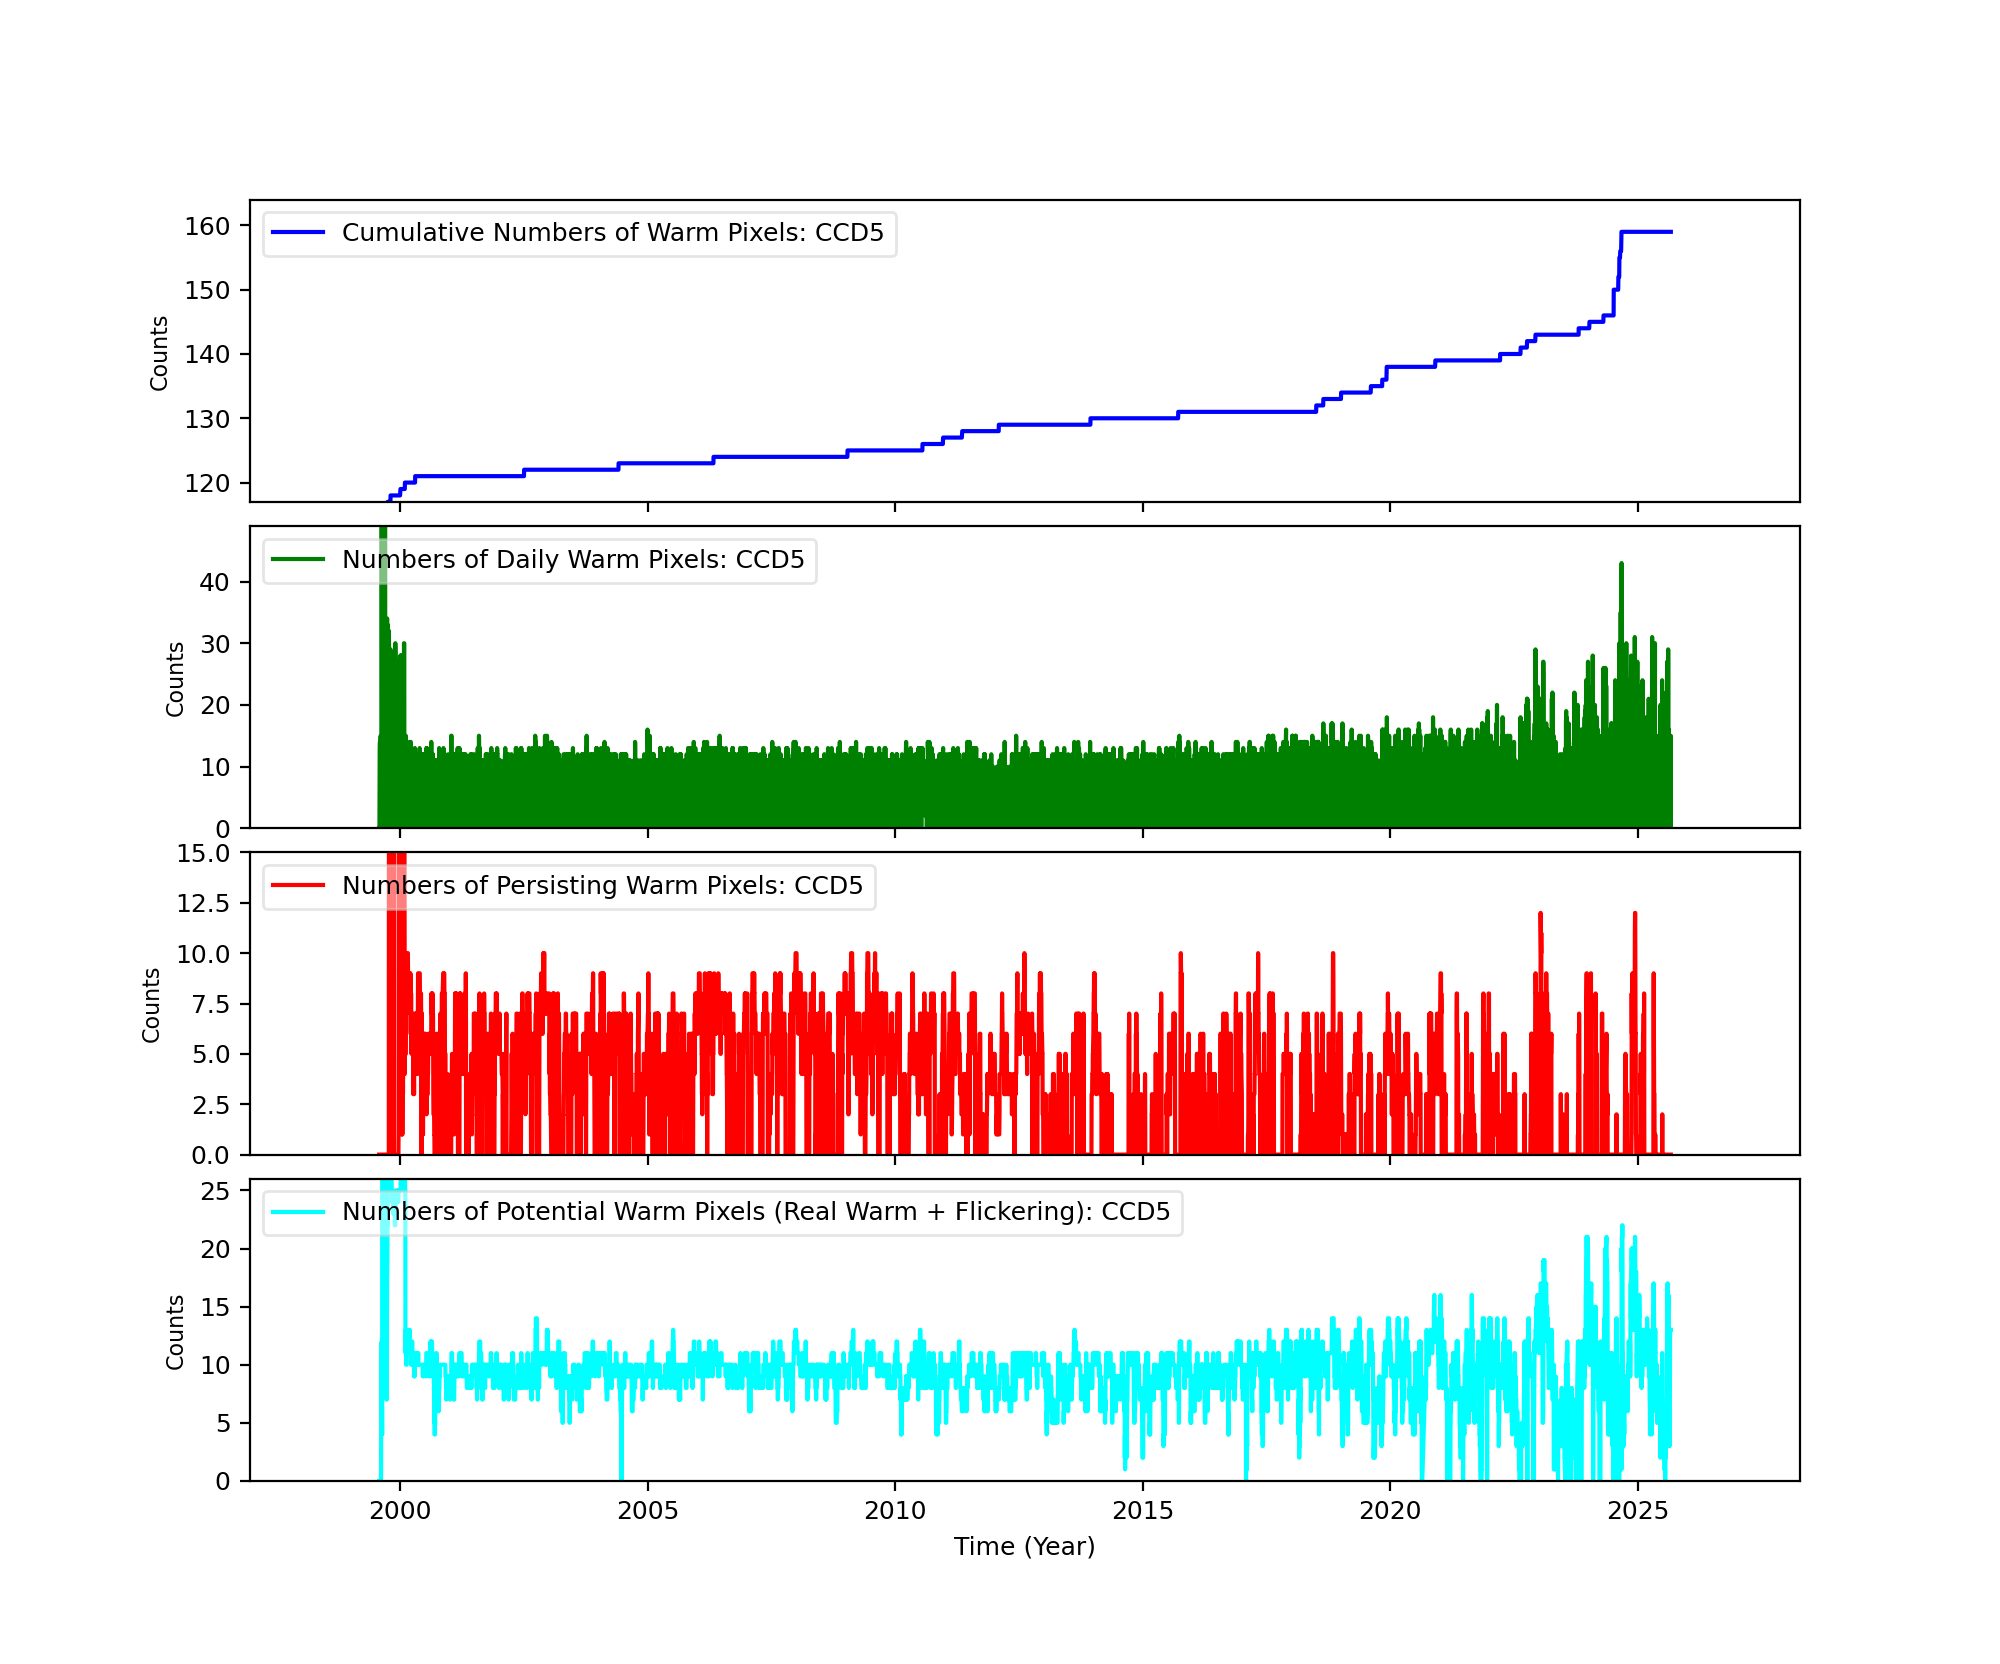
Bad Pixels
The plots below were generated with a new warm pixel finding script. Please see Acis Bad Pixel Page for details.
Front Side CCDs
Back Side CCD (CCD5)
Science Instrument Background Rates
| Name | Low (keV) | High(KeV) | Description |
|---|---|---|---|
| SSoft | 0.00 | 0.50 | Super soft photons |
| Soft | 0.50 | 1.00 | Soft photons |
| Med | 1.00 | 3.00 | Moderate energy photons |
| Hard | 3.00 | 5.00 | Hard Photons |
| Harder | 5.00 | 10.00 | Very Hard photons |
| Hardest | 10.00 | Beyond 10 keV |


HRC
DOSE of Central 4K Pore-Pairs
Please refer to Maximum Dose Trends for more details.
)
|
|---|
IMAGE                NPIX      MEAN    STDDEV      MIN       MAX
HRCI_08_2025.fits  16777216	0.060 	0.249 	0.000 	9.000
)
IMAGE                       NPIX      MEAN    STDDEV      MIN       MAX
HRCI_08_1999_08_2025.fits  16777216	na	na	na	na
No Data
)
IMAGE                       NPIX      MEAN    STDDEV      MIN       MAX
HRCS_08_1999_08_2025.fits  16777216	na	na	na	na
|
|
Max dose trend plots corrected for events that "pile-up"
in the center of the taps due to bad position information.
|
)
|
)
|
)
|
)
|
| May 2025 | Feb 2025 | Nov 2024 | Aug 2024 |
|---|
)
|
)
|
)
|
)
|
| May 2025 | Feb 2025 | Nov 2024 | Aug 2024 |
|---|
HRMA Focus
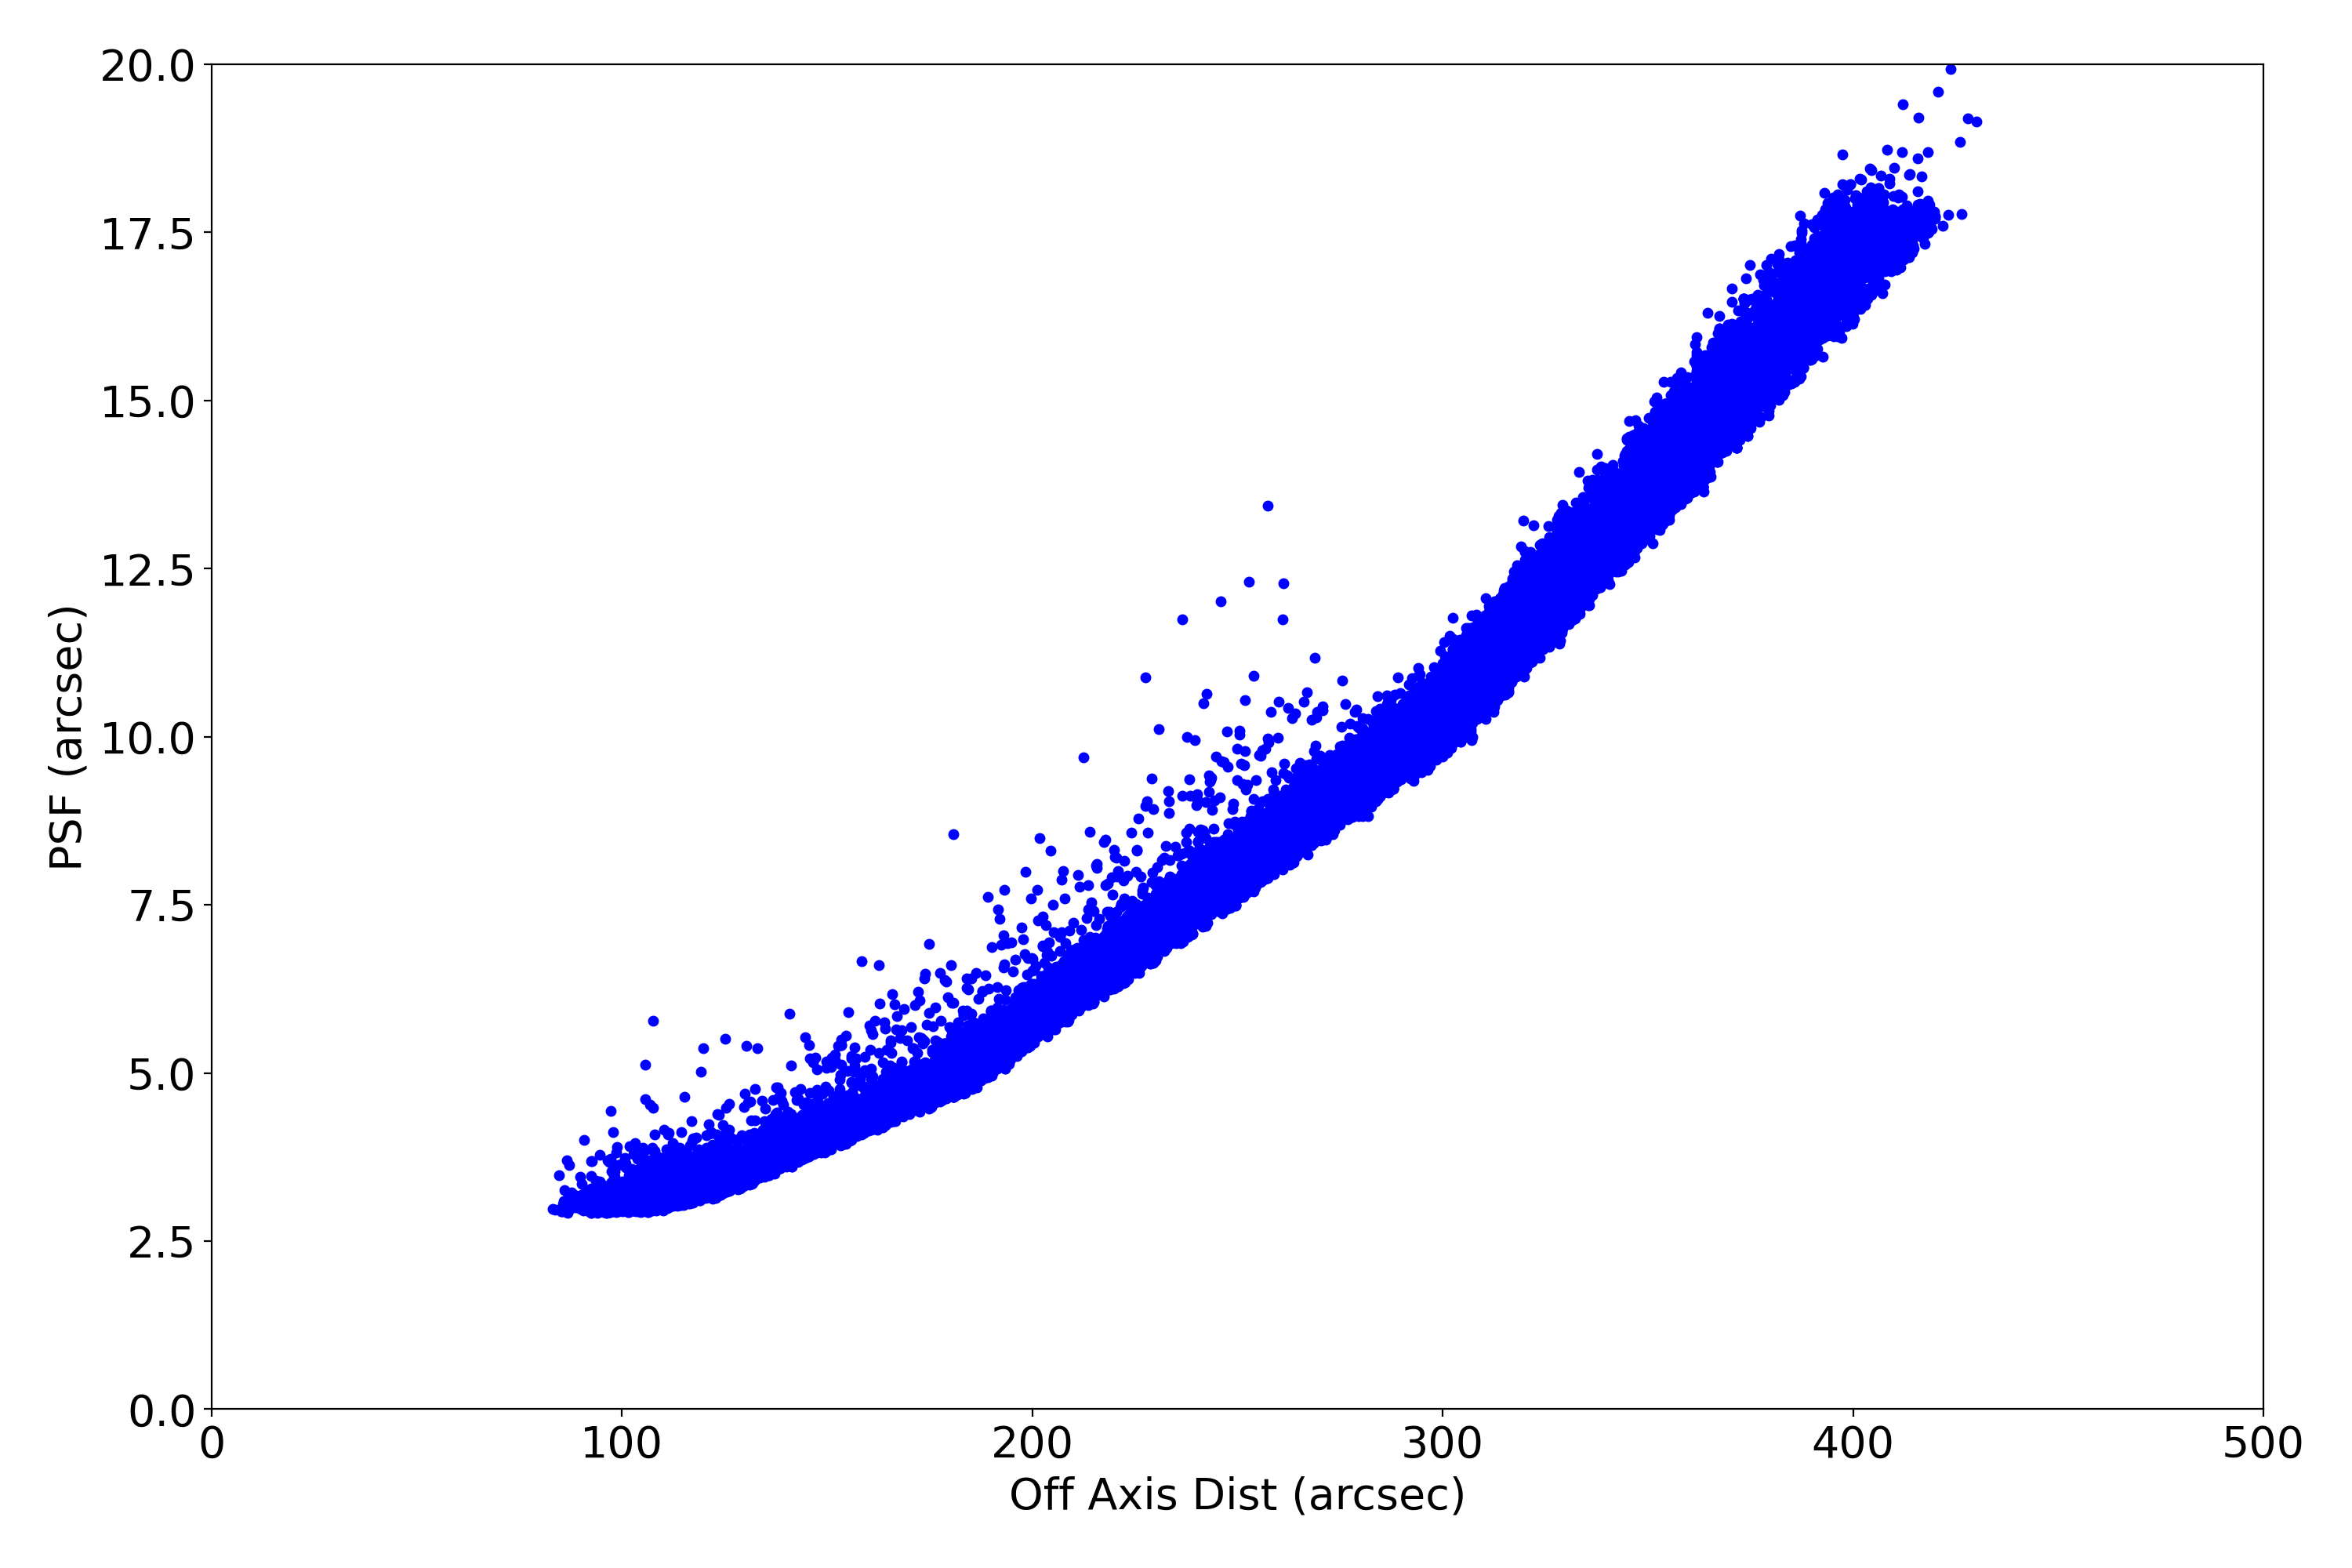
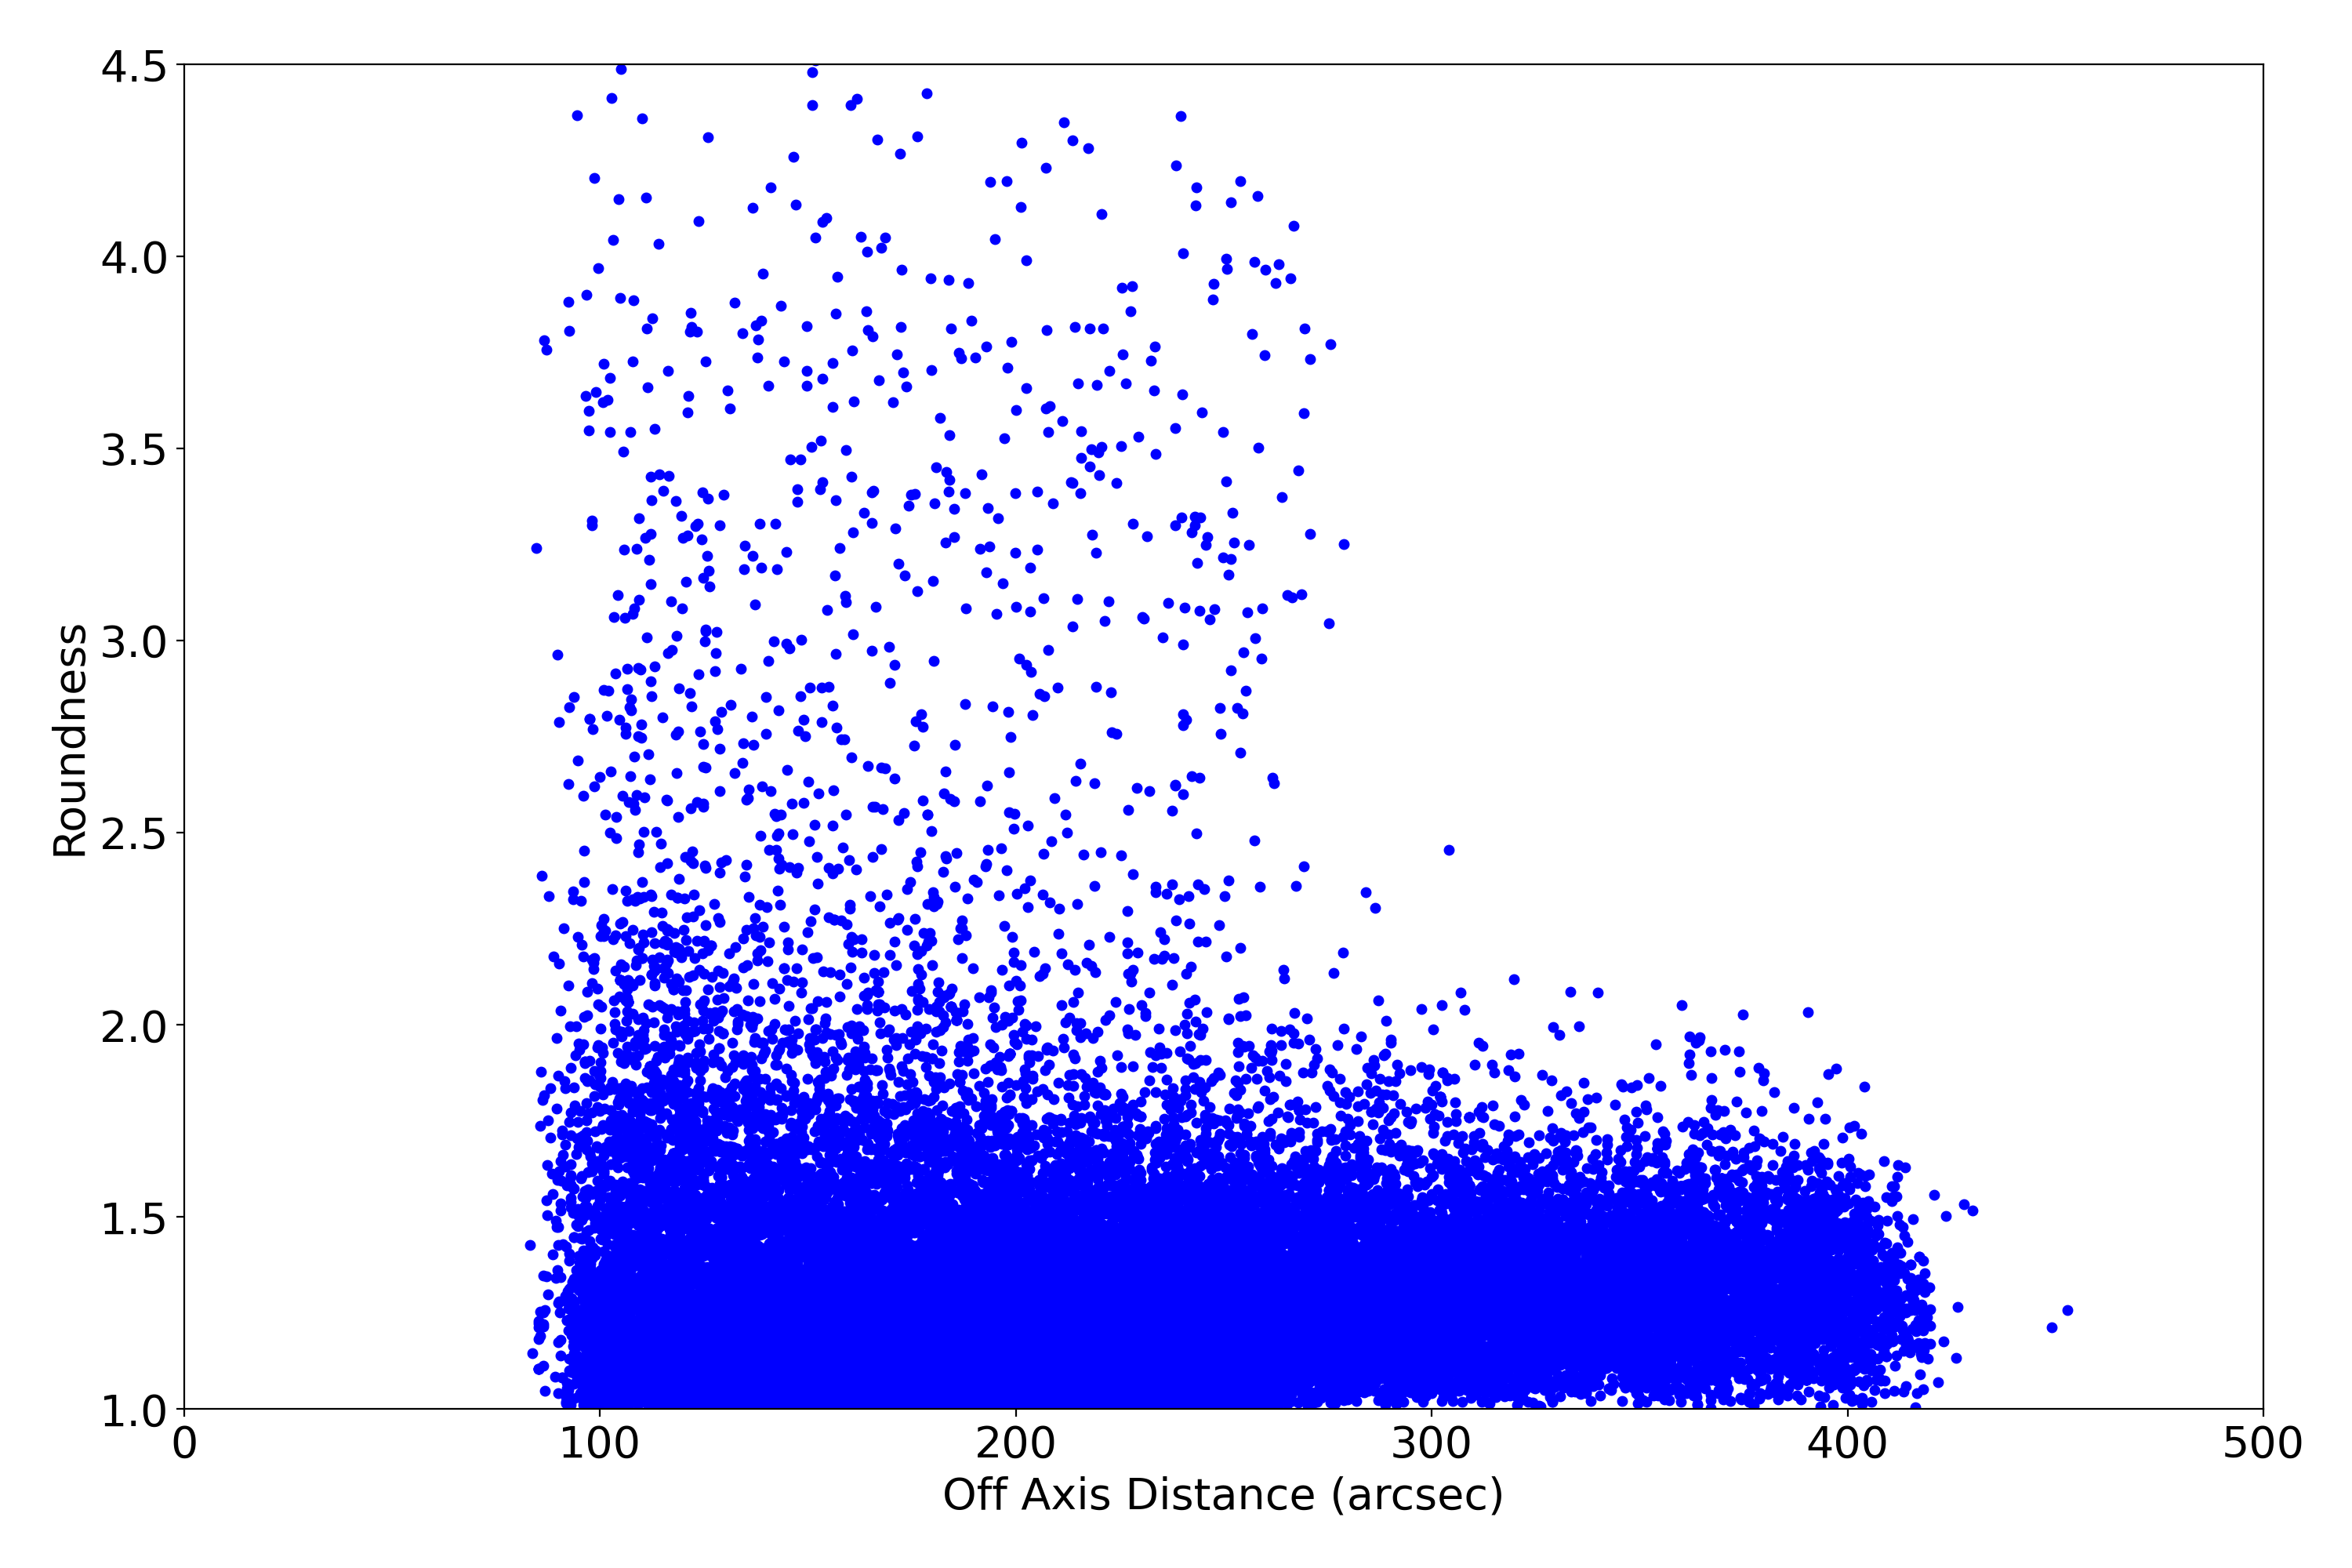
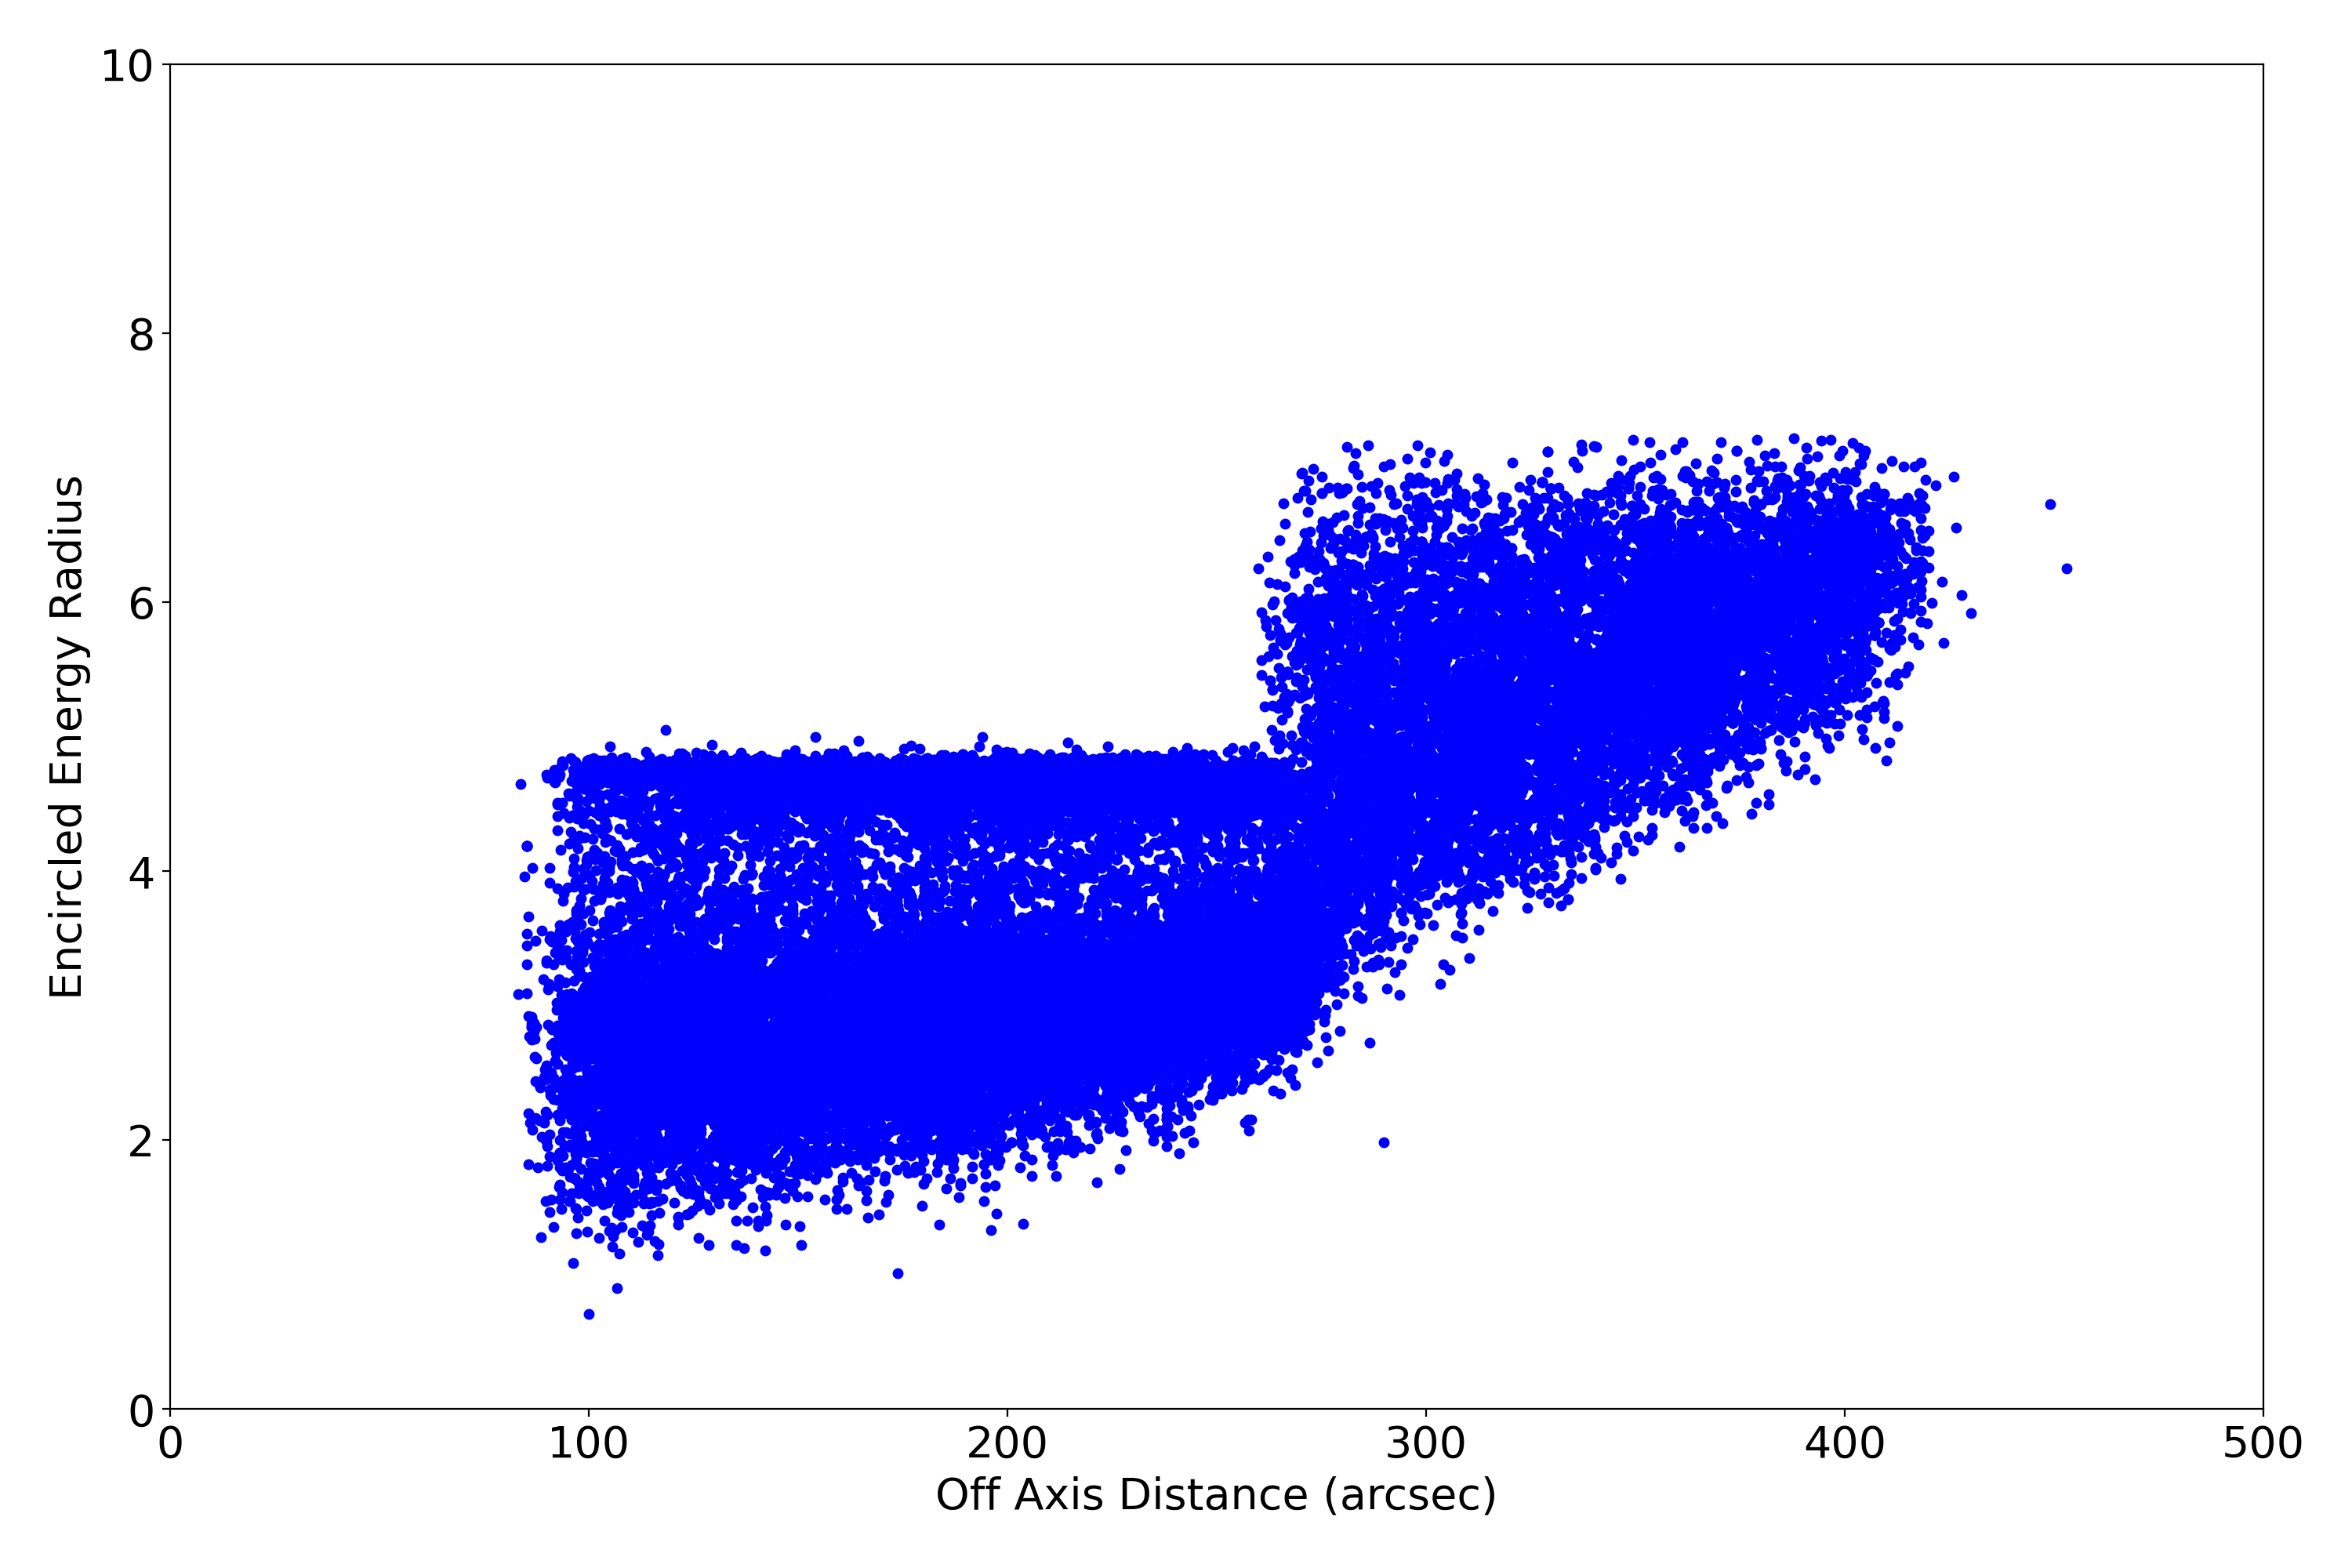
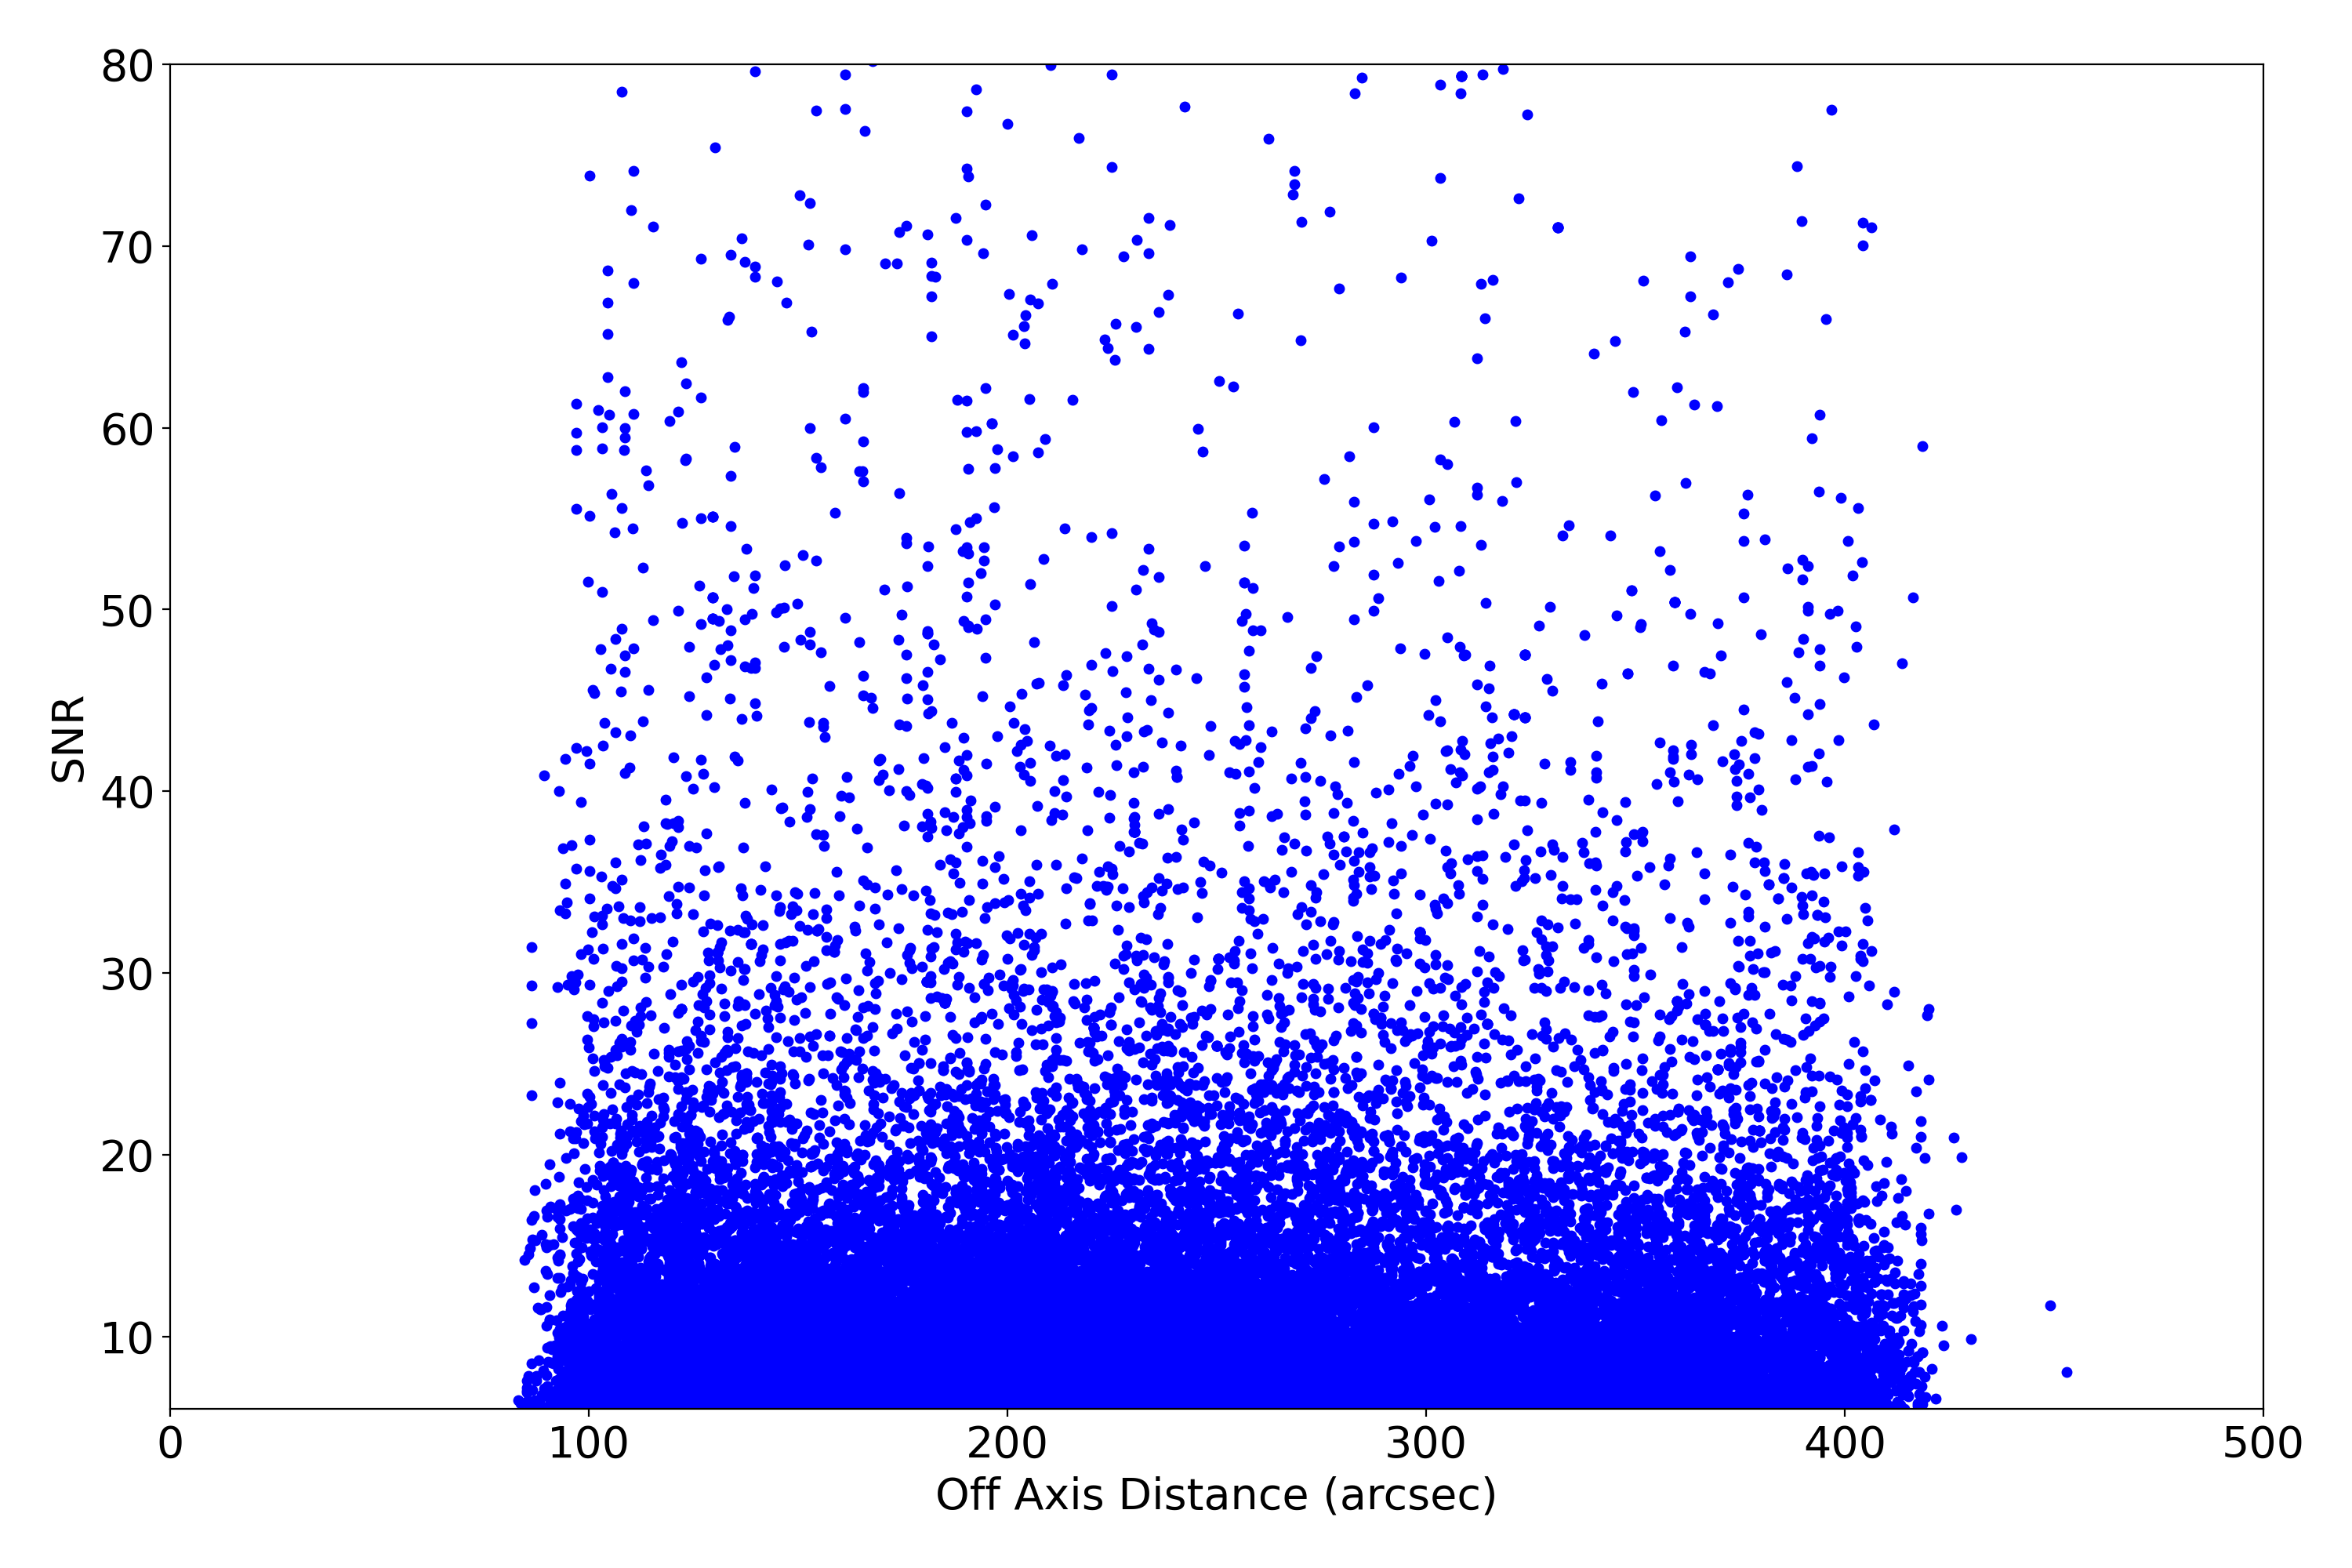
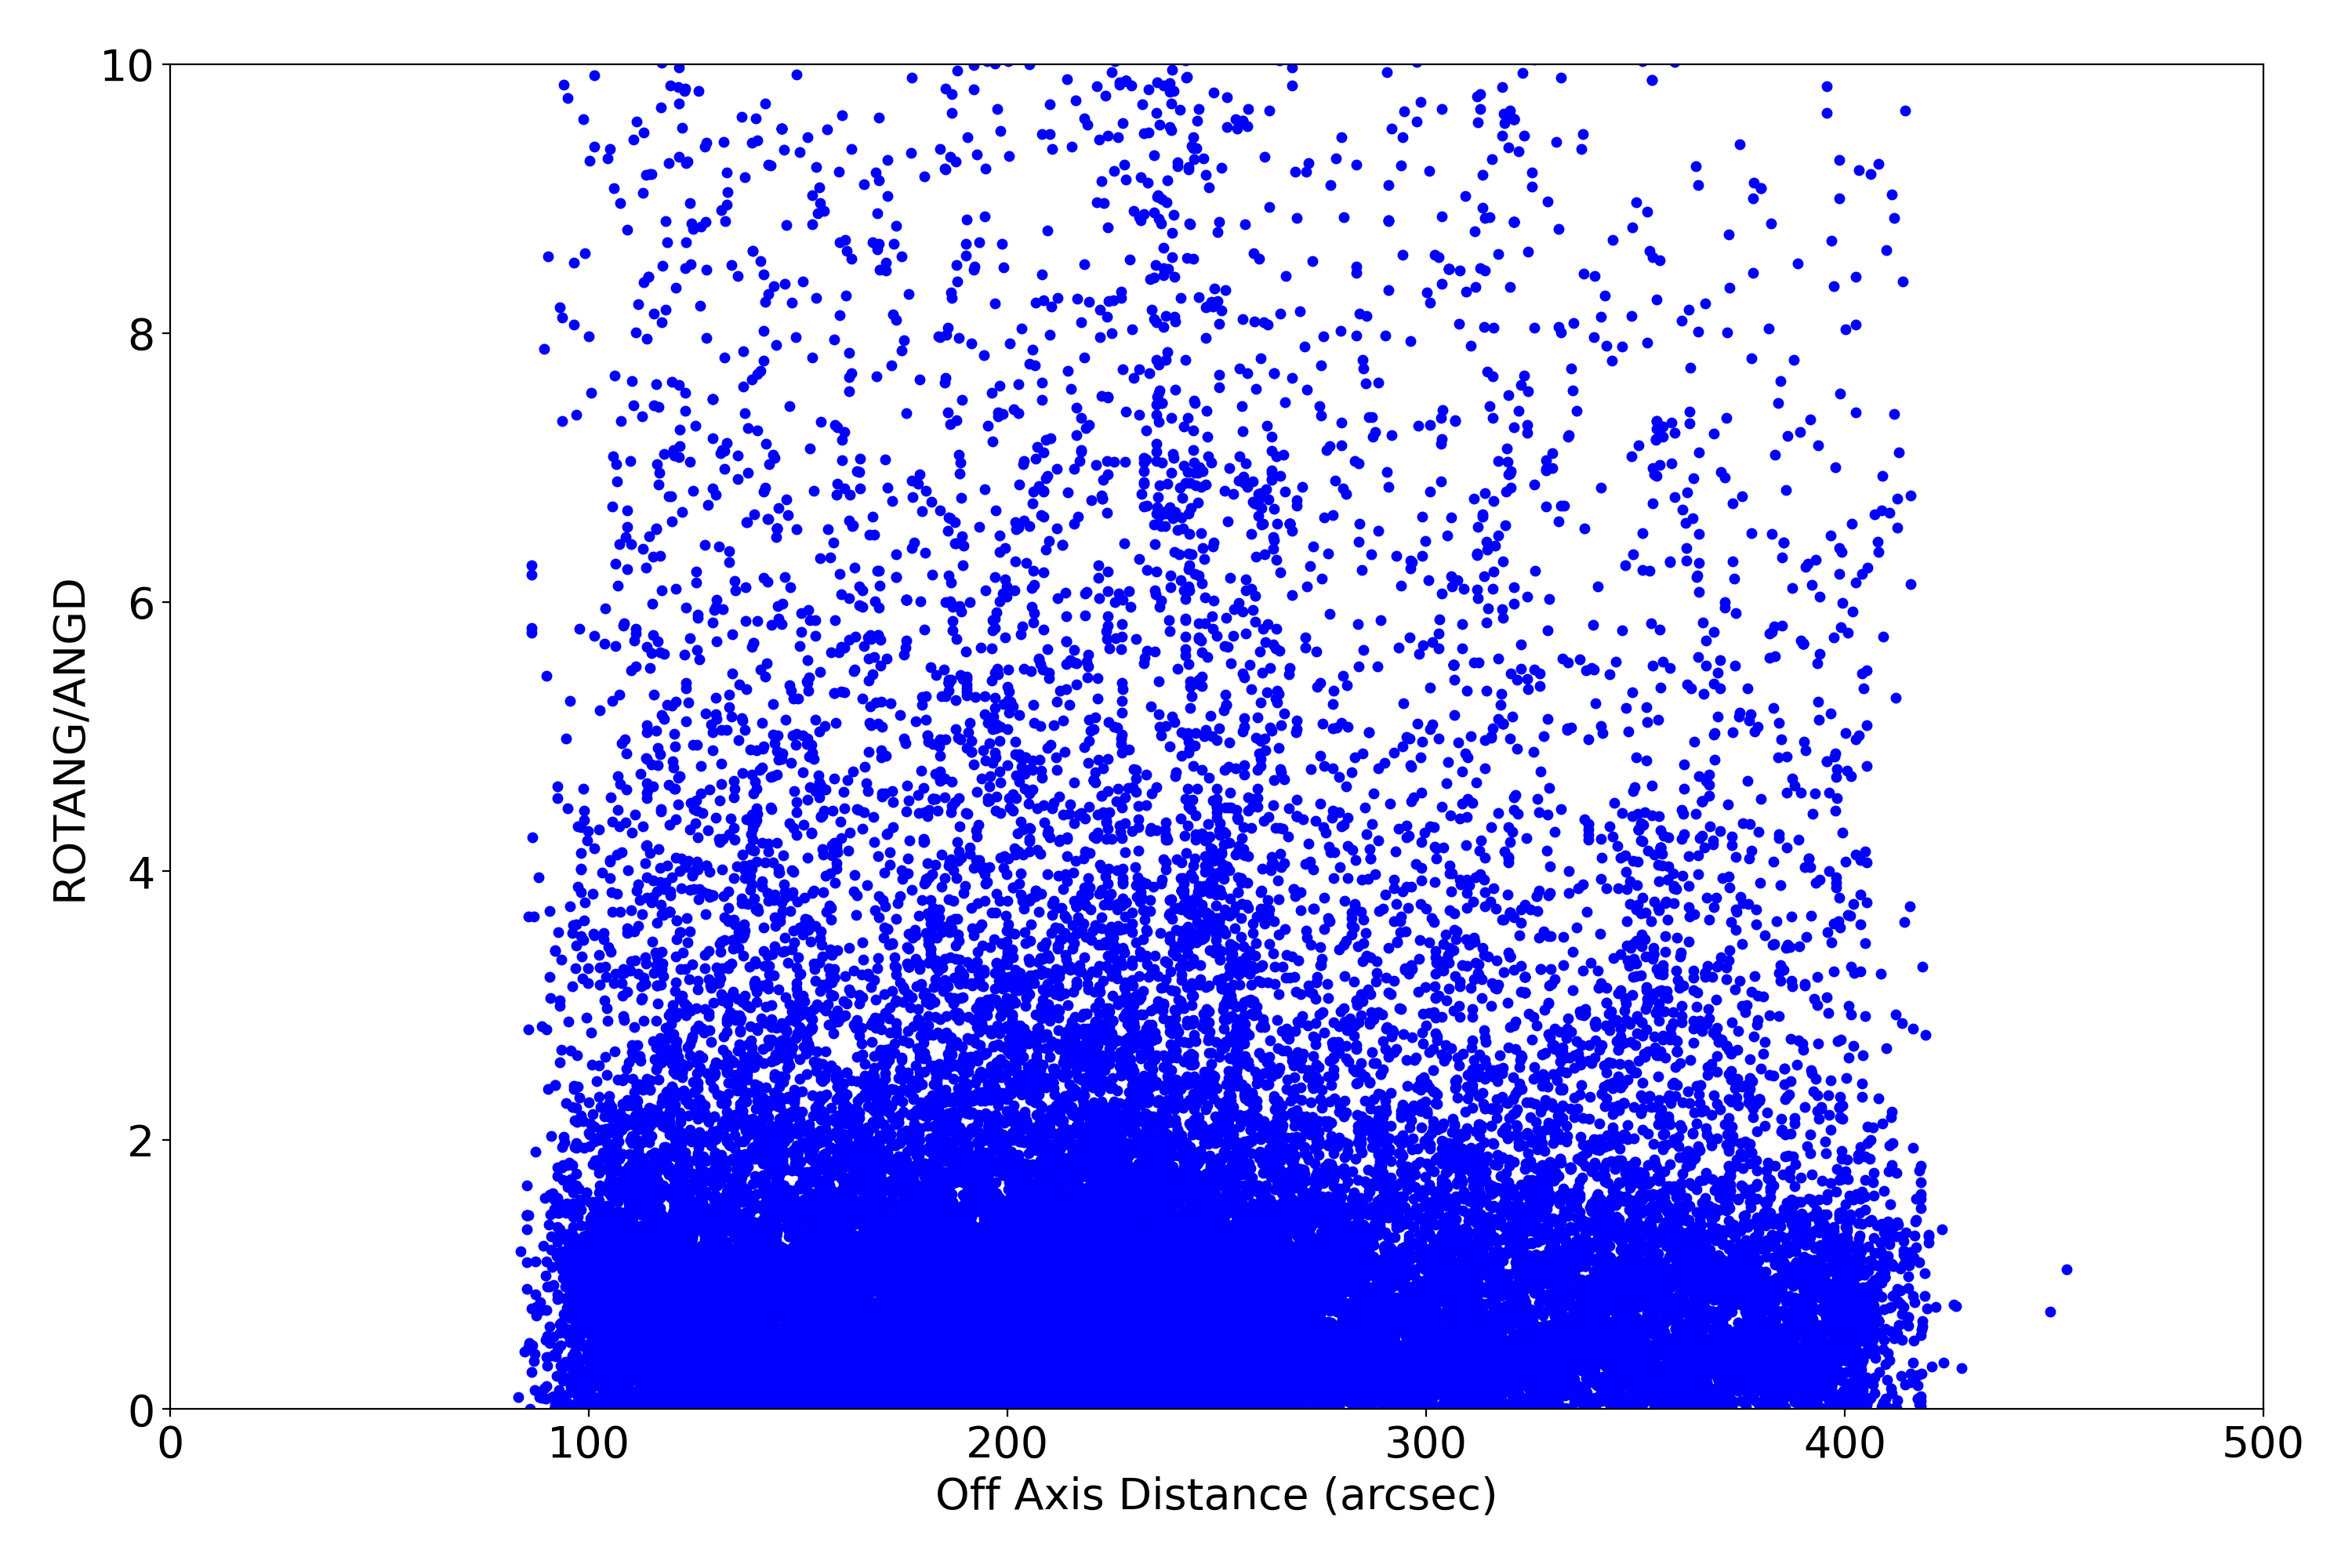
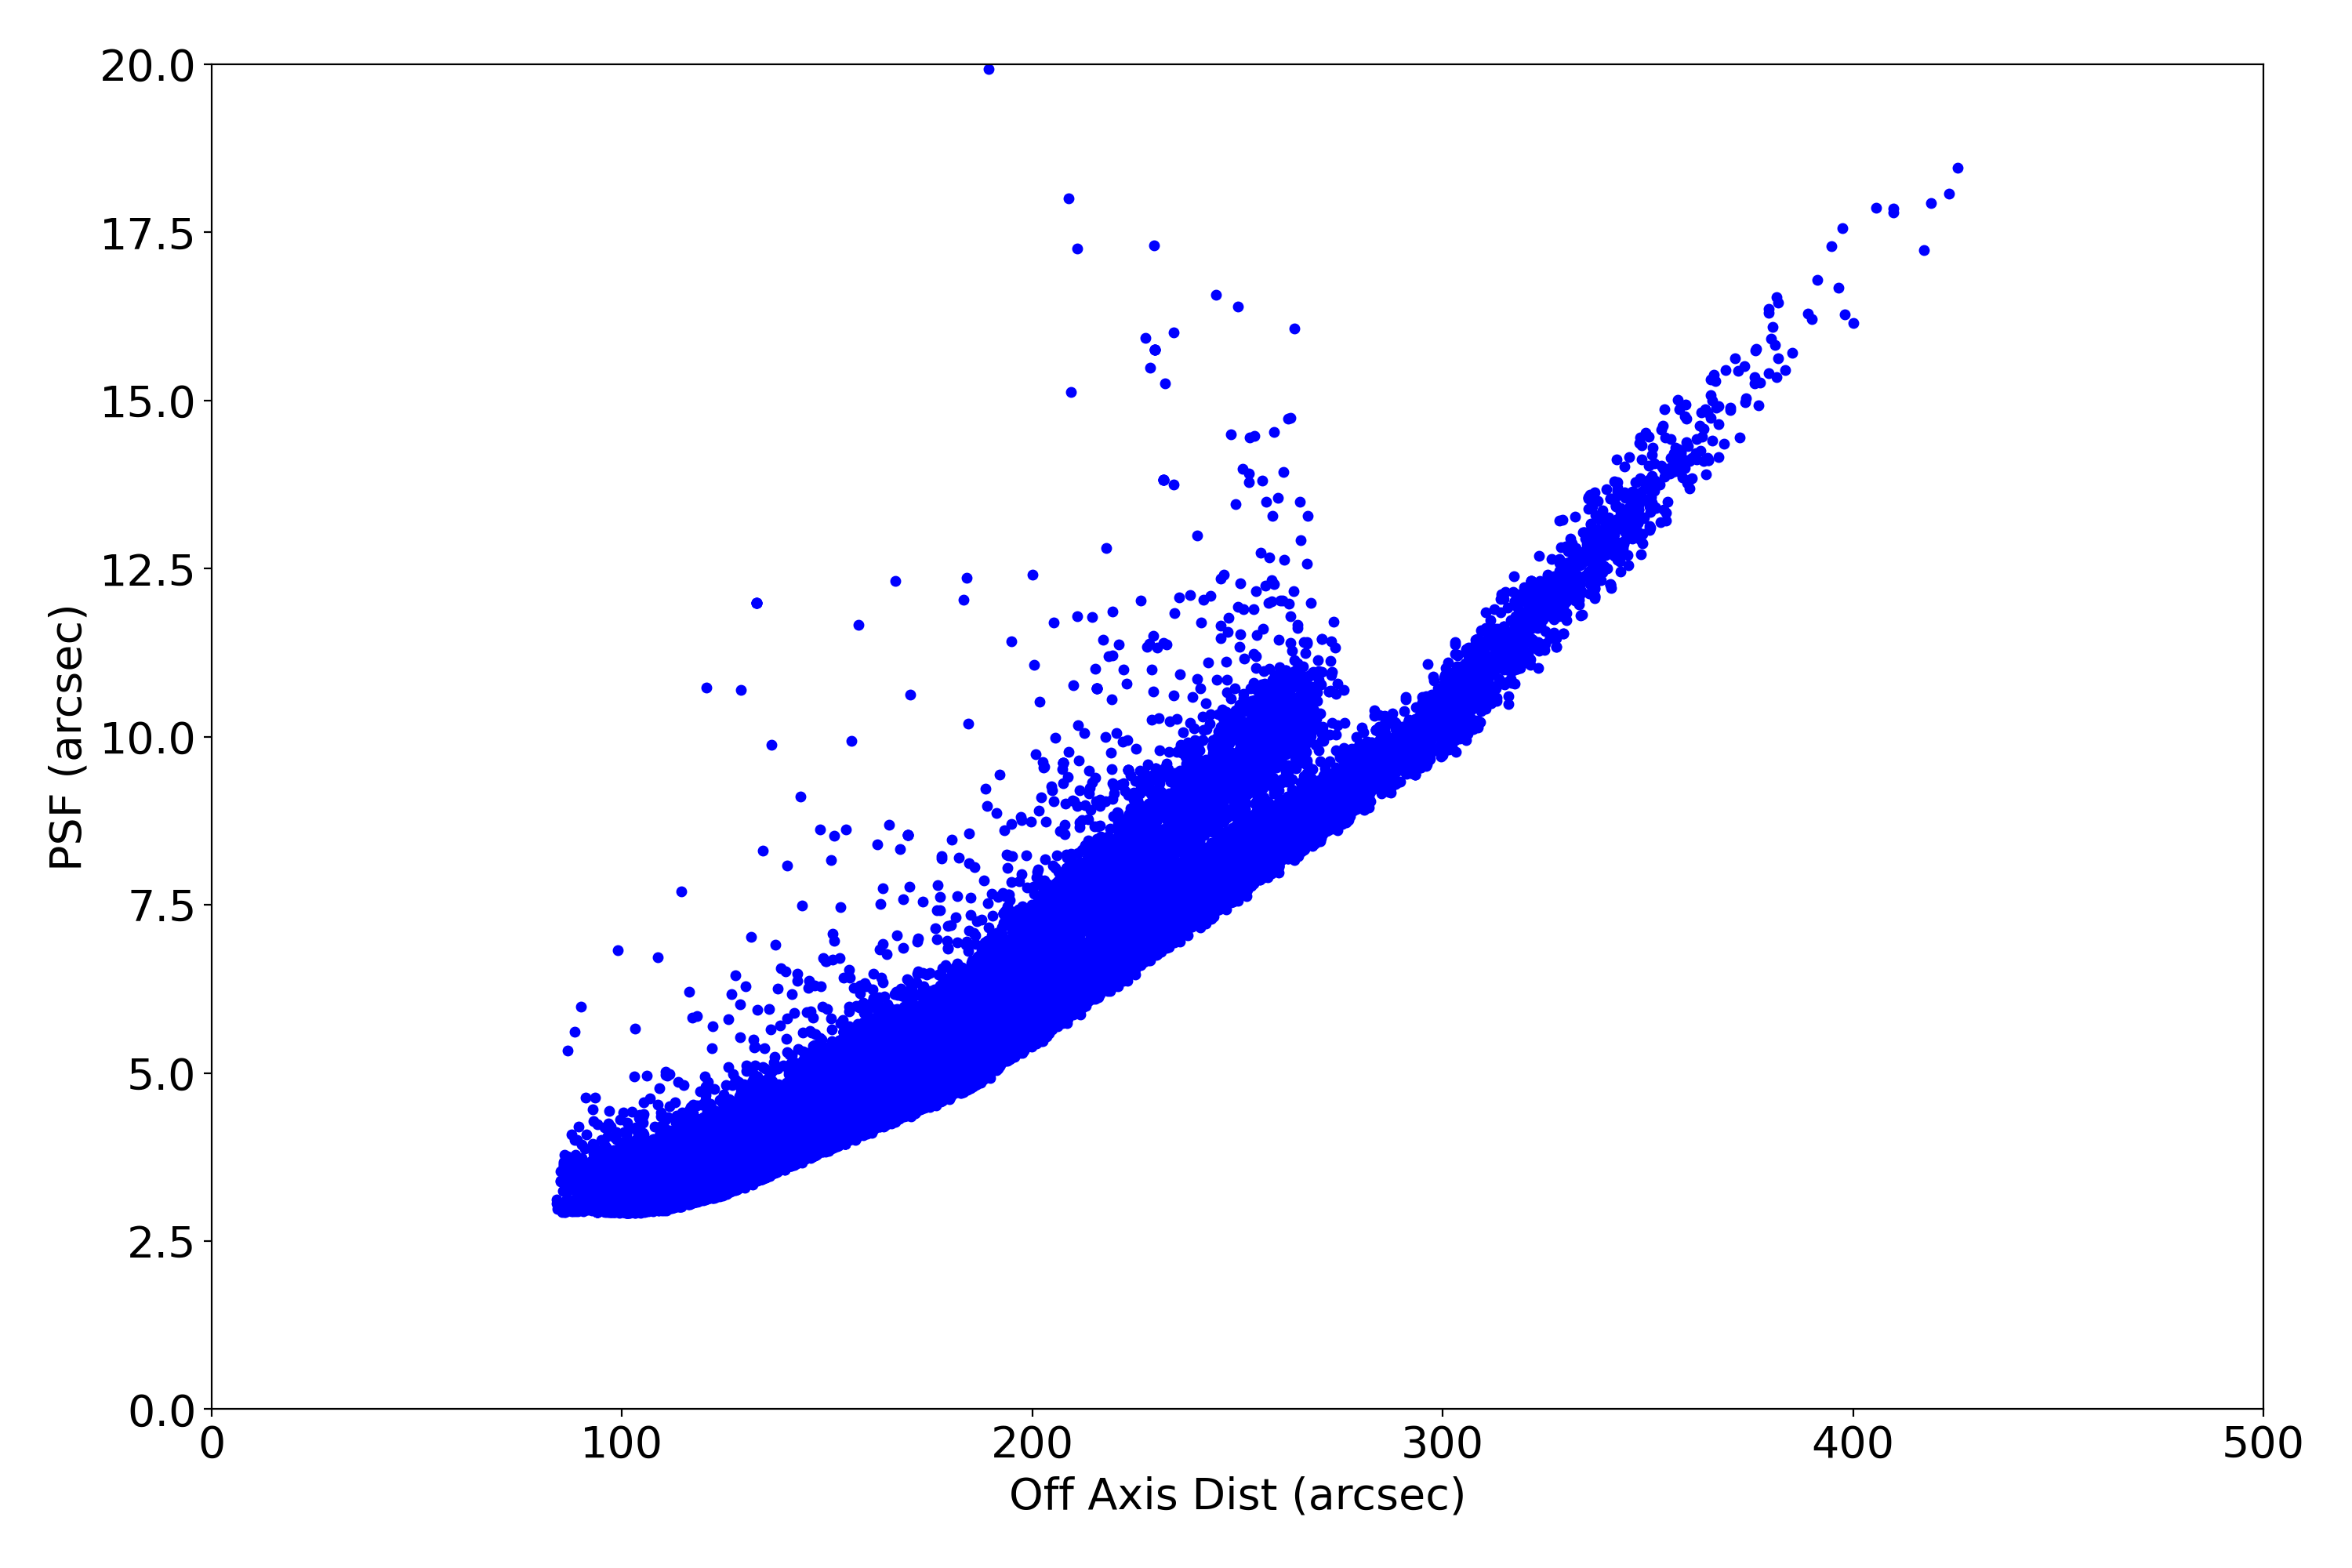
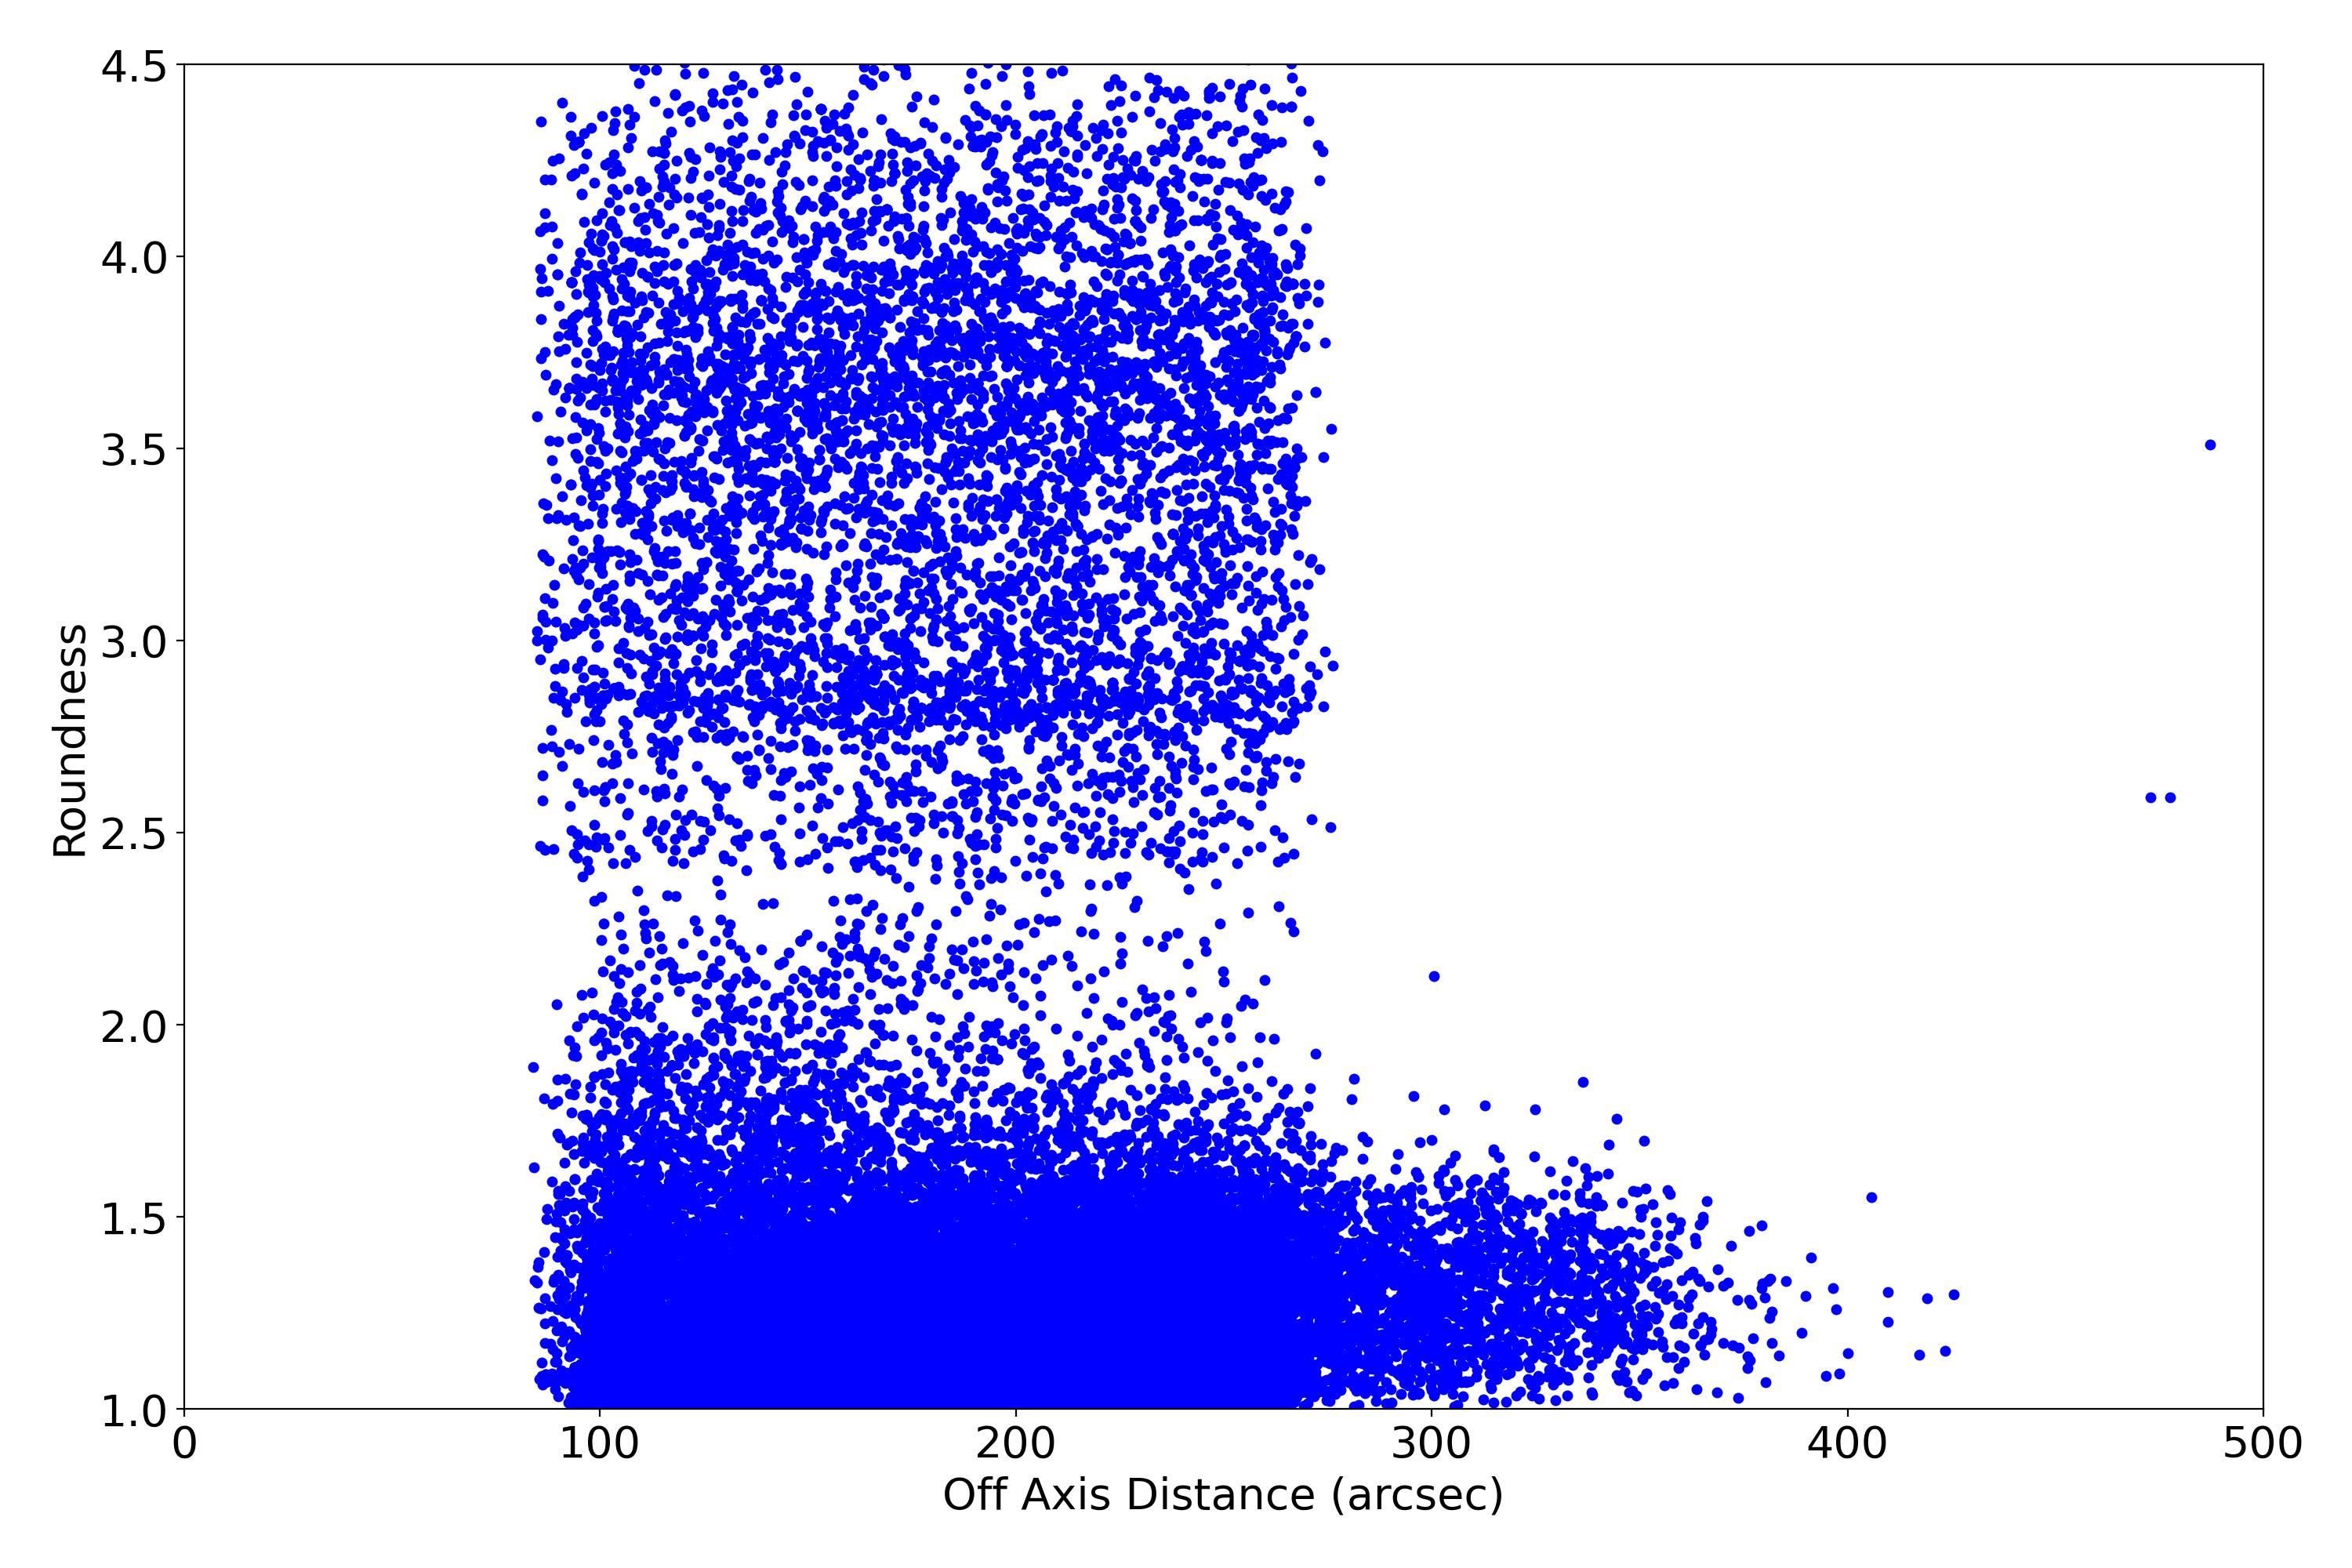
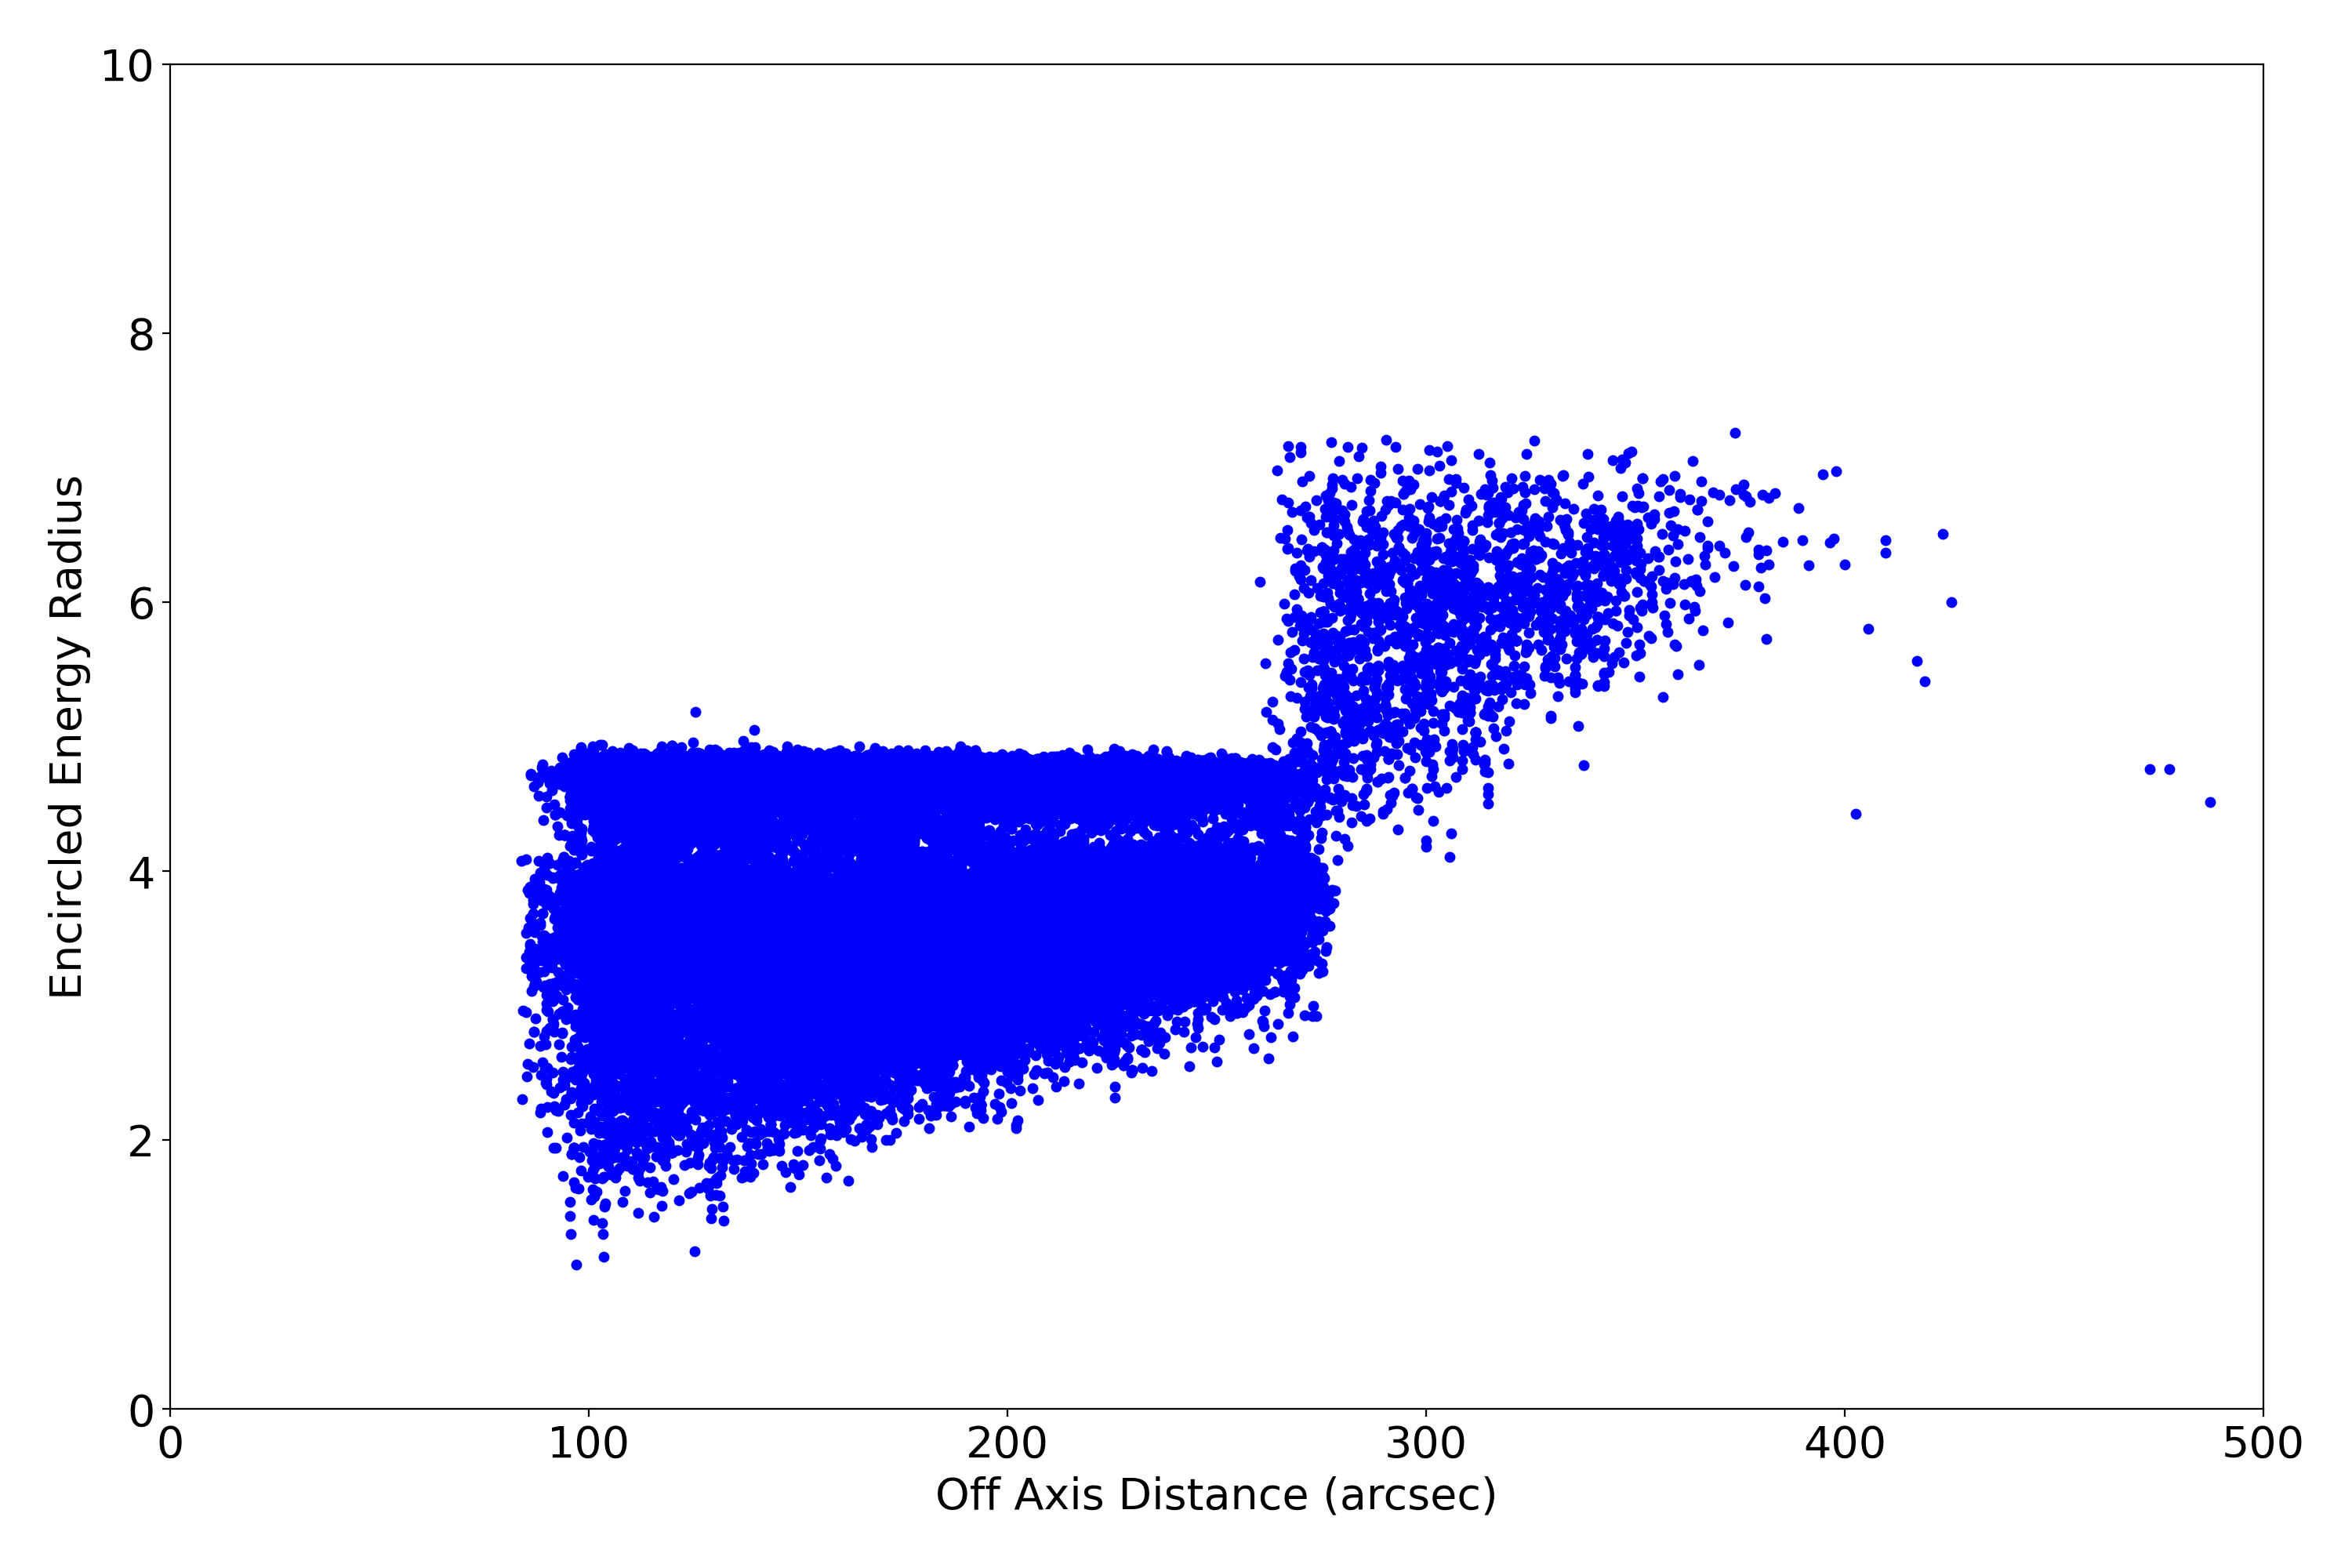
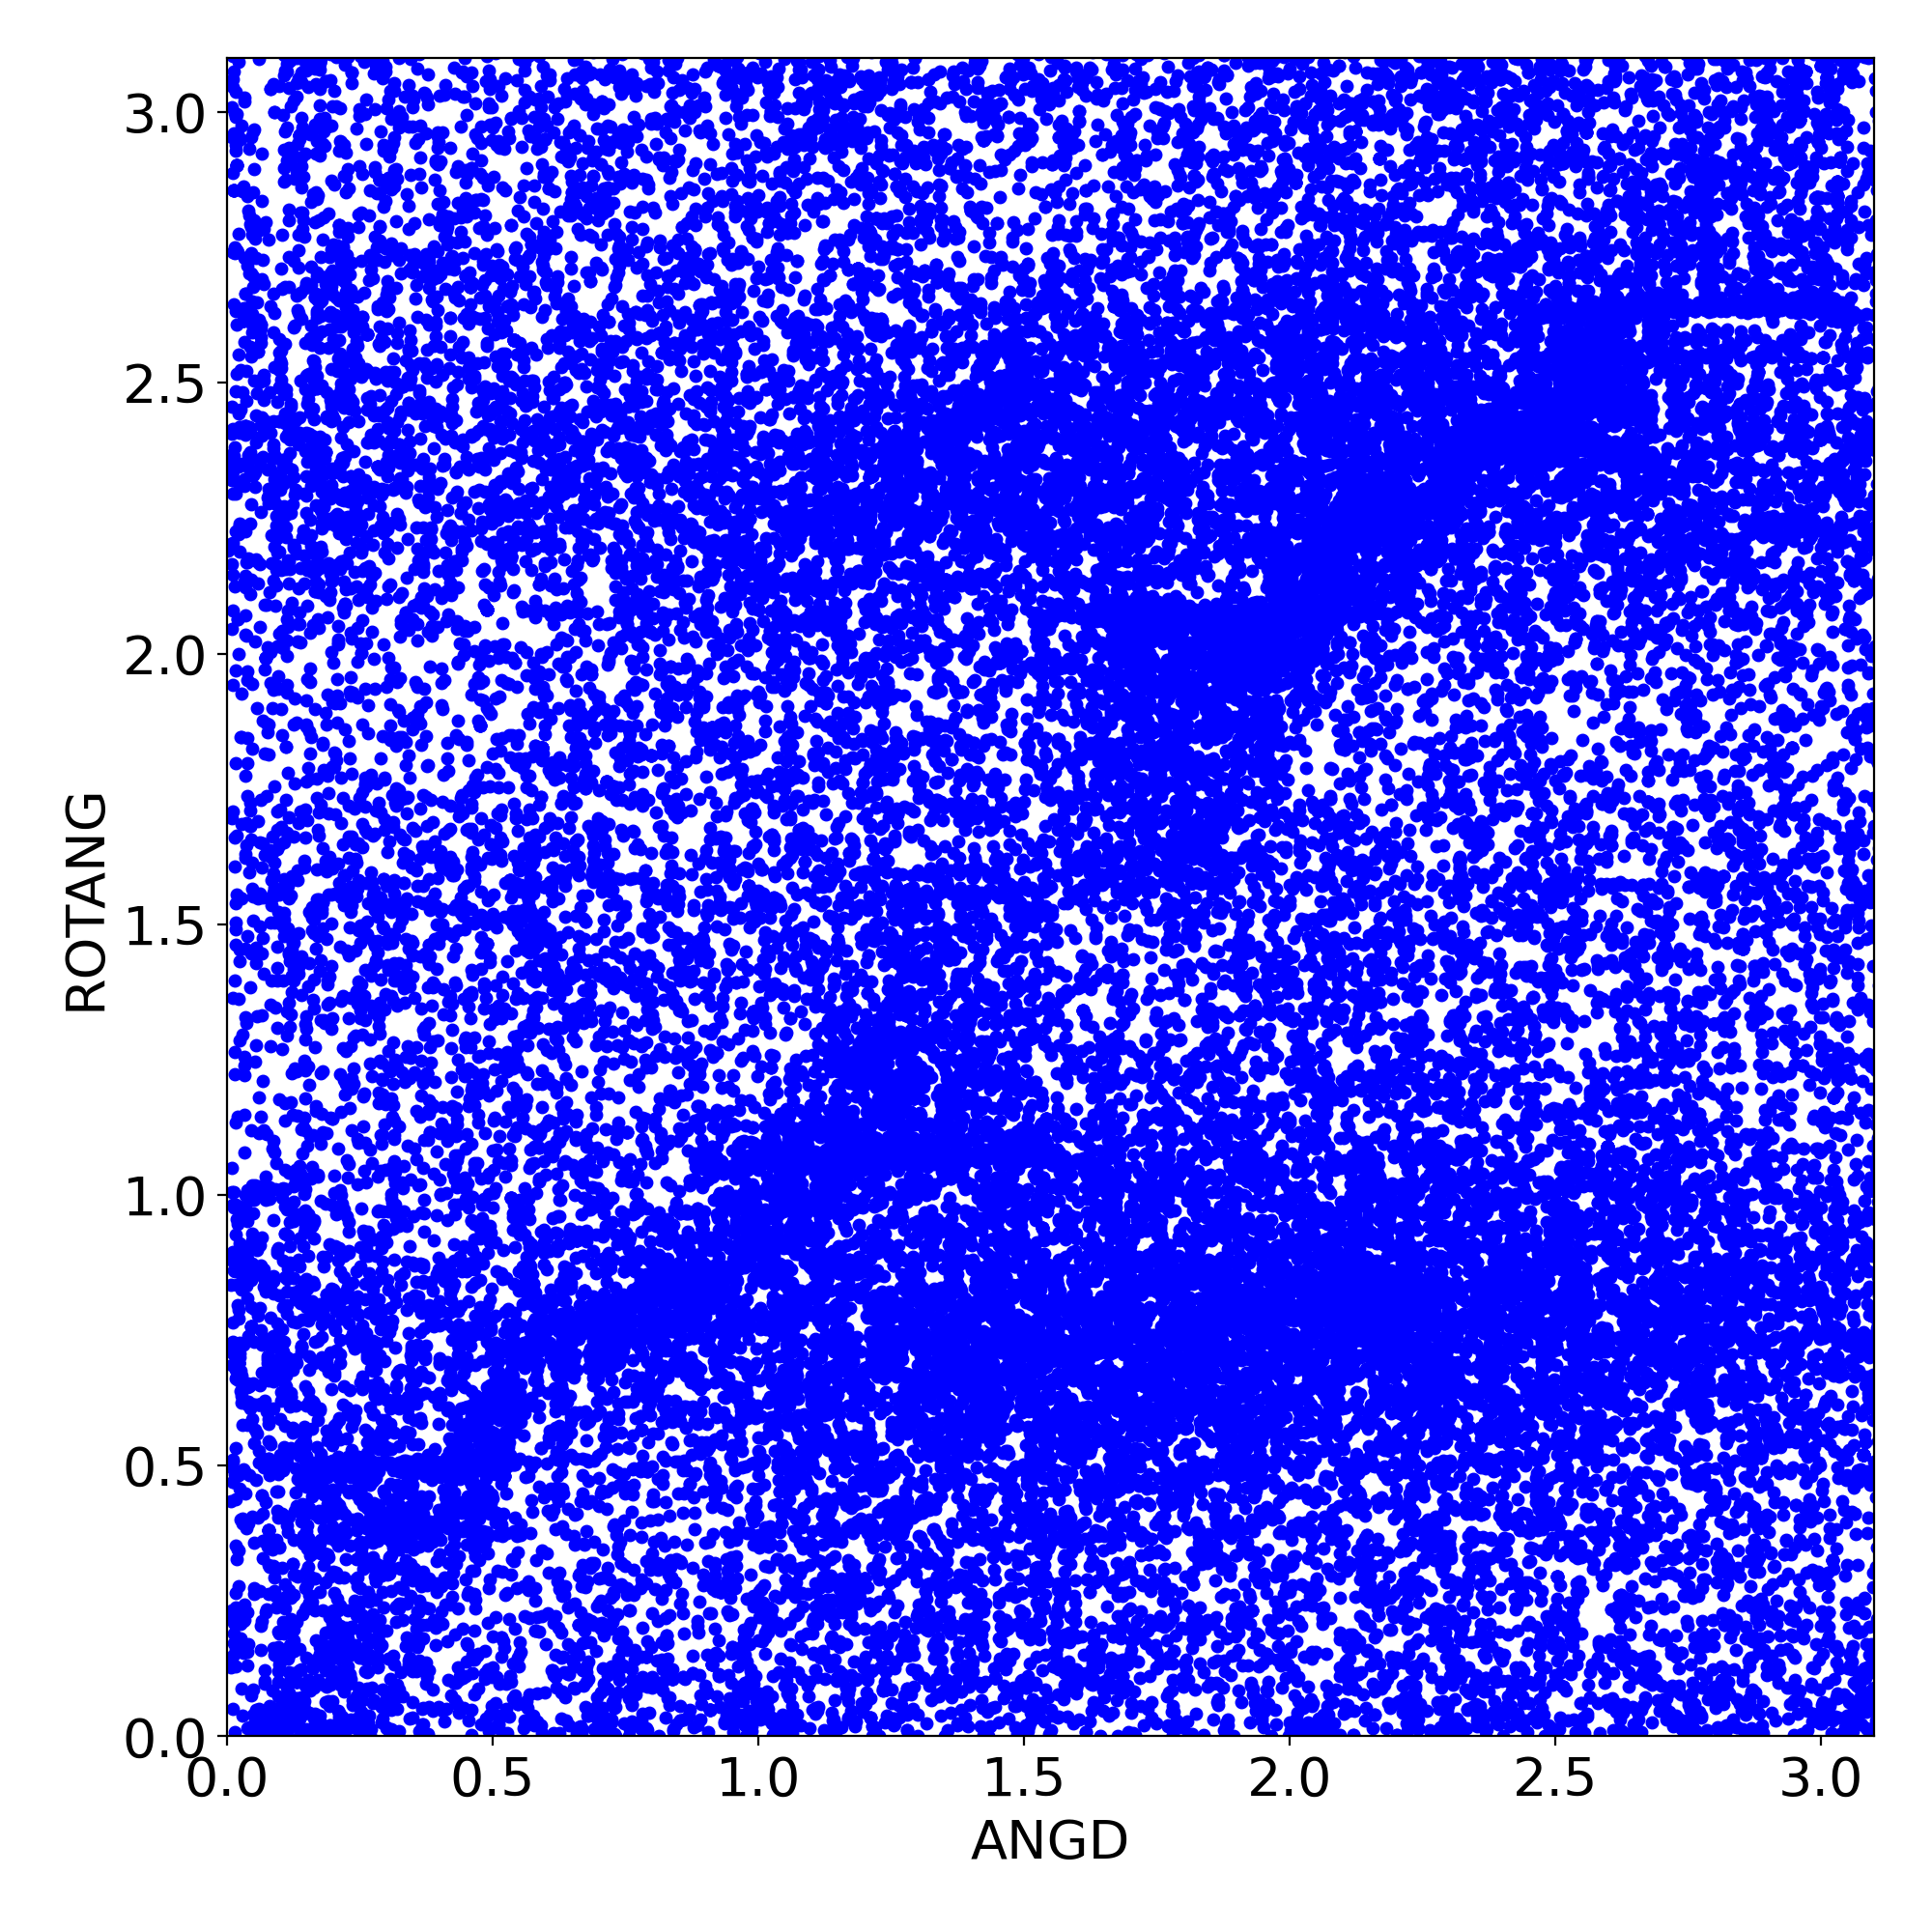
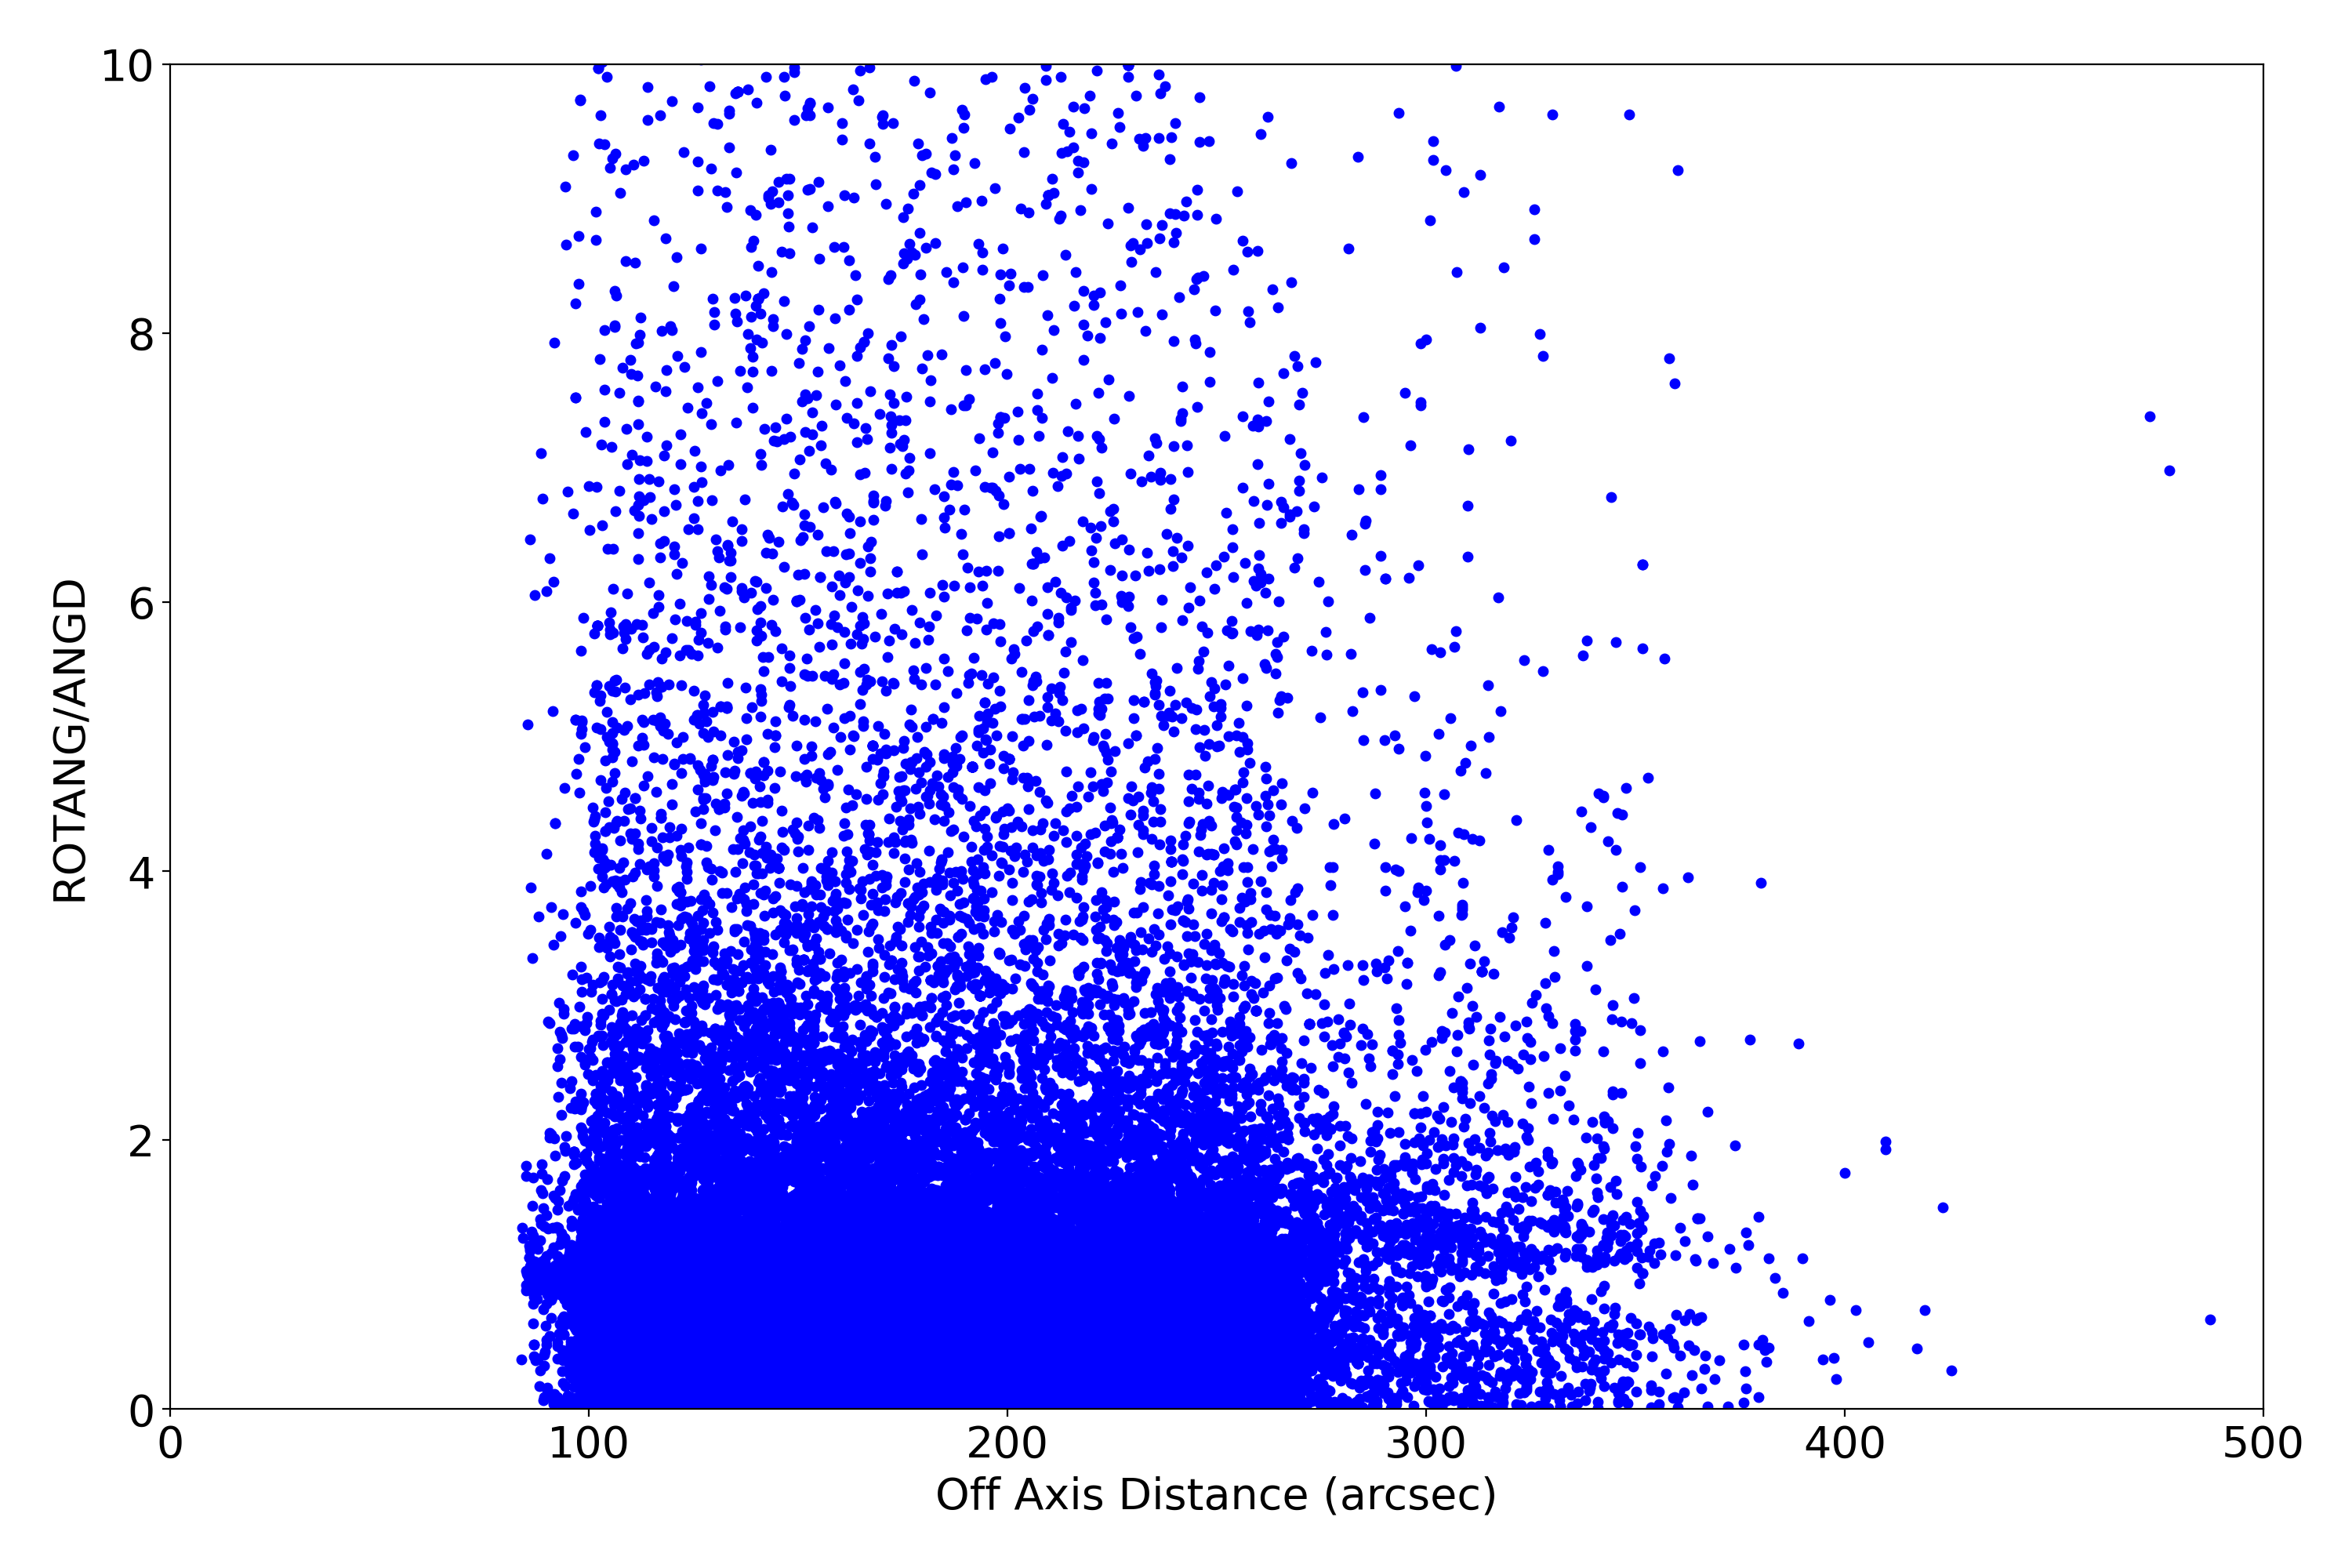
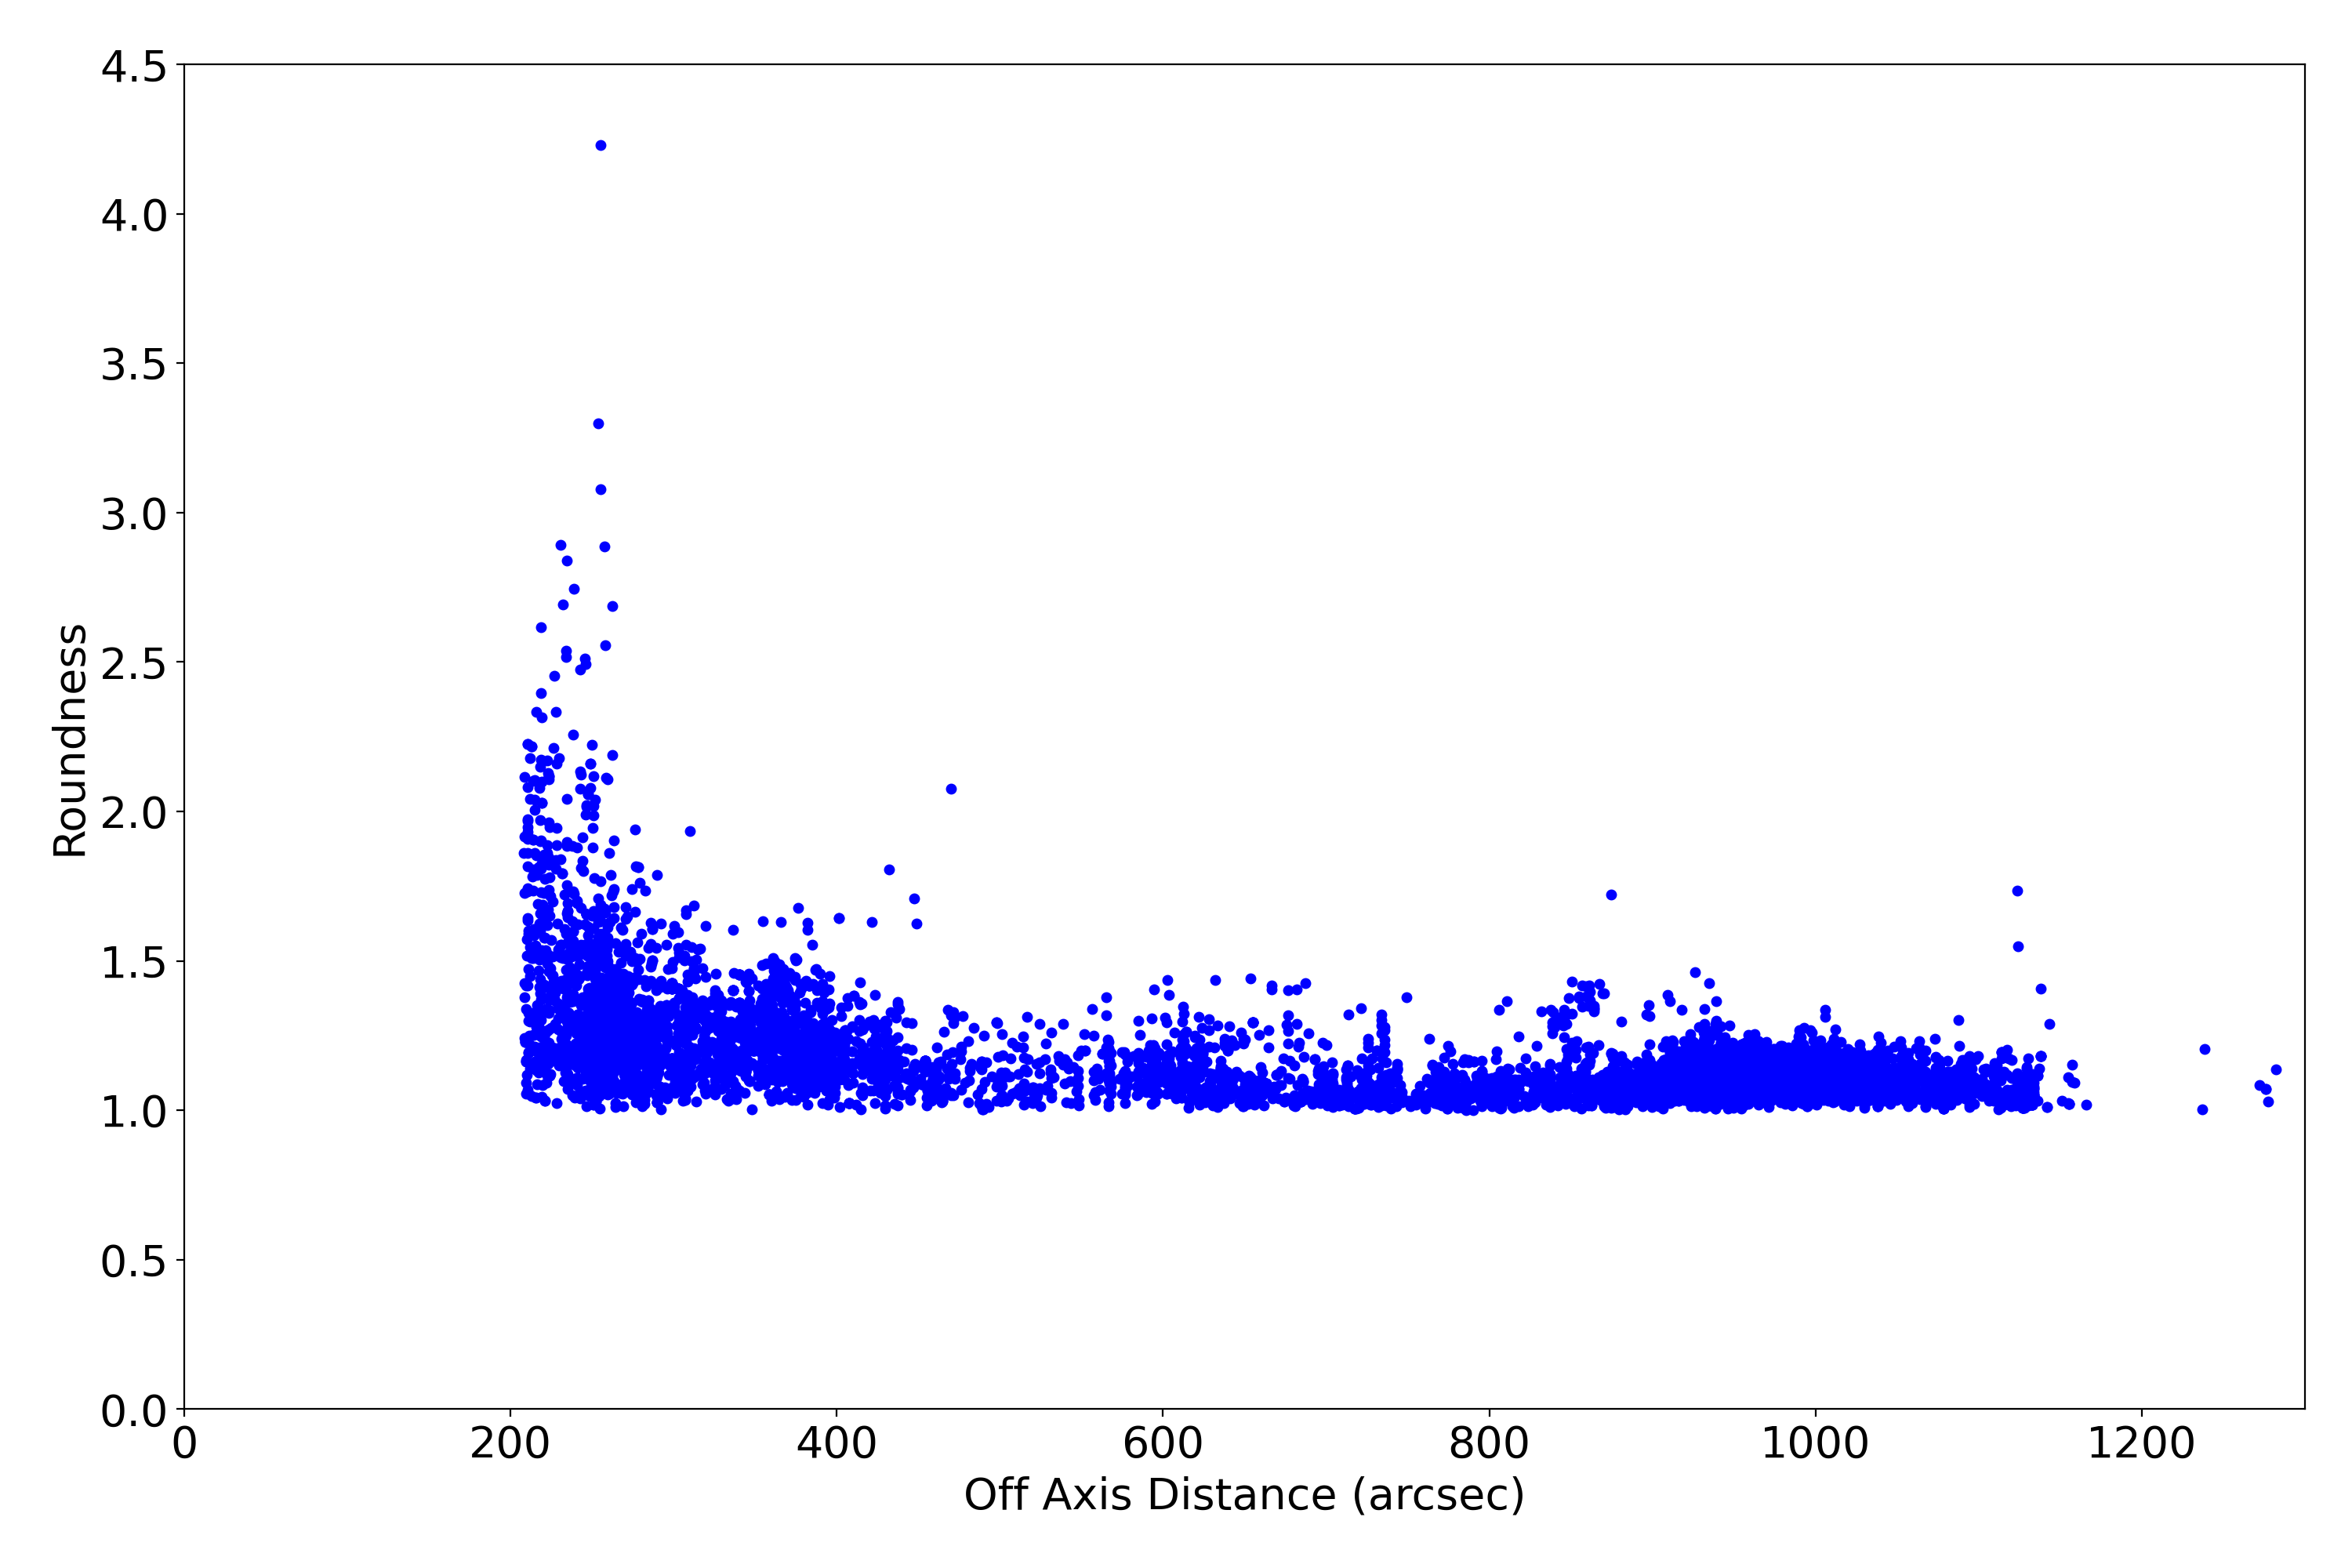
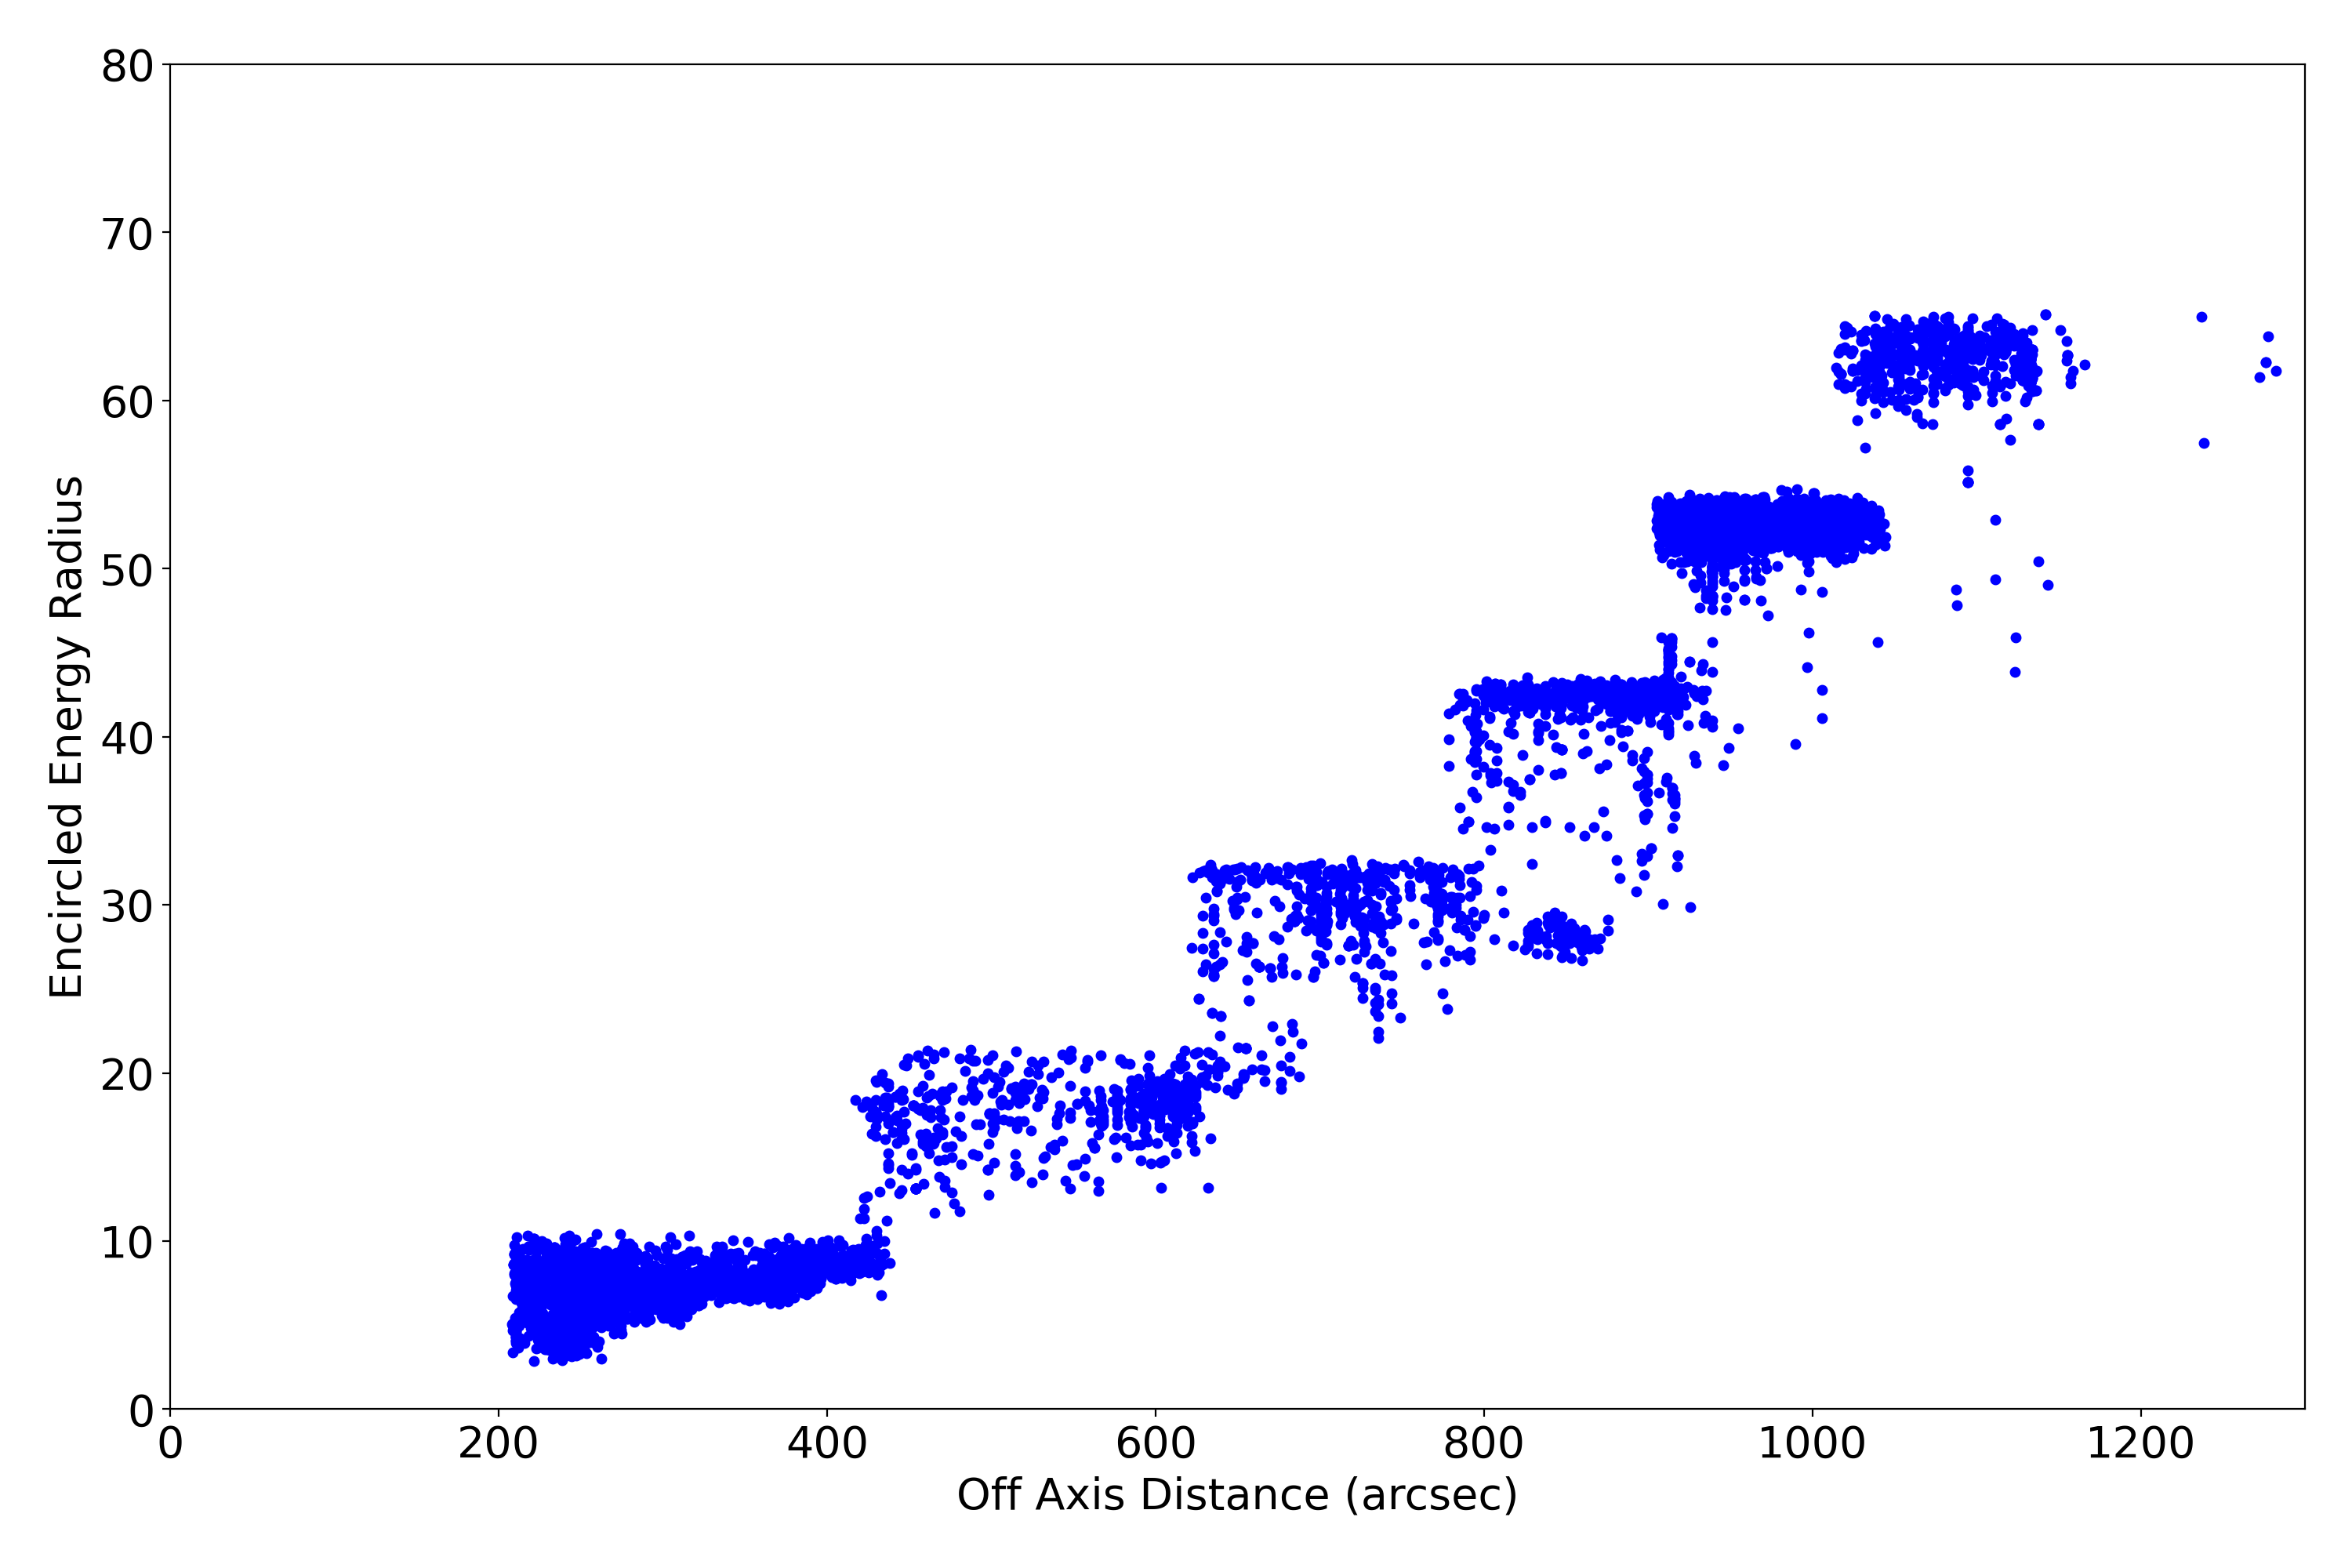
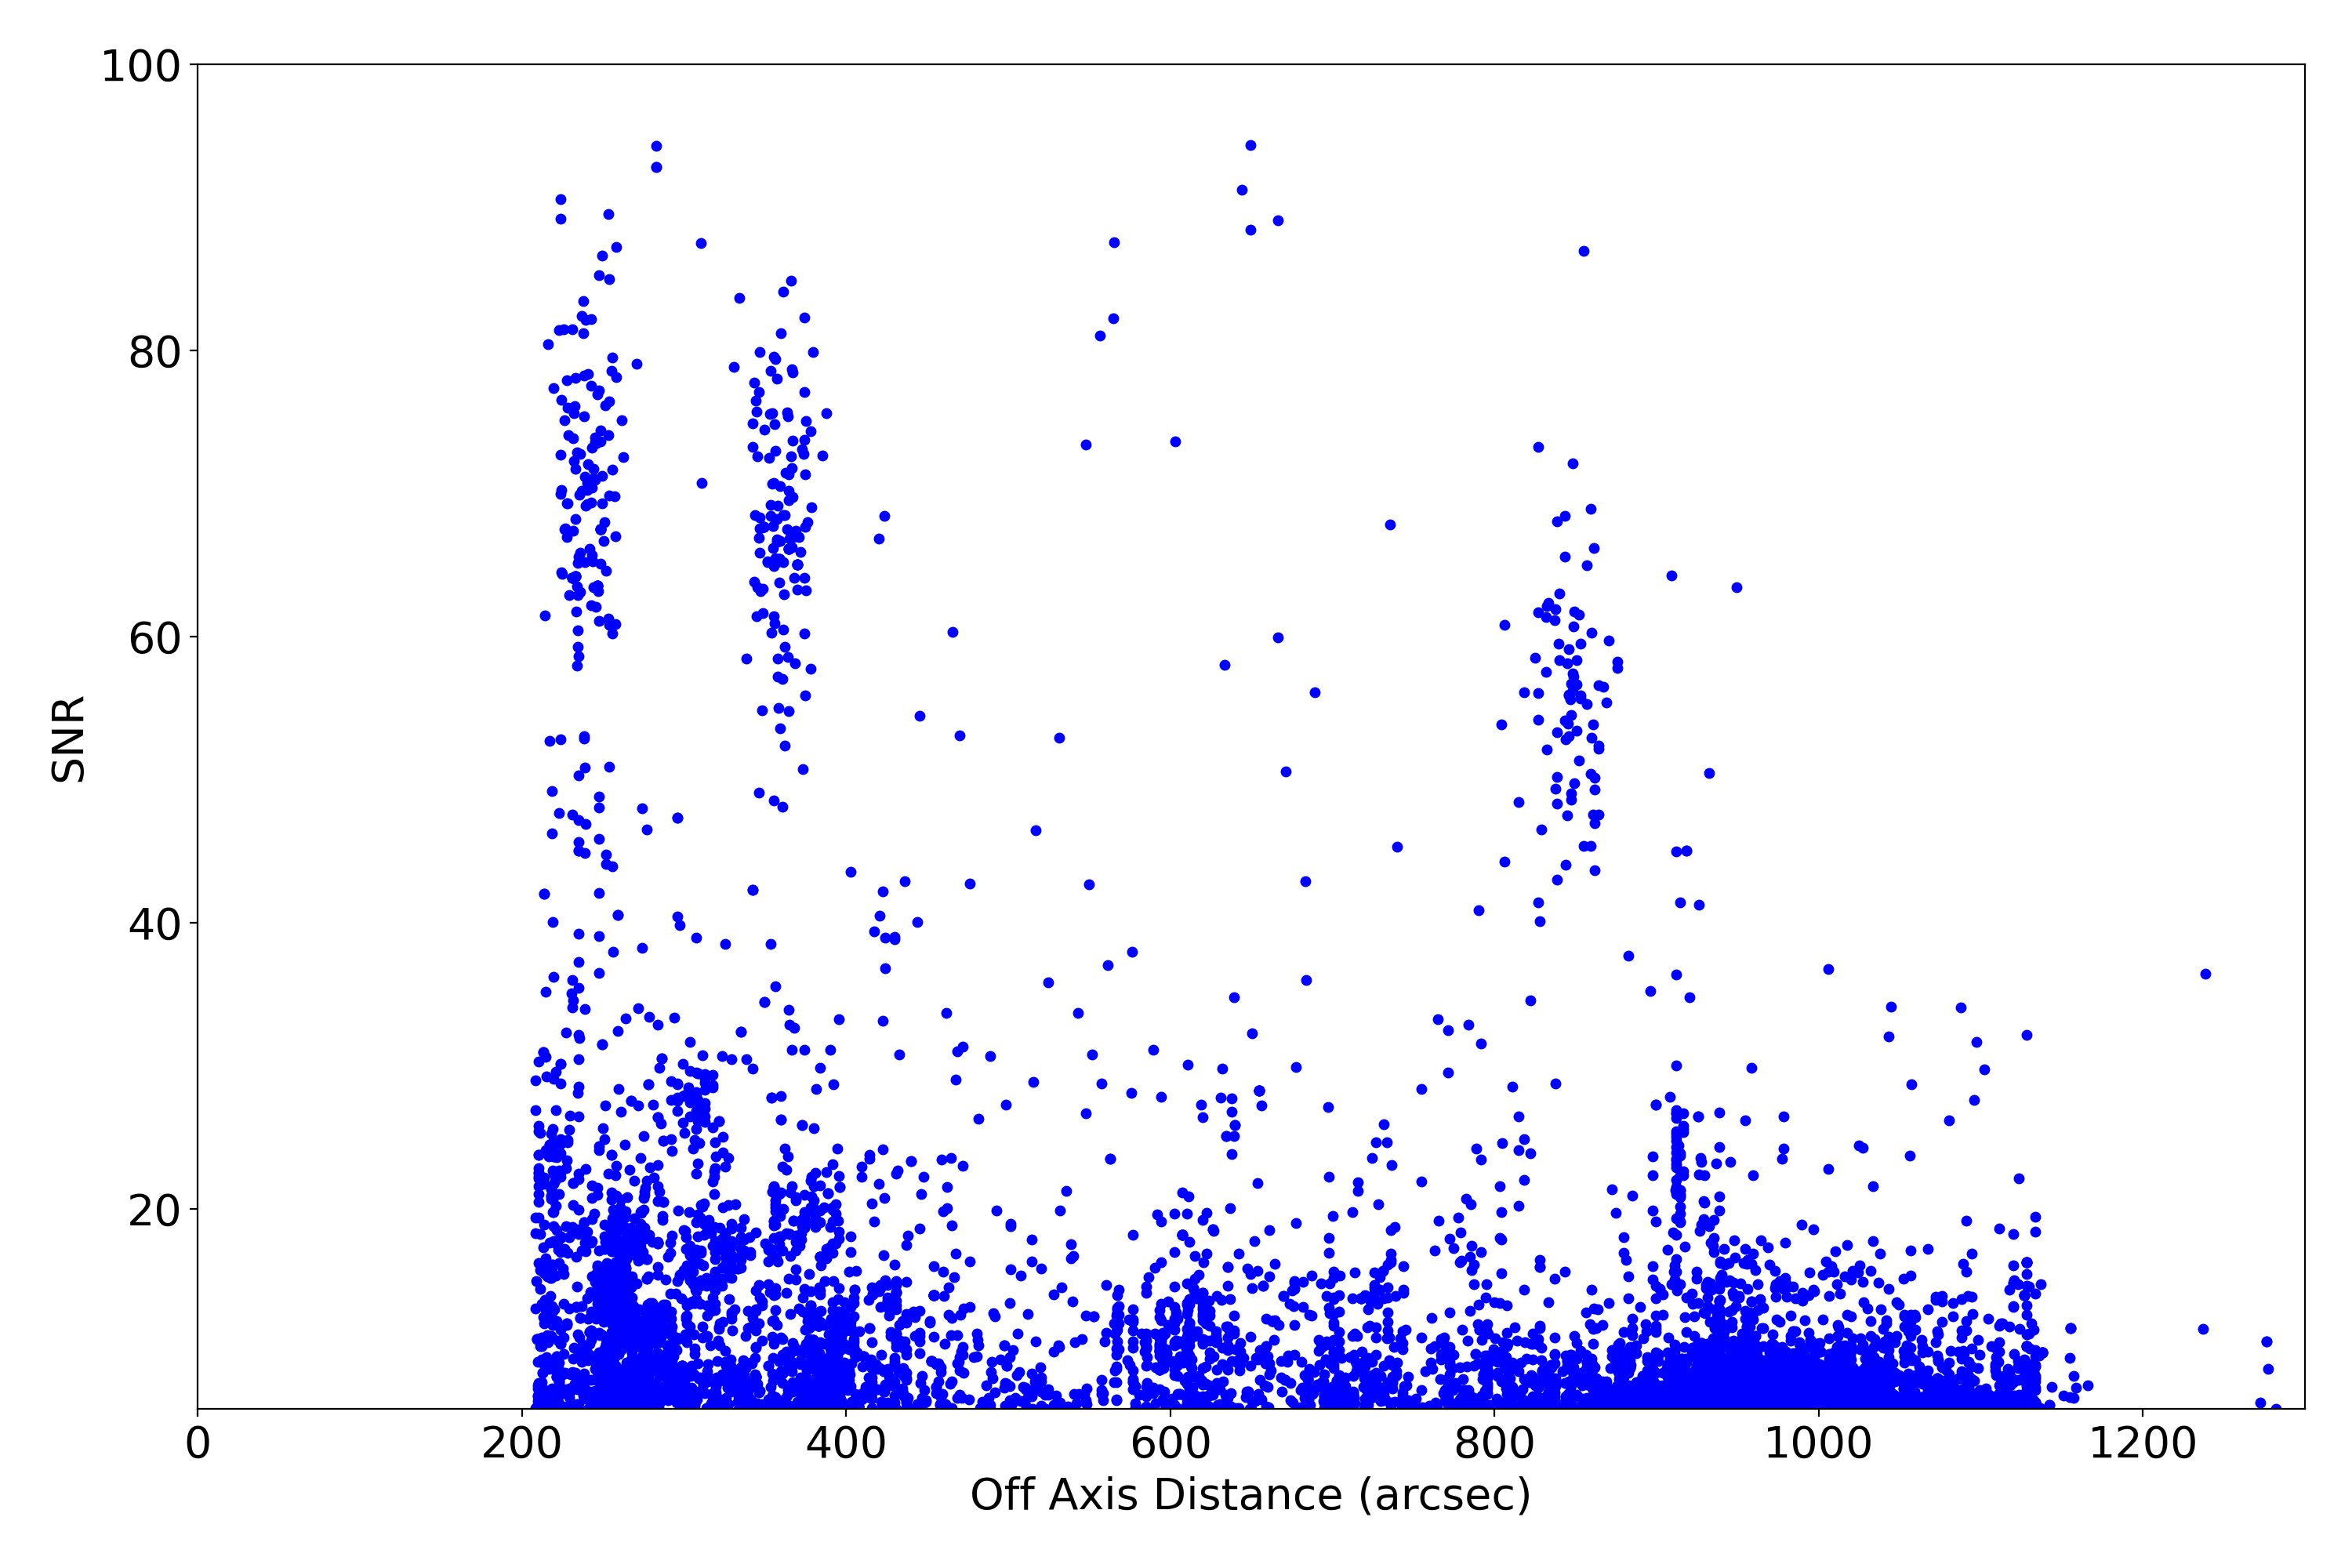
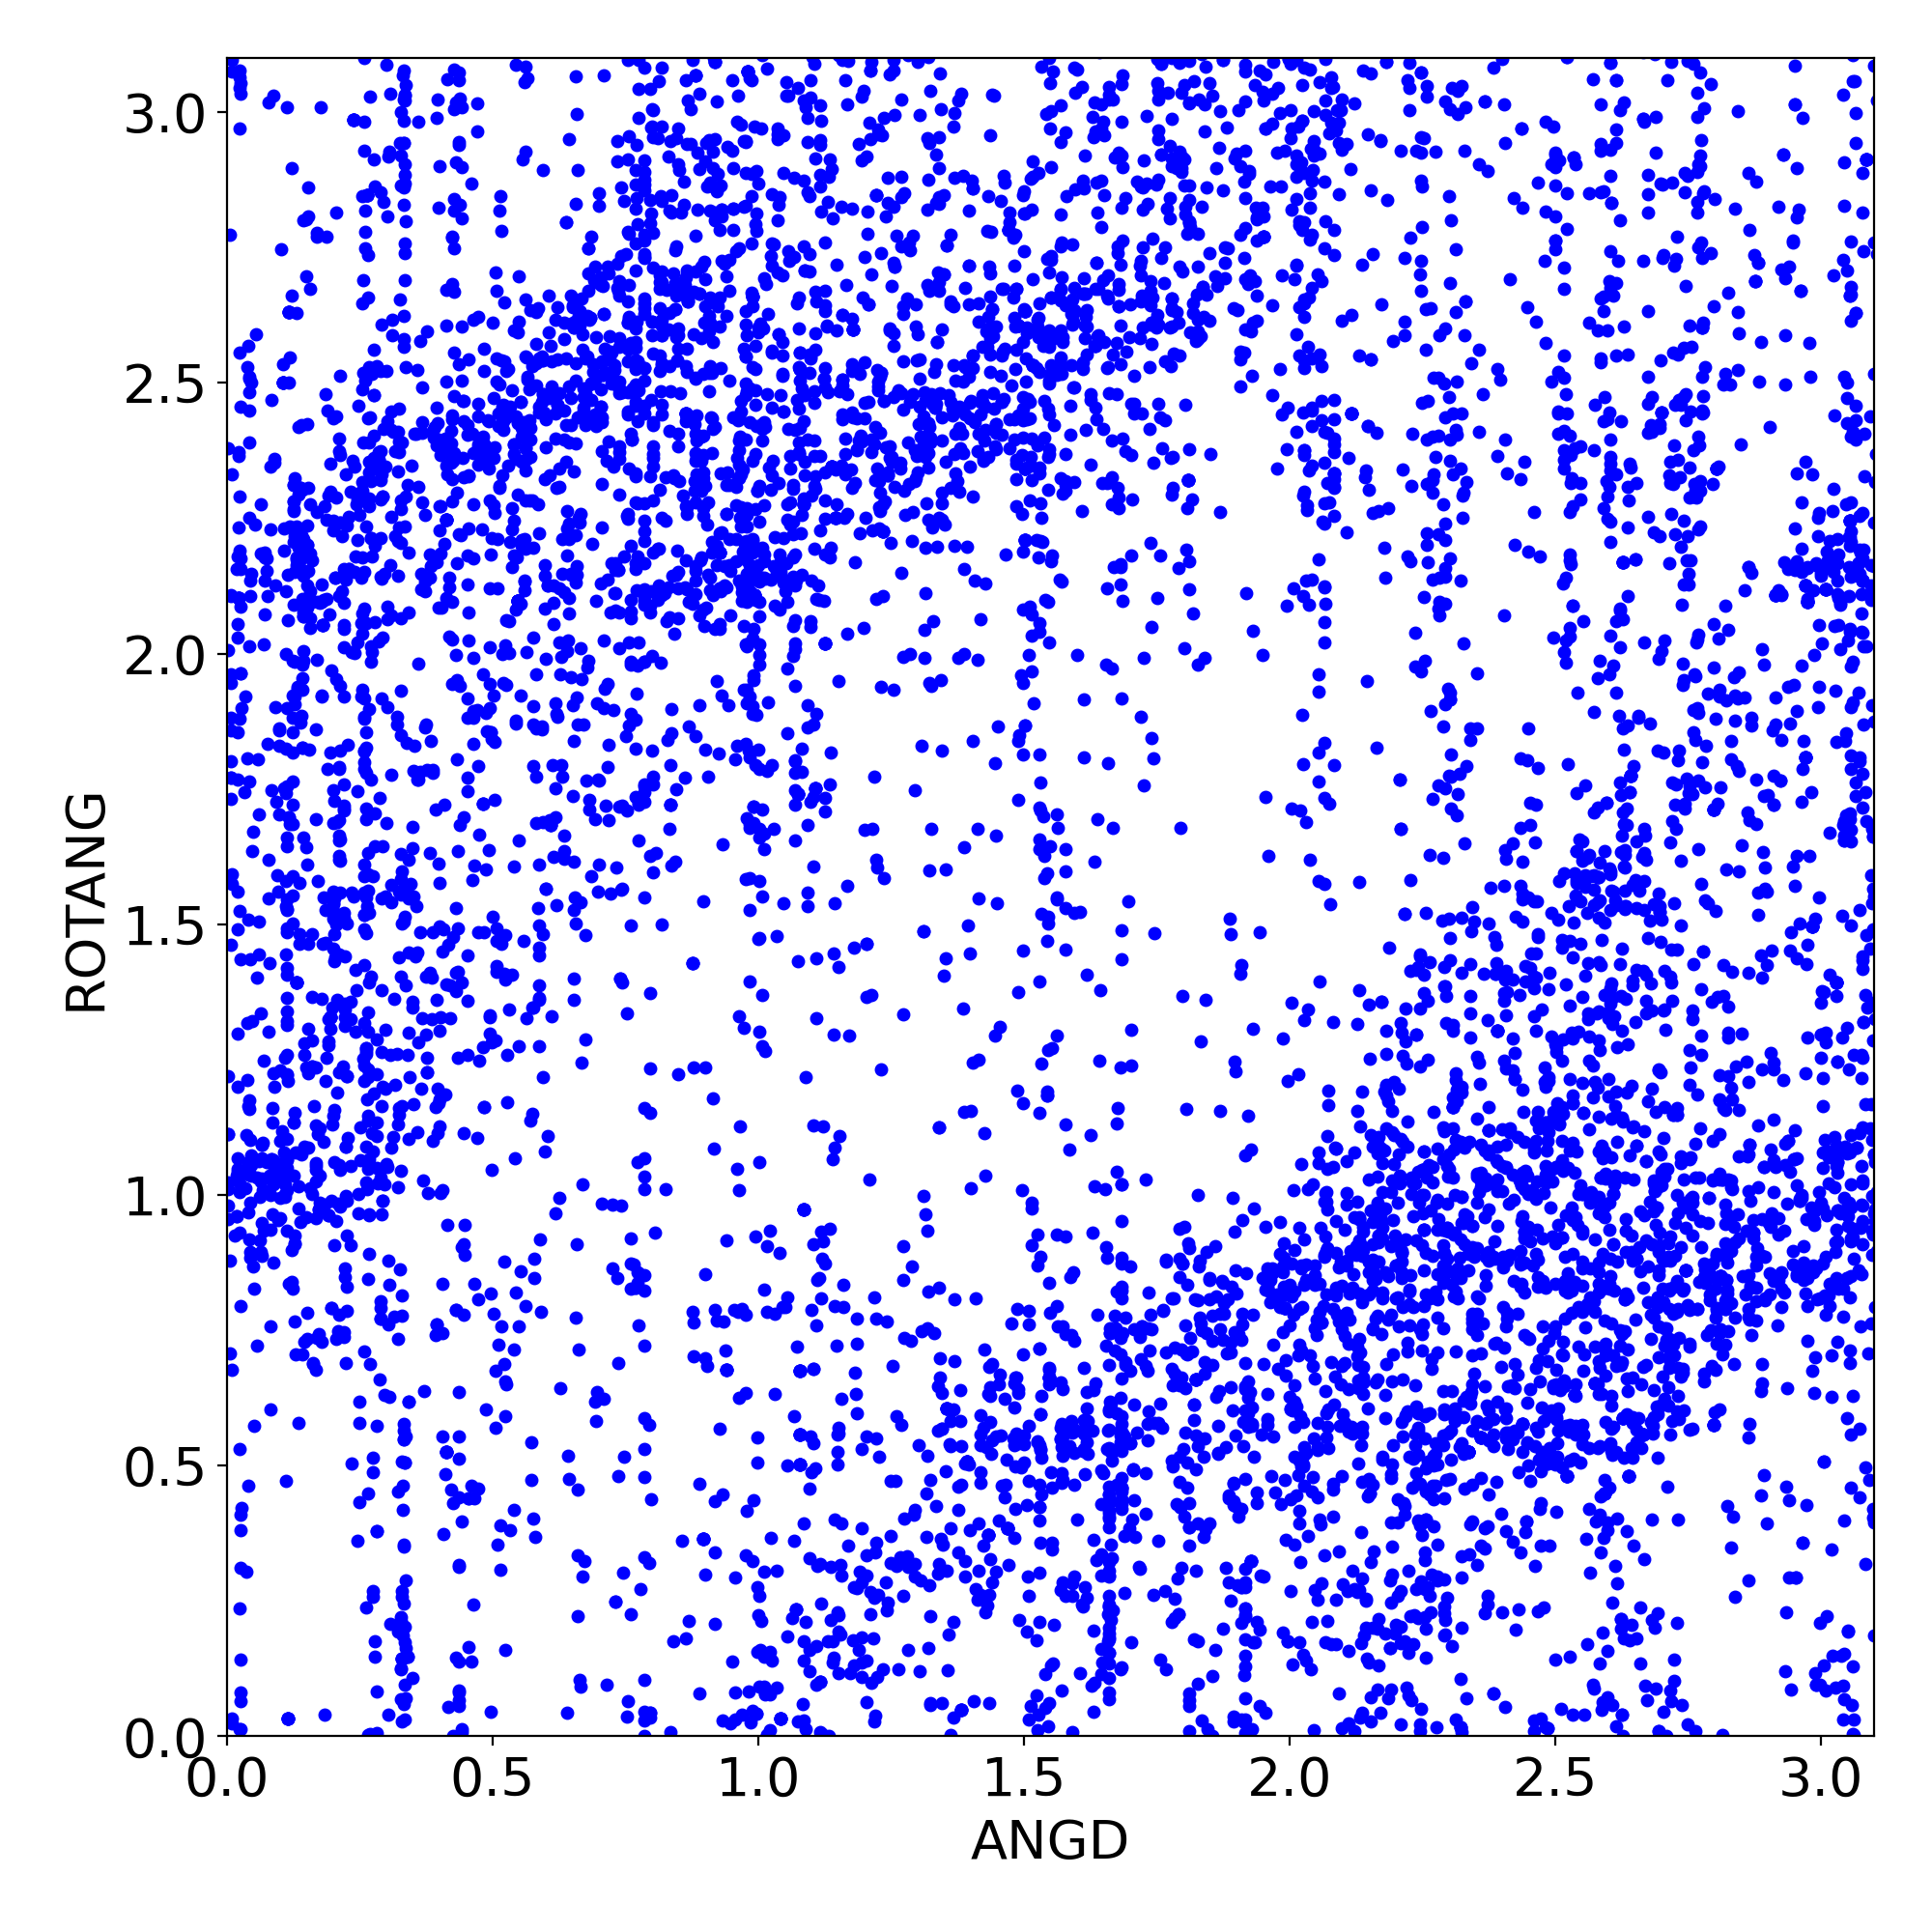
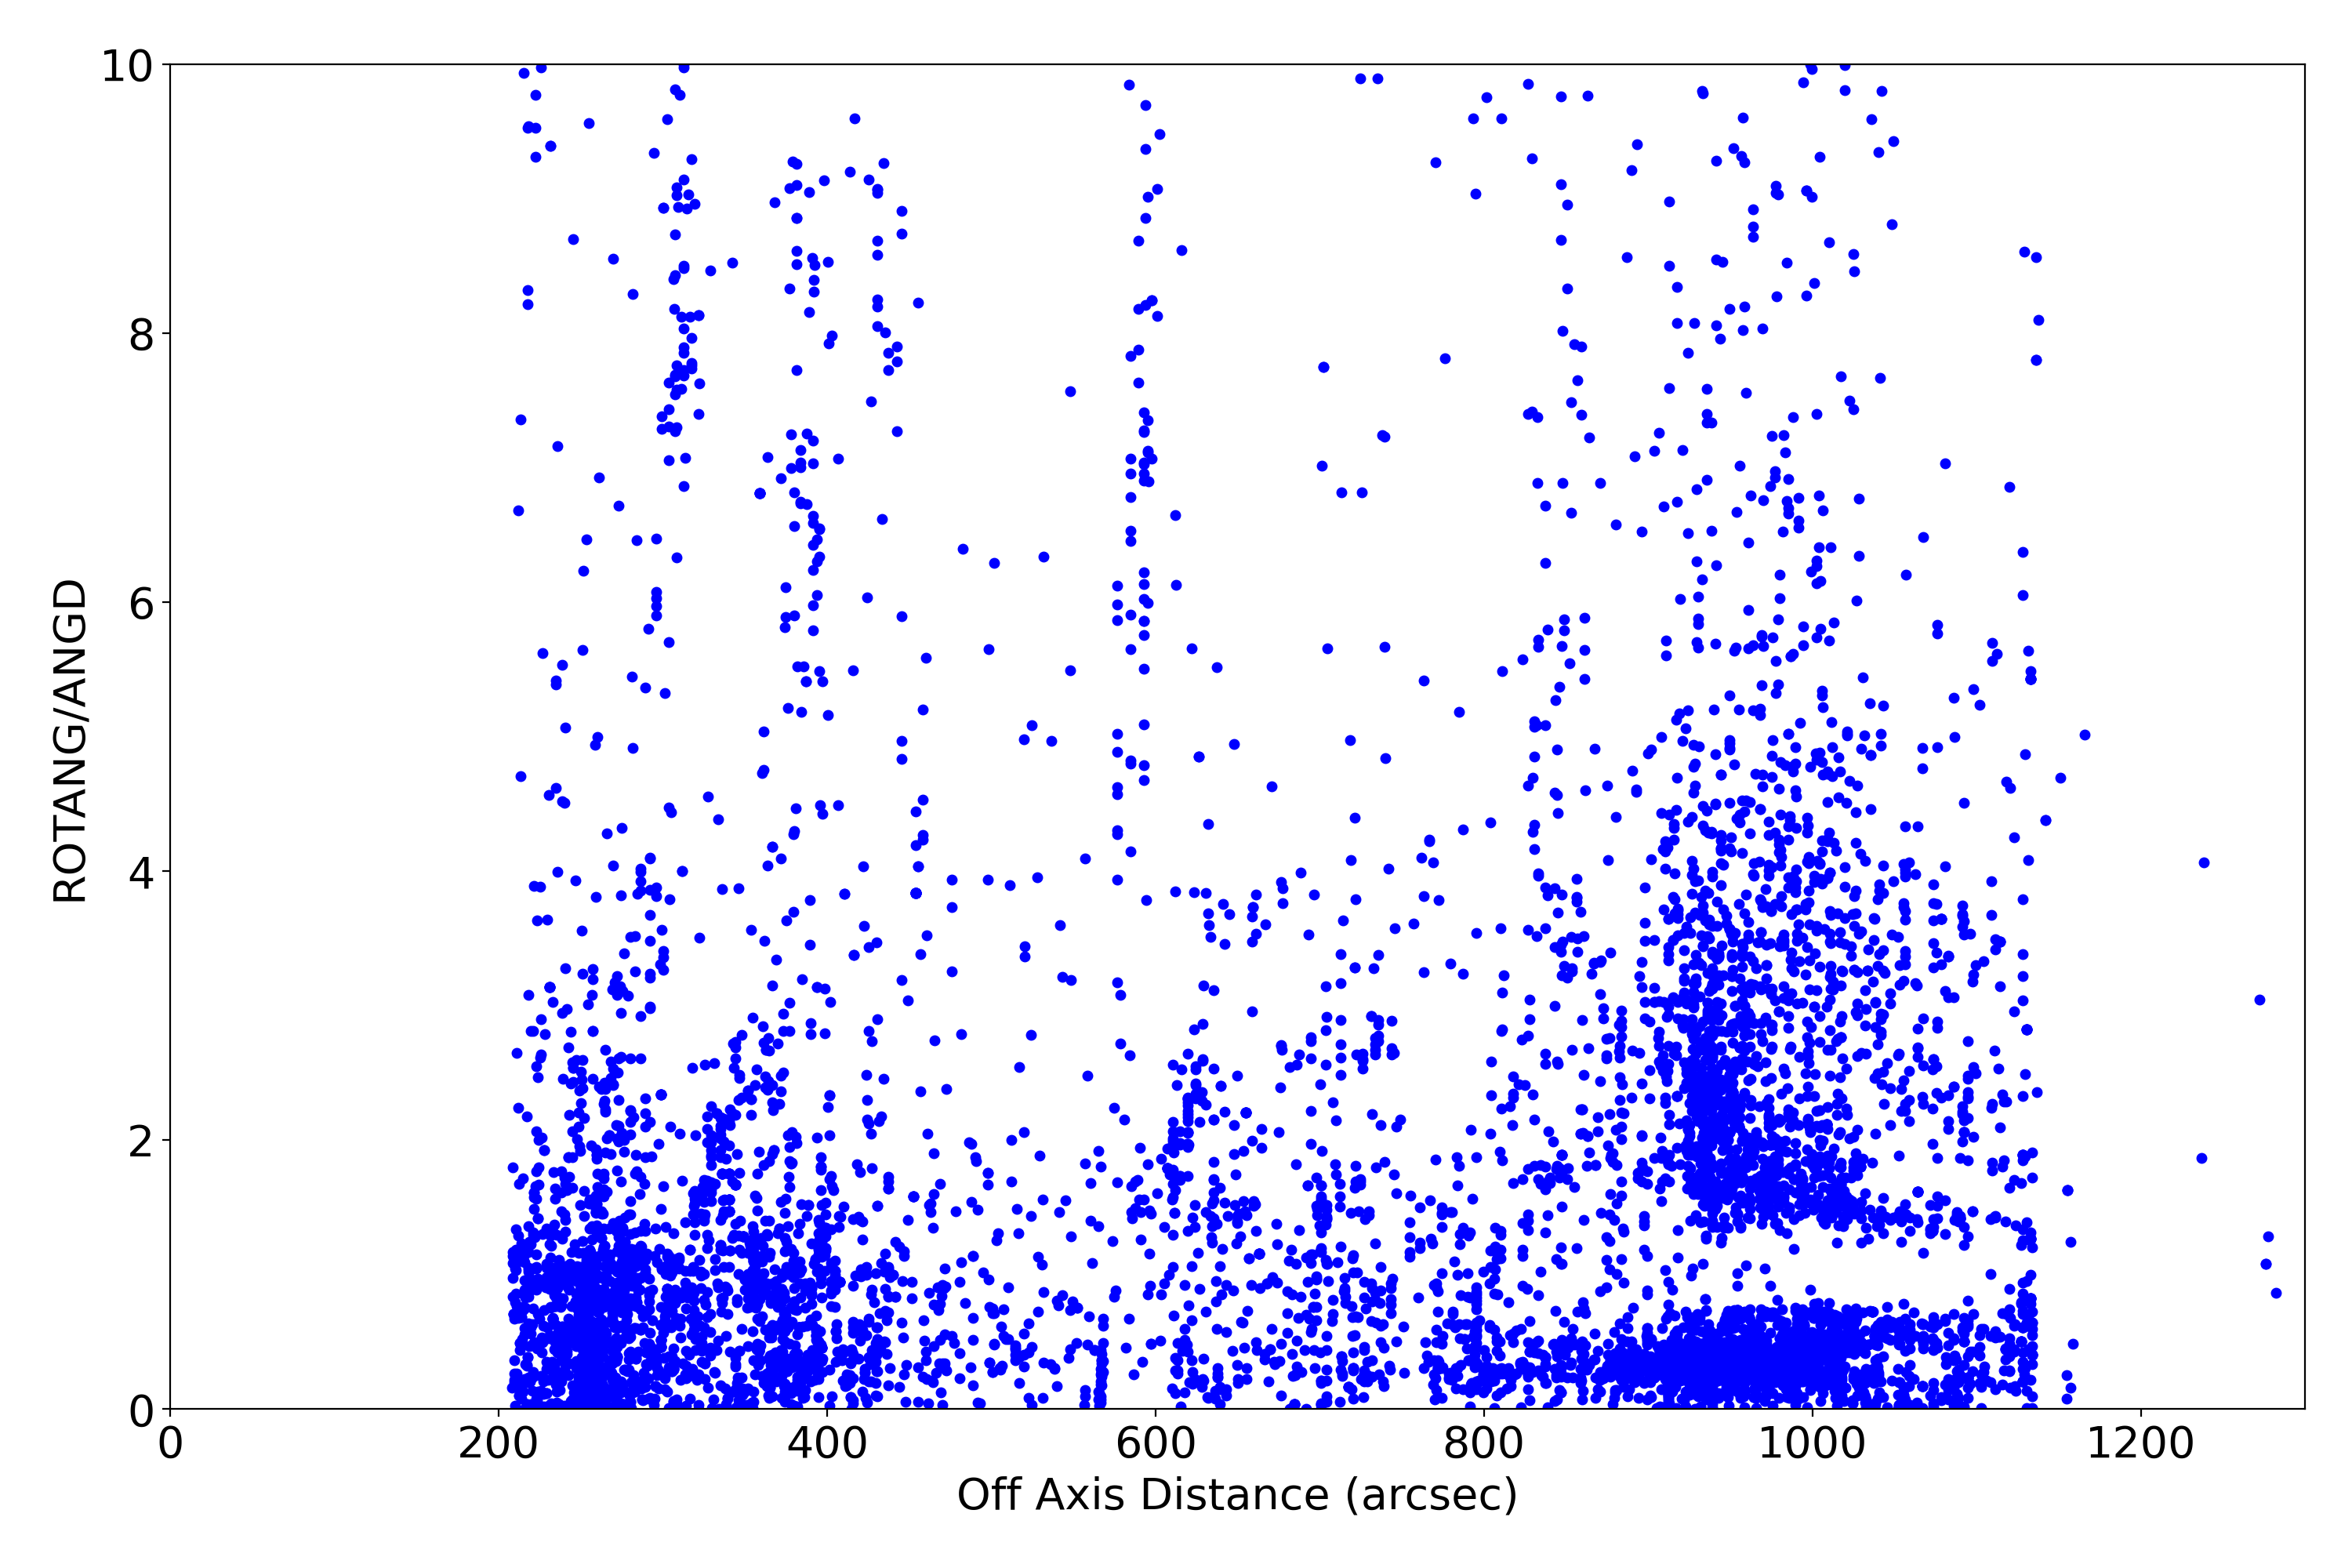
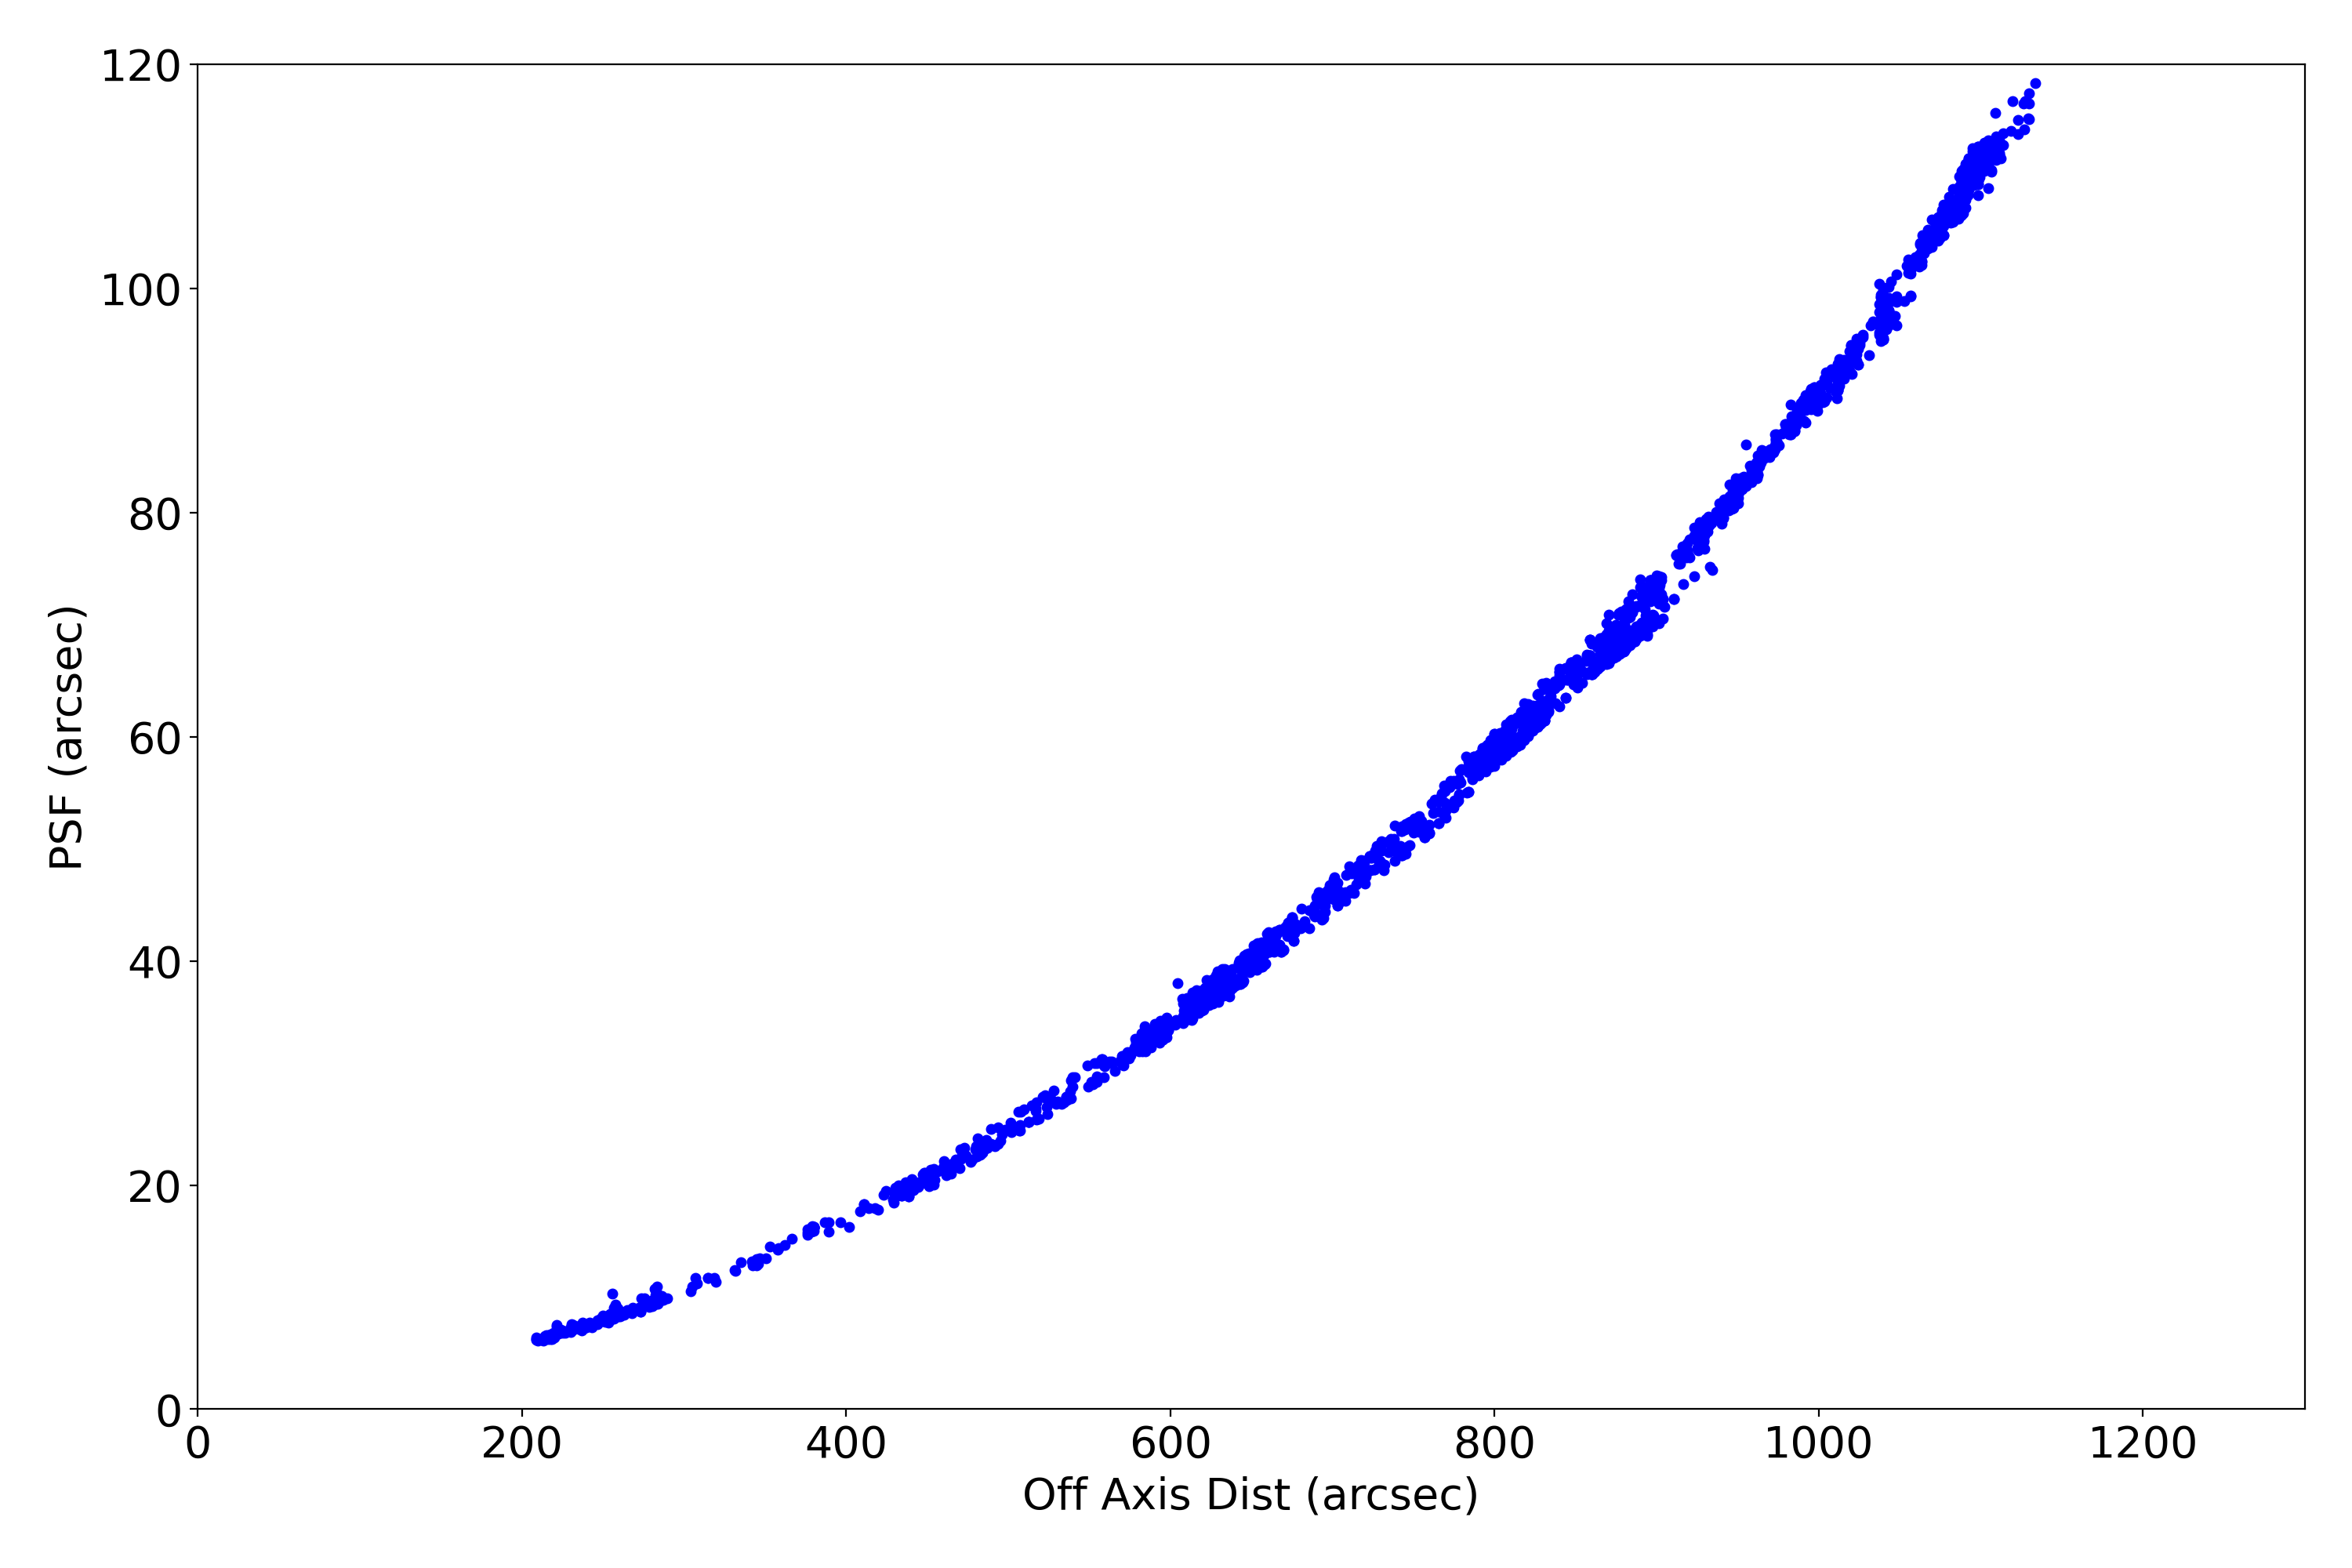
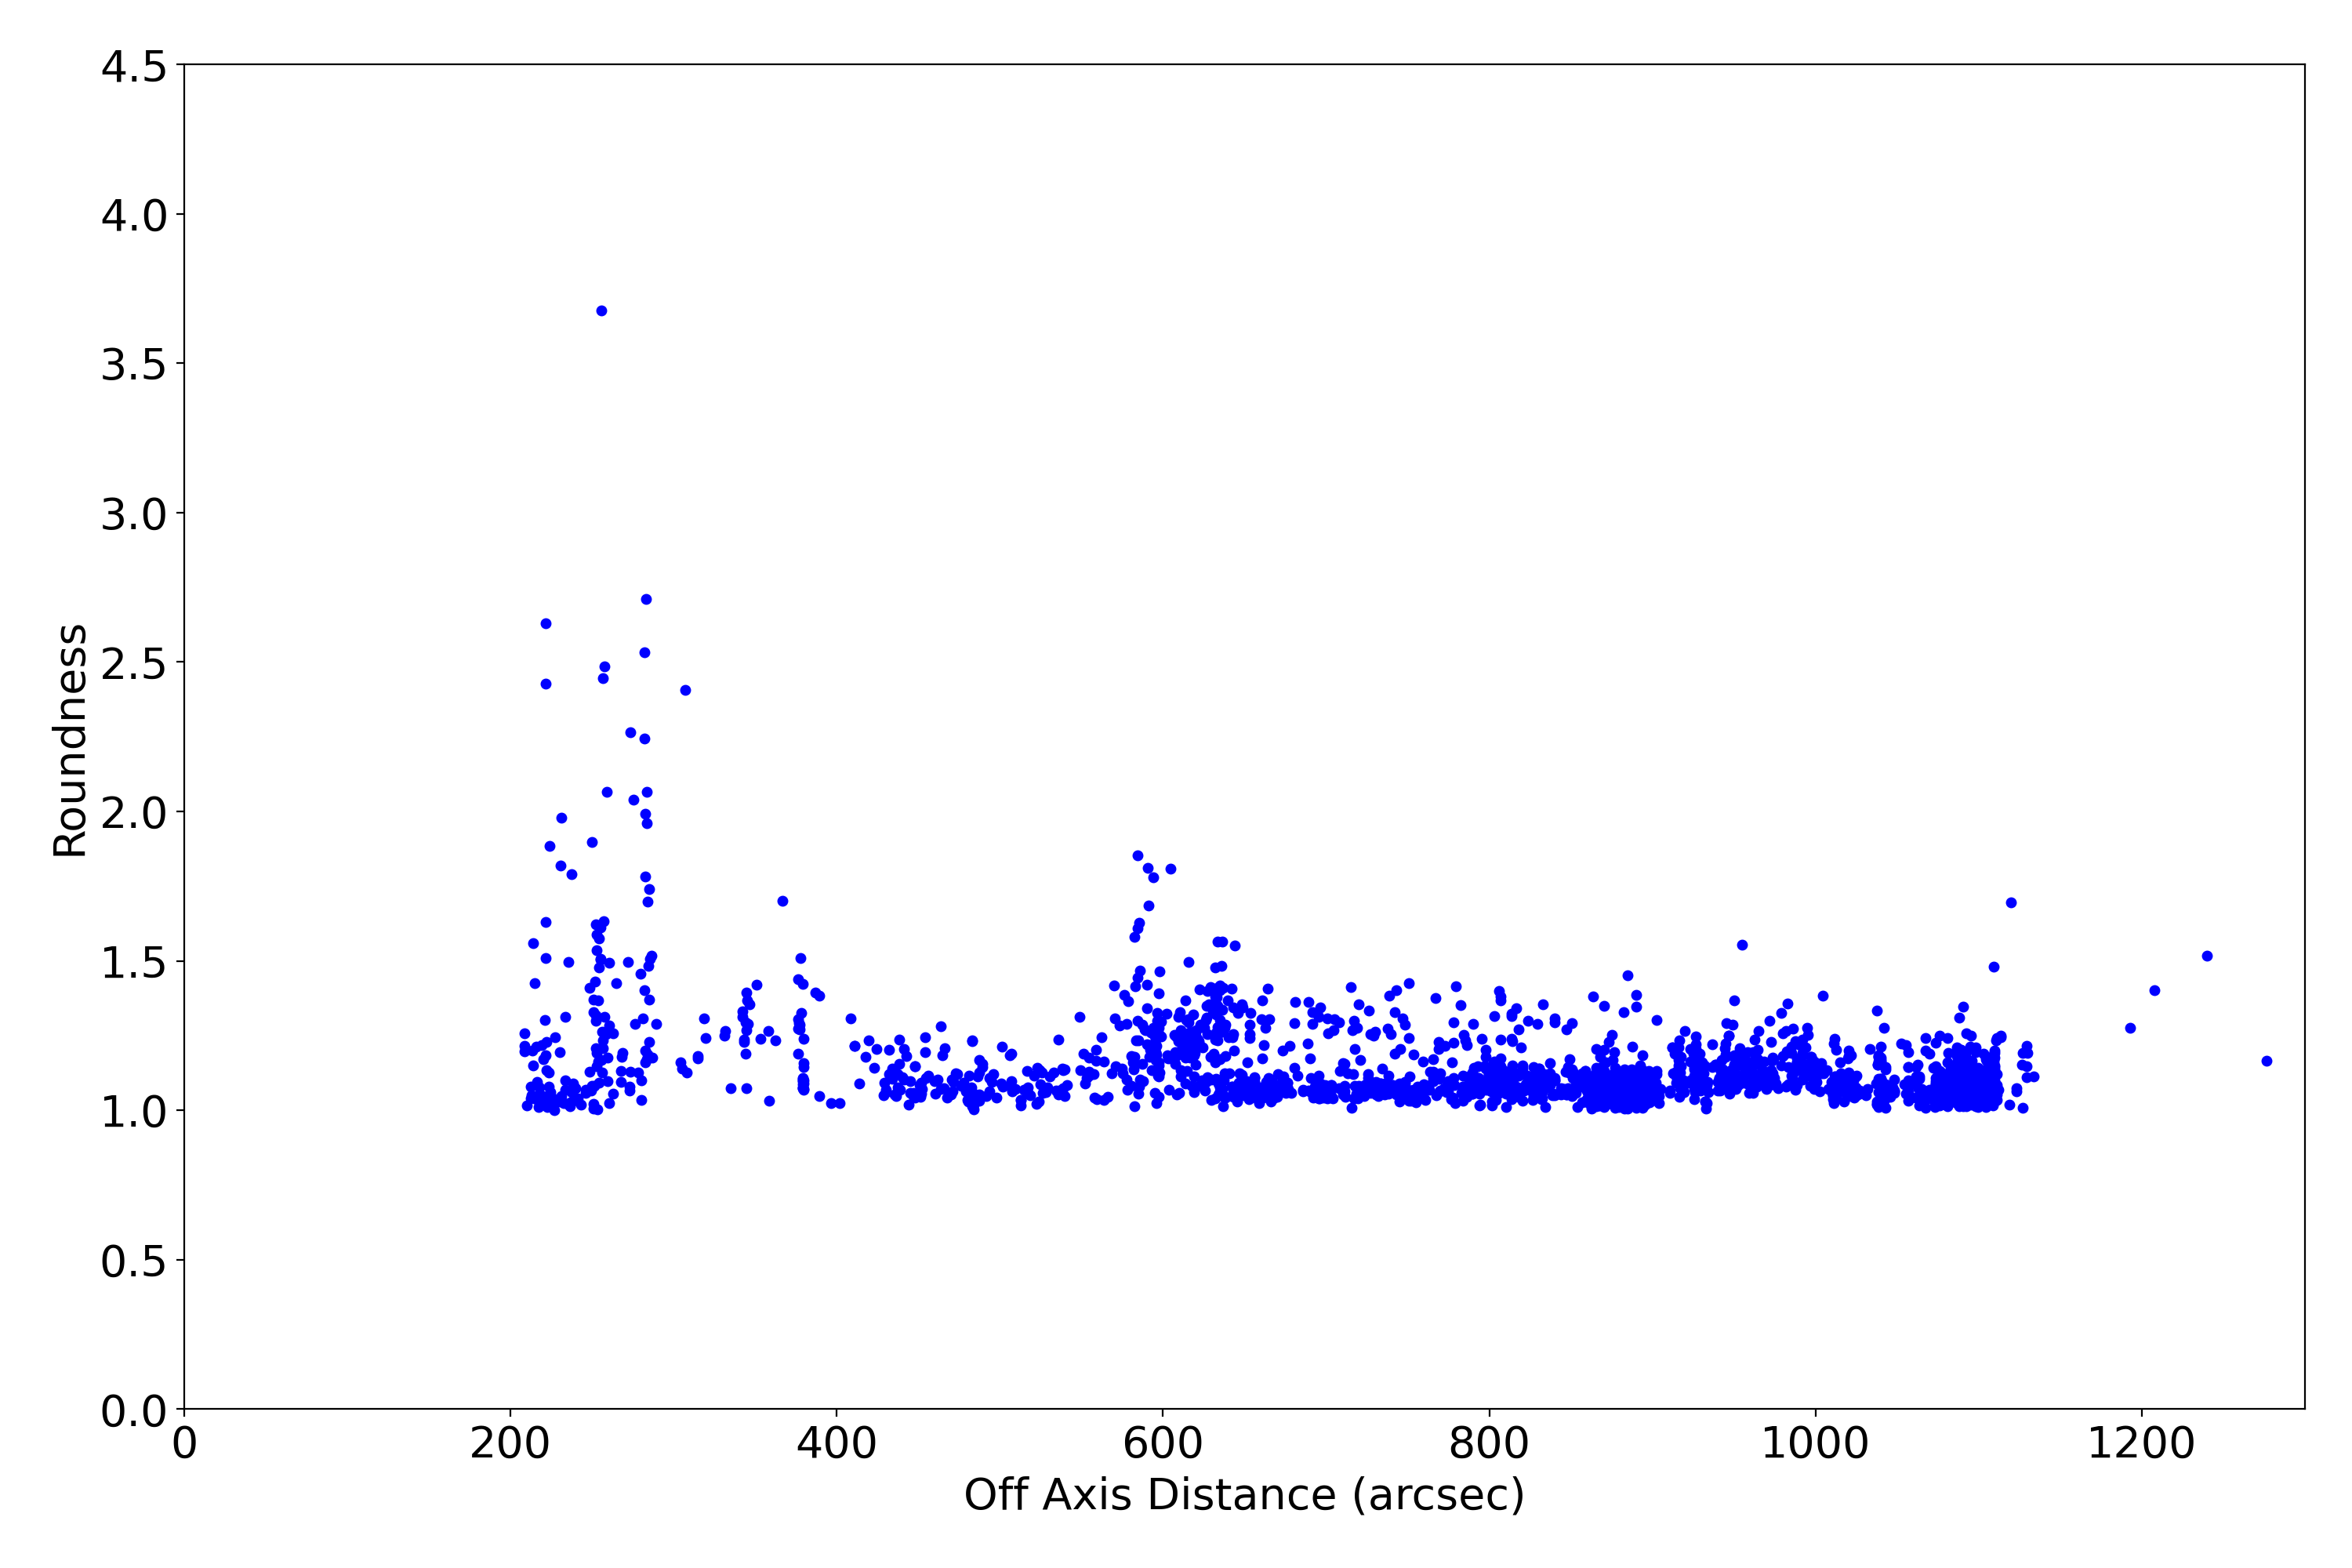
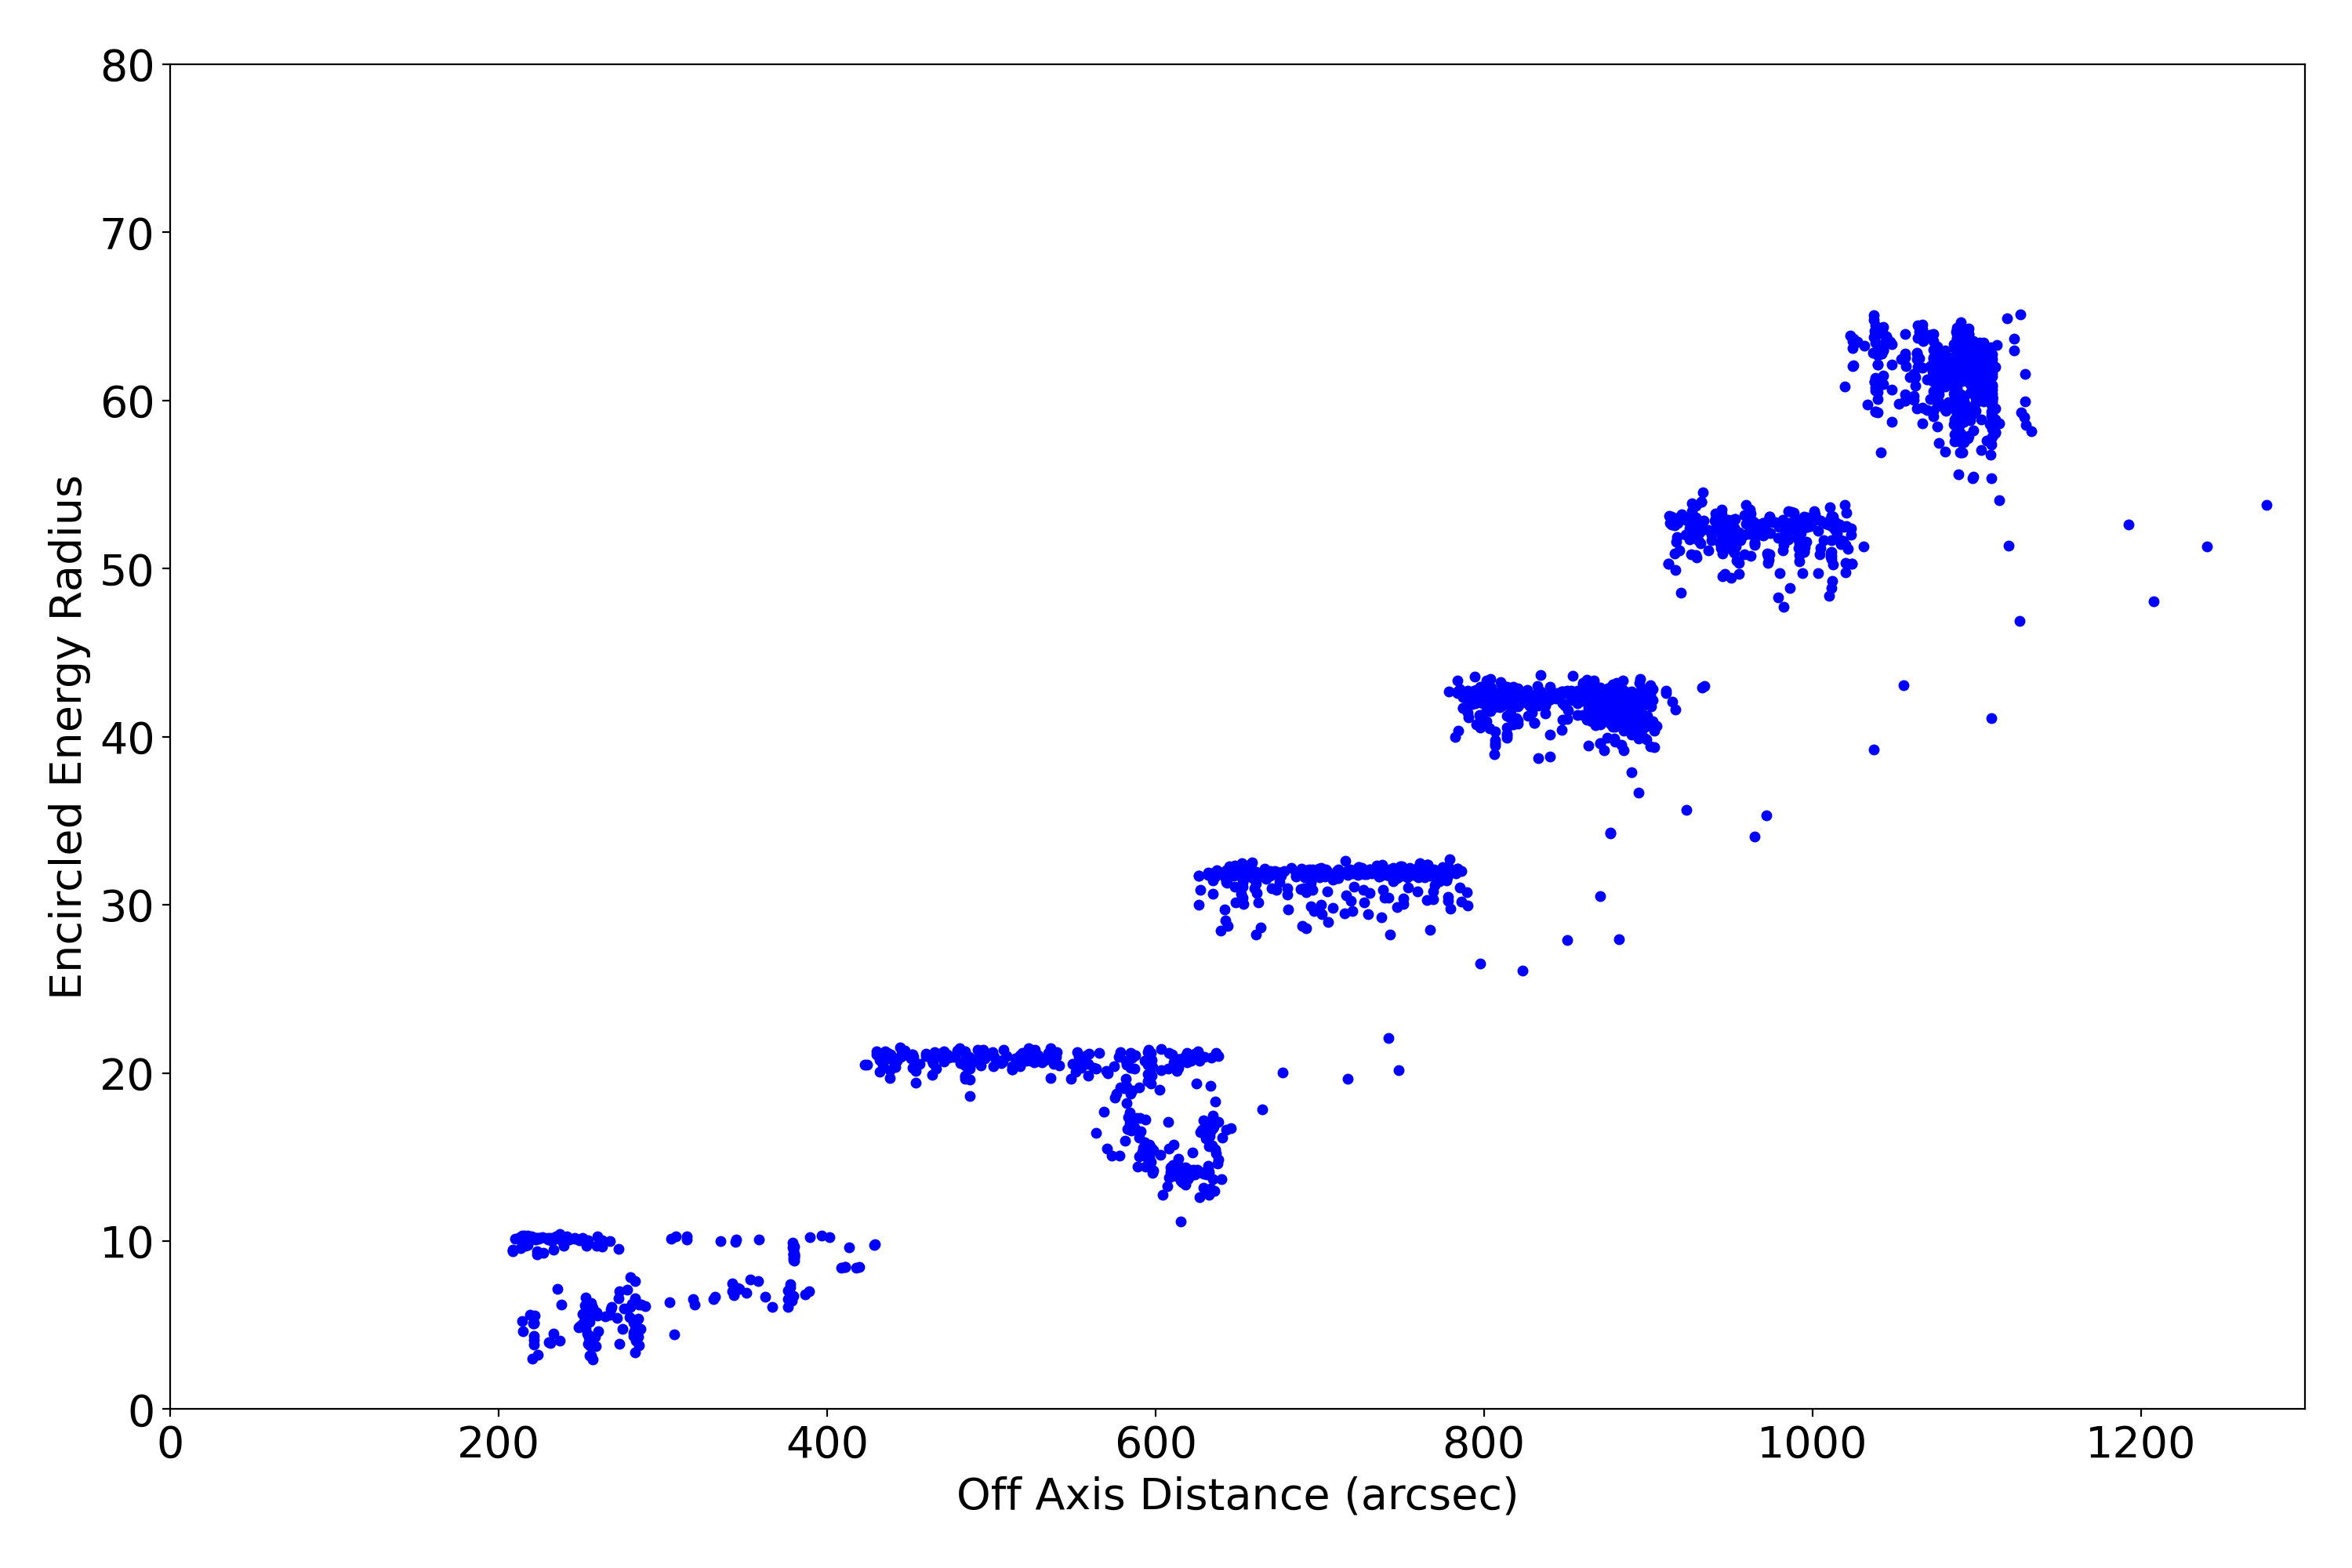
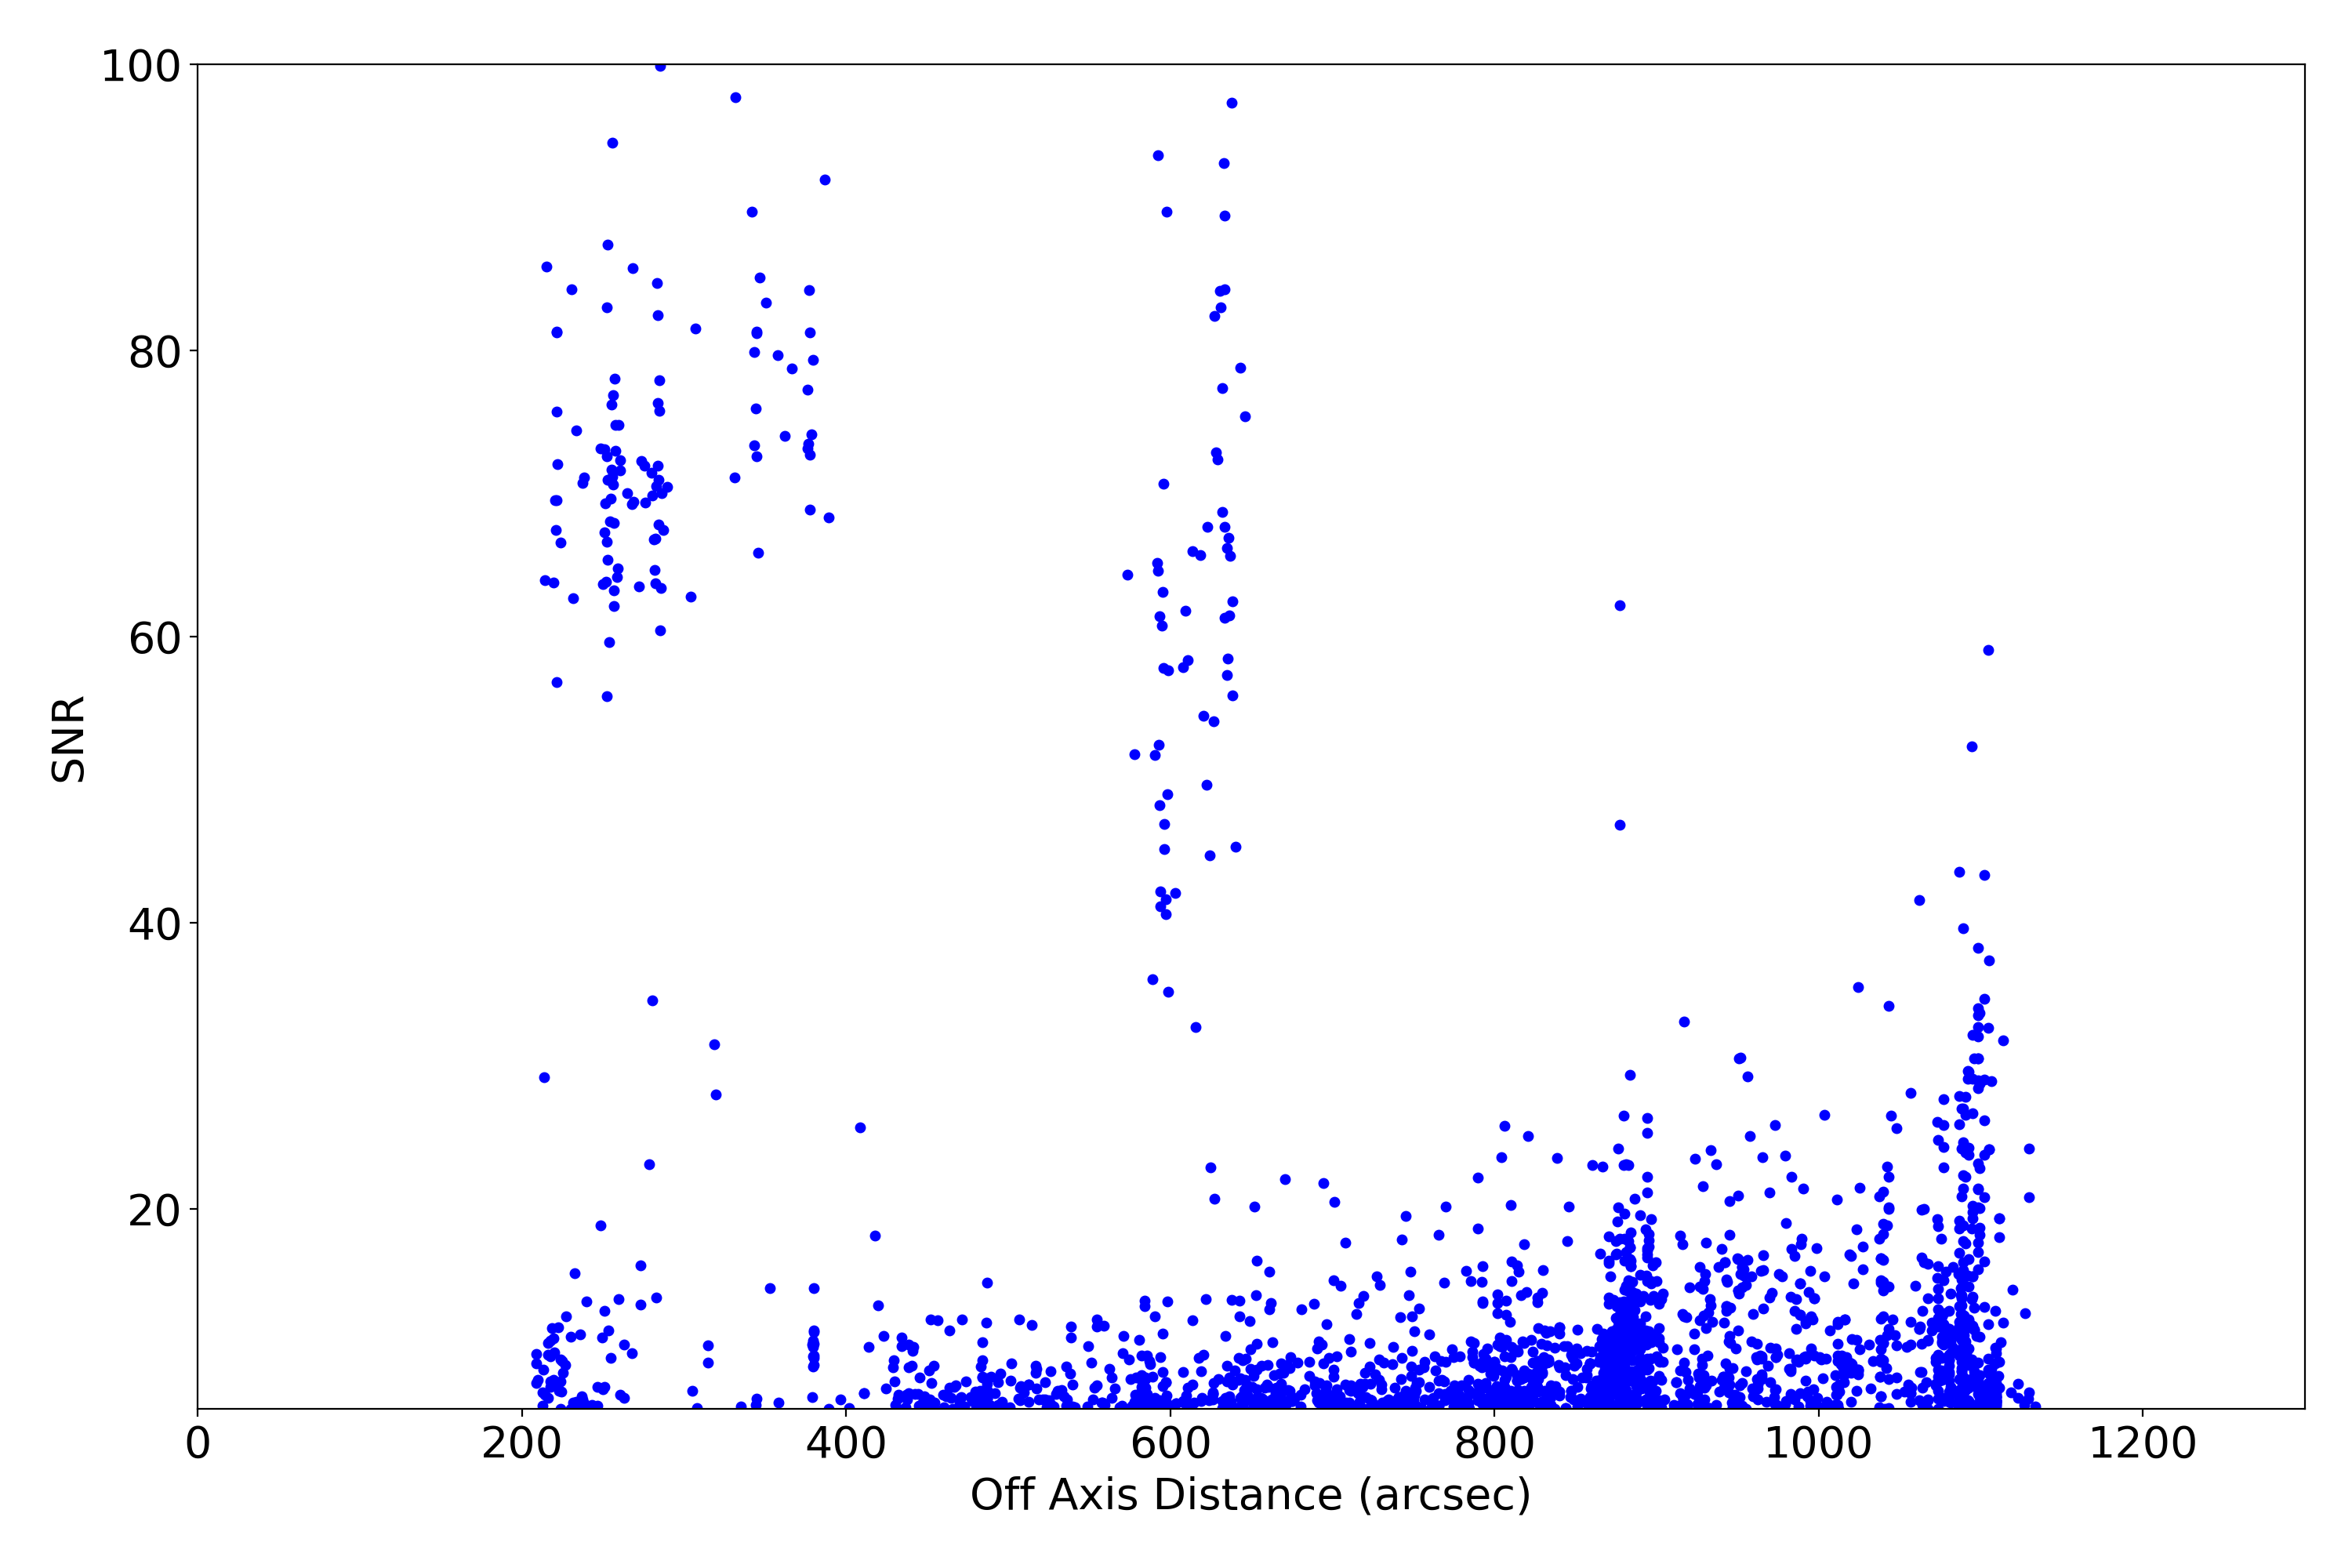
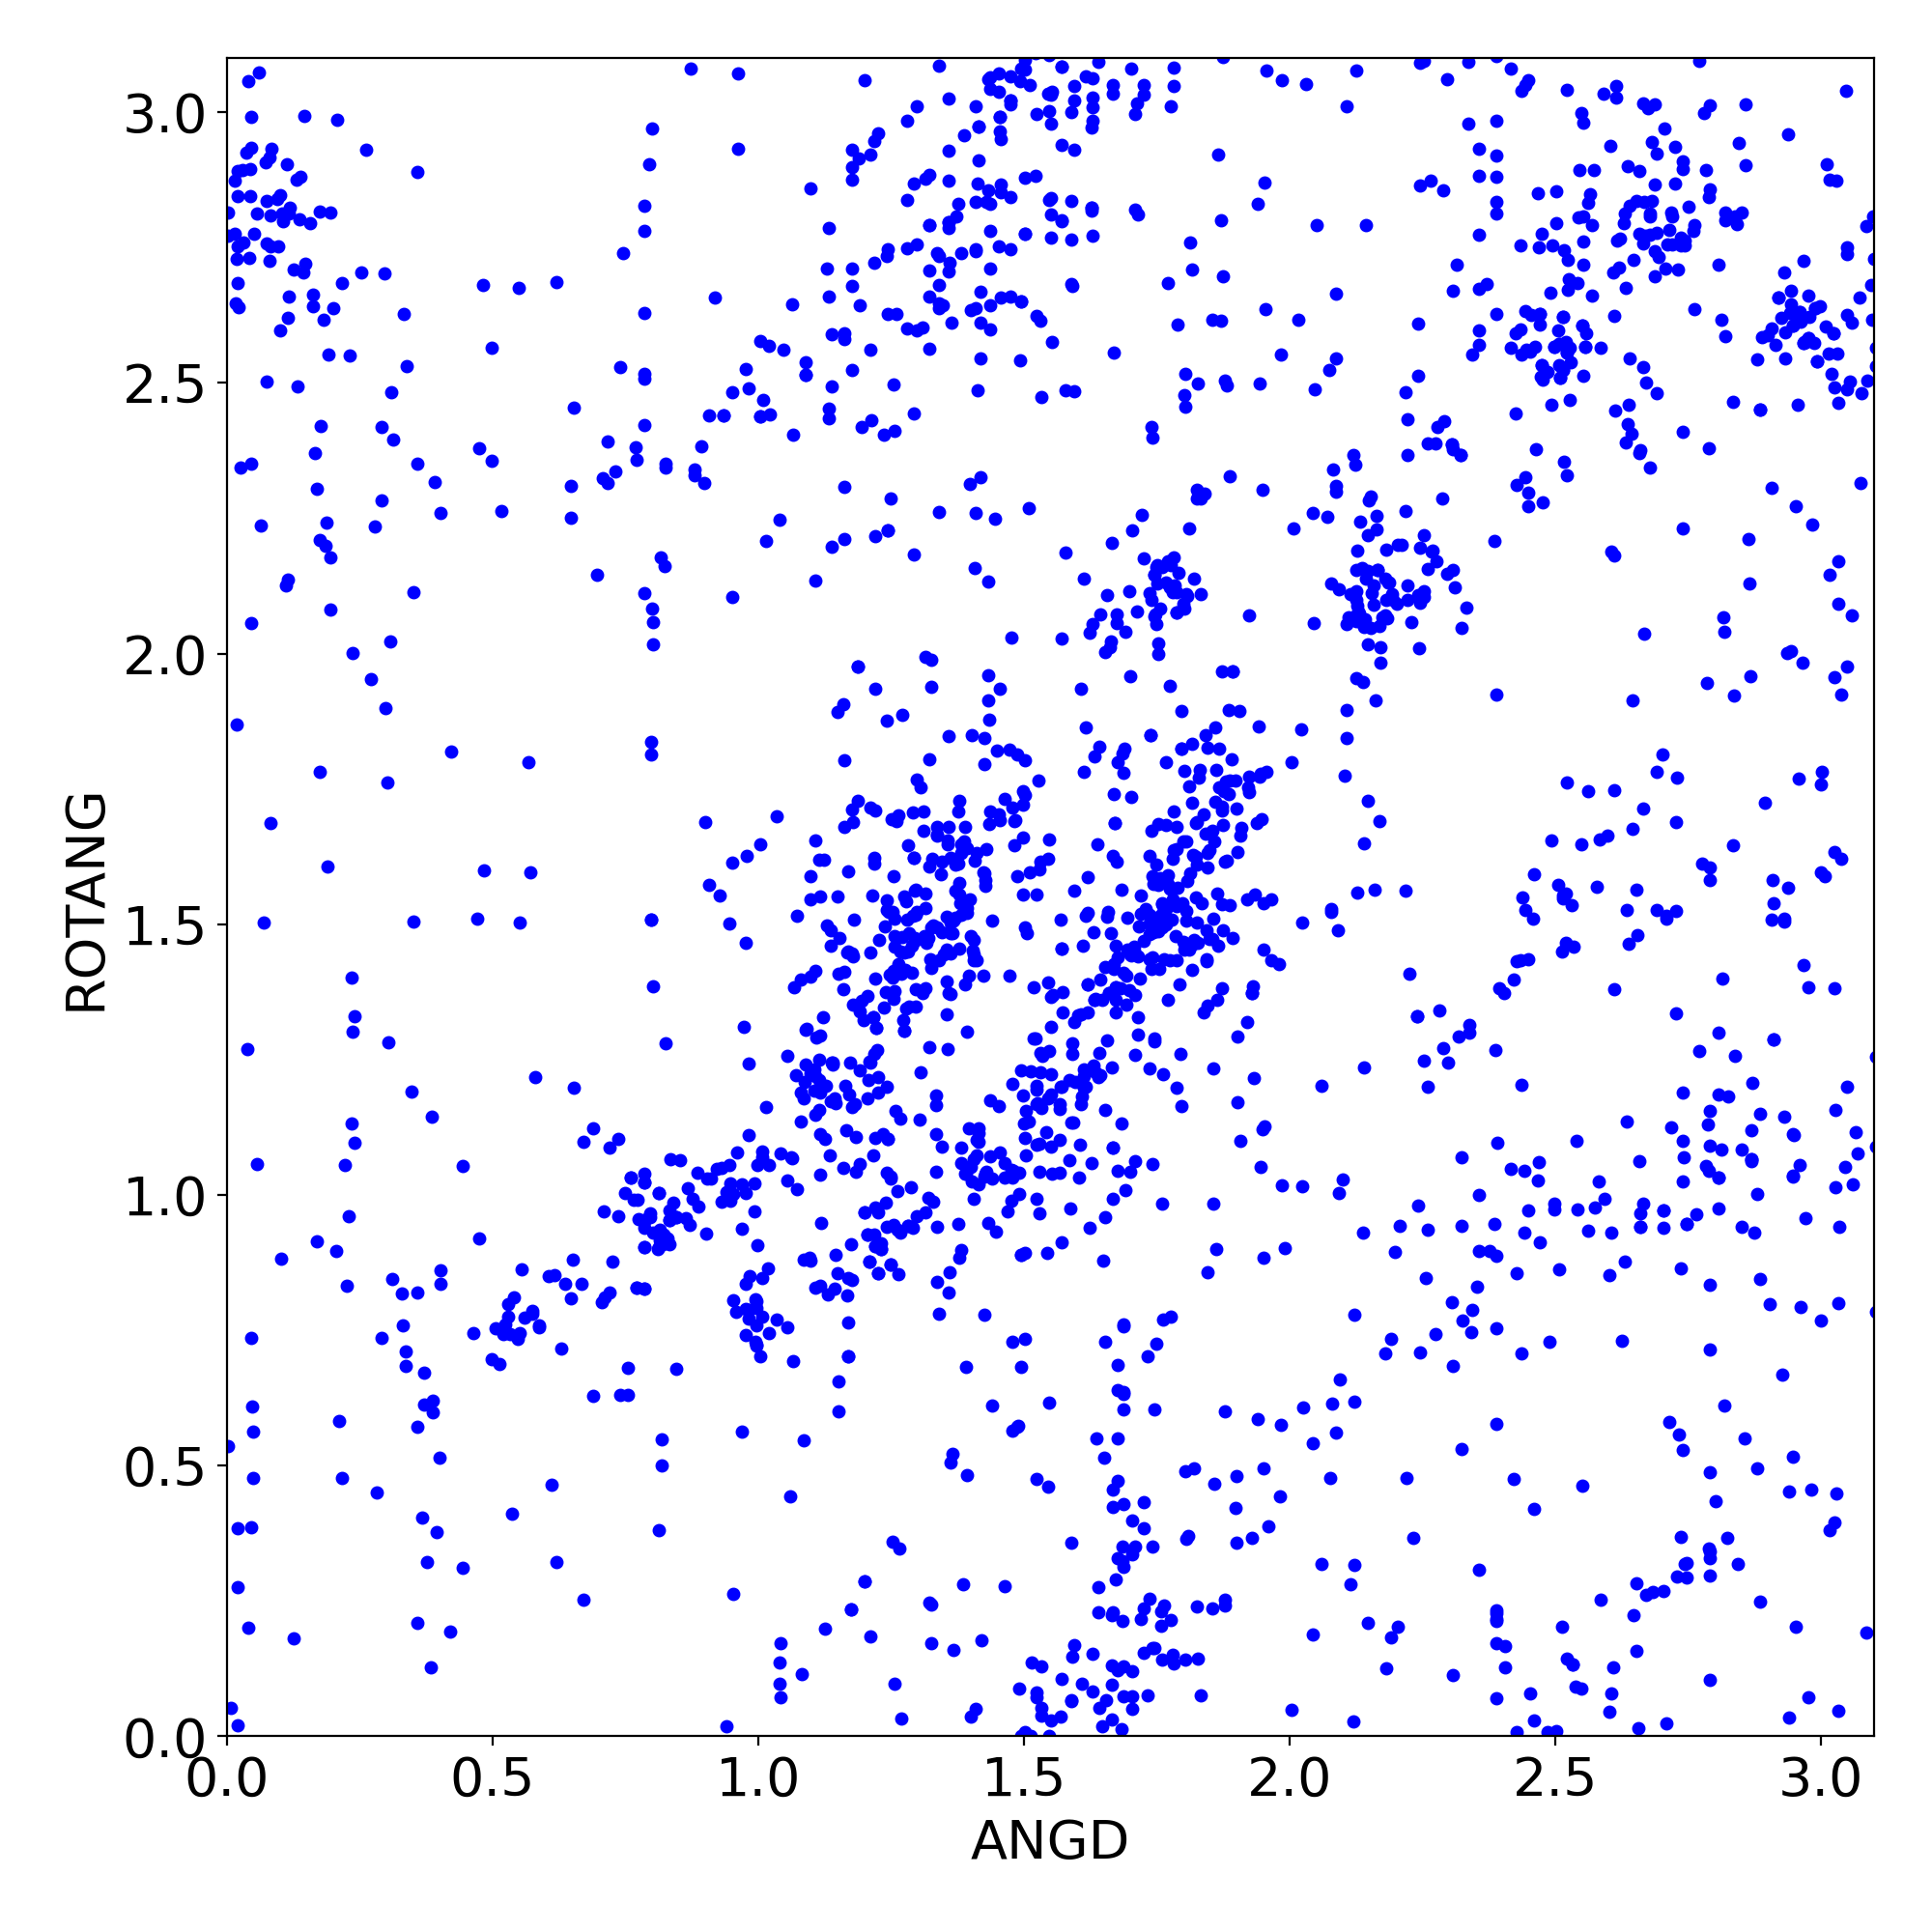
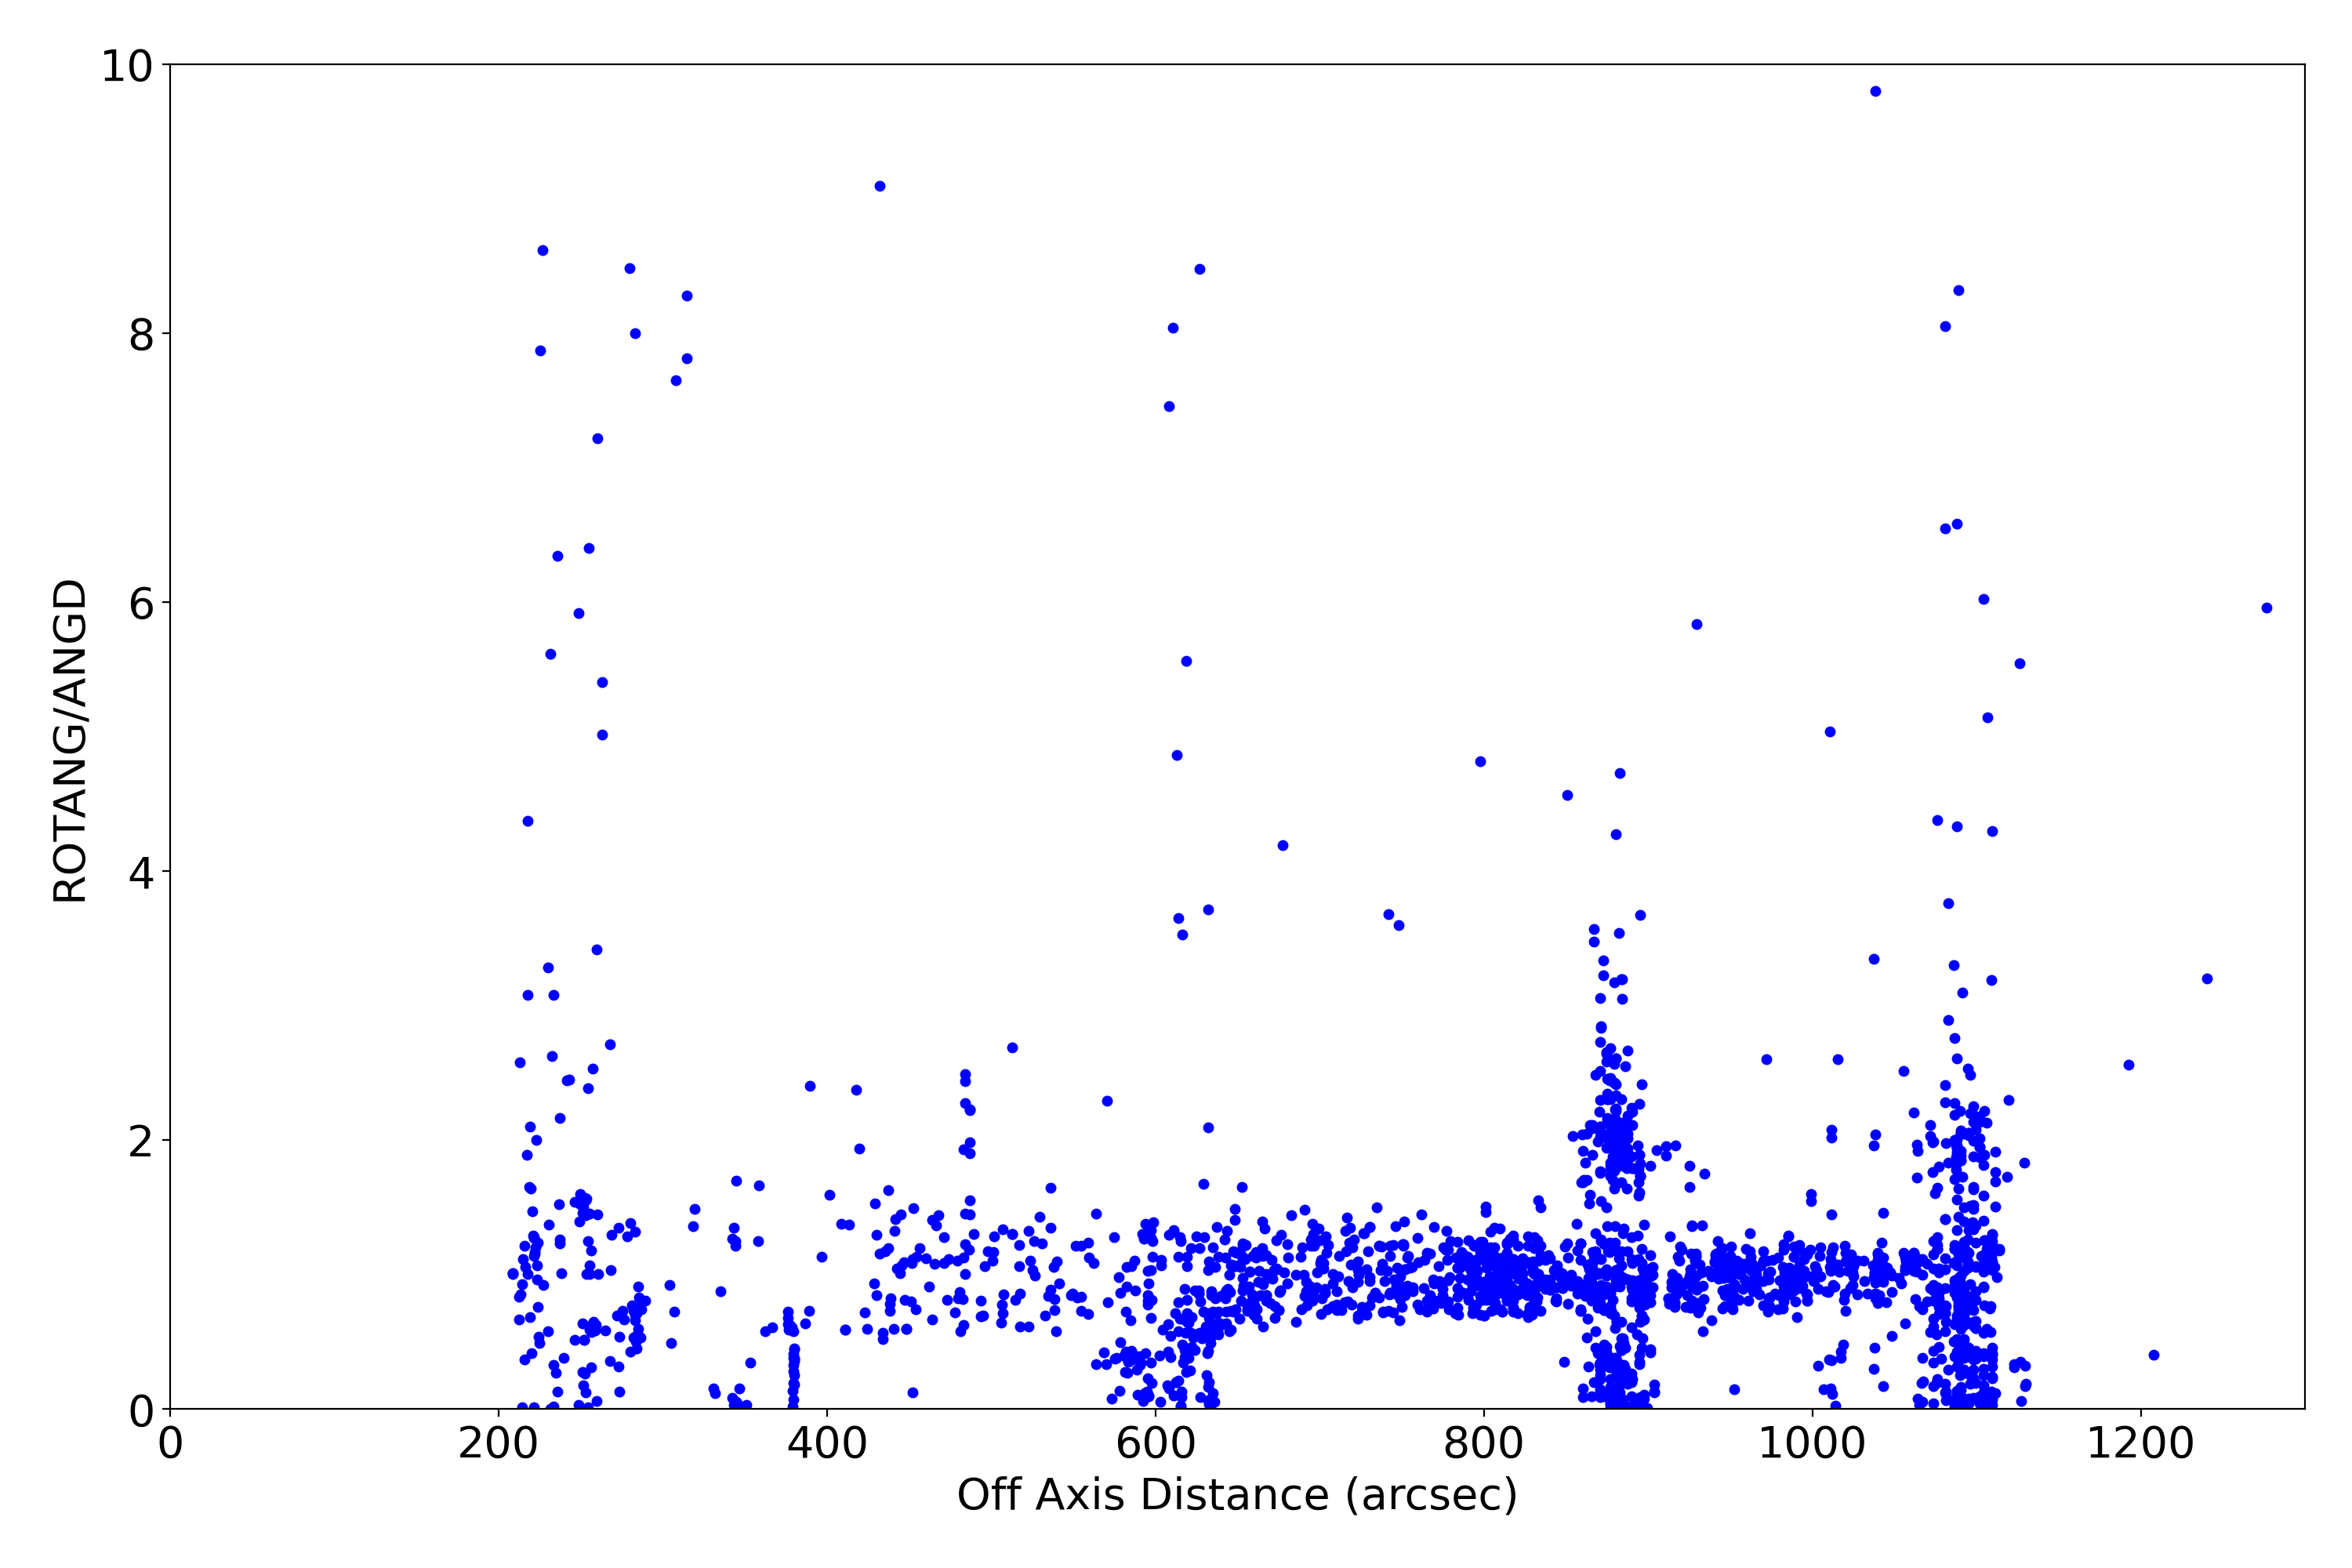
Plots below show various characteristics of detected imaging sources. Standard level 2 data products (*src2.fits) are used. Only observations with focus (sim_x) within 0.01 mm of nominal value for given SI configuration are used. Sources are also filtered for strength (SNR > 15).
| XY | PSF | Roundness | EE Radius | SNR | Rotation | Rotation2 | |
|---|---|---|---|---|---|---|---|
| ACIS I |  |
 |
 |
 |
 |
 |
 |
| ACIS S | 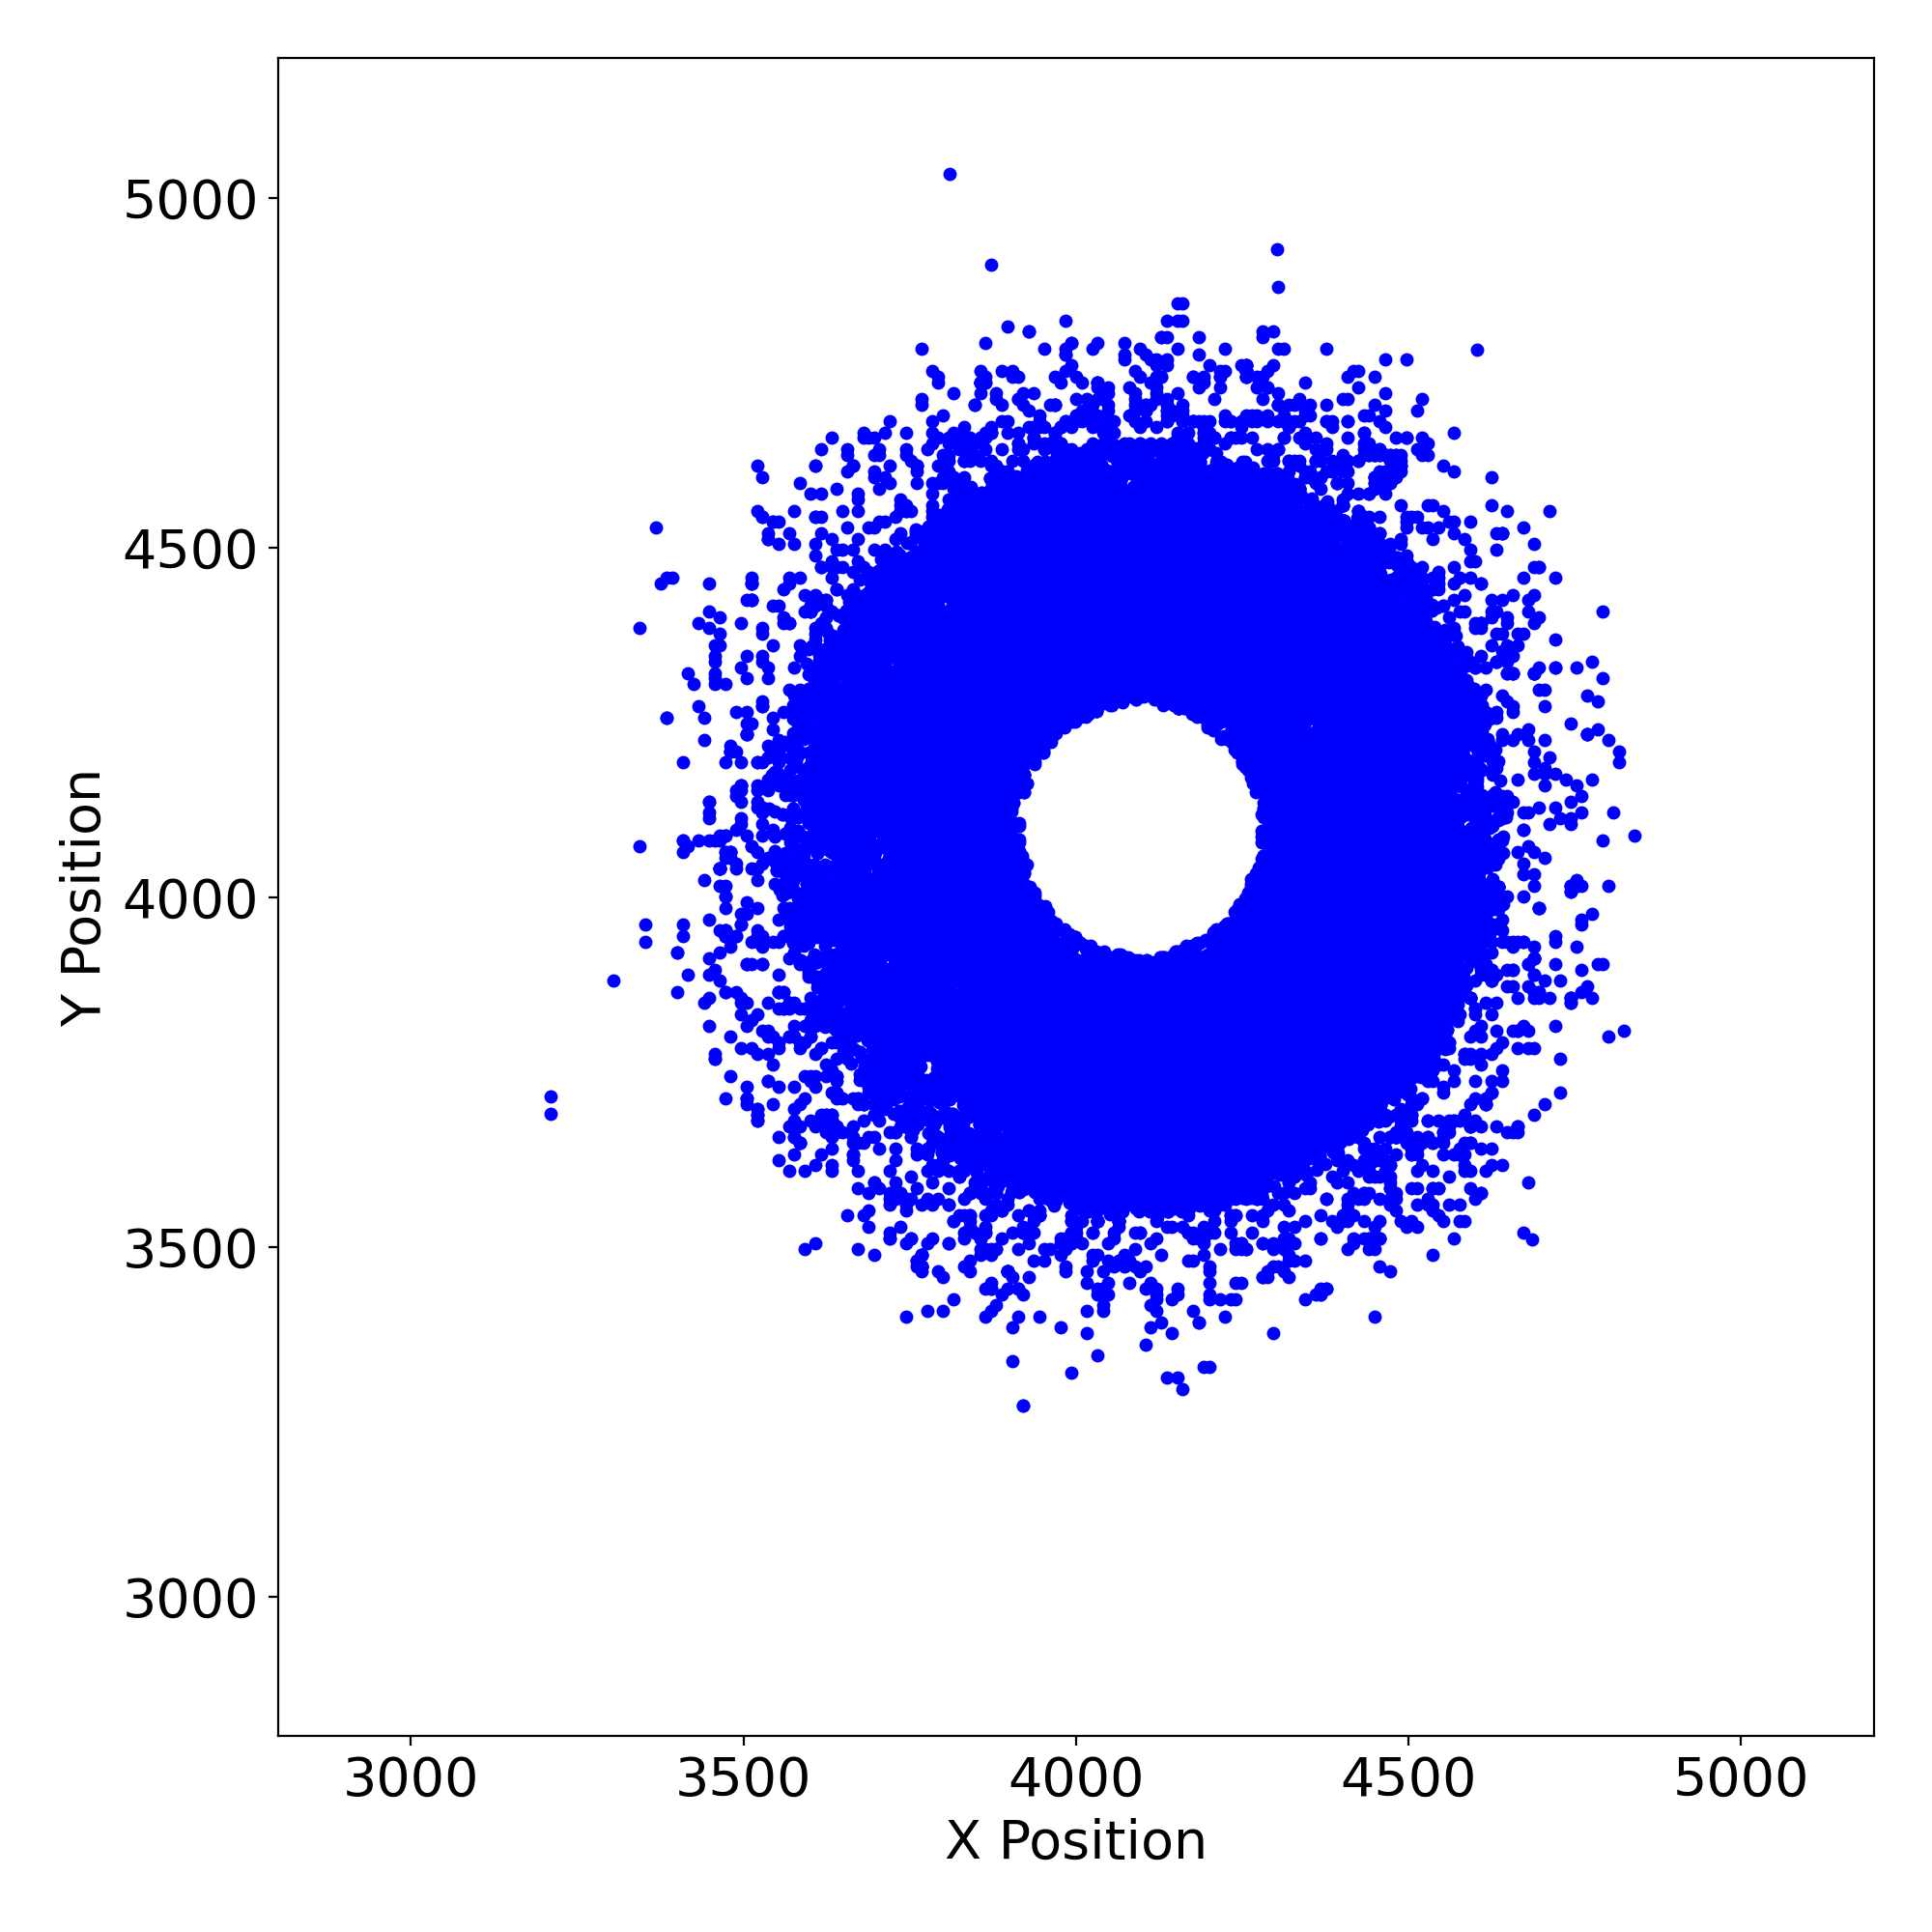 |
 |
 |
 |
 |
 |
 |
| HRC I | 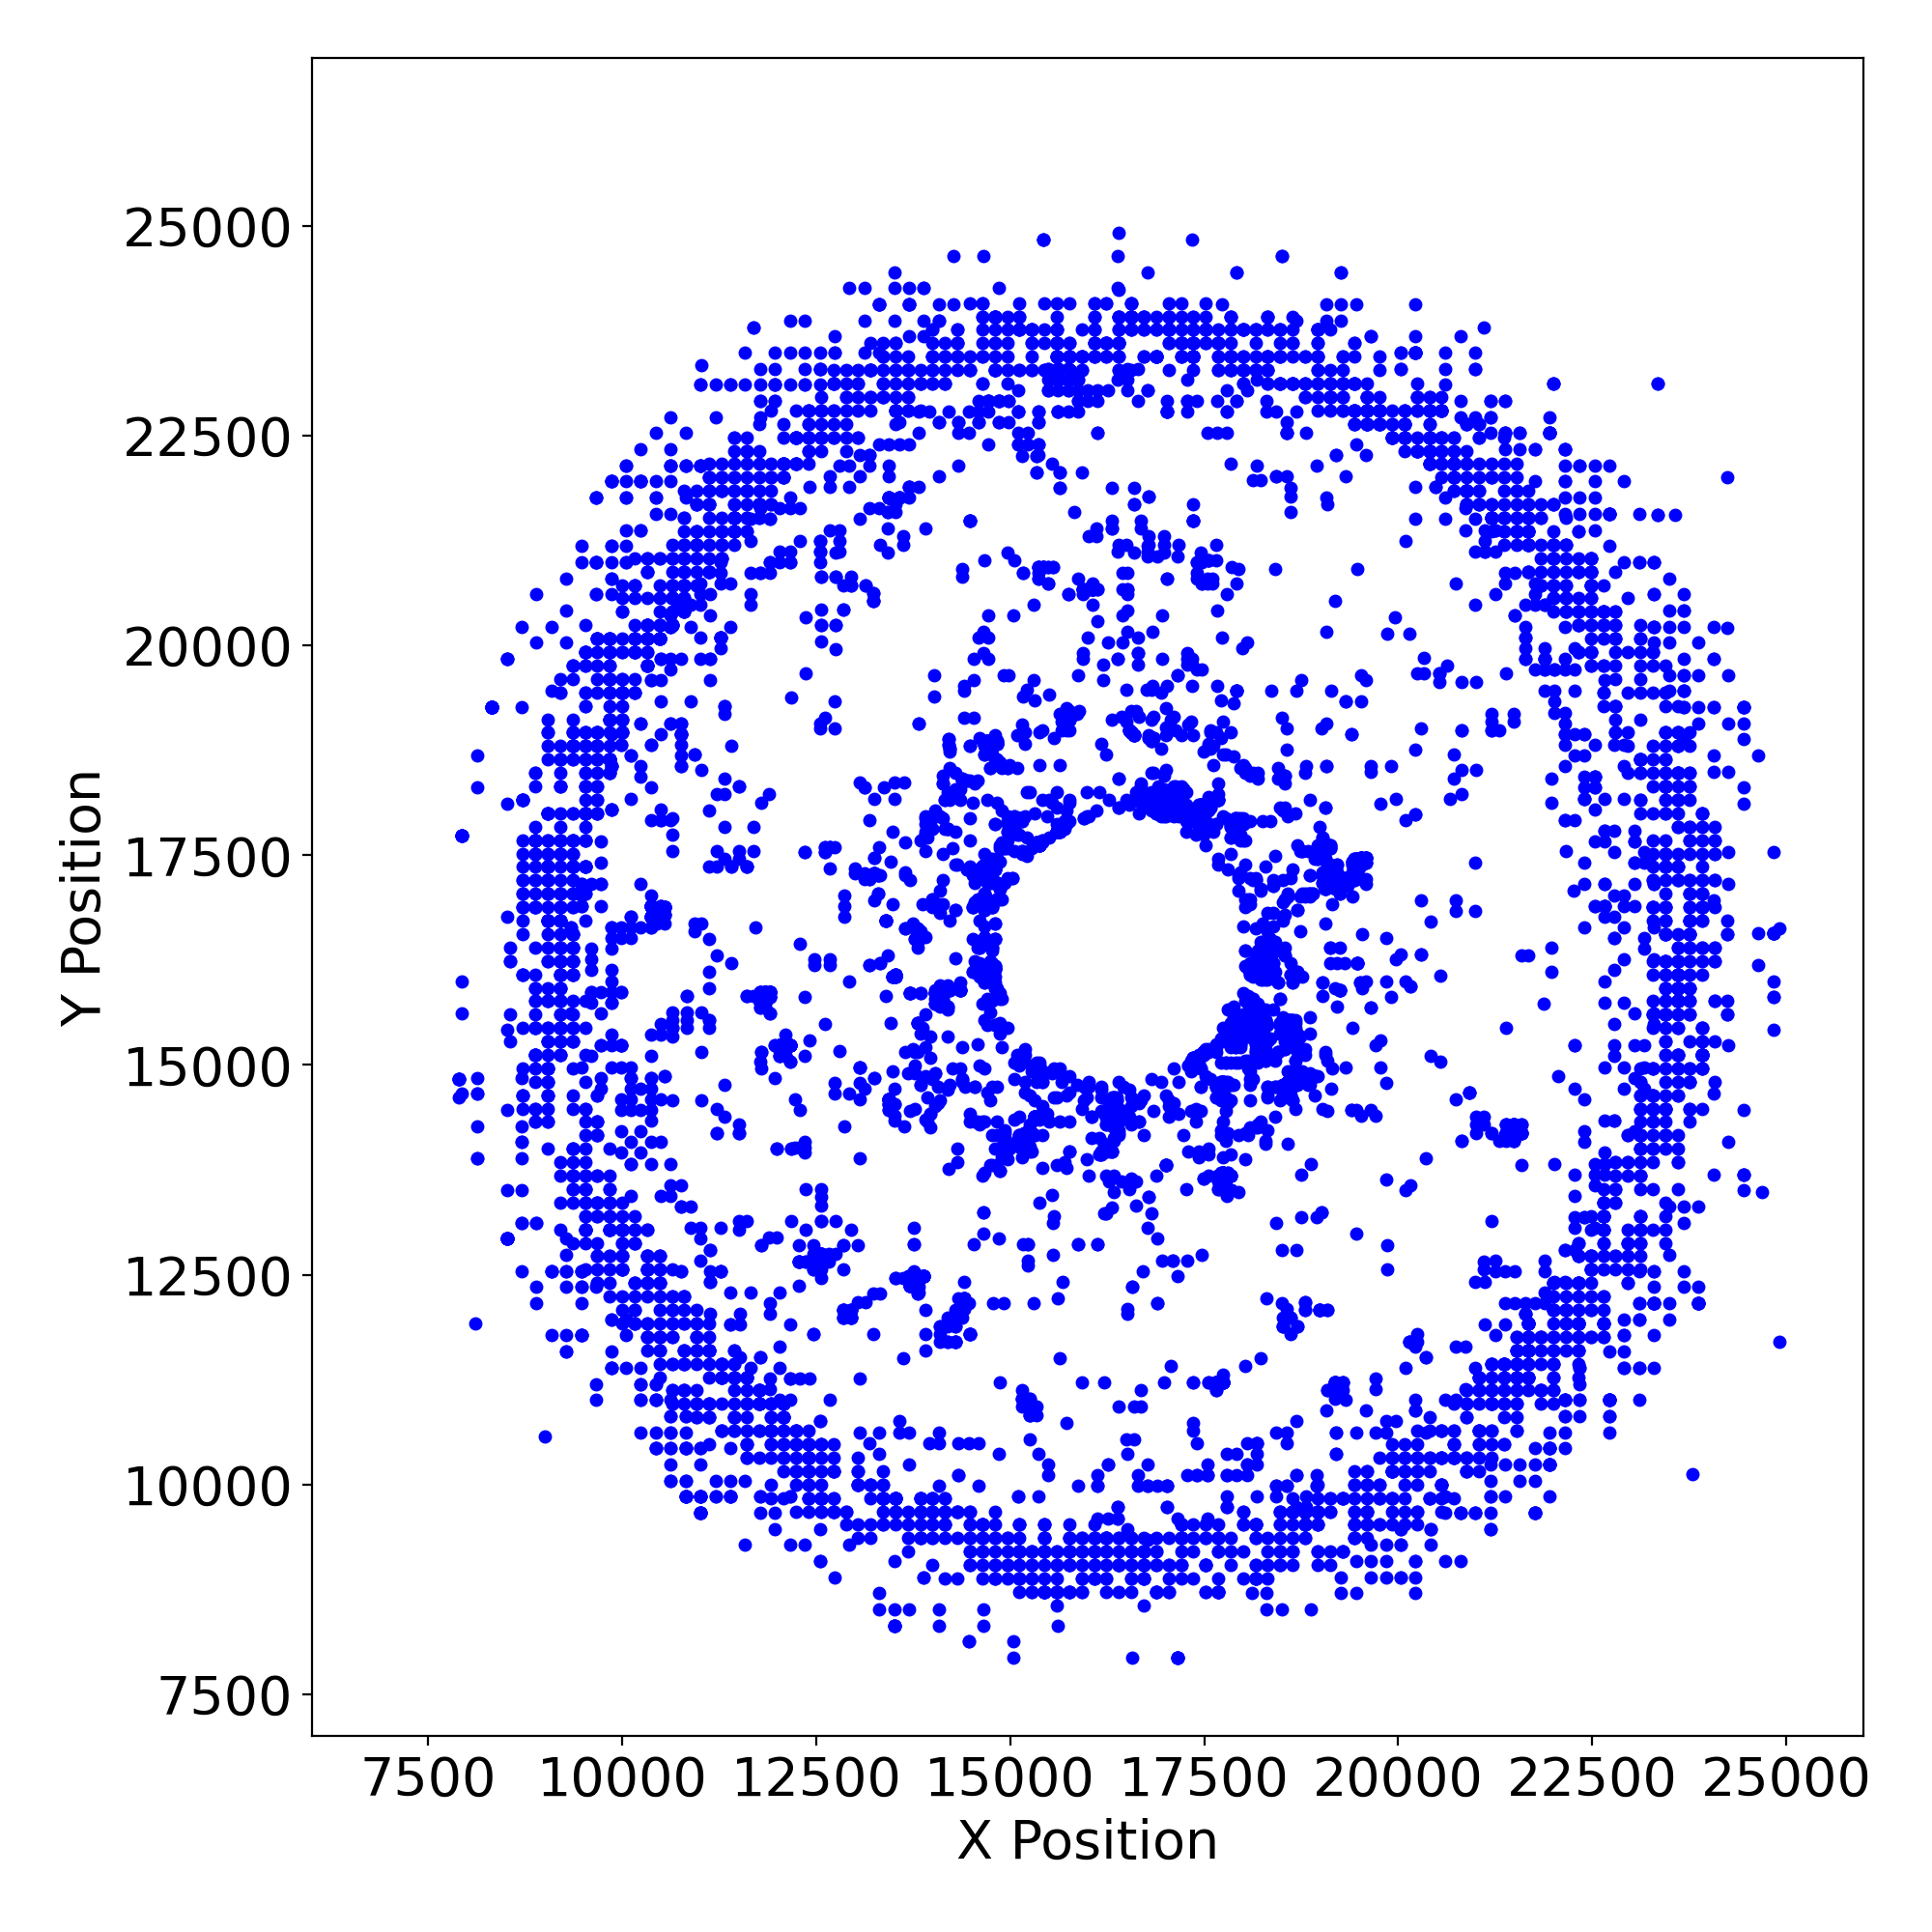 |
 |
 |
 |
 |
 |
 |
| HRC S | 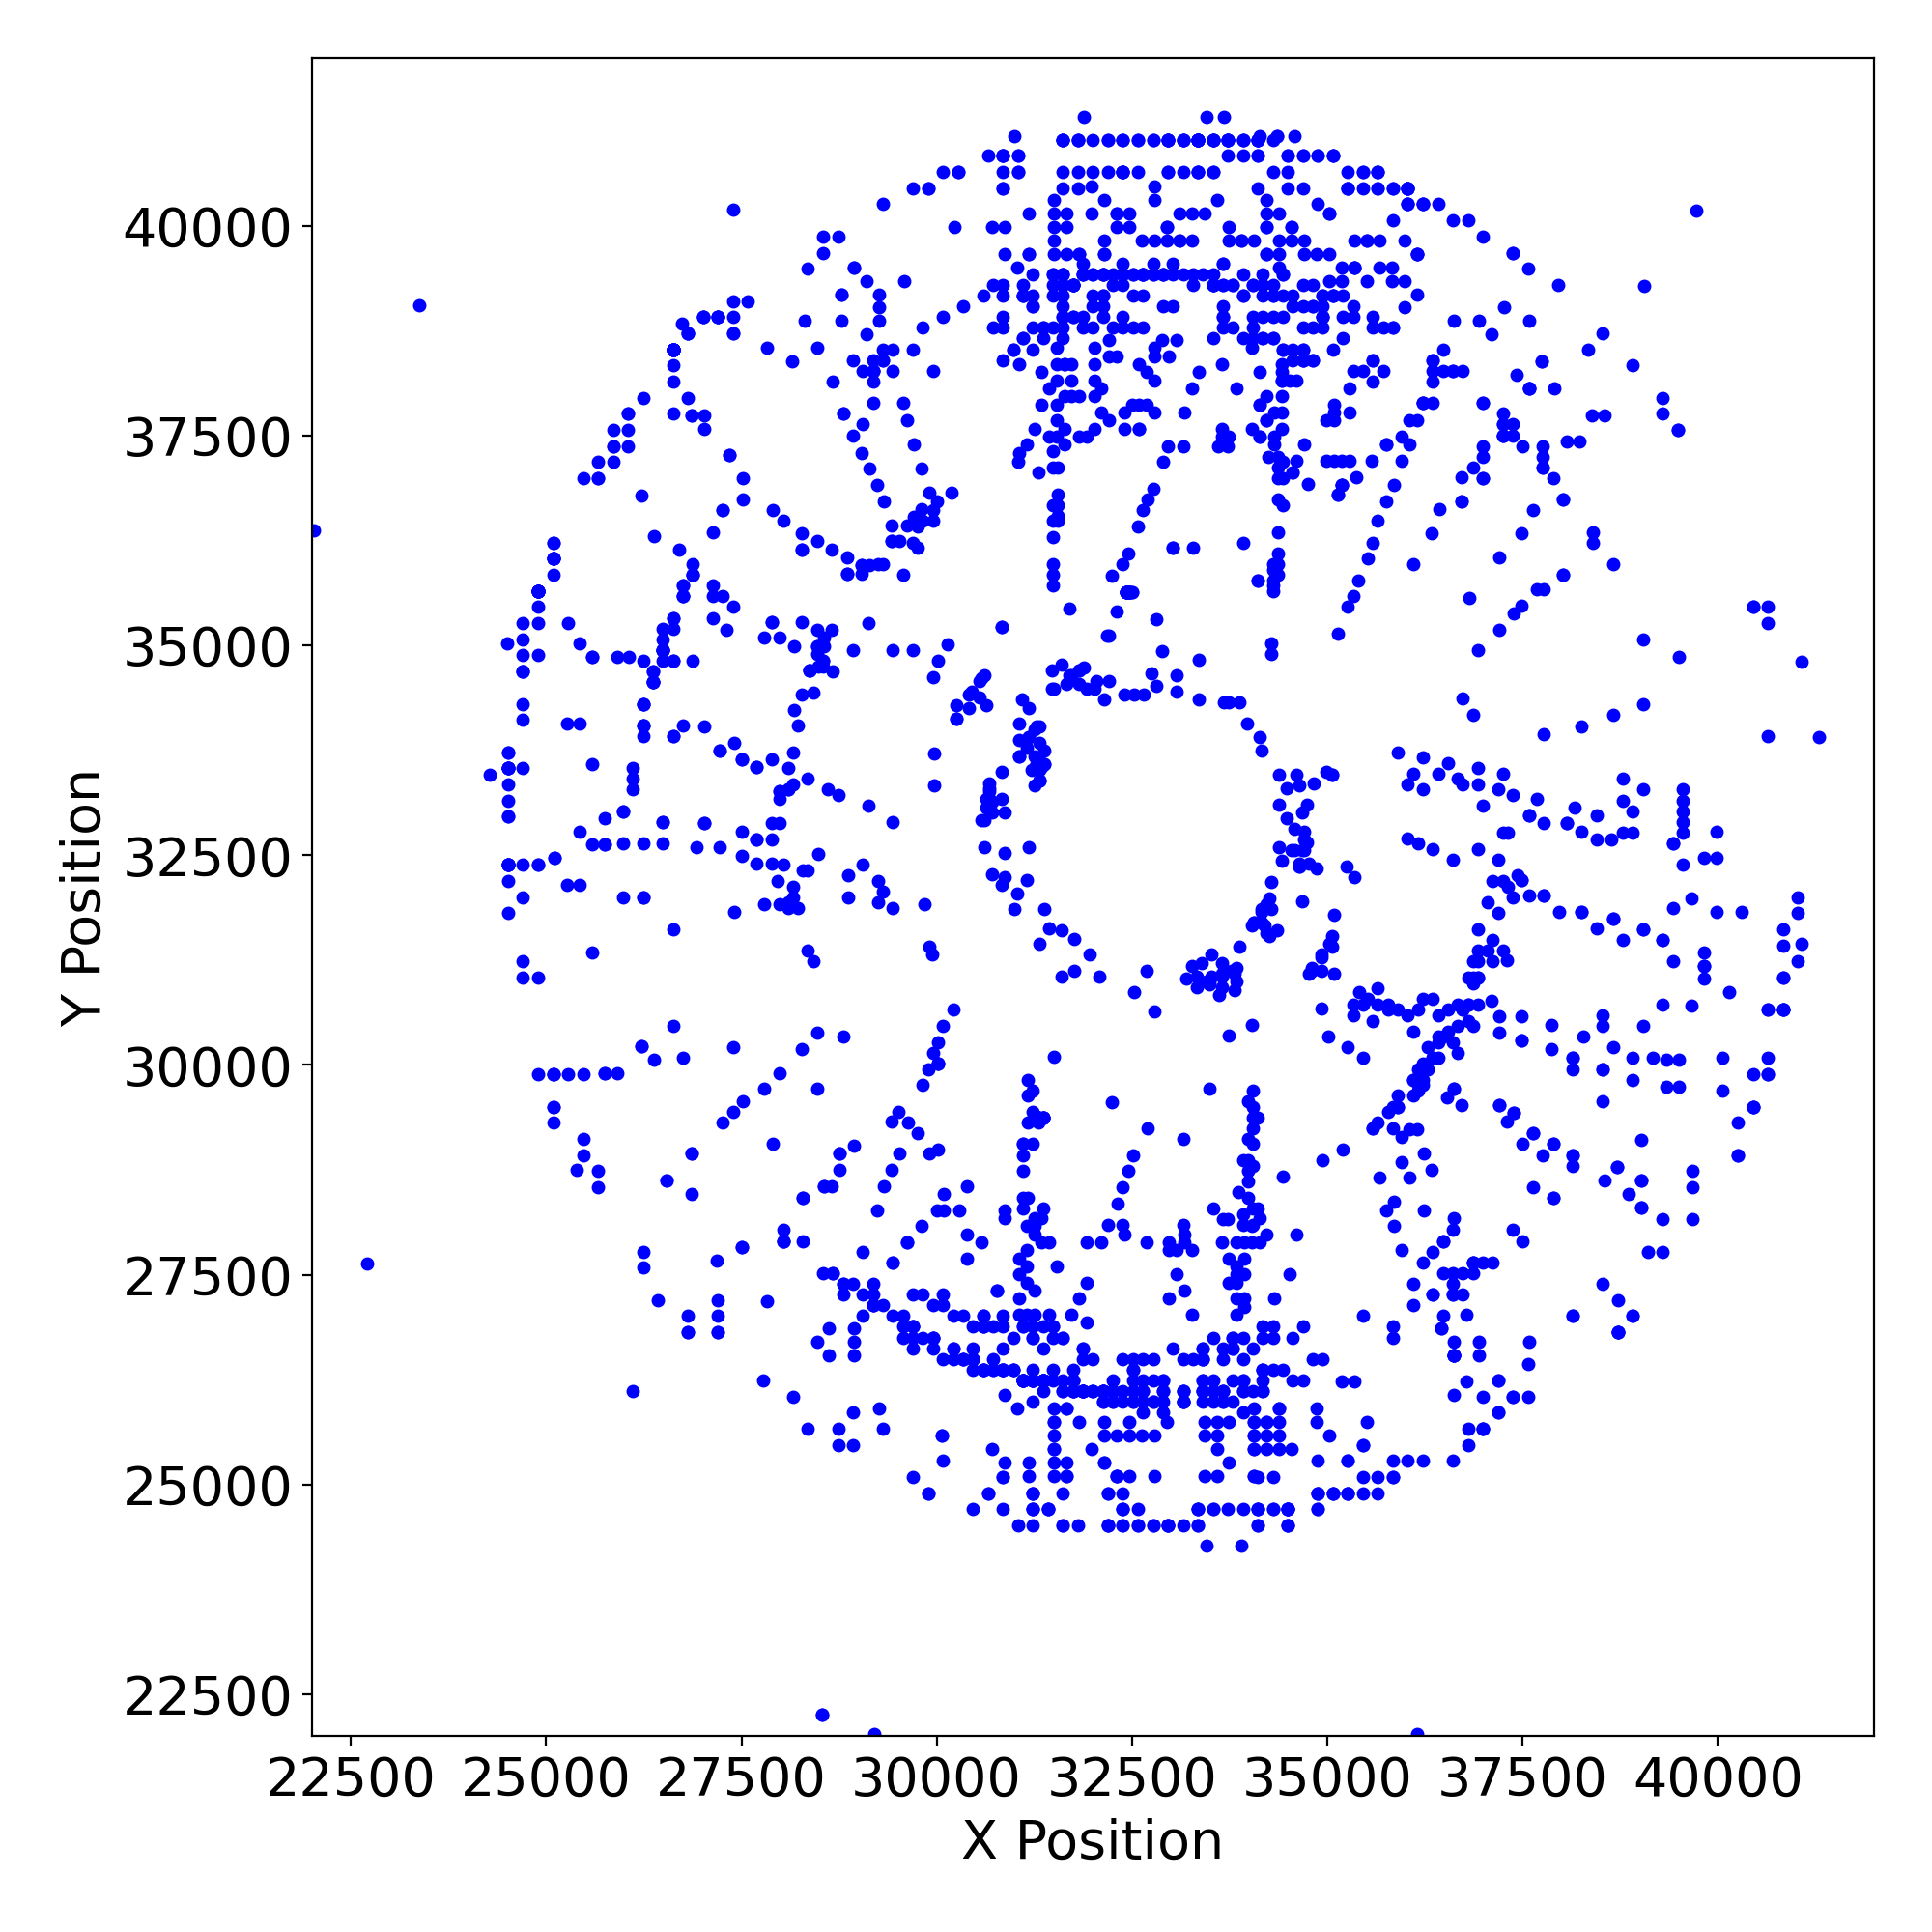 |
 |
 |
 |
 |
 |
 |
Gratings
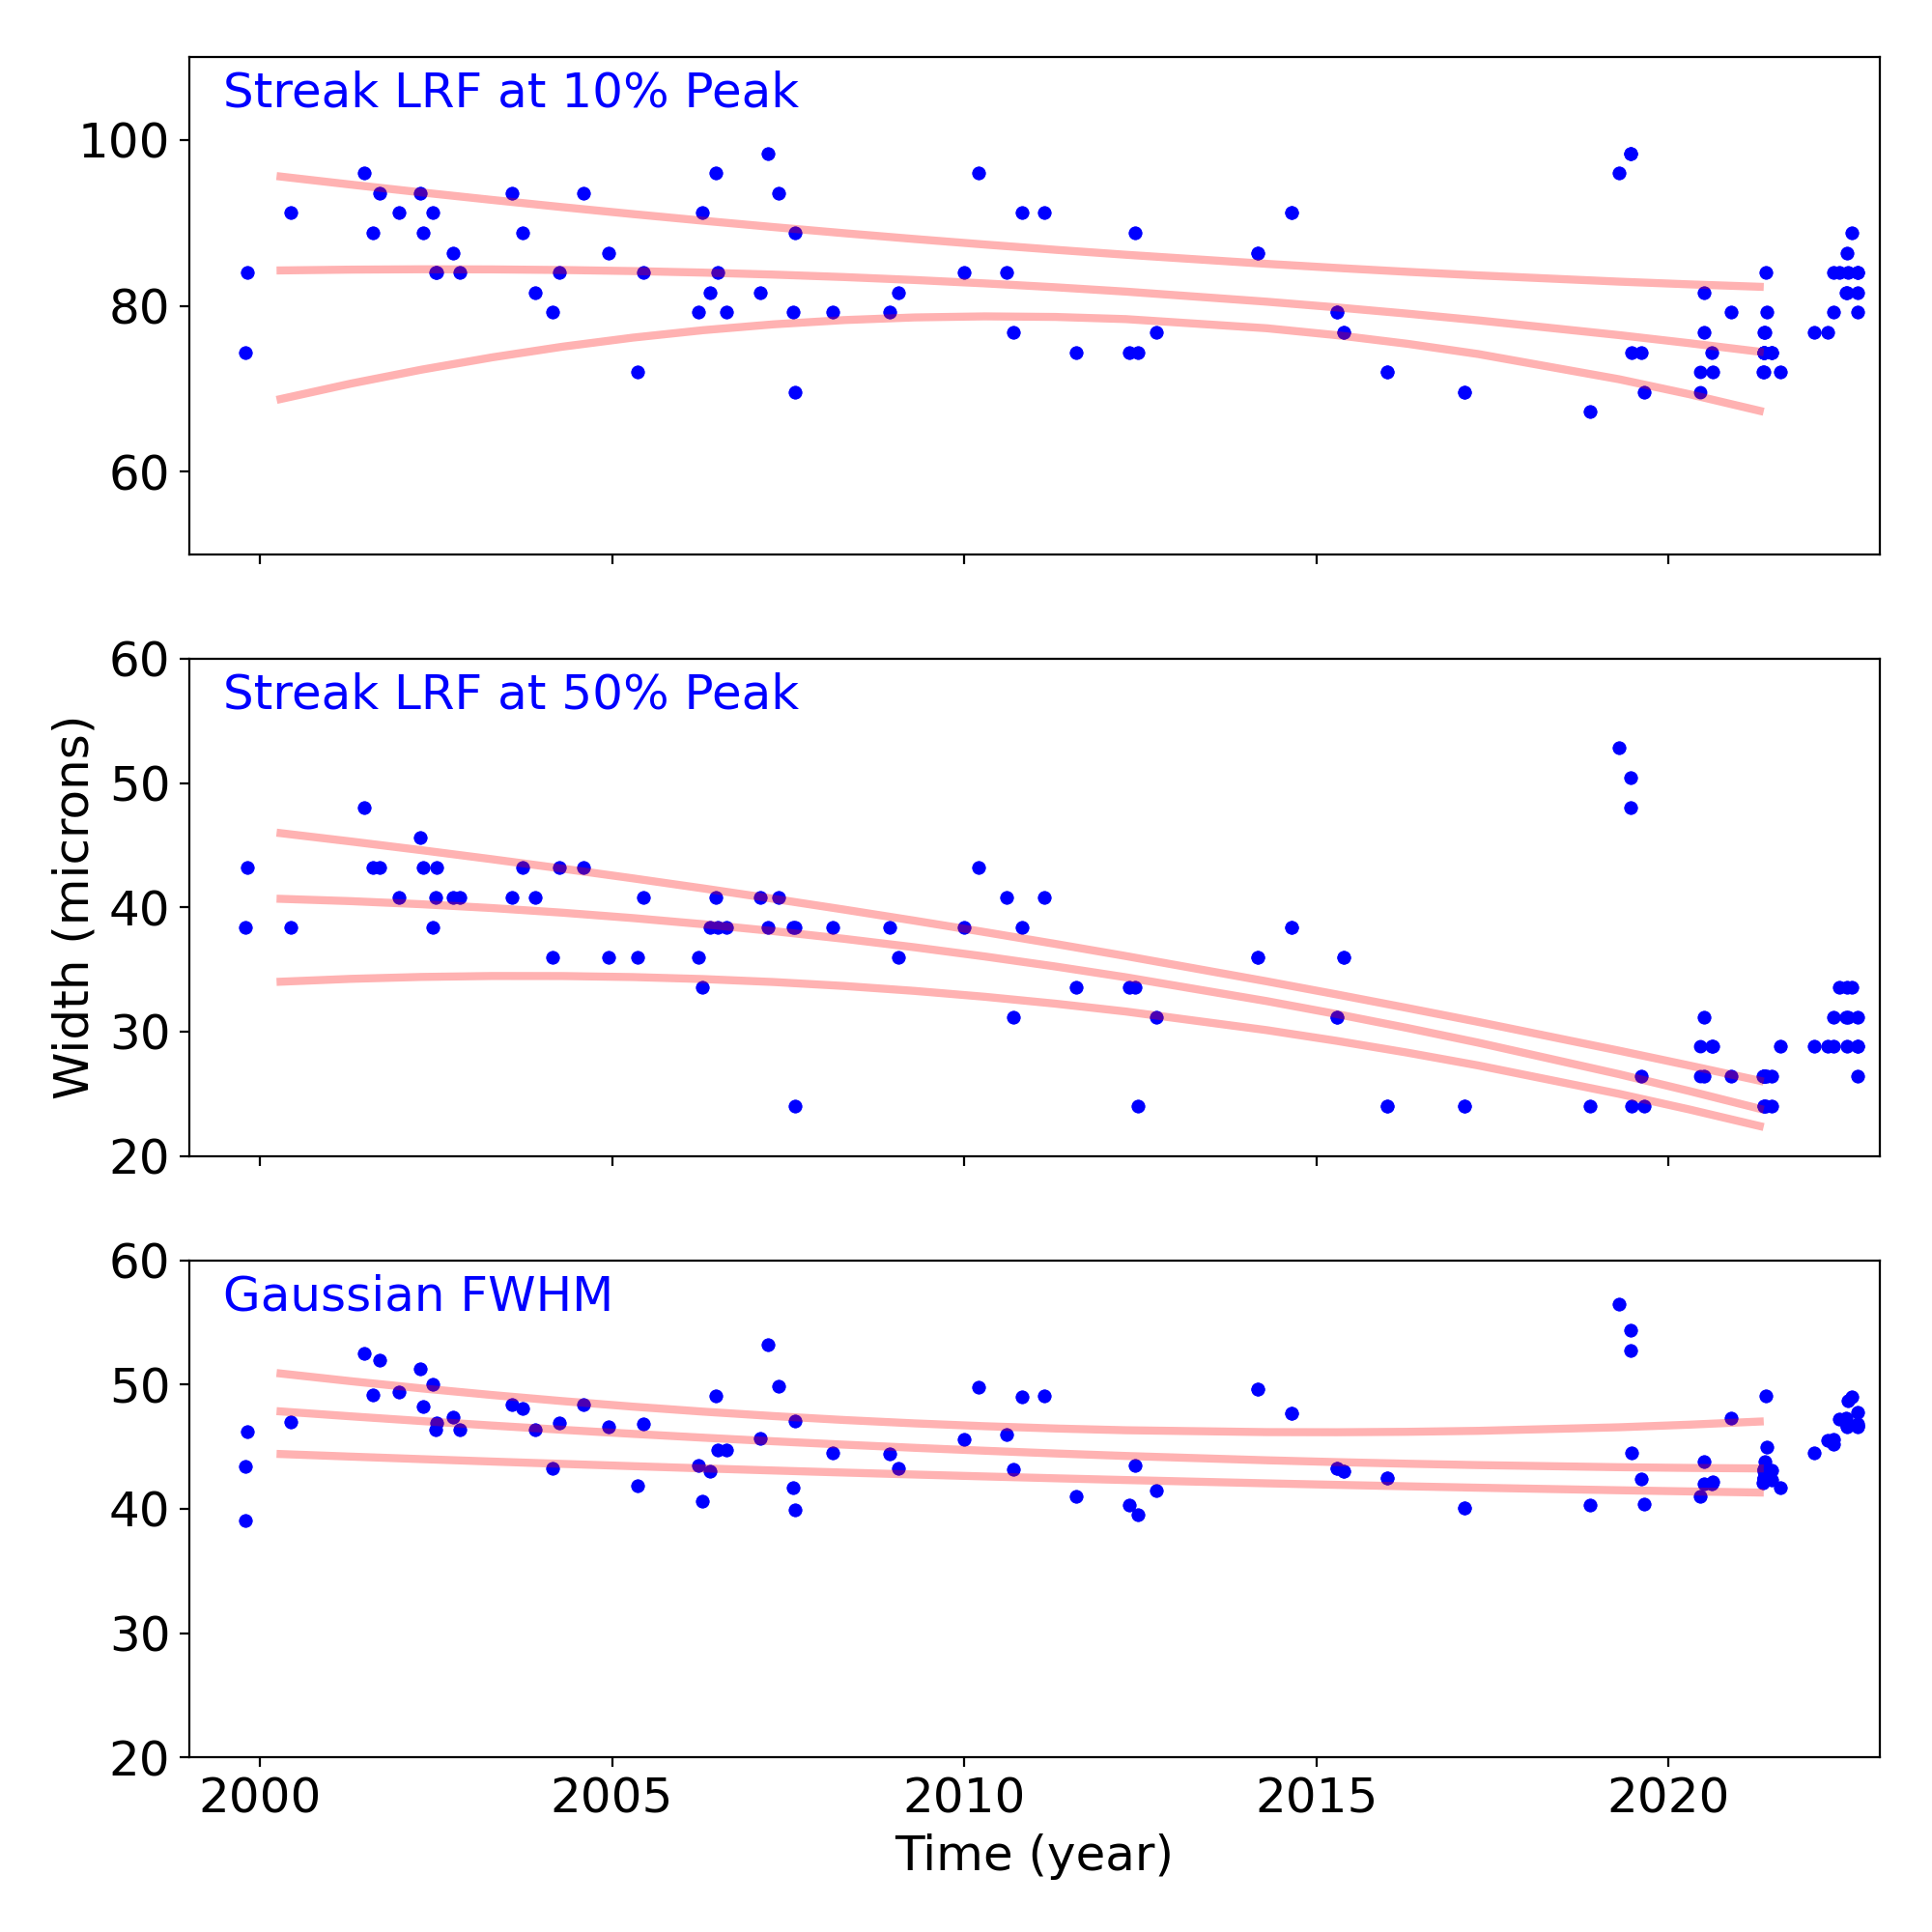
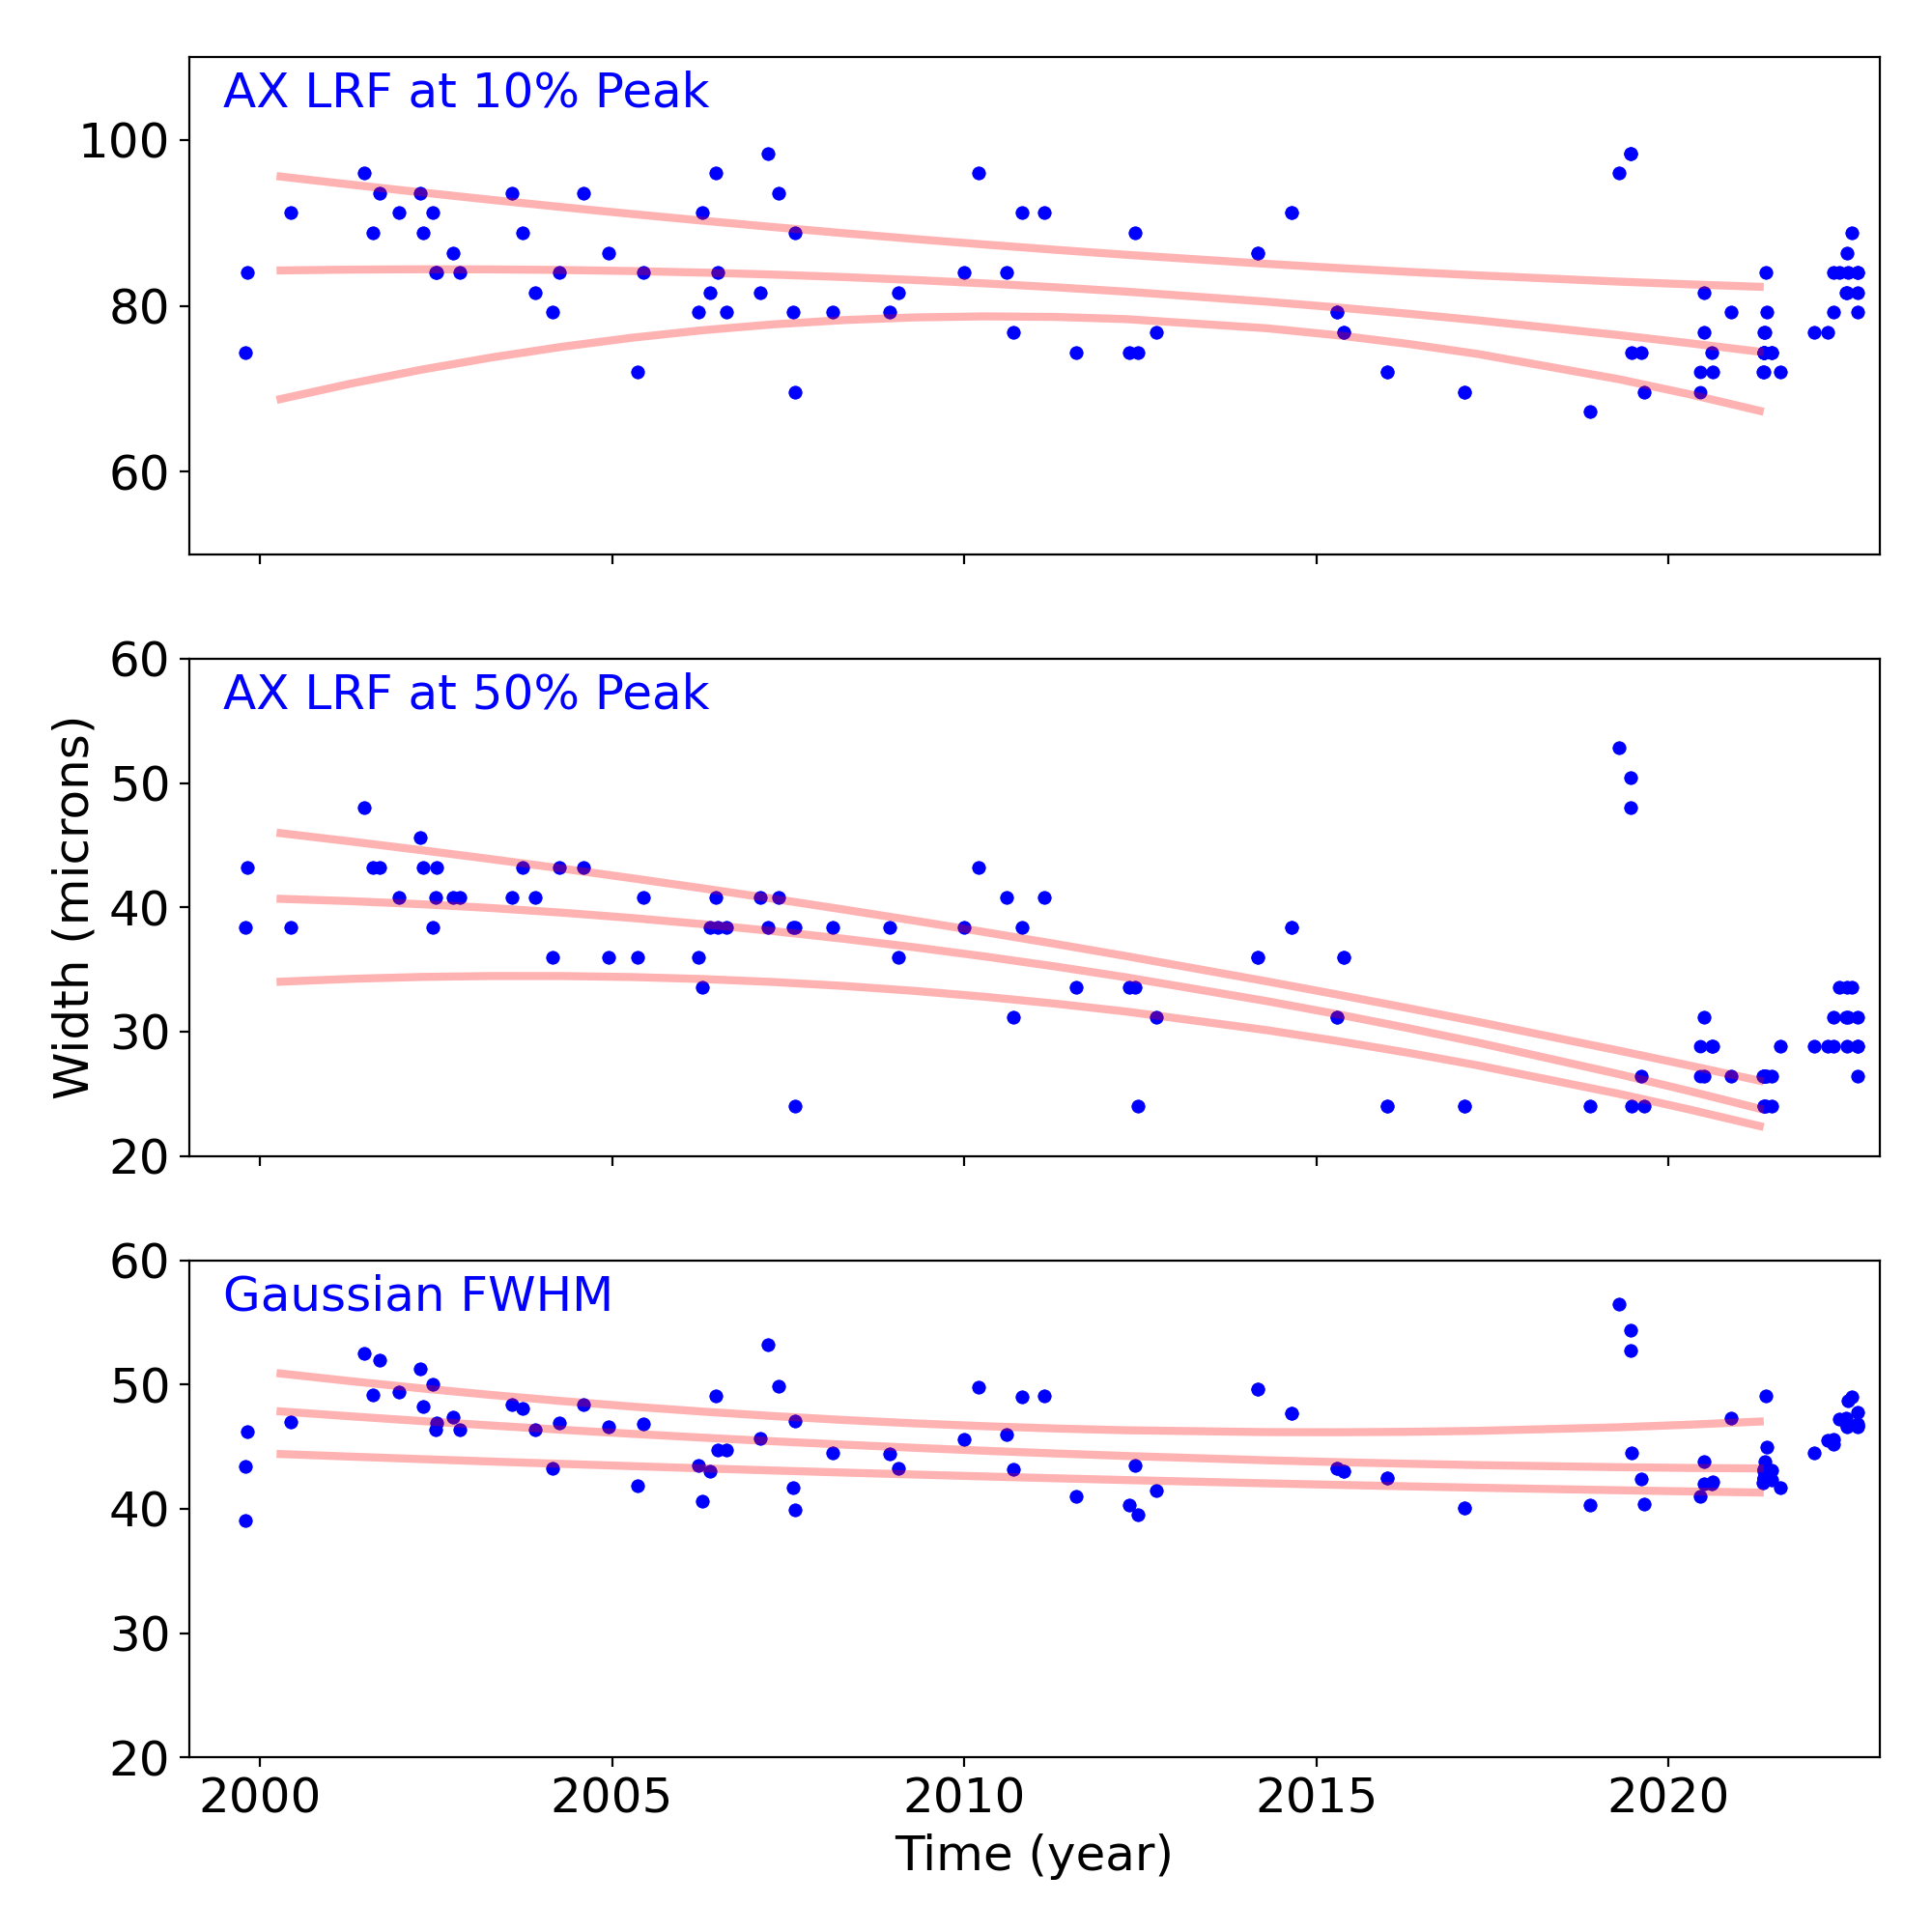
Grating Trends/Focus
We plot the width of the zero order streak of ACIS/HETG observations and the width of the zero order image for HRC/LETG observations of point sources. No significant defocusing trend is seen at this time. See Gratings Trends pages.
PCAD
ACA Trending
| ACIS |
)
|
)
|
)
|
|
|---|---|---|---|---|
)
|
)
|
)
| ||
| HRCI |
)
|
)
|
)
|
)
|
| HRCI |
)
|
)
|
)
|
)
|
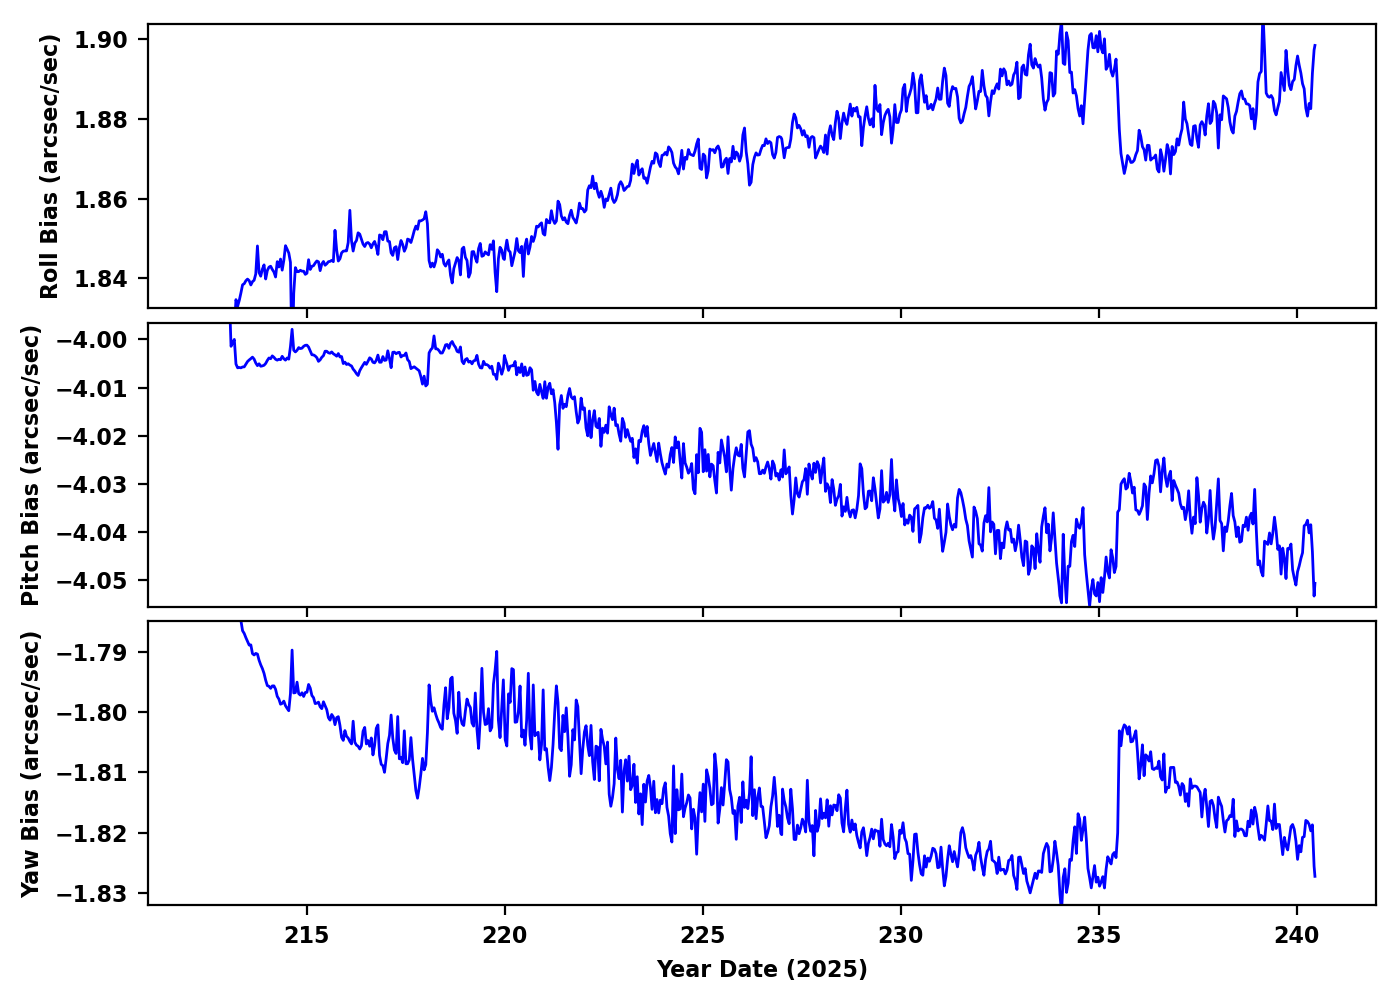
Gyro Bias Drift
Radiation History
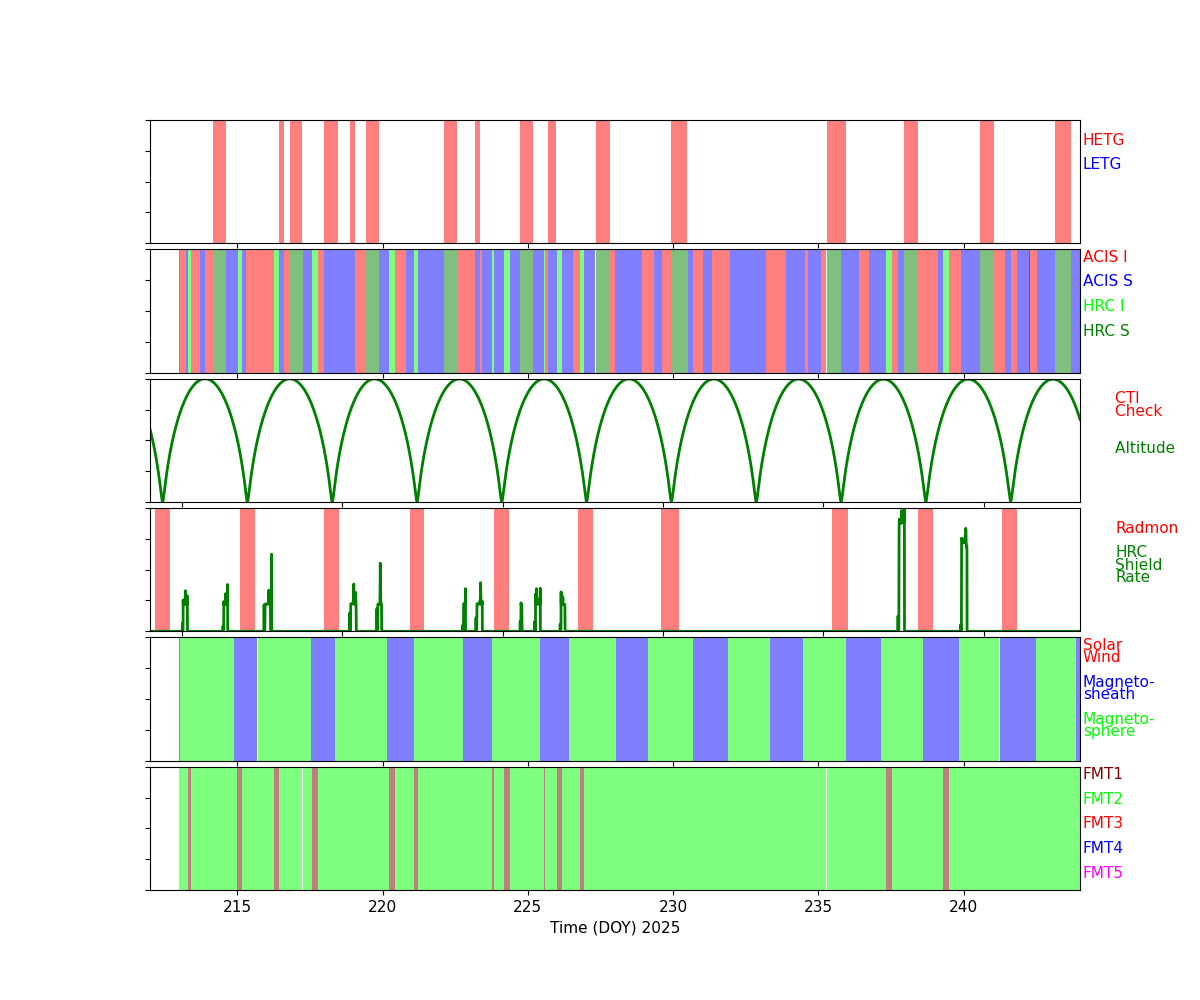
Radiation Count Rates of Aug 2025
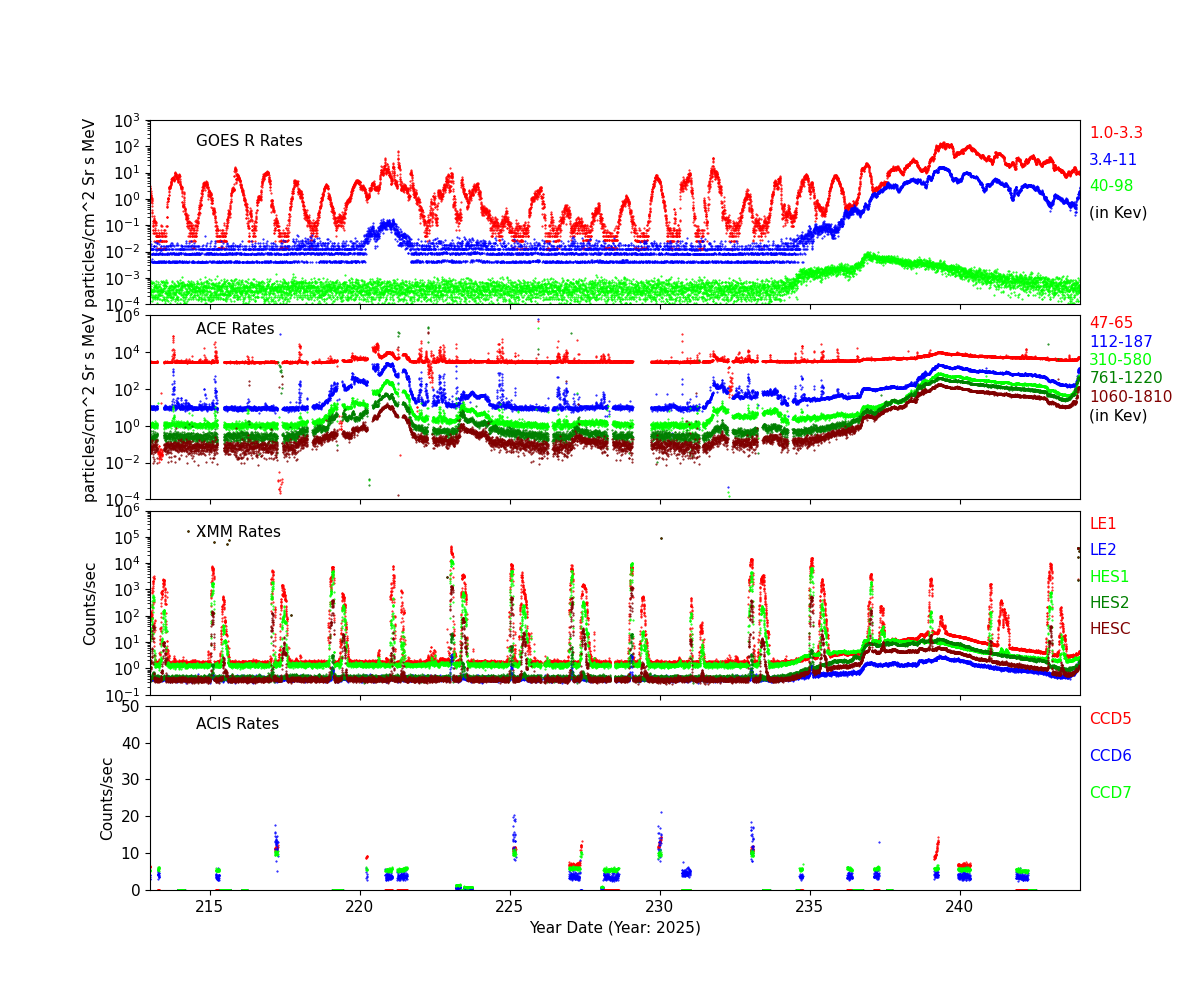
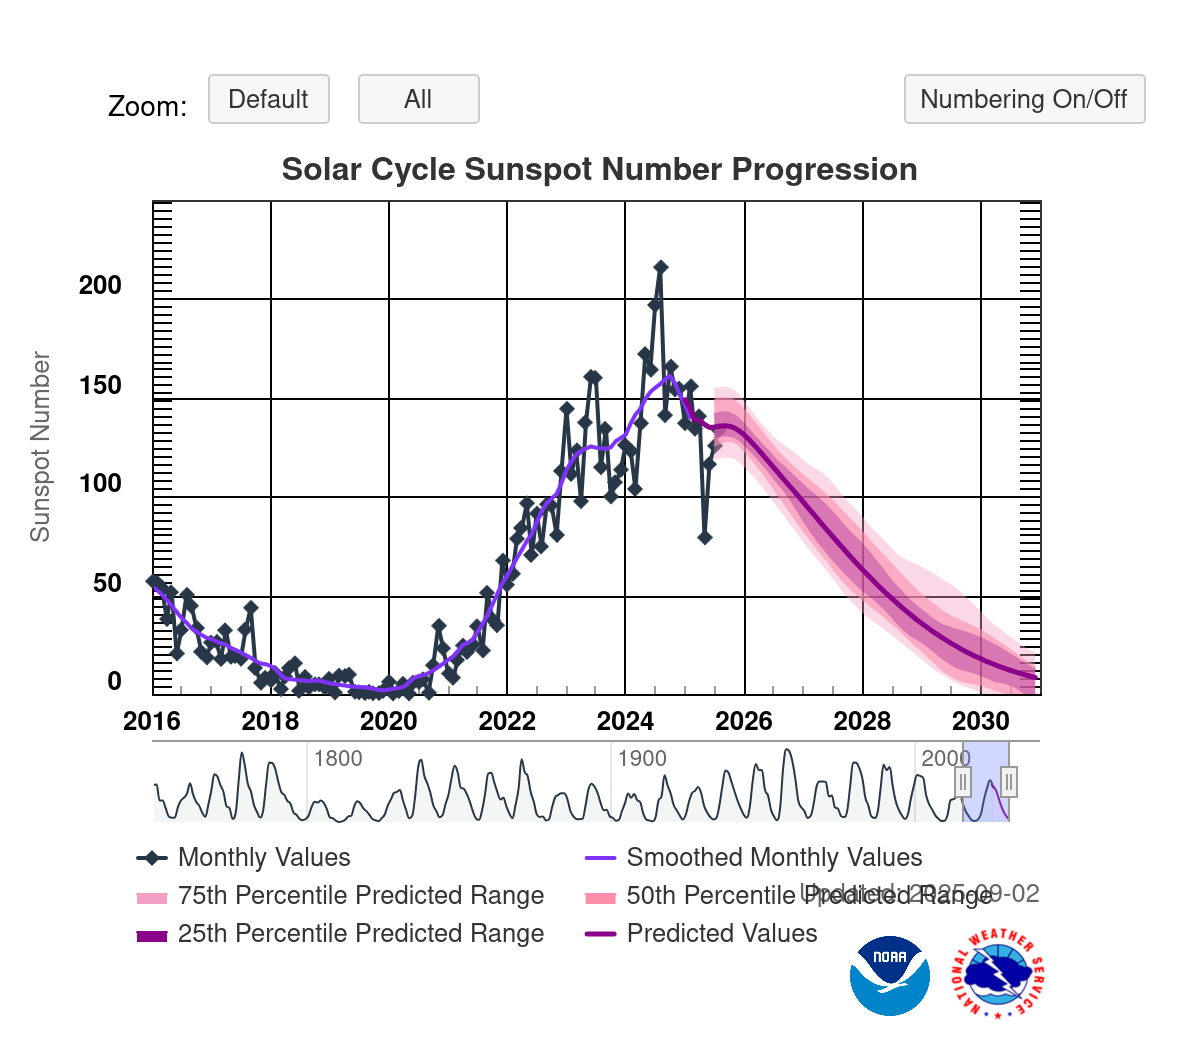
Sun Spot History (See:NOAA Page)
Trending
Quarterly Trends
- HRC Temperature
| Previous Quarter | |||||||
| MSID | MEAN | RMS | DELTA/YR | DELTA/YR/YR | UNITS | DESCRIPTION | |
| 2ceahvpt | 0.001 | 5.568e-04 | (2.79+/-0.01)e2 | 0.14 +/- 0.41 | K | CEA RADIATOR TEMPERATURE AT CENTER | |
|---|---|---|---|---|---|---|---|
| 2chtrpzt | 7.657e-04 | 5.485e-04 | (2.76+/-0.01)e2 | 0.15 +/- 0.40 | K | CENTRAL ELECTRONICS BOX TEMP | |
| 2condmxt | 0.001 | 8.217e-04 | (2.70+/-0.02)e2 | -0.87 +/- 0.54 | K | CONDUIT -X FACE TEMPERATURE | |
| 2dcentrt | 7.479e-04 | 2.794e-04 | (2.74+/-0.01)e2 | 0.17 +/- 0.21 | K | DETECTOR HOUSING TEMP 2 | |
| 2dtstatt | 0.003 | 4.523e-04 | (2.70+/-0.01)e2 | 0.07 +/- 0.32 | K | DETECTOR HOUSING TEMP 1 | |
| 2fhtrmzt | 0.006 | 0.001 | (2.65+/-0.03)e2 | -1.01 +/- 0.91 | K | FRONT END ELECTRONICS BOX TEMPERATURE | |
| 2fradpyt | 0.005 | 0.001 | (2.63+/-0.03)e2 | -1.18 +/- 0.88 | K | FRONT END ASSEMBLY +Y AT RADIATOR CENTER TEMP | |
| 2pmt1t | -0.003 | 6.786e-04 | (2.83+/-0.02)e2 | 0.12 +/- 0.42 | K | PMT 1 TEMPERATURE | |
| 2pmt2t | -0.002 | 6.911e-04 | (2.83+/-0.02)e2 | 0.21 +/- 0.43 | K | PMT 2 TEMPERATURE | |
| 2uvlspxt | -6.398e-04 | 4.948e-04 | (2.75+/-0.01)e2 | 0.36 +/- 0.36 | K | UV LIGHT SHIELD NEXT TO SNOUT TEMP | |
- HRC HK
| Previous Quarter | |||||||
| MSID | MEAN | RMS | DELTA/YR | DELTA/YR/YR | UNITS | DESCRIPTION | |
| 2fe00atm | -3.621e-04 | 0.006 | -1.20 +/- 3.15 | 0.56 +/- 0.12 | C | Front end temperature | |
|---|---|---|---|---|---|---|---|
| 2fepratm | on | 0.075 | 0.004 | 25.19 +/- 1.89 | -2.48 +/- 1.79 | C | FE temp card temperature | off | 3.976e-04 | 0.005 | -1.11 +/- 3.12 | 0.57 +/- 0.11 |
| 2imhvatm | on | 0.046 | 0.003 | 31.71 +/- 1.25 | -1.31 +/- 1.13 | C | Imaging det HVPS temperature | off | 0.008 | 0.003 | 16.31 +/- 1.64 | -0.02 +/- 0.12 |
| 2iminatm | on | 0.064 | 0.003 | 20.52 +/- 1.59 | -1.25 +/- 1.57 | C | Imaging det temperature | off | 0.002 | 0.001 | 1.29 +/- 0.67 | 0.27 +/- 0.06 |
| 2lvplatm | on | 0.036 | 0.003 | 28.00 +/- 1.17 | -1.19 +/- 1.10 | C | LVPS plate temperature | off | -0.003 | 0.003 | 10.20 +/- 1.51 | 0.14 +/- 0.09 |
| 2prbscr | on | 0.001 | 1.075e-04 | 1.76 +/- 0.05 | -0.03 +/- 0.05 | AMP | Primary bus current | off | 7.708e-06 | 2.818e-05 | 1.71 +/- 0.02 | (8.30+/-152.50)e-5 |
| 2prbsvl | 9.826e-04 | 2.024e-04 | 26.76 +/- 0.12 | -0.04 +/- 0.01 | V | Primary bus voltage | |
| 2smtratm | on | 2.481e-13 | 2.768e-09 | 5.94 +/- 0.00 | (2.46+/-13.58)e-13 | C | Selected motor temperature | off | -3.541e-15 | 999.000 | 5.66 +/- 0.00 | (2.67+/-1.54)e-14 |
| 2sphvatm | on | -0.002 | 0.003 | 31.48 +/- 1.19 | -0.02 +/- 1.24 | C | Spect det HVPS temperature | off | -0.018 | 0.003 | 16.55 +/- 1.78 | 0.31 +/- 0.08 |
| 2spinatm | on | 0.054 | 0.003 | 19.08 +/- 1.49 | -1.14 +/- 1.53 | C | Spect det temperature | off | -0.001 | 0.001 | 3.46 +/- 0.78 | 0.09 +/- 0.05 |
- PCAD Temperature
| Previous Quarter | |||||||
| MSID | MEAN | RMS | DELTA/YR | DELTA/YR/YR | UNITS | DESCRIPTION | |
| aacccdpt | 5.140e-05 | 7.863e-04 | (2.65+/-0.02)e2 | 0.47 +/- 0.47 | K | AC CCD TEMP (PRI) | |
|---|---|---|---|---|---|---|---|
| aacccdrt | 1.529e-04 | 8.473e-04 | (3.09+/-0.02)e2 | 0.57 +/- 0.51 | K | AC CCD TEMP (RDNT) | |
| aach1t | 2.078e-04 | 8.645e-04 | (3.06+/-0.02)e2 | 0.46 +/- 0.52 | K | AC HOUSING TEMP (ACH1) | |
| aach2t | 2.692e-04 | 8.665e-04 | (3.06+/-0.02)e2 | 0.54 +/- 0.52 | K | AC HOUSING TEMP (ACH2) | |
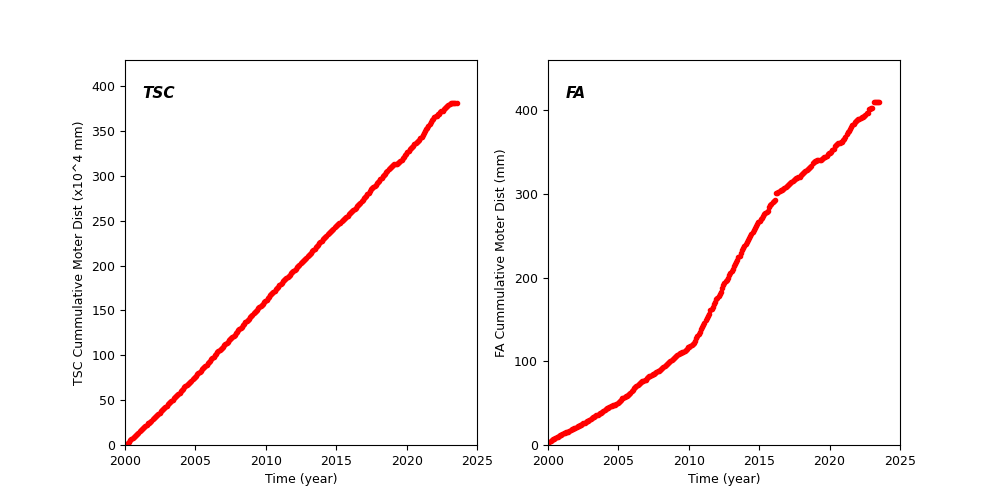
Spacecraft Motions
TSC and FA Cummulative Moter Distance
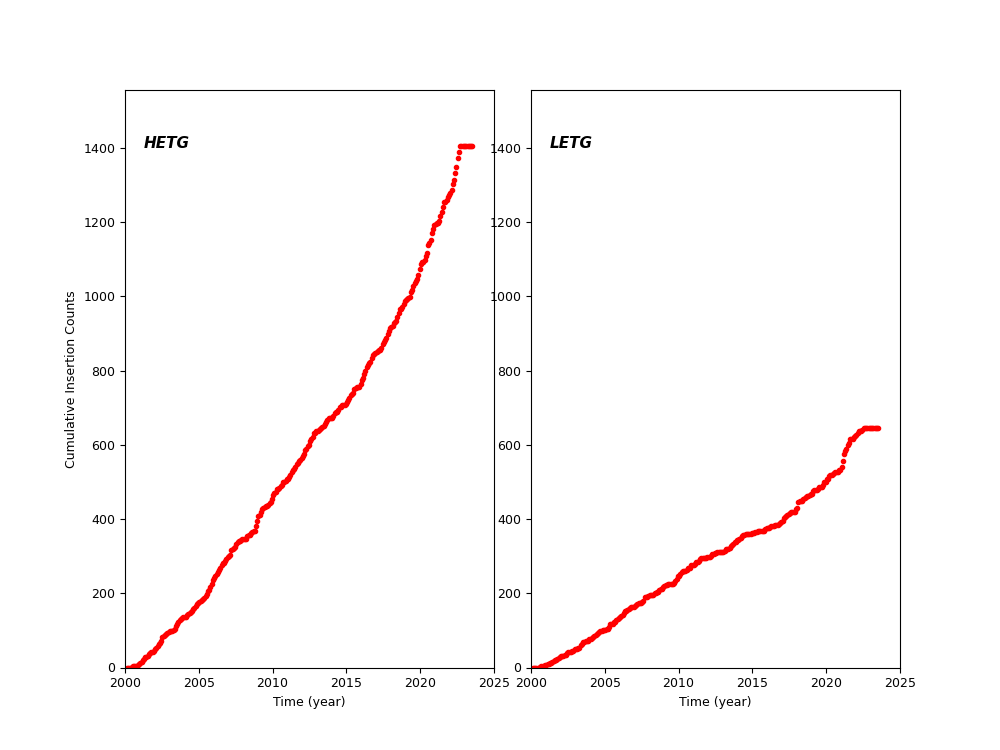
HETG and LETG Cummulative Insertion Counts
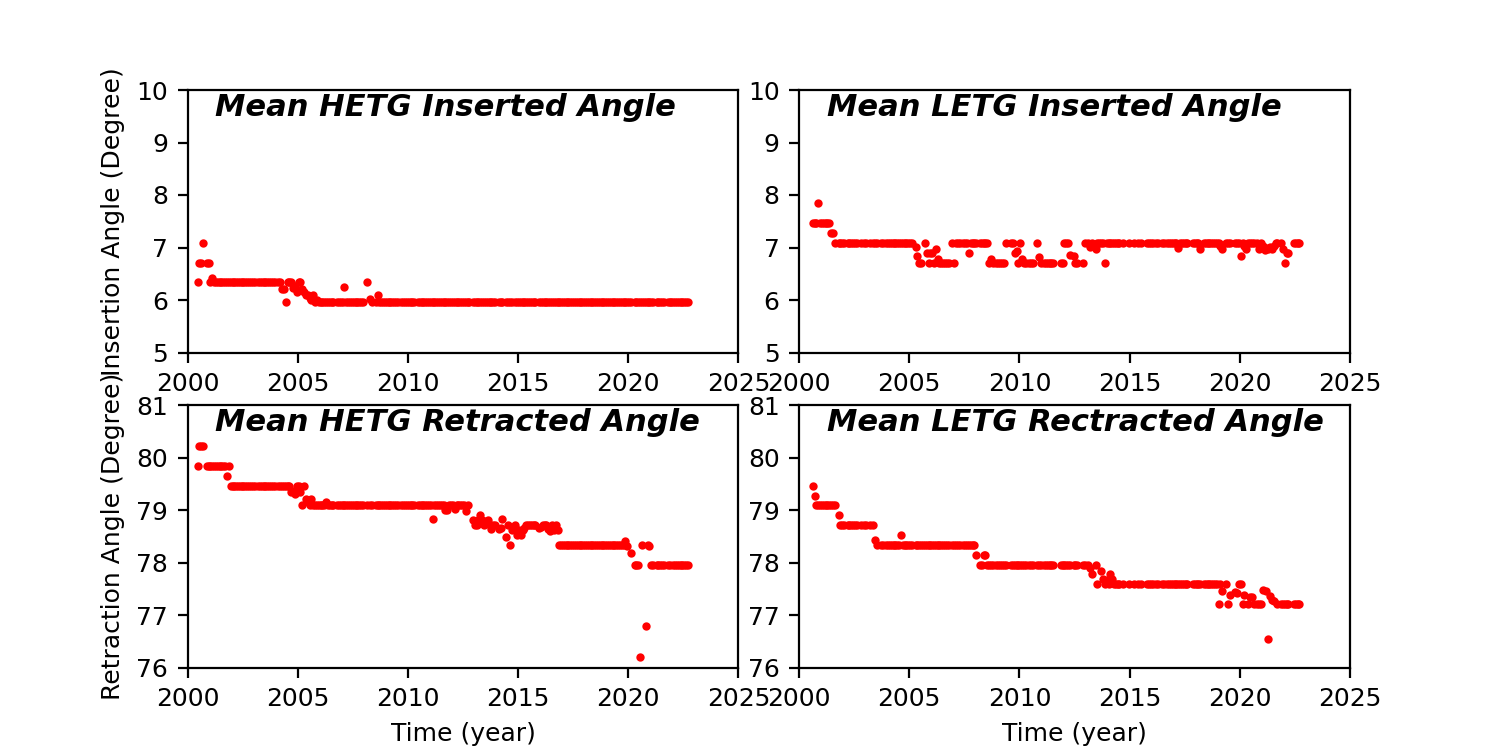
HETG/LETG Insertion/Retraction Angle
Reaction Wheel Rotations
