ACIS
ACIS DOSE Registered-Photon-Map
The steps we took to compute the dose map are;
- Level 1 Event files for a specified month are obtained from archive.
- Image data including I2, I3, S2, S3 CCDs are extracted from all event files.
- All the extracted image data were merged to create a month long exposure map for the month.
- The exposure map is opened with ds9, and check a distribution of count rates against energy. From this, estimate the upper threshold value. Any events beyond this upper threshold are assumed erroneous events such as bad pixels.
- Using this upper threshold, the data is filtered, and create a cleaned exposure map for the month.
- The exposure map from each month from the Sep 1999 is added up to create a cumulative exposure map for each month.
- Using fimgstatistic, we compute count rate statistics for each CCDs.
- For observations with high data drop rates (e.g., Crab nebula, Cas A), we corrected the observations by adding events.
Please check more detail plots at Telemetered Photon Dose Trend page.
)
)
)
Statistics:
# IMAGE     NPIX     MEAN        RMS        MIN     MAX
ACIS_mar25 6004901       3.700         4.775           0.0      543


I2 node 0  262654	2.256559	1.660506	0.0	 44.0
I2 node 1  262654	2.876938	1.961622	0.0	 80.0
I2 node 2  262654	2.888718	1.958292	0.0	 48.0
I2 node 3  262654	2.815235	2.243227	0.0	171.0

I3 node 0  262654	4.626747	3.463378	0.0	 52.0
I3 node 1  262654	3.970688	2.393552	0.0	 82.0
I3 node 2  262654	3.927678	2.159989	0.0	 43.0
I3 node 3  262654	4.128027	6.202288	0.0	153.0

S2 node 0  262654	4.792023	3.612800	0.0	543.0
S2 node 1  262654	5.333995	4.034139	0.0	445.0
S2 node 2  262654	5.771971	4.091934	0.0	375.0
S2 node 3  262654	5.387200	5.207319	0.0	539.0

S3 node 0  262654	7.039200	4.879249	0.0	156.0
S3 node 1  262654	8.242207	4.572615	0.0	138.0
S3 node 2  262654	8.568681	5.401316	0.0	161.0
S3 node 3  262654	7.215231	5.203754	0.0	151.0
)
)
)
Statistics:
 IMAGE     NPIX      MEAN        RMS           MIN      MAX
ACIS_total   6004901       2724.944         3446.511           0.0   168593


I2 node 0  262654	2367.399523	480.661984	507.0	15677.0
I2 node 1  262654	2496.239839	705.293128	518.0	166587.0
I2 node 2  262654	2523.619989	535.730987	543.0	17305.0
I2 node 3  262654	2527.804597	656.947291	502.0	36208.0

I3 node 0  262654	2725.811190	675.464827	504.0	15206.0
I3 node 1  262654	2807.289865	1755.811276	527.0	56057.0
I3 node 2  262654	2515.849028	471.756310	493.0	15363.0
I3 node 3  262654	2493.015889	508.943785	470.0	35984.0

S2 node 0  262654	3179.299104	513.835896	1716.0	22625.0
S2 node 1  262654	3377.305785	770.673186	1892.0	20255.0
S2 node 2  262654	3744.739377	774.289312	2306.0	33577.0
S2 node 3  262654	3701.333716	629.355294	2028.0	85816.0

S3 node 0  262654	5628.129025	3026.831944	2472.0	55179.0
S3 node 1  262654	6849.803914	2400.964578	0.0	83602.0
S3 node 2  262654	5583.542502	1372.901773	2620.0	27638.0
S3 node 3  262654	4391.672137	778.171533	2649.0	26733.0
)
|
)
|
)
|
)
|
| Dec 2024 | Sep 2024 | Jun 2024 | Mar 2024 |
|---|
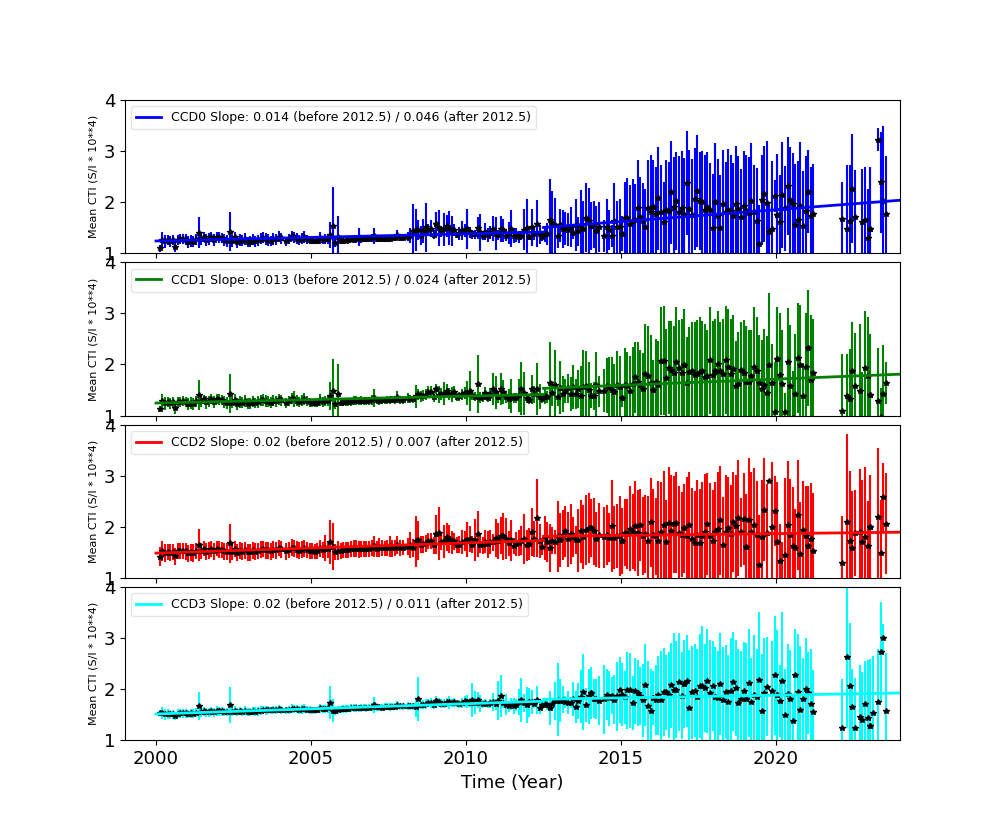
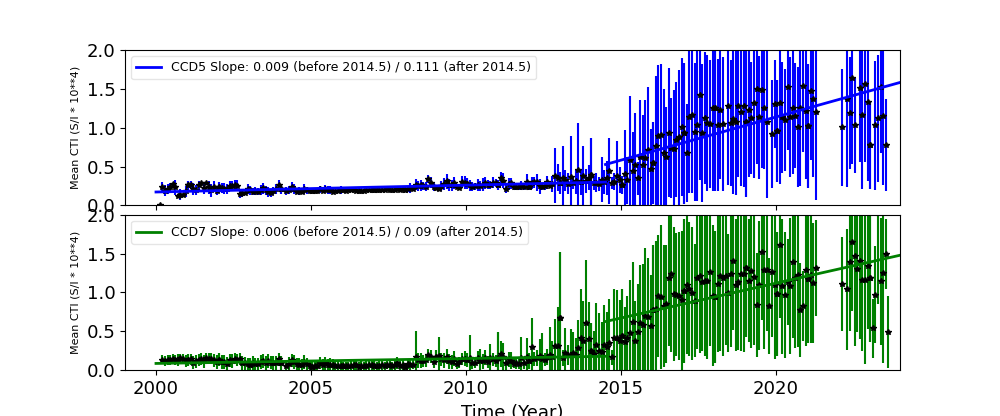
The Mean Detrended CTI
We report CTIs with a refined data definition. CTIs were computed for the temperature dependency corrected data. Please see CTI page for detailed explanation. CTI's are computed for Mn K alpha, and defined as slope/intercept x10^4 of row # vs ADU. Data file: here
Imaging CCDs
Spectral CCDs
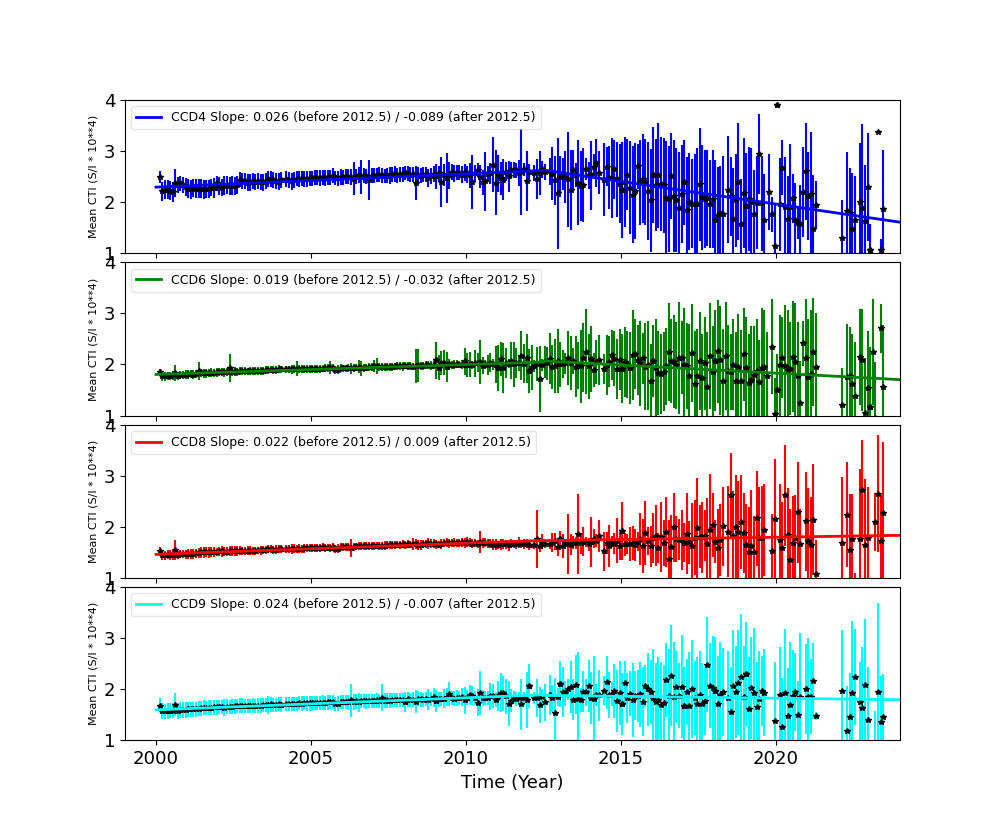
Backside CCDs
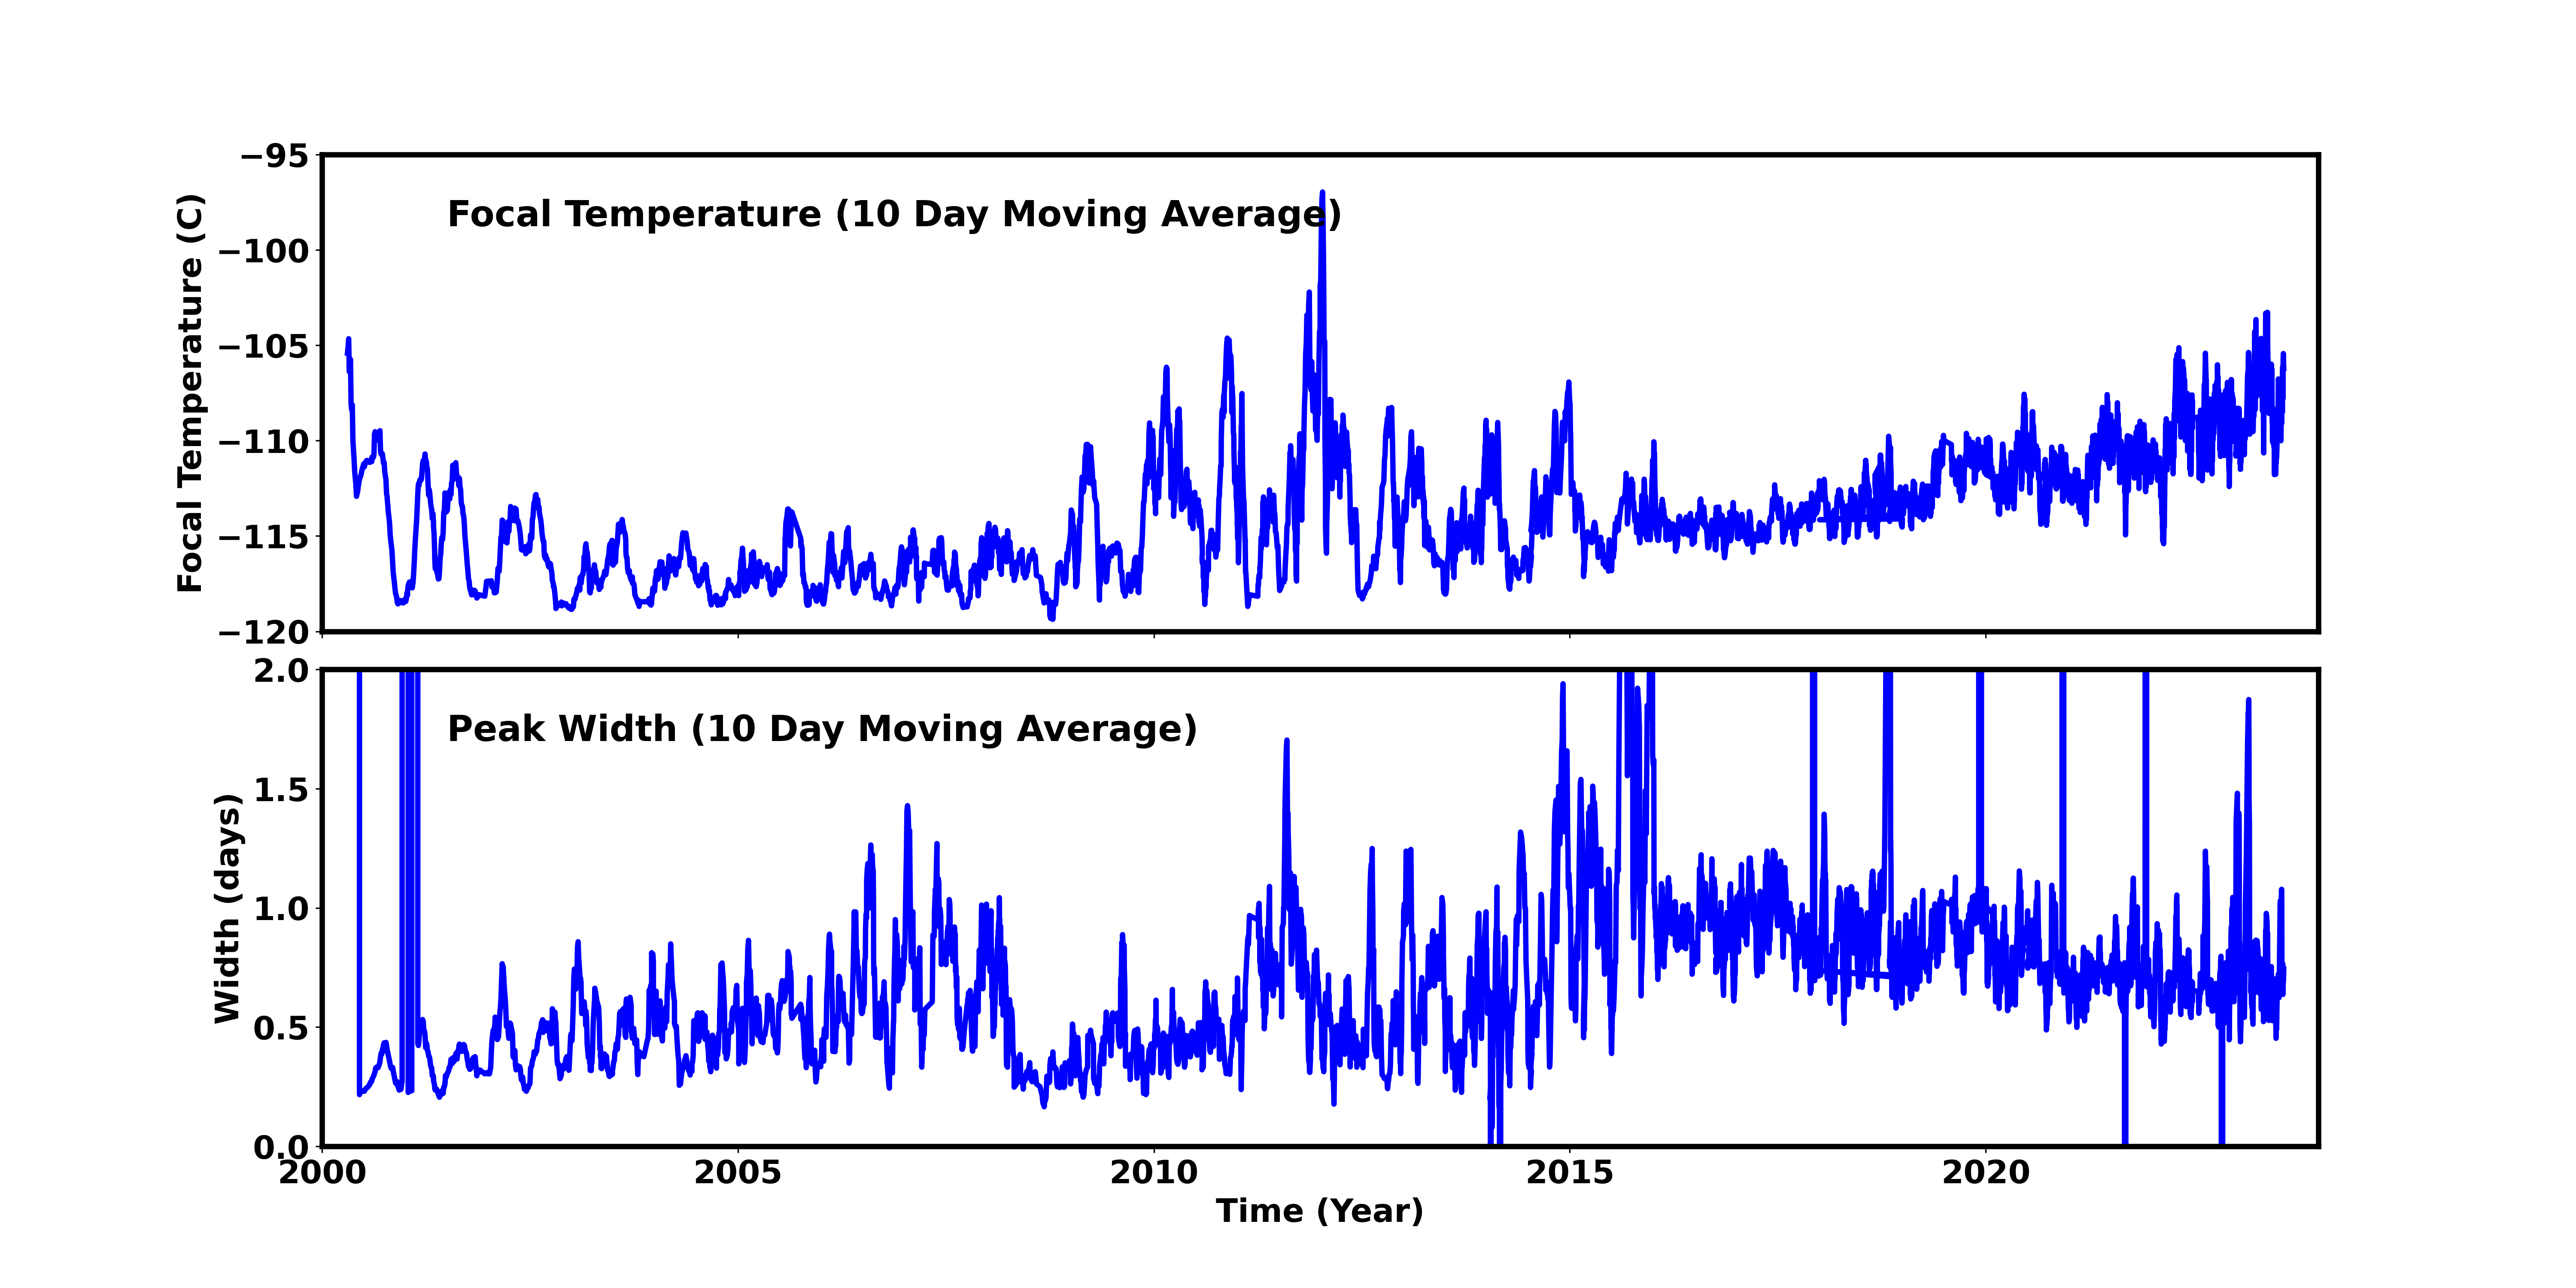
Focal Plane Temperature
Mar 2025 Focal Temperature
| The Mean (max) FPT: | |
|---|---|
| -107.53 | +/- 7.69 C |
| Mean Width: | |
| 0.8 | +/- 0.58 days |
Averaged Focal Plane Temperature
We are using 10 period moving averages to show trends of peak temperatures and peak widths. Note, the gaps in the width plot are due to missing/corrupted data.
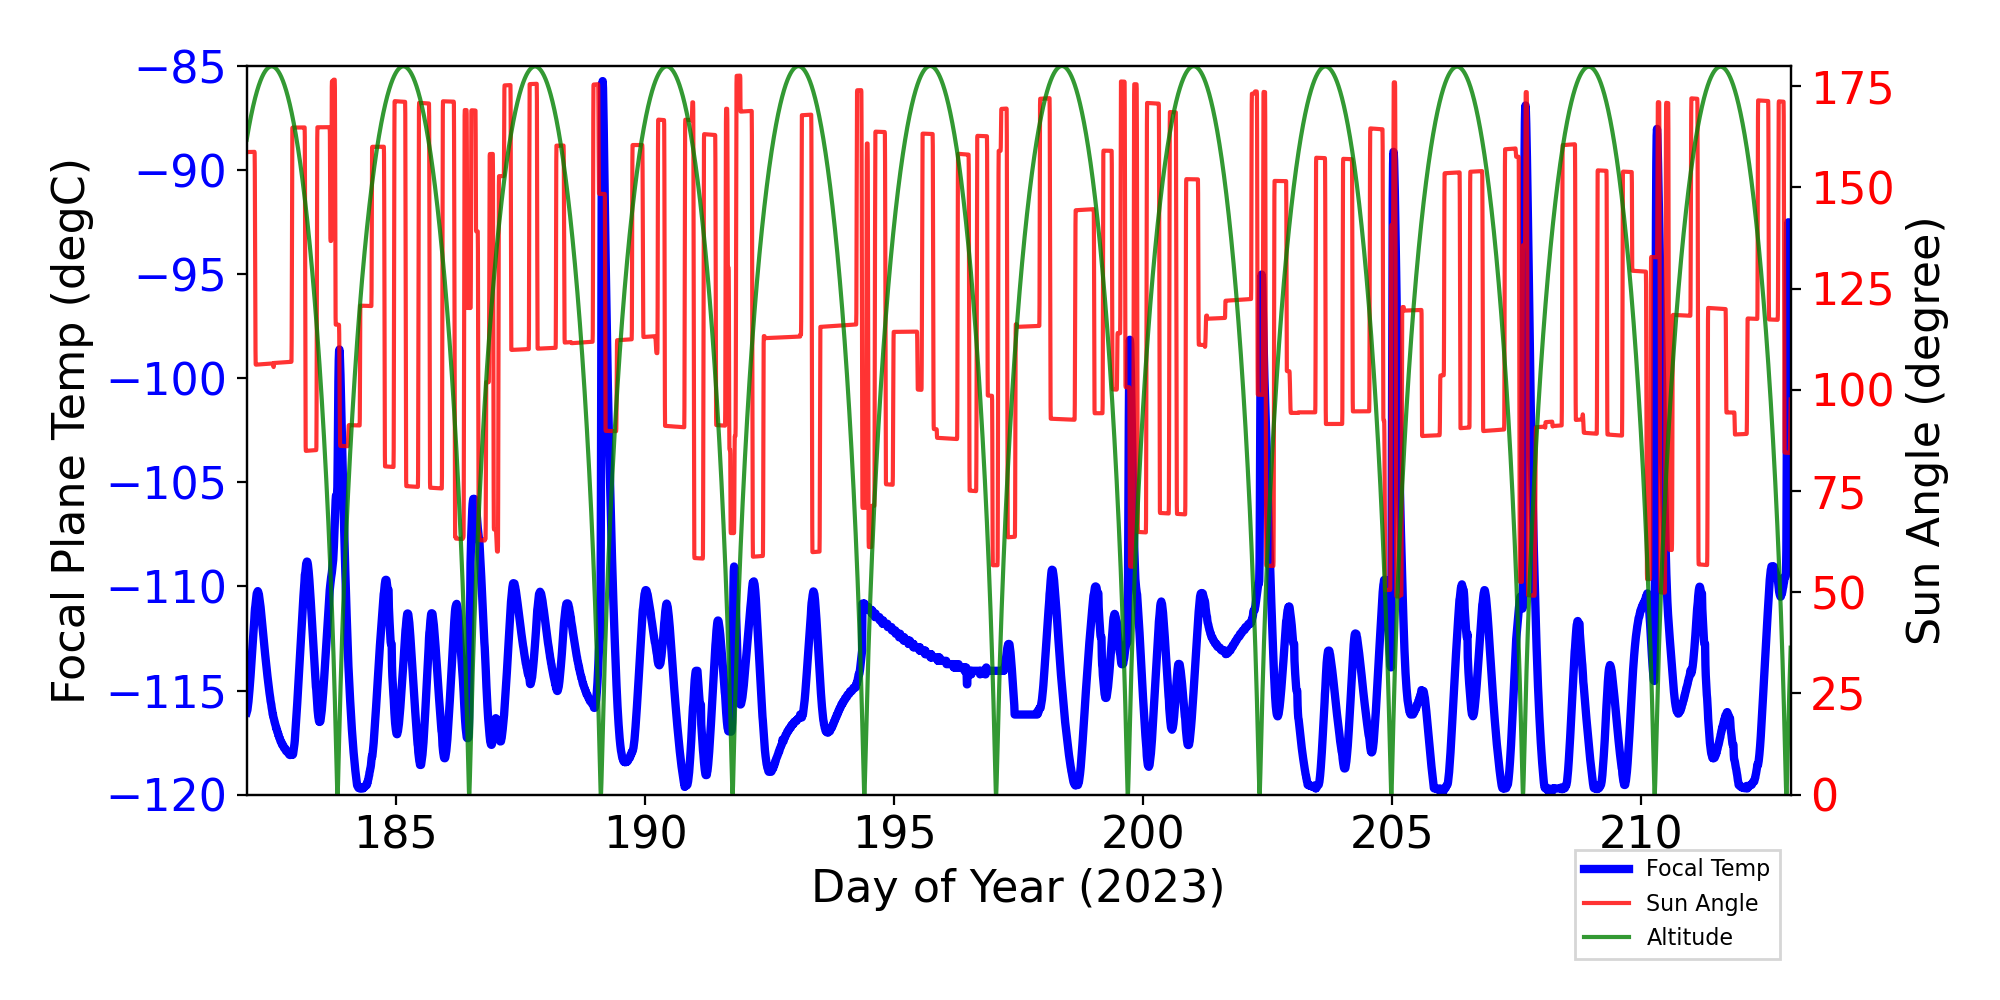
Focal Plane Temperature, Sun Angle and Altitude
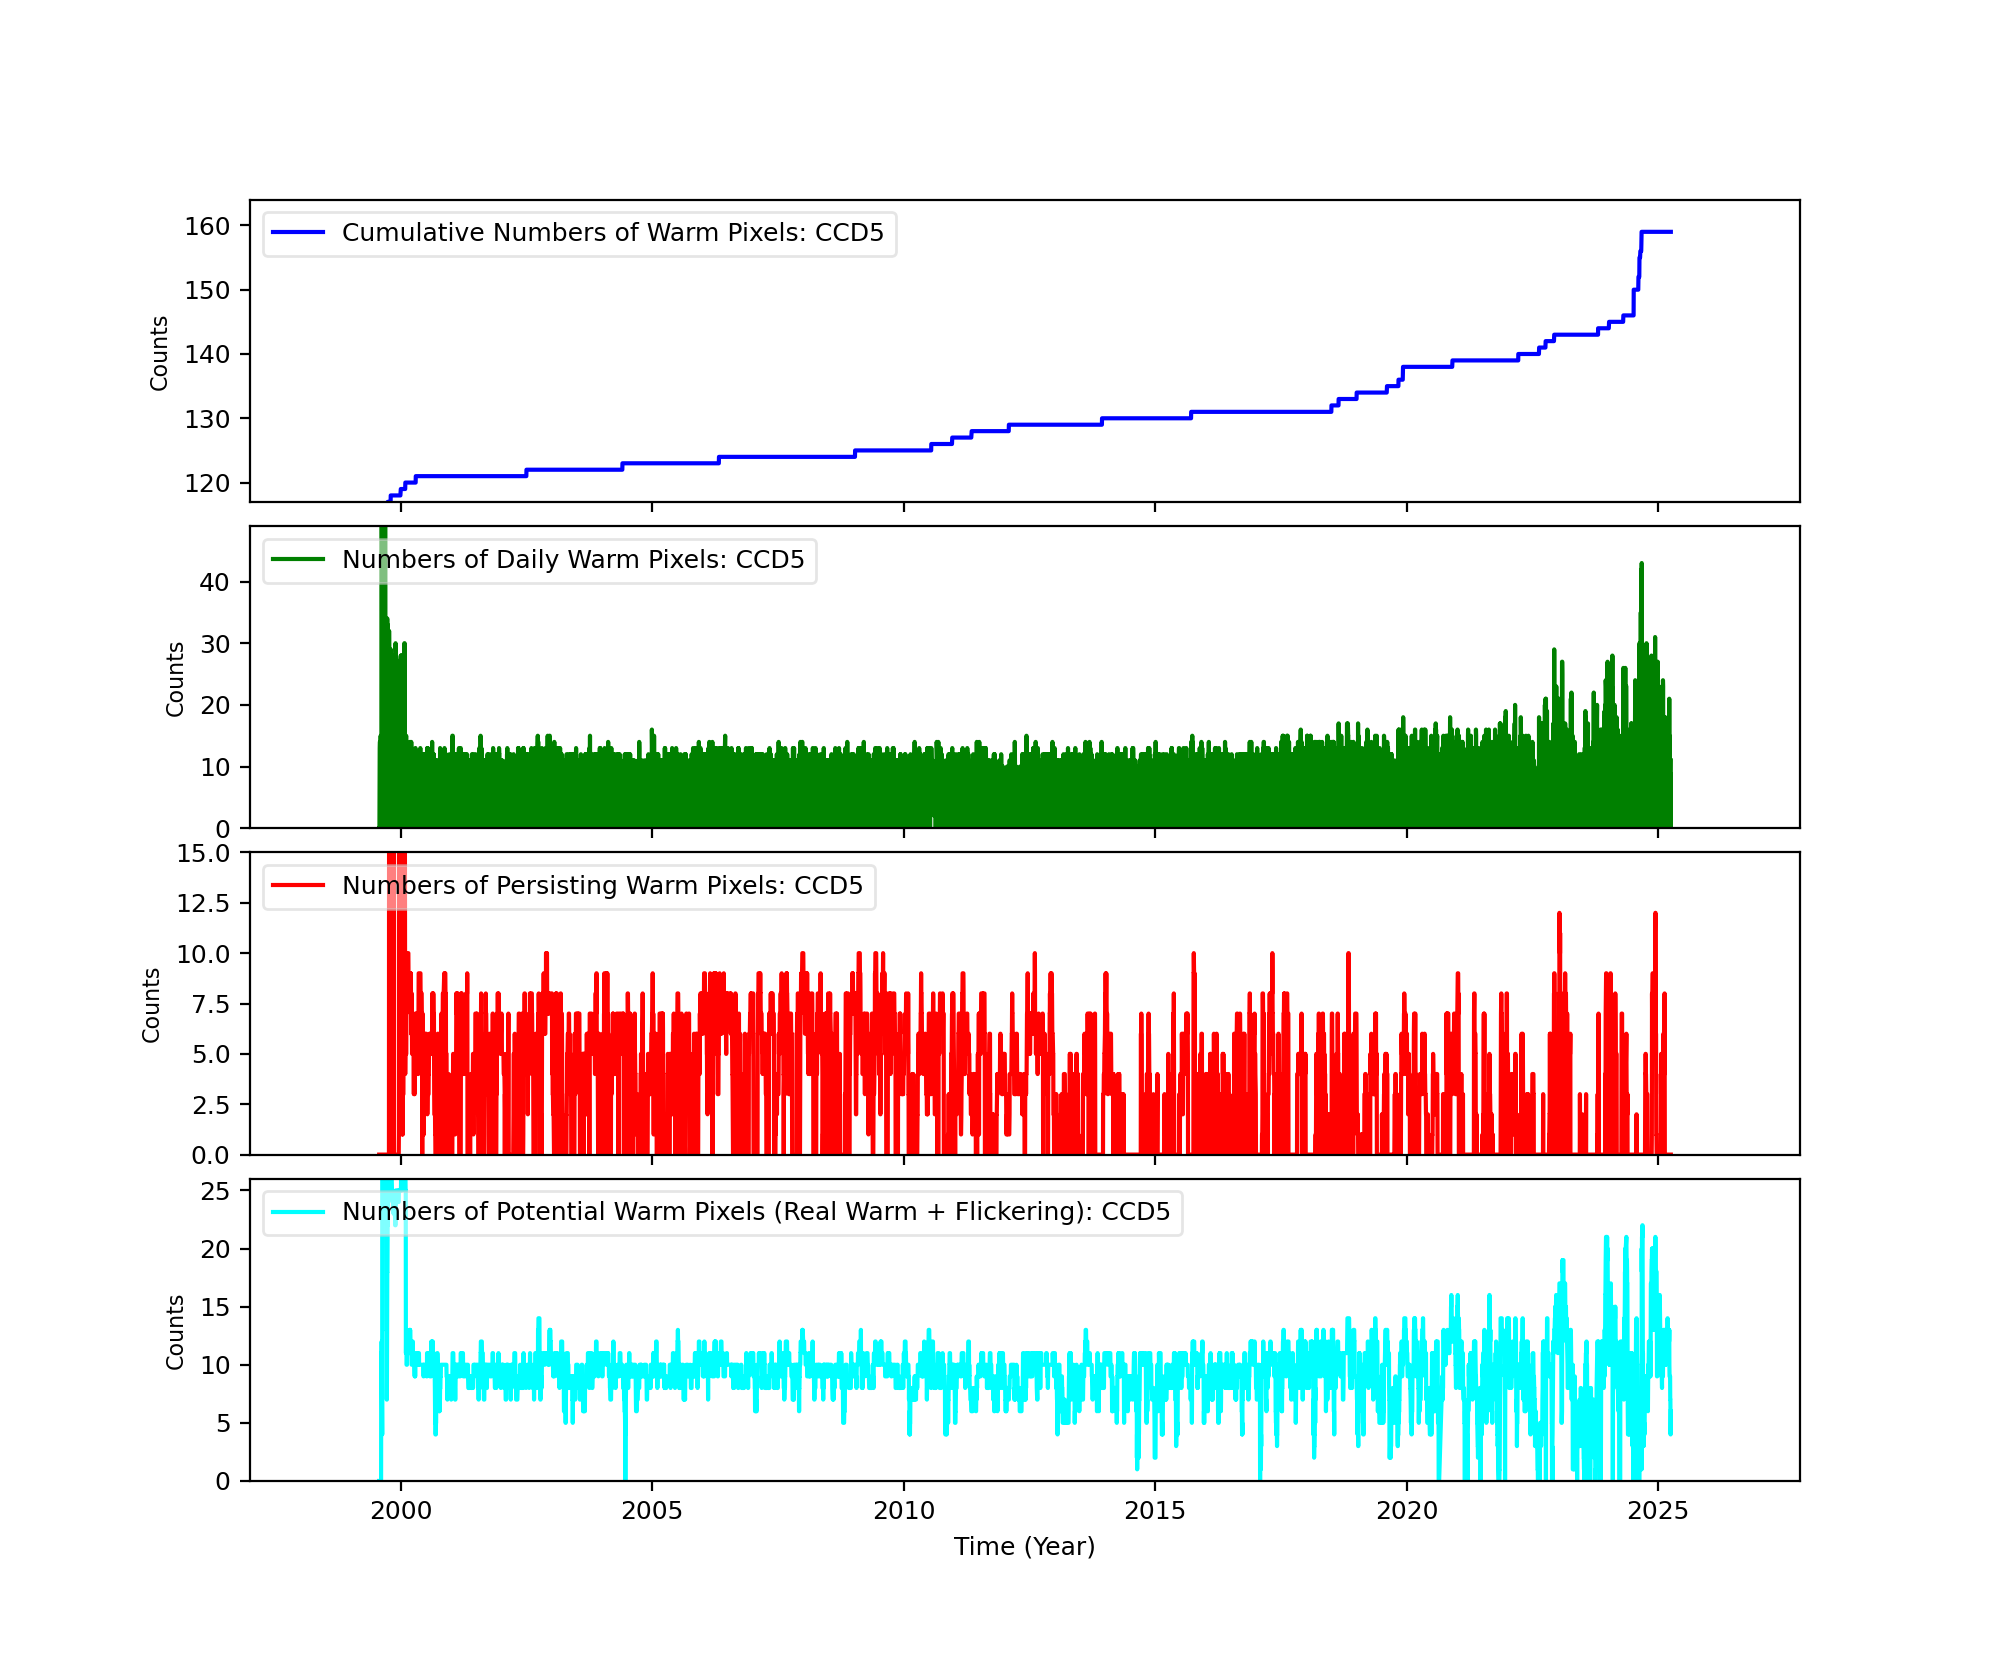
Bad Pixels
The plots below were generated with a new warm pixel finding script. Please see Acis Bad Pixel Page for details.
Front Side CCDs
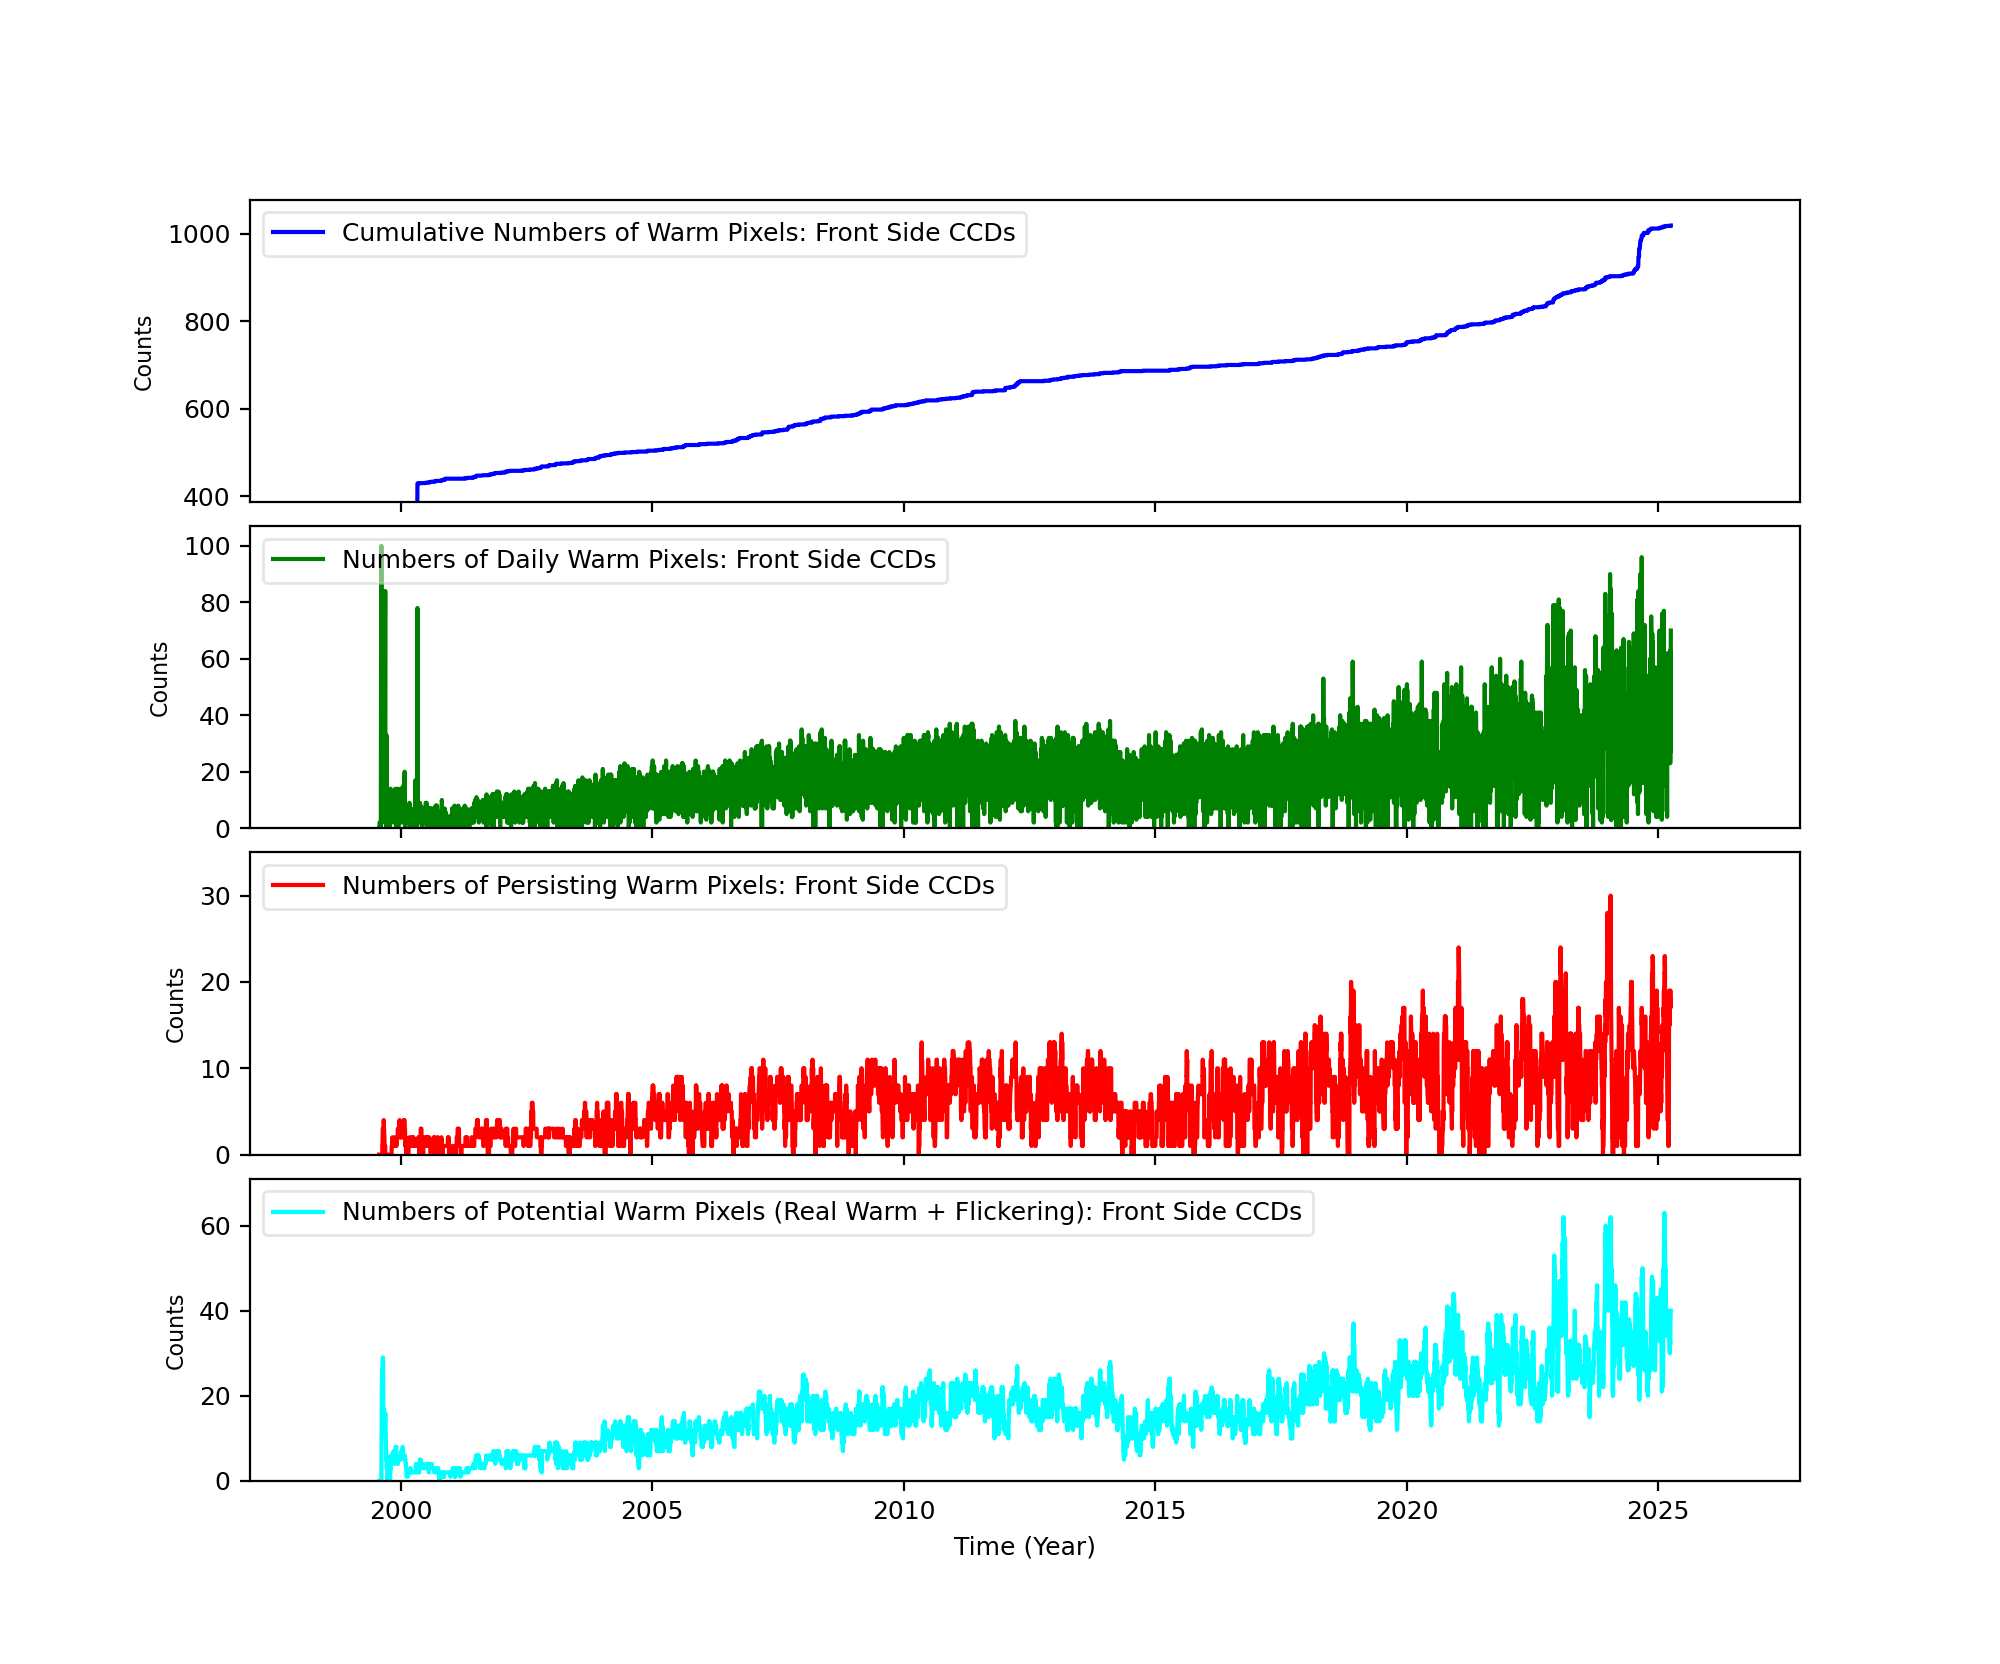
Back Side CCD (CCD5)
Science Instrument Background Rates
| Name | Low (keV) | High(KeV) | Description |
|---|---|---|---|
| SSoft | 0.00 | 0.50 | Super soft photons |
| Soft | 0.50 | 1.00 | Soft photons |
| Med | 1.00 | 3.00 | Moderate energy photons |
| Hard | 3.00 | 5.00 | Hard Photons |
| Harder | 5.00 | 10.00 | Very Hard photons |
| Hardest | 10.00 | Beyond 10 keV |


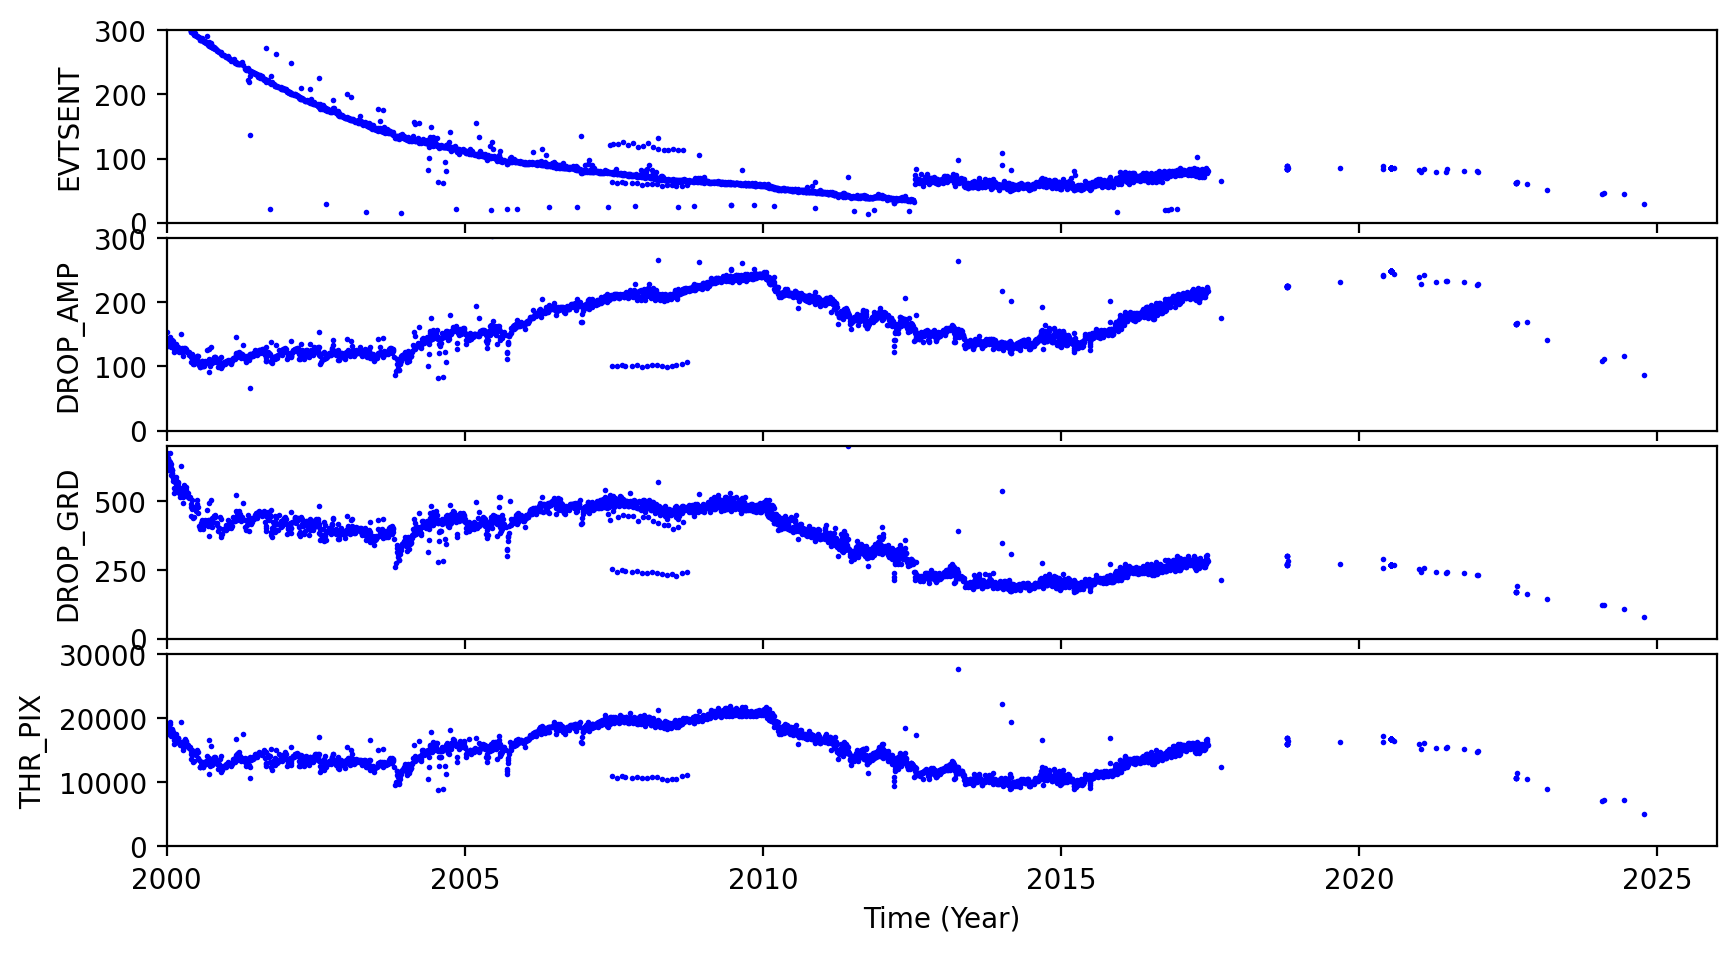
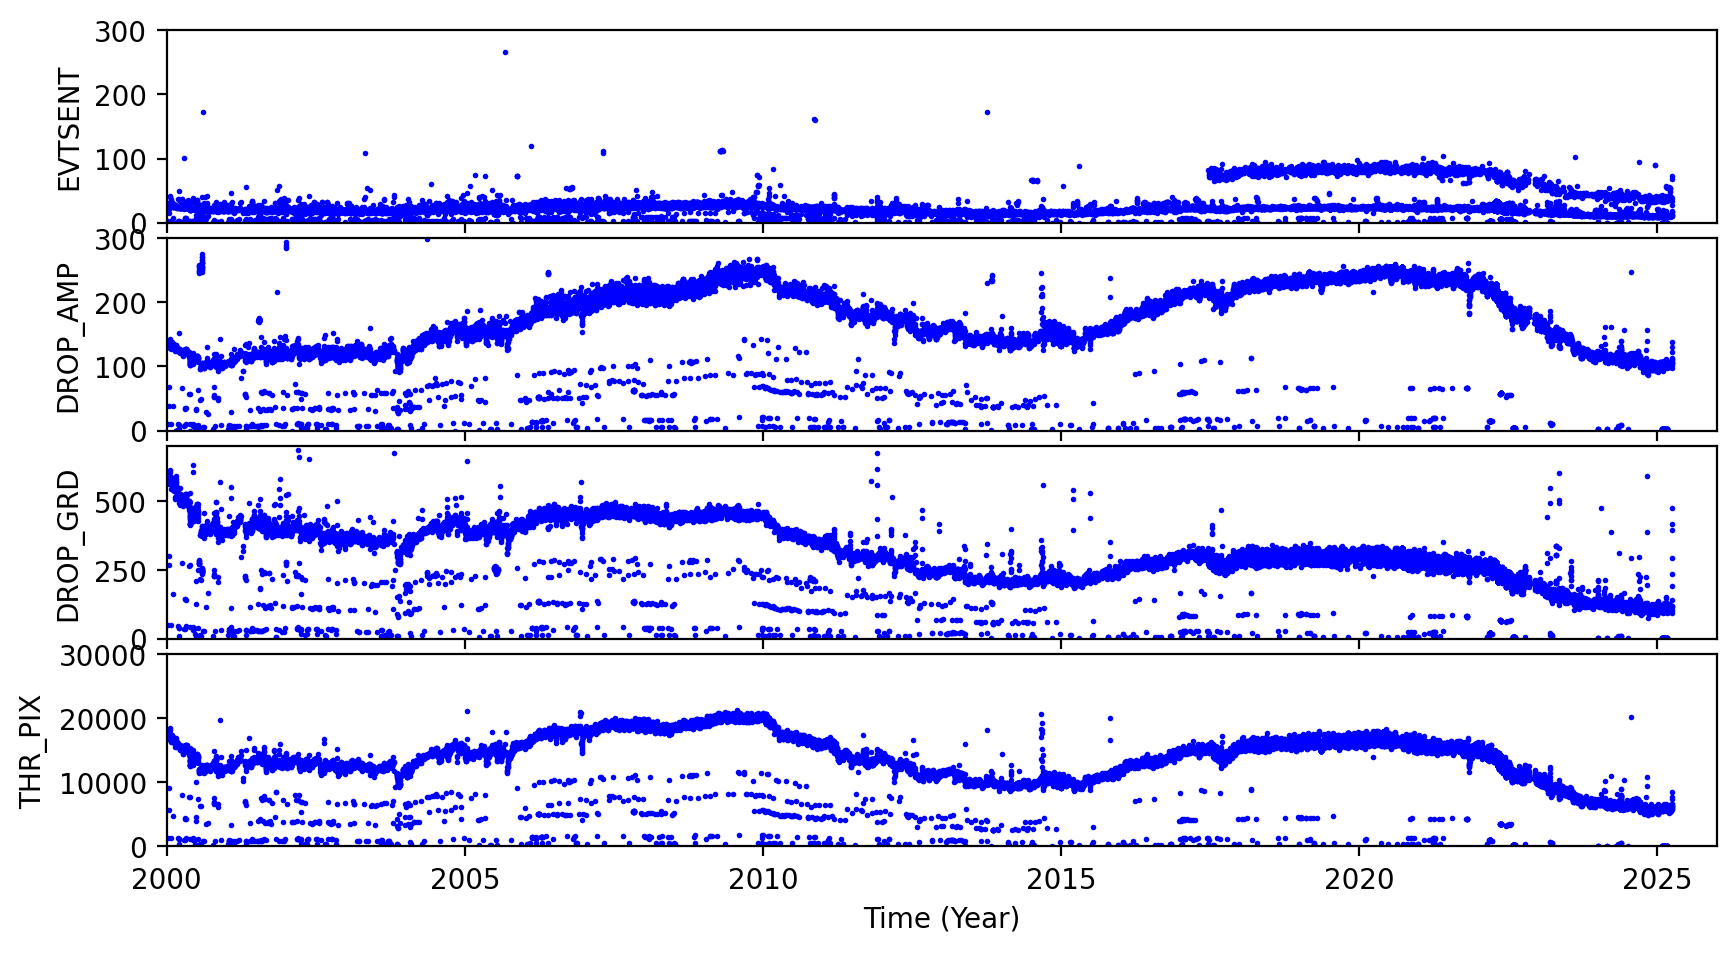
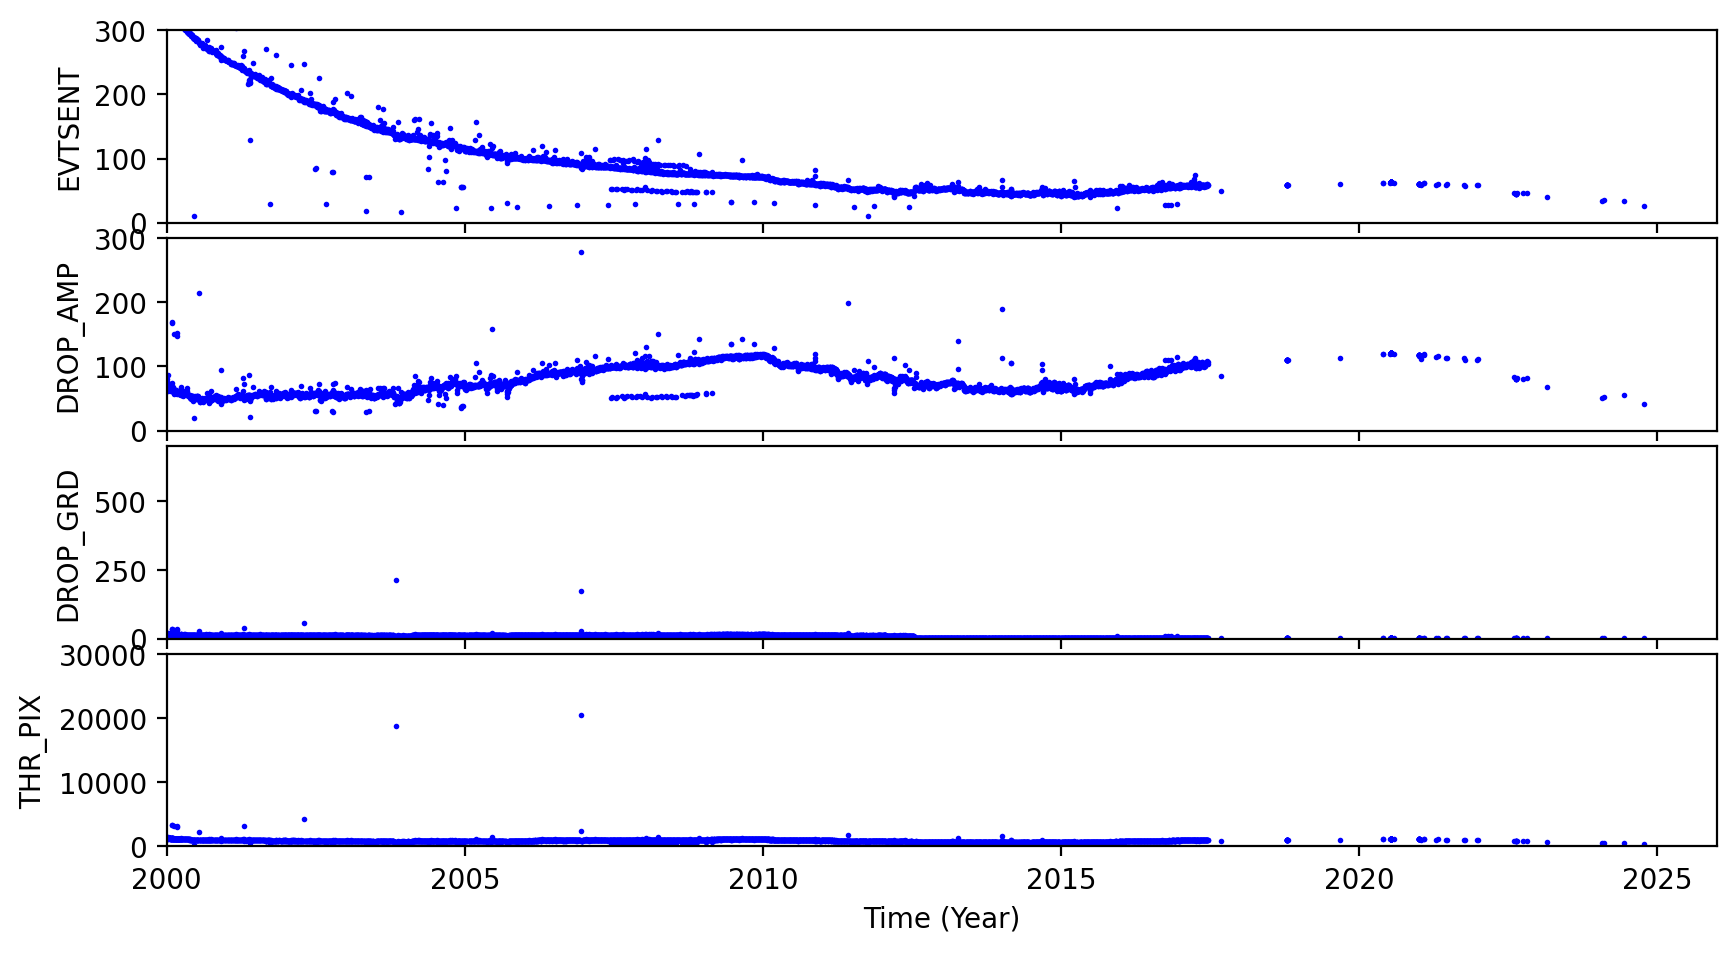
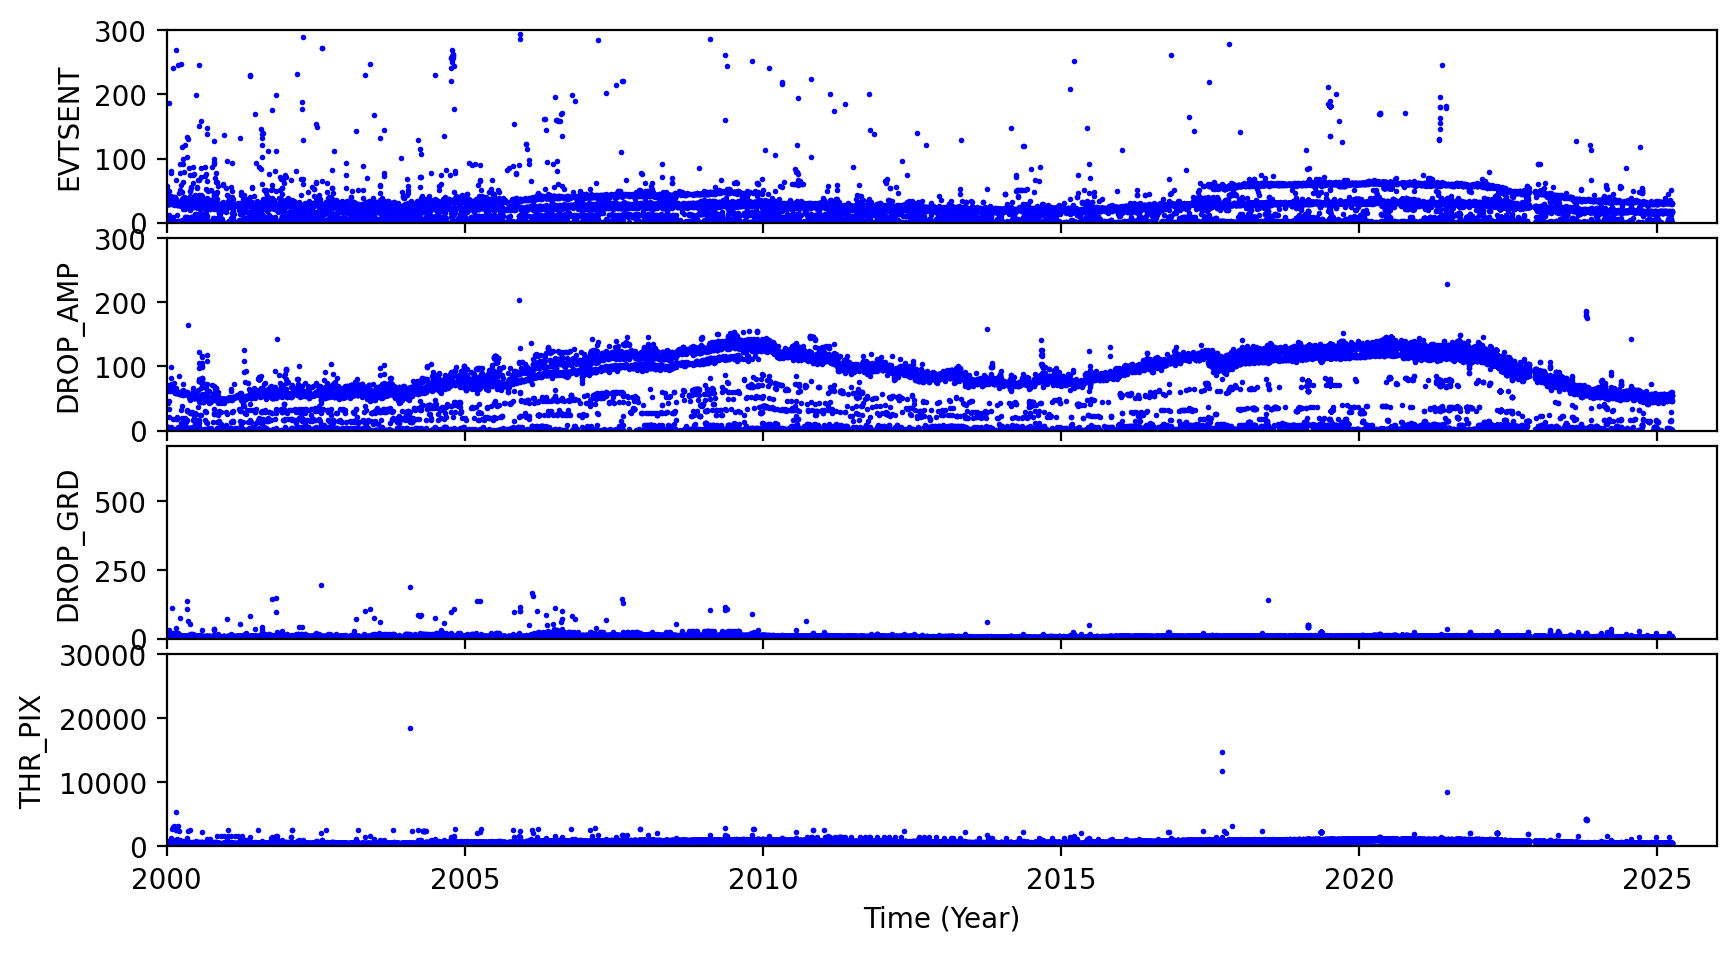
ACIS Rejected Events
The links below are plots of stat1 quantities, showing on-board rejected events. The average EVTSENT, DROP_AMP, DROP_POS, DROP_GRD, THR_PIX, and maximum BERR_SUM obtained from L1 acis*stat1.fits files are plotted for each observation. CTI observations are plotted separately from regular science observations.
Column definitions:
- EVTSENT - number of events sent in data record
- DROP_AMP - number of discarded events due to corrected amplitude
- DROP_POS - number of discarded events due to CCD position
- DROP_GRD - number of discarded events due to grade code
- THR_PIX - number of pixels above respective threshold level
- BERR_SUM - number of pixel bias errors so far in science run
Note the half-life decline of the CTI source is clearly evidenced in the steady janline of EVTSENT.
CCD3 Observations
| CTI | Science |
|
|
|---|
CCD7 Observations
| CTI | Science |
|
|
|---|
ACIS Gain Trends
We computed ACIS gain and offset from ACIS event1 files used in CTI computation, following the step described by C. Grant ACIS gain @ -120C page.
Instead computing gains and offsets from individual observations, we combined all data from each month and computed an monthly averaged gain and offset.
The following plots show CCD3 and CCD5 gains and offset trends.
| CCD 3 | |
)
|
)
|
| CCD 5 | |
)
|
)
|
[an error occurred while processing this directive]
HRC
DOSE of Central 4K Pore-Pairs
Please refer to Maximum Dose Trends for more details.
)
|
|---|
IMAGE                NPIX      MEAN    STDDEV      MIN       MAX
HRCI_03_2025.fits  16777216	0.086 	0.298 	0.000 	7.000
)
IMAGE                       NPIX      MEAN    STDDEV      MIN       MAX
HRCI_08_1999_03_2025.fits  16777216	na	na	na	na
)
|
|---|
IMAGE                NPIX      MEAN    STDDEV      MIN       MAX
HRCS_03_2025.fits  16777216	0.031 	0.200 	0.000 	13.000
)
IMAGE                       NPIX      MEAN    STDDEV      MIN       MAX
HRCS_08_1999_03_2025.fits  16777216	na	na	na	na
|
|
Max dose trend plots corrected for events that "pile-up"
in the center of the taps due to bad position information.
|
)
|
)
|
)
|
)
|
| Dec 2024 | Sep 2024 | Jun 2024 | Mar 2024 |
|---|
)
|
)
|
)
|
)
|
| Dec 2024 | Sep 2024 | Jun 2024 | Mar 2024 |
|---|
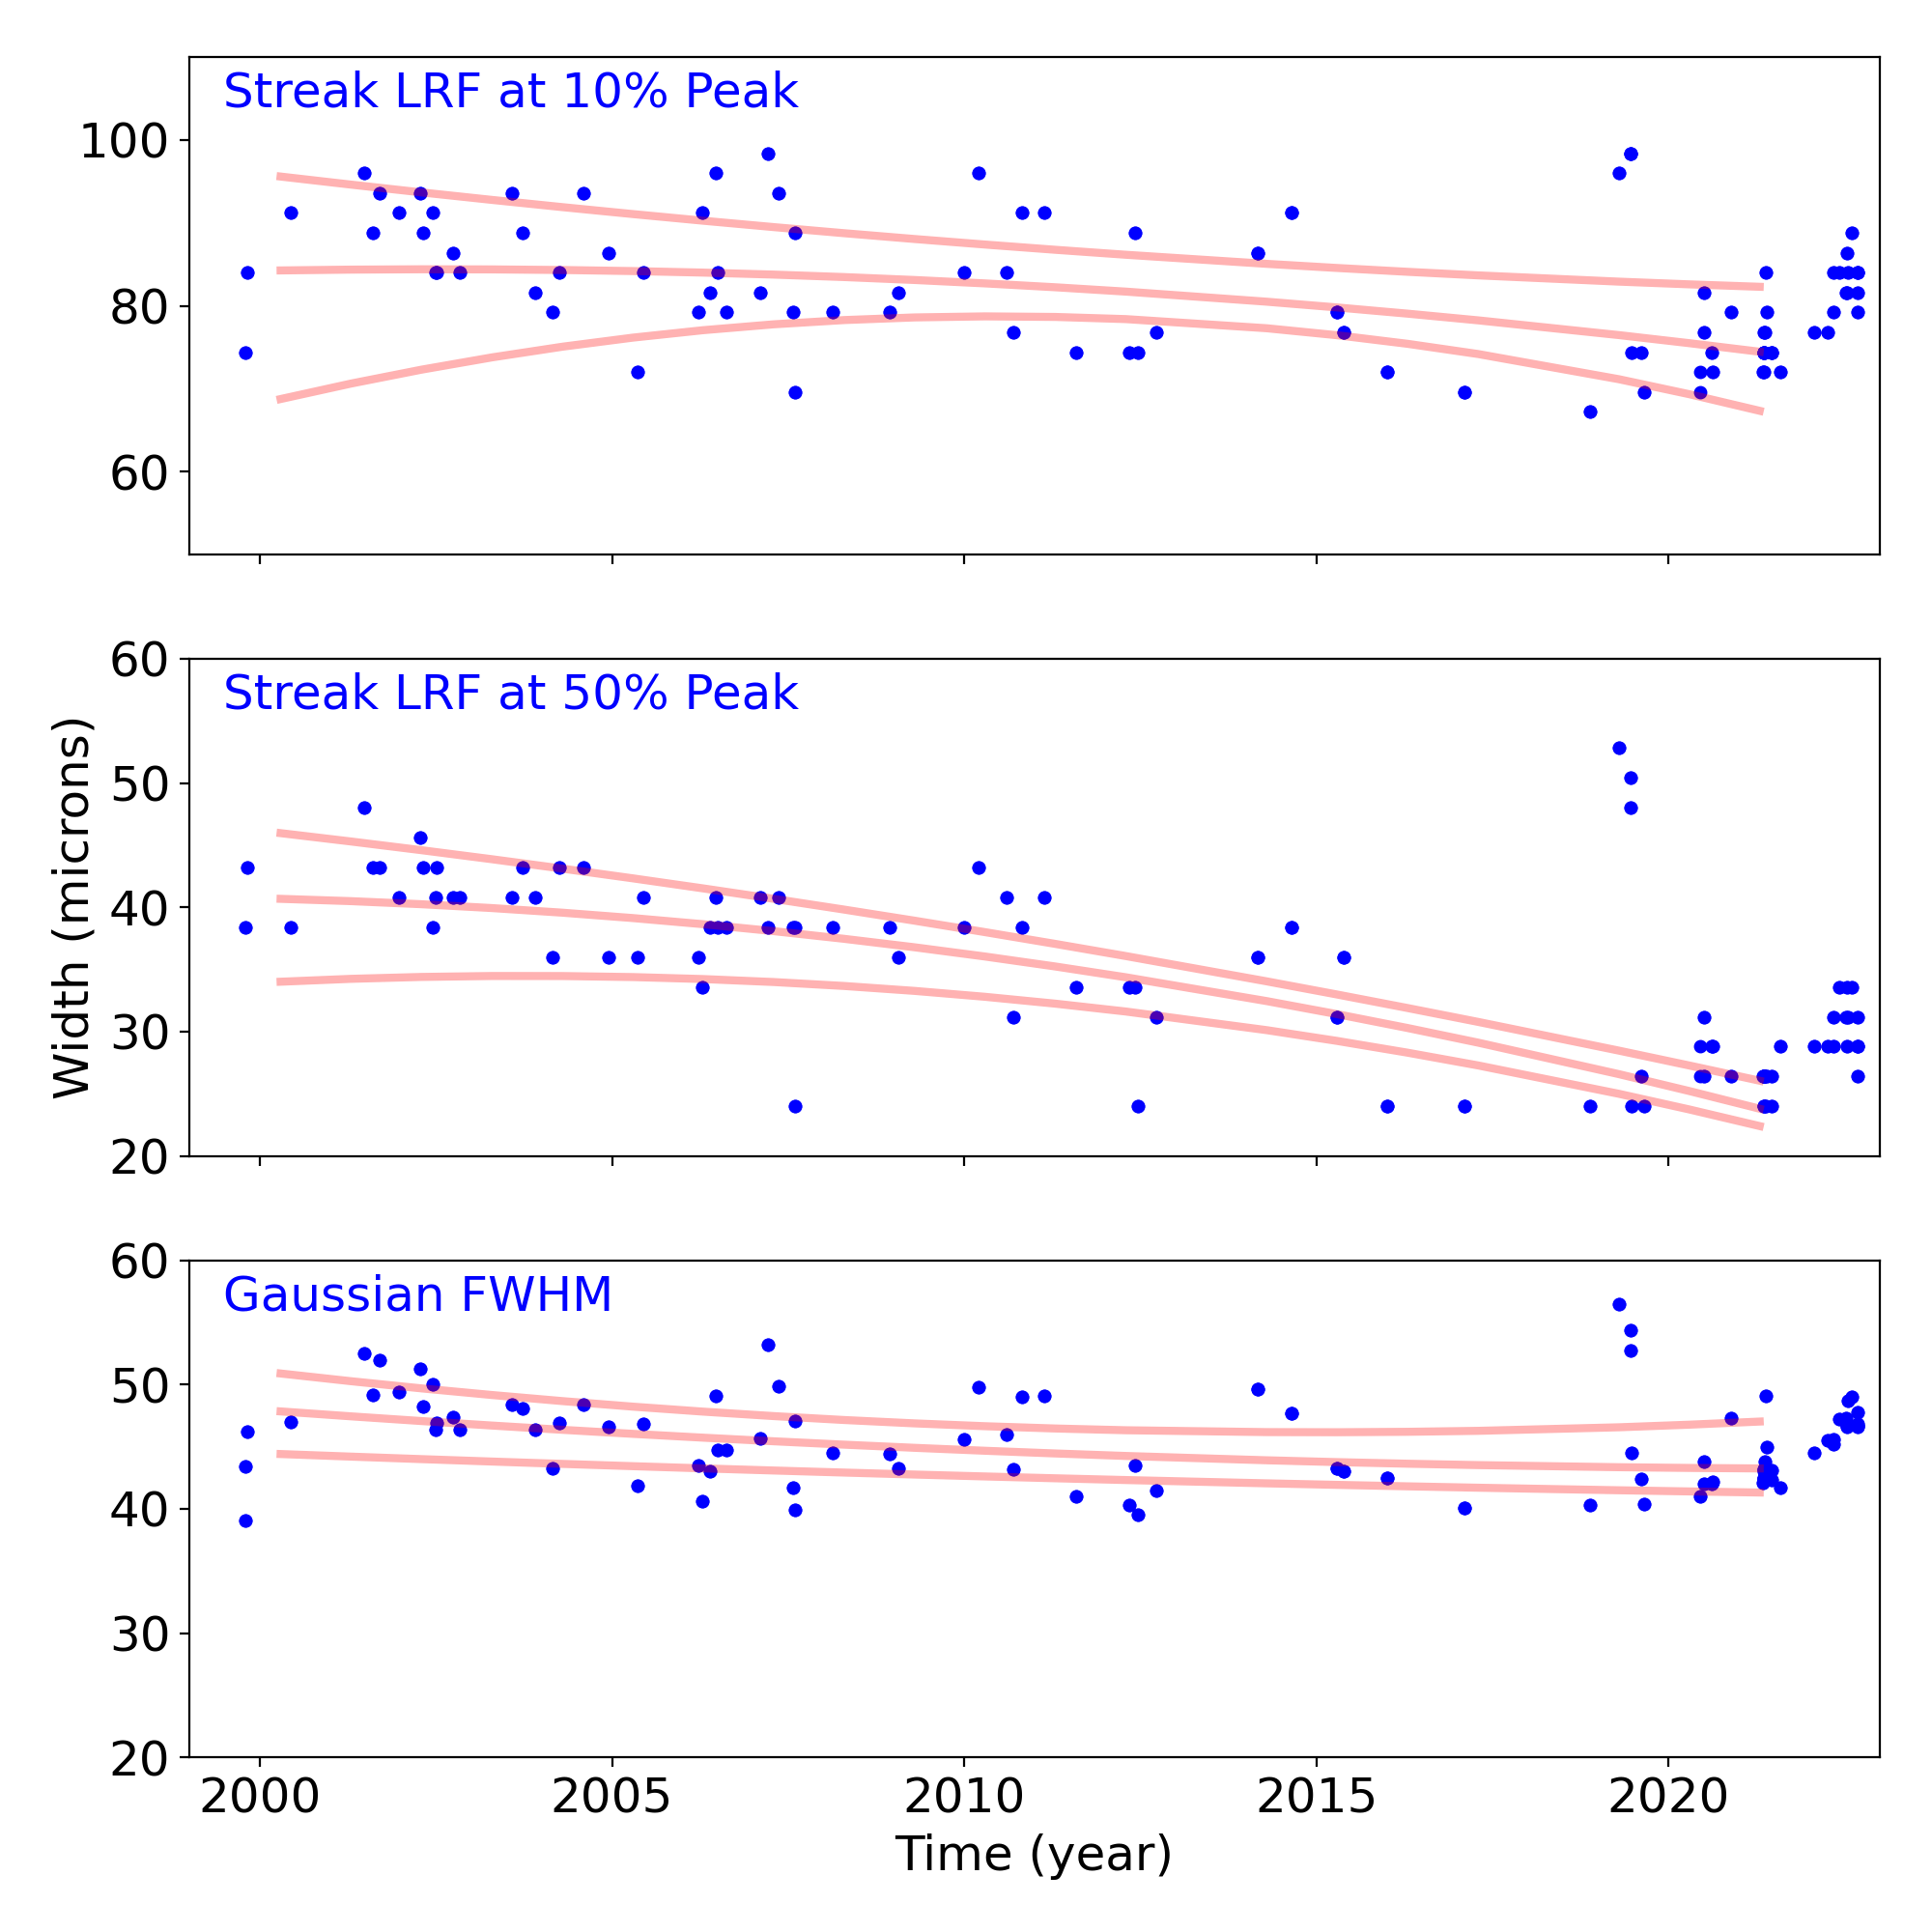
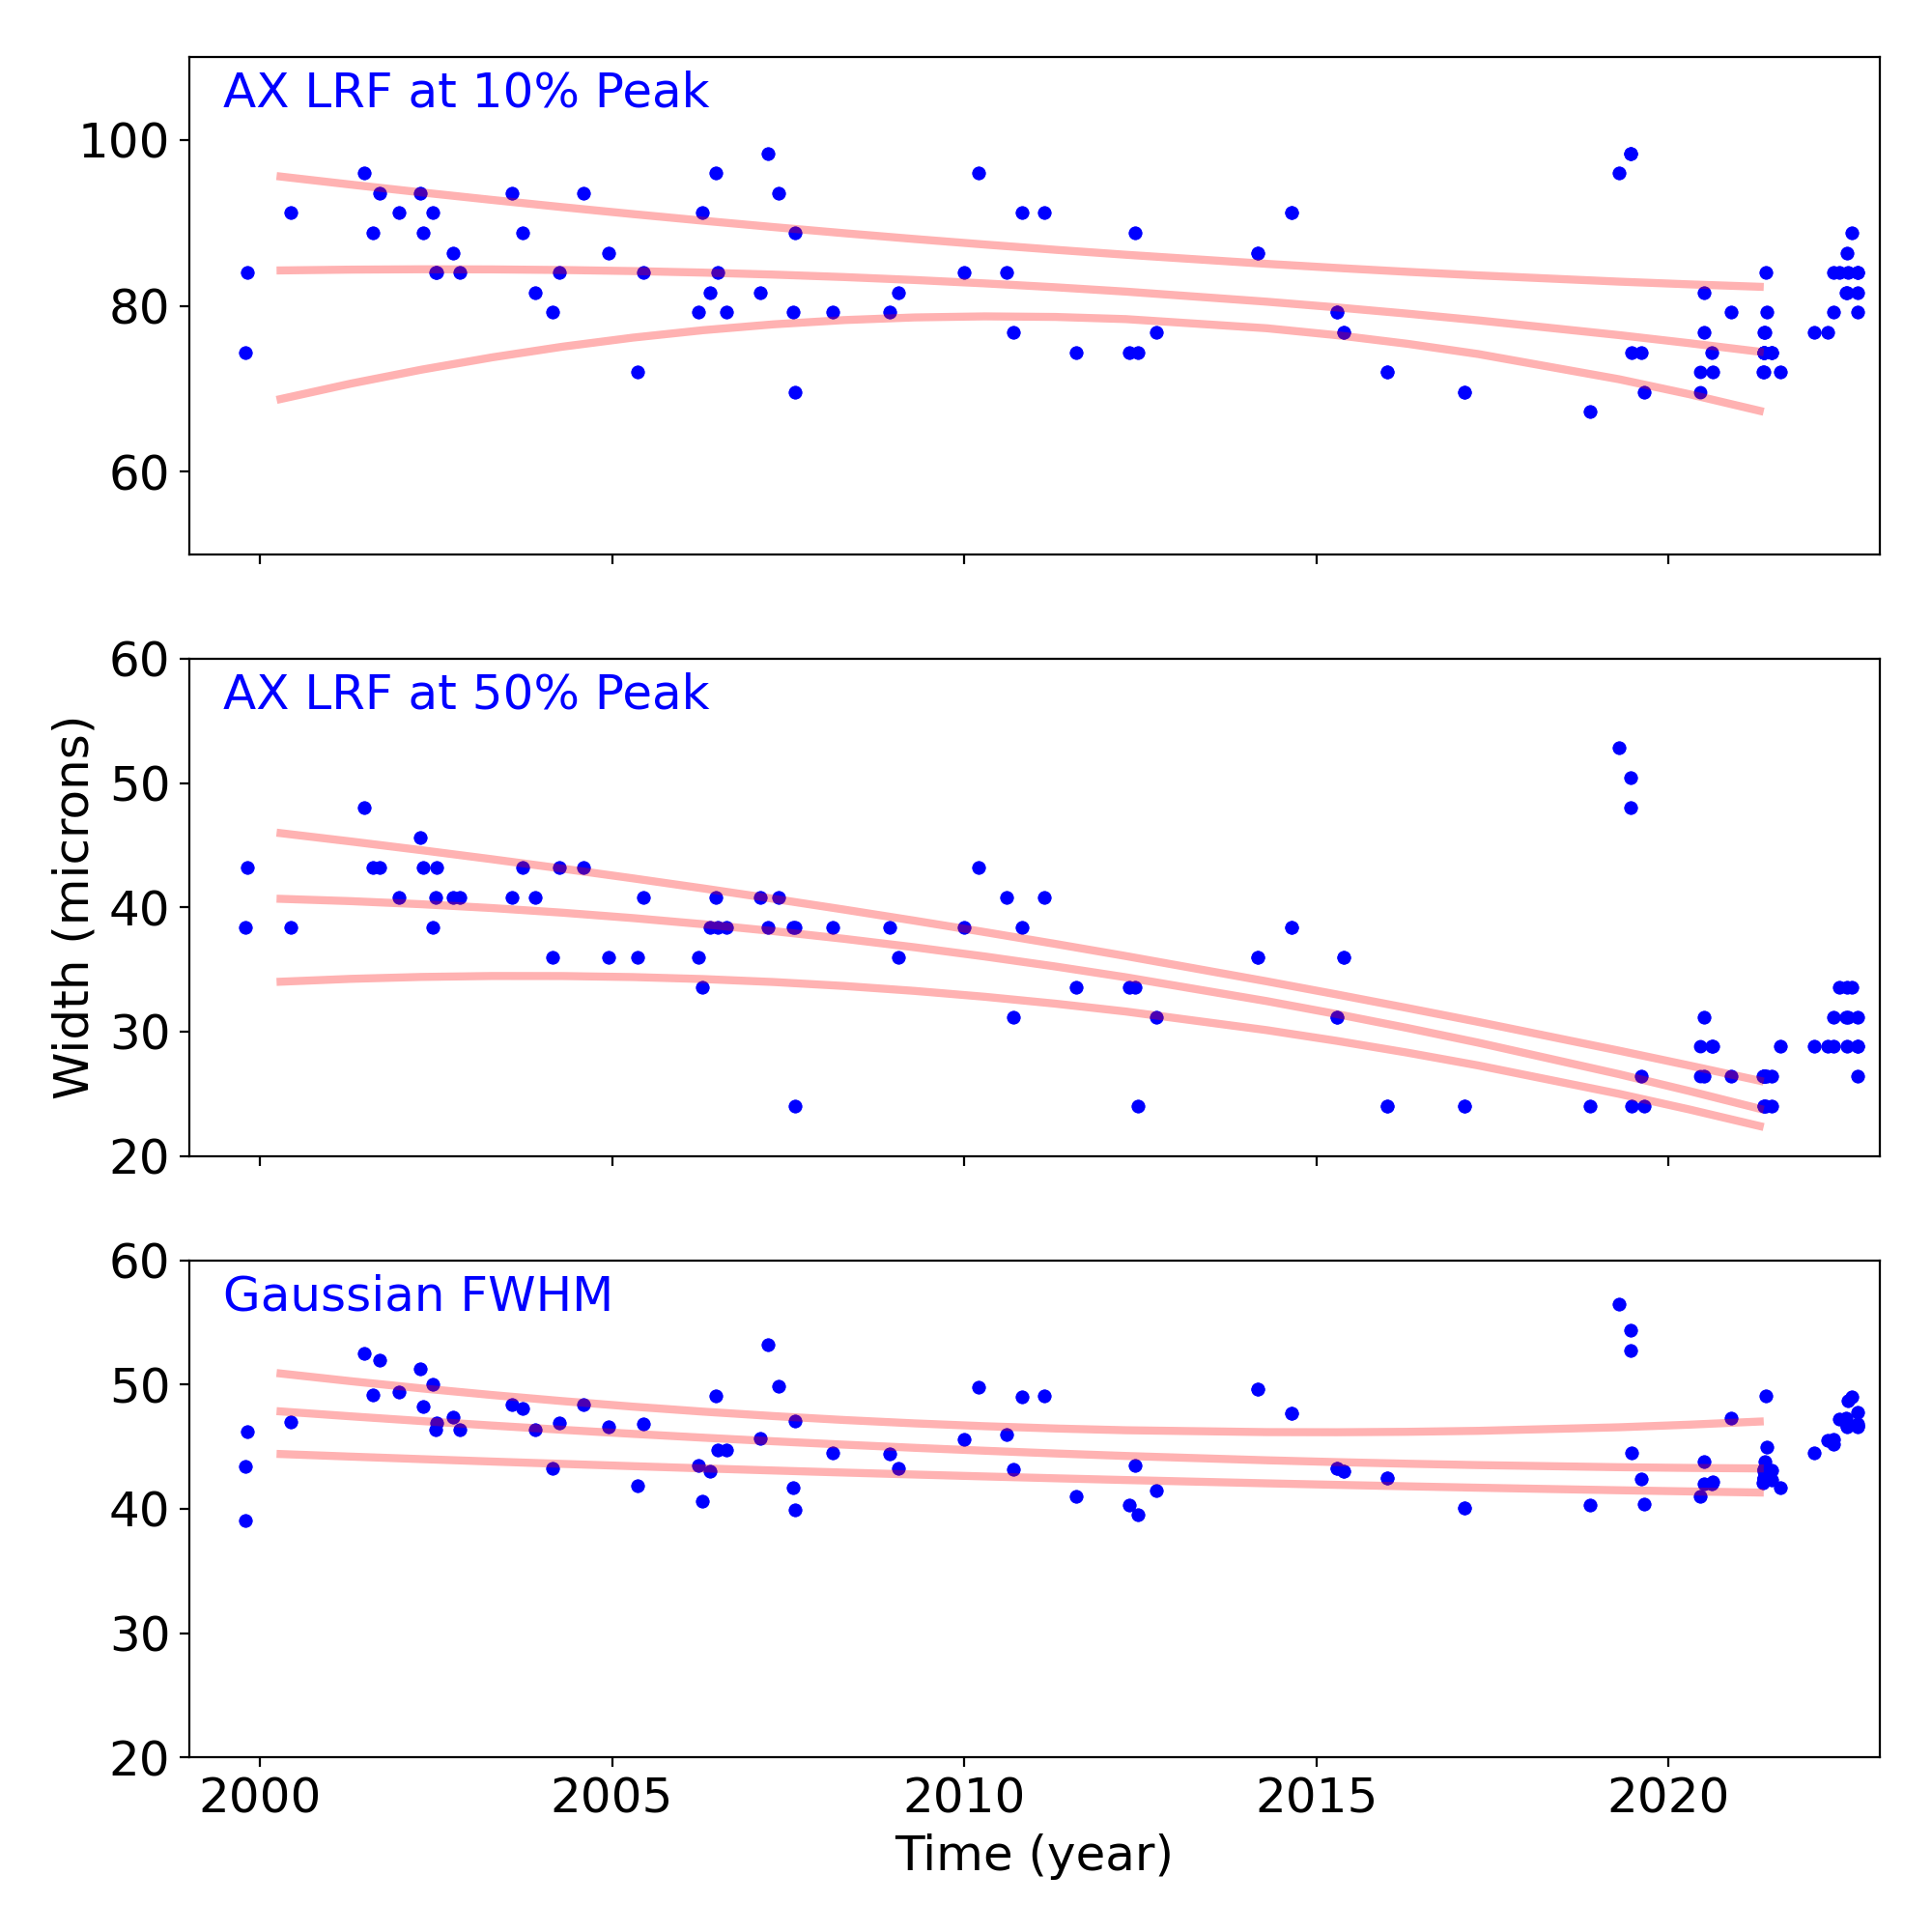
Gratings
Grating Trends/Focus
We plot the width of the zero order streak of ACIS/HETG observations and the width of the zero order image for HRC/LETG observations of point sources. No significant defocusing trend is seen at this time. See Gratings Trends pages.
PCAD
ACA Trending
| ACIS |
)
|
)
|
)
|
|
|---|---|---|---|---|
)
|
)
|
)
| ||
| HRCI |
)
|
)
|
)
|
)
|
| HRCI |
)
|
)
|
)
|
)
|
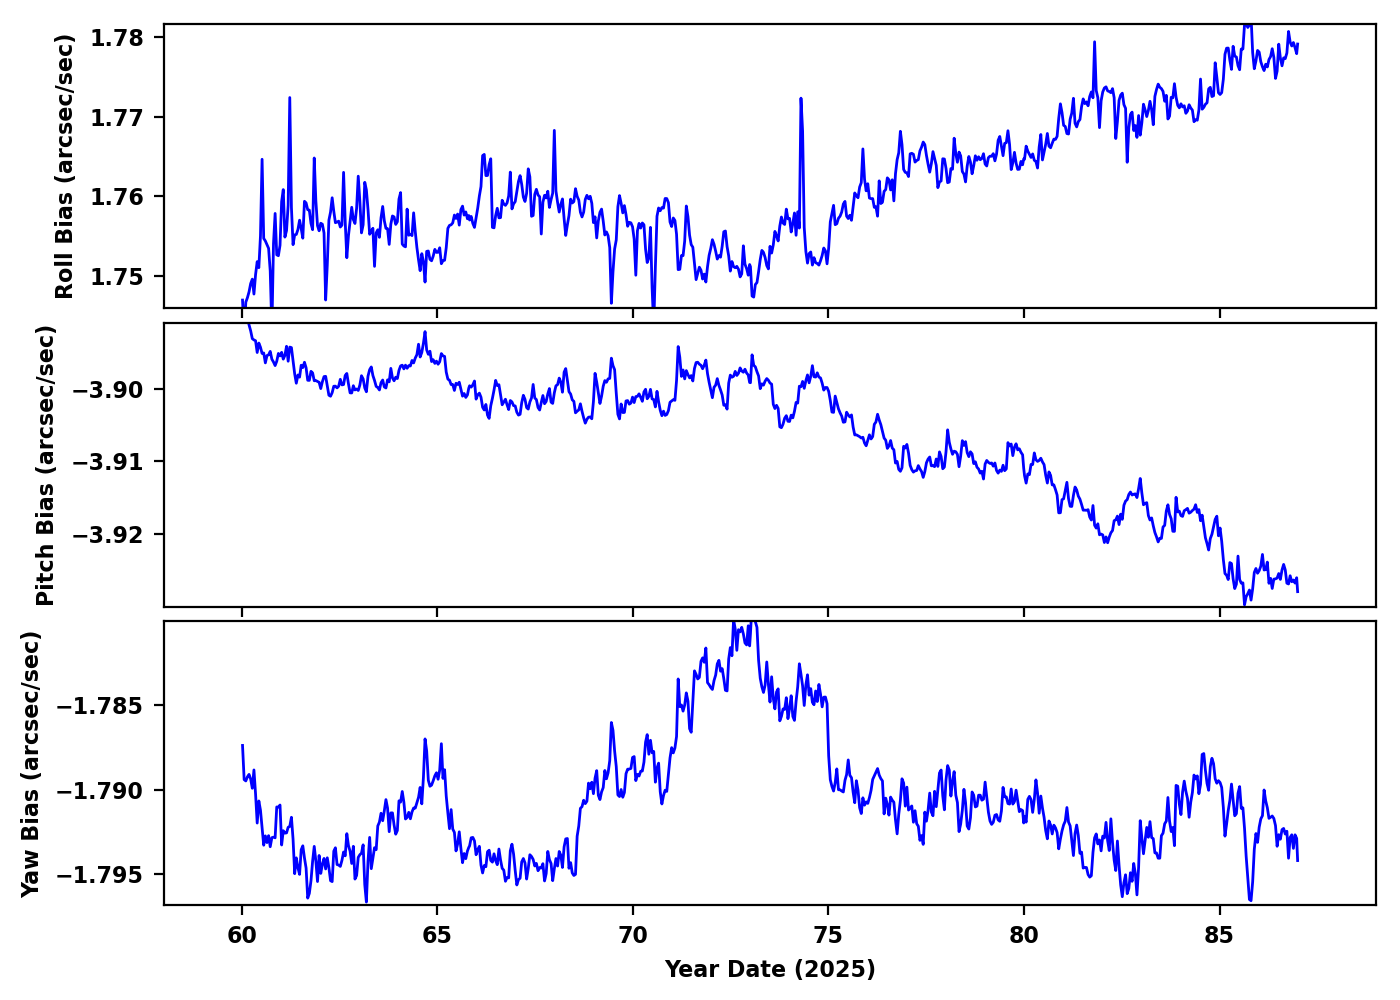
Gyro Bias Drift
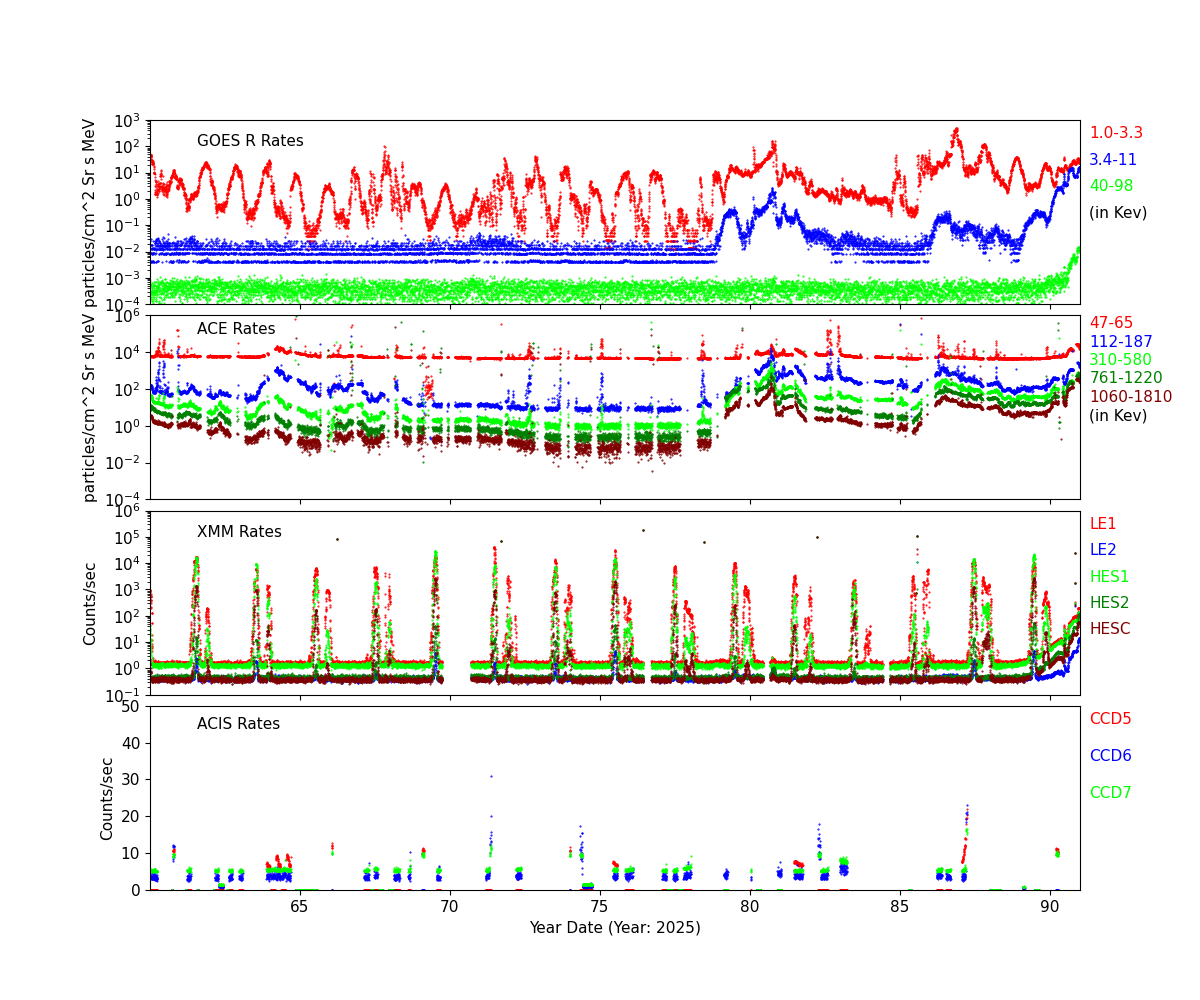
Radiation History
Radiation Count Rates of Mar 2025
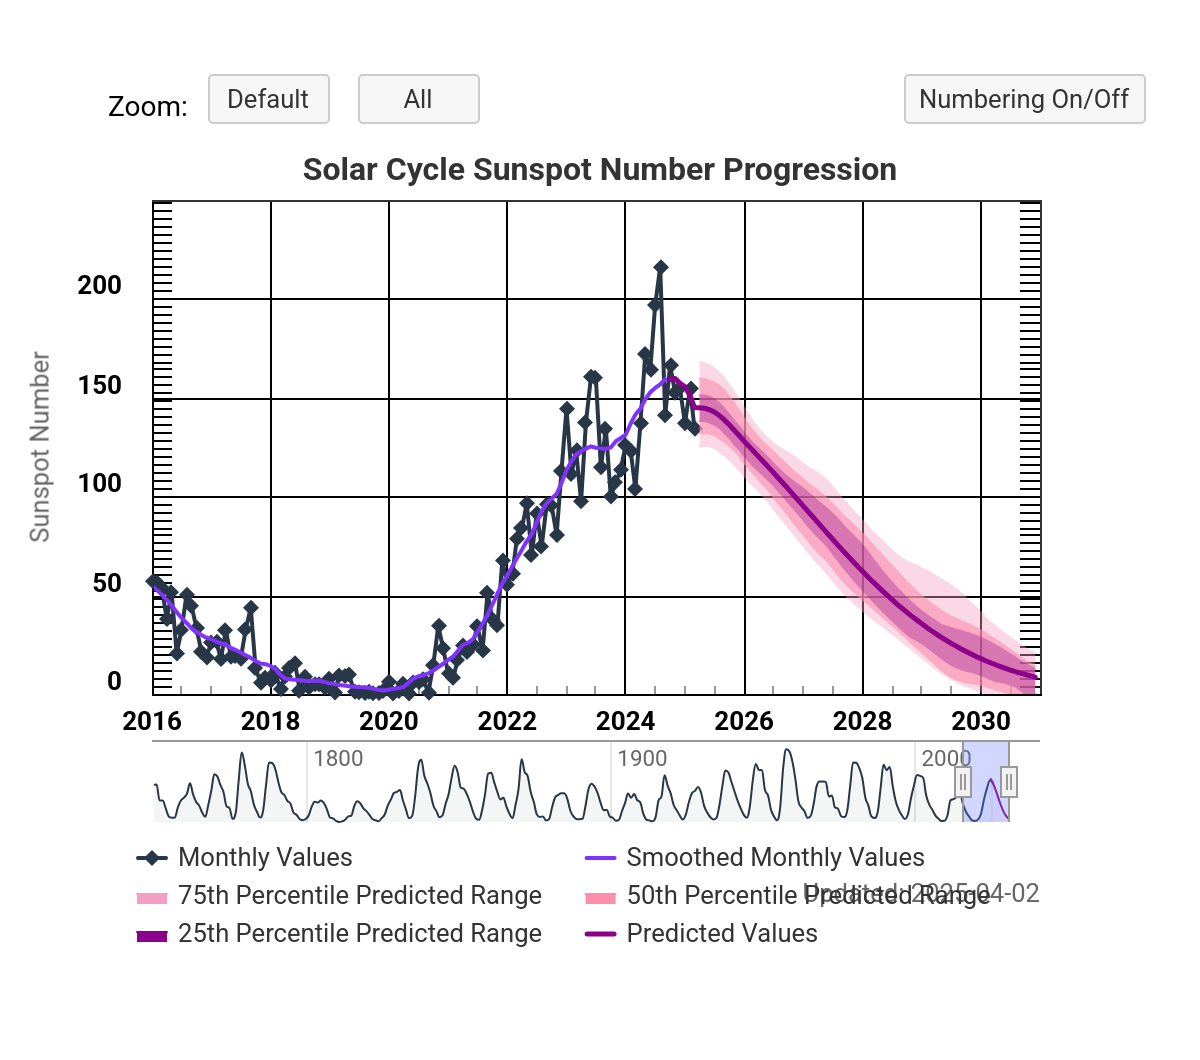
Sun Spot History (See:NOAA Page)
-->
Trending
Critical Trends
| ACIS Temperatures - Daily Maximums | |||||||
|---|---|---|---|---|---|---|---|
| MSID | MEAN | RMS | DELTA/YR | DELTA/YR/YR | UNITS | DESCRIPTION | |
| 1pdeaat | 0.001 | 0.002 | (2.99+/-0.04)e2 | 1.24 +/- 1.33 | K | PSMC DEA PS A TEMP | |
| HRMA Computed Averages - Daily Maximums | |||||||
|---|---|---|---|---|---|---|---|
| MSID | MEAN | RMS | DELTA/YR | DELTA/YR/YR | UNITS | DESCRIPTION | |
| obaavg | -0.014 | 0.001 | (2.98+/-0.02)e2 | -1.27 +/- 0.65 | TEMP | OBA/TFTE | |
| EPHIN Temperatures - Daily Maximums | |||||||
|---|---|---|---|---|---|---|---|
| MSID | MEAN | RMS | DELTA/YR | DELTA/YR/YR | UNITS | DESCRIPTION | |
| teio | 0.026 | 0.009 | (3.30+/-0.22)e2 | 2.97 +/- 3.64 | K | EPHIN ELECTRONICS HOUSING TEMP | |
| tephin | 0.008 | 0.003 | (3.39+/-0.08)e2 | 2.15 +/- 2.13 | K | EPHIN SENSOR HOUSING TEMP | |
| S/C Main Temperatures - Daily Maximums | |||||||
|---|---|---|---|---|---|---|---|
| MSID | MEAN | RMS | DELTA/YR | DELTA/YR/YR | UNITS | DESCRIPTION | |
| tcylfmzm | 0.020 | 0.004 | (3.13+/-0.10)e2 | 1.24 +/- 1.91 | K | CNT CYL TEMP:-Z SIDE UNDER LAE-1 | |
| tcylfmzp | 0.020 | 0.004 | (3.16+/-0.09)e2 | 1.12 +/- 1.75 | K | CNT CYL TEMP:-Z SIDE UNDER LAE-2 | |
| S/C Ancillary Temperatures - Daily Maximums | |||||||
|---|---|---|---|---|---|---|---|
| MSID | MEAN | RMS | DELTA/YR | DELTA/YR/YR | UNITS | DESCRIPTION | |
| tfssbkt1 | 0.015 | 0.012 | (3.50+/-0.29)e2 | 3.75 +/- 4.12 | K | FSS BRAC | |
| tfssbkt2 | 0.017 | 0.013 | (3.45+/-0.29)e2 | 3.80 +/- 4.17 | K | FSS BRAC | |
| tsctsf1 | 0.004 | 0.002 | (3.24+/-0.05)e2 | 0.53 +/- 1.31 | K | SC-TS FITTING -1 TEMP | |
| tsctsf6 | 0.003 | 0.002 | (3.24+/-0.05)e2 | 0.36 +/- 1.36 | K | SC-TS FITTING -6 TEMP | |
| MUPS - Daily Maximums | |||||||
|---|---|---|---|---|---|---|---|
| MSID | MEAN | RMS | DELTA/YR | DELTA/YR/YR | UNITS | DESCRIPTION | |
| pm1thv1t | 0.016 | 0.007 | (3.52+/-0.16)e2 | -1.18 +/- 2.51 | K | MUPS 1 THRUSTER VALVE 01 TEMP | |
| pm2thv1t | 0.063 | 0.022 | (3.18+/-0.51)e2 | 0.41 +/- 7.55 | K | MUPS 2 THRUSTER VALVE 01 TEMP | |
| pm1thv2t | 0.015 | 0.007 | (3.54+/-0.16)e2 | -0.79 +/- 2.65 | K | MUPS 1 THRUSTER VALVE 02 TEMP | |
| pm2thv2t | 0.059 | 0.023 | (3.16+/-0.55)e2 | 1.27 +/- 8.00 | K | MUPS 2 THRUSTER VALVE 02 TEMP | |
| pline02t | 0.023 | 0.005 | (3.36+/-0.12)e2 | 0.78 +/- 2.28 | K | PROP LINE TEMP 02 | |
| pline03t | 0.025 | 0.006 | (3.29+/-0.14)e2 | 0.57 +/- 2.15 | K | PROP LINE TEMP 03 | |
| pline04t | 0.023 | 0.005 | (3.17+/-0.11)e2 | 2.82 +/- 2.29 | K | PROP LINE TEMP 04 | |
Quarterly Trends
- PCAD FTS Temperature and Gradient
| Previous Quarter | |||||||
| MSID | MEAN | RMS | DELTA/YR | DELTA/YR/YR | UNITS | DESCRIPTION | |
| ohrthr27 | 4.531e-04 | 6.225e-05 | (2.97+/-0.00)e2 | -0.00 +/- 0.02 | K | RT 20 : PERISCOPE | |
|---|---|---|---|---|---|---|---|
| ohrthr42 | 0.003 | 3.019e-04 | (2.97+/-0.01)e2 | 0.51 +/- 0.12 | K | RT 133: PERISCOPE | |
| ohrthr43 | 0.003 | 3.296e-04 | (2.97+/-0.01)e2 | 0.43 +/- 0.16 | K | RT 134: PERISCOPE | |
| oobagrd3 | -2.965e-04 | 5.231e-05 | -0.33 +/- 0.12 | 0.02 +/- 0.04 | K | RT 505 TO RT 504: PERISCOPE GRADIENT MONITOR | |
| oobagrd6 | 4.743e-05 | 5.770e-06 | 0.13 +/- 0.01 | 0.01 +/- 0.00 | K | RT 507 TO RT 506: PERISCOPE GRADIENT MONITOR | |
- SIM Temperature
| Previous Quarter | |||||||
| MSID | MEAN | RMS | DELTA/YR | DELTA/YR/YR | UNITS | DESCRIPTION | |
| 3btu_bpt | -0.010 | 0.002 | (2.66+/-0.04)e2 | 0.02 +/- 1.27 | K | BTU BASEPLATE (+X)), ABORT HTR TSC2 | |
|---|---|---|---|---|---|---|---|
| 3tsmxcet | -0.046 | 0.018 | (2.41+/-0.41)e2 | 0.66 +/- 5.09 | K | -X TURTLE SHELL NR HRC CEA | |
| 3tsmxspt | -0.332 | 0.081 | (4.39+/-1.91)e2 | 20.84 +/- 25.54 | K | -X TURTLE SHELL NR ACIS SS | |
- SIIM Electronics
| Previous Quarter | |||||||
| MSID | MEAN | RMS | DELTA/YR | DELTA/YR/YR | UNITS | DESCRIPTION | |
| agrndadc | -3.242e-06 | 5.164e-07 | -(3.83+/-0.93)e-4 | (3.81+/-1.50)e-4 | V | Analog fround A/D convert reading | |
|---|---|---|---|---|---|---|---|
| fatabadc | -2.463e-05 | 2.878e-05 | 4.99 +/- 0.08 | 0.01 +/- 0.00 | V | FA Tab Position Sensor A/D Converter | |
| n15vadc | 4.888e-07 | 1.280e-07 | -15.02 +/- 0.00 | -(2.92+/-7.56)e-5 | V | -15V Power Supply A/D Converter Reading | |
| p15vadc | -3.171e-07 | 1.174e-07 | 14.96 +/- 0.00 | -(4.74+/-10.21)e-5 | V | +15V Power Supply A/D Converter Reading | |
| p5vadc | 3.783e-06 | 7.379e-07 | 4.94 +/- 0.00 | (7.42+/-5.60)e-4 | V | +5V Power Supply A/D Converter Reading | |
| tsctabadc | -1.713e-04 | 0.001 | 4.97 +/- 0.17 | 0.14 +/- 0.17 | V | TSC Tab Position Sensor A/D converter | |
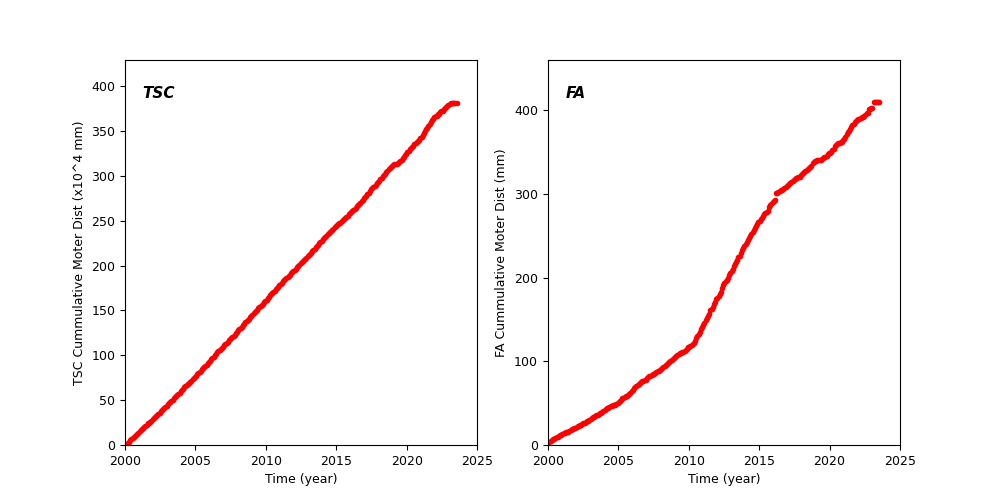
Spacecraft Motions
TSC and FA Cummulative Moter Distance
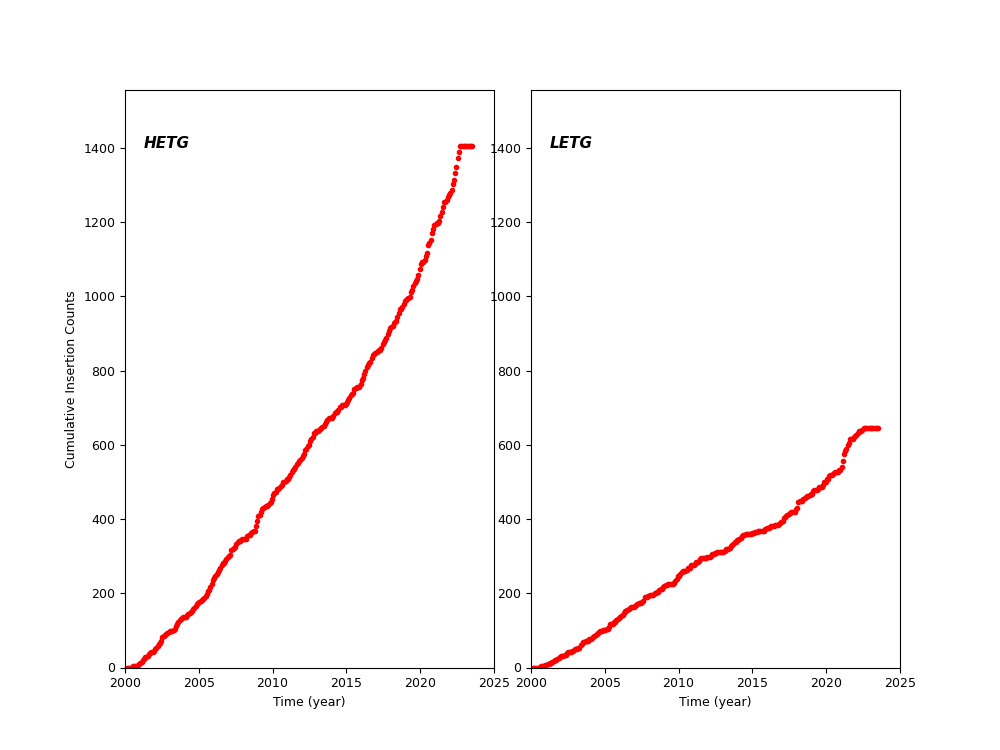
HETG and LETG Cummulative Insertion Counts
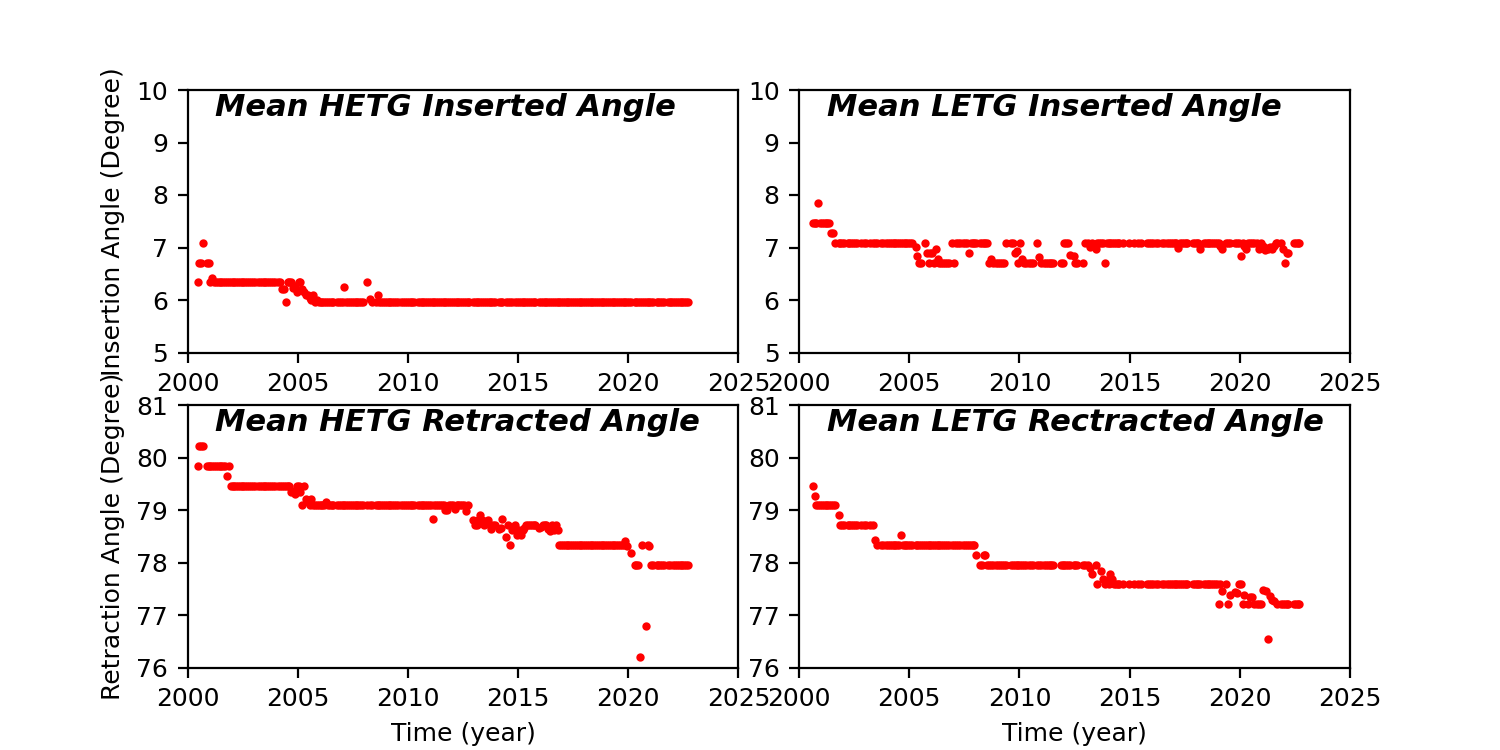
HETG/LETG Insertion/Retraction Angle
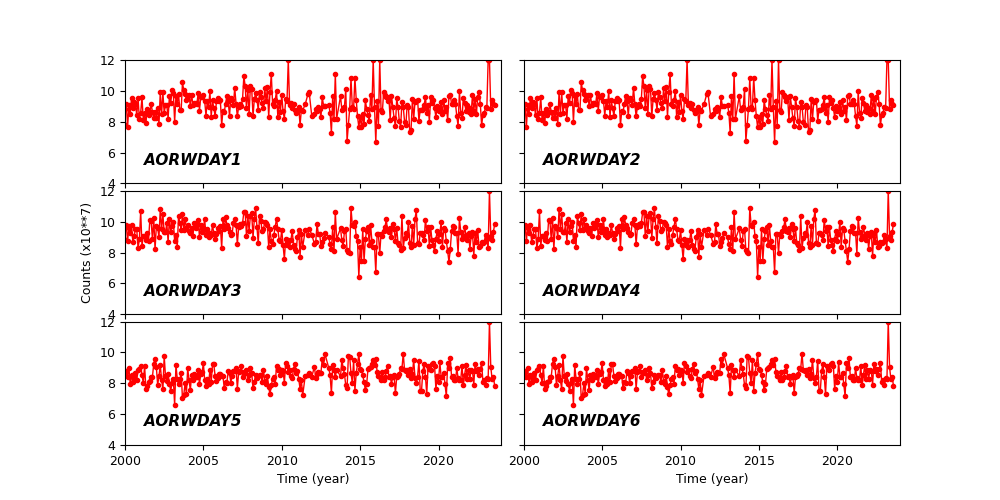
Reaction Wheel Rotations