ACIS
ACIS DOSE Registered-Photon-Map
The steps we took to compute the dose map are;
- Level 1 Event files for a specified month are obtained from archive.
- Image data including I2, I3, S2, S3 CCDs are extracted from all event files.
- All the extracted image data were merged to create a month long exposure map for the month.
- The exposure map is opened with ds9, and check a distribution of count rates against energy. From this, estimate the upper threshold value. Any events beyond this upper threshold are assumed erroneous events such as bad pixels.
- Using this upper threshold, the data is filtered, and create a cleaned exposure map for the month.
- The exposure map from each month from the Sep 1999 is added up to create a cumulative exposure map for each month.
- Using fimgstatistic, we compute count rate statistics for each CCDs.
- For observations with high data drop rates (e.g., Crab nebula, Cas A), we corrected the observations by adding events.
Please check more detail plots at Telemetered Photon Dose Trend page.
)
)
)
Statistics:
# IMAGE     NPIX     MEAN        RMS        MIN     MAX
ACIS_oct25 6004901       4.296         6.075           0.0     2524


I2 node 0  262654	4.037679	2.325214	0.0	160.0
I2 node 1  262654	5.081691	2.784149	0.0	 93.0
I2 node 2  262654	5.825274	3.376268	0.0	 94.0
I2 node 3  262654	4.571972	4.558279	0.0	1760.0

I3 node 0  262654	4.984115	2.679160	0.0	 86.0
I3 node 1  262654	4.967393	2.621744	0.0	120.0
I3 node 2  262654	4.794093	2.549912	0.0	 72.0
I3 node 3  262654	4.725959	3.892431	0.0	1513.0

S2 node 0  262654	4.857380	6.774301	0.0	2524.0
S2 node 1  262654	5.309275	4.543634	0.0	590.0
S2 node 2  262654	5.826827	6.827510	0.0	2090.0
S2 node 3  262654	5.384052	5.703682	0.0	815.0

S3 node 0  262654	7.318428	6.989248	0.0	215.0
S3 node 1  262654	8.413095	6.945337	0.0	132.0
S3 node 2  262654	8.855959	8.168182	0.0	173.0
S3 node 3  262654	7.382217	7.581267	0.0	229.0
)
)
)
Statistics:
 IMAGE     NPIX      MEAN        RMS           MIN      MAX
ACIS_total   6004901       2751.861         3473.040           0.0   169725


I2 node 0  262654	2390.086209	486.014467	511.0	16041.0
I2 node 1  262654	2521.988142	712.626901	522.0	167719.0
I2 node 2  262654	2549.318489	541.839160	547.0	17790.0
I2 node 3  262654	2552.345024	664.127744	505.0	37595.0

I3 node 0  262654	2759.215660	686.595866	506.0	15530.0
I3 node 1  262654	2837.803331	1758.883041	531.0	56084.0
I3 node 2  262654	2544.987590	478.142527	498.0	15614.0
I3 node 3  262654	2520.420621	515.232434	477.0	36710.0

S2 node 0  262654	3211.268953	519.637702	1730.0	22672.0
S2 node 1  262654	3411.973775	780.225831	1905.0	21860.0
S2 node 2  262654	3783.907464	784.172588	2320.0	34132.0
S2 node 3  262654	3740.559605	642.742813	2041.0	88477.0

S3 node 0  262654	5687.683364	3074.526653	2501.0	55564.0
S3 node 1  262654	6904.756544	2410.277468	0.0	83602.0
S3 node 2  262654	5639.193777	1383.730810	2659.0	27726.0
S3 node 3  262654	4437.974949	784.340178	2664.0	26821.0
)
|
)
|
)
|
)
|
| Jul 2025 | Apr 2025 | Jan 2025 | Oct 2024 |
|---|
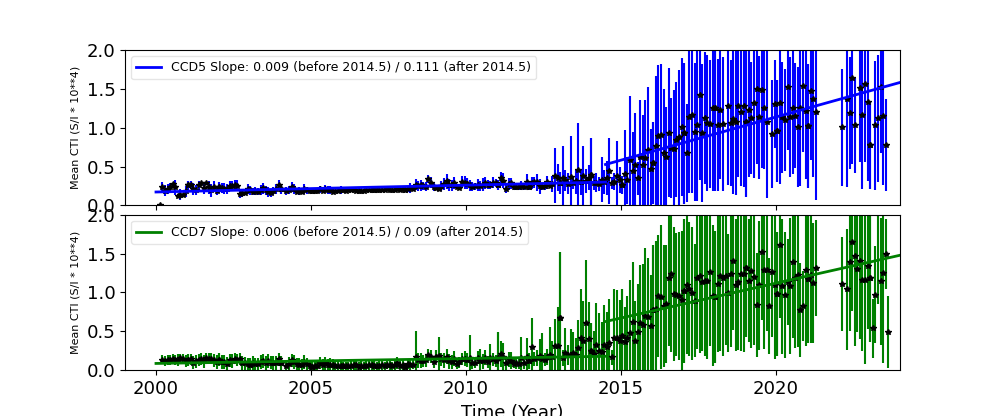
The Mean Detrended CTI
We report CTIs with a refined data definition. CTIs were computed for the temperature dependency corrected data. Please see CTI page for detailed explanation. CTI's are computed for Mn K alpha, and defined as slope/intercept x10^4 of row # vs ADU. Data file: here
Imaging CCDs
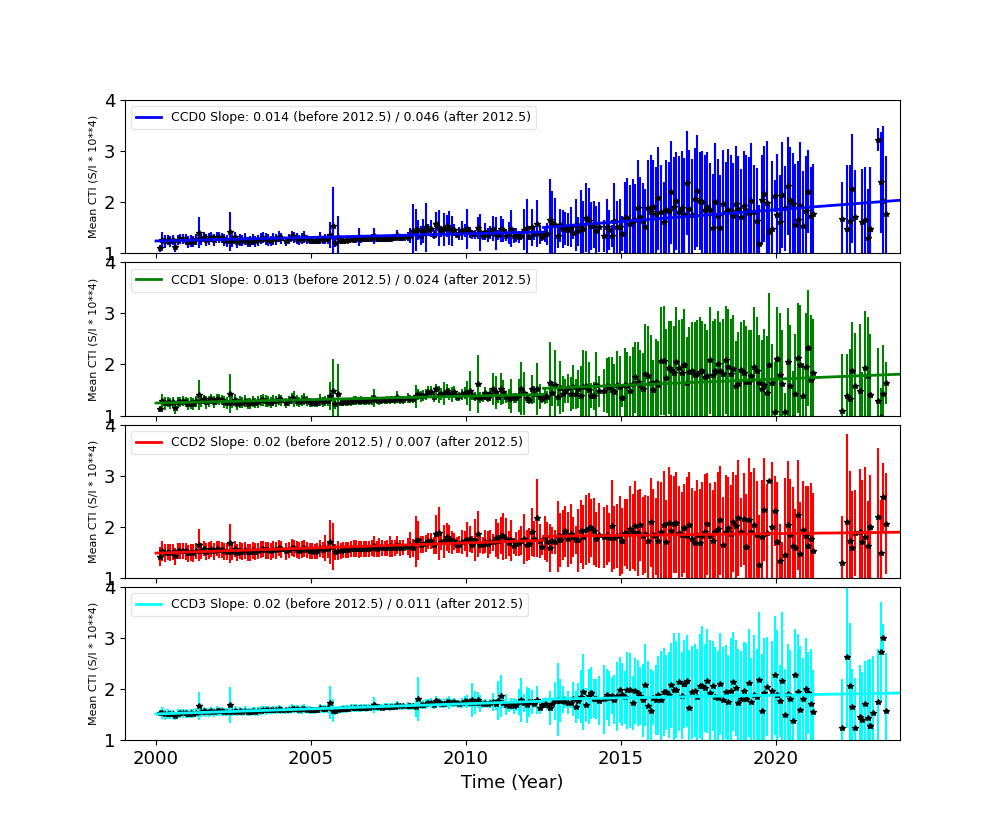
Spectral CCDs
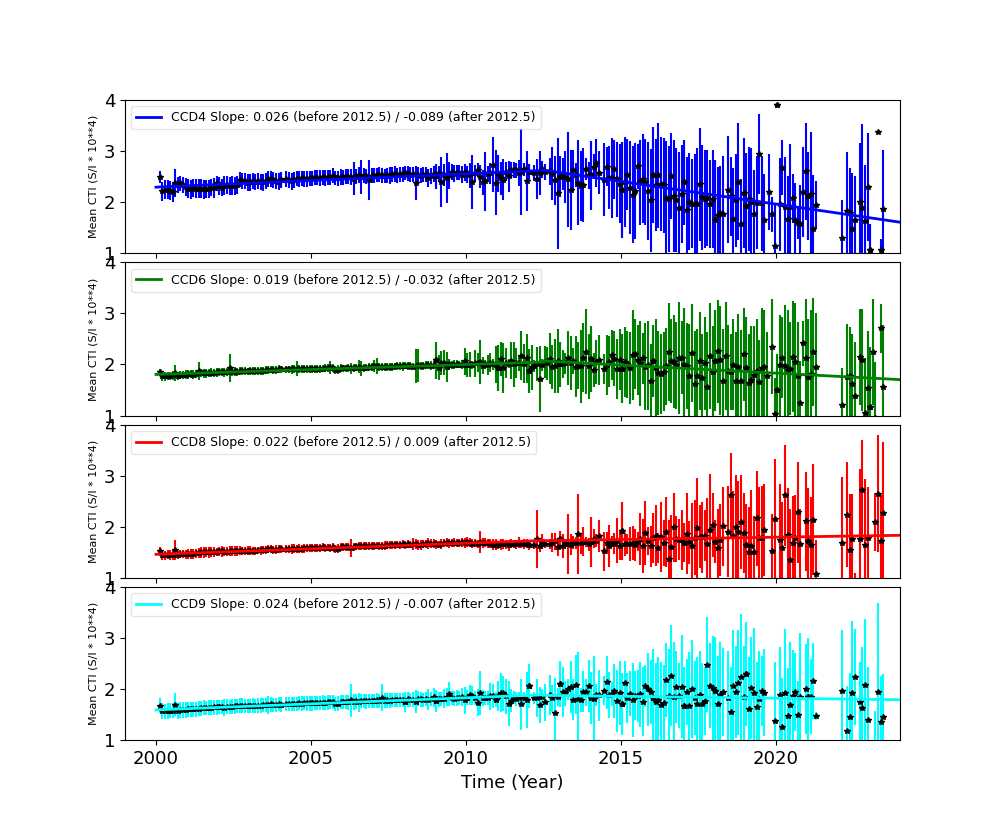
Backside CCDs
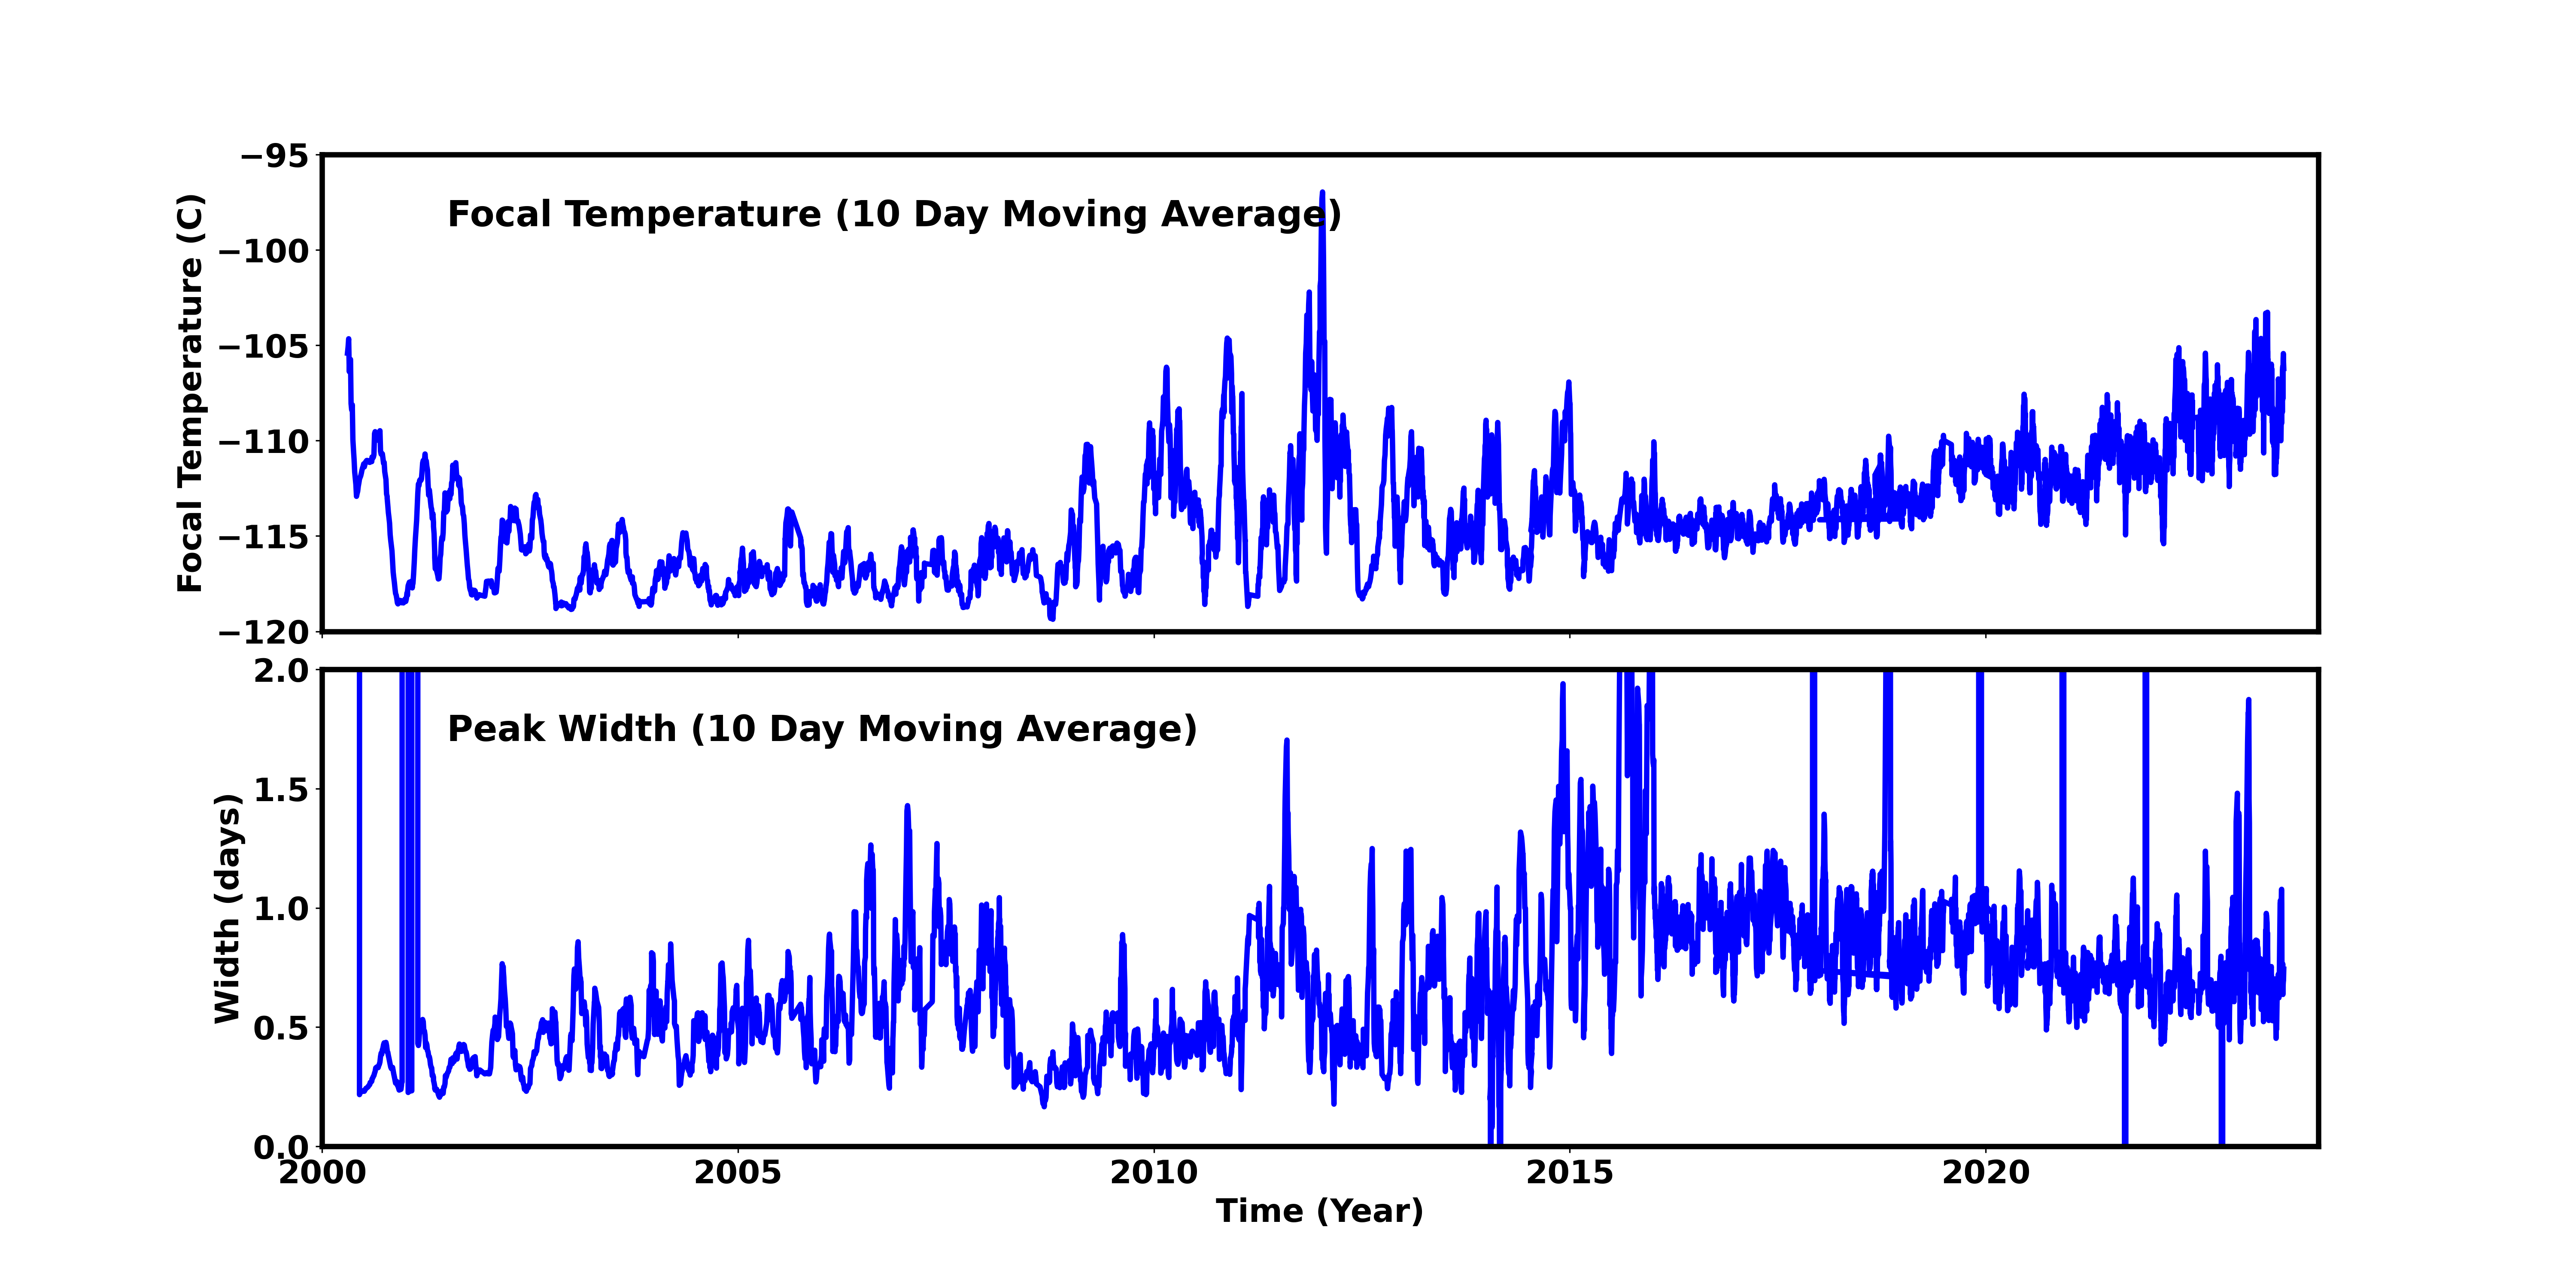
Focal Plane Temperature
Oct 2025 Focal Temperature
| The Mean (max) FPT: | |
|---|---|
| -107.53 | +/- 7.69 C |
| Mean Width: | |
| 0.8 | +/- 0.58 days |
Averaged Focal Plane Temperature
We are using 10 period moving averages to show trends of peak temperatures and peak widths. Note, the gaps in the width plot are due to missing/corrupted data.
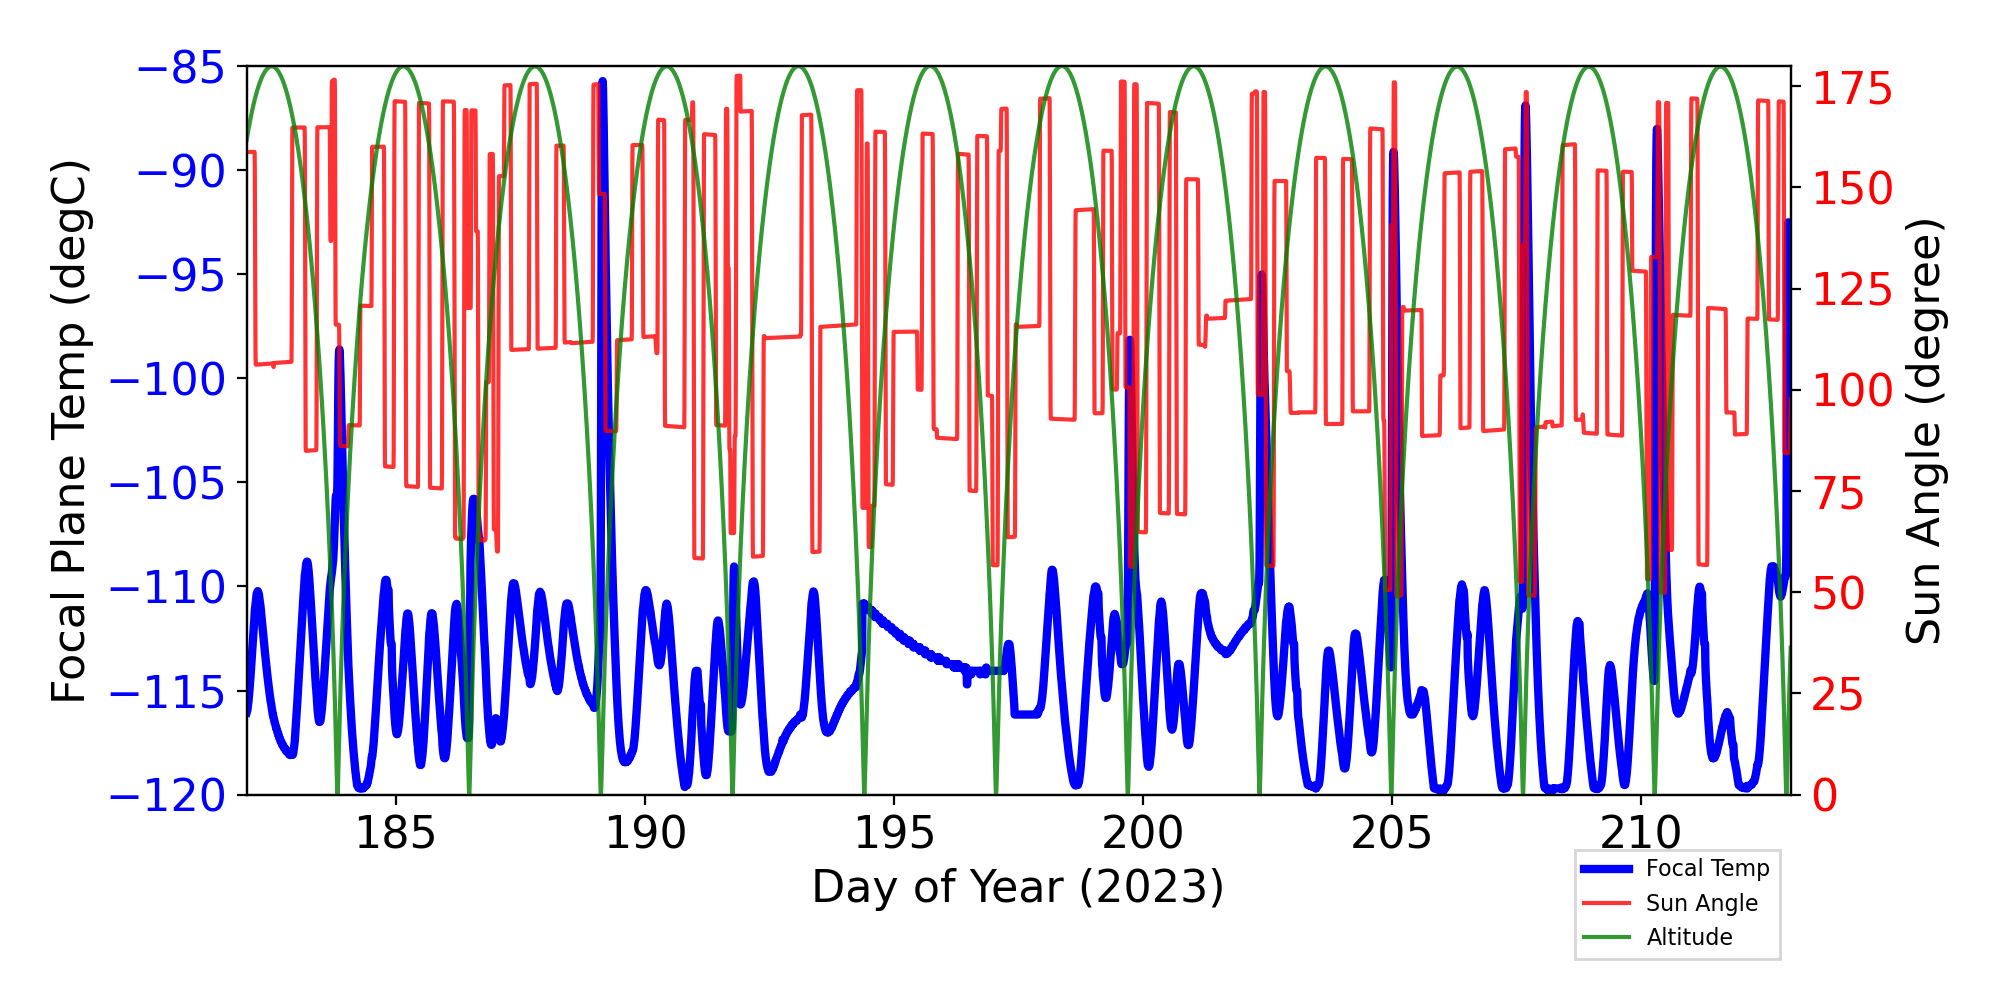
Focal Plane Temperature, Sun Angle and Altitude
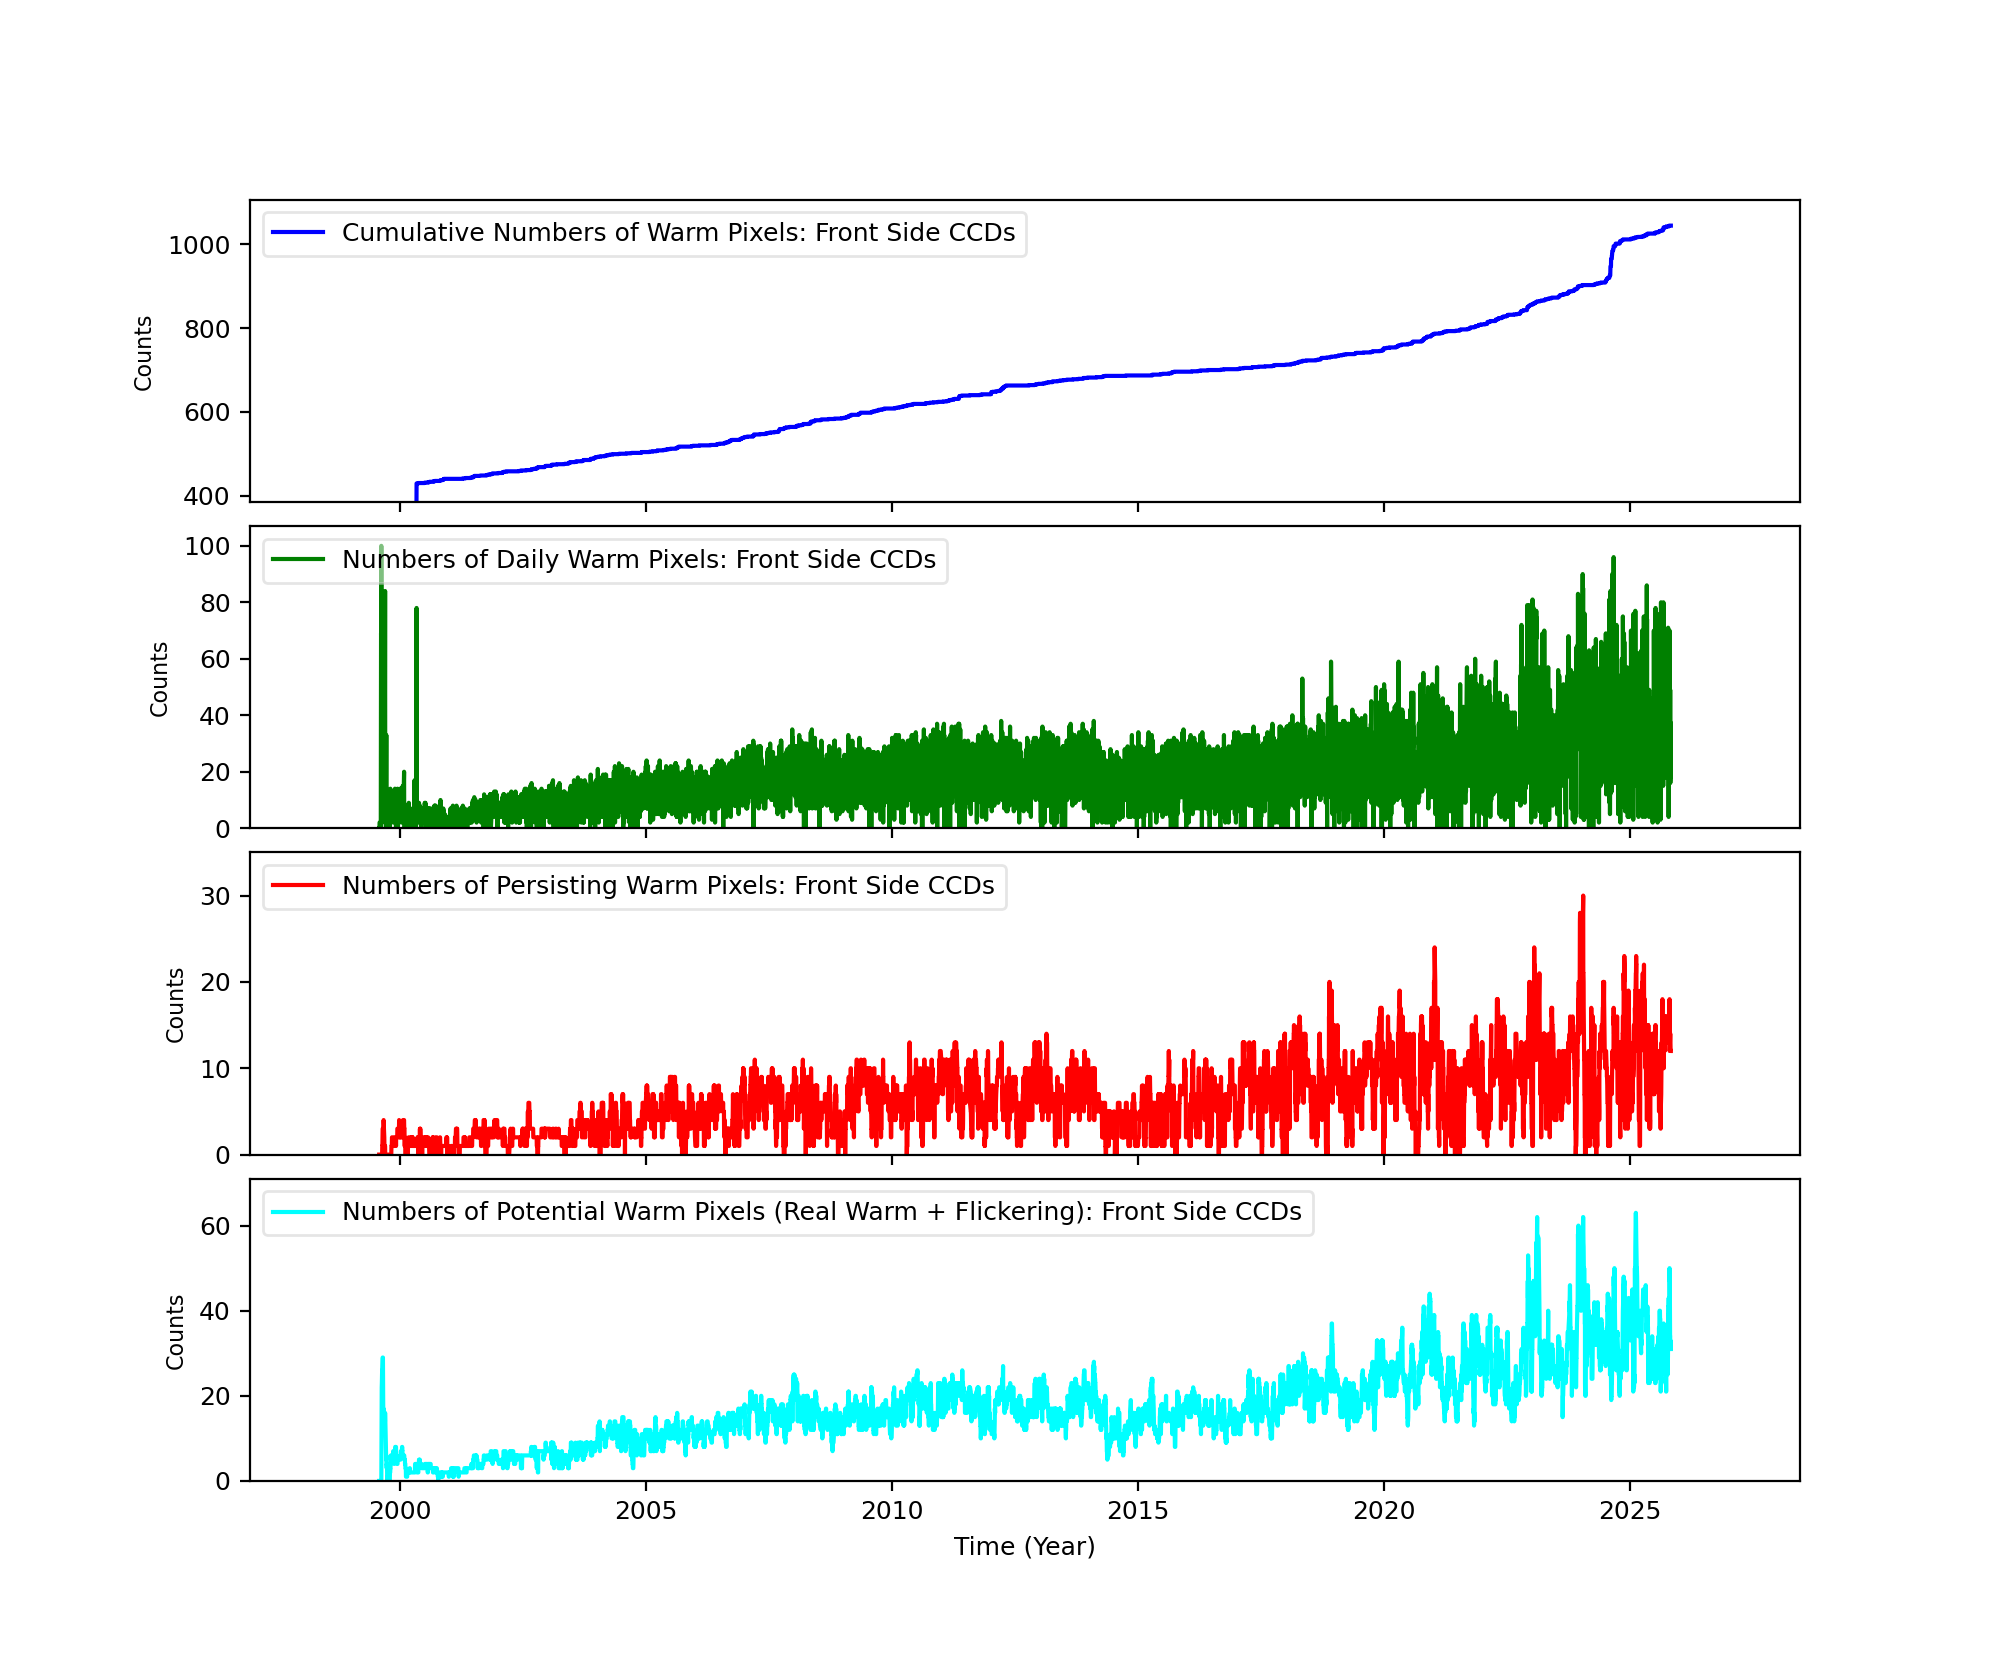
Bad Pixels
The plots below were generated with a new warm pixel finding script. Please see Acis Bad Pixel Page for details.
Front Side CCDs
Back Side CCD (CCD5)

Science Instrument Background Rates
| Name | Low (keV) | High(KeV) | Description |
|---|---|---|---|
| SSoft | 0.00 | 0.50 | Super soft photons |
| Soft | 0.50 | 1.00 | Soft photons |
| Med | 1.00 | 3.00 | Moderate energy photons |
| Hard | 3.00 | 5.00 | Hard Photons |
| Harder | 5.00 | 10.00 | Very Hard photons |
| Hardest | 10.00 | Beyond 10 keV |


HRC
DOSE of Central 4K Pore-Pairs
Please refer to Maximum Dose Trends for more details.
)
|
|---|
IMAGE                NPIX      MEAN    STDDEV      MIN       MAX
HRCI_10_2025.fits  16777216	0.001 	0.026 	0.000 	1.000
)
IMAGE                       NPIX      MEAN    STDDEV      MIN       MAX
HRCI_08_1999_10_2025.fits  16777216	na	na	na	na
)
|
|---|
IMAGE                NPIX      MEAN    STDDEV      MIN       MAX
HRCS_10_2025.fits  16777216	0.009 	0.098 	0.000 	3.000
)
IMAGE                       NPIX      MEAN    STDDEV      MIN       MAX
HRCS_08_1999_10_2025.fits  16777216	na	na	na	na
|
|
Max dose trend plots corrected for events that "pile-up"
in the center of the taps due to bad position information.
|
)
|
)
|
)
|
)
|
| Jul 2025 | Apr 2025 | Jan 2025 | Oct 2024 |
|---|
)
|
)
|
)
|
)
|
| Jul 2025 | Apr 2025 | Jan 2025 | Oct 2024 |
|---|
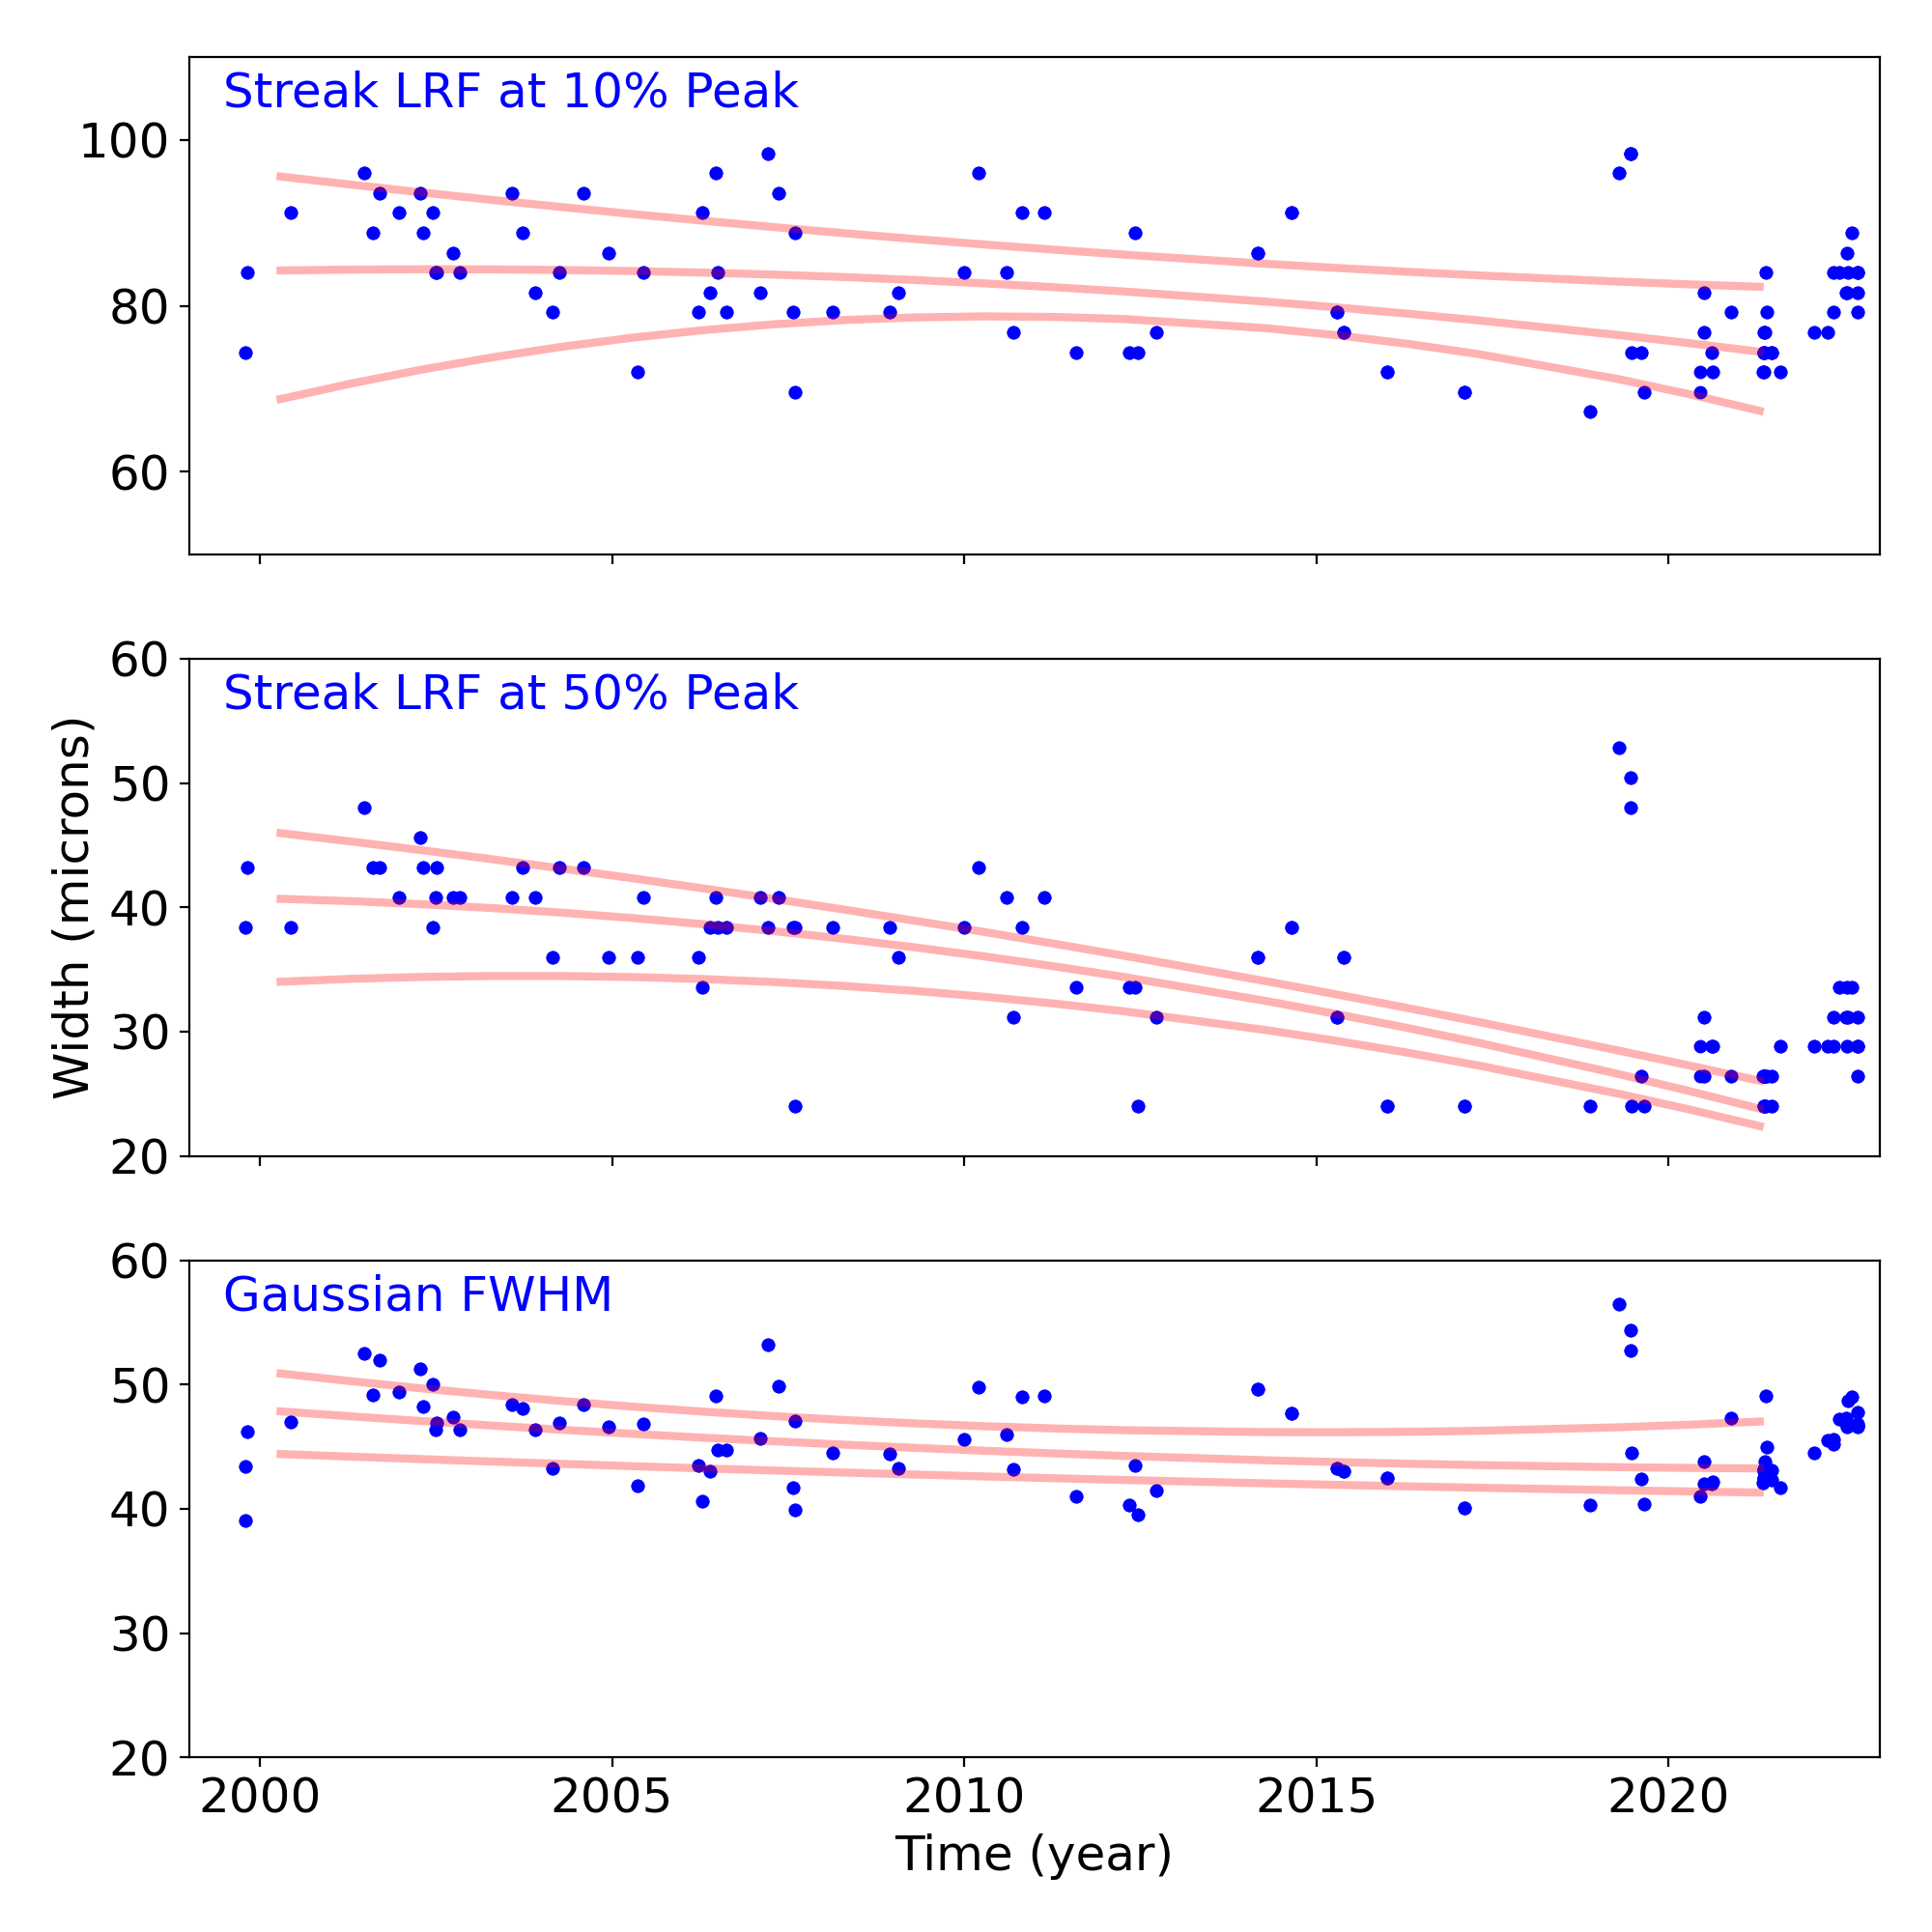
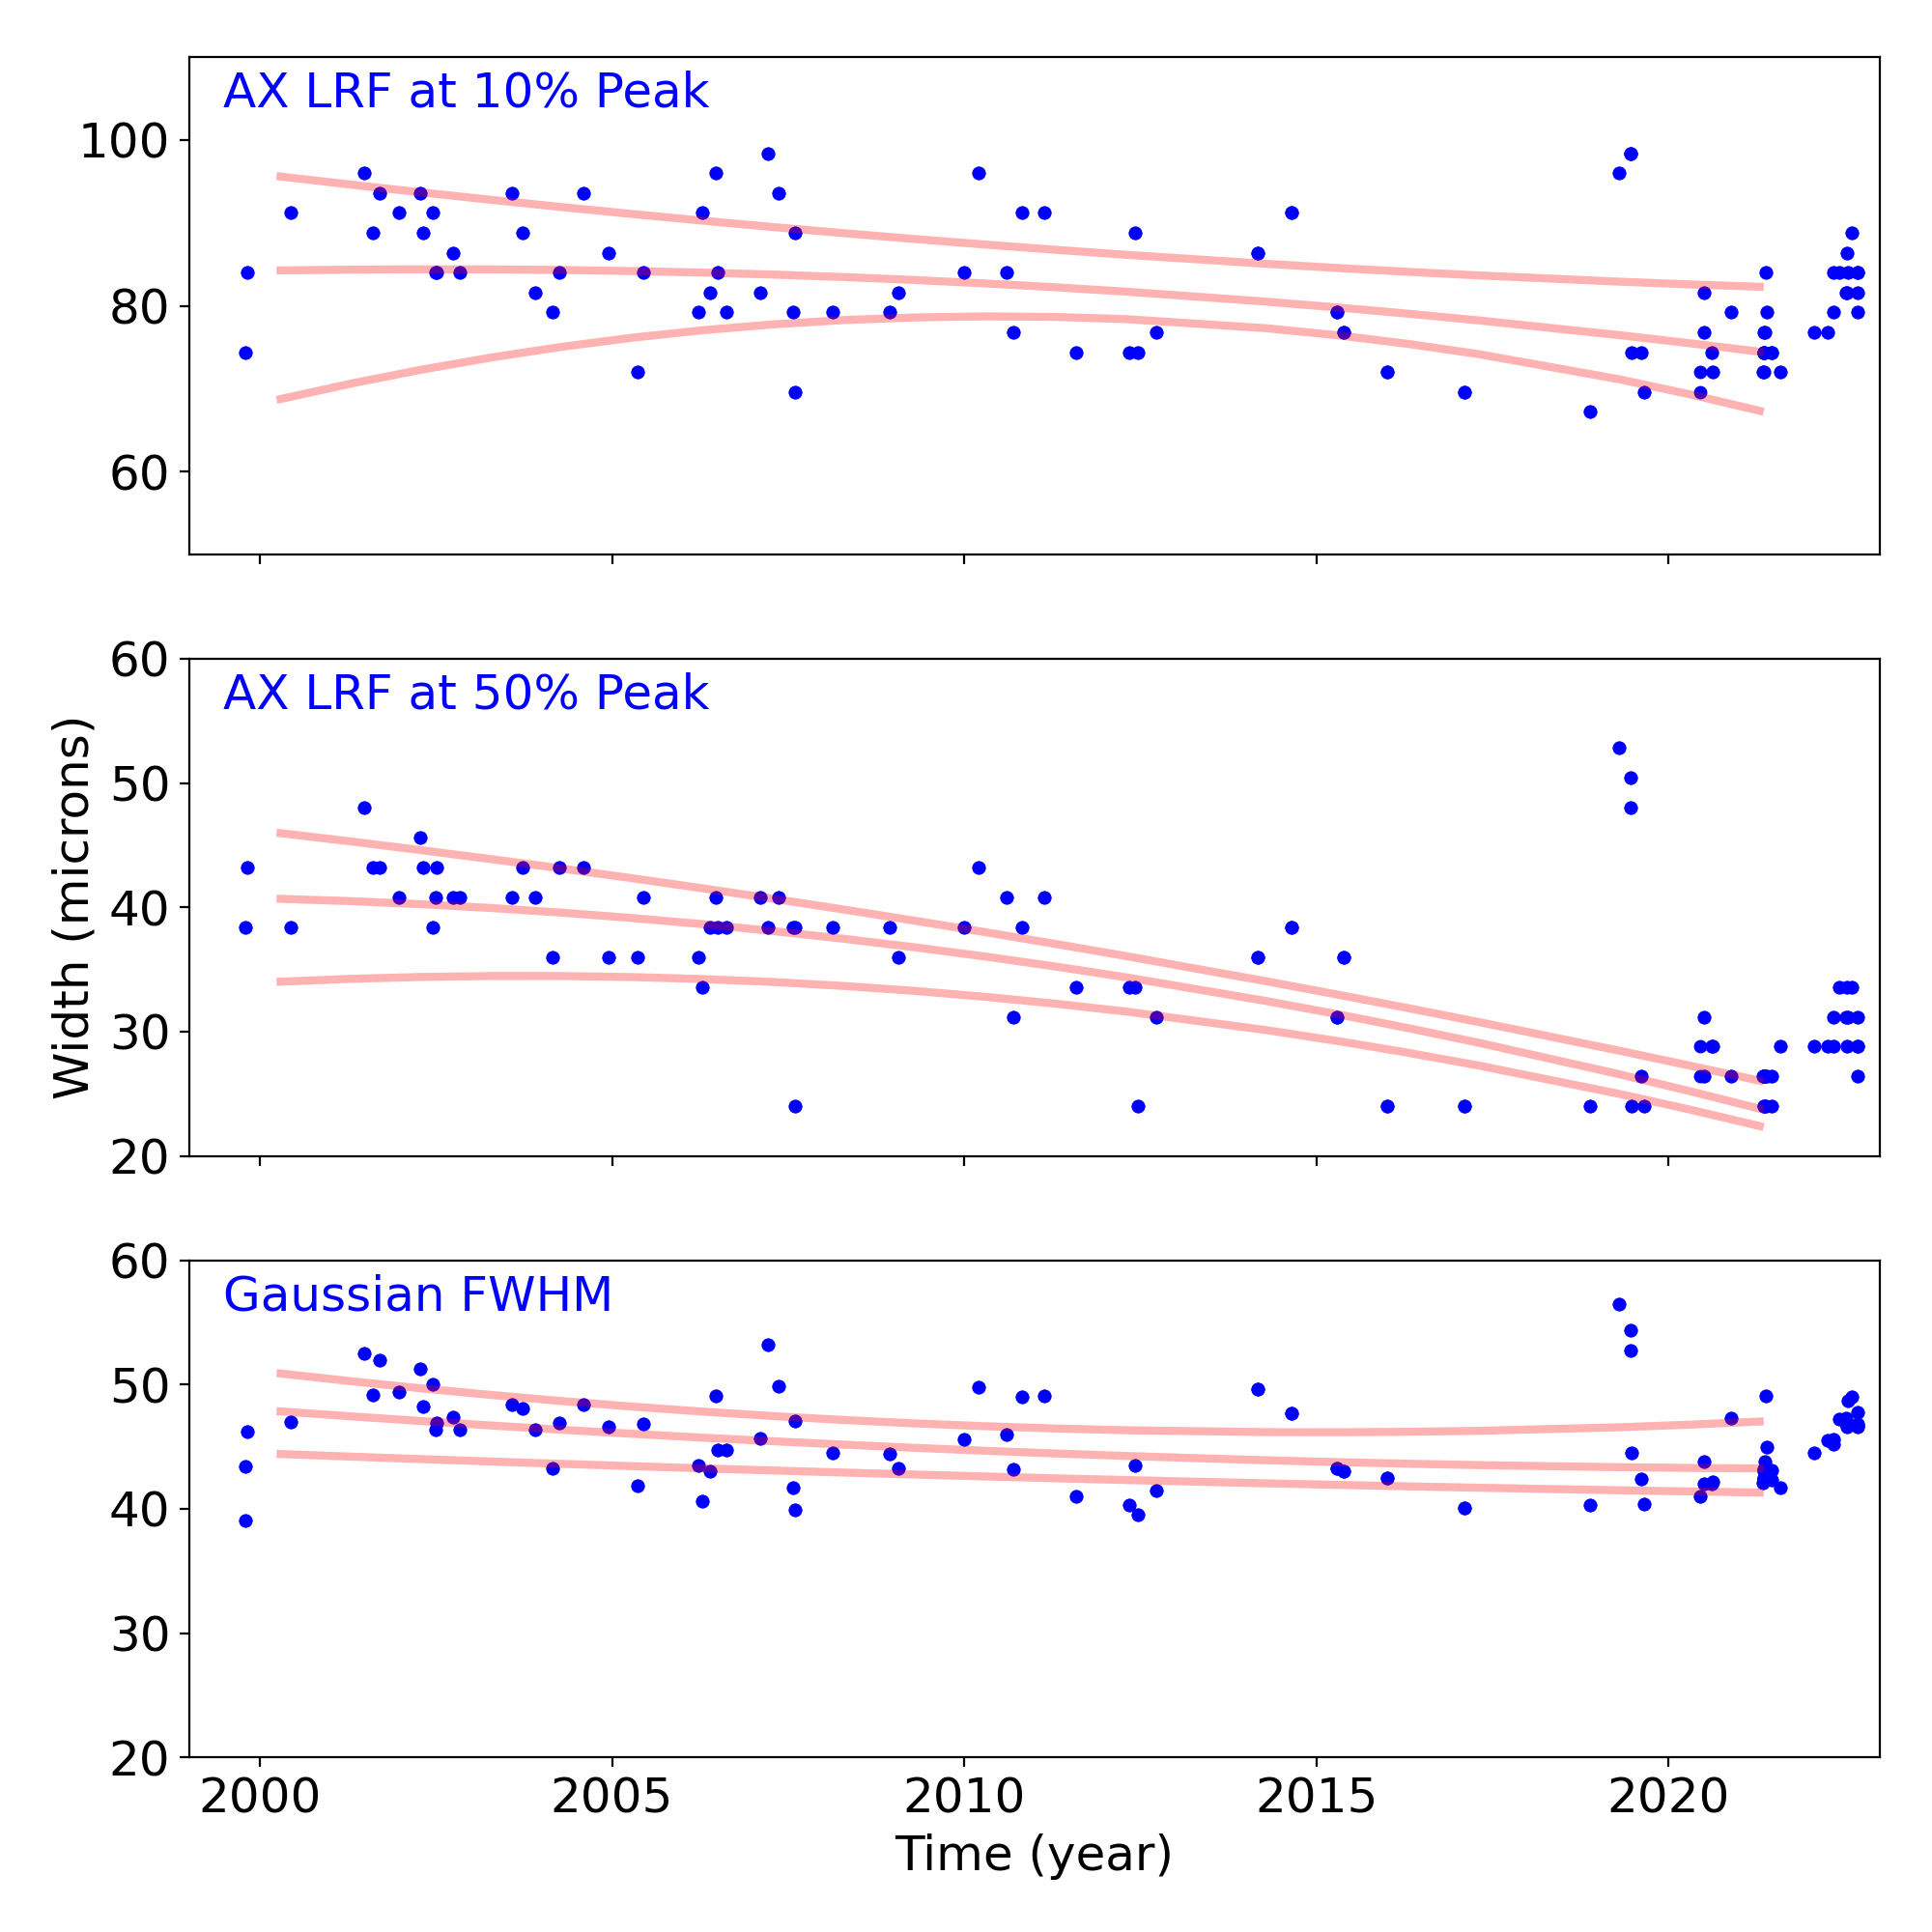
Gratings
Grating Trends/Focus
We plot the width of the zero order streak of ACIS/HETG observations and the width of the zero order image for HRC/LETG observations of point sources. No significant defocusing trend is seen at this time. See Gratings Trends pages.
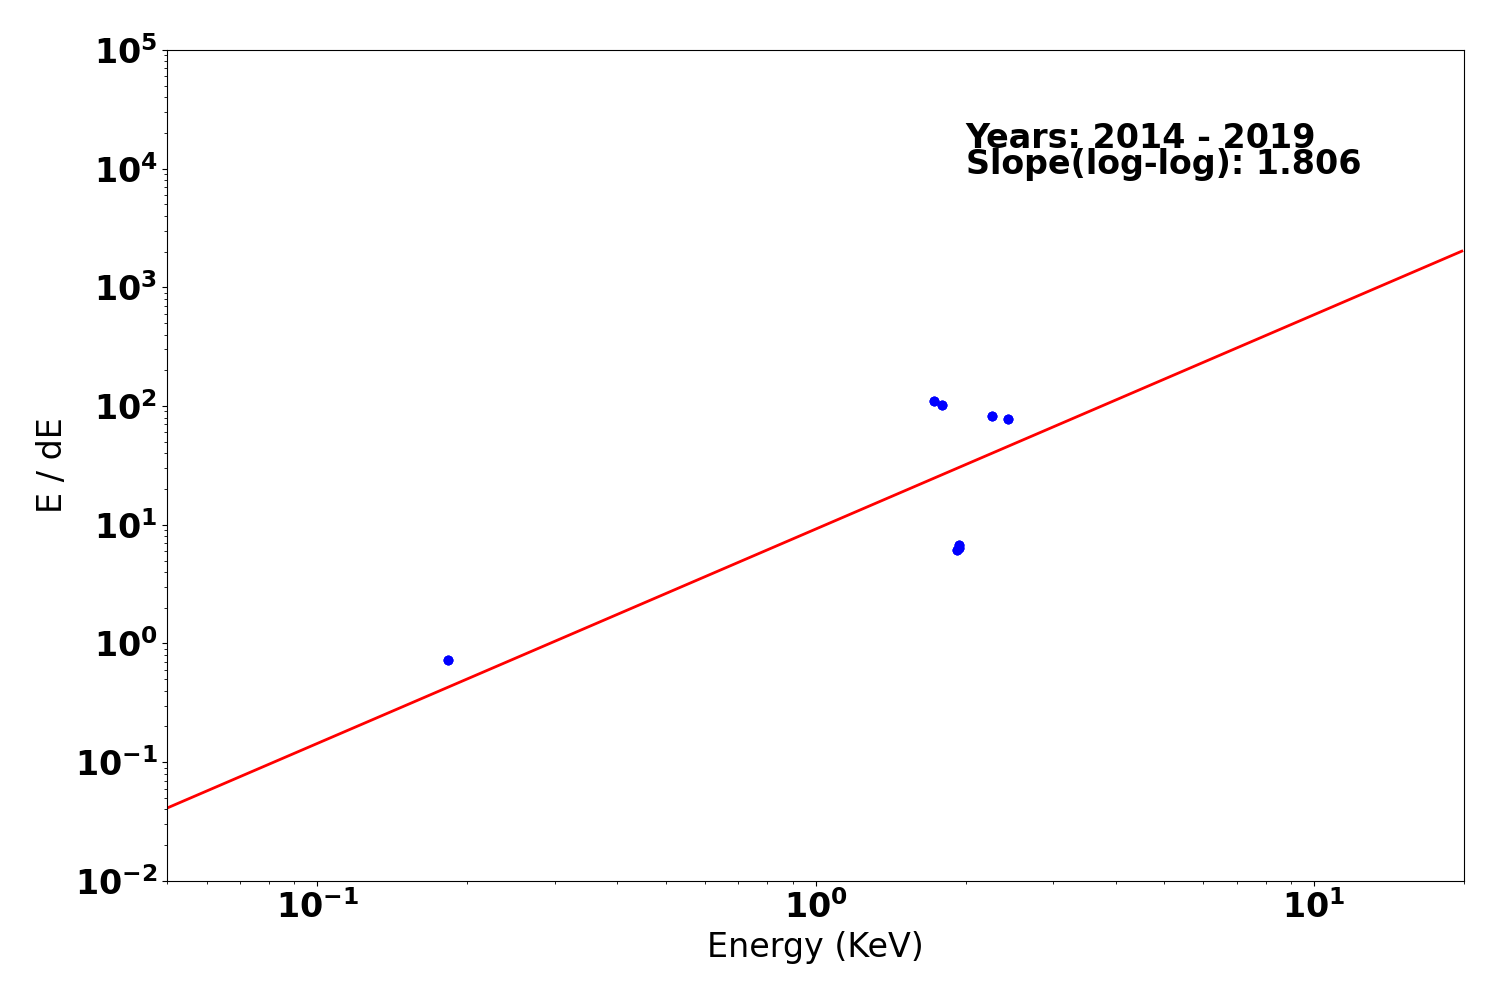
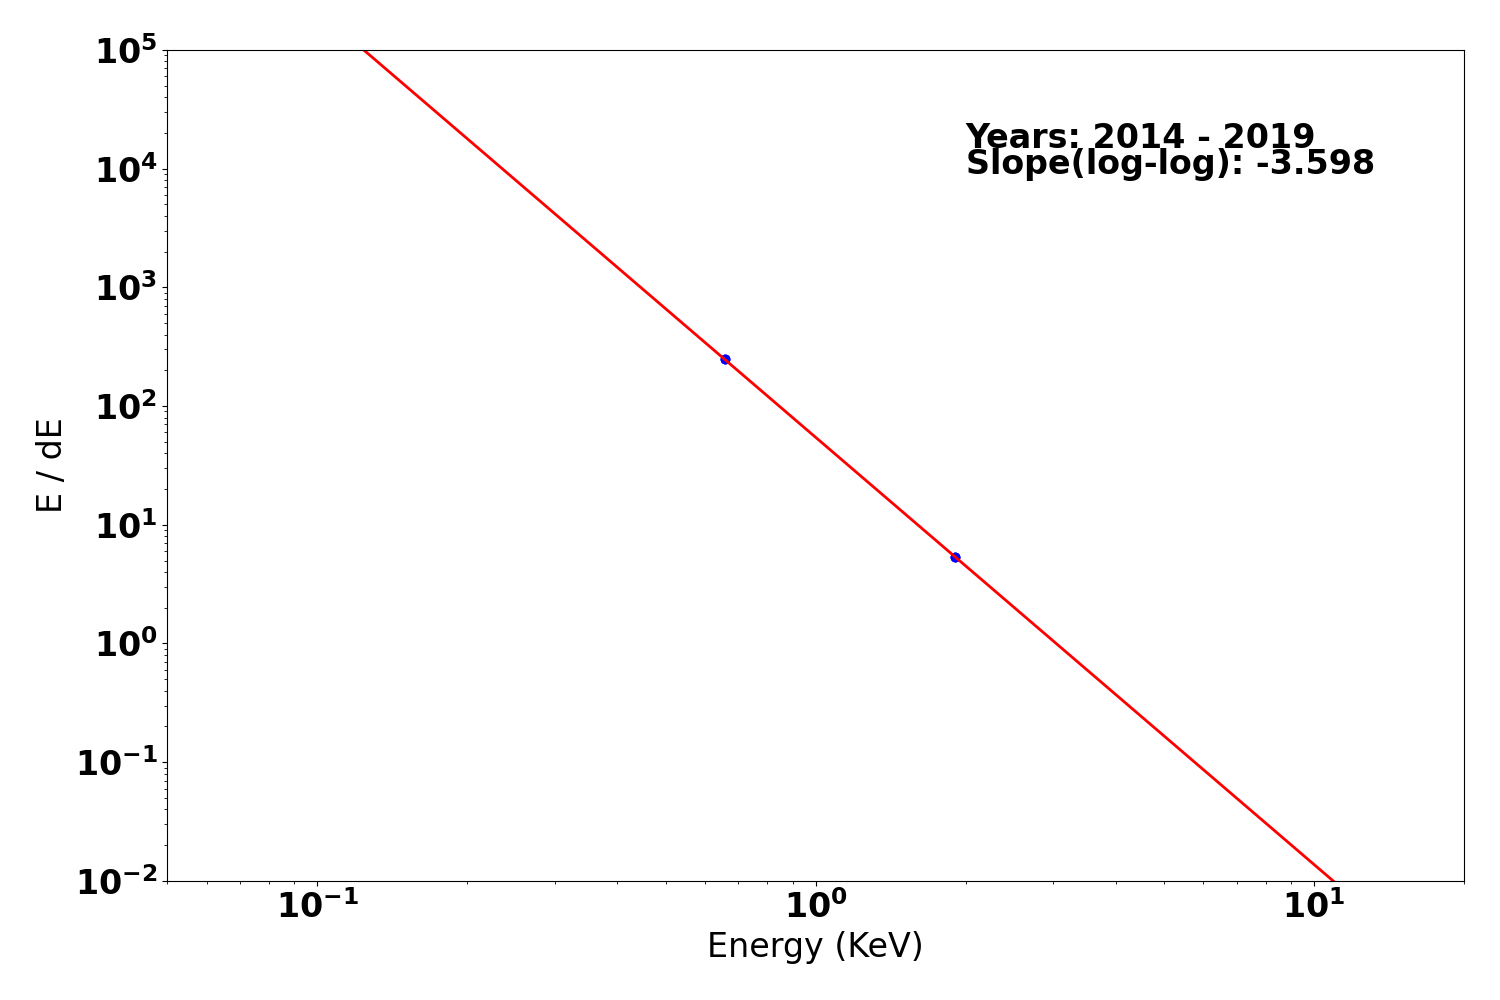
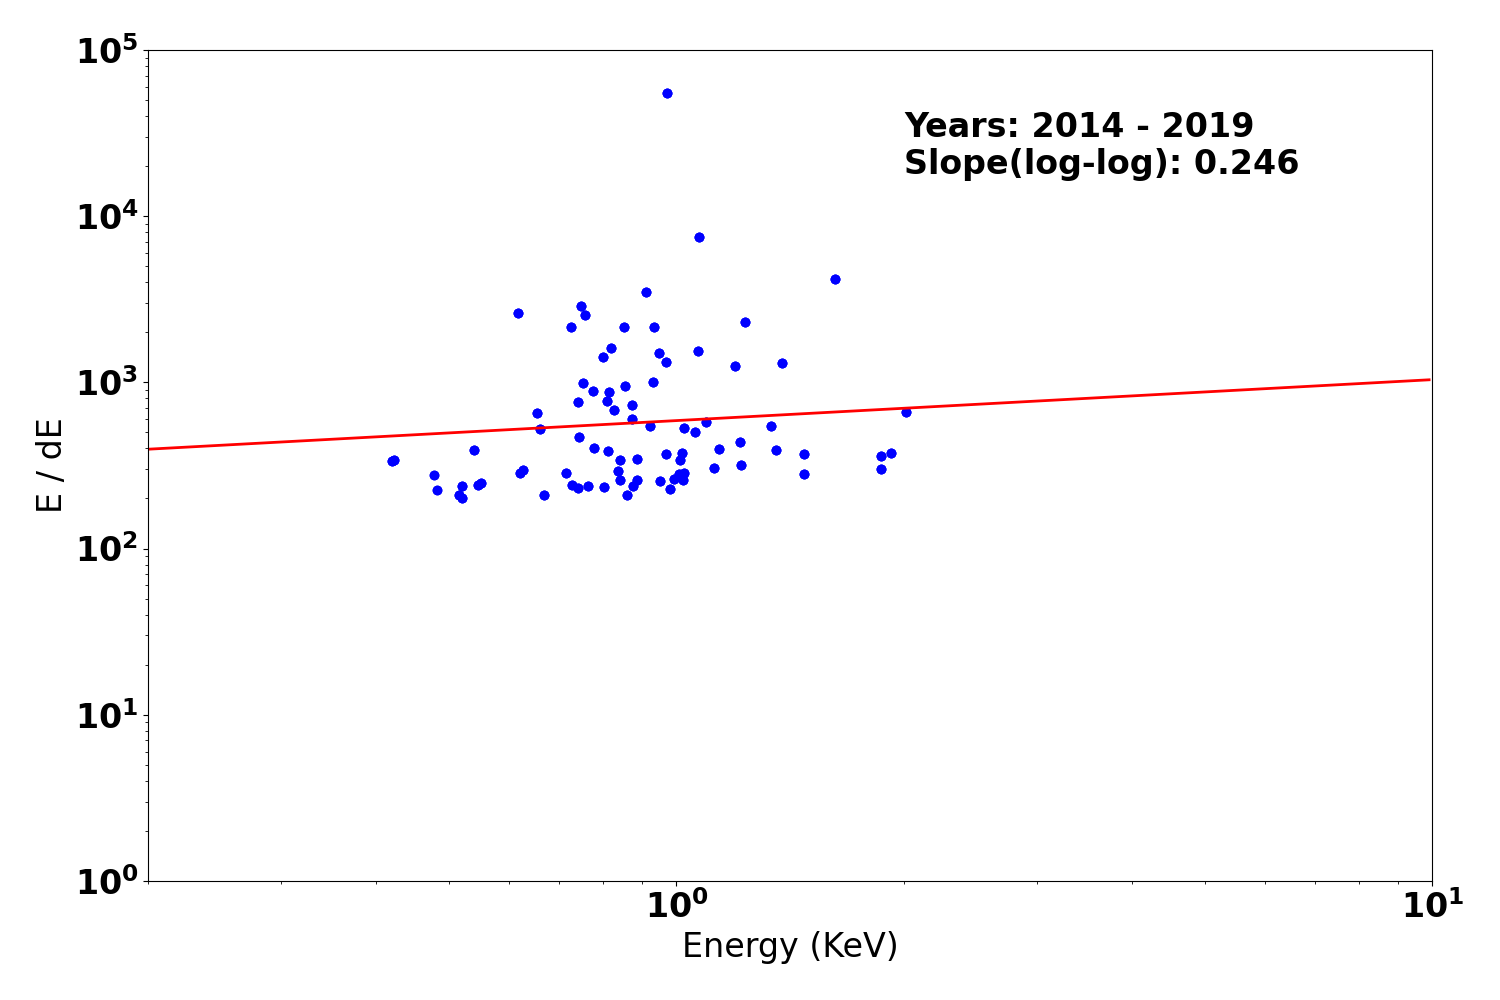
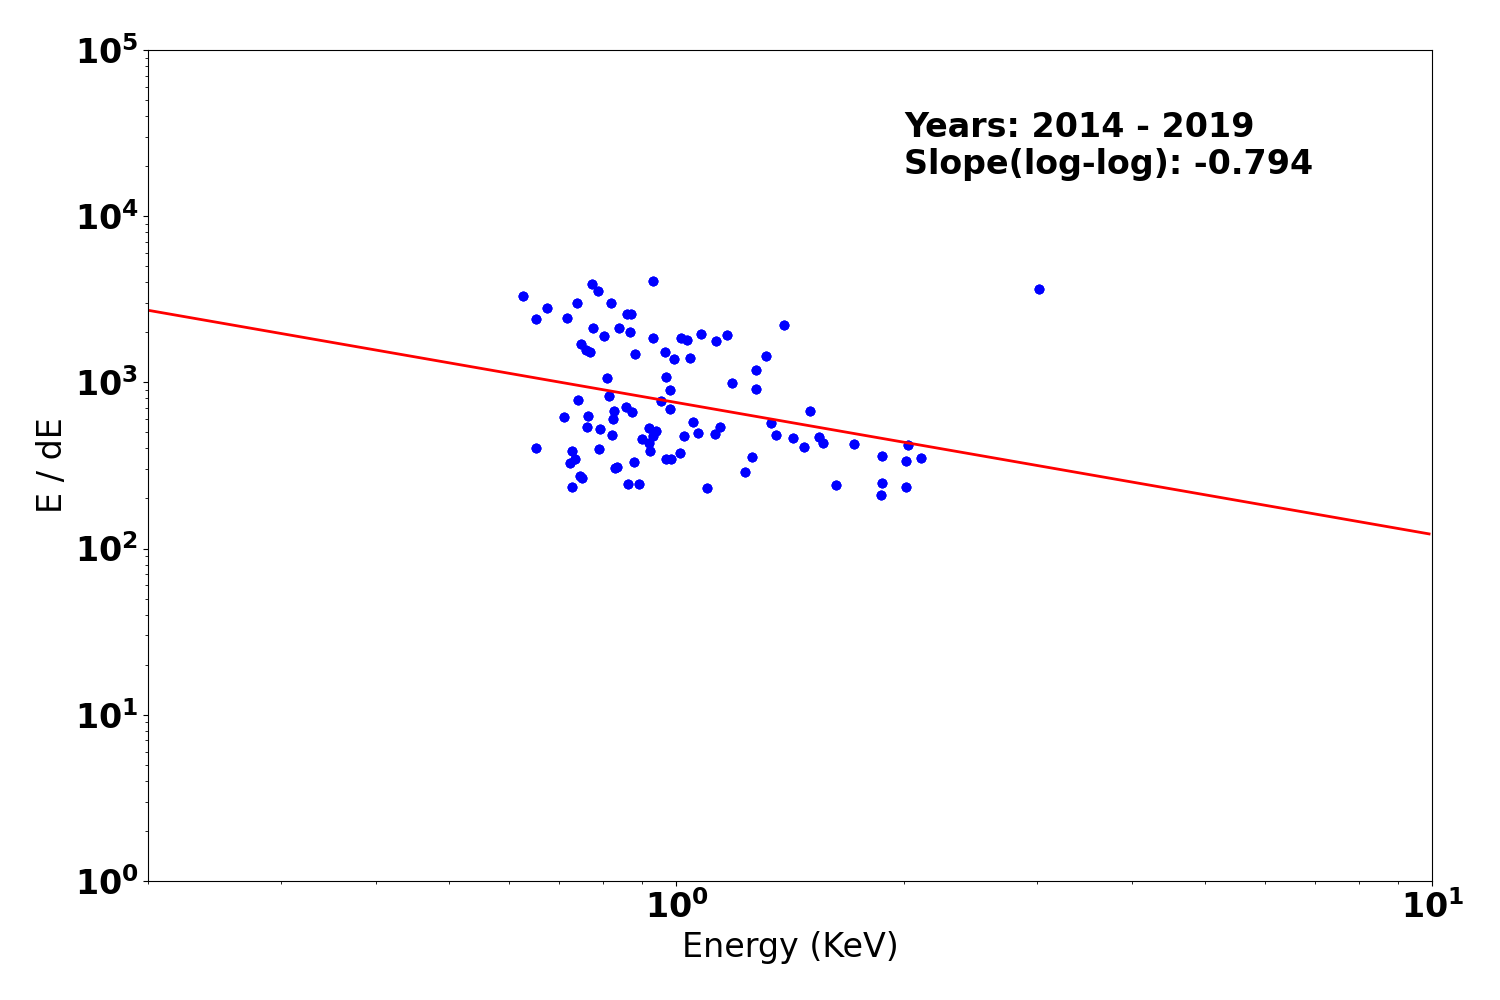
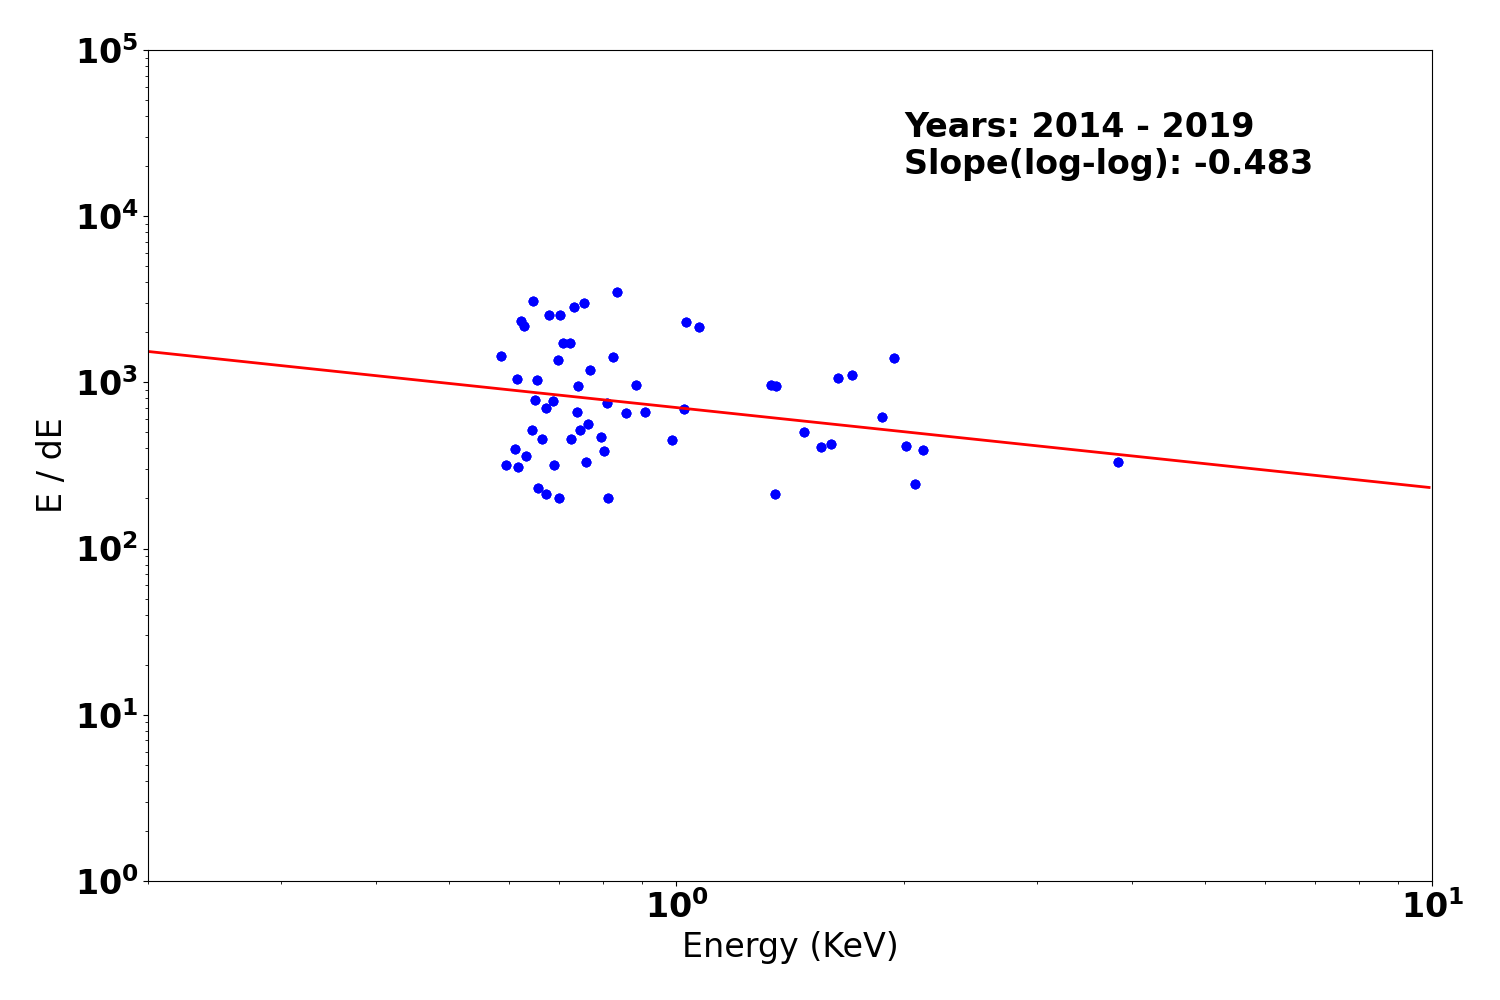
Gratings Resolving Power
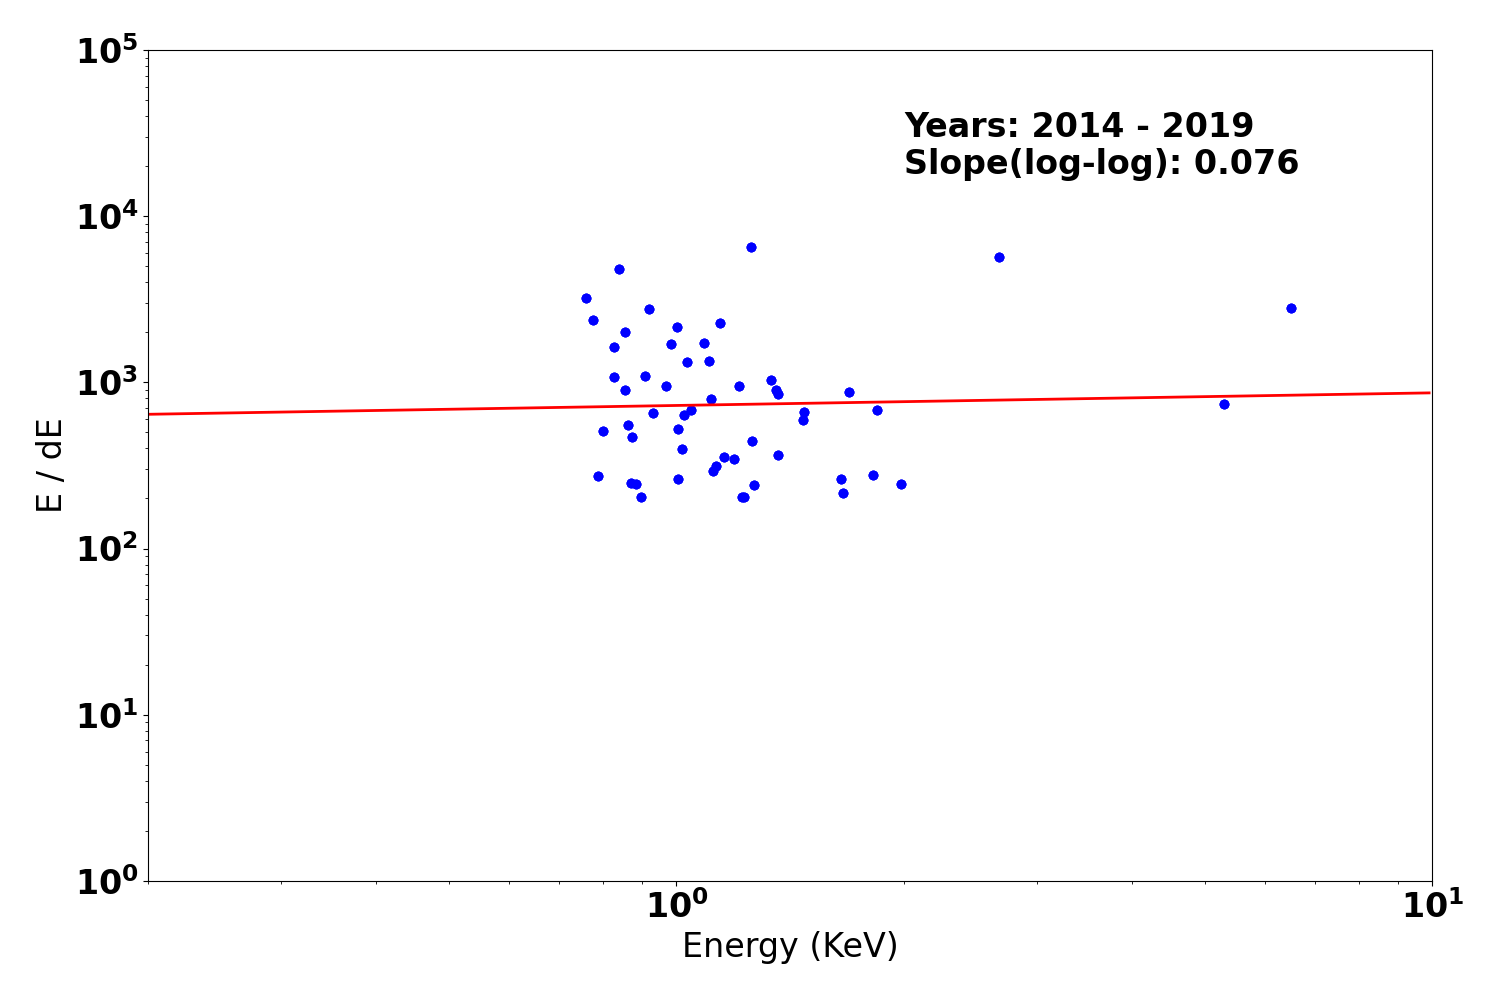
We plot E/dE vs. E for fits to detected lines with fwhm_error/fwhm less than 0.15 for the plus and minus arms of HEG, MEG, and LEG. Also shown are conservative (dotted line) and optimistic (dashed line) pre-launch resolving power expectations.
We have selected only calibration observations of Capella, HR1099, and Sigma Gem. See MIT technotes for a parallel analysis.
| Year 2014 - | |
|---|---|
| Letg minus side | Letg plus side |
 |
 |
| Metg minus side | Metg plus side |
 |
 |
| Hetg minus side | Hetg plus side |
 |
 |
PCAD
ACA Trending
| ACIS |
)
|
)
|
)
|
|
|---|---|---|---|---|
)
|
)
|
)
| ||
| HRCI |
)
|
)
|
)
|
)
|
| HRCI |
)
|
)
|
)
|
)
|
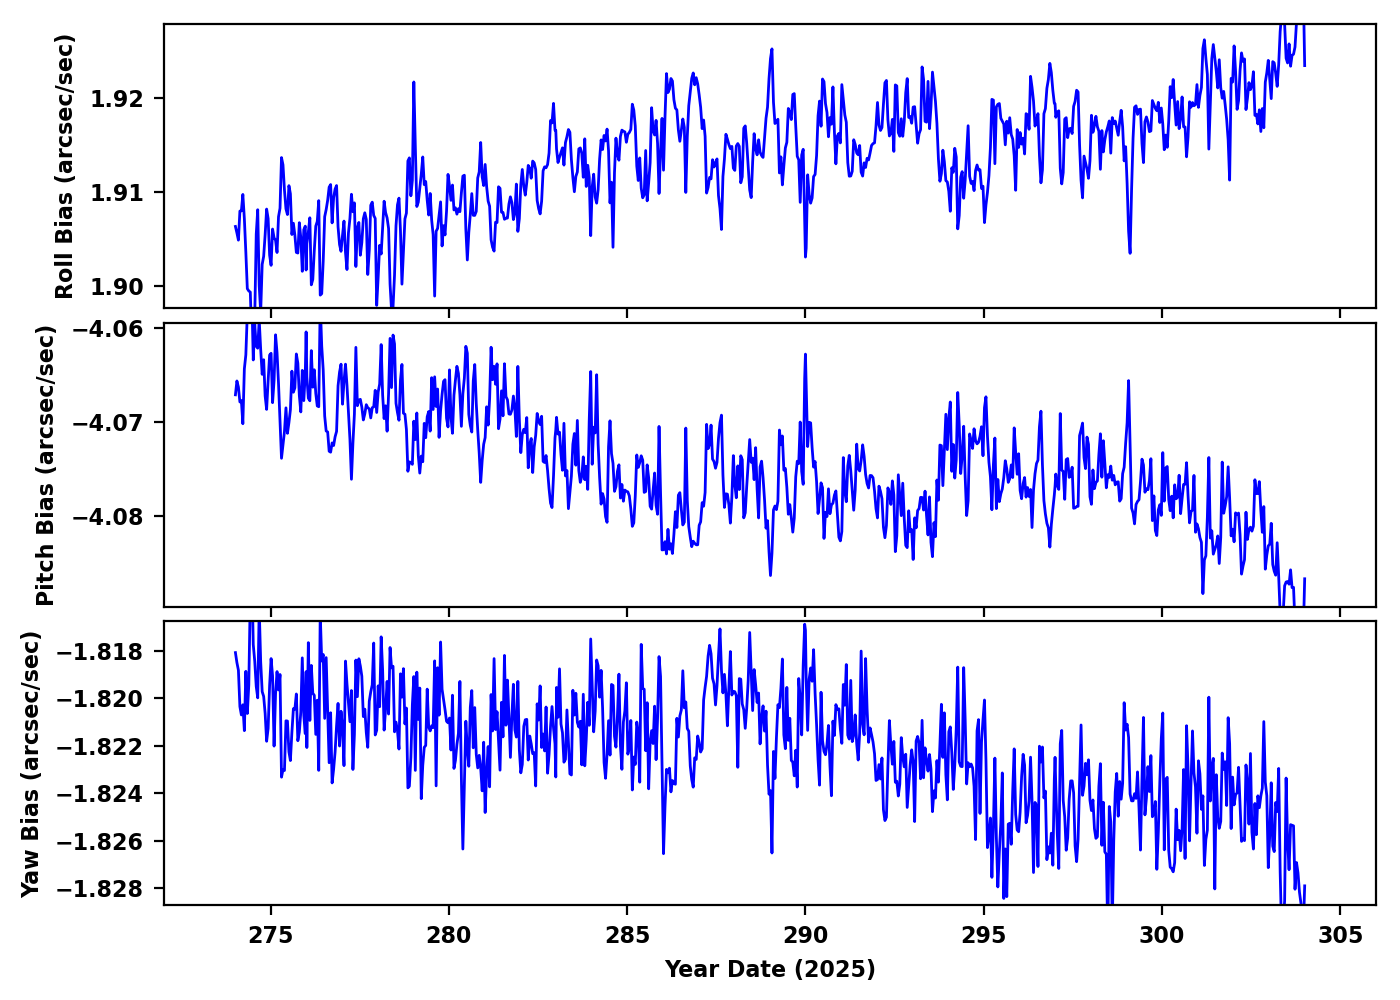
Gyro Bias Drift
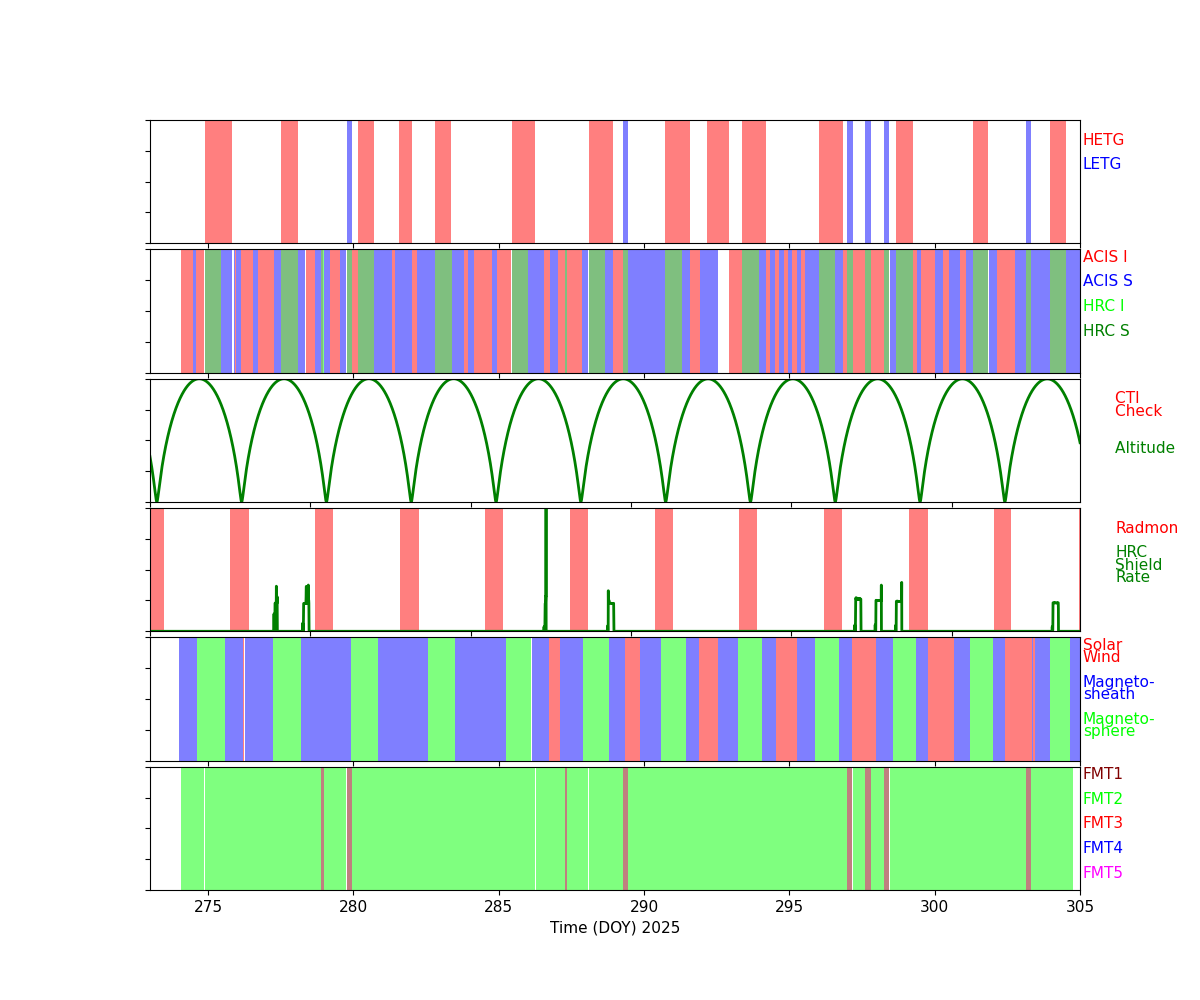
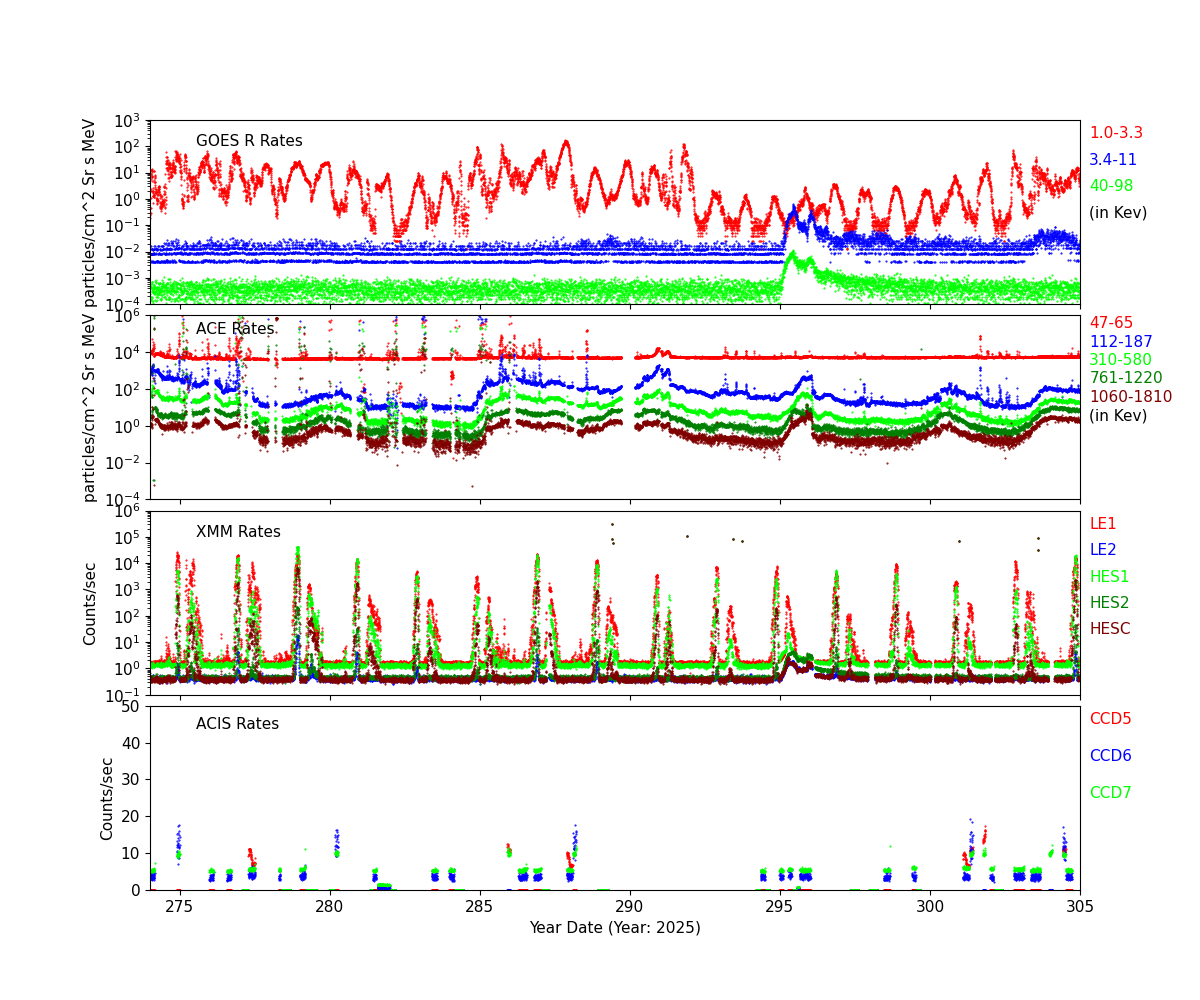
Radiation History
Radiation Count Rates of Oct 2025
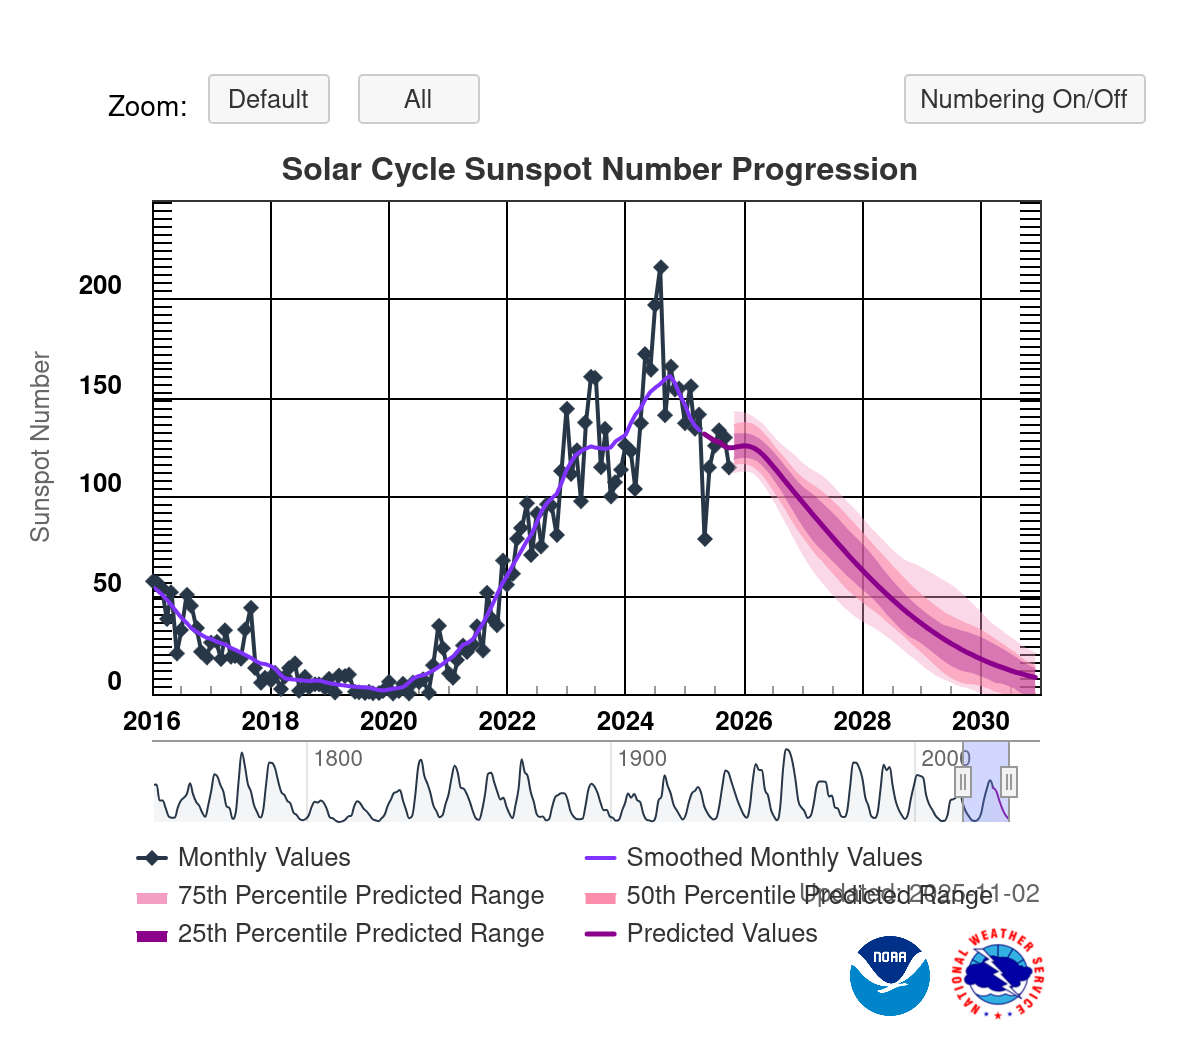
Sun Spot History (See:NOAA Page)
SIM
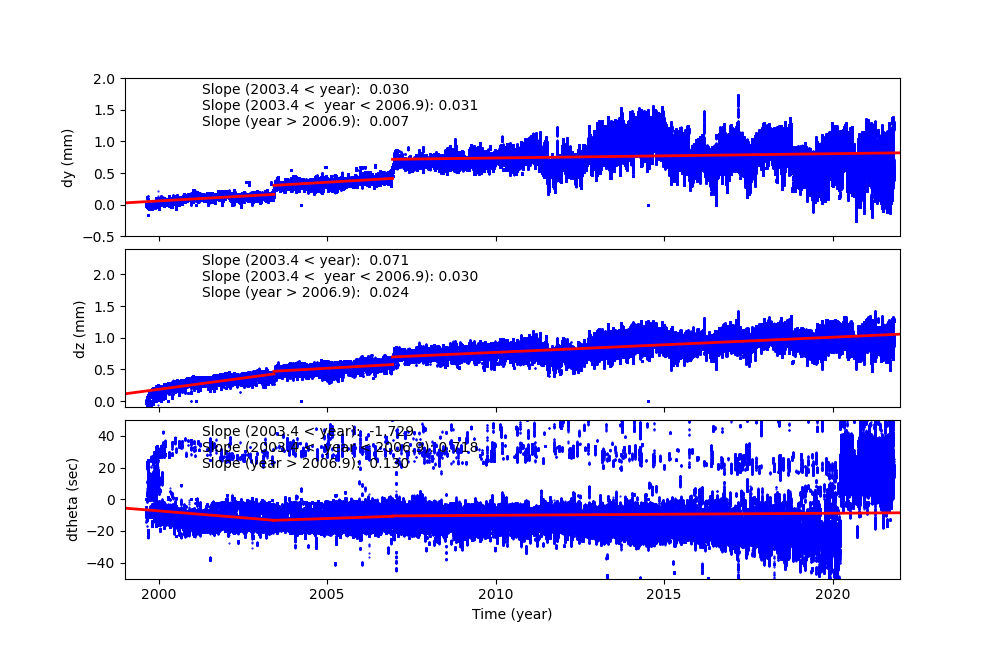
SIM Shift and Twist
SIM Shift and Twist Trend The following plots show trends of SIM shifts (dy and dz) and twist (dtheta). All quantities are directly taken from pcaf*_asol1.fits files. The units are mm for dy and dz, and degree for dtheta. We fit three lines separated before and after (Days of Mission)= 1400 (May 21, 2003), 2700 (Dec 11, 2006), and 4400 (Aug 07, 2011). The unit of slopes are mm per day or degree per day.
The sudden shift around DOM = 1400, 2700 and 4400 are due to fid light drift (see a memo by Aldcroft fiducial light drift). On the dtheta plot, two tracks are clearly observed. The track around 0.01 is due to HRC-I, and all others are clustered around -0.002. For more detail, please see SIM Shift and Twist Trend page
Trending
Quarterly Trends
- EPS Batteries
| Previous Quarter | |||||||
| MSID | MEAN | RMS | DELTA/YR | DELTA/YR/YR | UNITS | DESCRIPTION | |
| eb2ci | off | -5.618e-04 | 5.916e-05 | 0.31 +/- 0.14 | 0.00 +/- 0.00 | AMP | BATT 2 CHARGE CURRENT | on | -0.002 | 0.003 | 0.38 +/- 0.32 | (0.00+/-0.00)e0 |
|---|---|---|---|---|---|---|---|
| eb2di | off | -6.918e-04 | 1.283e-04 | 0.03 +/- 0.30 | (2.09+/-6.00)e-5 | AMP | BATT 2 DISCHARGE CURRENT | on | 0.006 | 0.010 | 0.27 +/- 1.03 | (0.00+/-0.00)e0 |
| eb2v | off | 0.001 | 6.602e-05 | 32.28 +/- 0.16 | 0.00 +/- 0.00 | V | BATT 2 VOLTAGE | on | -0.007 | 0.004 | 32.17 +/- 0.46 | (0.00+/-0.00)e0 |
| ecnv1v | -2.077e-05 | 4.755e-06 | 14.89 +/- 0.01 | (6.32+/-6.01)e-4 | V | CONV 1 +15V OUTPUT | |
| ecnv2v | -4.739e-06 | 3.541e-06 | 14.83 +/- 0.01 | 0.00 +/- 0.00 | V | CONV 2 +15V OUTPUT | |
| ecnv3v | -2.715e-05 | 2.294e-06 | 15.28 +/- 0.01 | (1.44+/-3.65)e-4 | V | CONV 3 +15V OUTPUT | |
- Spacecraft Electronics
| Previous Quarter | |||||||
| MSID | MEAN | RMS | DELTA/YR | DELTA/YR/YR | UNITS | DESCRIPTION | |
| elbi | 0.003 | 5.472e-04 | 53.23 +/- 1.28 | 0.03 +/- 0.16 | AMP | LOAD BUS CURRENT | |
|---|---|---|---|---|---|---|---|
| elbv | off | 0.002 | 6.899e-05 | 27.82 +/- 0.17 | -0.04 +/- 0.02 | V | LOAD BUS VOLTAGE | on | 0.007 | 0.003 | 27.71 +/- 0.36 | (0.00+/-0.00)e0 |
- OBA Heater
| Previous Quarter | |||||||
| MSID | MEAN | RMS | DELTA/YR | DELTA/YR/YR | UNITS | DESCRIPTION | |
| oobthr04 | 0.006 | 7.138e-04 | (3.03+/-0.02)e2 | 0.81 +/- 0.39 | K | RT 27: HRMA STRUT | |
|---|---|---|---|---|---|---|---|
| oobthr12 | 0.008 | 0.001 | (3.01+/-0.02)e2 | 0.97 +/- 0.60 | K | RT 35: OBA CONE | |
| oobthr26 | 0.011 | 0.002 | (3.05+/-0.04)e2 | 1.18 +/- 0.91 | K | RT 48: OBA CONE | |
| oobthr38 | 3.574e-05 | 5.182e-06 | (2.72+/-0.00)e2 | 0.00 +/- 0.00 | K | RT 60: TFTE CONE | |
| oobthr44 | 0.008 | 0.001 | (3.04+/-0.02)e2 | 1.02 +/- 0.62 | K | RT 66: TFTE COVER | |
| oobthr50 | 0.008 | 8.899e-04 | (2.98+/-0.02)e2 | 0.90 +/- 0.52 | K | RT 76: S/C STRUT | |
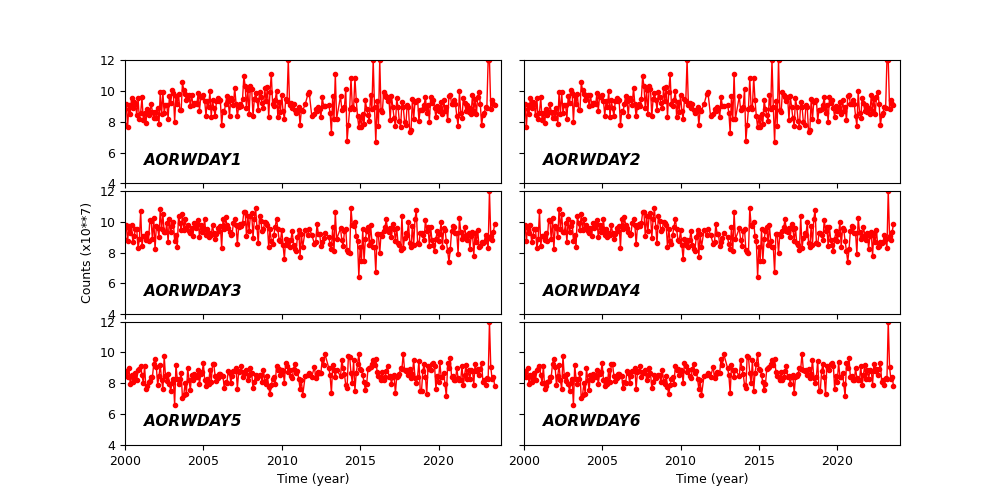
Spacecraft Motions
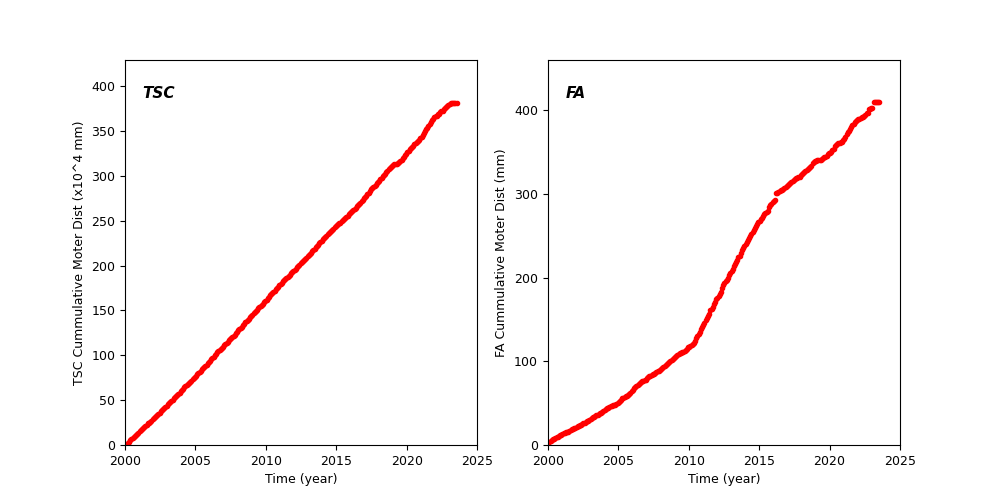
TSC and FA Cummulative Moter Distance
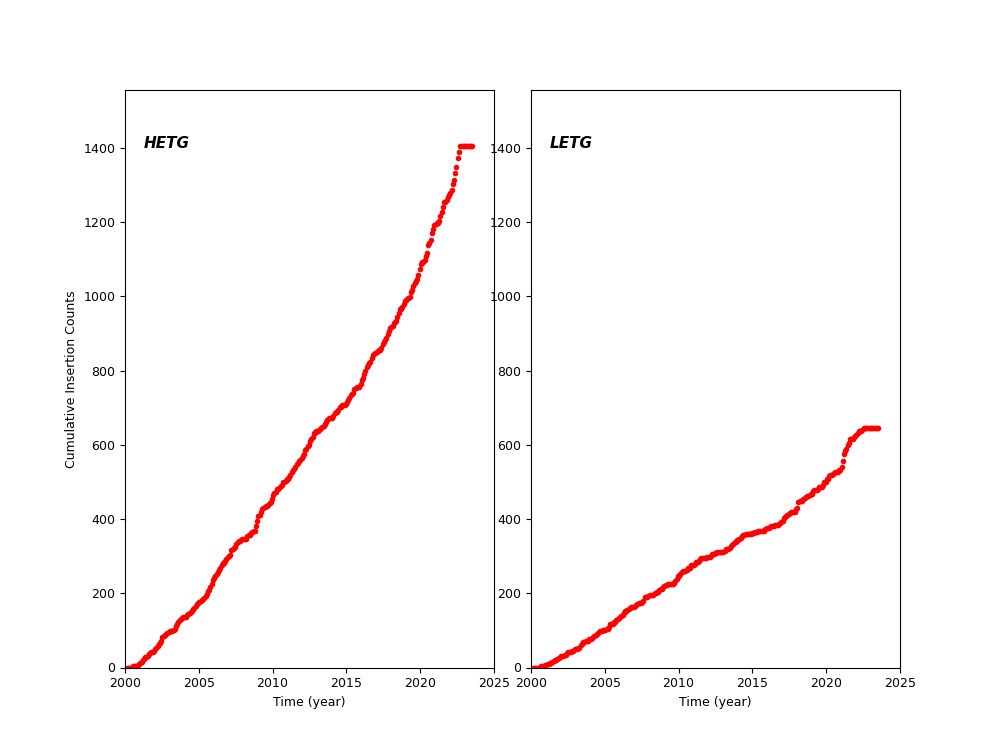
HETG and LETG Cummulative Insertion Counts
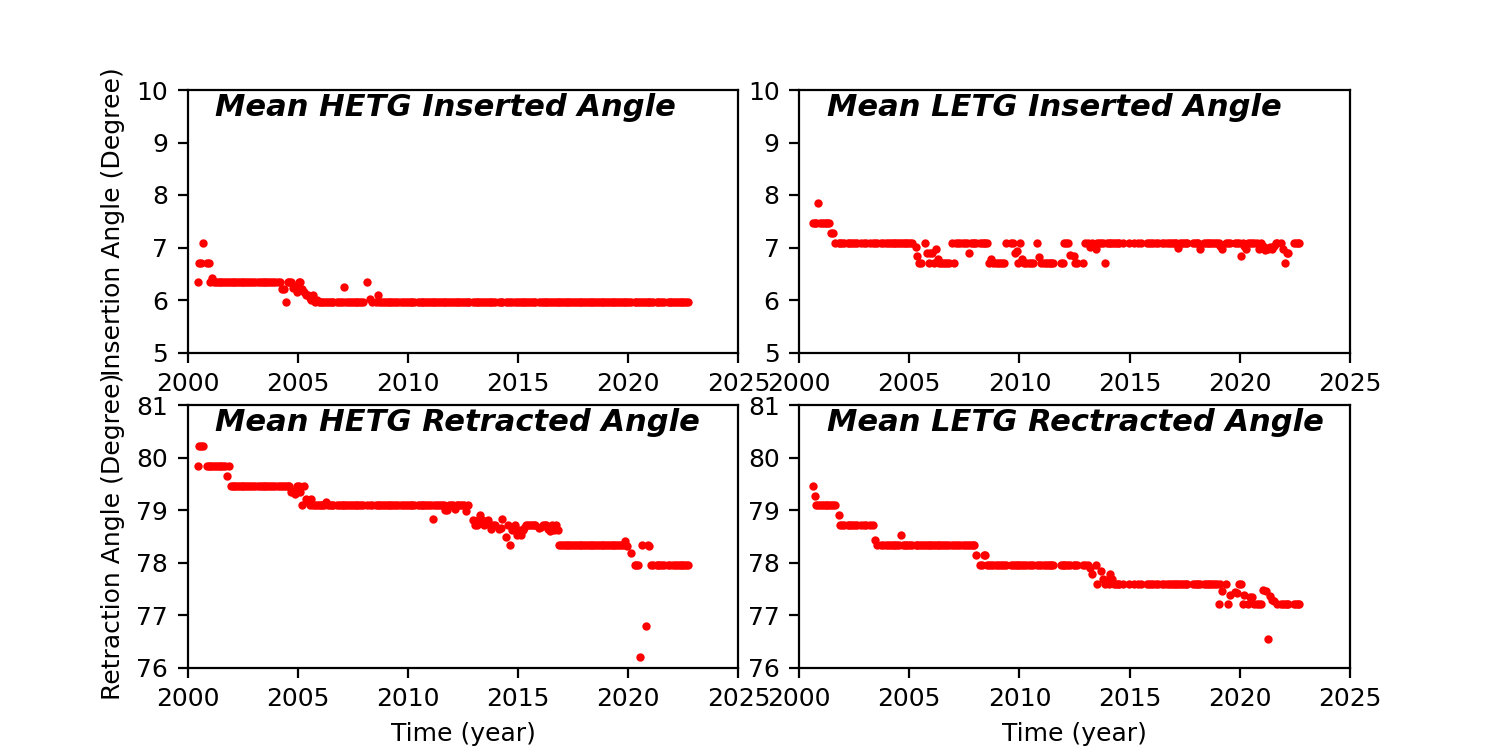
HETG/LETG Insertion/Retraction Angle
Reaction Wheel Rotations