ACIS
ACIS DOSE Registered-Photon-Map
The steps we took to compute the dose map are;
- Level 1 Event files for a specified month are obtained from archive.
- Image data including I2, I3, S2, S3 CCDs are extracted from all event files.
- All the extracted image data were merged to create a month long exposure map for the month.
- The exposure map is opened with ds9, and check a distribution of count rates against energy. From this, estimate the upper threshold value. Any events beyond this upper threshold are assumed erroneous events such as bad pixels.
- Using this upper threshold, the data is filtered, and create a cleaned exposure map for the month.
- The exposure map from each month from the Sep 1999 is added up to create a cumulative exposure map for each month.
- Using fimgstatistic, we compute count rate statistics for each CCDs.
- For observations with high data drop rates (e.g., Crab nebula, Cas A), we corrected the observations by adding events.
Please check more detail plots at Telemetered Photon Dose Trend page.
)
)
)
Statistics:
# IMAGE     NPIX     MEAN        RMS        MIN     MAX
ACIS_nov25 6004901       5.261         7.514           0.0      839


I2 node 0  262654	4.009250	2.350664	0.0	 63.0
I2 node 1  262654	4.504034	2.619906	0.0	 78.0
I2 node 2  262654	5.665175	3.605002	0.0	 78.0
I2 node 3  262654	8.203845	6.731643	0.0	561.0

I3 node 0  262654	12.154510	11.222881	0.0	839.0
I3 node 1  262654	7.050269	3.844532	0.0	110.0
I3 node 2  262654	5.394608	2.700188	0.0	 66.0
I3 node 3  262654	4.904442	2.577309	0.0	111.0

S2 node 0  262654	4.524897	3.720424	0.0	507.0
S2 node 1  262654	4.670818	3.815253	0.0	249.0
S2 node 2  262654	5.252217	5.894138	0.0	246.0
S2 node 3  262654	4.773057	4.615752	0.0	432.0

S3 node 0  262654	8.011171	8.038780	0.0	130.0
S3 node 1  262654	13.561169	10.516771	0.0	137.0
S3 node 2  262654	13.565694	12.023978	0.0	143.0
S3 node 3  262654	7.594721	9.511112	0.0	130.0
)
)
)
Statistics:
 IMAGE     NPIX      MEAN        RMS           MIN      MAX
ACIS_total   6004901       2757.121         3477.470           0.0   169725


I2 node 0  262654	2394.095458	486.896209	511.0	16089.0
I2 node 1  262654	2526.492176	713.686646	523.0	167719.0
I2 node 2  262654	2554.983664	544.002779	548.0	17868.0
I2 node 3  262654	2560.548869	668.325472	506.0	37694.0

I3 node 0  262654	2771.370170	695.012357	507.0	16369.0
I3 node 1  262654	2844.853600	1759.761938	533.0	56090.0
I3 node 2  262654	2550.382199	479.296297	501.0	15637.0
I3 node 3  262654	2525.325063	516.238856	480.0	36710.0

S2 node 0  262654	3215.793850	519.928643	1733.0	22677.0
S2 node 1  262654	3416.644592	781.218612	1909.0	22109.0
S2 node 2  262654	3789.159681	784.743226	2324.0	34212.0
S2 node 3  262654	3745.332662	643.520489	2042.0	88909.0

S3 node 0  262654	5695.694535	3076.508917	2506.0	55589.0
S3 node 1  262654	6918.317713	2412.227593	0.0	83602.0
S3 node 2  262654	5652.759471	1387.040126	2663.0	27735.0
S3 node 3  262654	4445.569670	784.388240	2669.0	26830.0
)
|
)
|
)
|
)
|
| Aug 2025 | May 2025 | Feb 2025 | Nov 2024 |
|---|
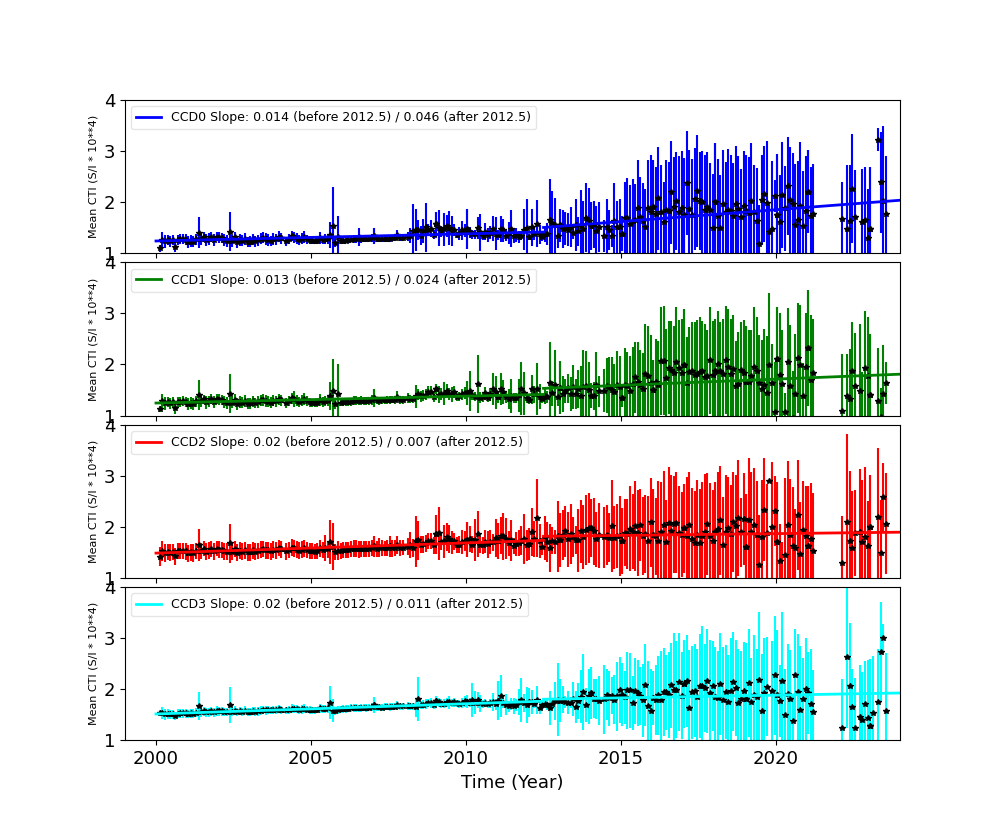
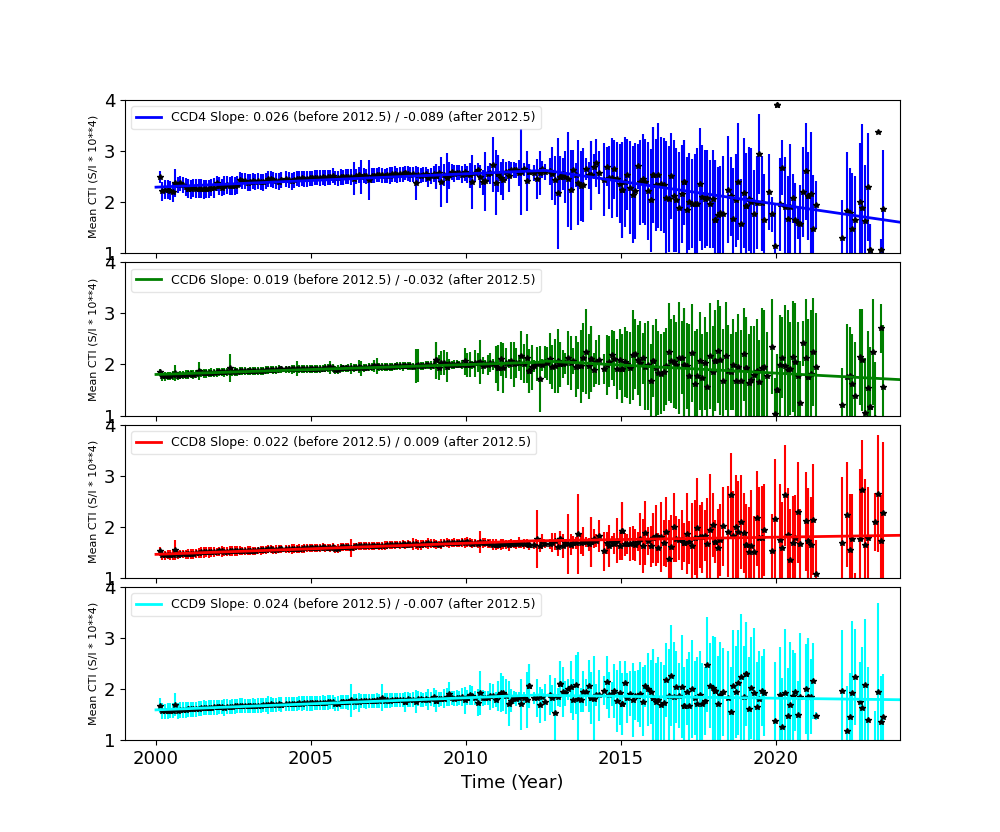
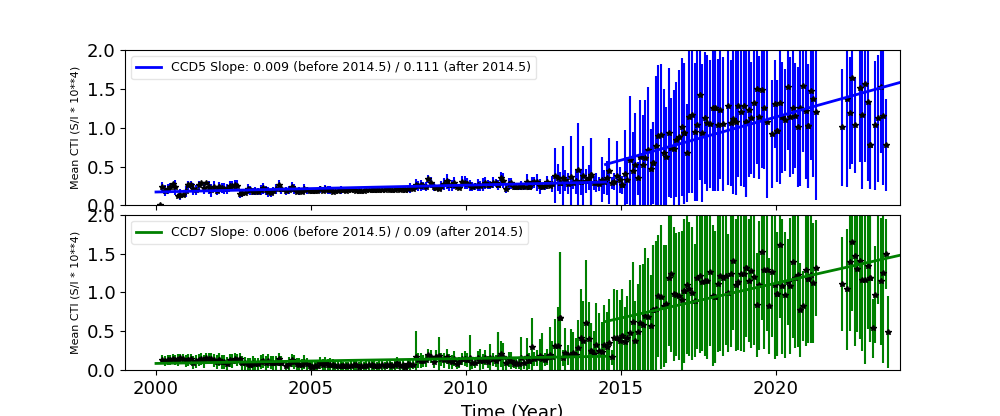
The Mean Detrended CTI
We report CTIs with a refined data definition. CTIs were computed for the temperature dependency corrected data. Please see CTI page for detailed explanation. CTI's are computed for Mn K alpha, and defined as slope/intercept x10^4 of row # vs ADU. Data file: here
Imaging CCDs
Spectral CCDs
Backside CCDs
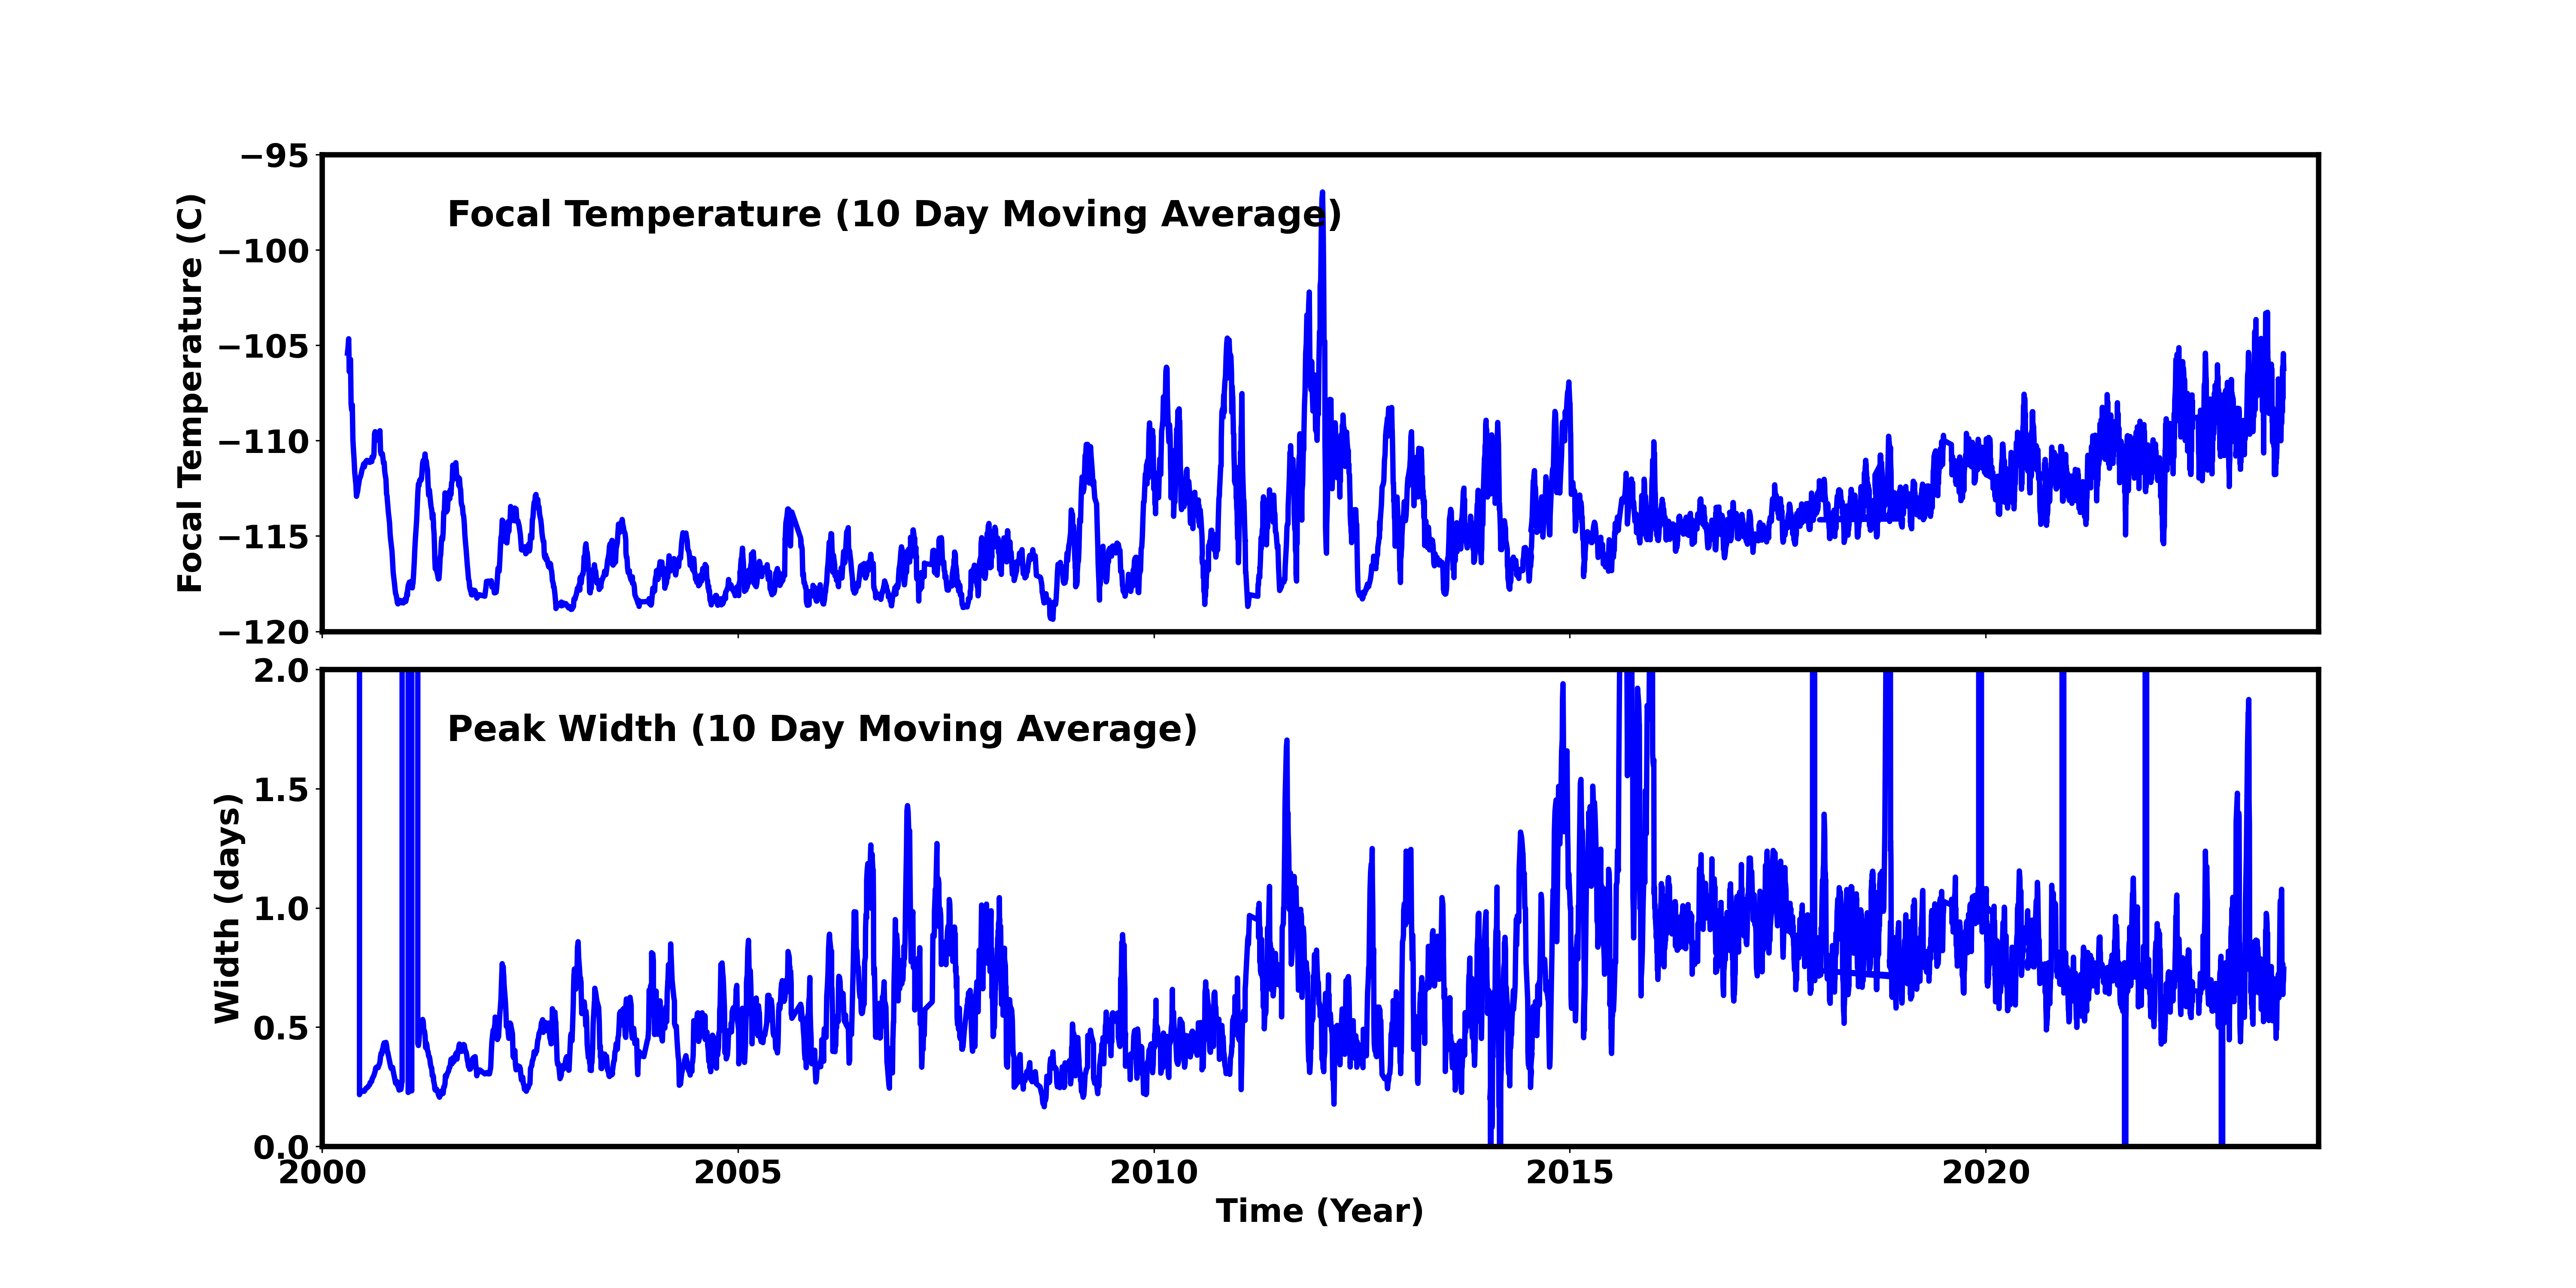
Focal Plane Temperature
Nov 2025 Focal Temperature
| The Mean (max) FPT: | |
|---|---|
| -107.53 | +/- 7.69 C |
| Mean Width: | |
| 0.8 | +/- 0.58 days |
Averaged Focal Plane Temperature
We are using 10 period moving averages to show trends of peak temperatures and peak widths. Note, the gaps in the width plot are due to missing/corrupted data.
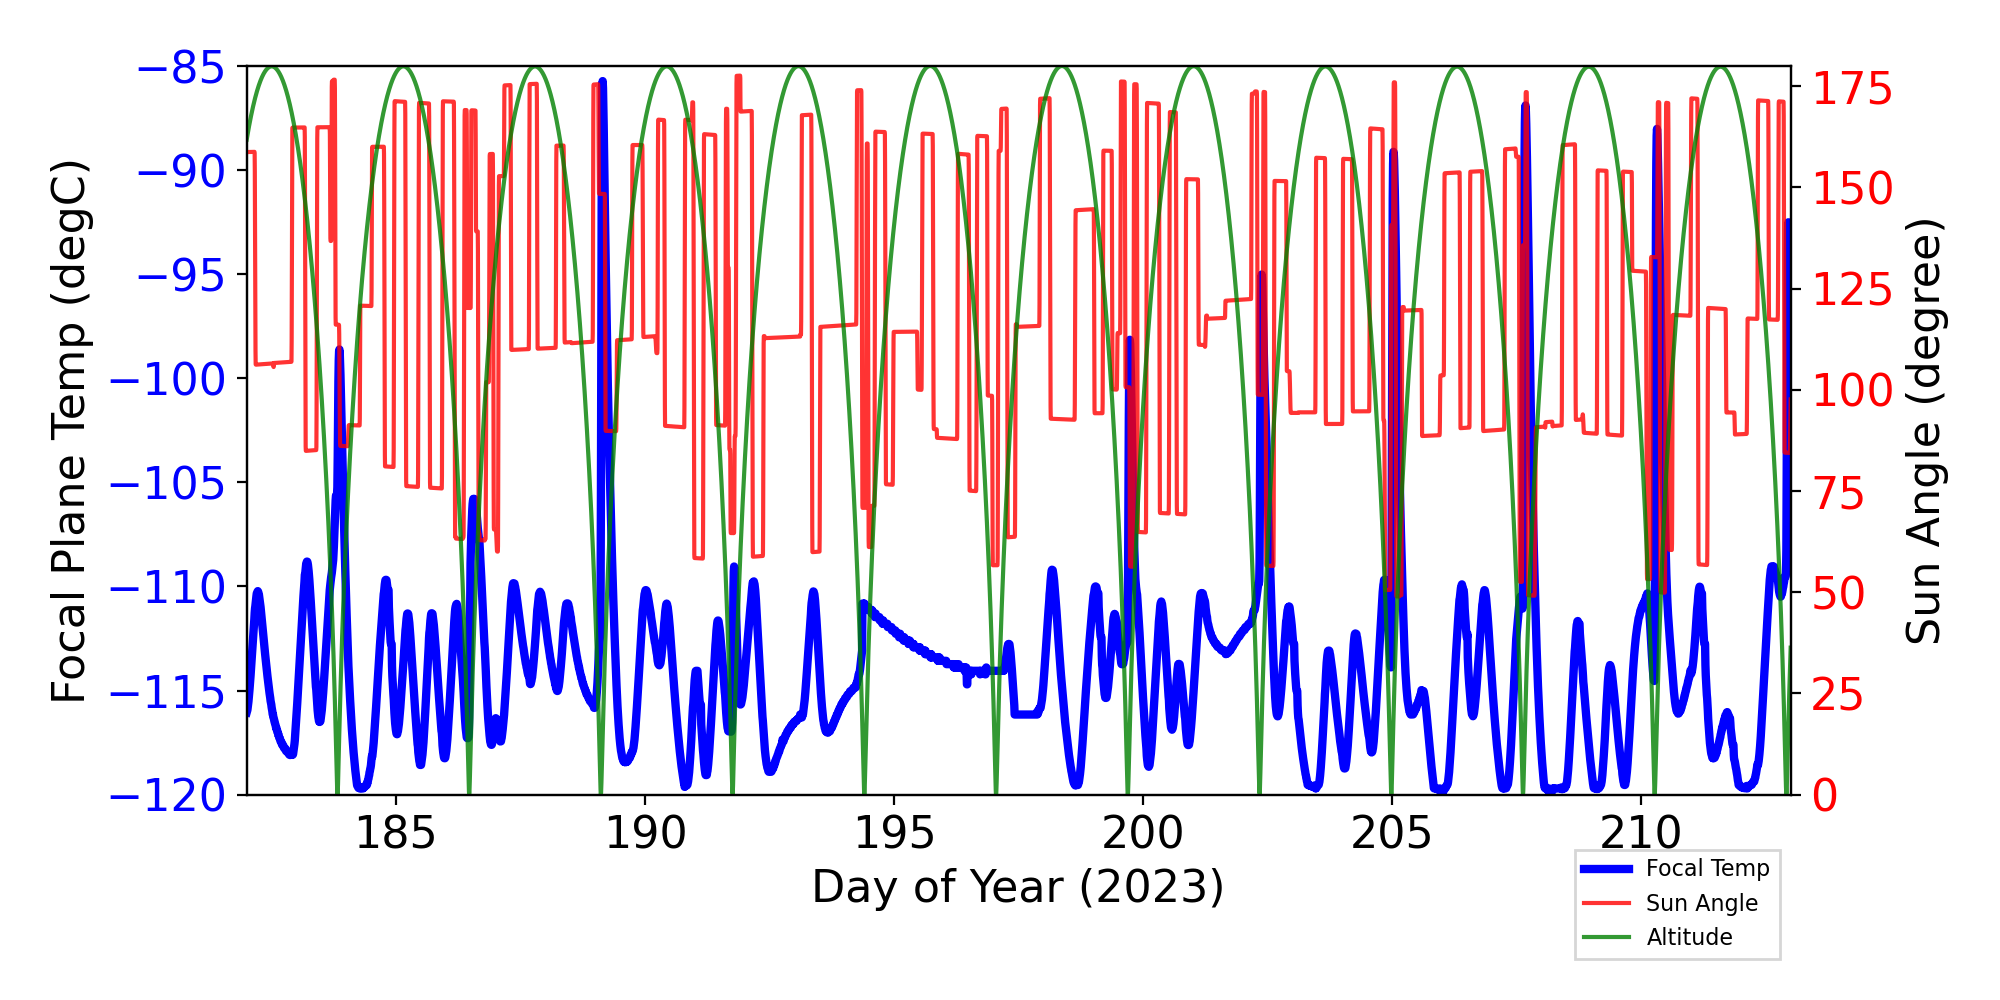
Focal Plane Temperature, Sun Angle and Altitude
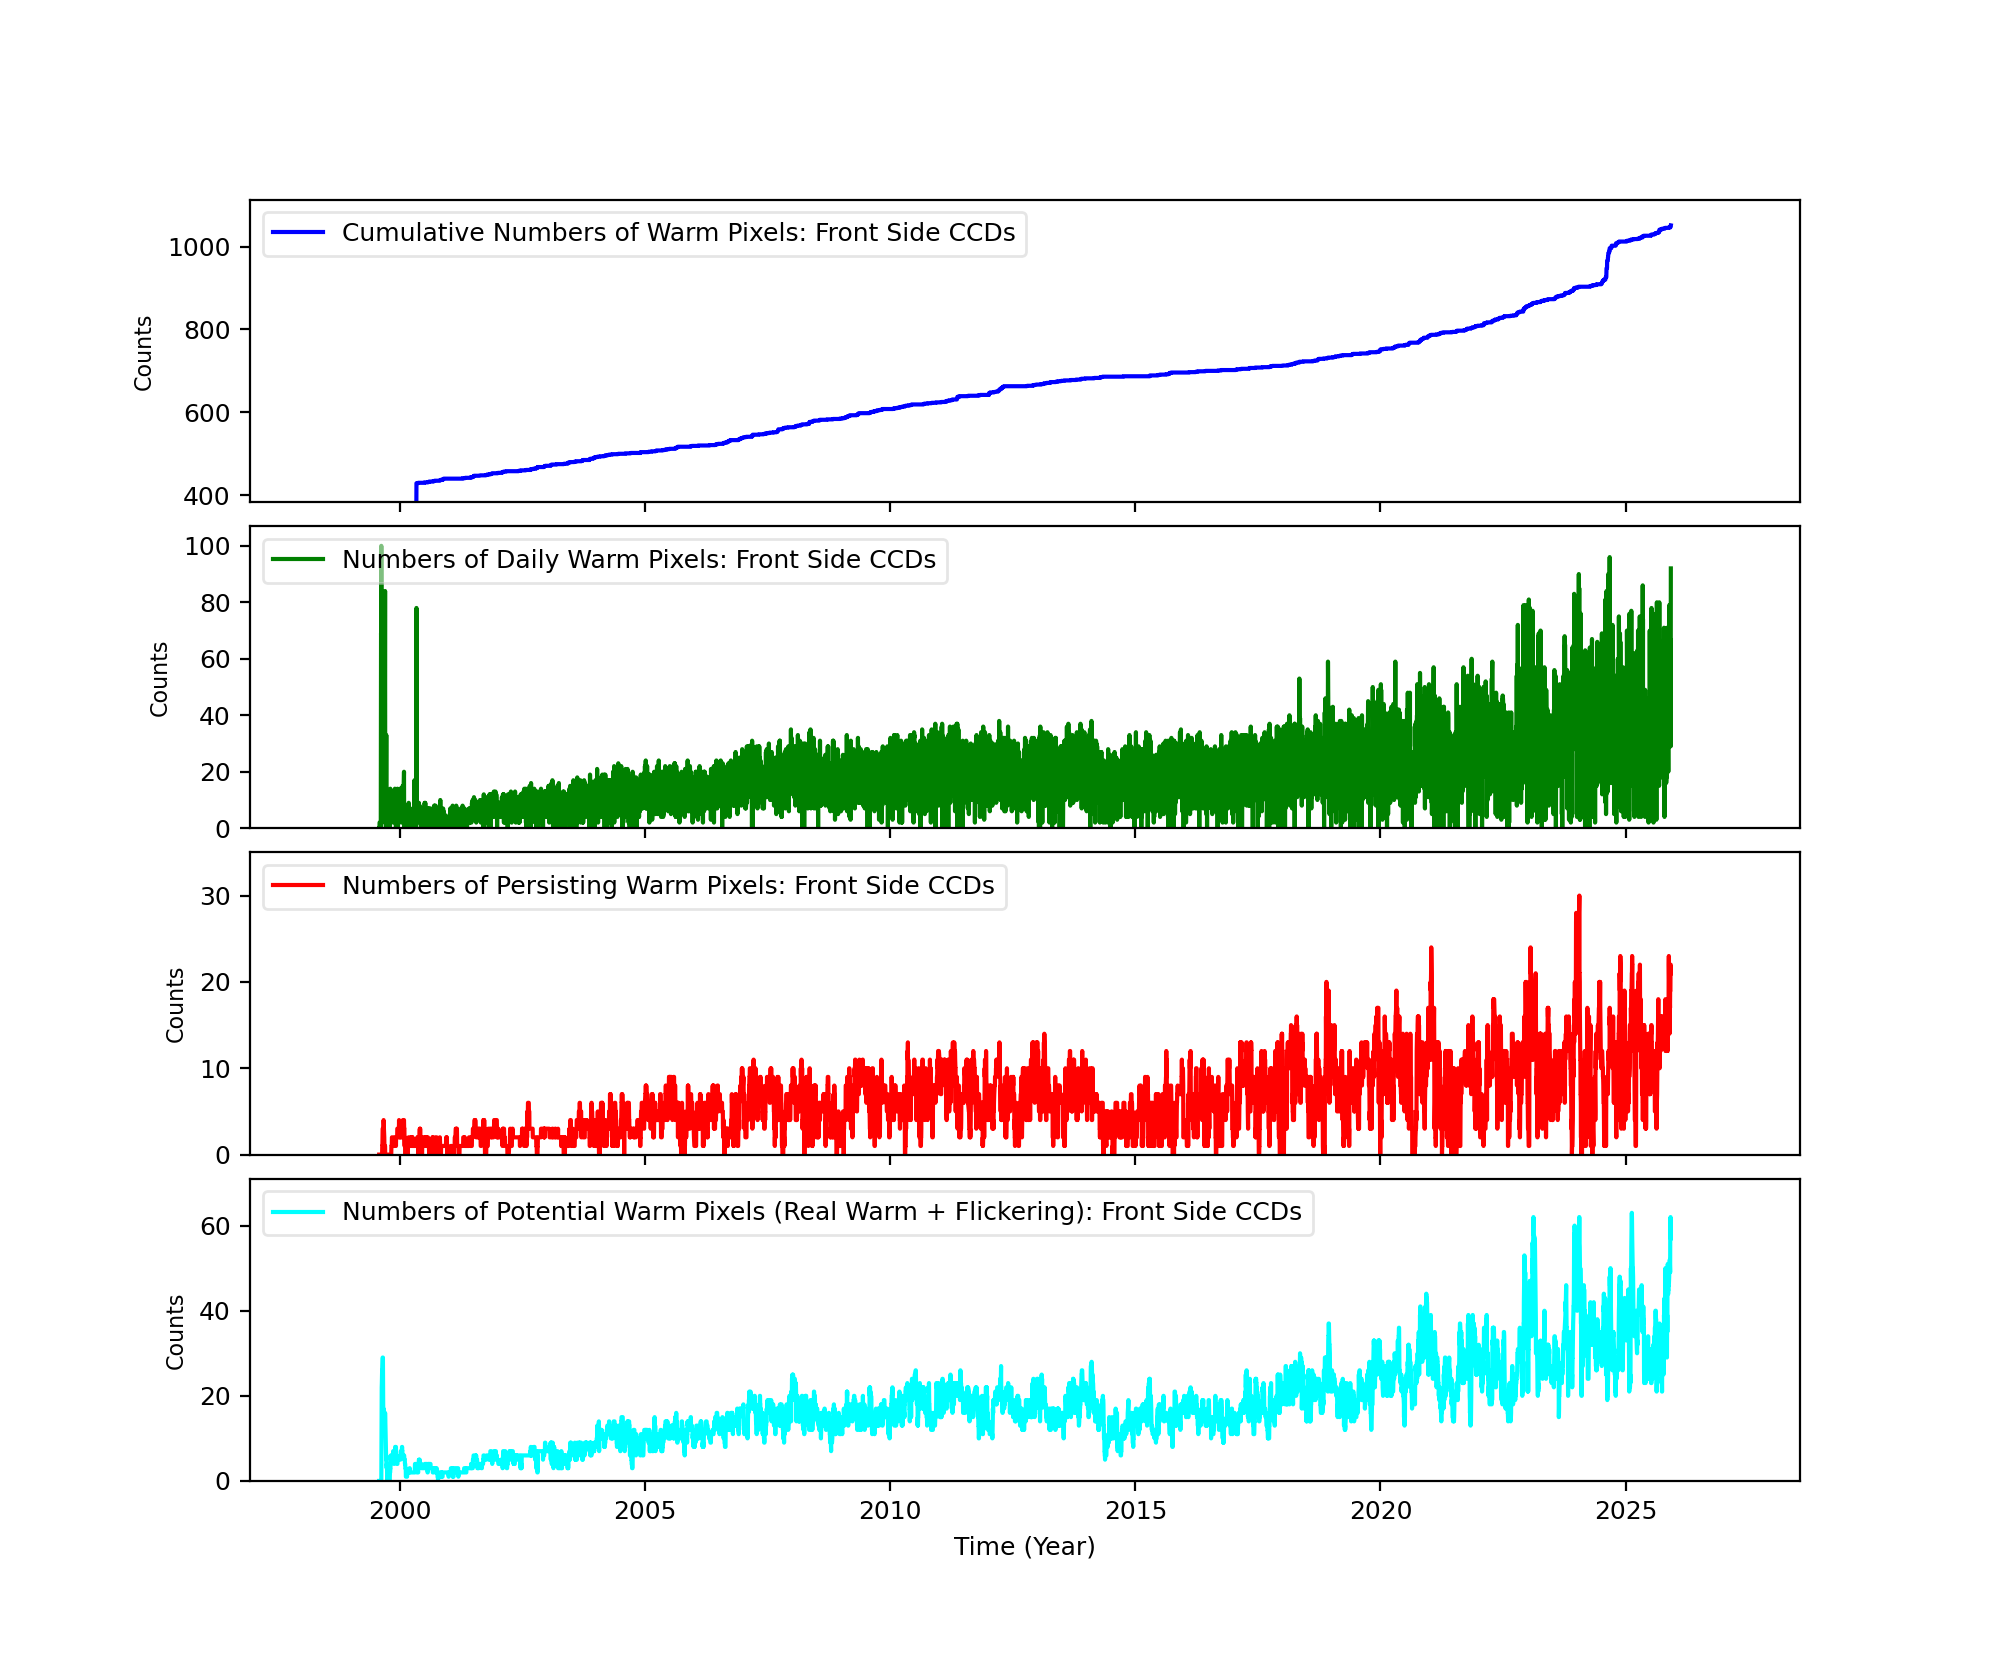
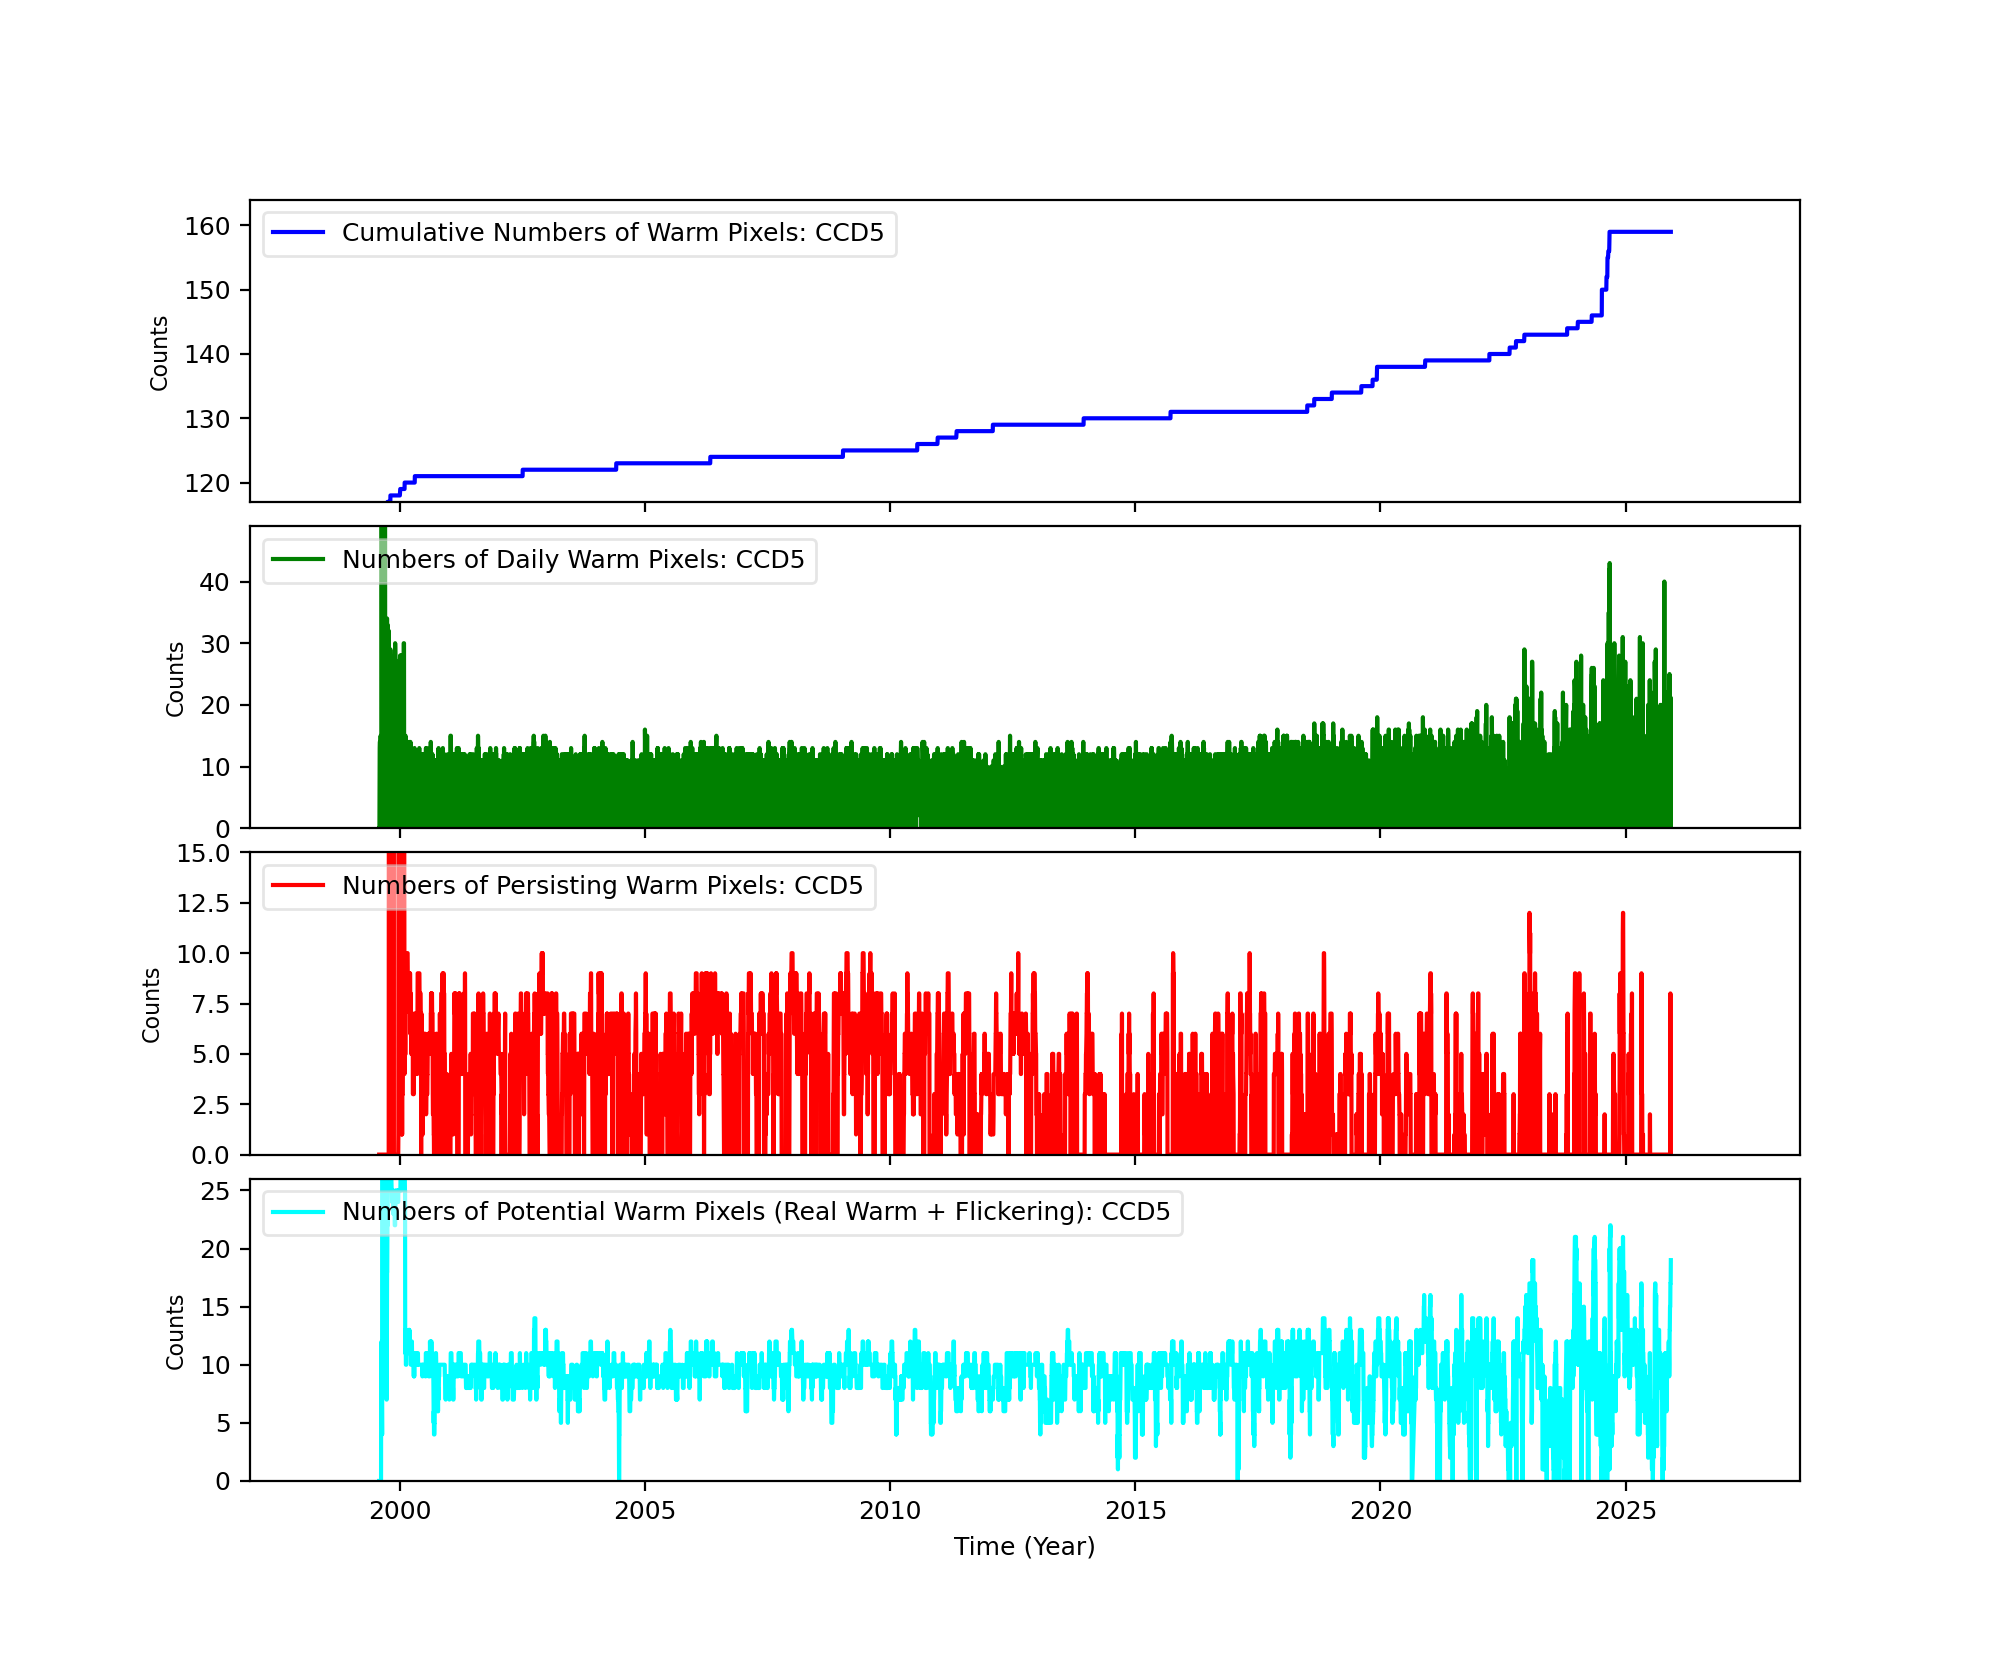
Bad Pixels
The plots below were generated with a new warm pixel finding script. Please see Acis Bad Pixel Page for details.
Front Side CCDs
Back Side CCD (CCD5)
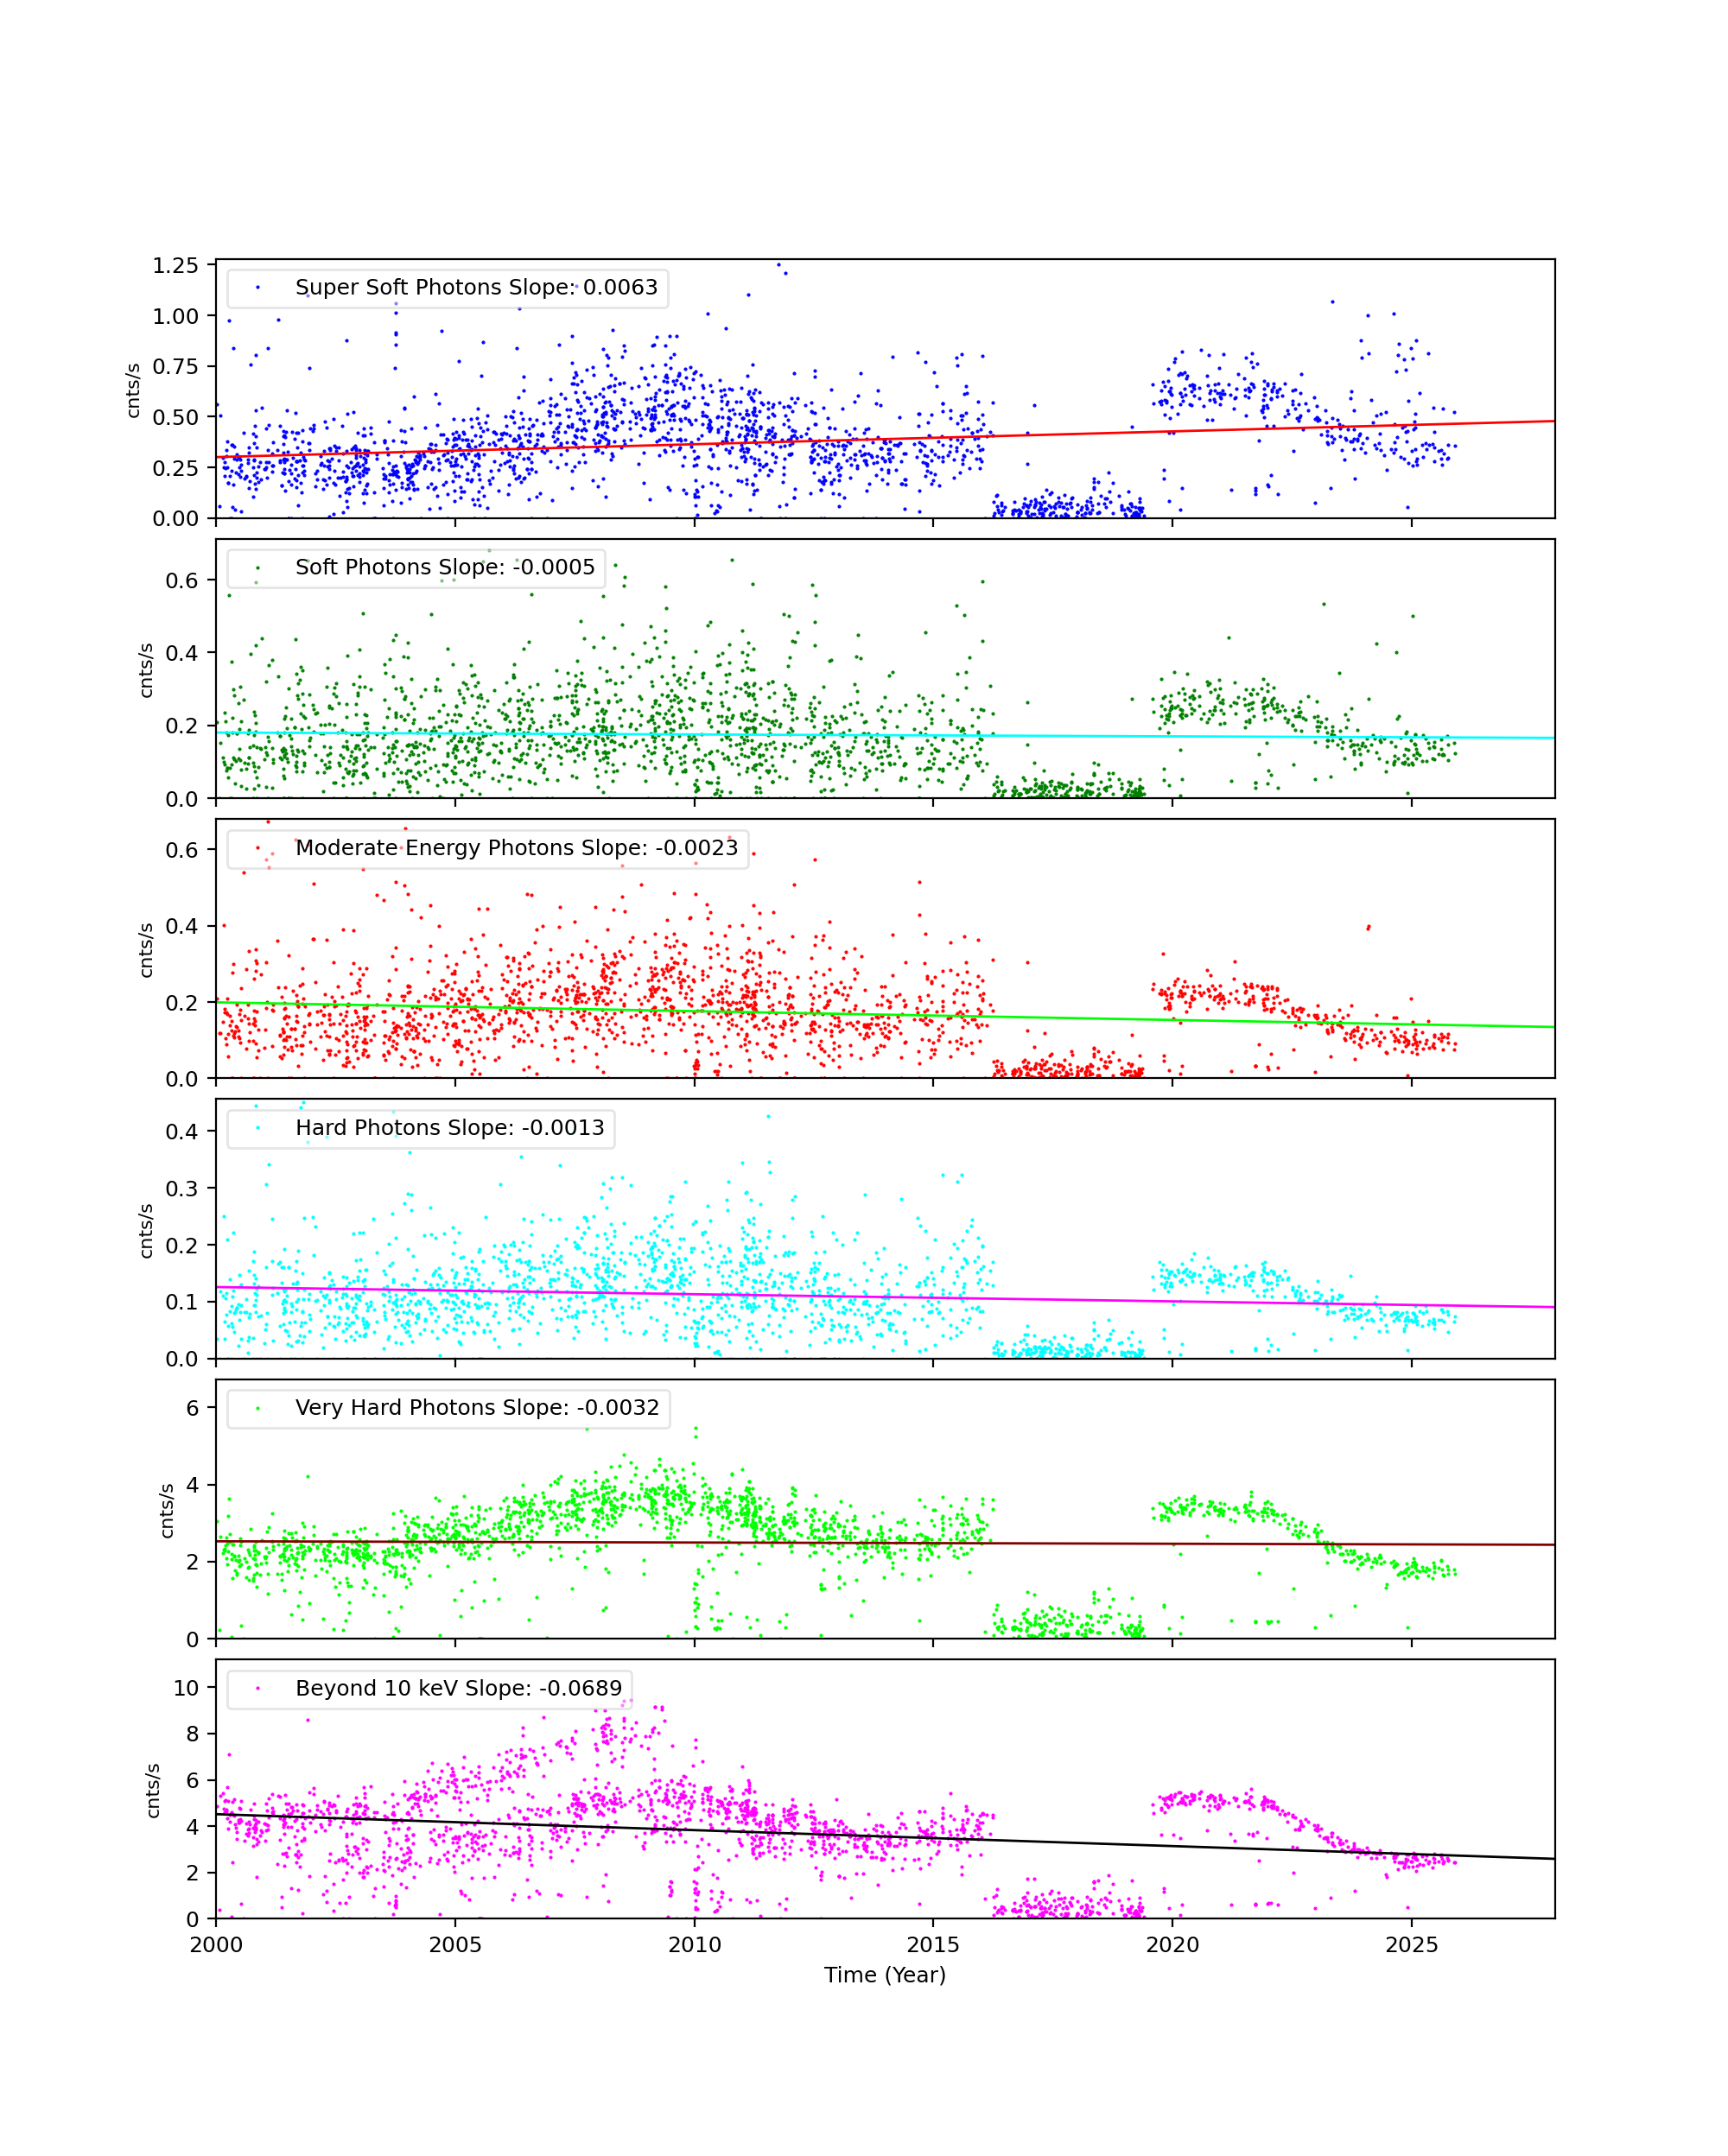
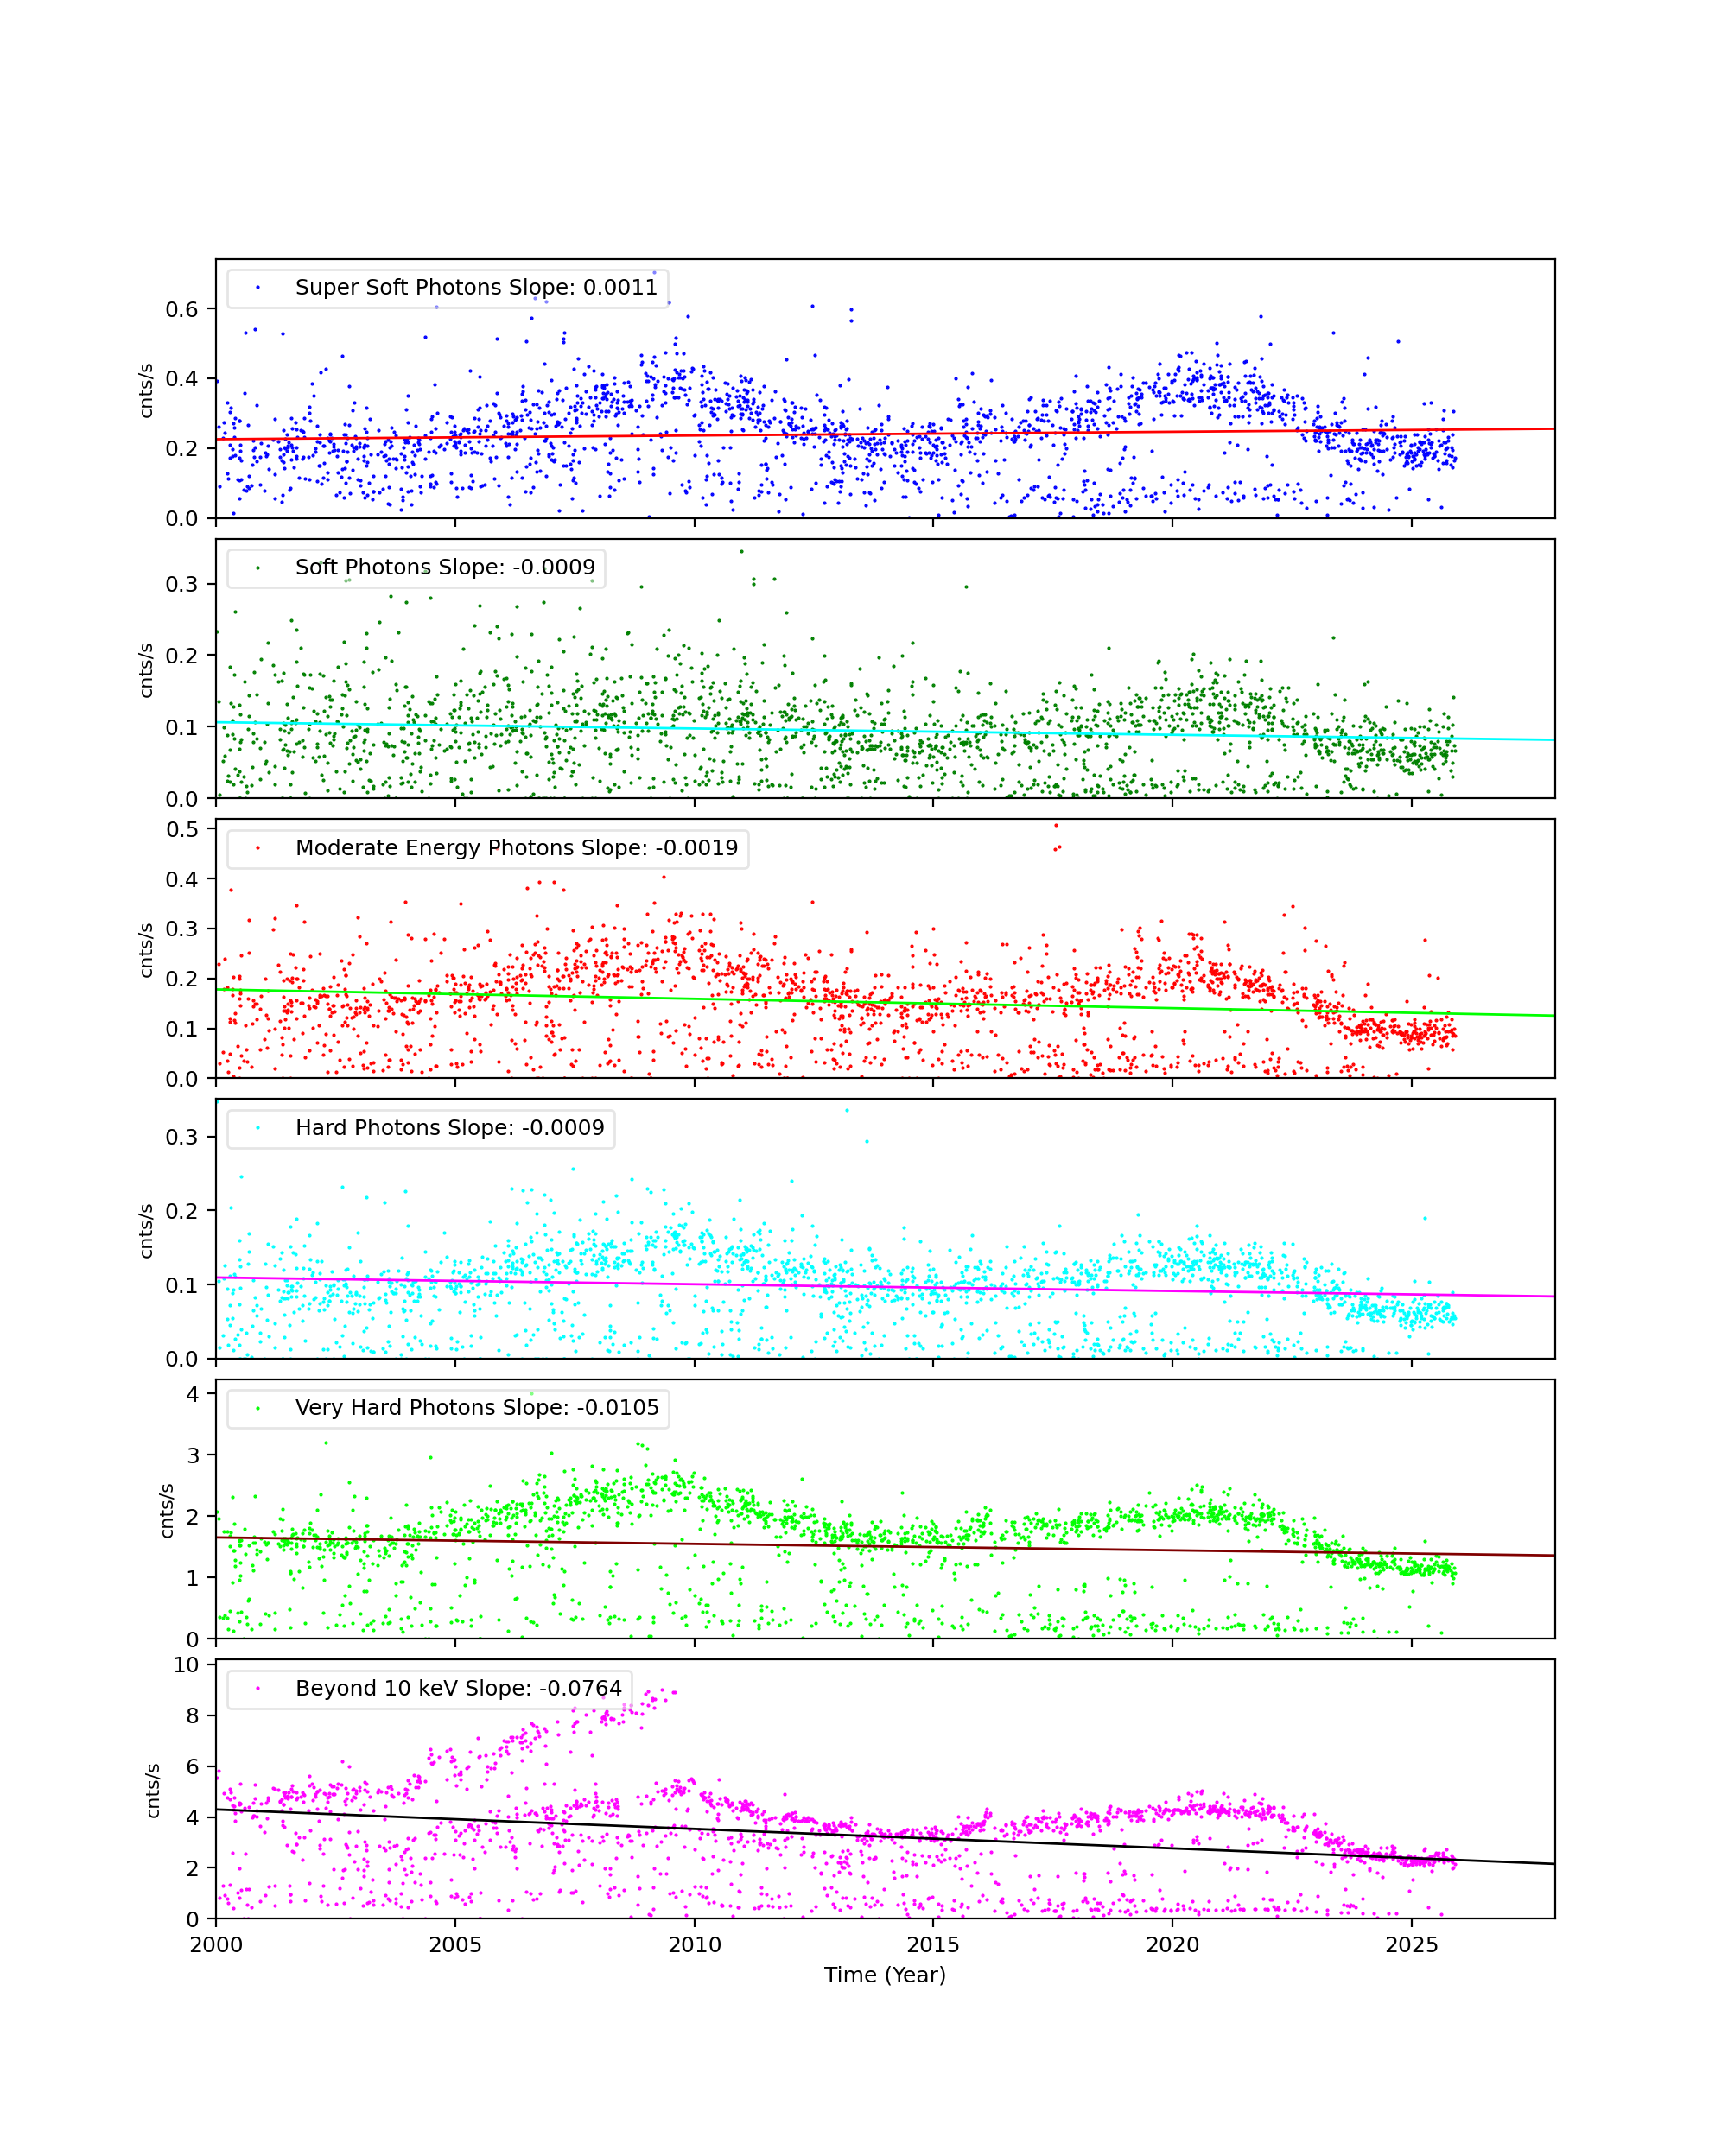
Science Instrument Background Rates
| Name | Low (keV) | High(KeV) | Description |
|---|---|---|---|
| SSoft | 0.00 | 0.50 | Super soft photons |
| Soft | 0.50 | 1.00 | Soft photons |
| Med | 1.00 | 3.00 | Moderate energy photons |
| Hard | 3.00 | 5.00 | Hard Photons |
| Harder | 5.00 | 10.00 | Very Hard photons |
| Hardest | 10.00 | Beyond 10 keV |


The following three plots show trends of SIB from year 2000. CCDs shown here are CCD3, CCD5, and CCD7. Fitted lines are linear fit after eliminating extreme outliers. For >10 keV plots, 2 lines are fit. One is with a 13 keV filter, and another without.
CCD 3
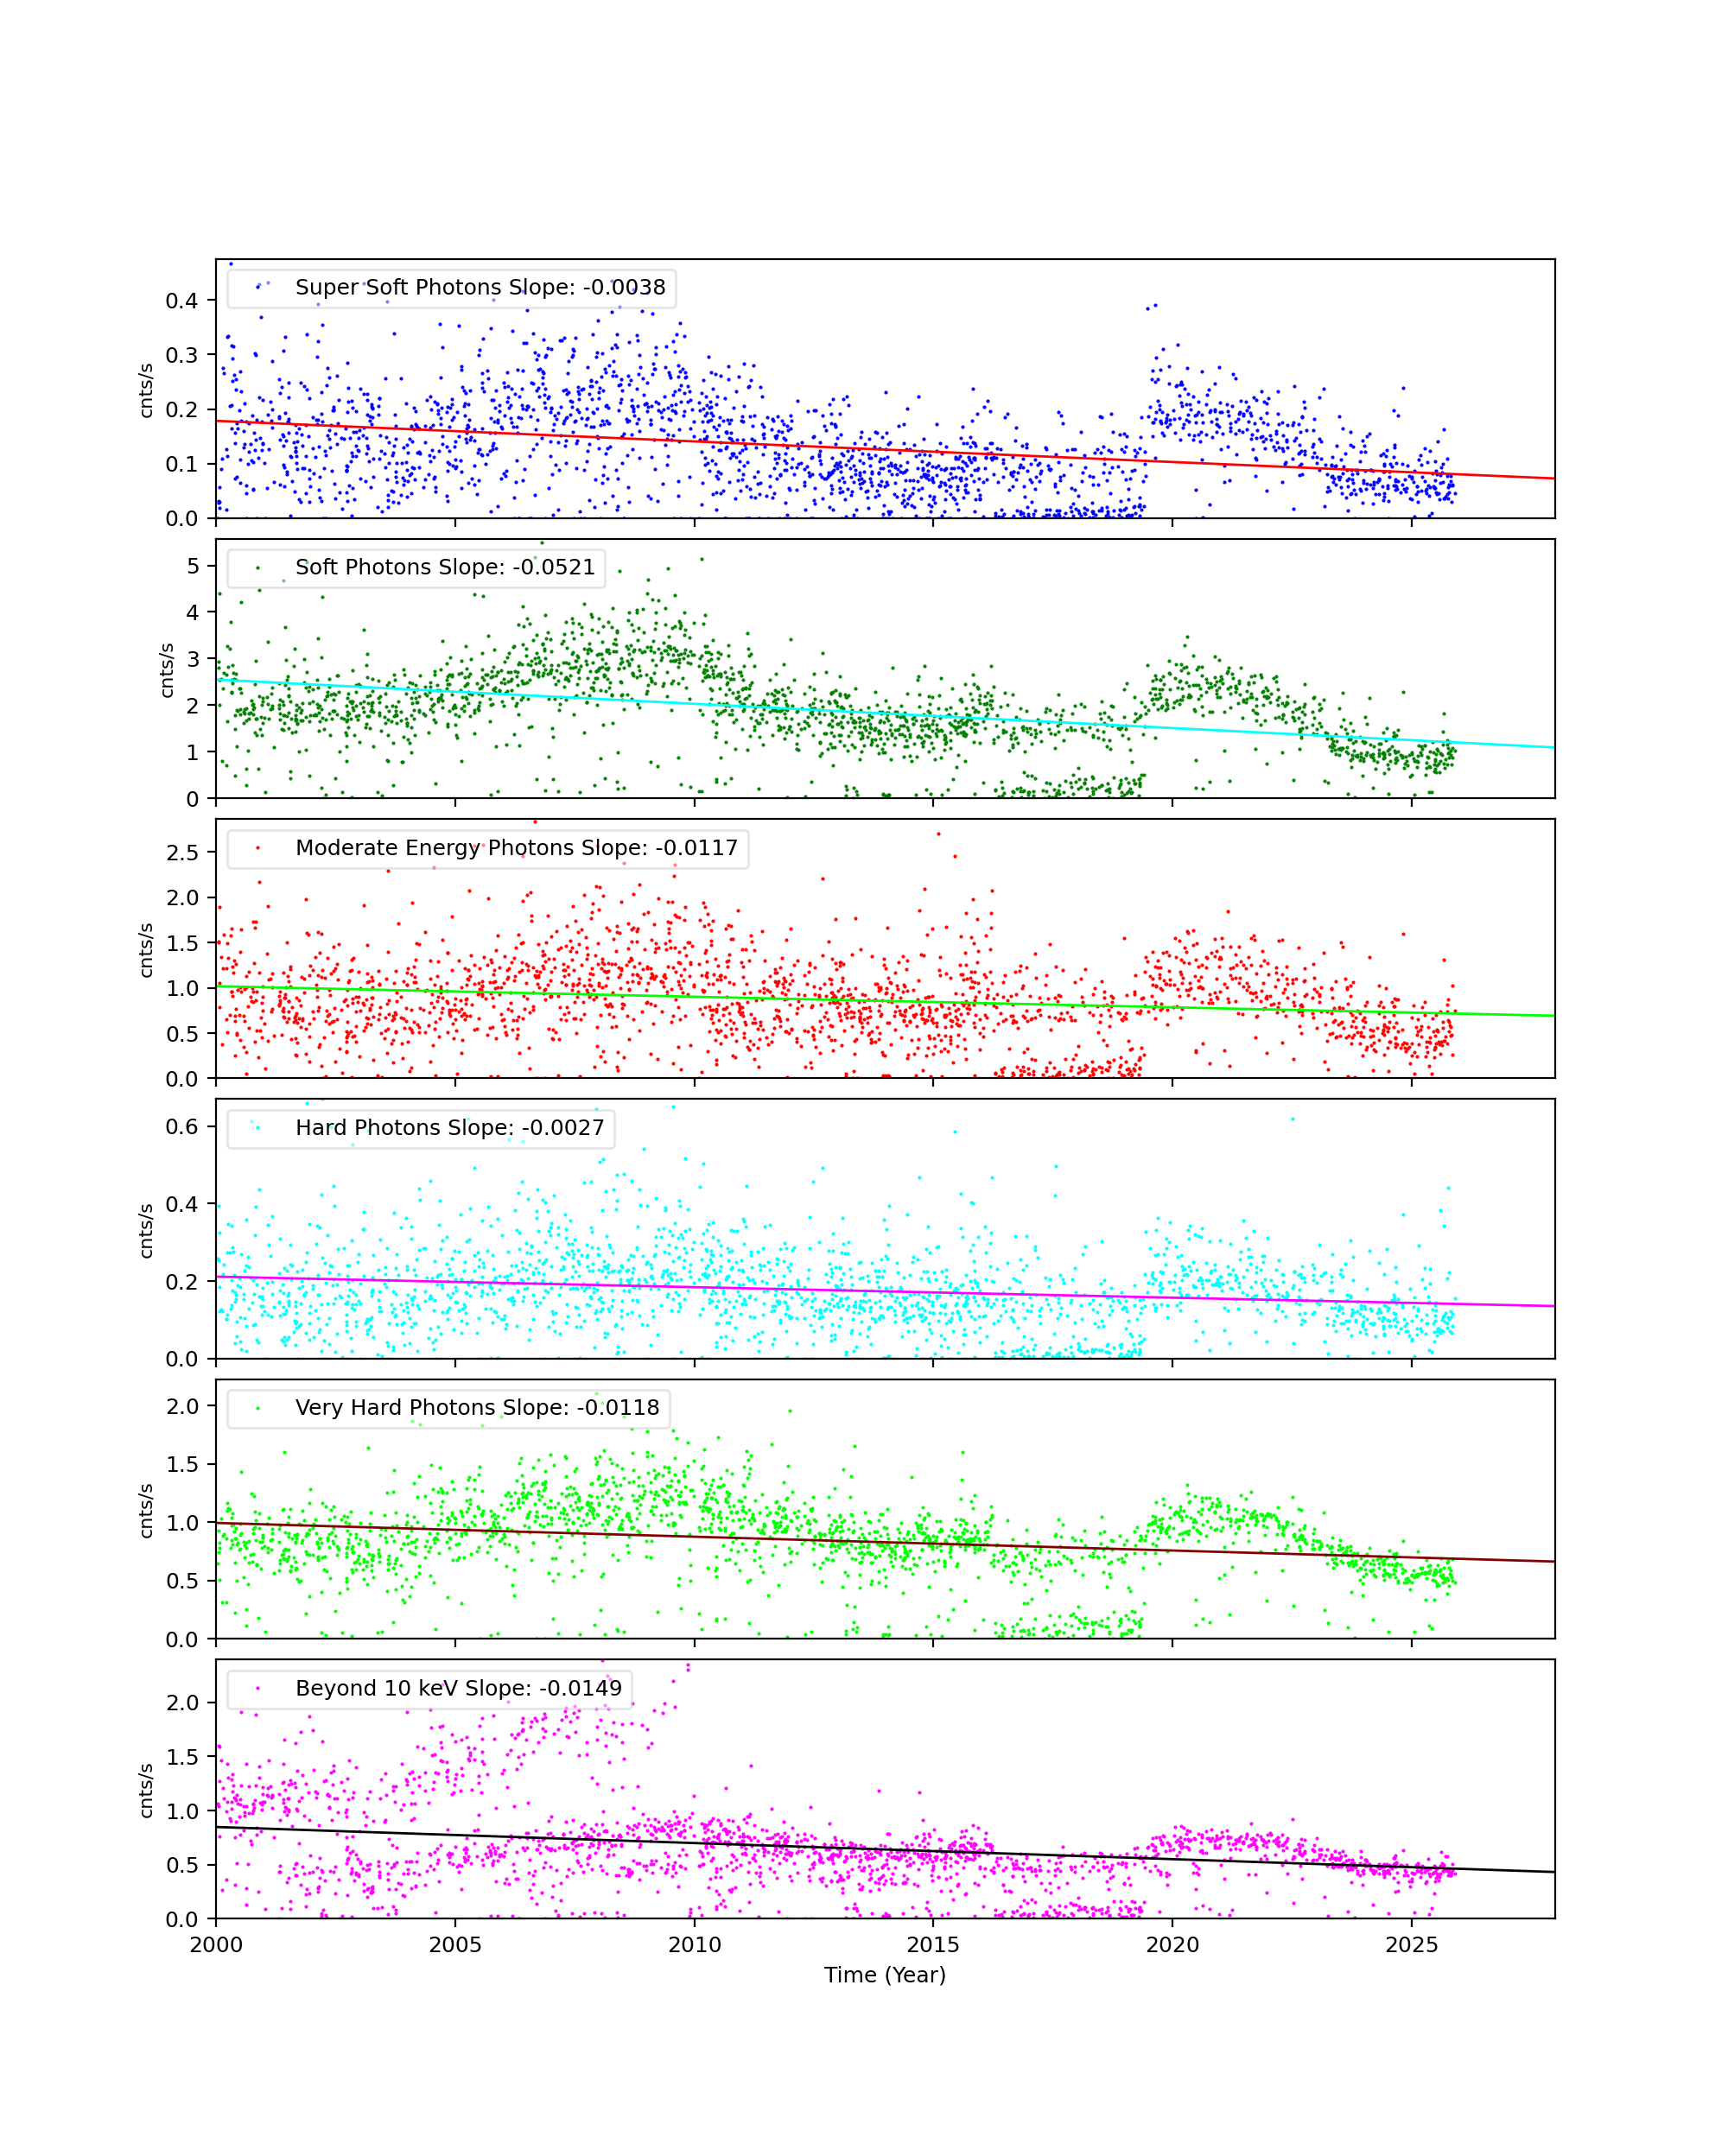
CCD 5
CCD 7
ACIS Histogram Mode Trends
We collected data from acis histogram mode data, and created trend plots of peak portions and peak widths against time (DOM). The peaks were estimated by fitting a simple Gaussian on three peaks (Al, Ti, and Mn), and the widths were estimated by a width at the half max from the peak.
All histogram data are taken under TIMED and GRADED_HIST mode, SIM position is at an external calibration source position, the focal temperature is around -119.7 C, and parameter settings in aciselec, acistemp are set to about same for all.
CCD 3, Peak Position
CCD 3, Peak Widths
CCD 3, Count Rates
HRC
DOSE of Central 4K Pore-Pairs
Please refer to Maximum Dose Trends for more details.
No Data
)
IMAGE                       NPIX      MEAN    STDDEV      MIN       MAX
HRCI_08_1999_11_2025.fits  16777216	na	na	na	na
No Data
)
IMAGE                       NPIX      MEAN    STDDEV      MIN       MAX
HRCS_08_1999_11_2025.fits  16777216	na	na	na	na
|
|
Max dose trend plots corrected for events that "pile-up"
in the center of the taps due to bad position information.
|
)
|
)
|
)
|
)
|
| Aug 2025 | May 2025 | Feb 2025 | Nov 2024 |
|---|
)
|
)
|
)
|
)
|
| Aug 2025 | May 2025 | Feb 2025 | Nov 2024 |
|---|
Gratings
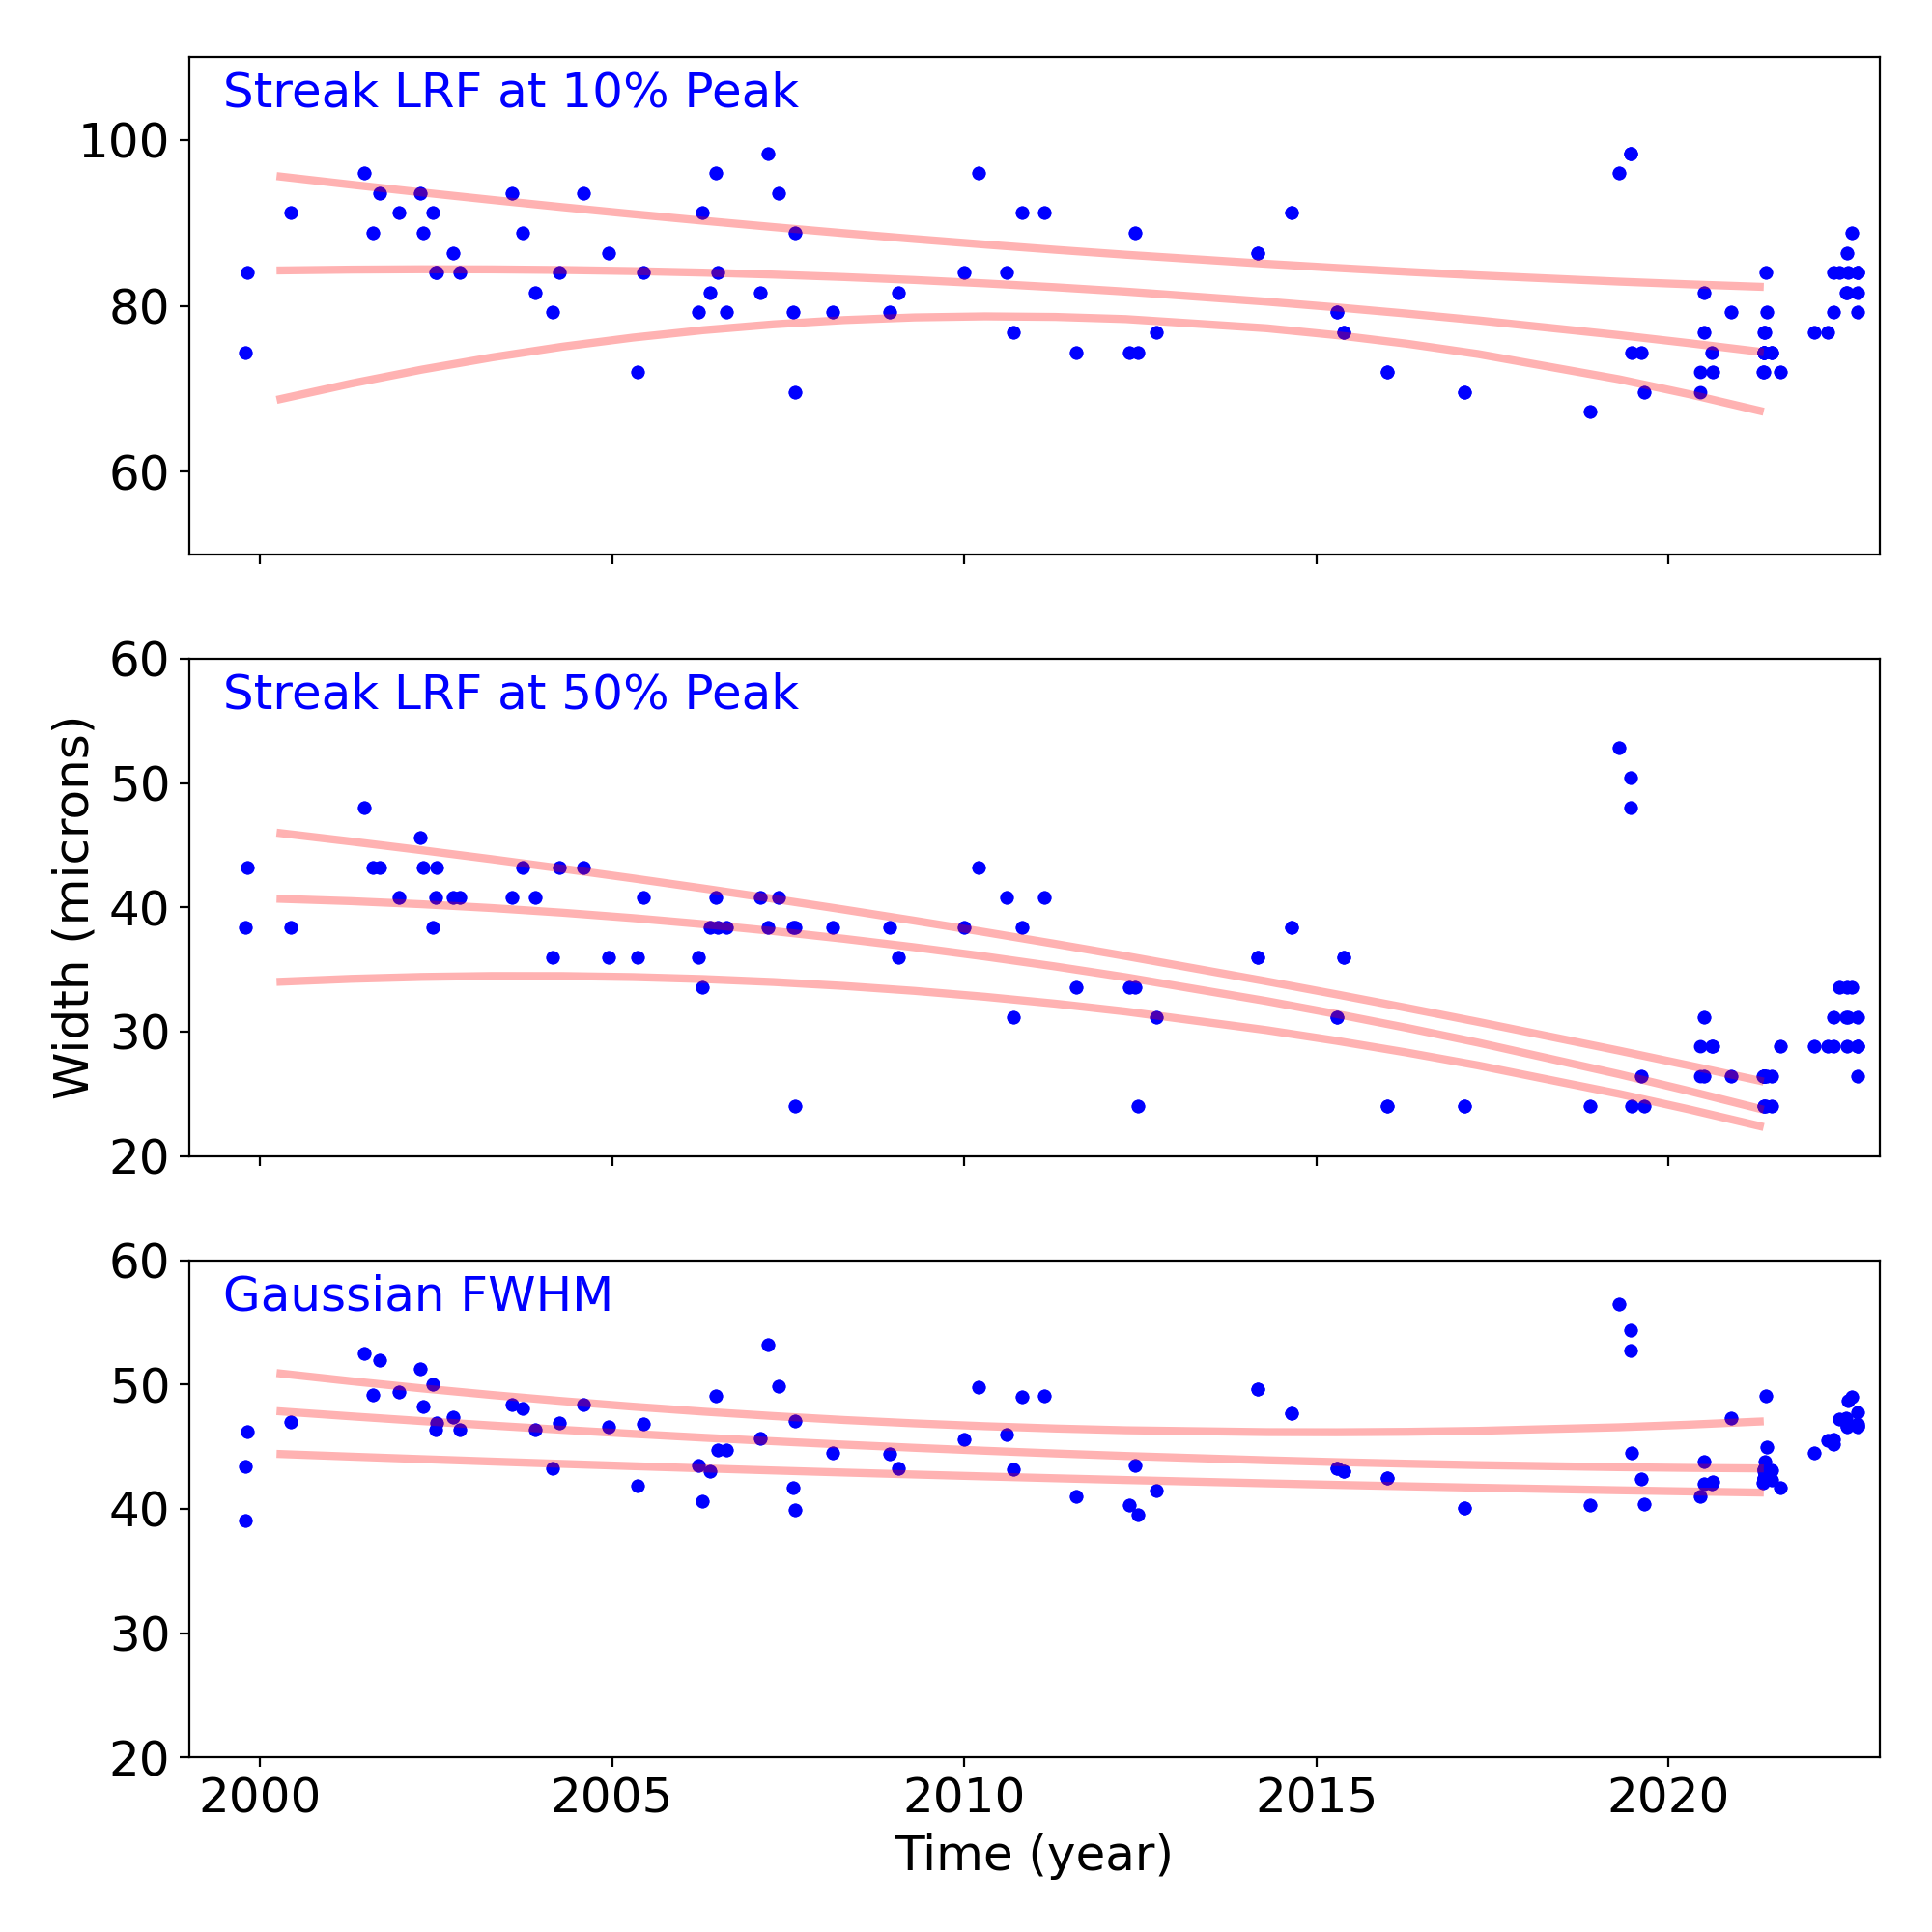
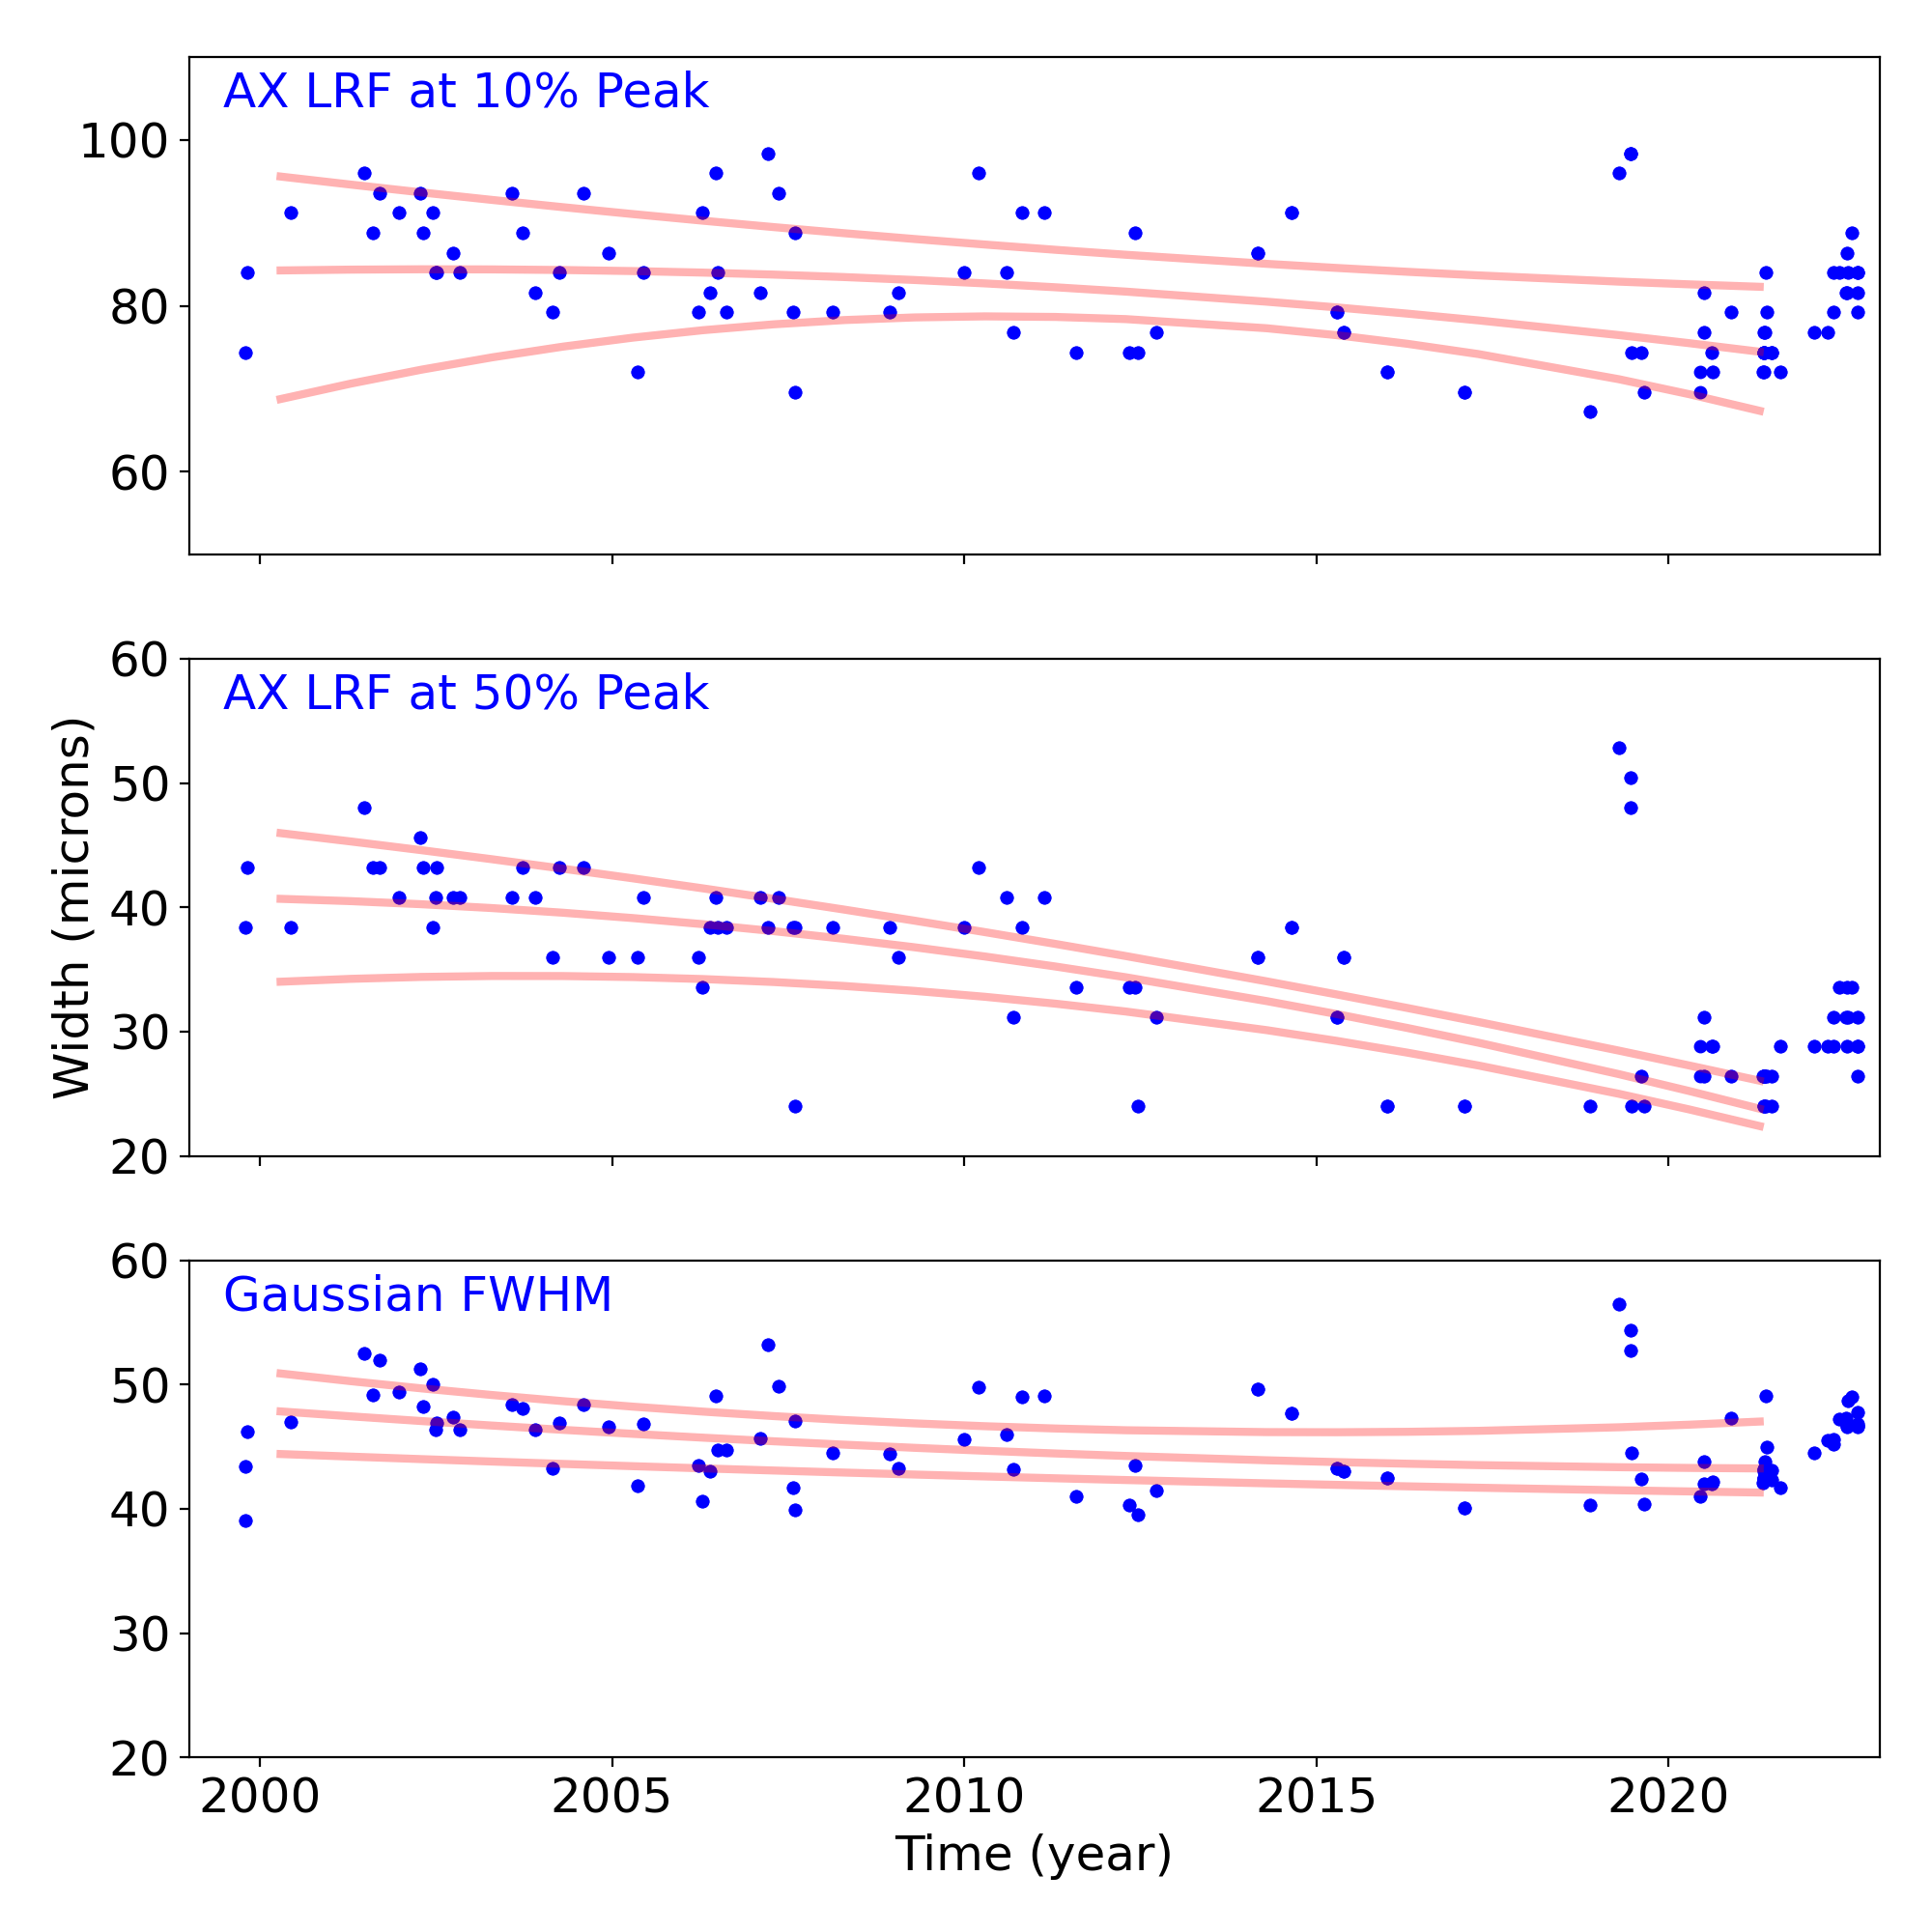
Grating Trends/Focus
We plot the width of the zero order streak of ACIS/HETG observations and the width of the zero order image for HRC/LETG observations of point sources. No significant defocusing trend is seen at this time. See Gratings Trends pages.
PCAD
ACA Trending
| ACIS |
)
|
)
|
)
|
|
|---|---|---|---|---|
)
|
)
|
)
| ||
| HRCI |
)
|
)
|
)
|
)
|
| HRCI |
)
|
)
|
)
|
)
|
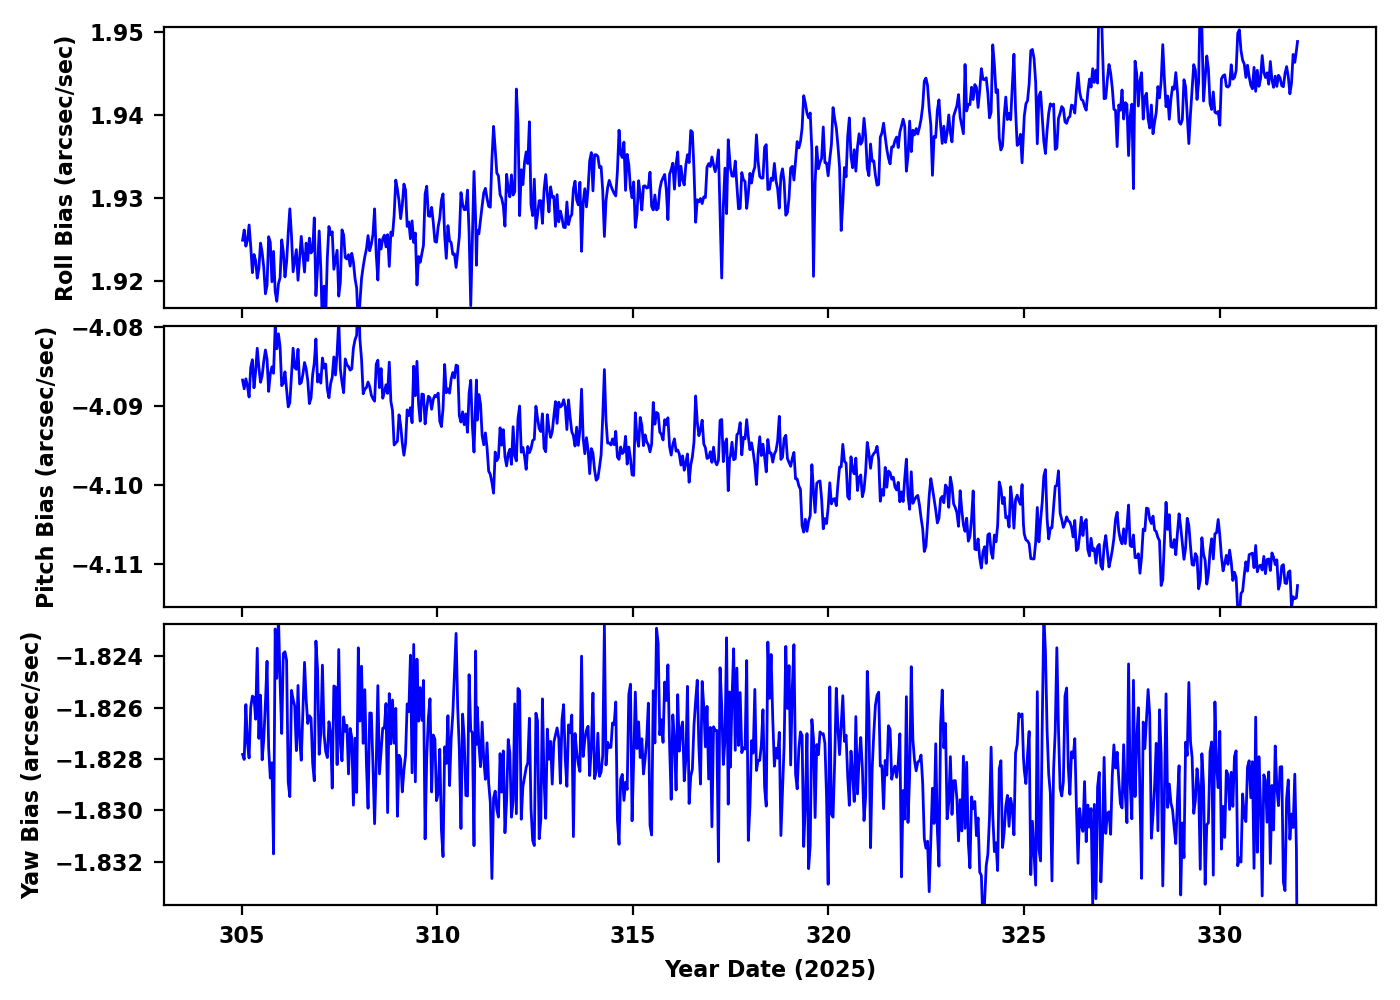
Gyro Bias Drift
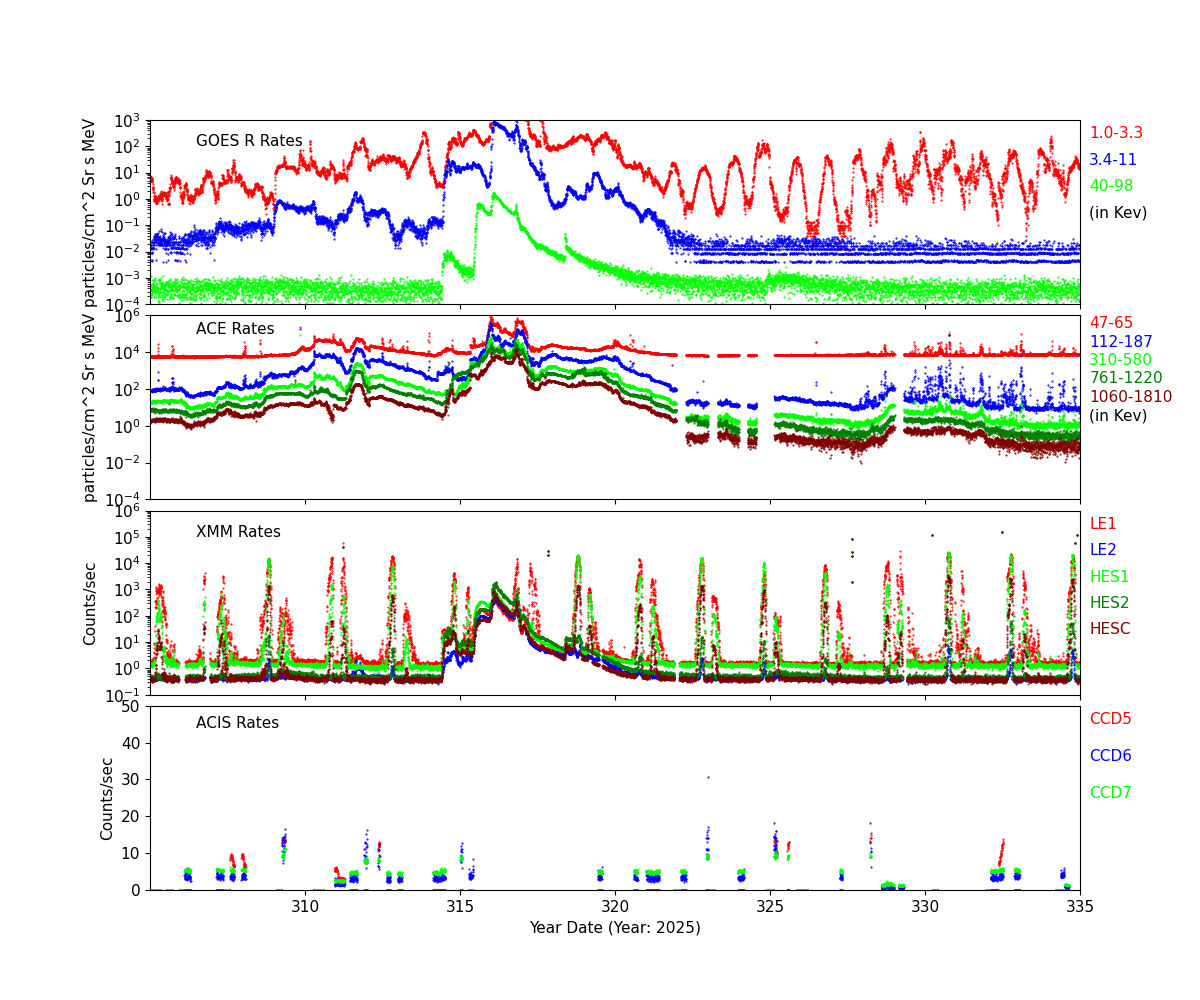
Radiation History
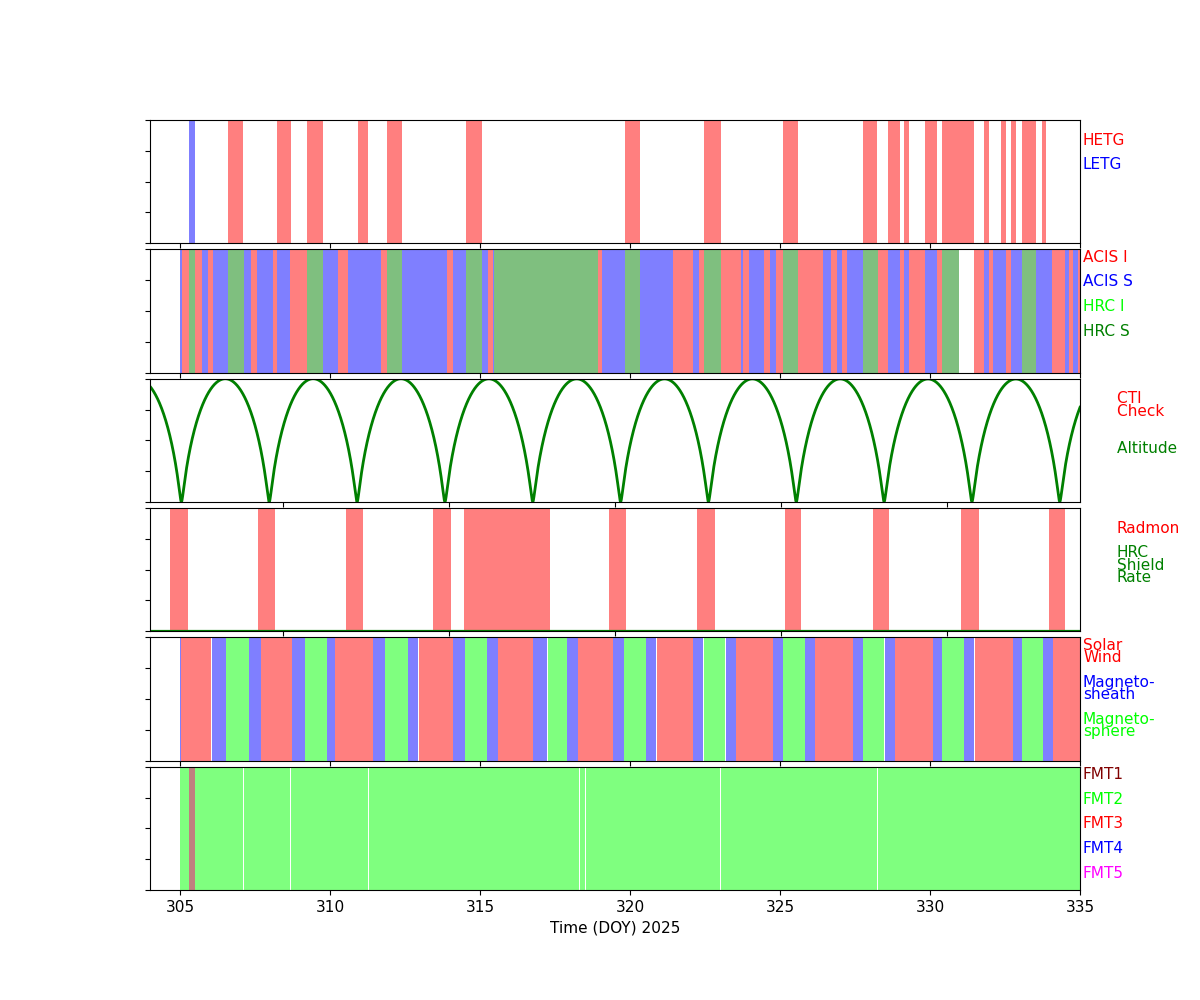
Radiation Count Rates of Nov 2025
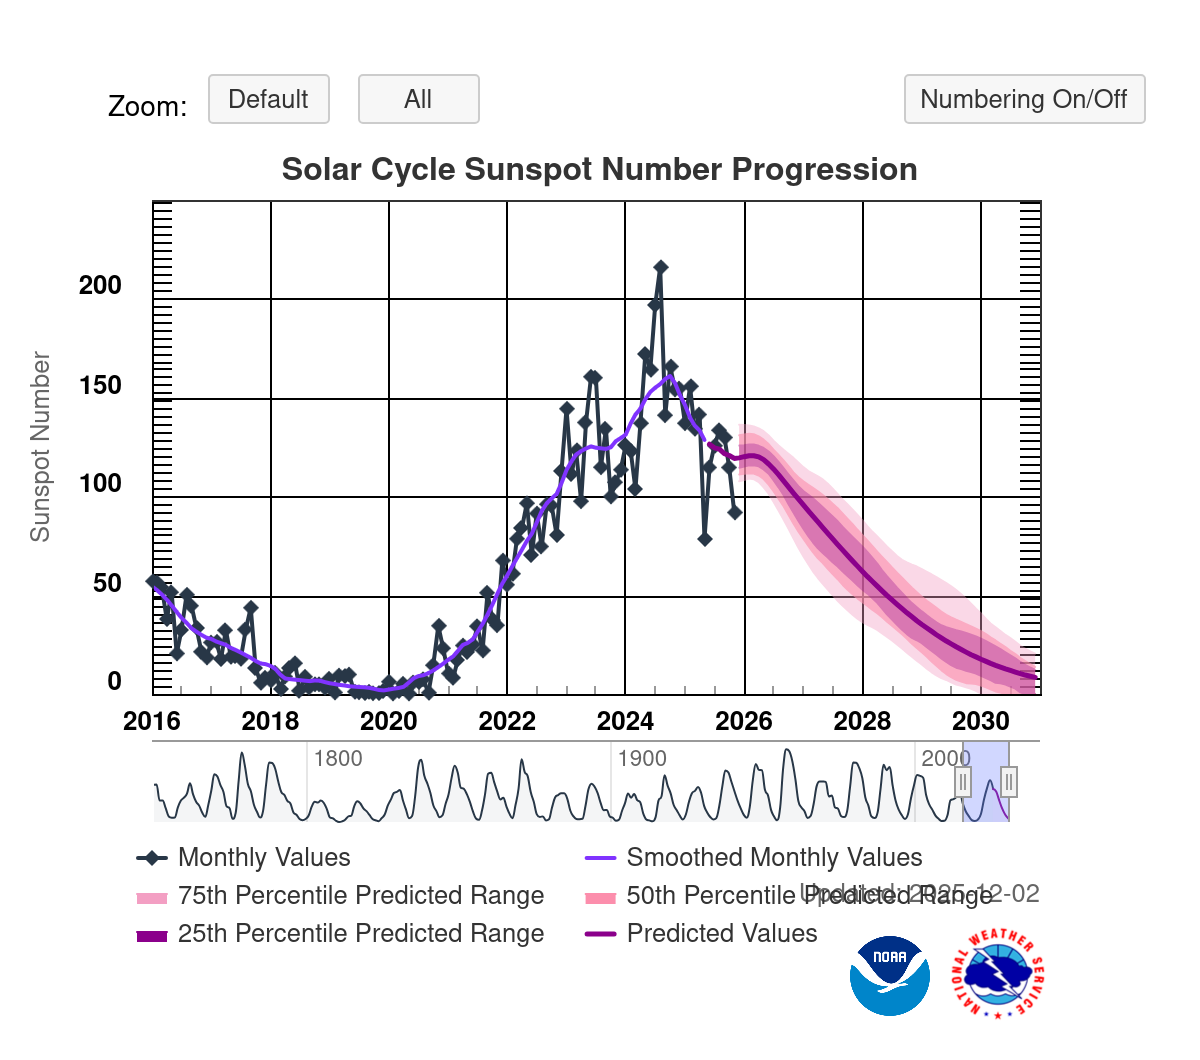
Sun Spot History (See:NOAA Page)
Trending
Quarterly Trends
- HRMA Heater
| Previous Quarter | |||||||
| MSID | MEAN | RMS | DELTA/YR | DELTA/YR/YR | UNITS | DESCRIPTION | |
| ohrthr03 | 2.306e-04 | 3.101e-05 | (2.95+/-0.00)e2 | 0.04 +/- 0.01 | K | RT 5: HRMA FORWARD APERTURE PLATE | |
|---|---|---|---|---|---|---|---|
| ohrthr09 | 8.754e-04 | 1.737e-04 | (2.96+/-0.00)e2 | 0.31 +/- 0.05 | K | RT 105: HRMA CAP | |
| ohrthr17 | 9.394e-04 | 1.848e-04 | (2.96+/-0.00)e2 | 0.33 +/- 0.06 | K | RT 125: HSA OUTER CYNLINDER | |
| ohrthr24 | 0.002 | 3.337e-04 | (2.97+/-0.01)e2 | 0.64 +/- 0.14 | K | RT 12: HRMA AFT HEATER PLATE | |
| ohrthr38 | 0.006 | 8.678e-04 | (3.01+/-0.02)e2 | 1.27 +/- 0.49 | K | RT 120: HRMA AFT COLLIMATOR OUTER CYLINDER | |
| ohrthr52 | 8.998e-04 | 1.806e-04 | (2.96+/-0.00)e2 | 0.33 +/- 0.06 | K | RT 100: HRMA CAP | |
- HRMA Thermal
| Previous Quarter | |||||||
| MSID | MEAN | RMS | DELTA/YR | DELTA/YR/YR | UNITS | DESCRIPTION | |
| 4rt568t | 0.006 | 9.319e-04 | (3.00+/-0.02)e2 | 1.26 +/- 0.53 | K | RT 568 - HRMA TEMP | |
|---|---|---|---|---|---|---|---|
| 4rt569t | 0.002 | 2.987e-04 | (2.97+/-0.01)e2 | 0.64 +/- 0.12 | K | RT 569 - HRMA TEMP | |
| 4rt570t | 0.001 | 1.639e-04 | (2.96+/-0.00)e2 | 0.31 +/- 0.06 | K | RT 570 - HRMA TEMP | |
| 4rt575t | 0.008 | 0.001 | (3.06+/-0.03)e2 | 1.55 +/- 0.67 | K | RT 575 - OB CONE TEMP | |
| 4rt576t | 0.007 | 9.279e-04 | (2.96+/-0.02)e2 | 1.40 +/- 0.53 | K | RT 576 - OB CONE TEMP | |
| 4rt578t | 0.009 | 0.002 | (3.04+/-0.04)e2 | 1.66 +/- 0.87 | K | RT 578 - OB CONE TEMP | |
- MUPS
| Previous Quarter | |||||||
| MSID | MEAN | RMS | DELTA/YR | DELTA/YR/YR | UNITS | DESCRIPTION | |
| pm1thv1t | 0.016 | 0.007 | (3.52+/-0.16)e2 | -1.18 +/- 2.51 | K | MUPS 1 THRUSTER VALVE 01 TEMP | |
|---|---|---|---|---|---|---|---|
| pline02t | 0.023 | 0.005 | (3.36+/-0.12)e2 | 0.78 +/- 2.28 | K | PROP LINE TEMP 02 | |
| pline03t | 0.025 | 0.006 | (3.29+/-0.14)e2 | 0.57 +/- 2.15 | K | PROP LINE TEMP 03 | |
| pline04t | 0.023 | 0.005 | (3.17+/-0.11)e2 | 2.82 +/- 2.29 | K | PROP LINE TEMP 04 | |
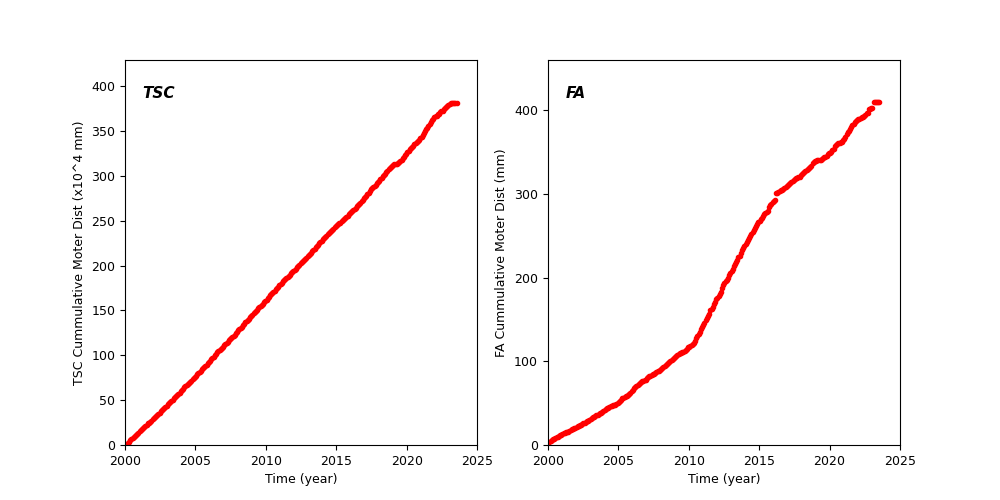
Spacecraft Motions
TSC and FA Cummulative Moter Distance
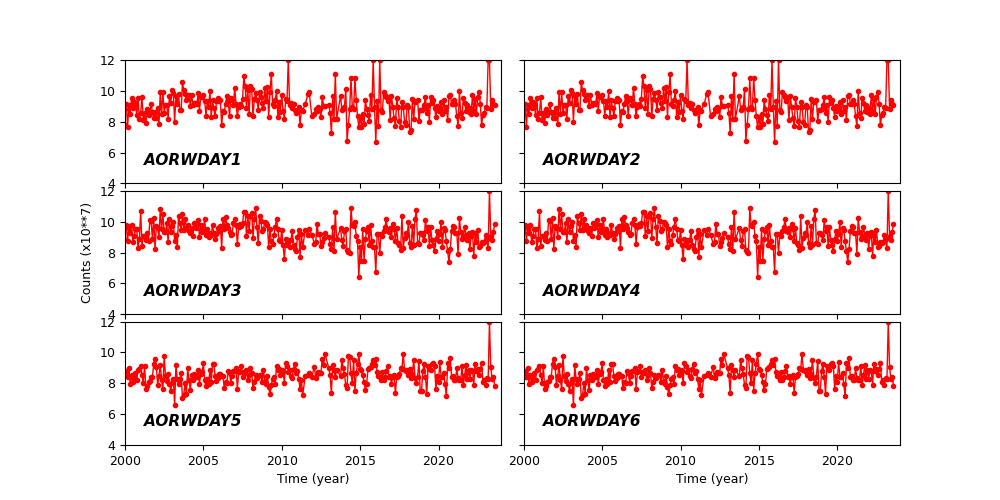
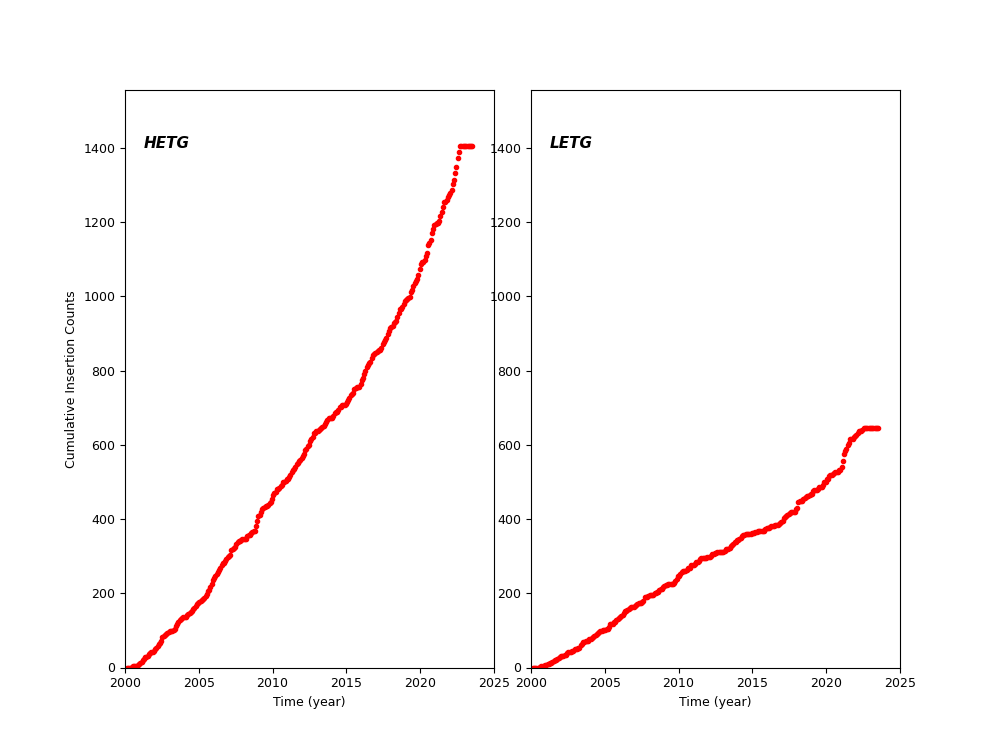
HETG and LETG Cummulative Insertion Counts
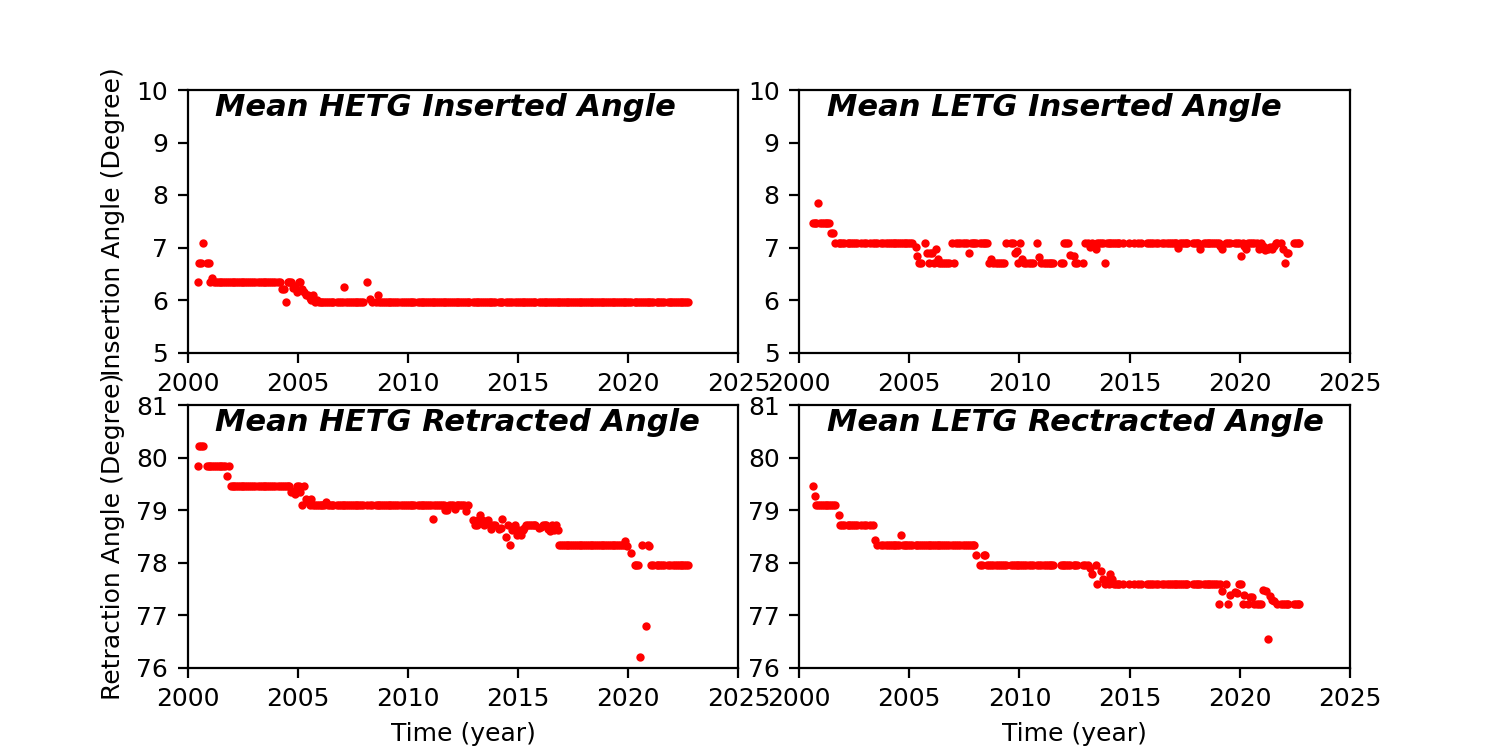
HETG/LETG Insertion/Retraction Angle
Reaction Wheel Rotations