ACIS
ACIS DOSE Registered-Photon-Map
The steps we took to compute the dose map are;
- Level 1 Event files for a specified month are obtained from archive.
- Image data including I2, I3, S2, S3 CCDs are extracted from all event files.
- All the extracted image data were merged to create a month long exposure map for the month.
- The exposure map is opened with ds9, and check a distribution of count rates against energy. From this, estimate the upper threshold value. Any events beyond this upper threshold are assumed erroneous events such as bad pixels.
- Using this upper threshold, the data is filtered, and create a cleaned exposure map for the month.
- The exposure map from each month from the Sep 1999 is added up to create a cumulative exposure map for each month.
- Using fimgstatistic, we compute count rate statistics for each CCDs.
- For observations with high data drop rates (e.g., Crab nebula, Cas A), we corrected the observations by adding events.
Please check more detail plots at Telemetered Photon Dose Trend page.
)
)
)
Statistics:
# IMAGE     NPIX     MEAN        RMS        MIN     MAX
ACIS_dec25 6004901       5.005         8.475           0.0      494


I2 node 0  262654	3.557868	2.167352	0.0	 41.0
I2 node 1  262654	3.939513	2.511312	0.0	393.0
I2 node 2  262654	4.770716	3.192166	0.0	 66.0
I2 node 3  262654	7.066396	6.632893	0.0	448.0

I3 node 0  262654	11.637359	11.537262	0.0	434.0
I3 node 1  262654	6.768648	4.073572	0.0	 82.0
I3 node 2  262654	5.000035	2.697366	0.0	 60.0
I3 node 3  262654	4.381016	2.574861	0.0	494.0

S2 node 0  262654	5.326720	5.132274	0.0	 88.0
S2 node 1  262654	5.487103	5.318587	0.0	250.0
S2 node 2  262654	6.660401	9.113385	0.0	258.0
S2 node 3  262654	6.619198	7.769172	0.0	452.0

S3 node 0  262654	8.907667	11.948845	0.0	239.0
S3 node 1  262654	9.335205	13.190150	0.0	207.0
S3 node 2  262654	9.888224	16.260911	0.0	215.0
S3 node 3  262654	8.676498	14.574555	0.0	198.0
)
)
)
Statistics:
 IMAGE     NPIX      MEAN        RMS           MIN      MAX
ACIS_total   6004901       2762.126         3481.202           0.0   169725


I2 node 0  262654	2397.653326	487.730586	511.0	16130.0
I2 node 1  262654	2530.431689	714.608916	524.0	167719.0
I2 node 2  262654	2559.754380	545.865331	548.0	17921.0
I2 node 3  262654	2567.615266	672.225945	507.0	37733.0

I3 node 0  262654	2783.007529	703.750933	507.0	16803.0
I3 node 1  262654	2851.622248	1760.811181	534.0	56099.0
I3 node 2  262654	2555.382234	480.606163	501.0	15660.0
I3 node 3  262654	2529.706080	517.264339	482.0	37204.0

S2 node 0  262654	3221.120569	520.099263	1733.0	22689.0
S2 node 1  262654	3422.131696	782.336050	1912.0	22359.0
S2 node 2  262654	3795.820083	785.380037	2326.0	34296.0
S2 node 3  262654	3751.951859	645.020652	2045.0	89344.0

S3 node 0  262654	5704.602202	3077.575554	2515.0	55601.0
S3 node 1  262654	6927.652918	2411.680963	0.0	83602.0
S3 node 2  262654	5662.647695	1385.927470	2669.0	27742.0
S3 node 3  262654	4454.246168	784.575786	2673.0	26839.0
)
|
)
|
)
|
)
|
| Sep 2025 | Jun 2025 | Mar 2025 | Dec 2024 |
|---|
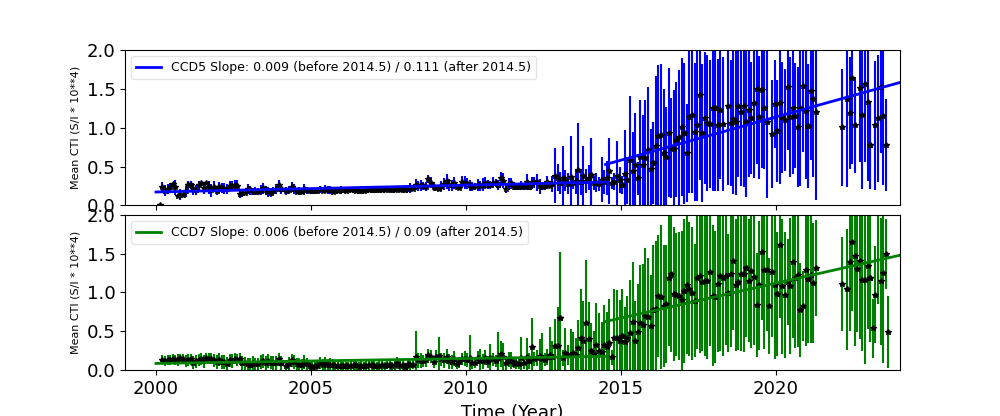
The Mean Detrended CTI
We report CTIs with a refined data definition. CTIs were computed for the temperature dependency corrected data. Please see CTI page for detailed explanation. CTI's are computed for Mn K alpha, and defined as slope/intercept x10^4 of row # vs ADU. Data file: here
Imaging CCDs
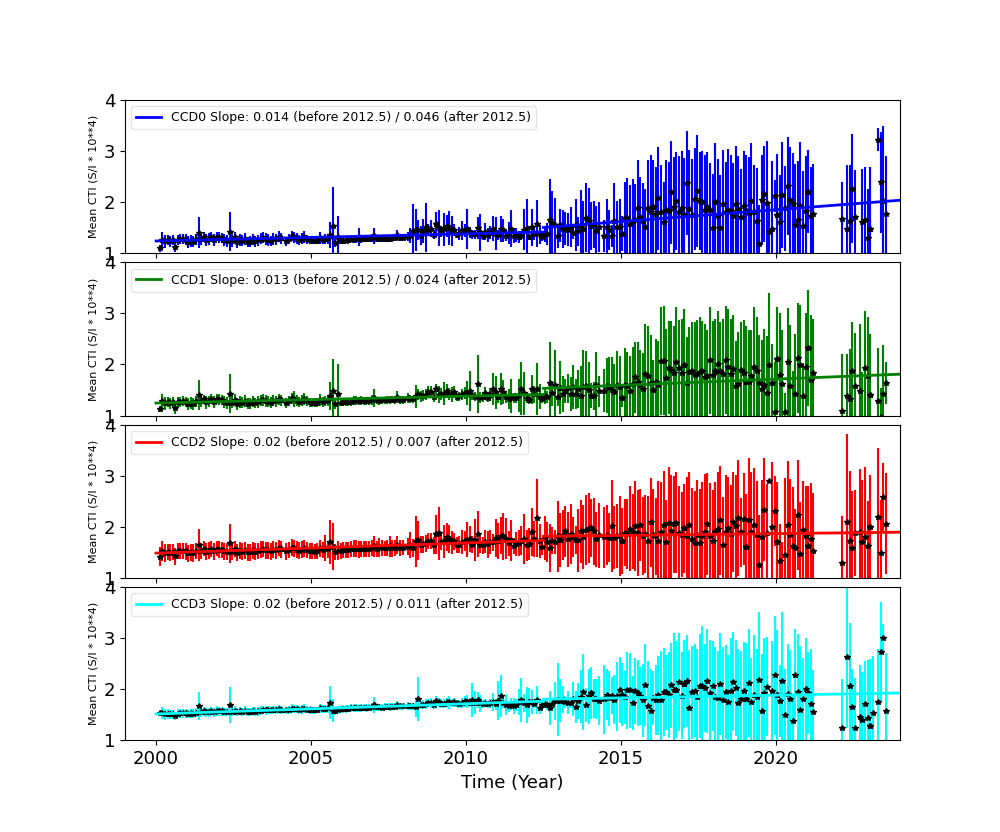
Spectral CCDs
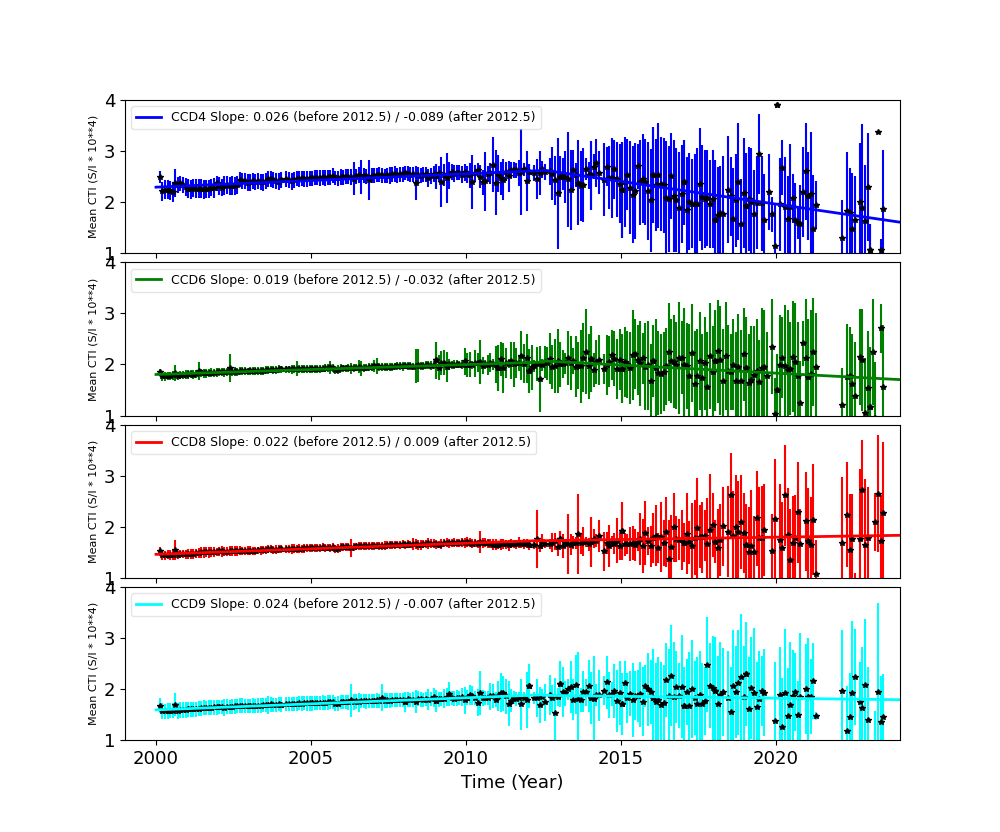
Backside CCDs
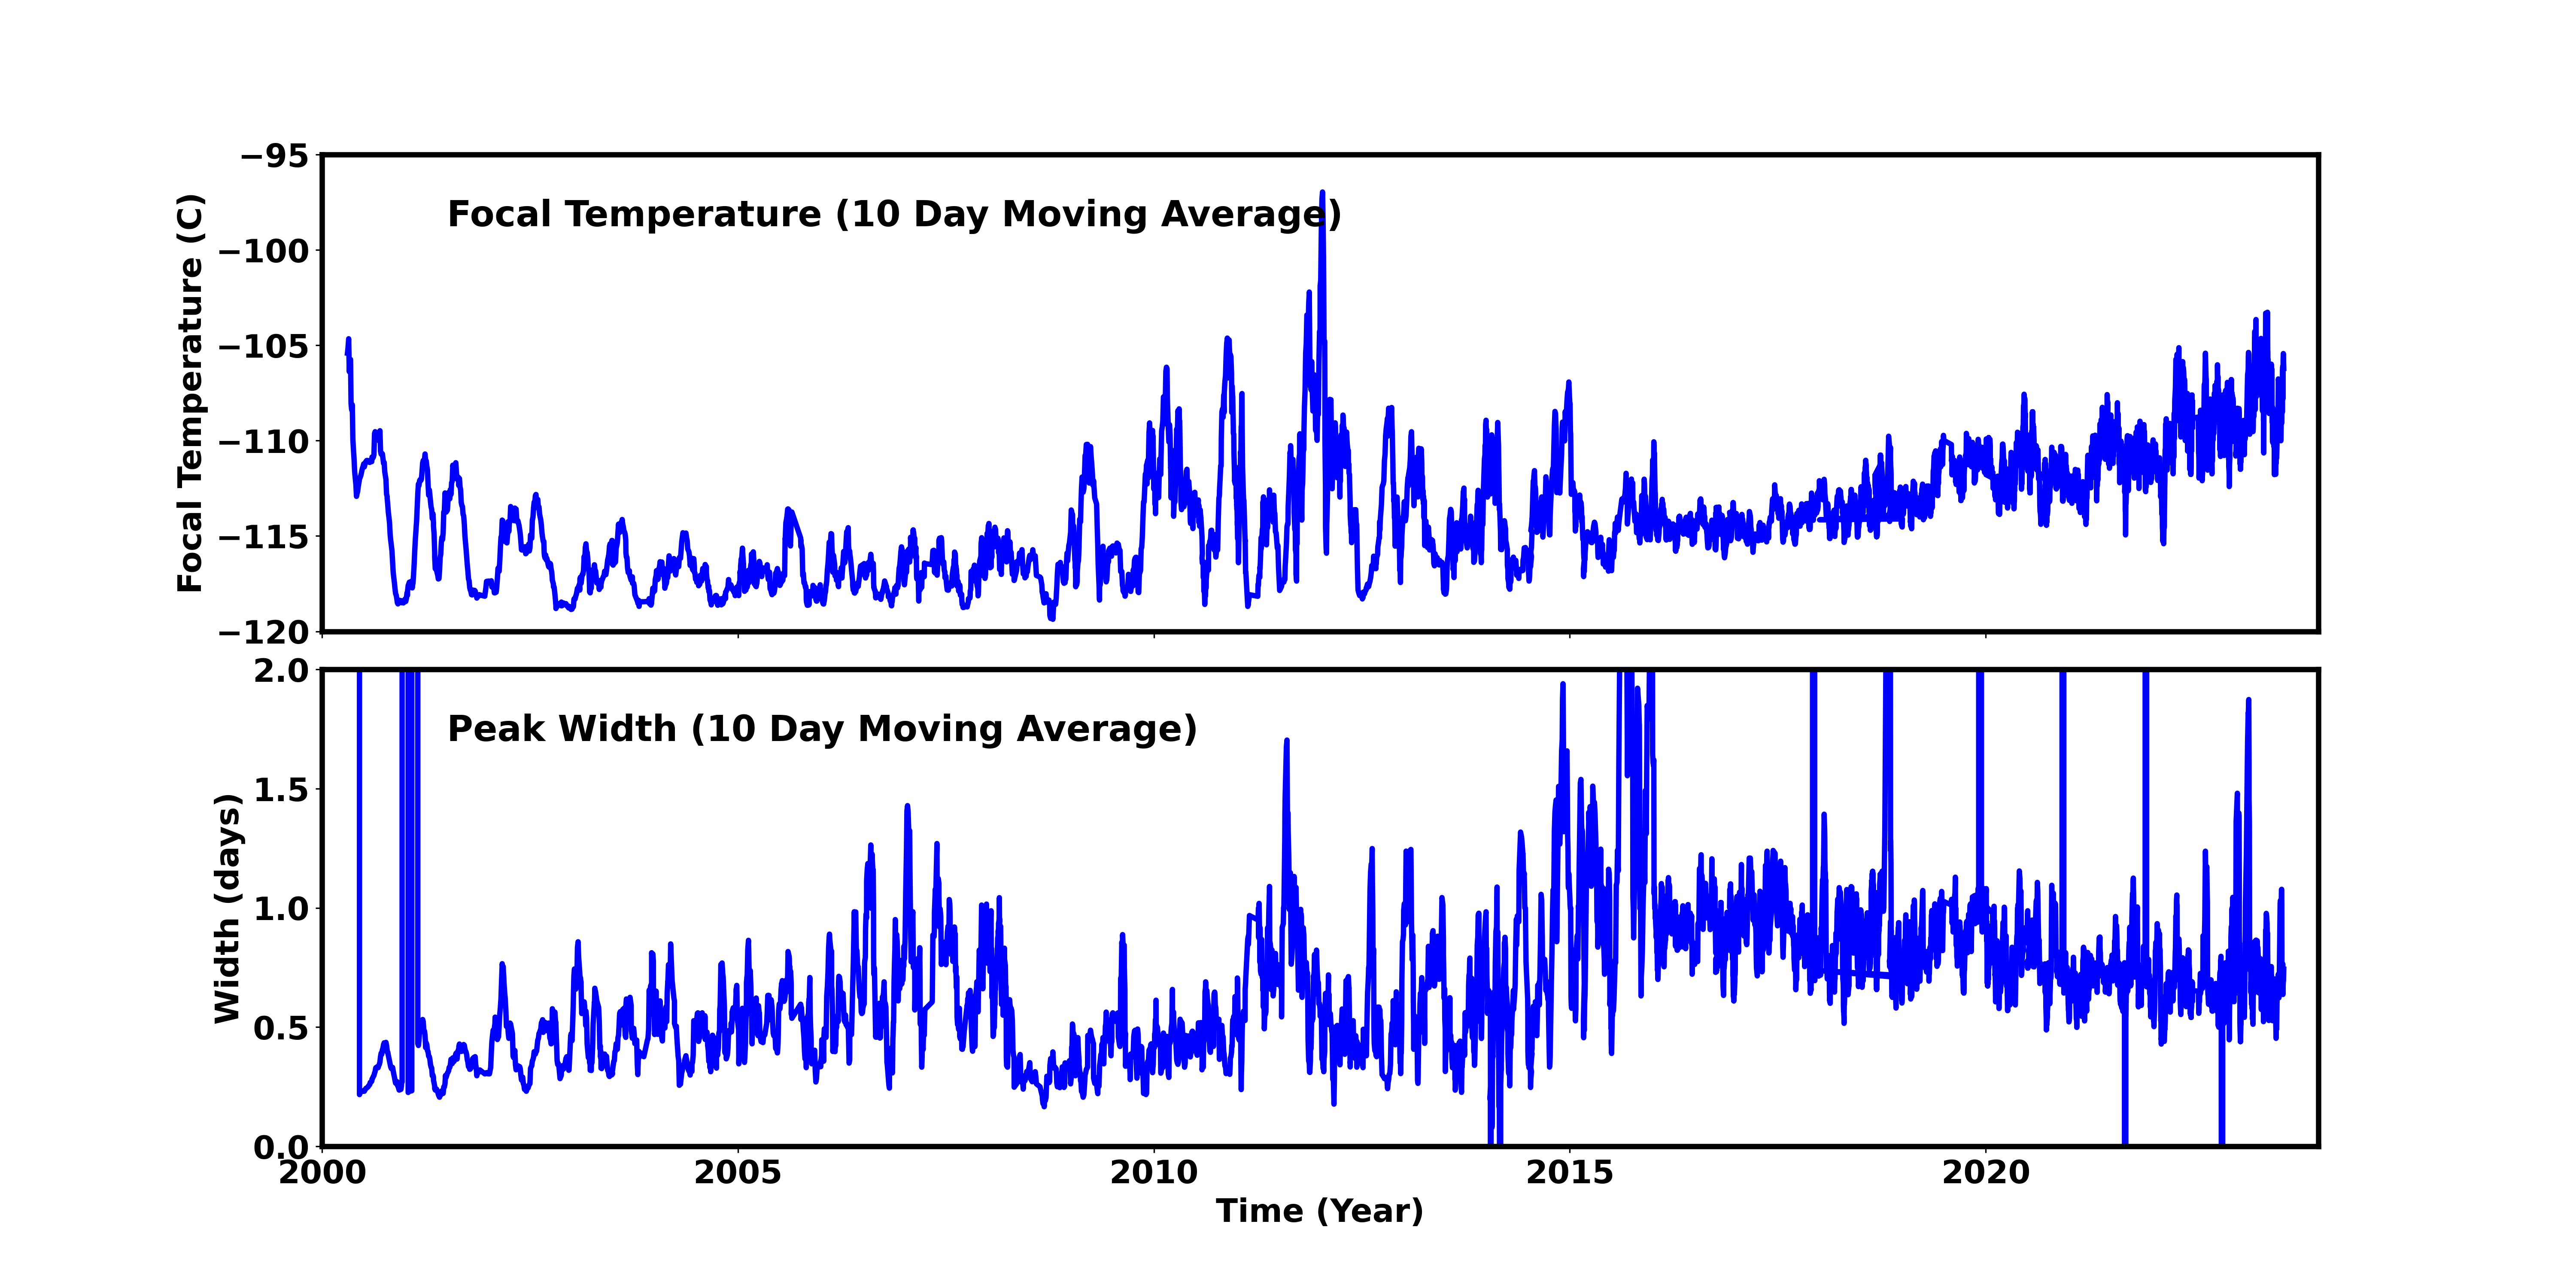
Focal Plane Temperature
Dec 2025 Focal Temperature
| The Mean (max) FPT: | |
|---|---|
| -107.53 | +/- 7.69 C |
| Mean Width: | |
| 0.8 | +/- 0.58 days |
Averaged Focal Plane Temperature
We are using 10 period moving averages to show trends of peak temperatures and peak widths. Note, the gaps in the width plot are due to missing/corrupted data.
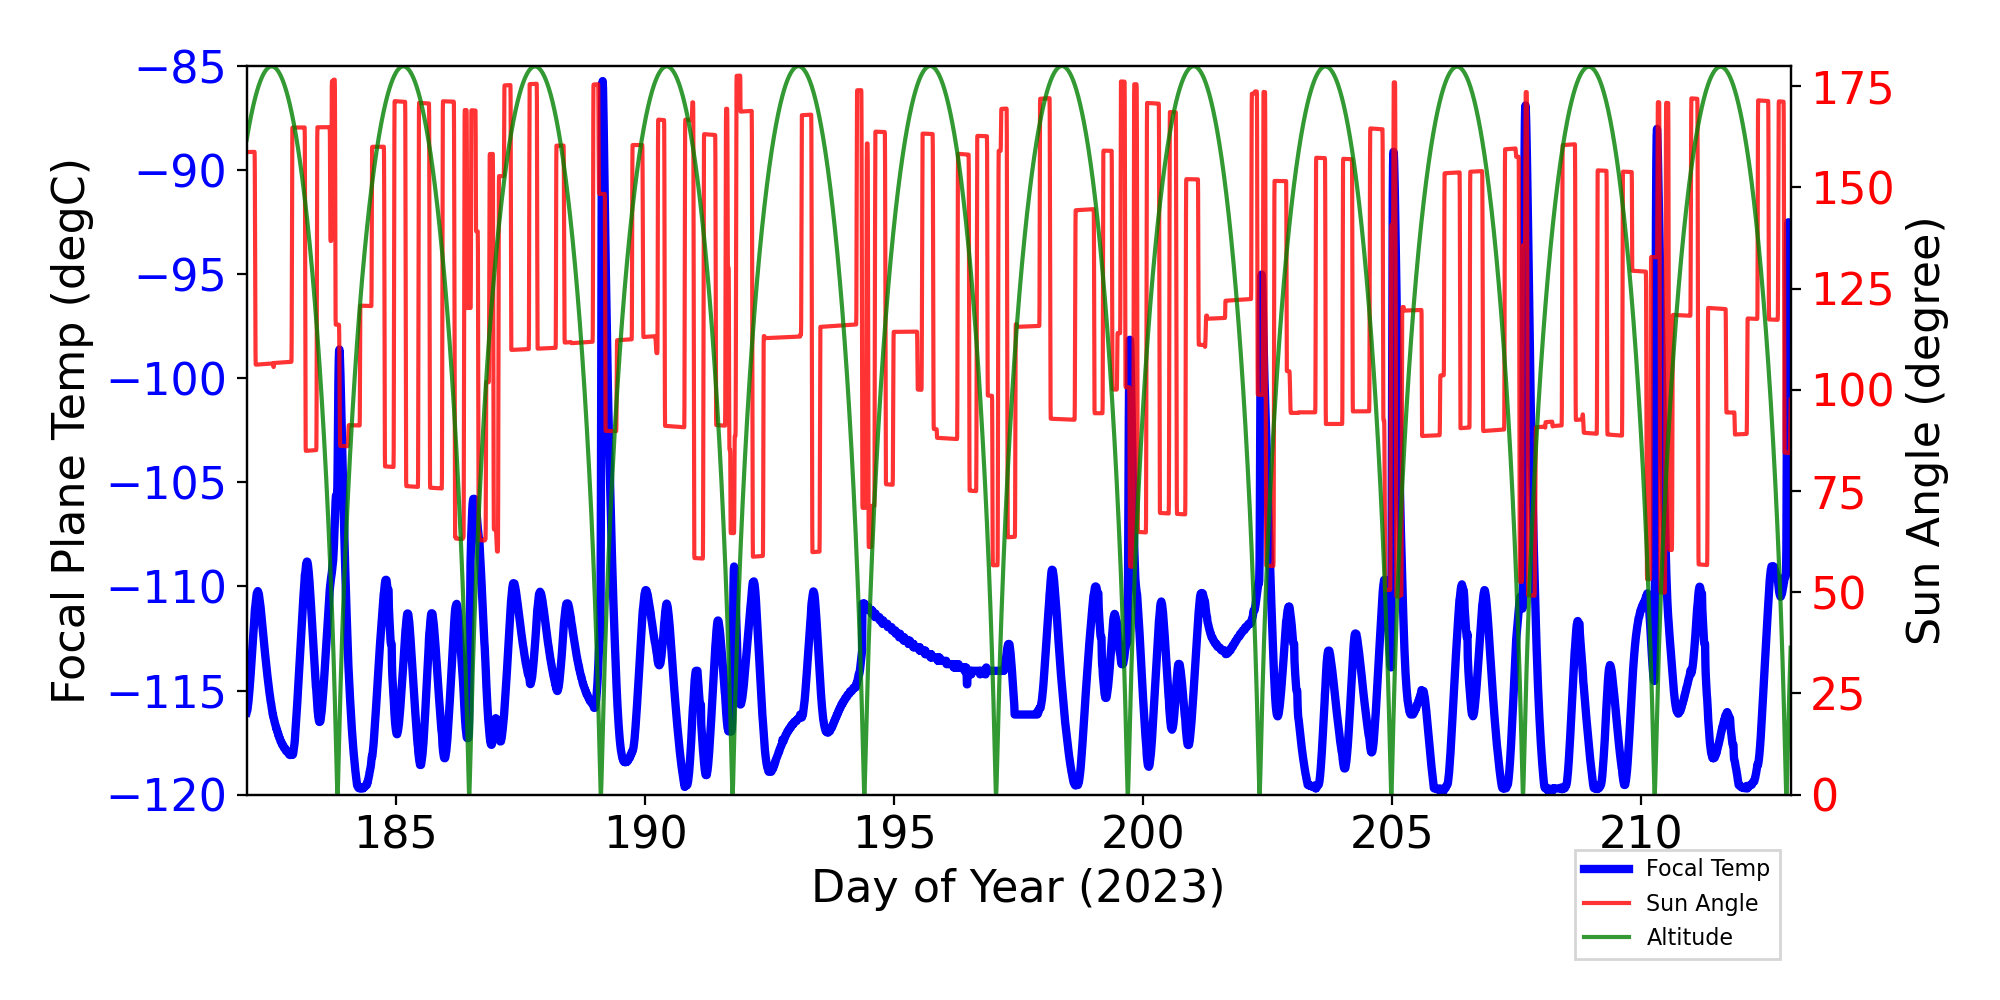
Focal Plane Temperature, Sun Angle and Altitude
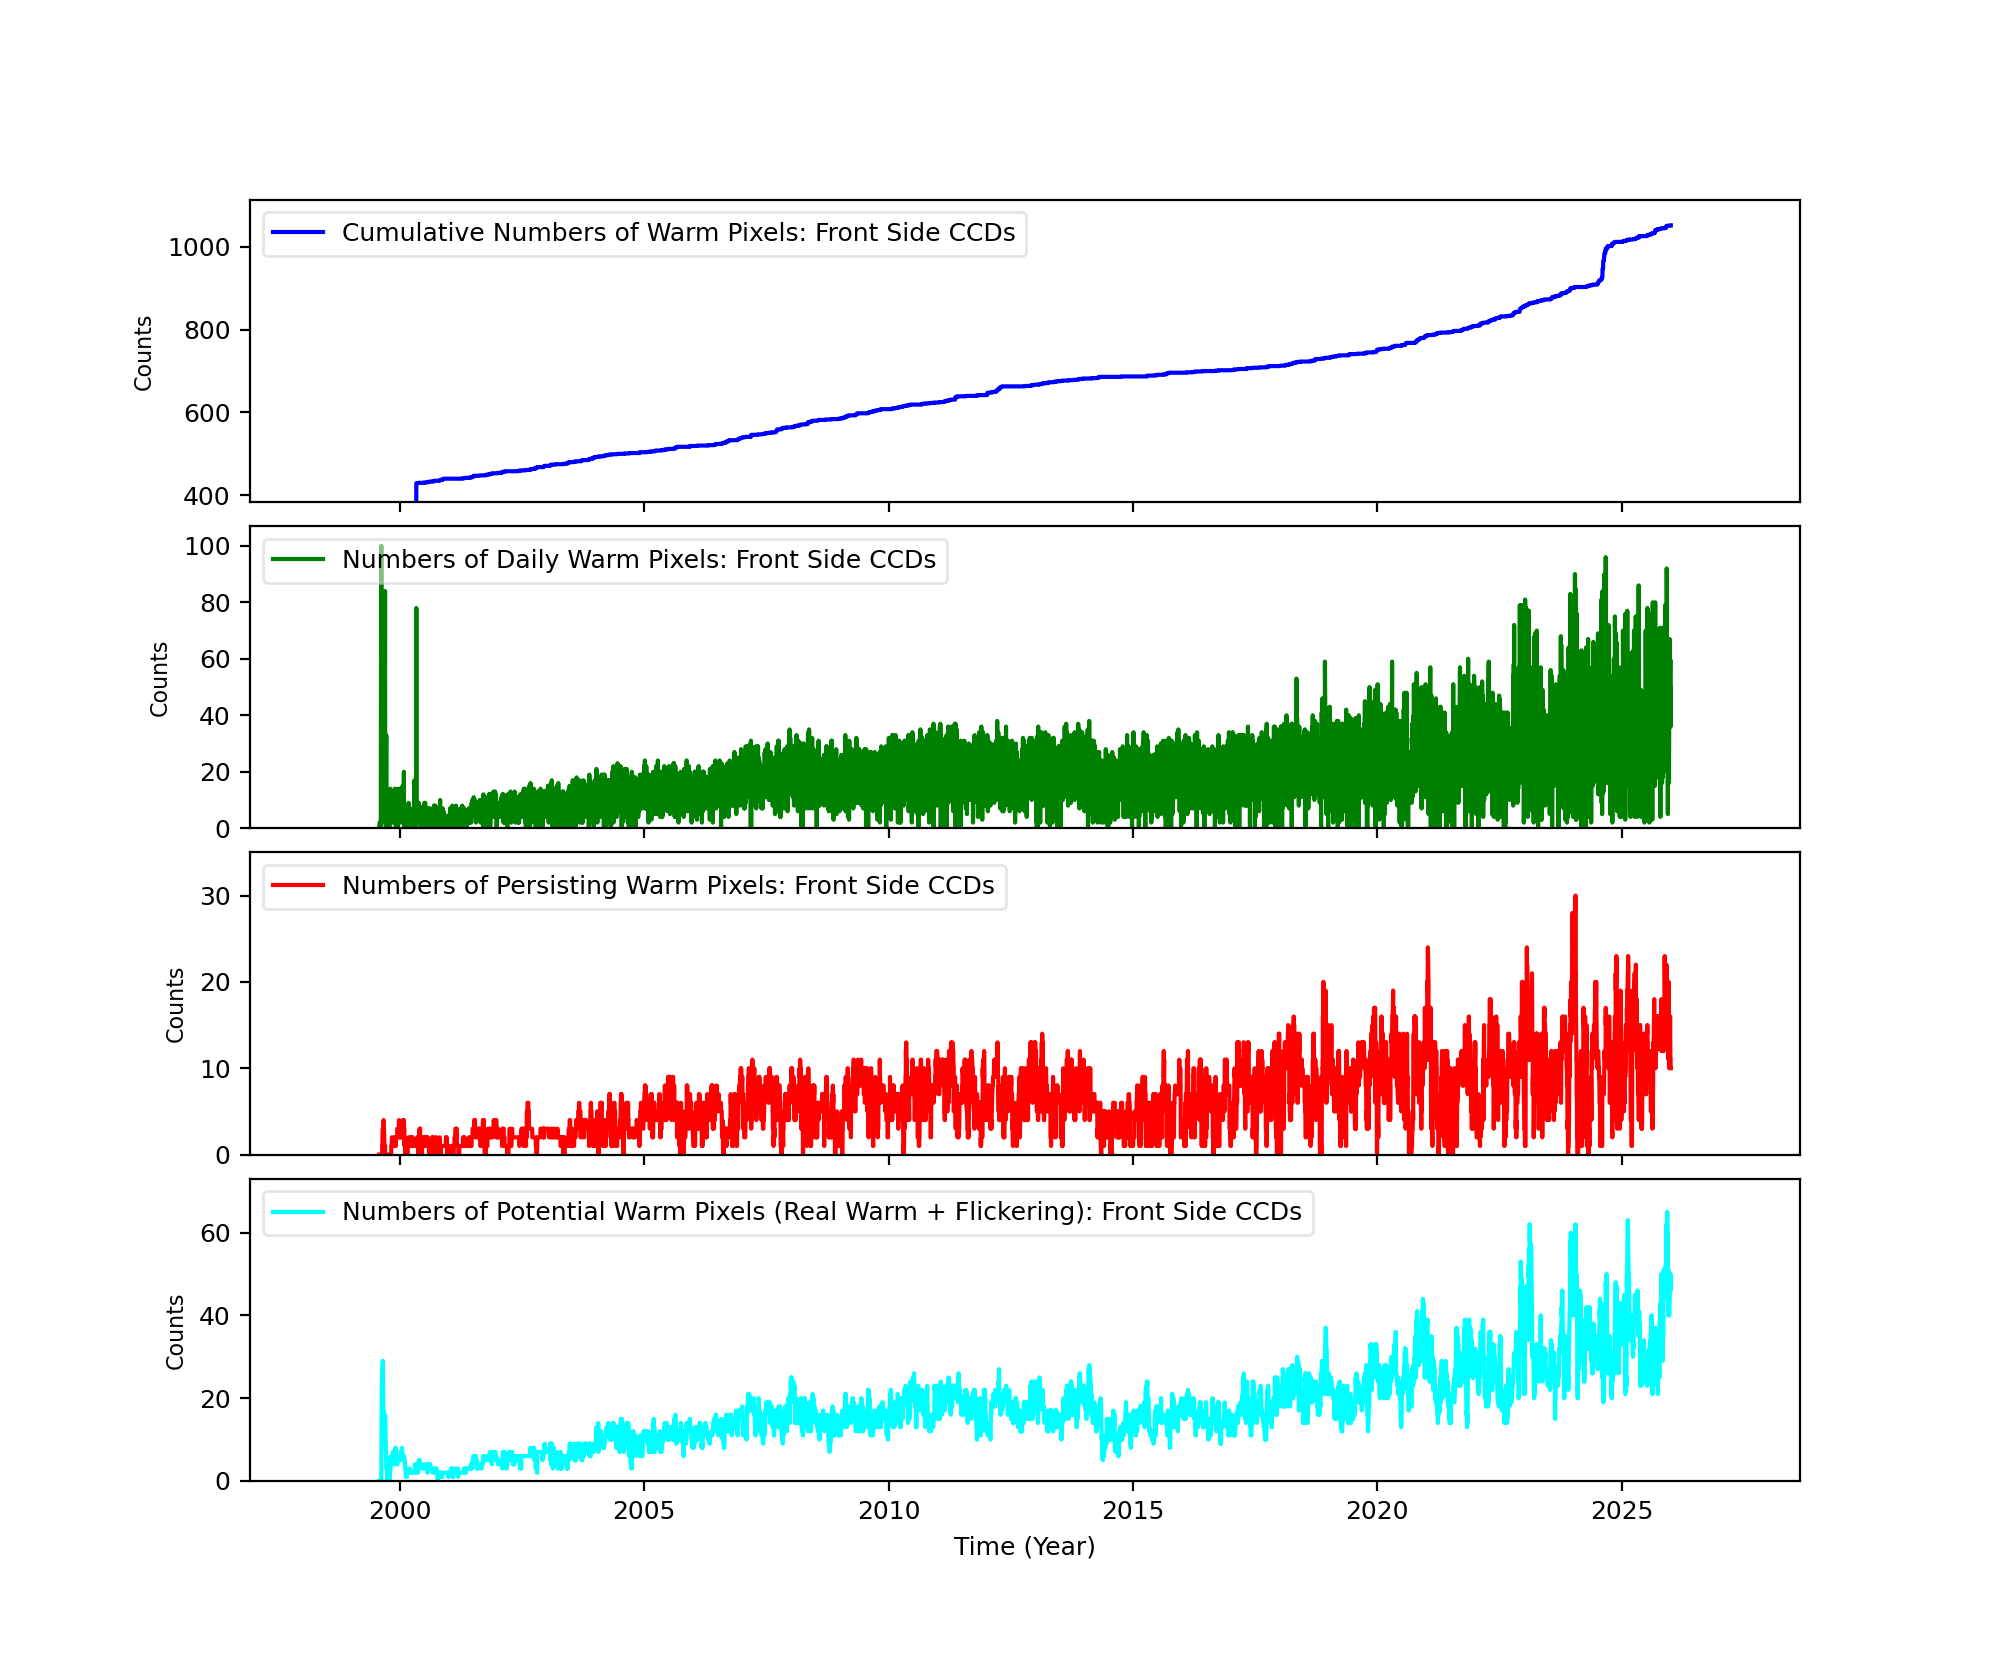
Bad Pixels
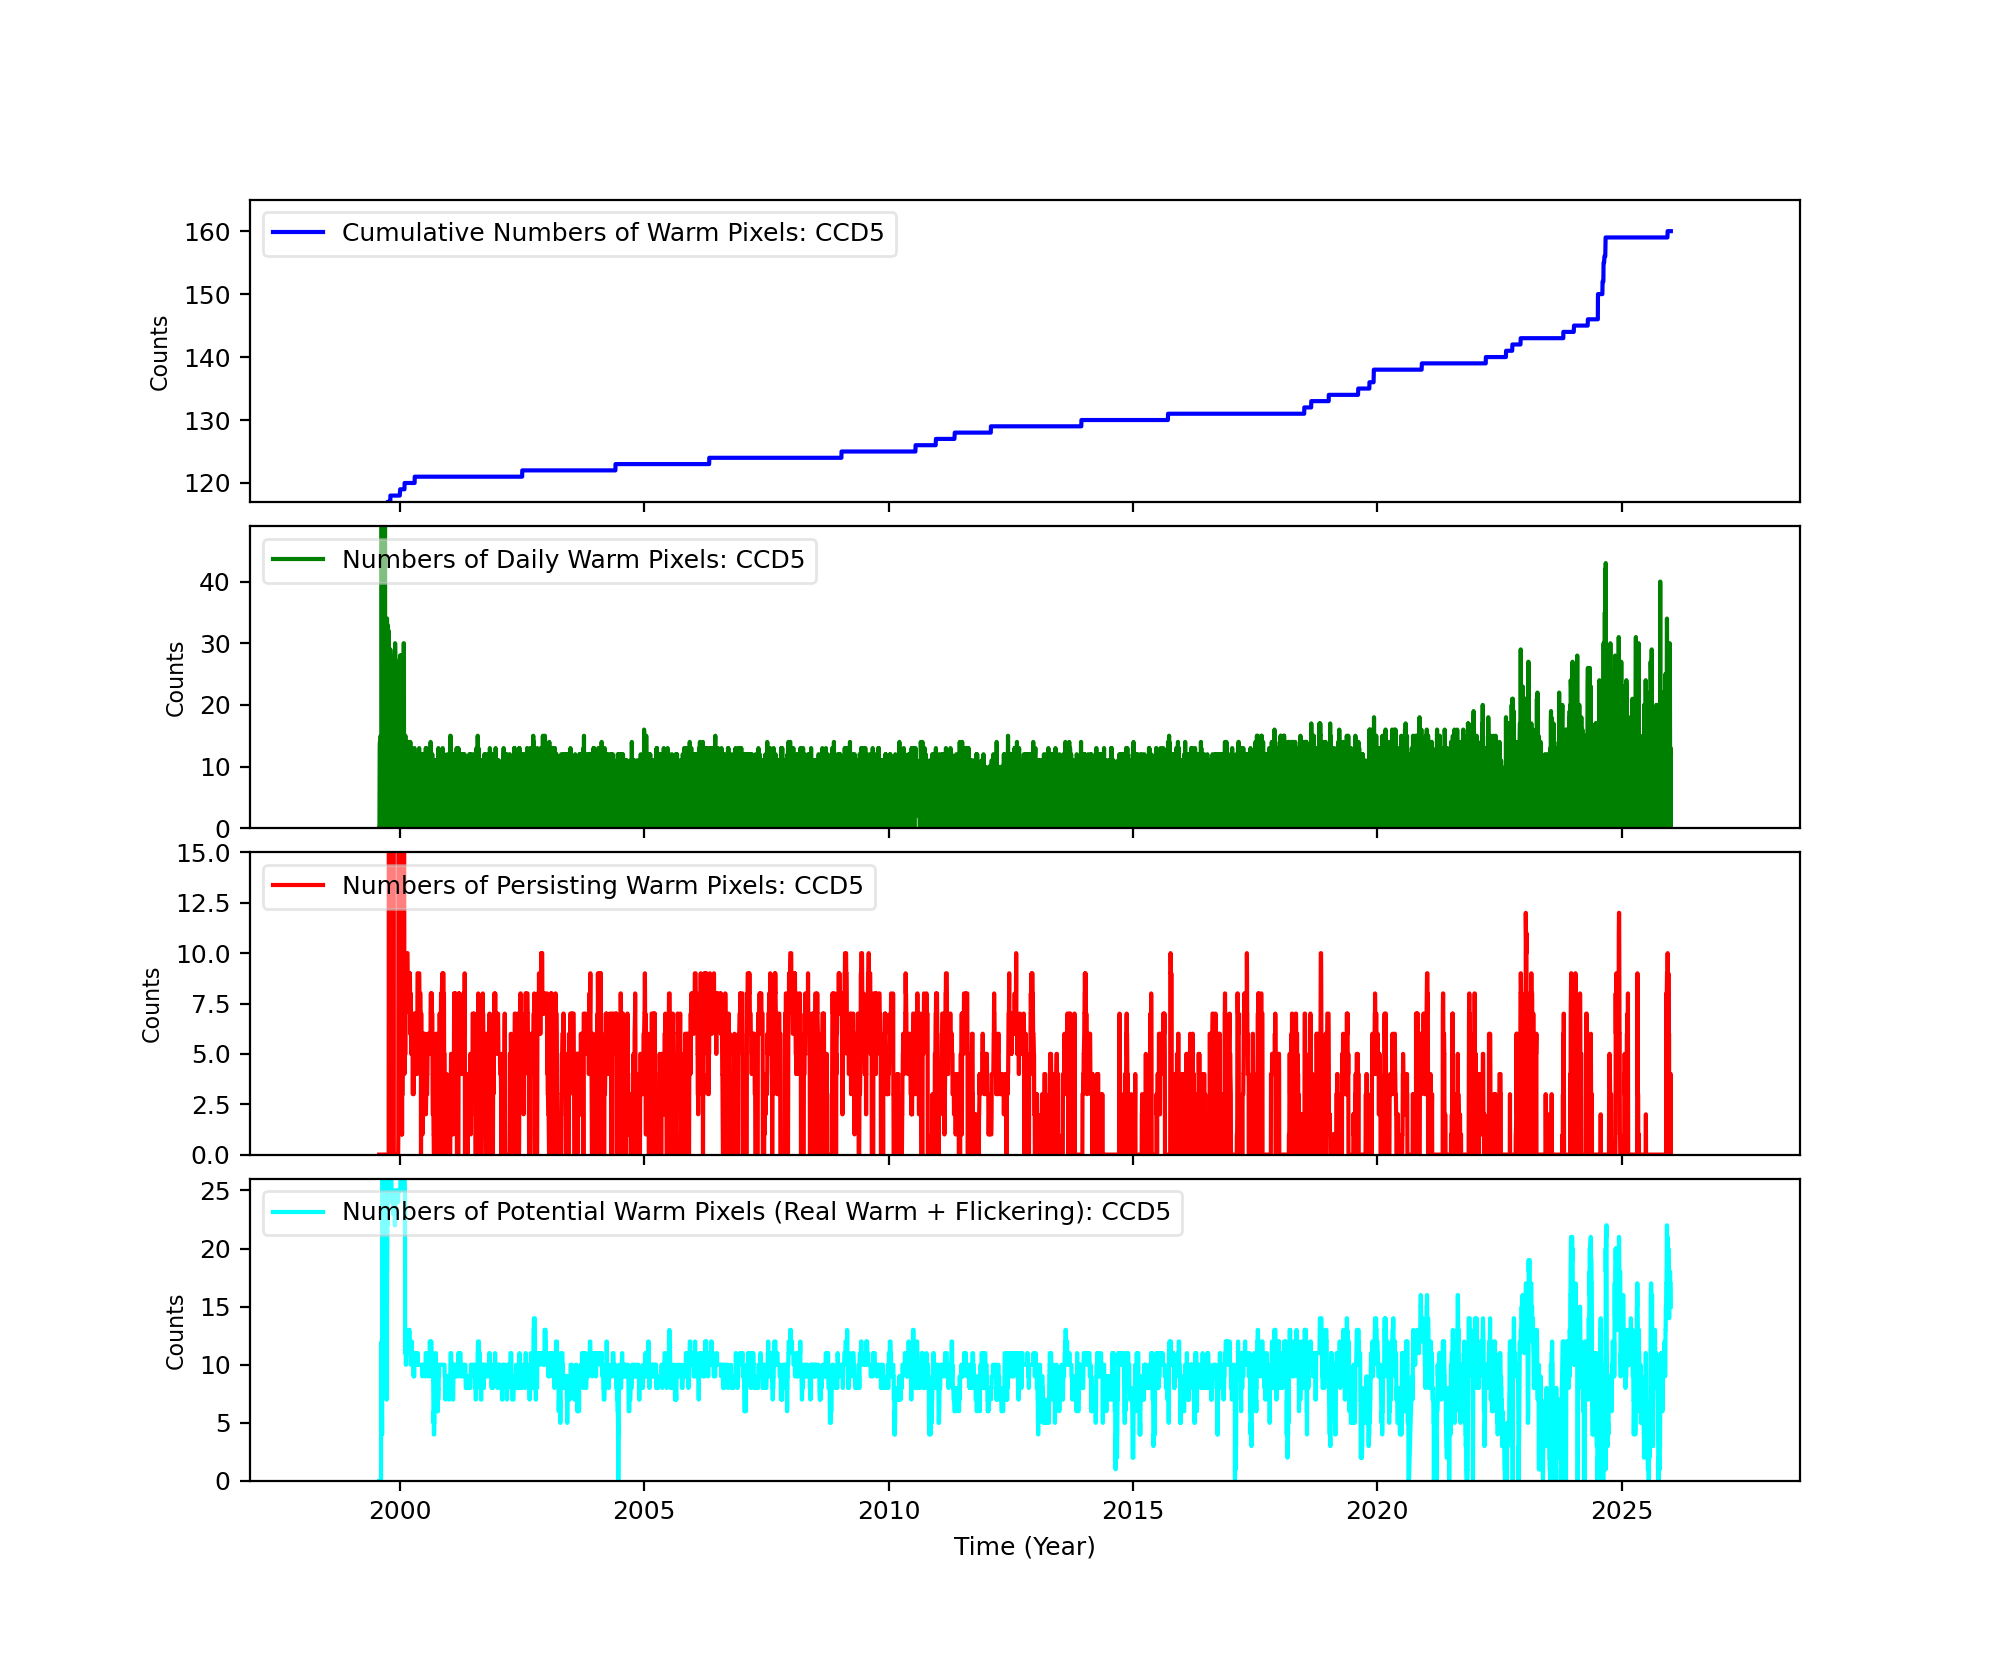
The plots below were generated with a new warm pixel finding script. Please see Acis Bad Pixel Page for details.
Front Side CCDs
Back Side CCD (CCD5)
Science Instrument Background Rates
| Name | Low (keV) | High(KeV) | Description |
|---|---|---|---|
| SSoft | 0.00 | 0.50 | Super soft photons |
| Soft | 0.50 | 1.00 | Soft photons |
| Med | 1.00 | 3.00 | Moderate energy photons |
| Hard | 3.00 | 5.00 | Hard Photons |
| Harder | 5.00 | 10.00 | Very Hard photons |
| Hardest | 10.00 | Beyond 10 keV |


HRC
DOSE of Central 4K Pore-Pairs
Please refer to Maximum Dose Trends for more details.
)
|
|---|
IMAGE                NPIX      MEAN    STDDEV      MIN       MAX
HRCI_12_2025.fits  16777216	0.006 	0.075 	0.000 	3.000
)
IMAGE                       NPIX      MEAN    STDDEV      MIN       MAX
HRCI_08_1999_12_2025.fits  16777216	na	na	na	na
No Data
)
IMAGE                       NPIX      MEAN    STDDEV      MIN       MAX
HRCS_08_1999_12_2025.fits  16777216	na	na	na	na
|
|
Max dose trend plots corrected for events that "pile-up"
in the center of the taps due to bad position information.
|
)
|
)
|
)
|
)
|
| Sep 2025 | Jun 2025 | Mar 2025 | Dec 2024 |
|---|
)
|
)
|
)
|
)
|
| Sep 2025 | Jun 2025 | Mar 2025 | Dec 2024 |
|---|
Gratings
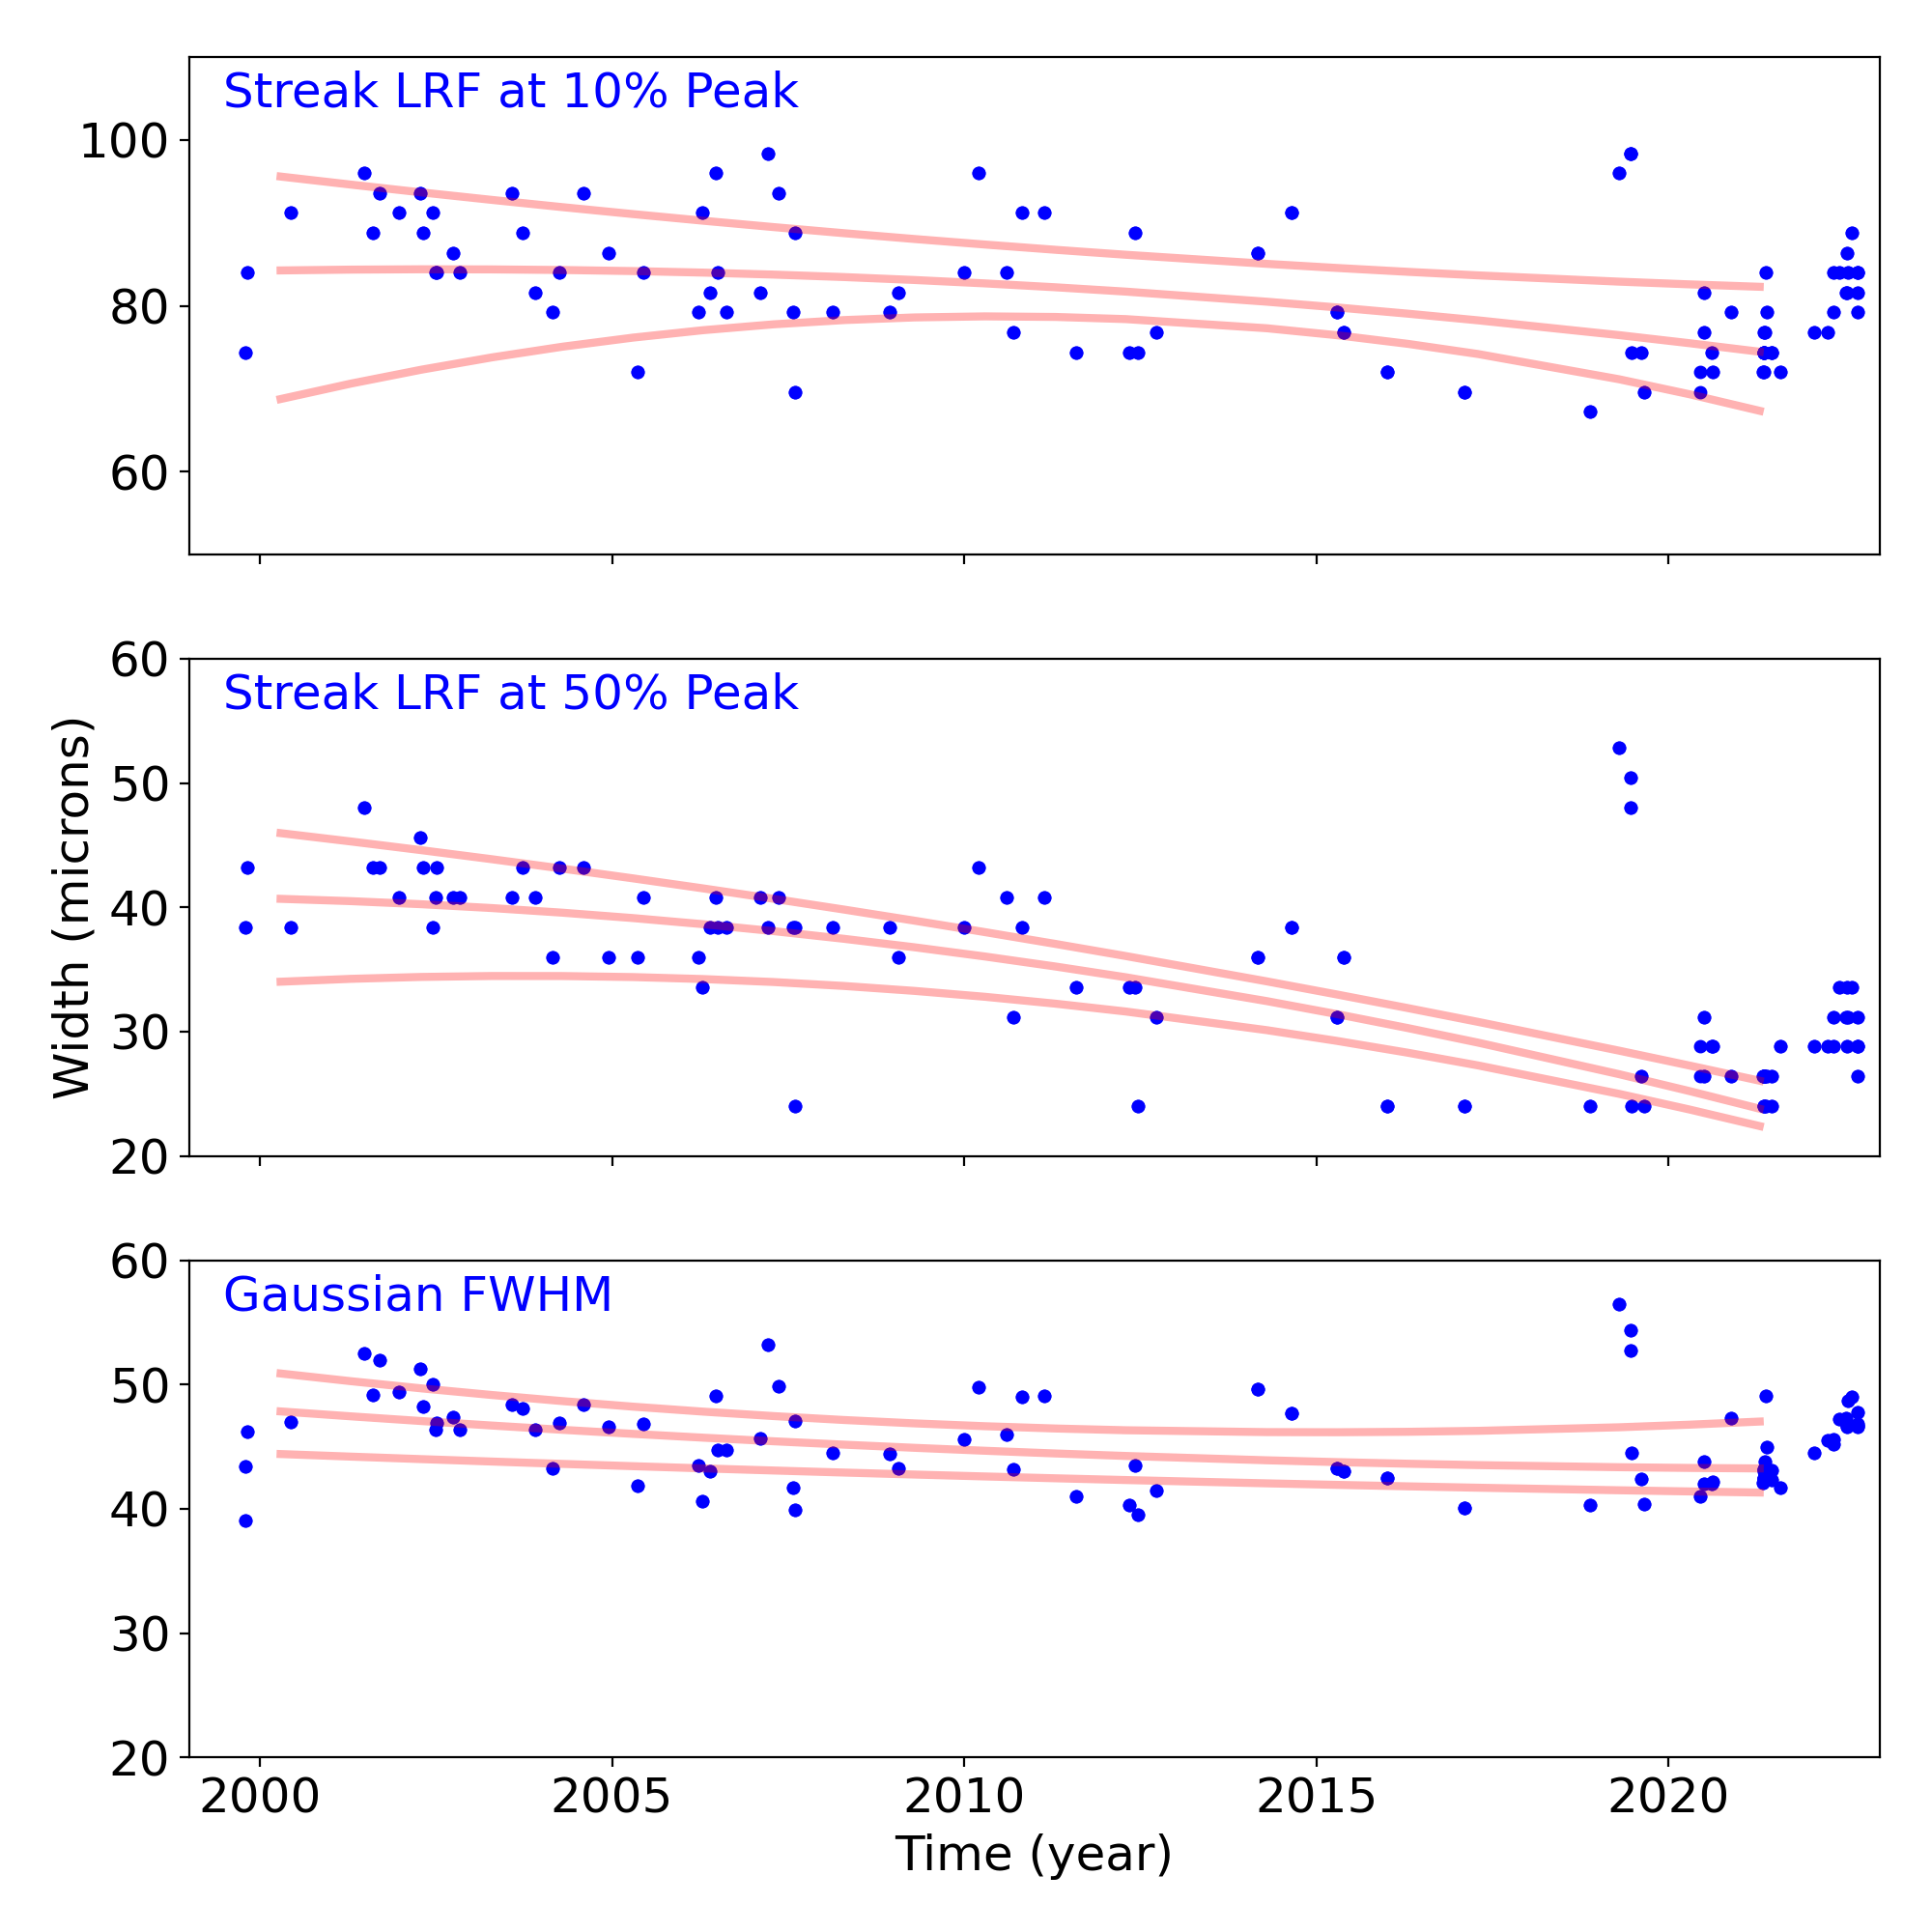
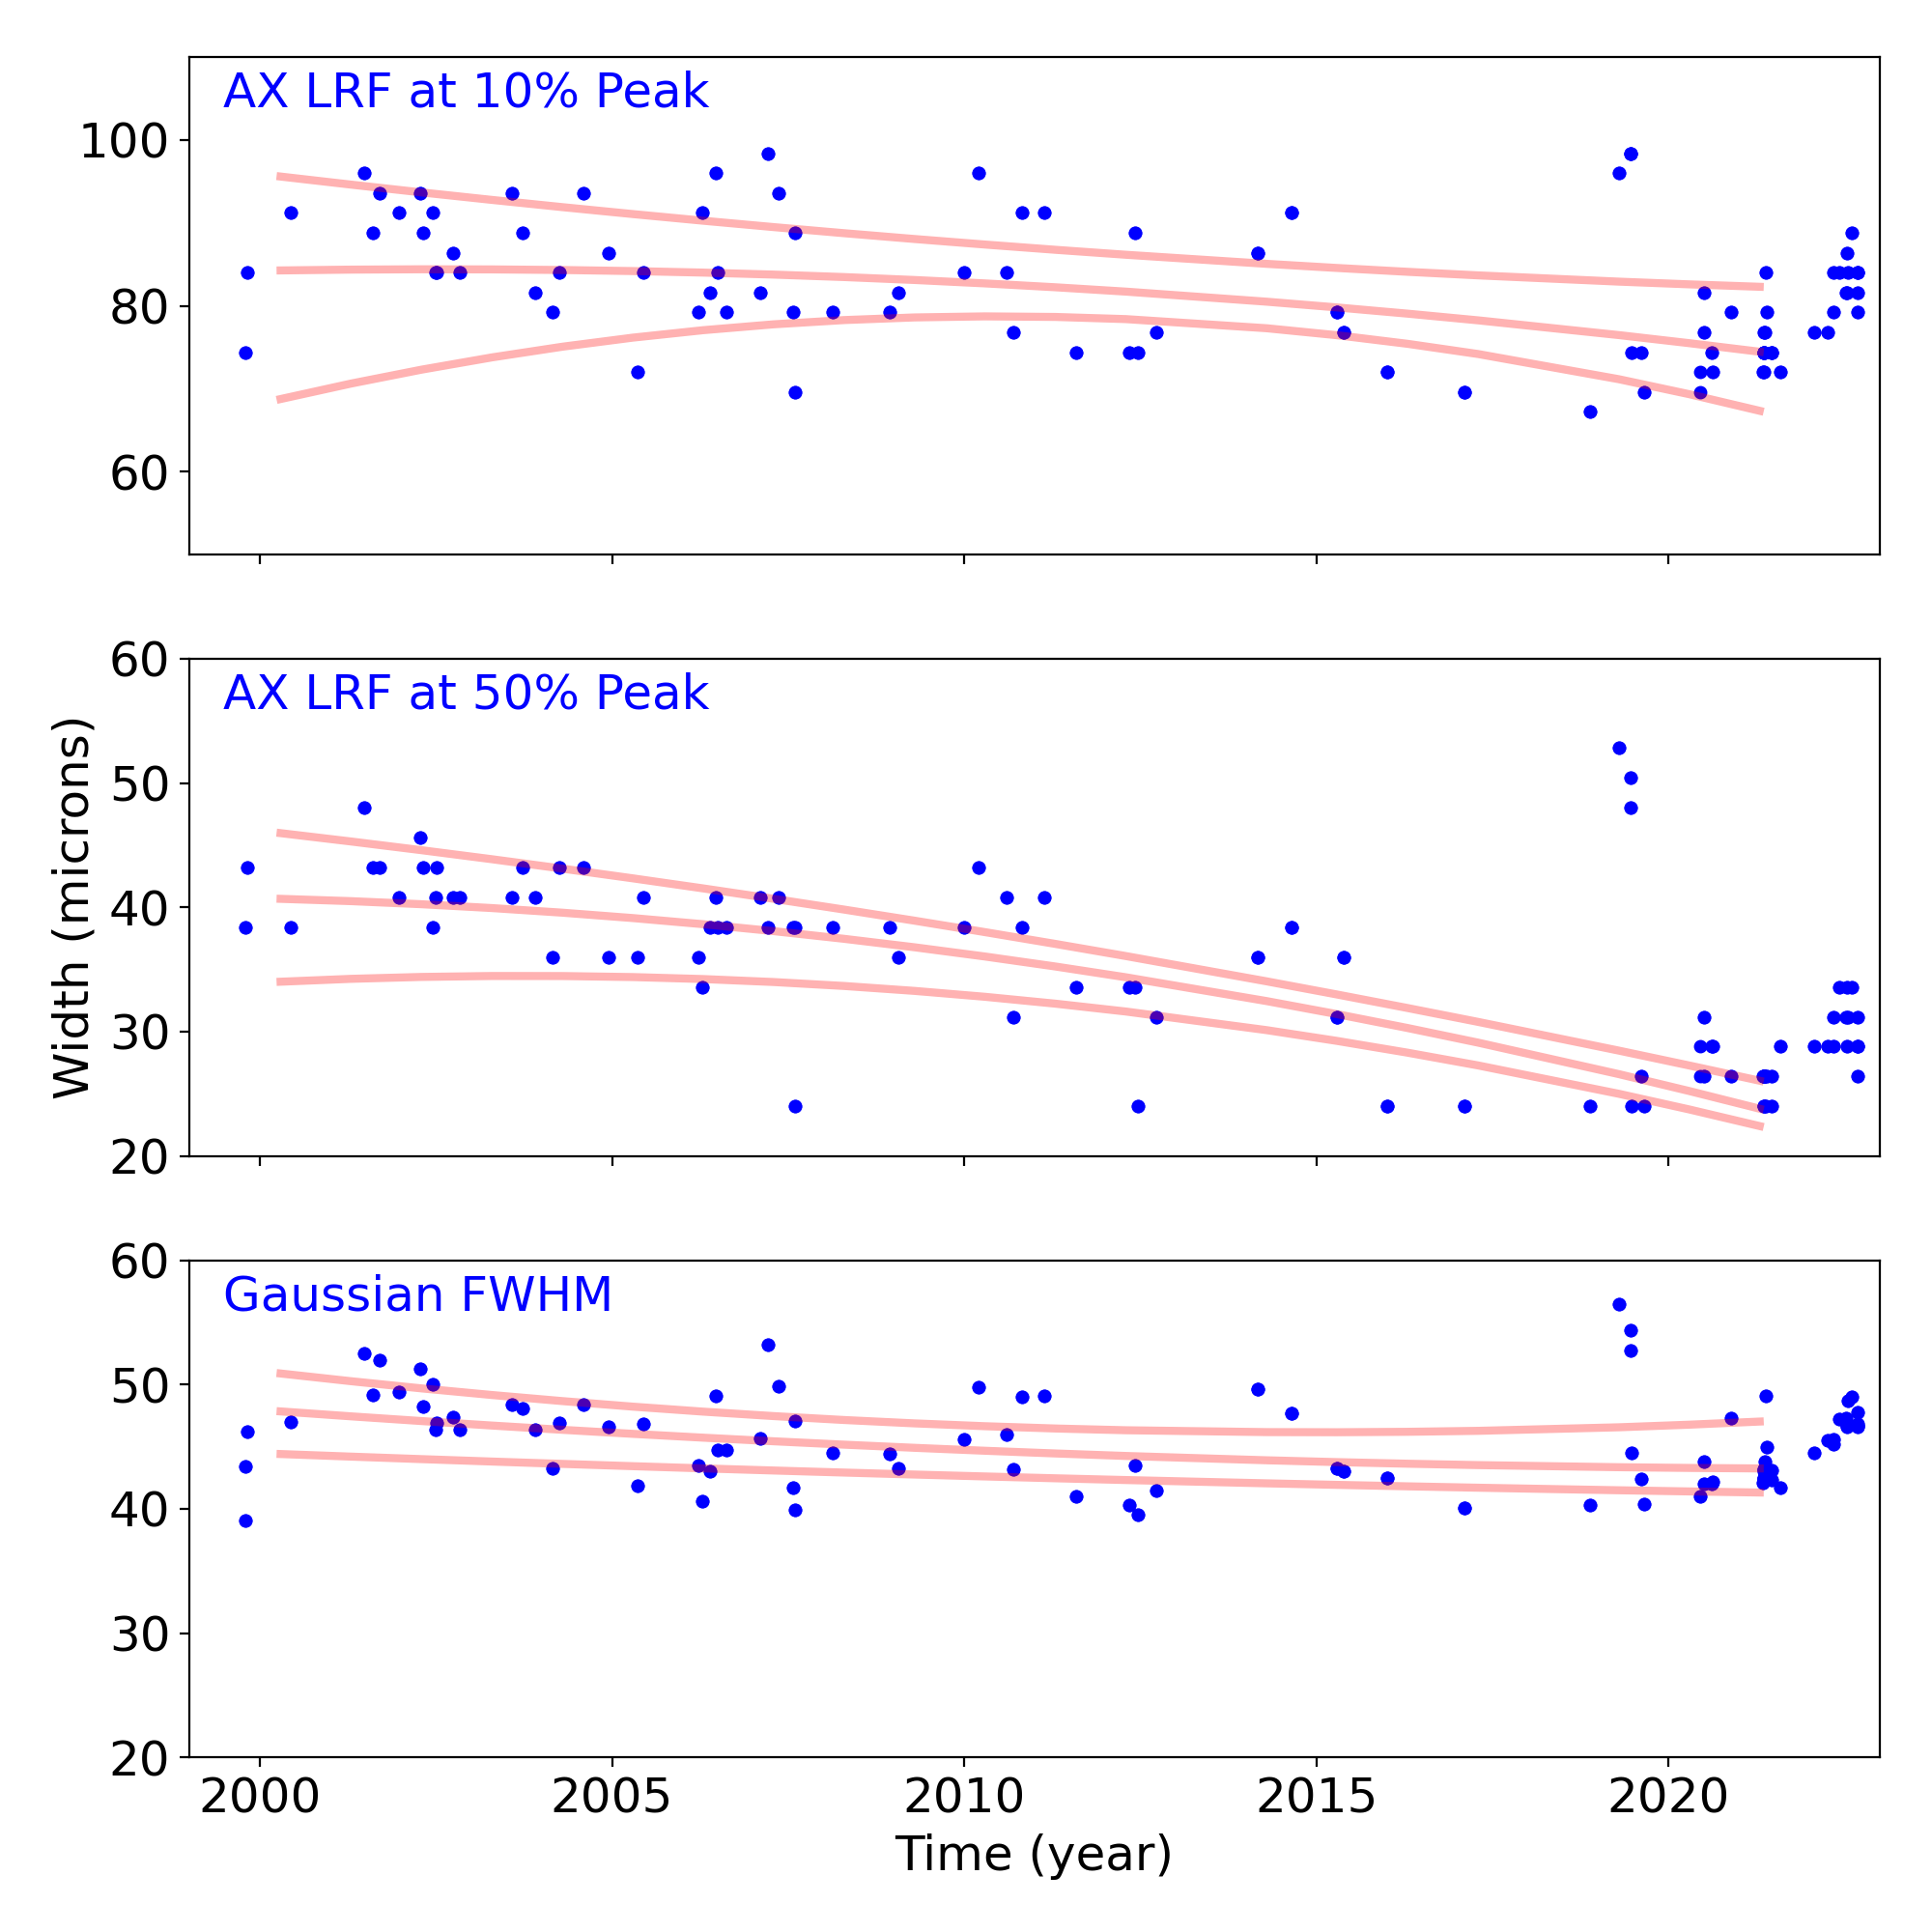
Grating Trends/Focus
We plot the width of the zero order streak of ACIS/HETG observations and the width of the zero order image for HRC/LETG observations of point sources. No significant defocusing trend is seen at this time. See Gratings Trends pages.
PCAD
ACA Trending
| ACIS |
)
|
)
|
)
|
|
|---|---|---|---|---|
)
|
)
|
)
| ||
| HRCI |
)
|
)
|
)
|
)
|
| HRCI |
)
|
)
|
)
|
)
|
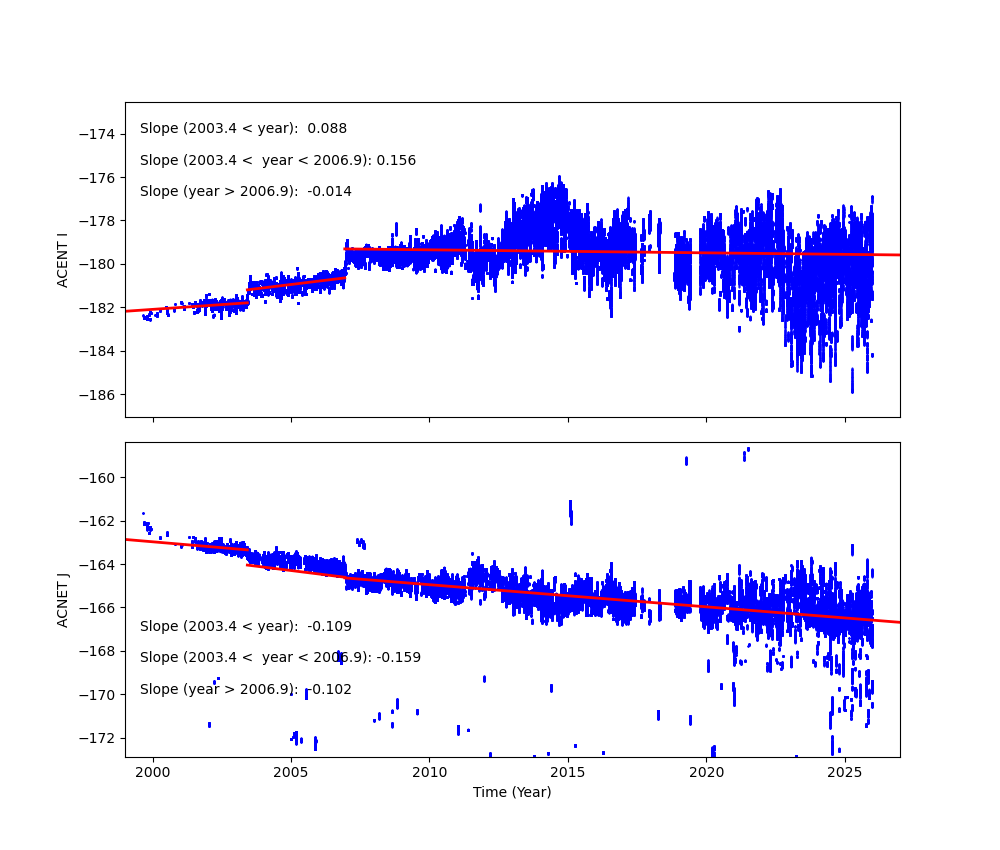
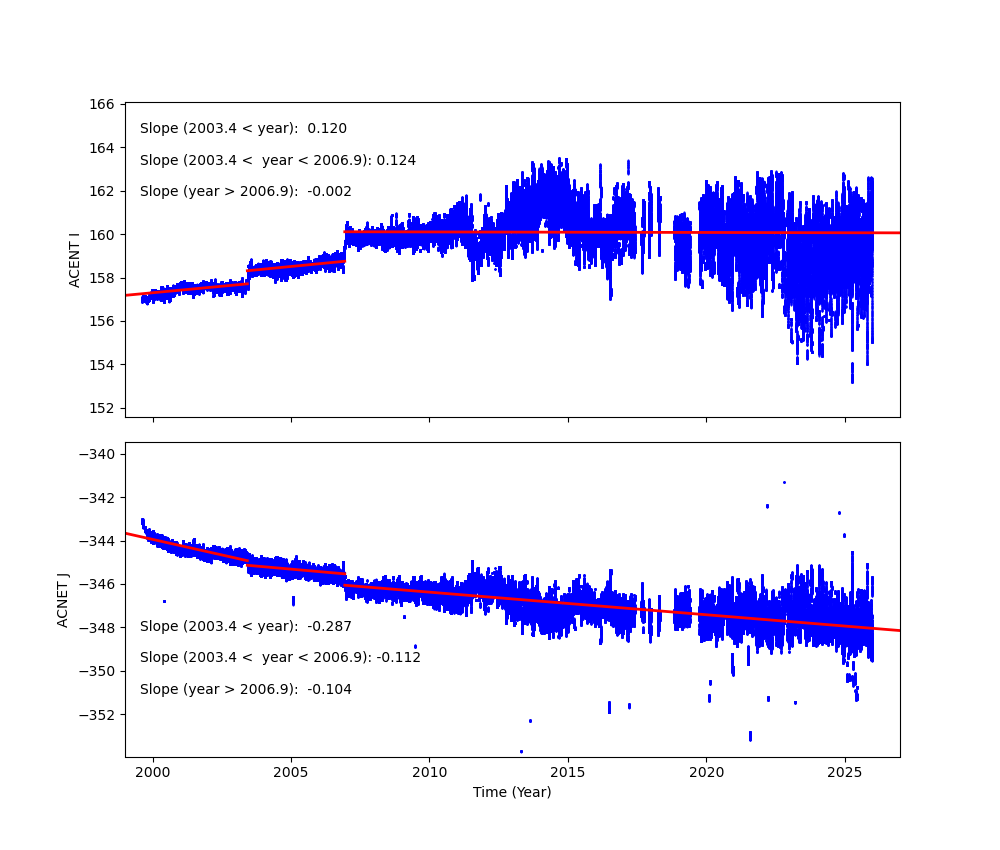
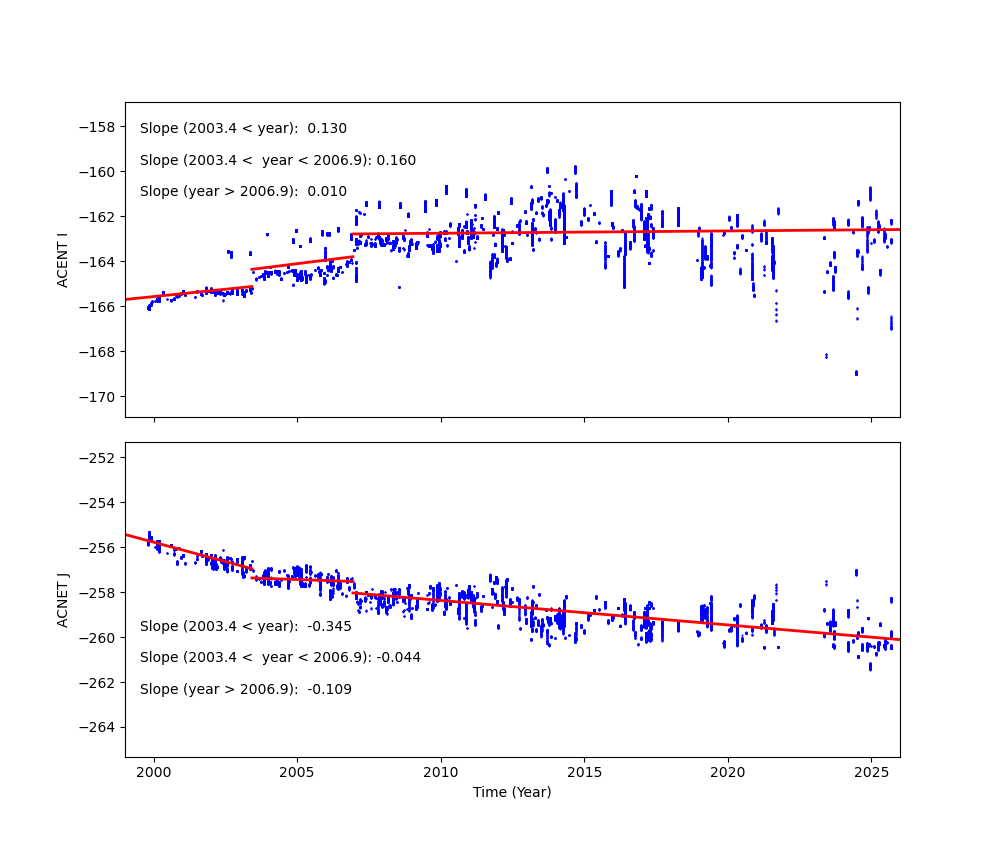
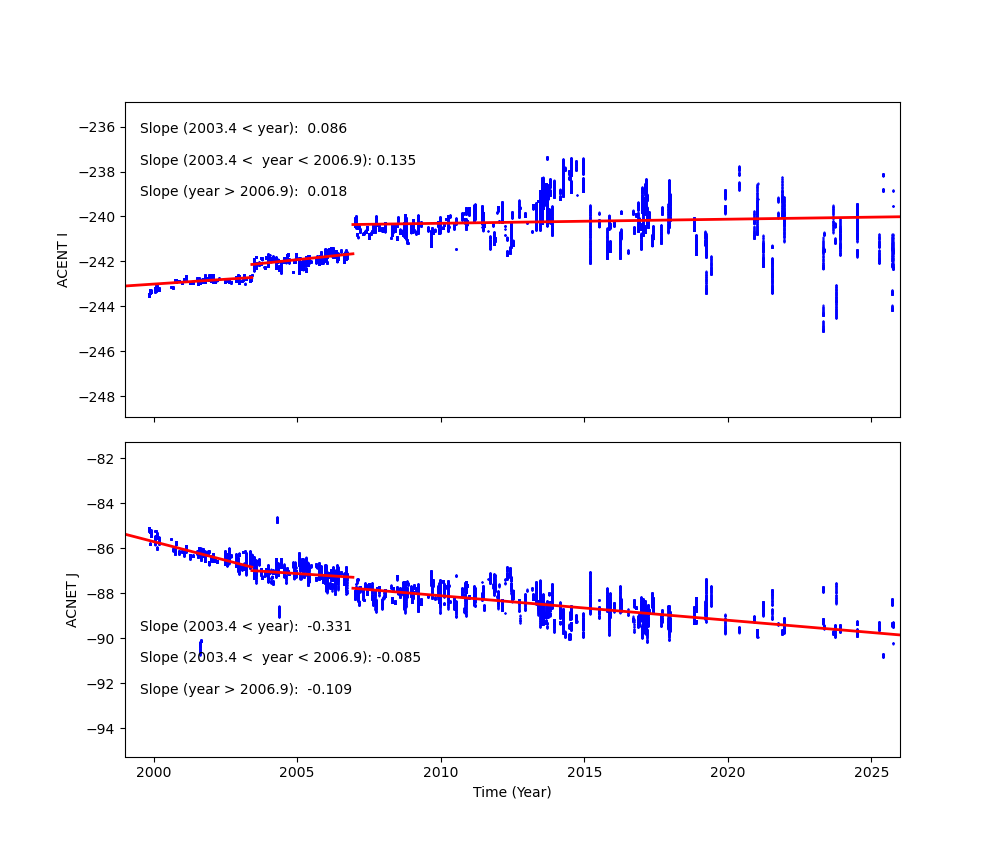
Fid Light Drift
Fid light positions on ACA drift with time. The drift trends of Fid light 2 with ACIS-I and ACIS-S configurations are shown below.
The top panel shows Fid light 2 drift in ACENT I (app. along with -Y axis), and the
bottom panel shows that in ACENT J (app. along with Z axis). The unit is a pixel, and
one pixel is approximately 0.5 arcsec. The slope listed at the top right corner is
the change in a position per year (arcsec/yr). The vertical line on DOM = 1411 (Jun 1, 2003)
indicates a transition date of use of IRU-1 to IRU-2.
See also Tom Aldcroft's updated page:
https://cxc.cfa.harvard.edu/mta/ASPECT/fid_drift
Fid 2 (ACIS-I)
Fid 2 (ACIS-S)
Fid 8 (HRC-I)
Fid 12 (HRC-S)
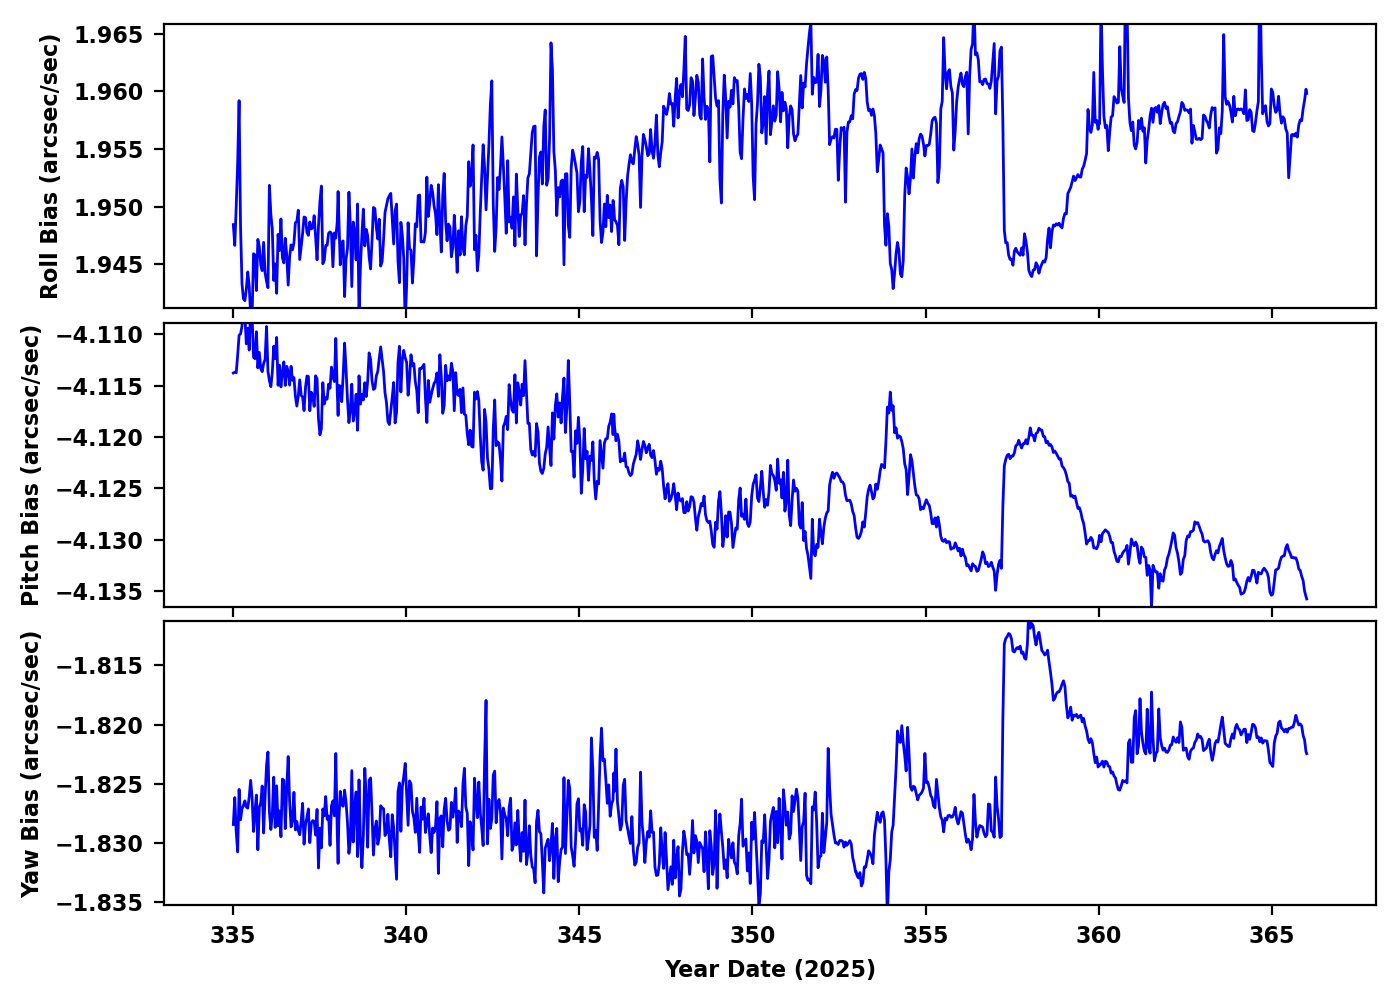
Gyro Bias Drift
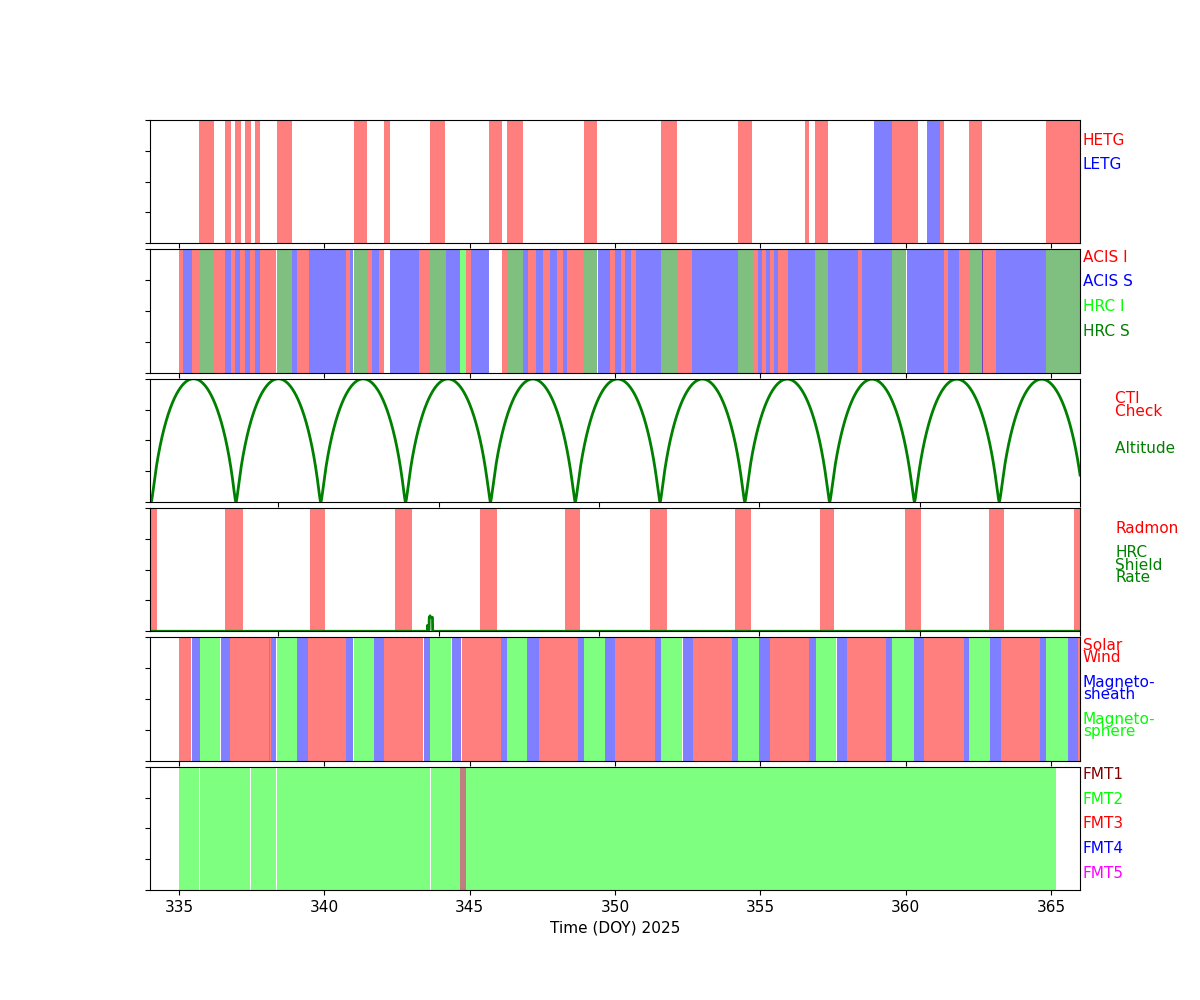
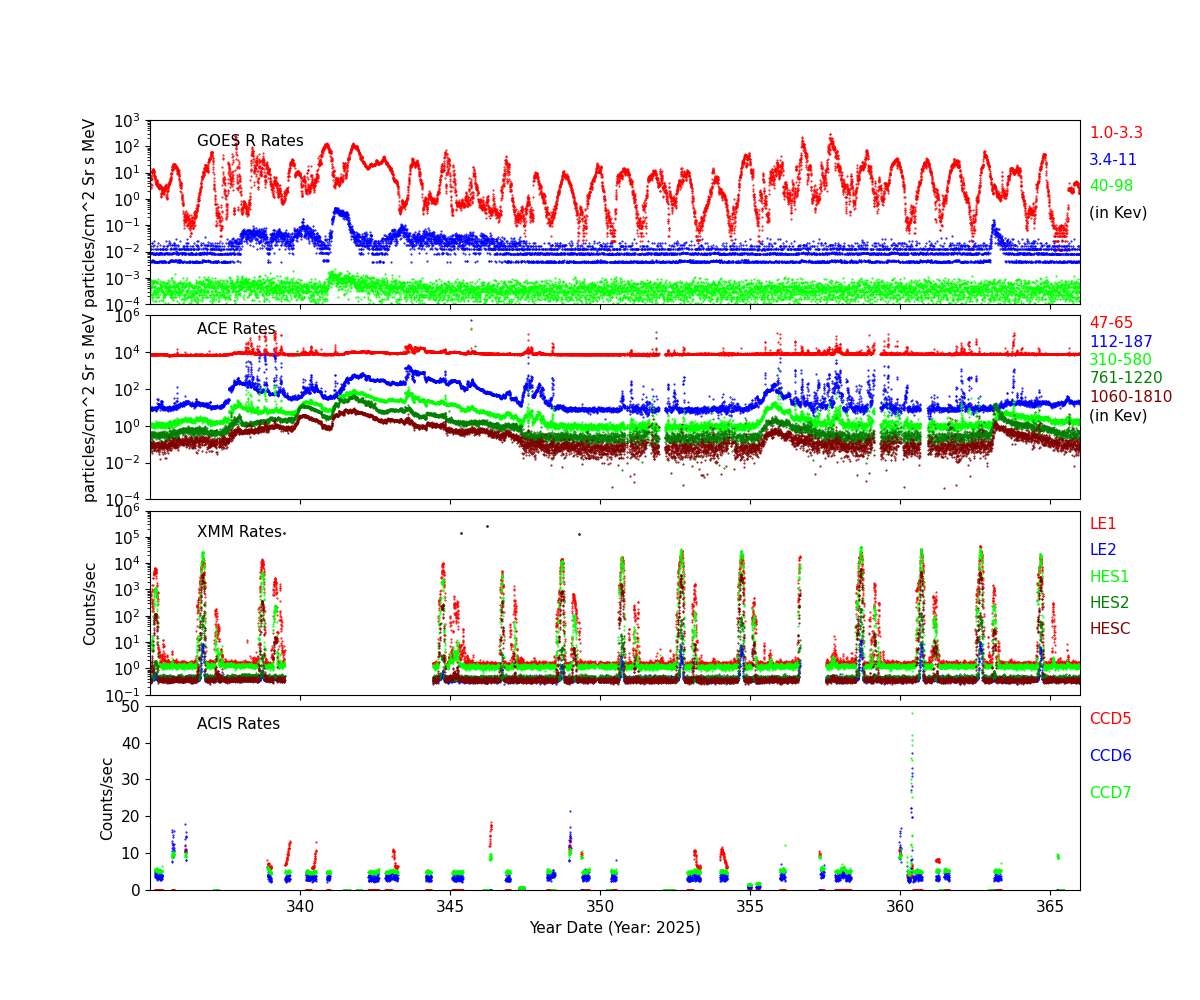
Radiation History
Radiation Count Rates of Dec 2025
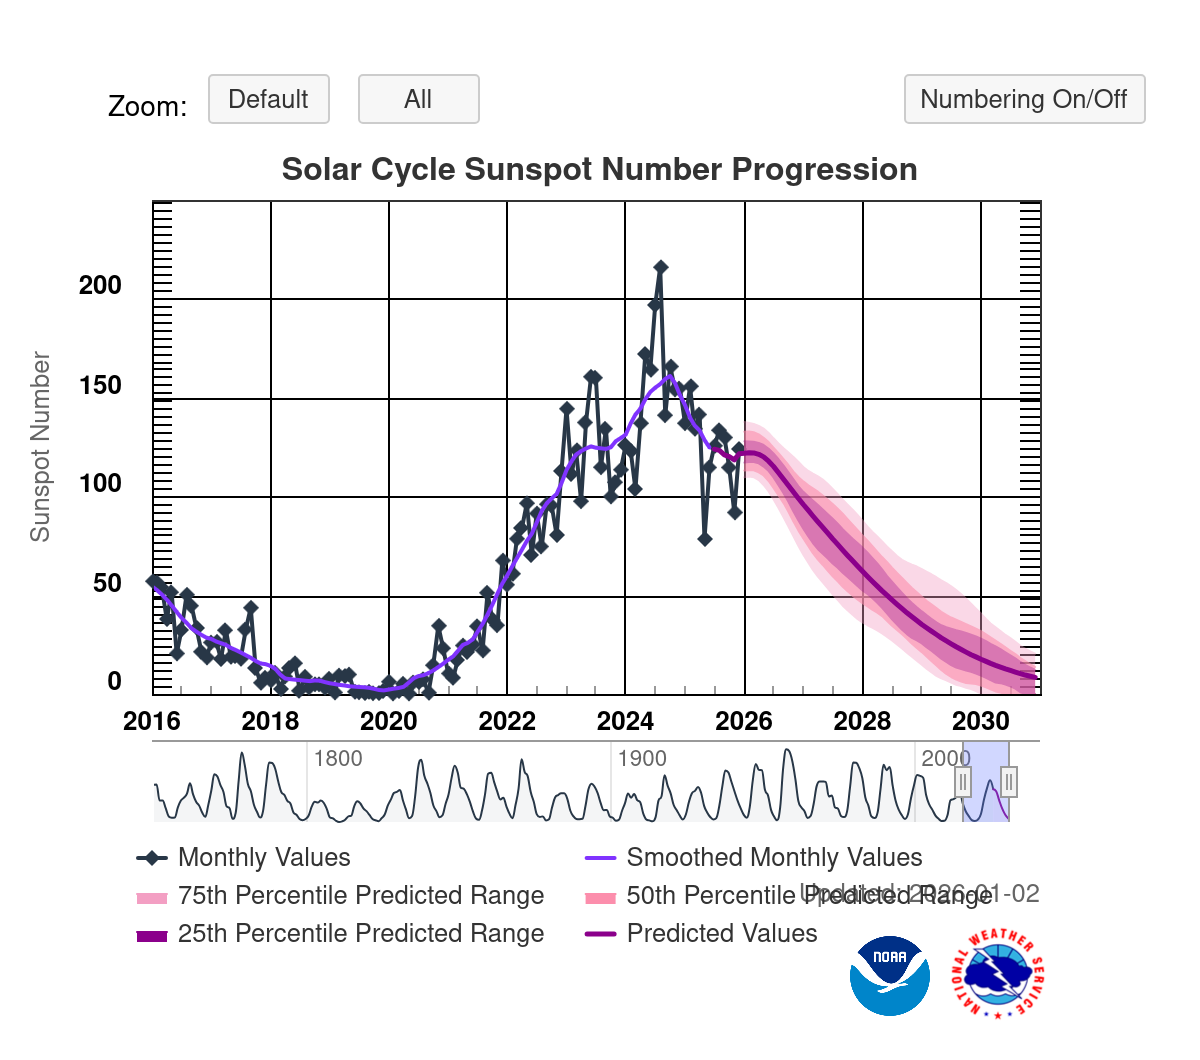
Sun Spot History (See:NOAA Page)
Trending
Critical Trends
| ACIS Temperatures - Daily Maximums | |||||||
|---|---|---|---|---|---|---|---|
| MSID | MEAN | RMS | DELTA/YR | DELTA/YR/YR | UNITS | DESCRIPTION | |
| 1pdeaat | 0.042 | 0.002 | (3.04+/-0.06)e2 | 0.69 +/- 1.71 | K | PSMC DEA PS A TEMP | |
| HRMA Computed Averages - Daily Maximums | |||||||
|---|---|---|---|---|---|---|---|
| MSID | MEAN | RMS | DELTA/YR | DELTA/YR/YR | UNITS | DESCRIPTION | |
| obaavg | 0.025 | 0.001 | (3.01+/-0.03)e2 | 2.29 +/- 0.84 | TEMP | OBA/TFTE | |
| EPHIN Temperatures - Daily Maximums | |||||||
|---|---|---|---|---|---|---|---|
| MSID | MEAN | RMS | DELTA/YR | DELTA/YR/YR | UNITS | DESCRIPTION | |
| teio | 0.023 | 0.009 | (3.35+/-0.21)e2 | -1.91 +/- 3.71 | K | EPHIN ELECTRONICS HOUSING TEMP | |
| tephin | 0.030 | 0.004 | (3.41+/-0.09)e2 | 4.00 +/- 2.87 | K | EPHIN SENSOR HOUSING TEMP | |
| S/C Main Temperatures - Daily Maximums | |||||||
|---|---|---|---|---|---|---|---|
| MSID | MEAN | RMS | DELTA/YR | DELTA/YR/YR | UNITS | DESCRIPTION | |
| tcylfmzm | 0.043 | 0.005 | (3.24+/-0.11)e2 | 1.41 +/- 2.08 | K | CNT CYL TEMP:-Z SIDE UNDER LAE-1 | |
| tcylfmzp | 0.044 | 0.004 | (3.26+/-0.10)e2 | 1.41 +/- 1.84 | K | CNT CYL TEMP:-Z SIDE UNDER LAE-2 | |
| S/C Ancillary Temperatures - Daily Maximums | |||||||
|---|---|---|---|---|---|---|---|
| MSID | MEAN | RMS | DELTA/YR | DELTA/YR/YR | UNITS | DESCRIPTION | |
| tfssbkt1 | 0.043 | 0.012 | (3.58+/-0.29)e2 | 3.60 +/- 4.66 | K | FSS BRAC | |
| tfssbkt2 | 0.044 | 0.013 | (3.53+/-0.32)e2 | 2.06 +/- 4.39 | K | FSS BRAC | |
| tsctsf1 | 0.041 | 0.003 | (3.30+/-0.06)e2 | 5.93 +/- 2.16 | K | SC-TS FITTING -1 TEMP | |
| tsctsf6 | 0.031 | 0.003 | (3.30+/-0.06)e2 | 7.25 +/- 2.30 | K | SC-TS FITTING -6 TEMP | |
| MUPS - Daily Maximums | |||||||
|---|---|---|---|---|---|---|---|
| MSID | MEAN | RMS | DELTA/YR | DELTA/YR/YR | UNITS | DESCRIPTION | |
| pm1thv1t | 0.053 | 0.008 | (3.59+/-0.18)e2 | -0.04 +/- 3.62 | K | MUPS 1 THRUSTER VALVE 01 TEMP | |
| pm2thv1t | 0.222 | 0.016 | (3.40+/-0.39)e2 | 2.54 +/- 5.42 | K | MUPS 2 THRUSTER VALVE 01 TEMP | |
| pm1thv2t | 0.055 | 0.008 | (3.62+/-0.18)e2 | 1.00 +/- 3.90 | K | MUPS 1 THRUSTER VALVE 02 TEMP | |
| pm2thv2t | 0.123 | 0.022 | (3.27+/-0.52)e2 | 0.72 +/- 8.31 | K | MUPS 2 THRUSTER VALVE 02 TEMP | |
| pline02t | 0.053 | 0.006 | (3.46+/-0.14)e2 | -0.89 +/- 3.33 | K | PROP LINE TEMP 02 | |
| pline03t | 0.042 | 0.006 | (3.37+/-0.14)e2 | 0.52 +/- 2.44 | K | PROP LINE TEMP 03 | |
| pline04t | 0.054 | 0.005 | (3.27+/-0.11)e2 | -3.65 +/- 2.87 | K | PROP LINE TEMP 04 | |
Quarterly Trends
- HRMA Struts
| Previous Quarter | |||||||
| MSID | MEAN | RMS | DELTA/YR | DELTA/YR/YR | UNITS | DESCRIPTION | |
| 4rt584t | 0.018 | 7.515e-04 | (3.04+/-0.02)e2 | 1.58 +/- 0.58 | K | RT 584 - STRUT TEMP | |
|---|---|---|---|---|---|---|---|
| 4rt585t | 0.020 | 7.507e-04 | (3.04+/-0.02)e2 | 1.29 +/- 0.57 | K | RT 585 - STRUT TEMP | |
| 4rt586t | 0.018 | 6.258e-04 | (3.00+/-0.02)e2 | 0.95 +/- 0.47 | K | RT 586 - STRUT TEMP | |
| 4rt587t | 0.015 | 4.871e-04 | (2.93+/-0.01)e2 | 0.81 +/- 0.36 | K | RT 587 - STRUT TEMP | |
| 4rt597t | 0.023 | 0.002 | (3.13+/-0.04)e2 | 2.04 +/- 1.17 | K | RT 597 - TFTE TEMP | |
| 4rt598t | 0.025 | 0.002 | (3.13+/-0.04)e2 | 1.75 +/- 1.19 | K | RT 598 - TFTE TEMP | |
- OB Forward Bulkhead
| Previous Quarter | |||||||
| MSID | MEAN | RMS | DELTA/YR | DELTA/YR/YR | UNITS | DESCRIPTION | |
| 4rt705t | 0.021 | 8.792e-04 | (2.94+/-0.02)e2 | 0.67 +/- 0.73 | K | RT 705 - OB BUL | |
|---|---|---|---|---|---|---|---|
| 4rt706t | 0.021 | 8.906e-04 | (2.93+/-0.02)e2 | 0.90 +/- 0.73 | K | RT 706 - OB BUL | |
| 4rt707t | 0.022 | 8.885e-04 | (2.96+/-0.02)e2 | 0.75 +/- 0.73 | K | RT 707 - OB BULKHEAD TEMP | |
| 4rt708t | 0.023 | 9.759e-04 | (3.01+/-0.02)e2 | 0.83 +/- 0.79 | K | RT 708 - OB BULKHEAD TEMP | |
| 4rt709t | 0.024 | 0.001 | (3.03+/-0.03)e2 | 0.81 +/- 0.85 | K | RT 709 - OB BULKHEAD TEMP | |
| 4rt710t | 0.026 | 0.001 | (3.05+/-0.03)e2 | 1.19 +/- 0.91 | K | RT 710 - OB BULKHEAD TEMP | |
- HRMA Thermal
- HRMA Thermal
| Previous Quarter | |||||||
| MSID | MEAN | RMS | DELTA/YR | DELTA/YR/YR | UNITS | DESCRIPTION | |
| 4rt568t | 0.021 | 9.607e-04 | (3.02+/-0.02)e2 | 1.67 +/- 0.74 | K | RT 568 - HRMA TEMP | |
|---|---|---|---|---|---|---|---|
| 4rt569t | 0.010 | 2.714e-04 | (2.98+/-0.01)e2 | 0.35 +/- 0.16 | K | RT 569 - HRMA TEMP | |
| 4rt570t | 0.006 | 1.428e-04 | (2.96+/-0.00)e2 | 0.11 +/- 0.07 | K | RT 570 - HRMA TEMP | |
| 4rt575t | 0.024 | 0.001 | (3.07+/-0.03)e2 | 1.85 +/- 0.95 | K | RT 575 - OB CONE TEMP | |
| 4rt576t | 0.022 | 9.642e-04 | (2.97+/-0.02)e2 | 1.39 +/- 0.77 | K | RT 576 - OB CONE TEMP | |
| 4rt578t | 0.028 | 0.002 | (3.06+/-0.04)e2 | 1.12 +/- 1.15 | K | RT 578 - OB CONE TEMP | |
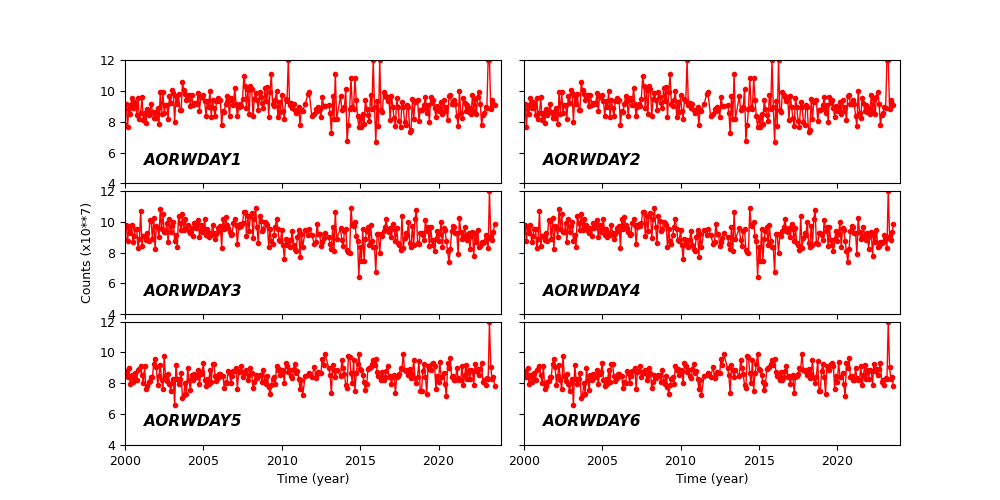
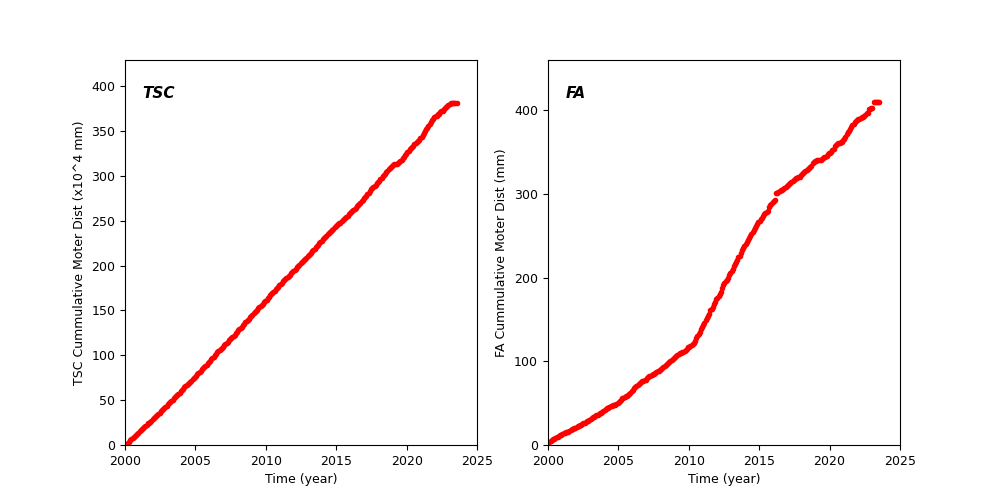
Spacecraft Motions
TSC and FA Cummulative Moter Distance
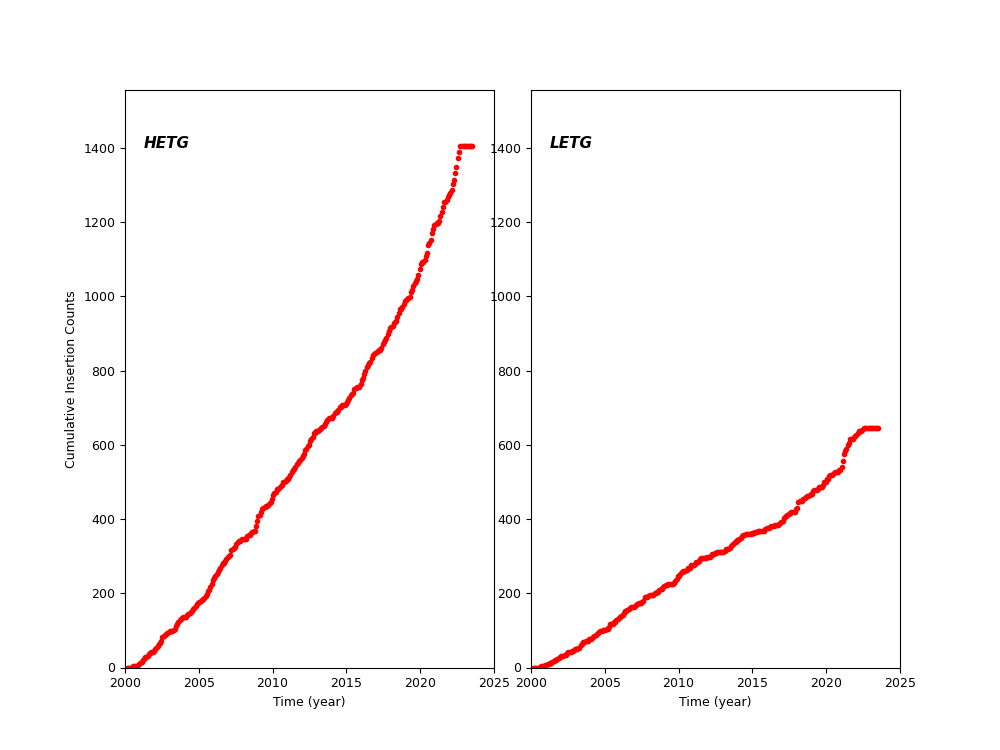
HETG and LETG Cummulative Insertion Counts
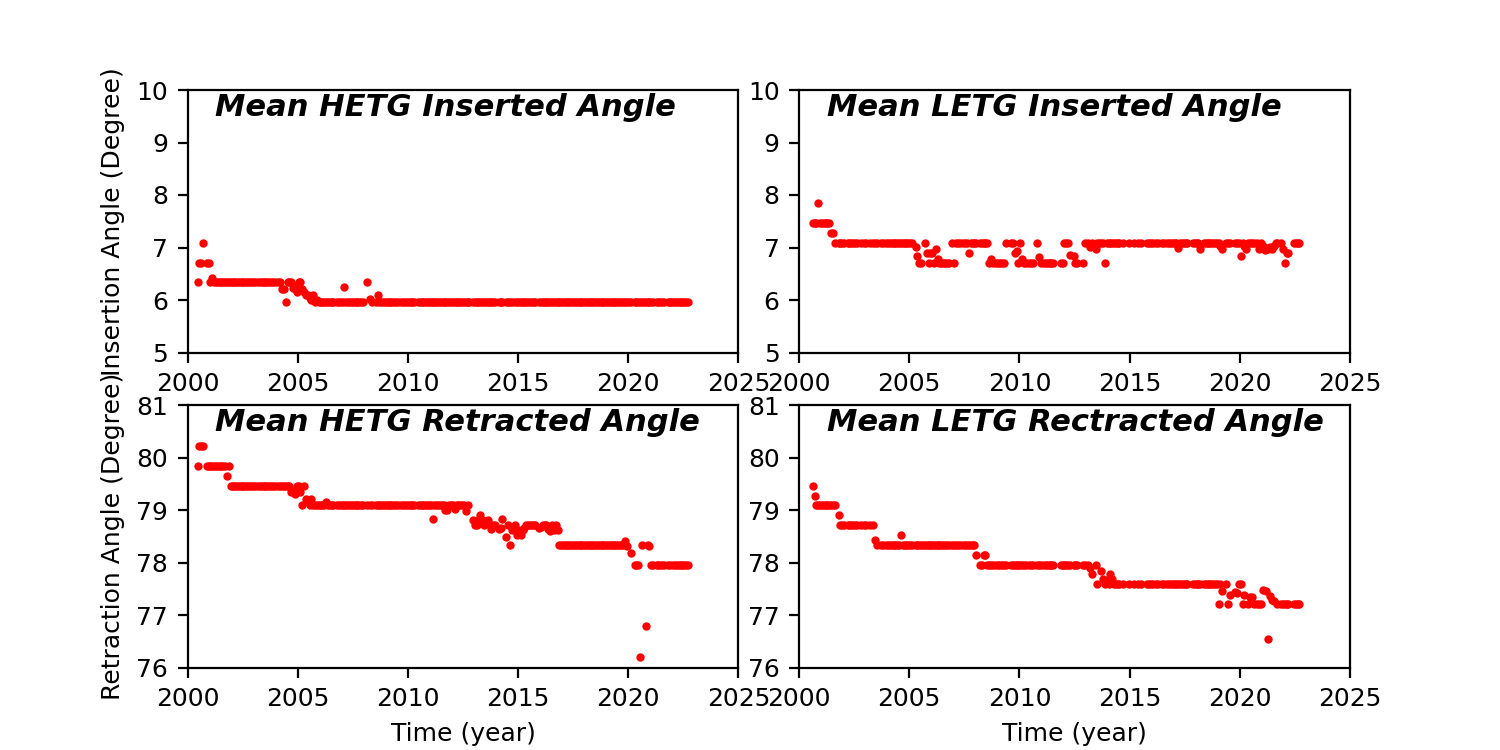
HETG/LETG Insertion/Retraction Angle
Reaction Wheel Rotations