ACIS
ACIS DOSE Registered-Photon-Map
The steps we took to compute the dose map are;
- Level 1 Event files for a specified month are obtained from archive.
- Image data including I2, I3, S2, S3 CCDs are extracted from all event files.
- All the extracted image data were merged to create a month long exposure map for the month.
- The exposure map is opened with ds9, and check a distribution of count rates against energy. From this, estimate the upper threshold value. Any events beyond this upper threshold are assumed erroneous events such as bad pixels.
- Using this upper threshold, the data is filtered, and create a cleaned exposure map for the month.
- The exposure map from each month from the Sep 1999 is added up to create a cumulative exposure map for each month.
- Using fimgstatistic, we compute count rate statistics for each CCDs.
- For observations with high data drop rates (e.g., Crab nebula, Cas A), we corrected the observations by adding events.
Please check more detail plots at Telemetered Photon Dose Trend page.
)
)
)
Statistics:
# IMAGE     NPIX     MEAN        RMS        MIN     MAX
ACIS_feb26 6004901       7.234         34.682           0.0     4415


I2 node 0  262654	5.211094	2.706286	0.0	 49.0
I2 node 1  262654	6.436275	4.057048	0.0	1124.0
I2 node 2  262654	7.989153	5.183060	0.0	 61.0
I2 node 3  262654	11.338699	11.951770	0.0	449.0

I3 node 0  262654	20.748101	22.107357	0.0	573.0
I3 node 1  262654	10.785309	7.377105	0.0	 87.0
I3 node 2  262654	6.939995	3.531565	0.0	 47.0
I3 node 3  262654	5.906988	2.928906	0.0	294.0

S2 node 0  262654	5.351624	9.096829	0.0	619.0
S2 node 1  262654	6.600825	12.977777	0.0	692.0
S2 node 2  262654	9.675509	23.307605	0.0	696.0
S2 node 3  262654	8.500906	18.564627	0.0	751.0

S3 node 0  262654	24.183372	152.630264	0.0	4415.0
S3 node 1  262654	7.071689	12.659053	0.0	304.0
S3 node 2  262654	9.927275	23.007476	0.0	317.0
S3 node 3  262654	9.257170	22.903198	0.0	303.0
)
)
)
Statistics:
 IMAGE     NPIX      MEAN        RMS           MIN      MAX
ACIS_total   6004901       2773.046         3491.790           0.0   169725


I2 node 0  262654	2405.102659	489.444101	512.0	16210.0
I2 node 1  262654	2539.439603	716.894655	526.0	167719.0
I2 node 2  262654	2570.637330	550.432869	551.0	18023.0
I2 node 3  262654	2582.721407	681.010885	509.0	37811.0

I3 node 0  262654	2810.833077	725.837358	508.0	17571.0
I3 node 1  262654	2867.001498	1763.608073	534.0	56110.0
I3 node 2  262654	2565.910054	483.629602	504.0	15716.0
I3 node 3  262654	2538.753203	519.192992	483.0	37655.0

S2 node 0  262654	3231.031736	522.603239	1739.0	22700.0
S2 node 1  262654	3433.437675	786.318592	1915.0	22732.0
S2 node 2  262654	3810.626532	792.177295	2328.0	34437.0
S2 node 3  262654	3766.873158	654.076137	2047.0	89837.0

S3 node 0  262654	5736.997710	3139.547520	2518.0	56532.0
S3 node 1  262654	6942.490998	2416.638722	0.0	83602.0
S3 node 2  262654	5679.182820	1395.681836	2672.0	27825.0
S3 node 3  262654	4469.293655	794.479312	2682.0	26938.0
)
|
)
|
)
|
)
|
| Nov 2025 | Aug 2025 | May 2025 | Feb 2025 |
|---|
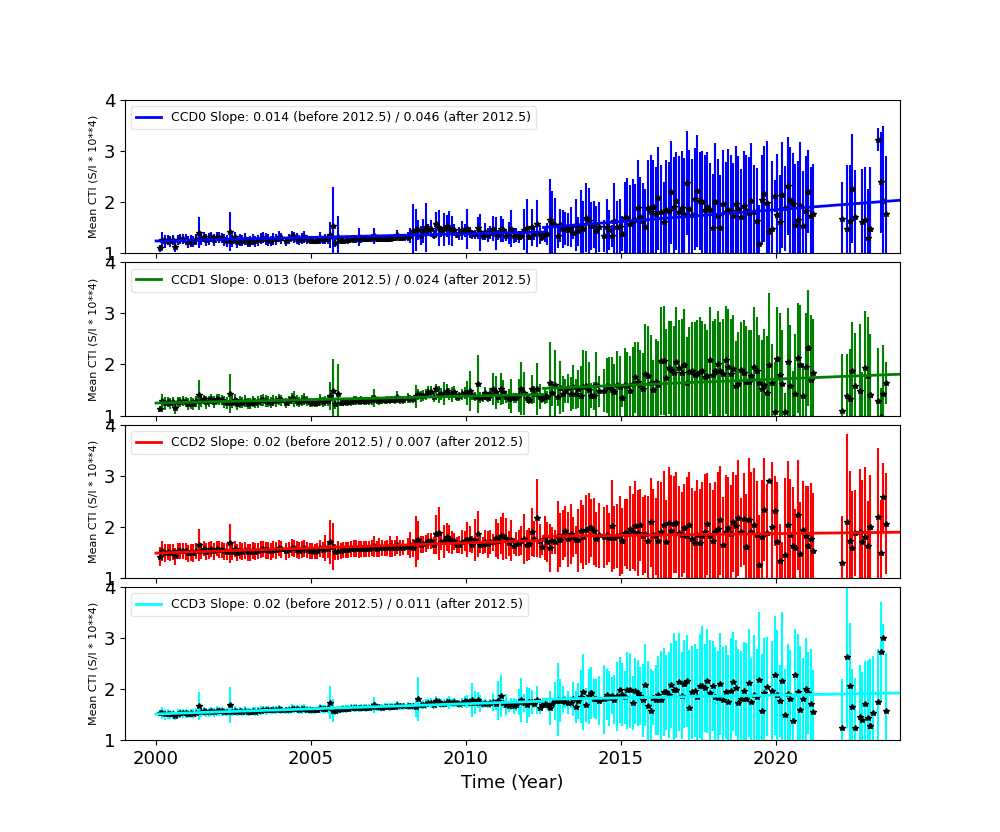
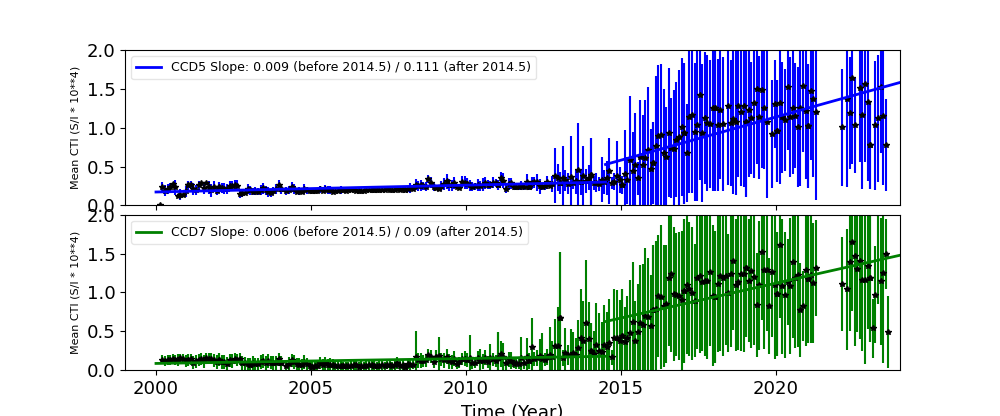
The Mean Detrended CTI
We report CTIs with a refined data definition. CTIs were computed for the temperature dependency corrected data. Please see CTI page for detailed explanation. CTI's are computed for Mn K alpha, and defined as slope/intercept x10^4 of row # vs ADU. Data file: here
Imaging CCDs
Spectral CCDs
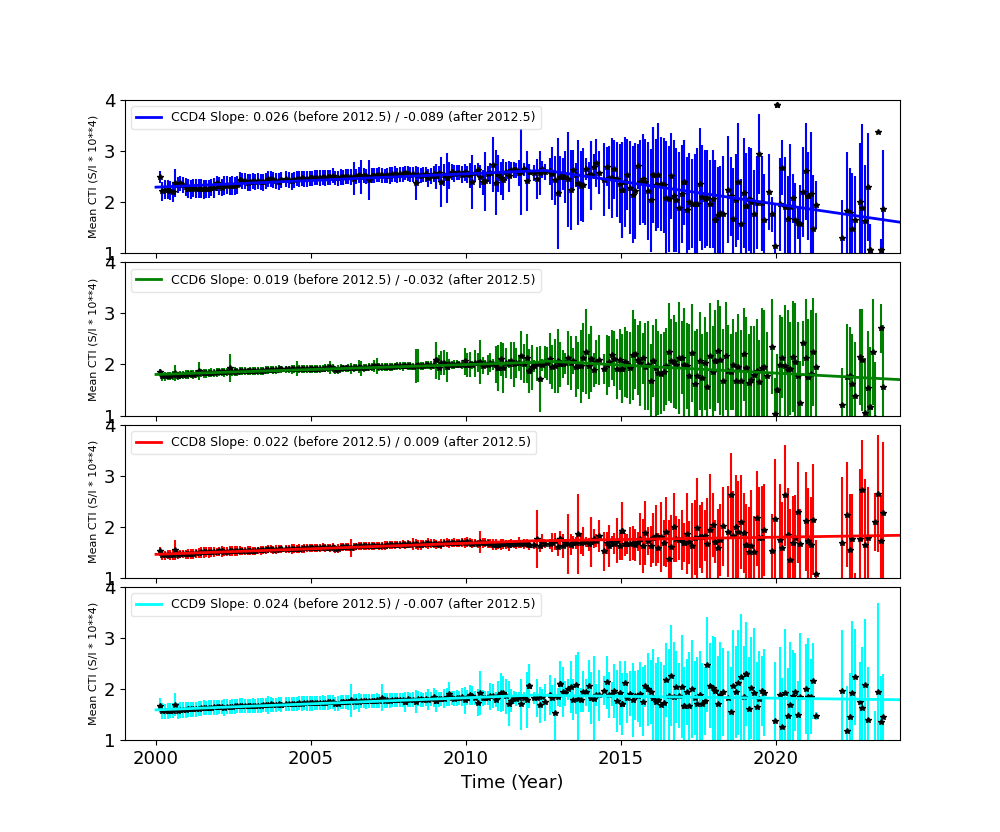
Backside CCDs
Focal Plane Temperature
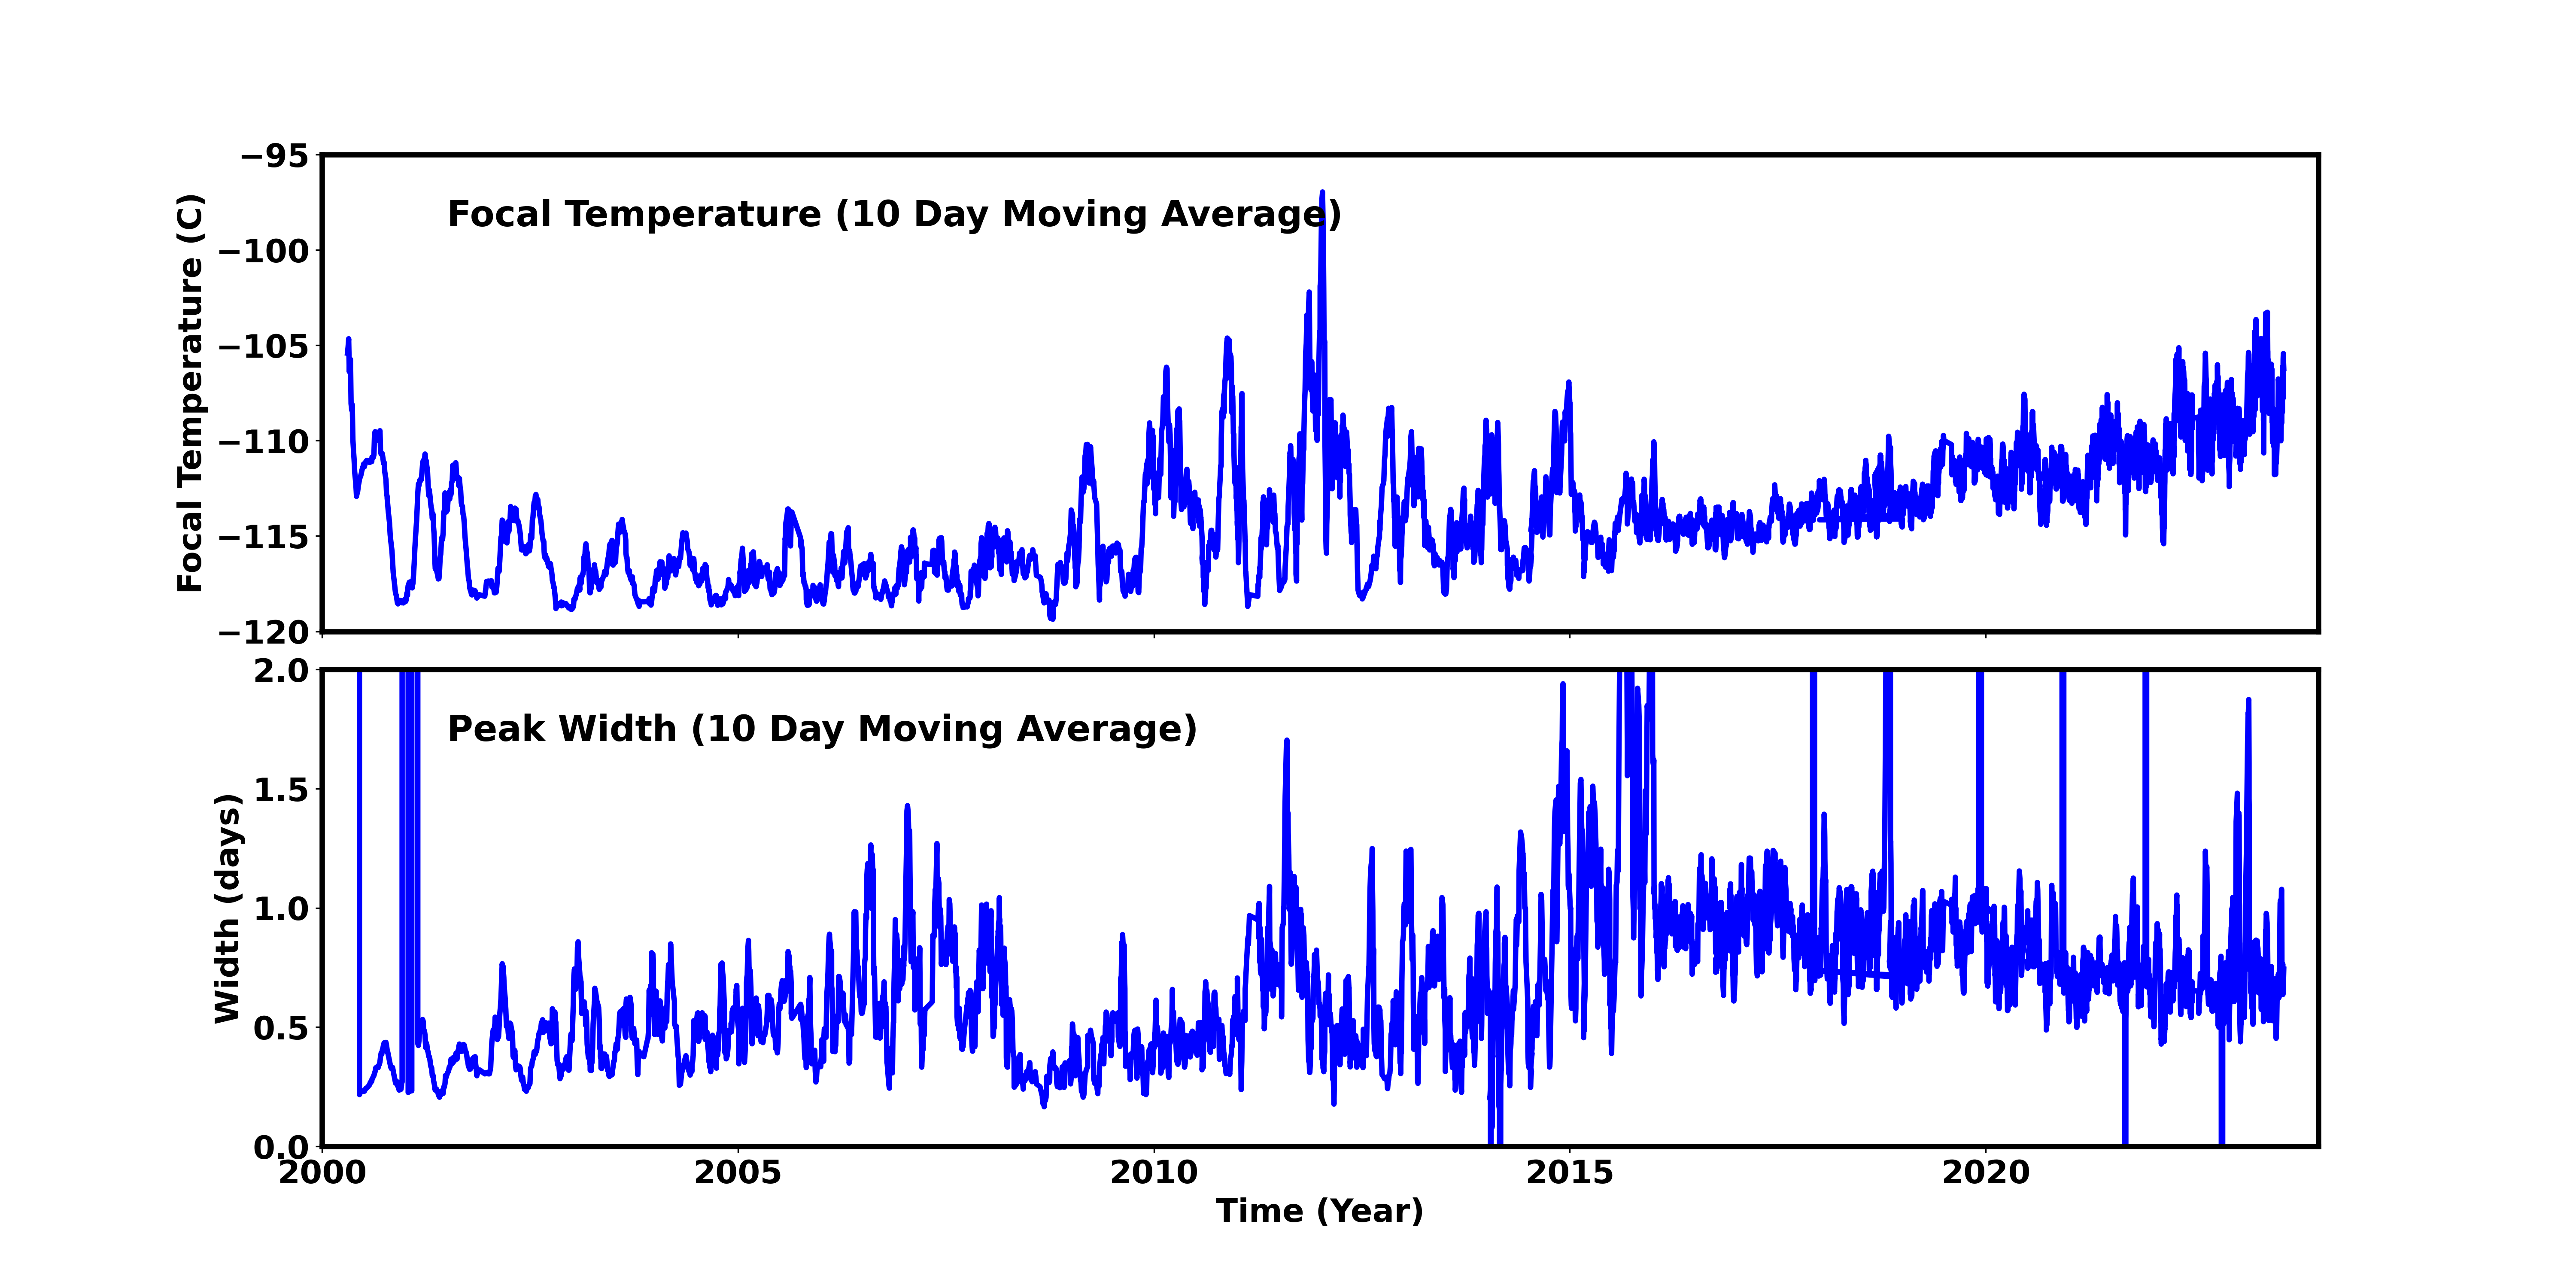
Feb 2026 Focal Temperature
| The Mean (max) FPT: | |
|---|---|
| -107.53 | +/- 7.69 C |
| Mean Width: | |
| 0.8 | +/- 0.58 days |
Averaged Focal Plane Temperature
We are using 10 period moving averages to show trends of peak temperatures and peak widths. Note, the gaps in the width plot are due to missing/corrupted data.
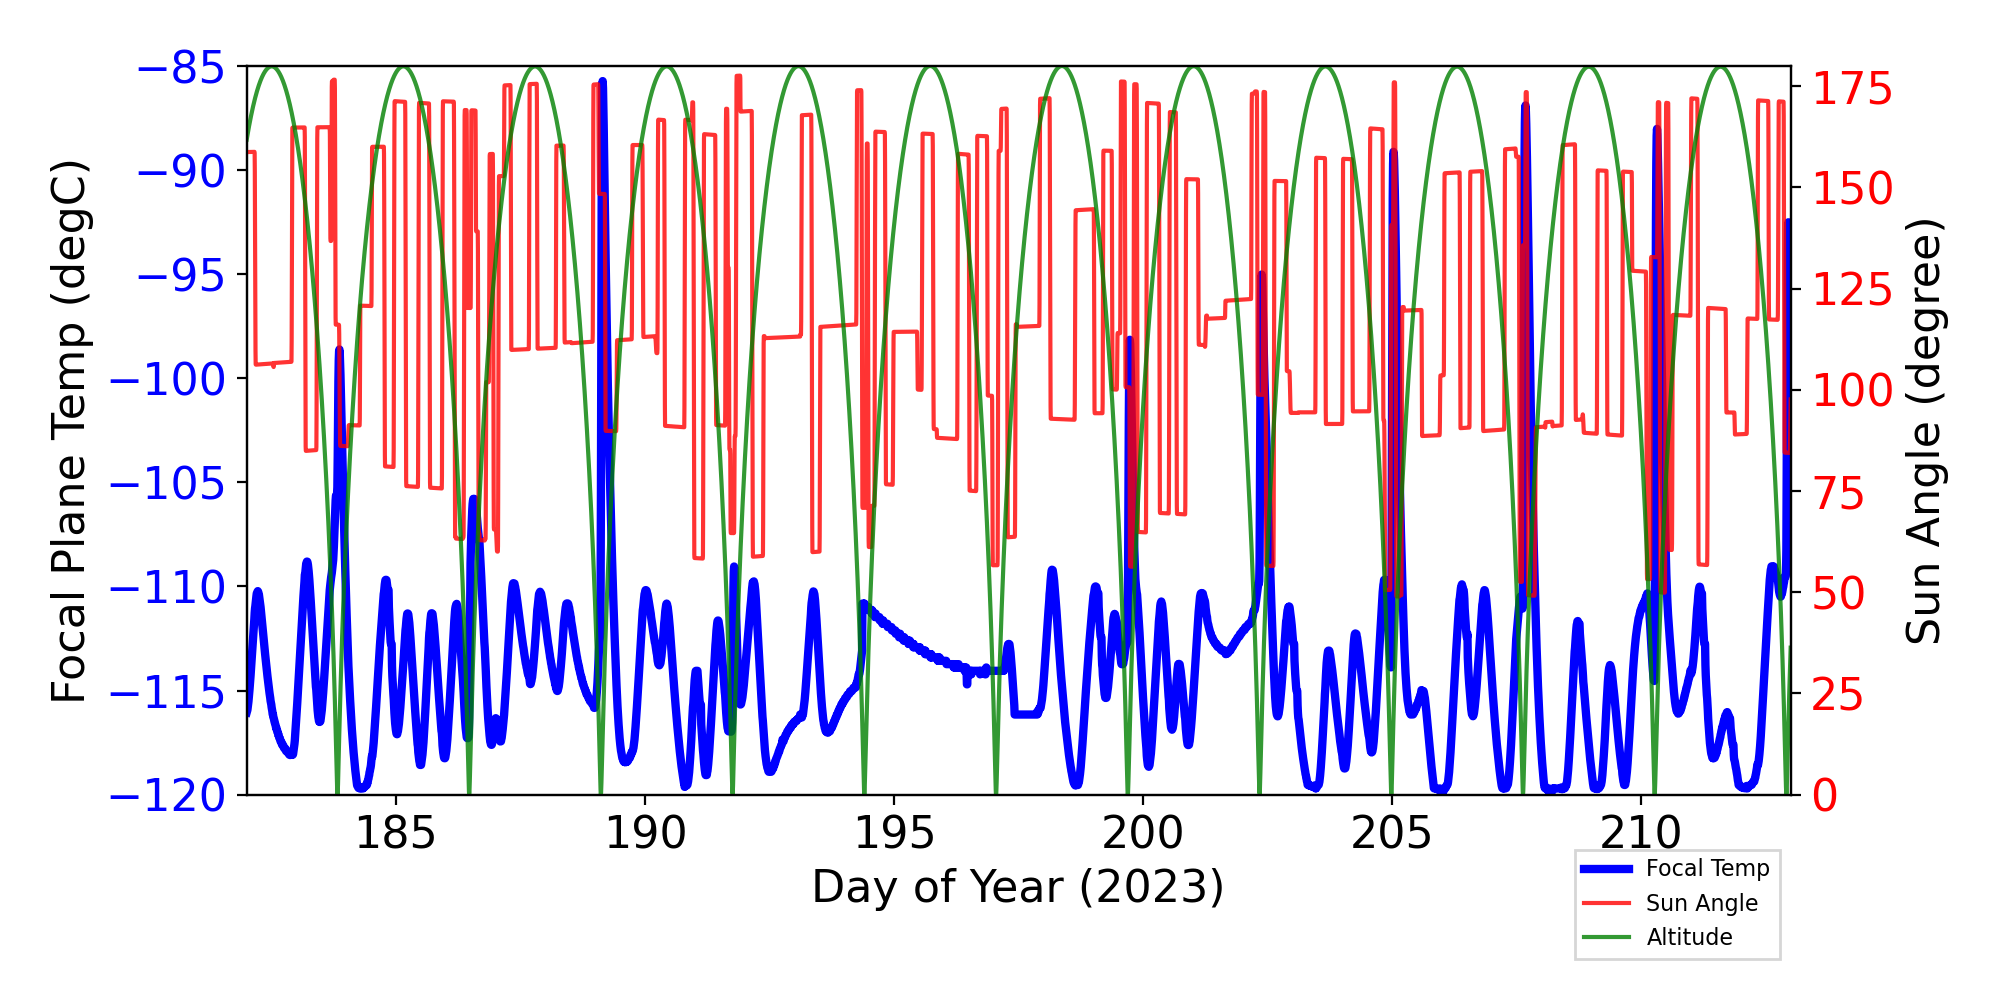
Focal Plane Temperature, Sun Angle and Altitude
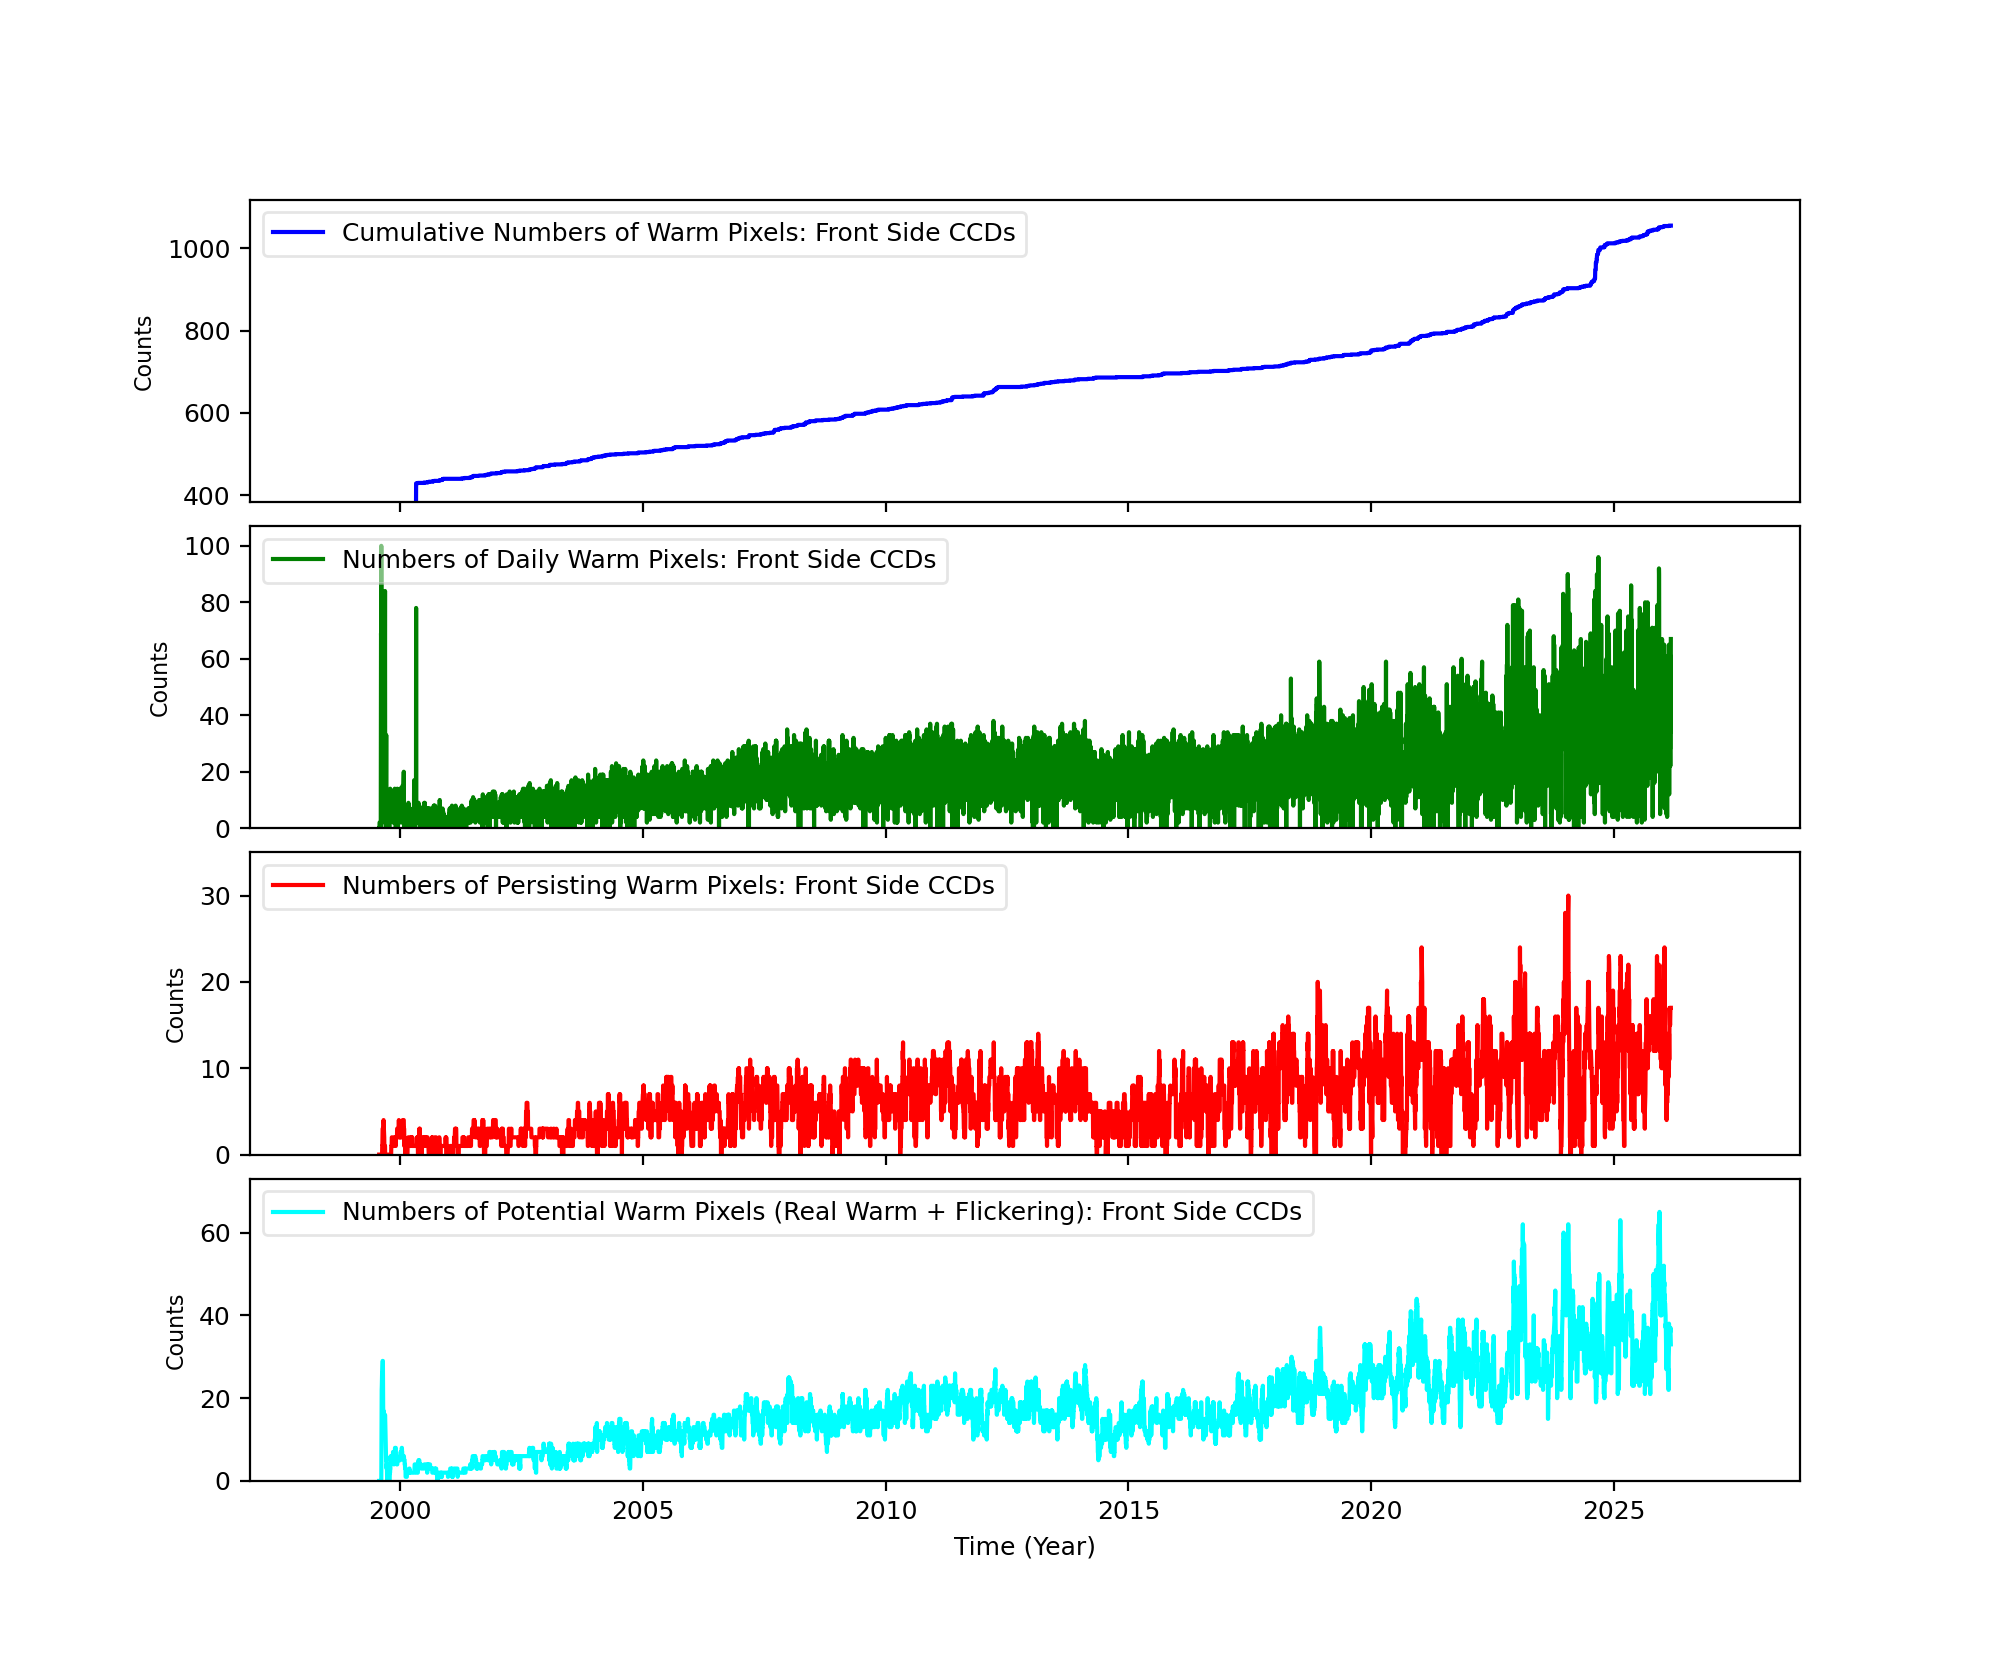
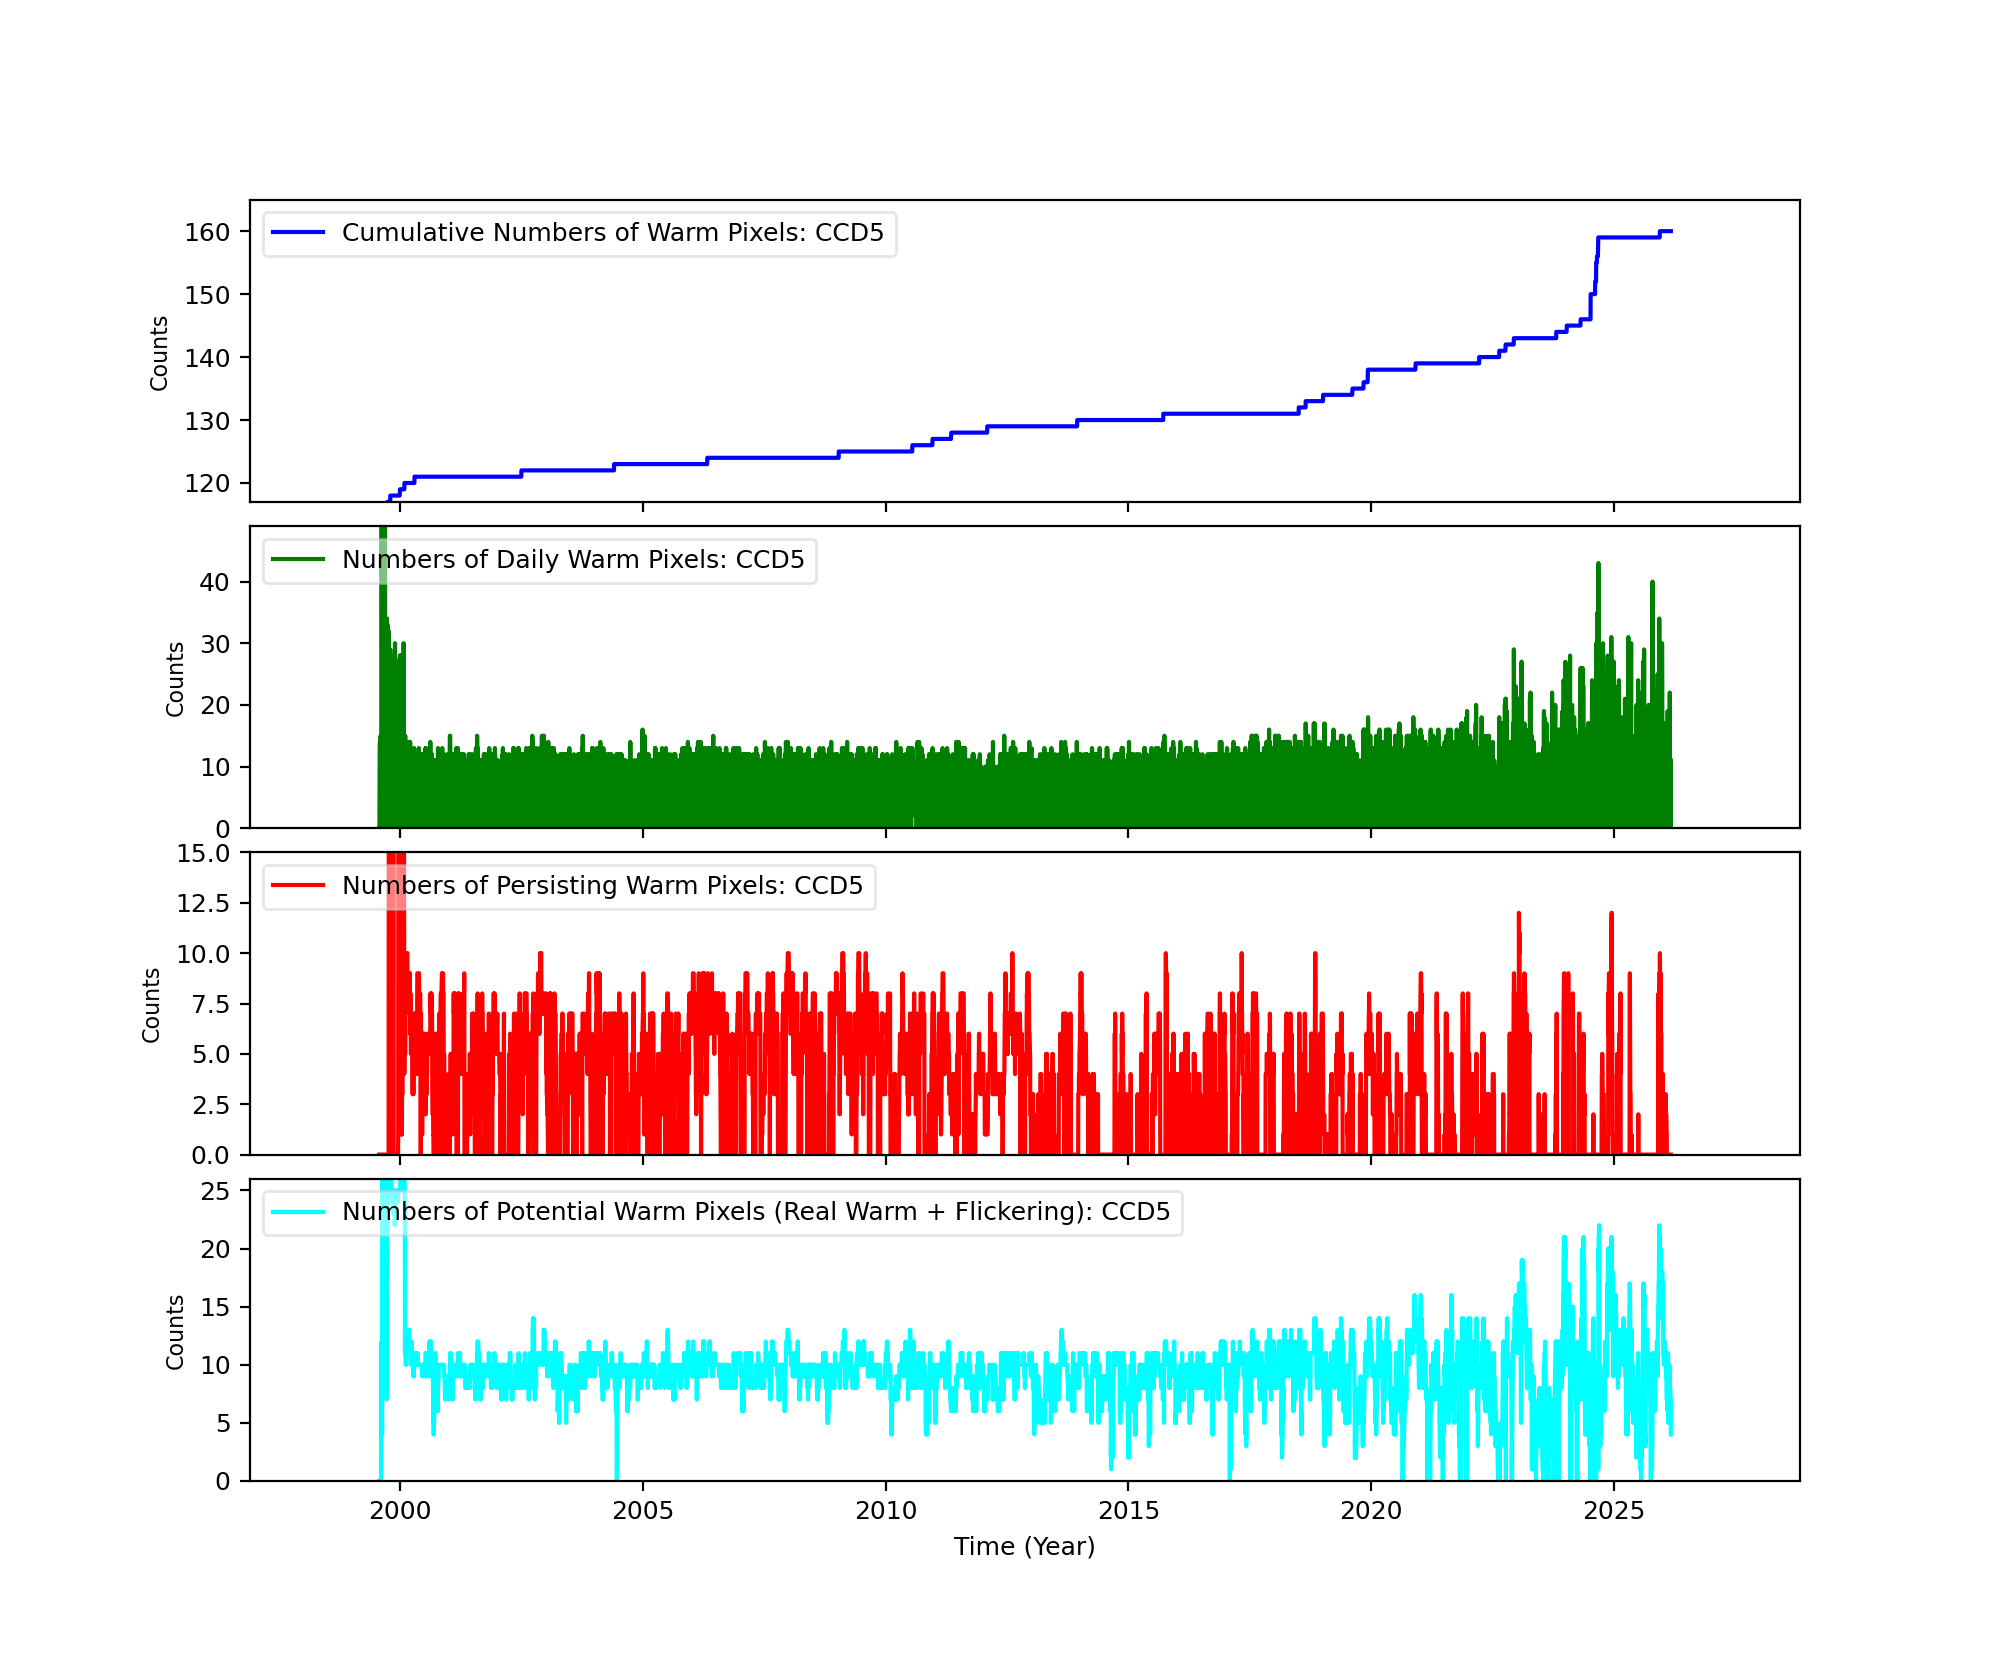
Bad Pixels
The plots below were generated with a new warm pixel finding script. Please see Acis Bad Pixel Page for details.
Front Side CCDs
Back Side CCD (CCD5)
Science Instrument Background Rates
| Name | Low (keV) | High(KeV) | Description |
|---|---|---|---|
| SSoft | 0.00 | 0.50 | Super soft photons |
| Soft | 0.50 | 1.00 | Soft photons |
| Med | 1.00 | 3.00 | Moderate energy photons |
| Hard | 3.00 | 5.00 | Hard Photons |
| Harder | 5.00 | 10.00 | Very Hard photons |
| Hardest | 10.00 | Beyond 10 keV |


HRC
DOSE of Central 4K Pore-Pairs
Please refer to Maximum Dose Trends for more details.
)
|
|---|
IMAGE                NPIX      MEAN    STDDEV      MIN       MAX
HRCI_02_2026.fits  16777216	0.019 	0.183 	0.000 	19.000
)
IMAGE                       NPIX      MEAN    STDDEV      MIN       MAX
HRCI_08_1999_02_2026.fits  16777216	na	na	na	na
No Data
)
IMAGE                       NPIX      MEAN    STDDEV      MIN       MAX
HRCS_08_1999_02_2026.fits  16777216	na	na	na	na
|
|
Max dose trend plots corrected for events that "pile-up"
in the center of the taps due to bad position information.
|
)
|
)
|
)
|
)
|
| Nov 2025 | Aug 2025 | May 2025 | Feb 2025 |
|---|
)
|
)
|
)
|
)
|
| Nov 2025 | Aug 2025 | May 2025 | Feb 2025 |
|---|
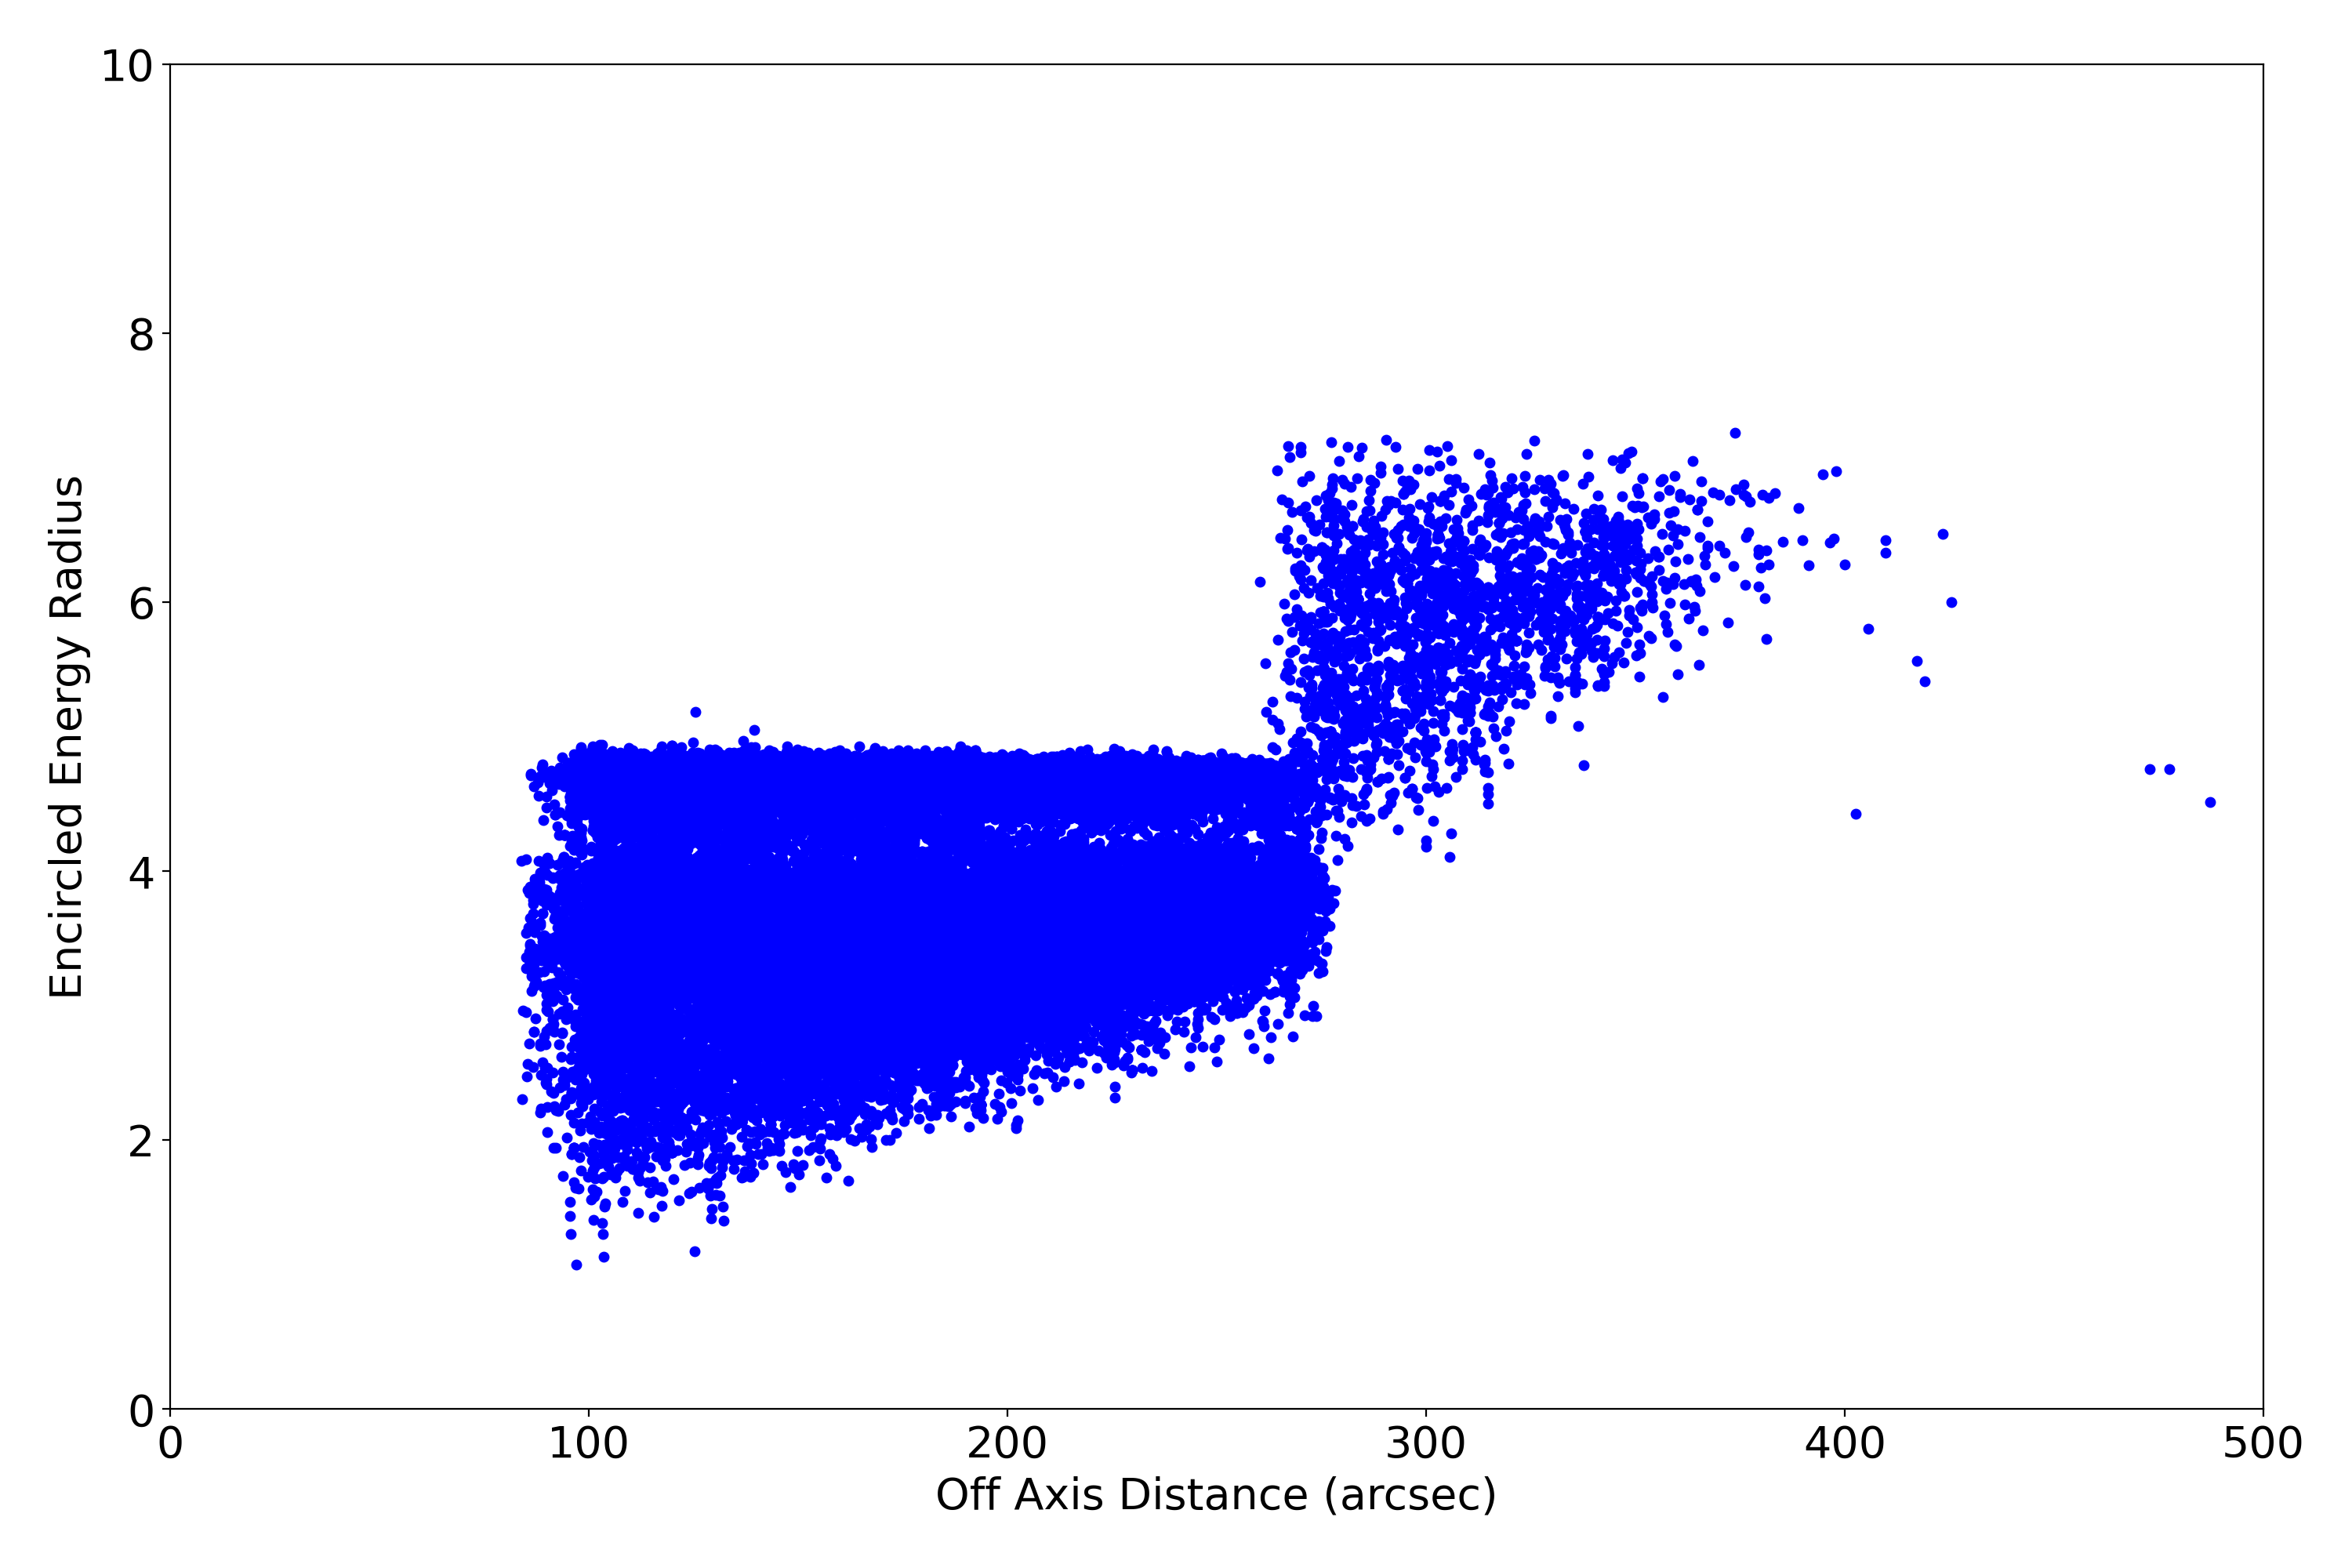
HRMA Focus
Plots below show various characteristics of detected imaging sources. Standard level 2 data products (*src2.fits) are used. Only observations with focus (sim_x) within 0.01 mm of nominal value for given SI configuration are used. Sources are also filtered for strength (SNR > 15).
| XY | PSF | Roundness | EE Radius | SNR | Rotation | Rotation2 | |
|---|---|---|---|---|---|---|---|
| ACIS I |  |
 |
 |
 |
 |
 |
 |
| ACIS S |  |
 |
 |
 |
 |
 |
 |
| HRC I |  |
 |
 |
 |
 |
 |
 |
| HRC S |  |
 |
 |
 |
 |
 |
 |
Gratings
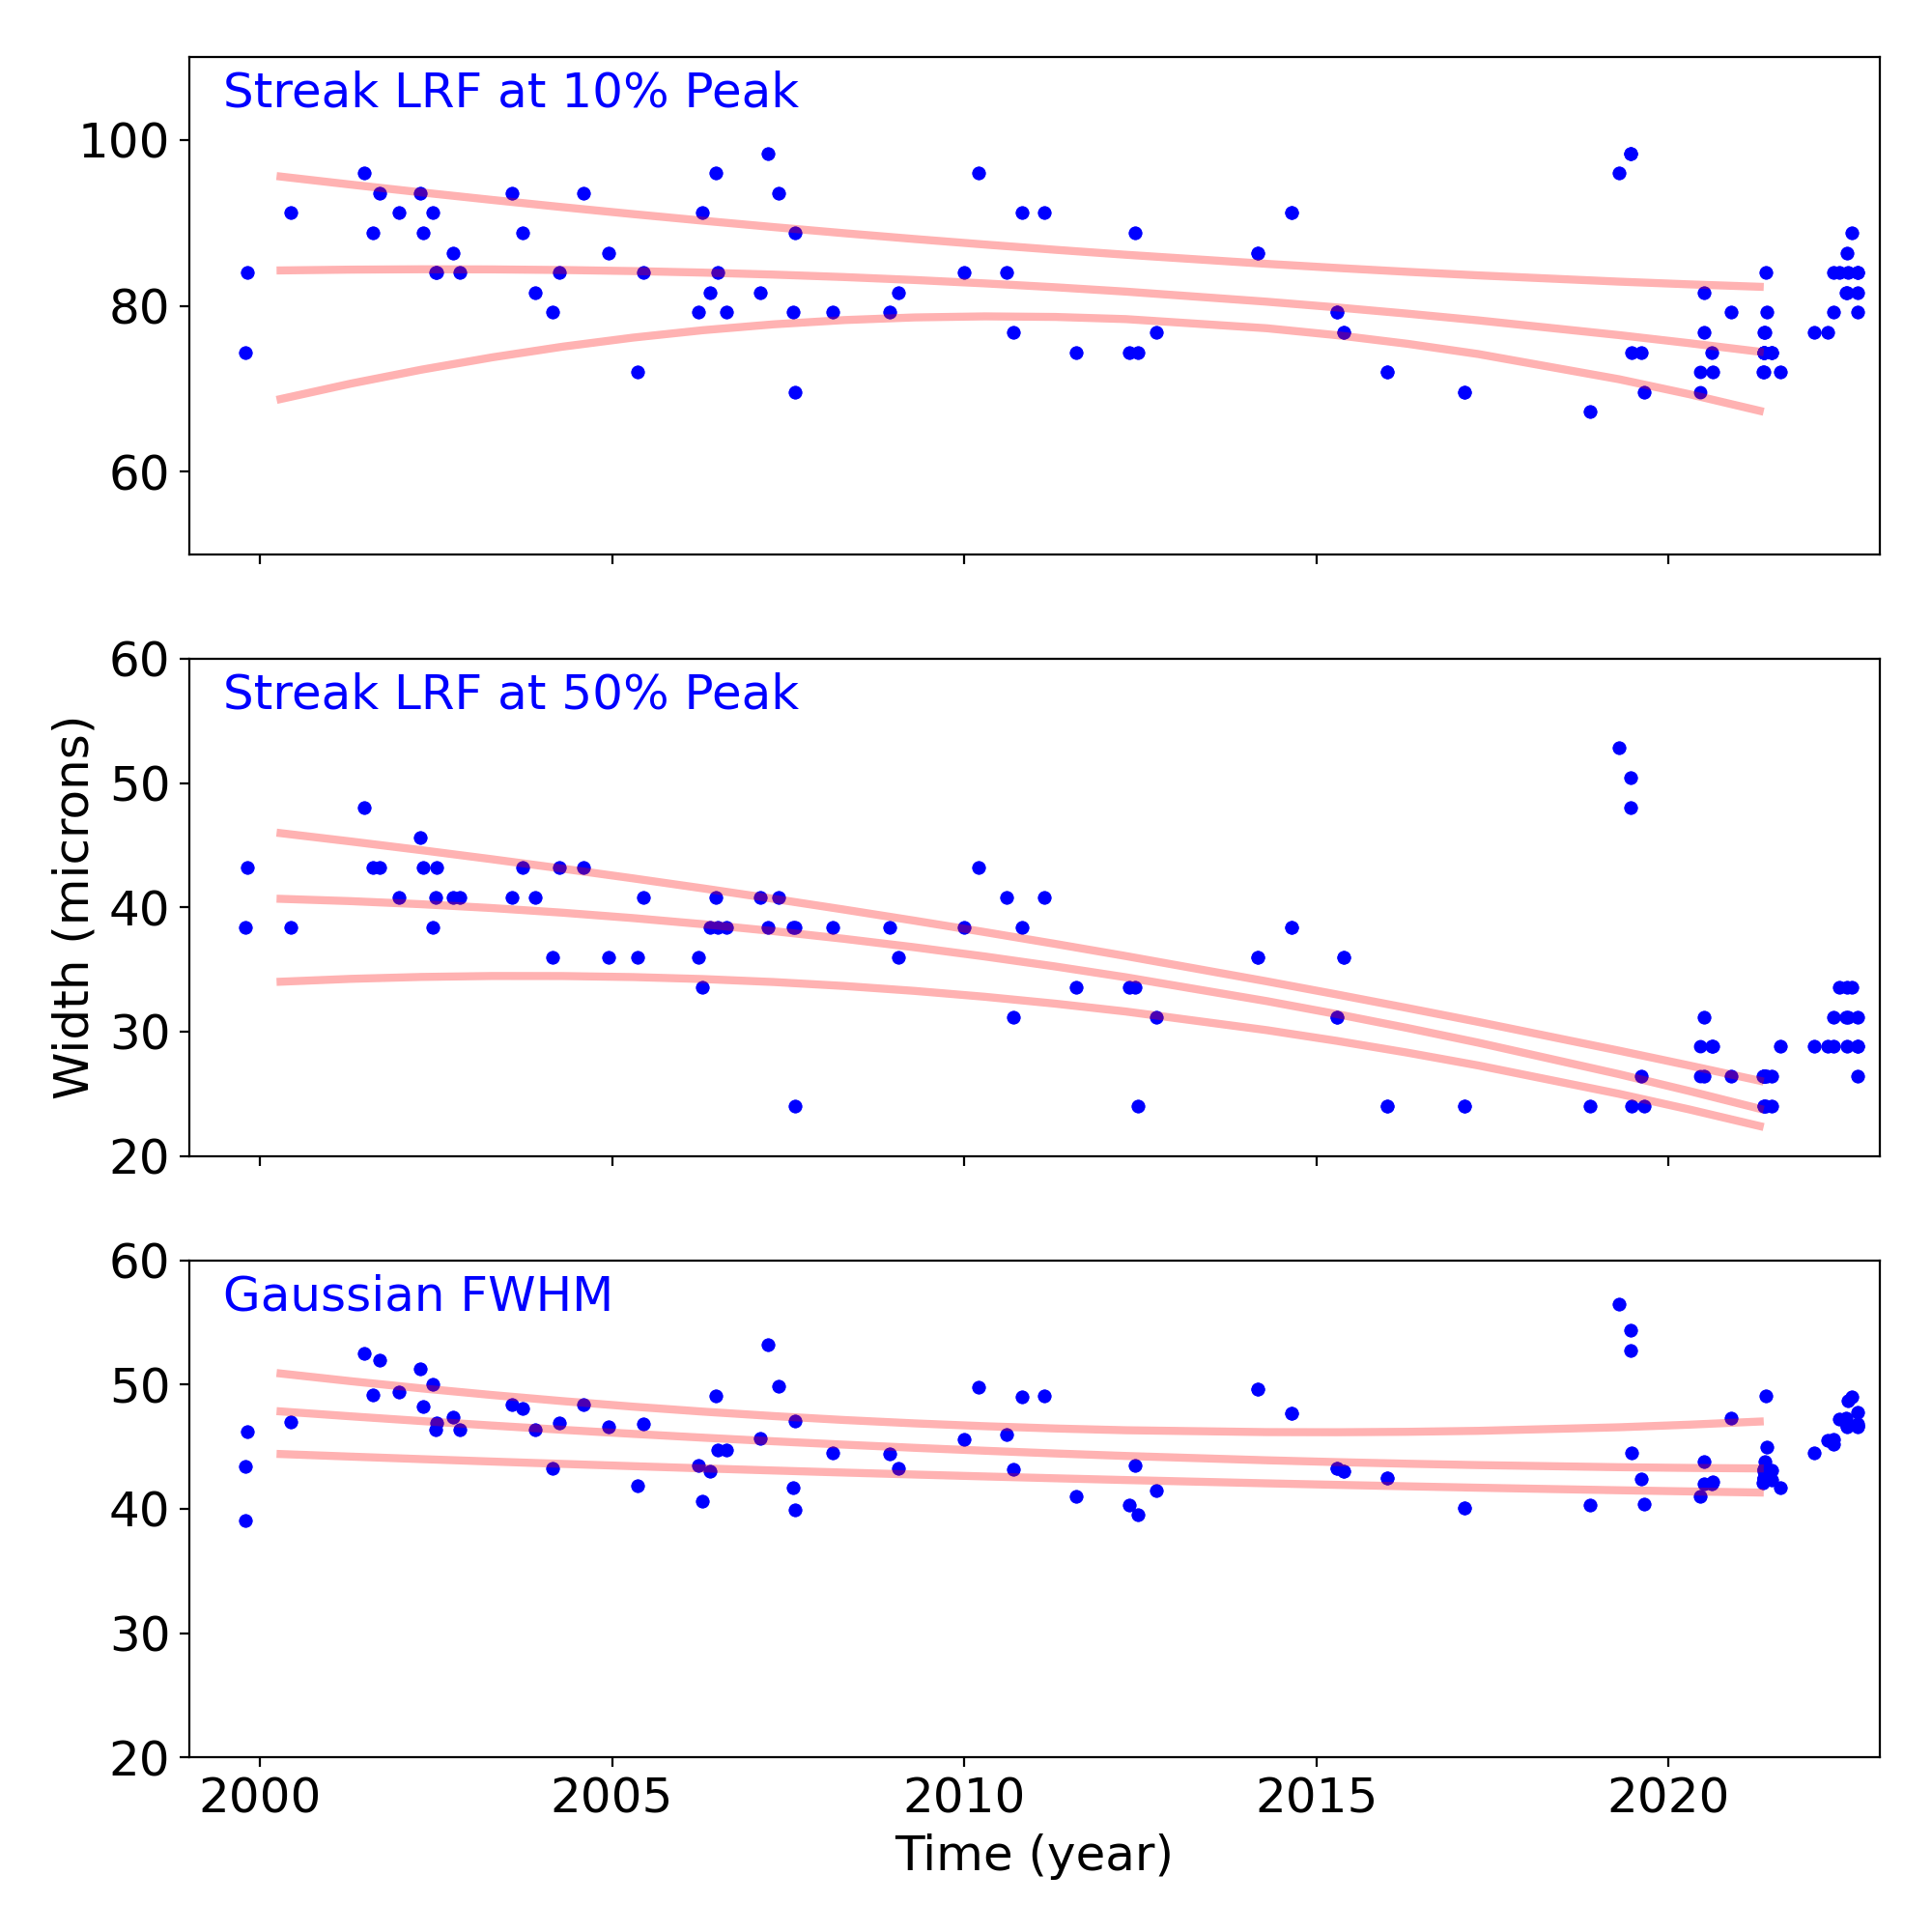
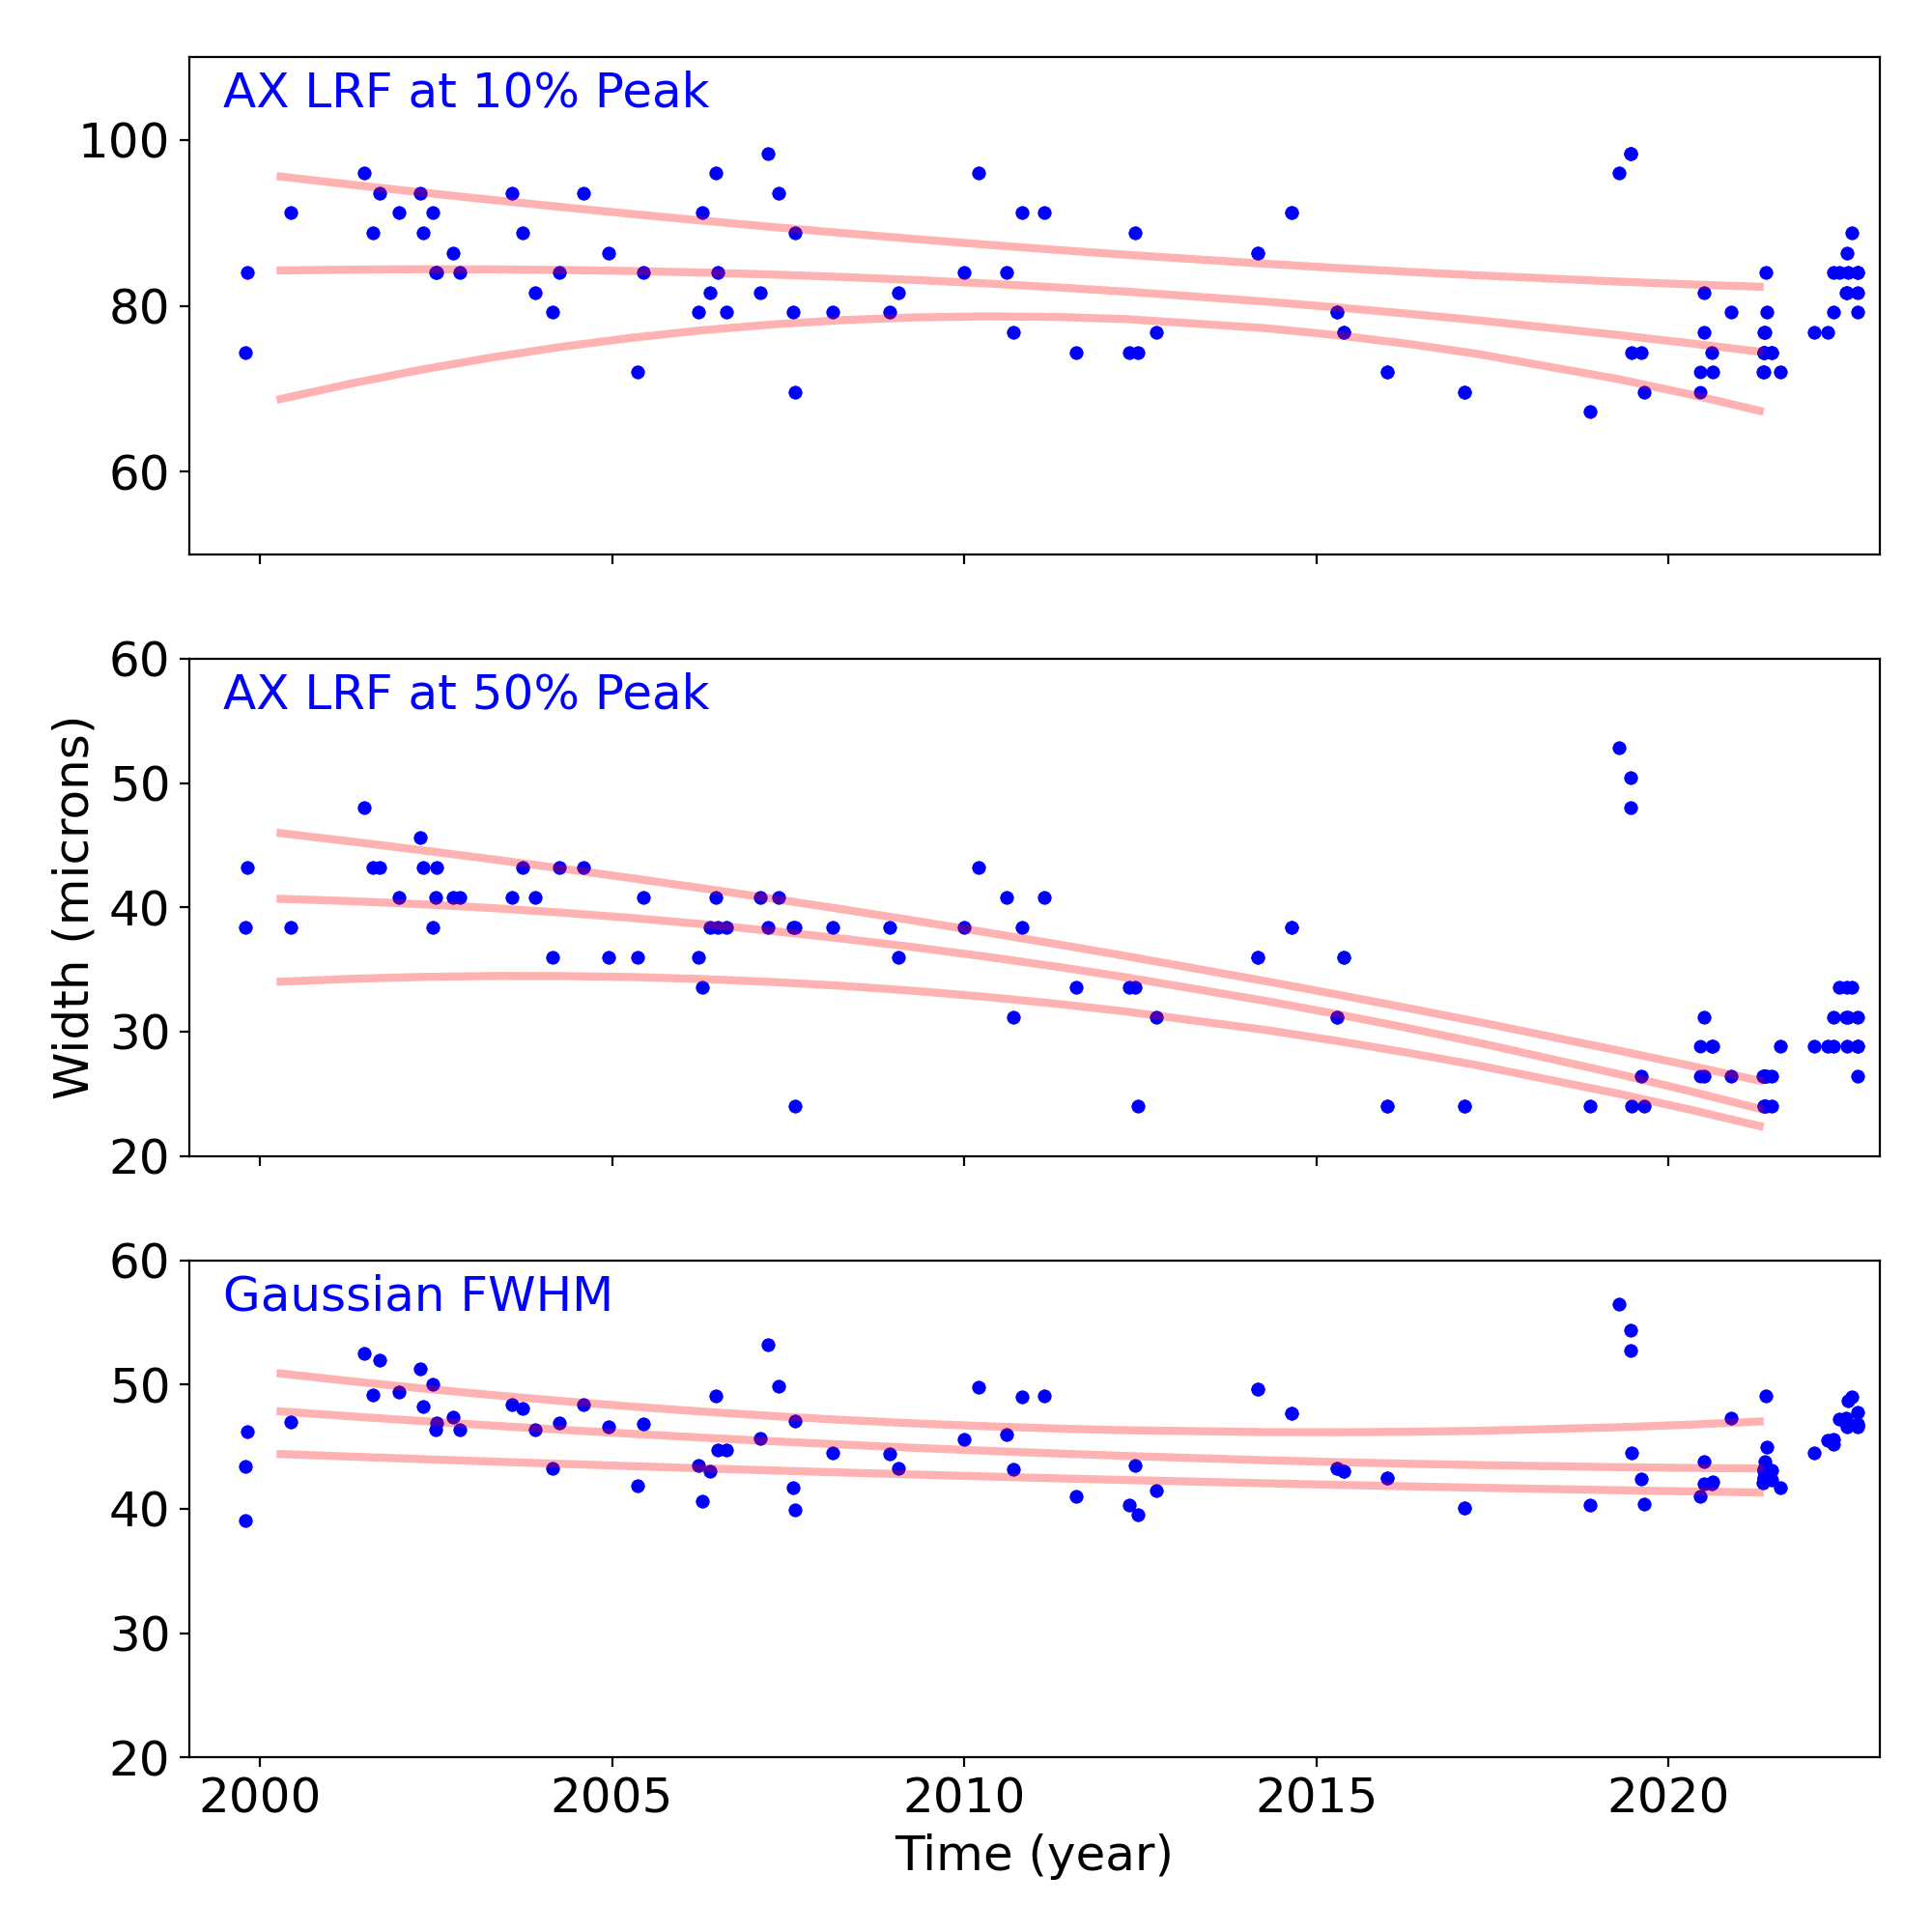
Grating Trends/Focus
We plot the width of the zero order streak of ACIS/HETG observations and the width of the zero order image for HRC/LETG observations of point sources. No significant defocusing trend is seen at this time. See Gratings Trends pages.
PCAD
ACA Trending
| ACIS |
)
|
)
|
)
|
|
|---|---|---|---|---|
)
|
)
|
)
| ||
| HRCI |
)
|
)
|
)
|
)
|
| HRCI |
)
|
)
|
)
|
)
|
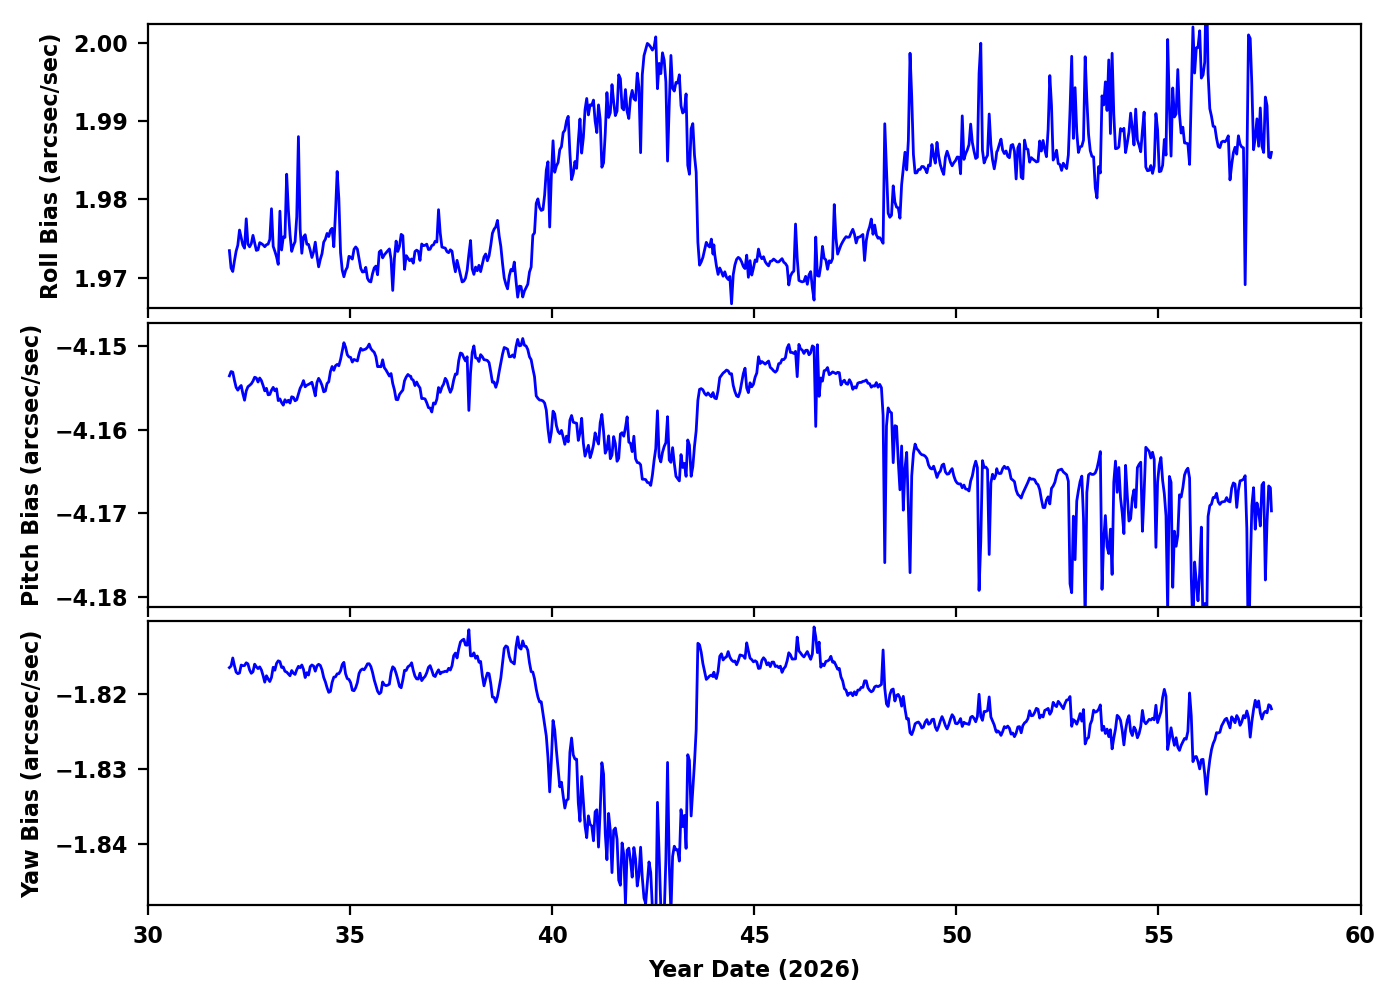
Gyro Bias Drift
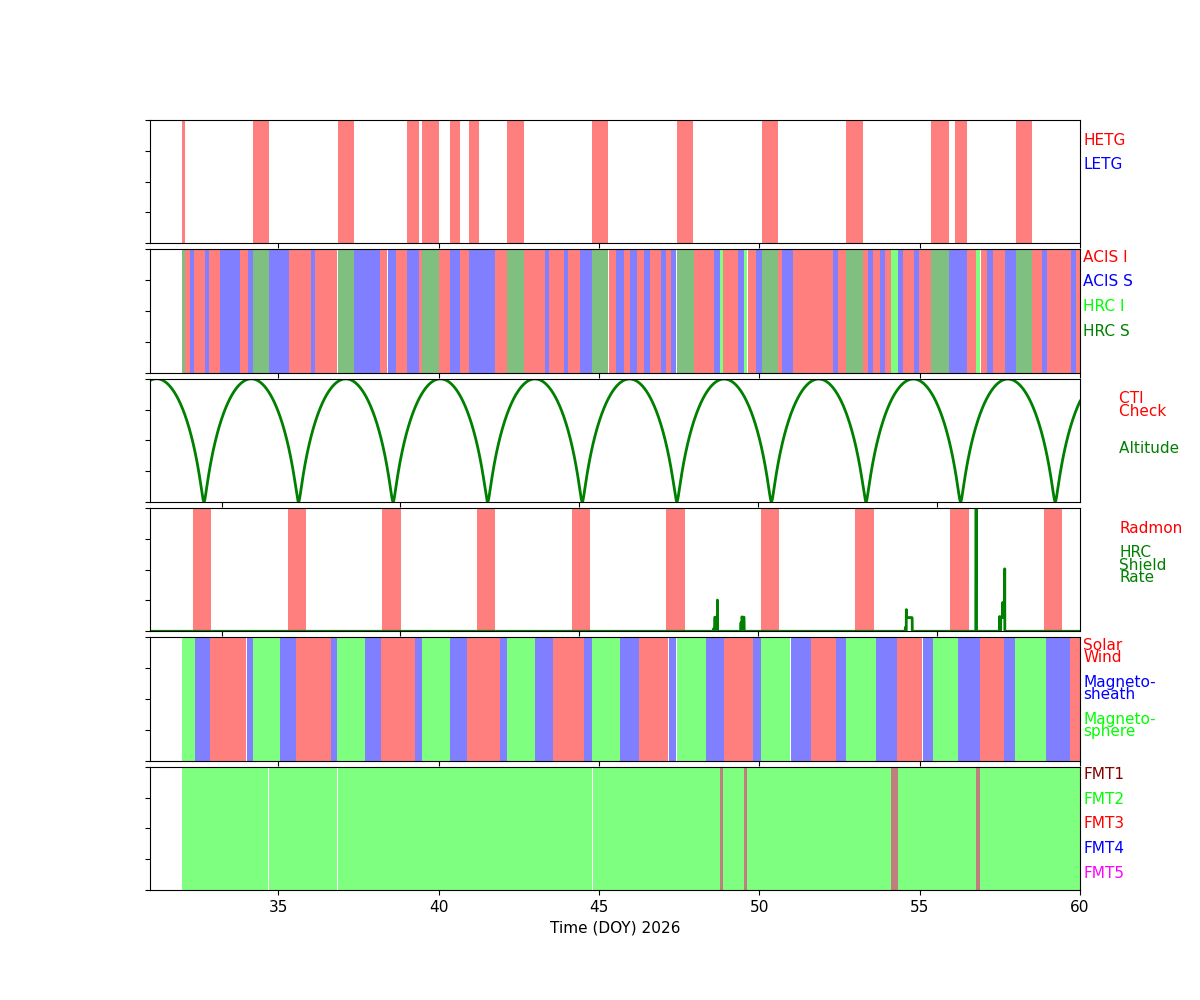
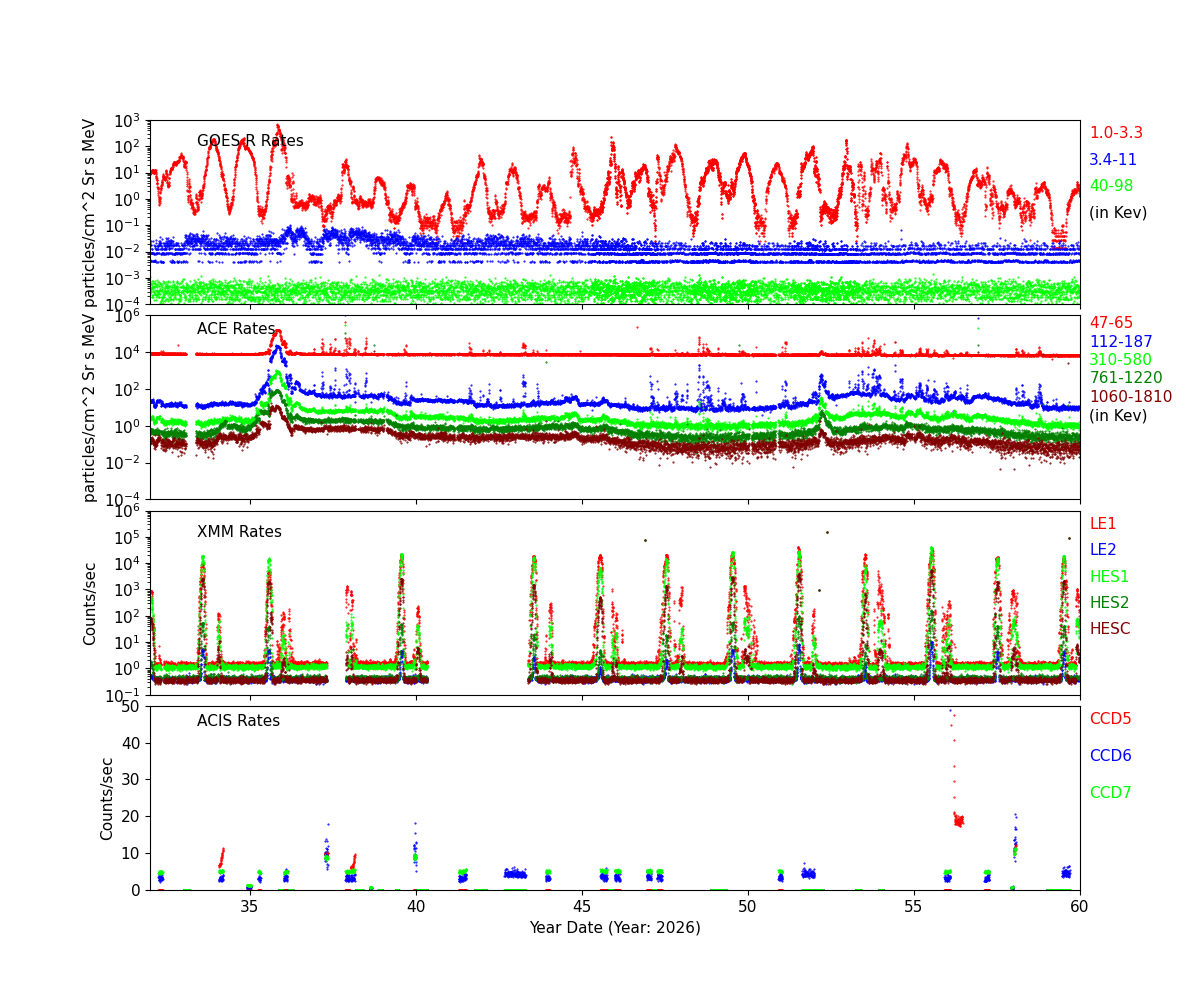
Radiation History
Radiation Count Rates of Feb 2026
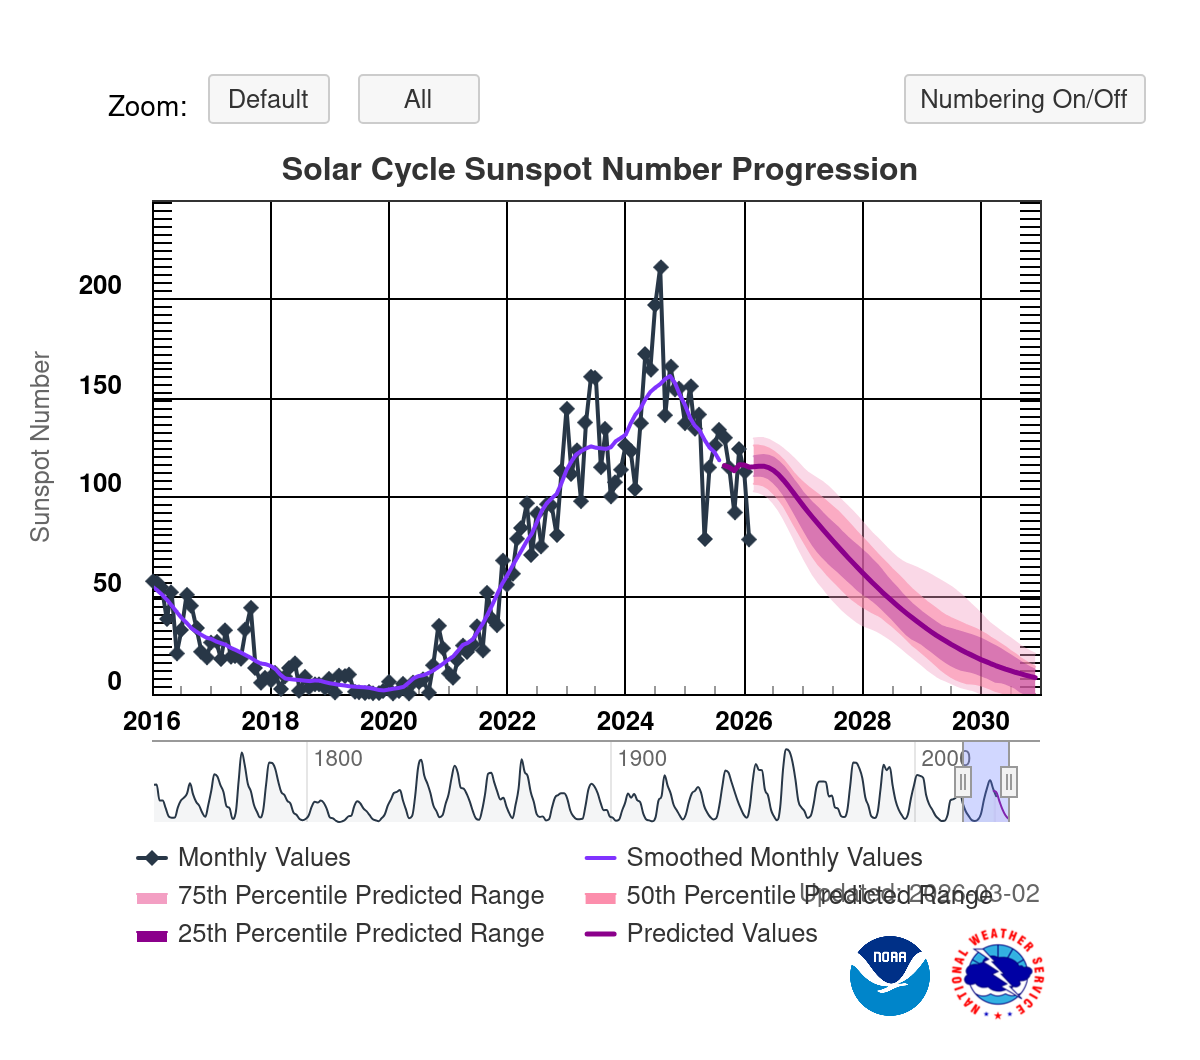
Sun Spot History (See:NOAA Page)
Trending
Quarterly Trends
- HRC Temperature
| Previous Quarter | |||||||
| MSID | MEAN | RMS | DELTA/YR | DELTA/YR/YR | UNITS | DESCRIPTION | |
| 2ceahvpt | -0.005 | 5.128e-04 | (2.79+/-0.01)e2 | -0.06 +/- 0.40 | K | CEA RADIATOR TEMPERATURE AT CENTER | |
|---|---|---|---|---|---|---|---|
| 2chtrpzt | -0.005 | 5.309e-04 | (2.76+/-0.01)e2 | -0.05 +/- 0.41 | K | CENTRAL ELECTRONICS BOX TEMP | |
| 2condmxt | -0.004 | 7.827e-04 | (2.72+/-0.02)e2 | 1.20 +/- 0.49 | K | CONDUIT -X FACE TEMPERATURE | |
| 2dcentrt | -9.514e-04 | 4.270e-04 | (2.74+/-0.01)e2 | 1.08 +/- 0.28 | K | DETECTOR HOUSING TEMP 2 | |
| 2dtstatt | 0.001 | 5.728e-04 | (2.70+/-0.01)e2 | 1.28 +/- 0.36 | K | DETECTOR HOUSING TEMP 1 | |
| 2fhtrmzt | -9.769e-06 | 9.580e-04 | (2.67+/-0.02)e2 | 0.66 +/- 0.66 | K | FRONT END ELECTRONICS BOX TEMPERATURE | |
| 2fradpyt | 2.095e-04 | 0.001 | (2.65+/-0.02)e2 | 0.46 +/- 0.72 | K | FRONT END ASSEMBLY +Y AT RADIATOR CENTER TEMP | |
| 2pmt1t | -0.009 | 7.895e-04 | (2.85+/-0.02)e2 | 0.10 +/- 0.57 | K | PMT 1 TEMPERATURE | |
| 2pmt2t | -0.009 | 7.734e-04 | (2.85+/-0.02)e2 | -0.07 +/- 0.56 | K | PMT 2 TEMPERATURE | |
| 2uvlspxt | -0.002 | 5.463e-04 | (2.76+/-0.01)e2 | 0.15 +/- 0.39 | K | UV LIGHT SHIELD NEXT TO SNOUT TEMP | |
- HRC HK
| Previous Quarter | |||||||
| MSID | MEAN | RMS | DELTA/YR | DELTA/YR/YR | UNITS | DESCRIPTION | |
| 2fe00atm | -0.008 | 0.009 | -0.69 +/- 2.98 | (0.00+/-0.00)e0 | C | Front end temperature | |
|---|---|---|---|---|---|---|---|
| 2fepratm | on | 0.075 | 0.004 | 25.19 +/- 1.89 | -2.48 +/- 1.79 | C | FE temp card temperature | off | -0.009 | 0.008 | -0.68 +/- 2.96 | (0.00+/-0.00)e0 |
| 2imhvatm | on | 0.023 | 0.022 | 16.26 +/- 1.82 | (0.00+/-0.00)e0 | C | Imaging det HVPS temperature | off | 0.015 | 0.012 | 16.42 +/- 1.14 | (0.00+/-0.00)e0 |
| 2iminatm | on | 0.064 | 0.003 | 20.52 +/- 1.59 | -1.25 +/- 1.57 | C | Imaging det temperature | off | -0.003 | 0.003 | 1.90 +/- 0.91 | (0.00+/-0.00)e0 |
| 2lvplatm | on | 0.019 | 0.019 | 10.14 +/- 1.57 | (0.00+/-0.00)e0 | C | LVPS plate temperature | off | 0.002 | 0.011 | 11.30 +/- 1.00 | (0.00+/-0.00)e0 |
| 2prbscr | on | 0.001 | 1.075e-04 | 1.76 +/- 0.05 | -0.03 +/- 0.05 | AMP | Primary bus current | off | 1.739e-04 | 4.659e-05 | 1.71 +/- 0.02 | (0.00+/-0.00)e0 |
| 2prbsvl | -0.001 | 4.861e-04 | 25.76 +/- 0.18 | (0.00+/-0.00)e0 | V | Primary bus voltage | |
| 2smtratm | on | 5.036e-15 | 2.577e-09 | 5.66 +/- 0.00 | (0.00+/-0.00)e0 | C | Selected motor temperature | off | 1.475e-15 | 1.800e-09 | 5.66 +/- 0.00 | (0.00+/-0.00)e0 |
| 2sphvatm | on | 0.014 | 0.017 | 15.75 +/- 1.36 | (0.00+/-0.00)e0 | C | Spect det HVPS temperature | off | -0.039 | 0.019 | 17.89 +/- 1.90 | (0.00+/-0.00)e0 |
| 2spinatm | on | 0.054 | 0.003 | 19.08 +/- 1.49 | -1.14 +/- 1.53 | C | Spect det temperature | off | -0.007 | 0.003 | 3.91 +/- 1.14 | (0.00+/-0.00)e0 |
- PCAD Temperature
| Previous Quarter | |||||||
| MSID | MEAN | RMS | DELTA/YR | DELTA/YR/YR | UNITS | DESCRIPTION | |
| aacccdpt | 0.016 | 9.558e-04 | (2.67+/-0.02)e2 | -2.46 +/- 0.77 | K | AC CCD TEMP (PRI) | |
|---|---|---|---|---|---|---|---|
| aacccdrt | 0.017 | 0.001 | (3.11+/-0.02)e2 | -2.51 +/- 0.82 | K | AC CCD TEMP (RDNT) | |
| aach1t | 0.017 | 0.001 | (3.09+/-0.02)e2 | -2.65 +/- 0.82 | K | AC HOUSING TEMP (ACH1) | |
| aach2t | 0.017 | 0.001 | (3.09+/-0.02)e2 | -2.65 +/- 0.82 | K | AC HOUSING TEMP (ACH2) | |
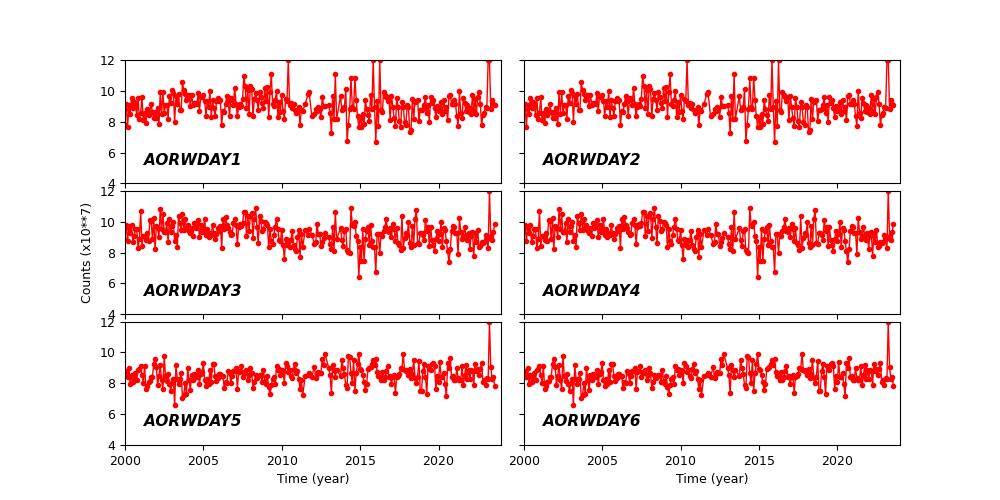
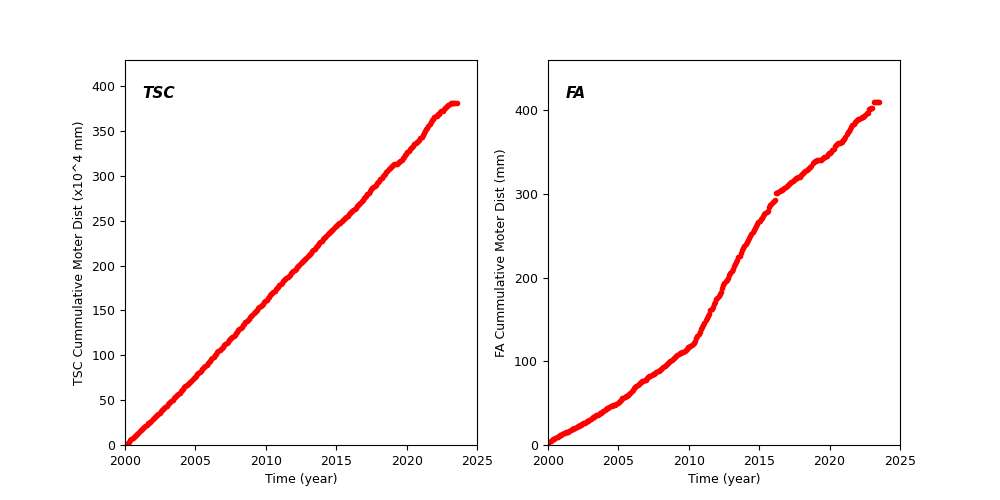
Spacecraft Motions
TSC and FA Cummulative Moter Distance
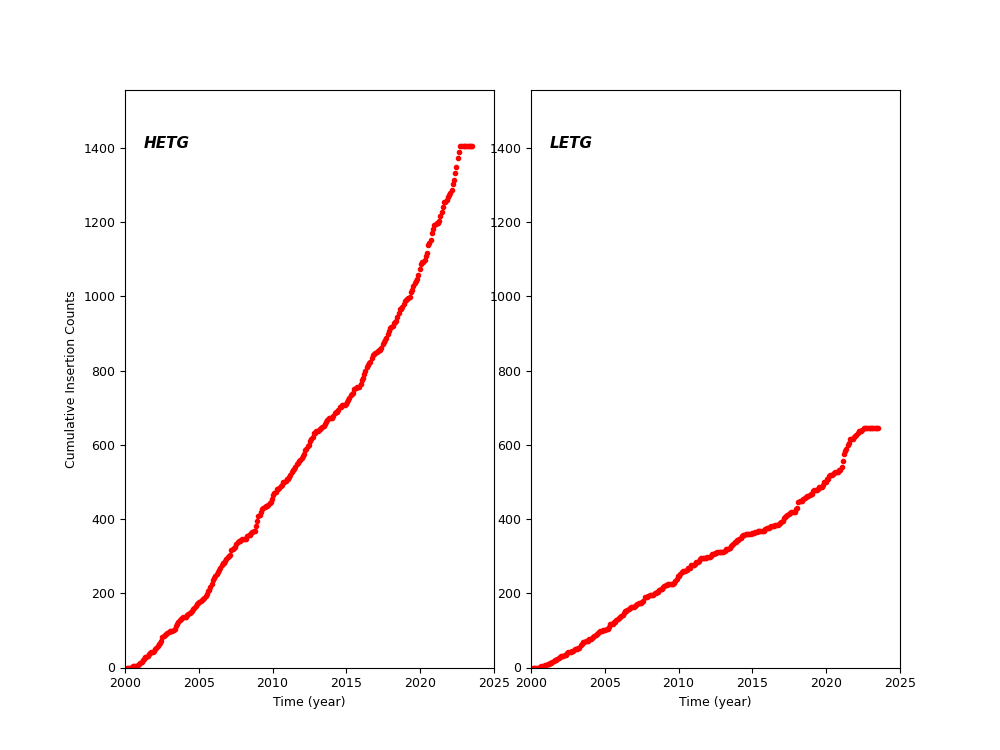
HETG and LETG Cummulative Insertion Counts
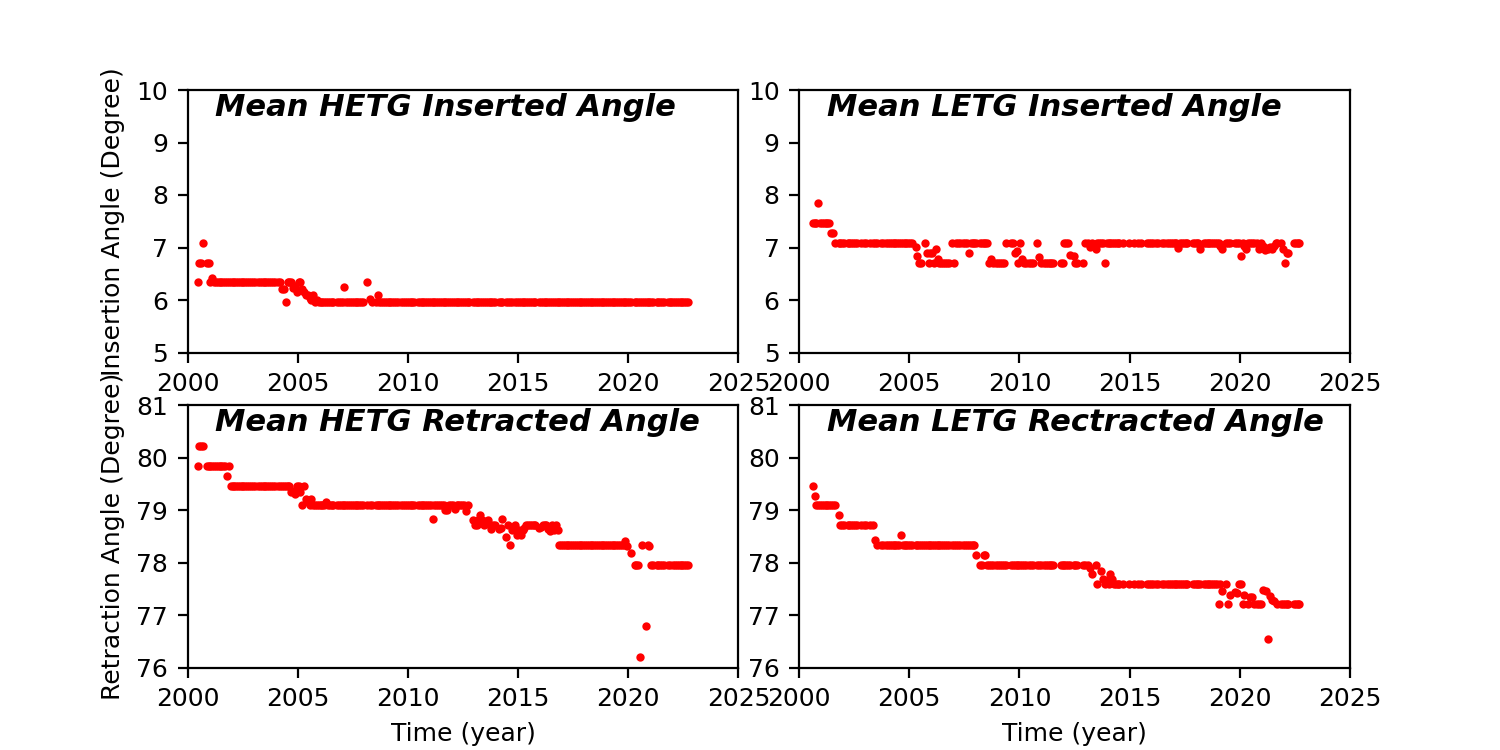
HETG/LETG Insertion/Retraction Angle
Reaction Wheel Rotations